Embed Size (px)
Citation preview
UK feedback on Delta V3.0
Presented by: John Stedman, Daniel Brookes, Keith Vincent, Emily Connolly10 April 2013
Outline
• Practical aspects• Other aspects covered in accompanying
presentation– Use of models for UK compliance assessments– Feedback provided last year– Using Delta V3.0– Conclusions and recommendations
• Views of the UK Competent Authorities
2
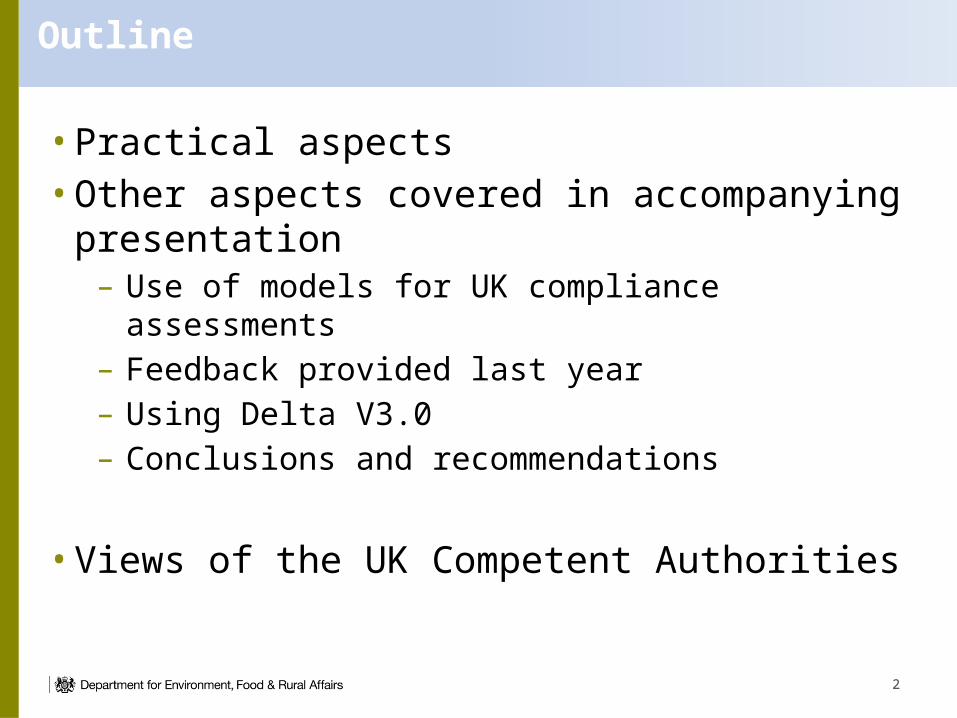
Models for UK compliance assessments
– Pollution Climate Mapping (PCM) models as supplementary assessment methods for annual compliance assessment (Decision 2004/461/EC)
– SO2, NOx, NO2, PM10, Pb, C6H6, O3, PM2.5, As, Cd, Ni and B[a]P
– Annual mean– Pollutant specific metrics
• High percentiles for SO2 and AOT40 and days above threshold for O3
3
Models for UK compliance assessments
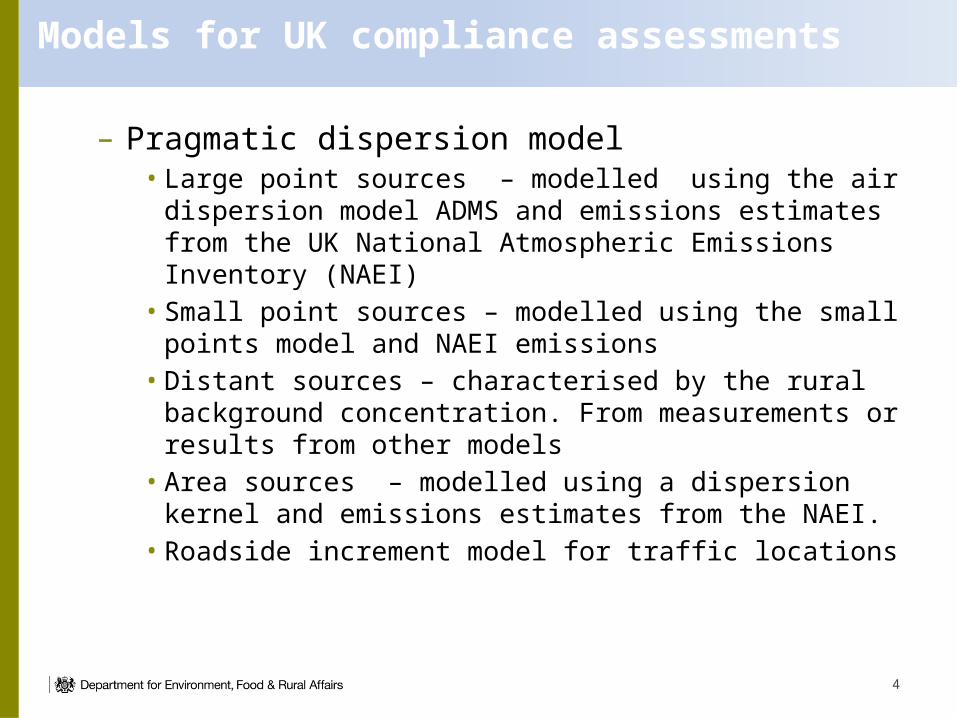
– Pragmatic dispersion model• Large point sources – modelled using the air dispersion
model ADMS and emissions estimates from the UK National Atmospheric Emissions Inventory (NAEI)
• Small point sources – modelled using the small points model and NAEI emissions
• Distant sources – characterised by the rural background concentration. From measurements or results from other models
• Area sources – modelled using a dispersion kernel and emissions estimates from the NAEI.
• Roadside increment model for traffic locations
4
Models for UK compliance assessments
– Assessment is based on a combination of measurement data and model results. The compliance status for each zone is based on the maximum of the measured and modelled concentrations
5

Models for UK compliance assessments
– The models are designed to assess compliance at locations defined within the directives
• Urban (and Rural) Background locations: 1 km x 1 km grid squares representative of the exposure of the general population
• Traffic locations: ~9000 receptors 4 m from the kerb of major roads in urban areas (to be representative of more than 100m segment and more than 25m from junctions.
– The same models are used for• Extent of exceedance• Source apportionment• Projections for the development of air quality plans• Consistent with the assessment for the reference year
6
Feedback from 2012
• Easier input of annual mean data • 75% data capture threshold
7
Delta V3.0: PCM model results for NO2 in 2010
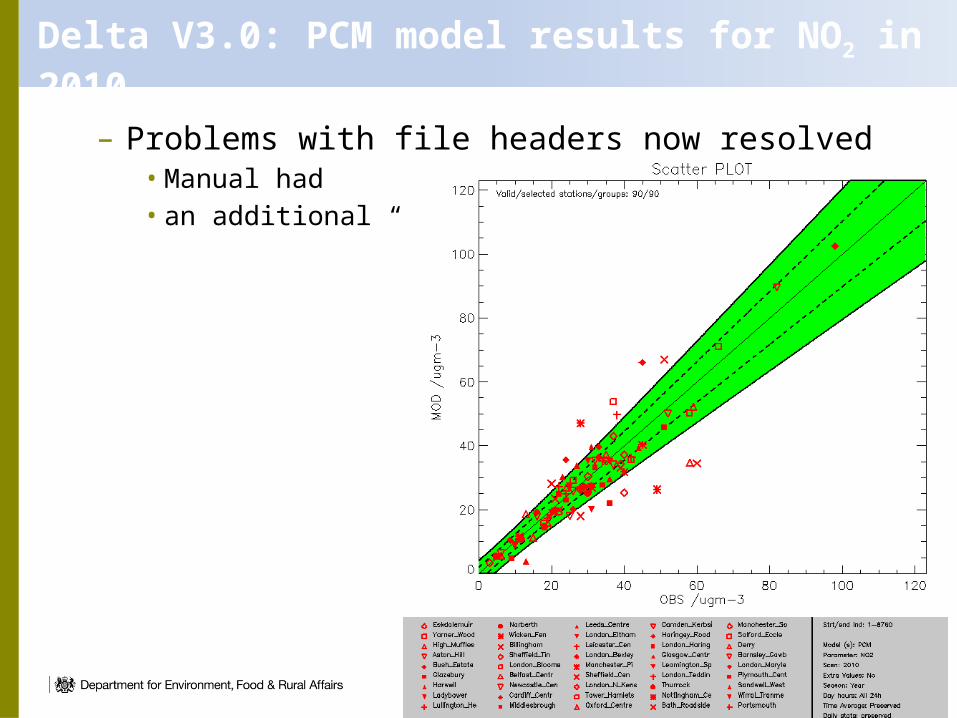
– Problems with file headers now resolved• Manual had • an additional “;”
8
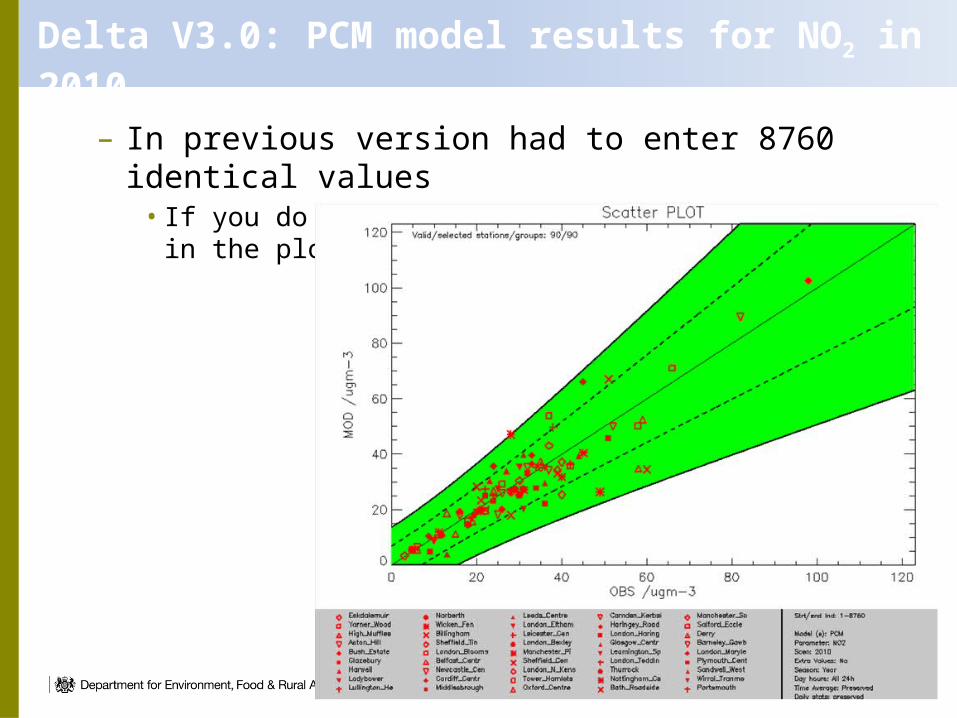
Delta V3.0: PCM model results for NO2 in 2010
– In previous version had to enter 8760 identical values• If you do this in V3.0 DQO for hourly are used in the plot
9
Delta V3.0: PCM model results for NO2 in 2010
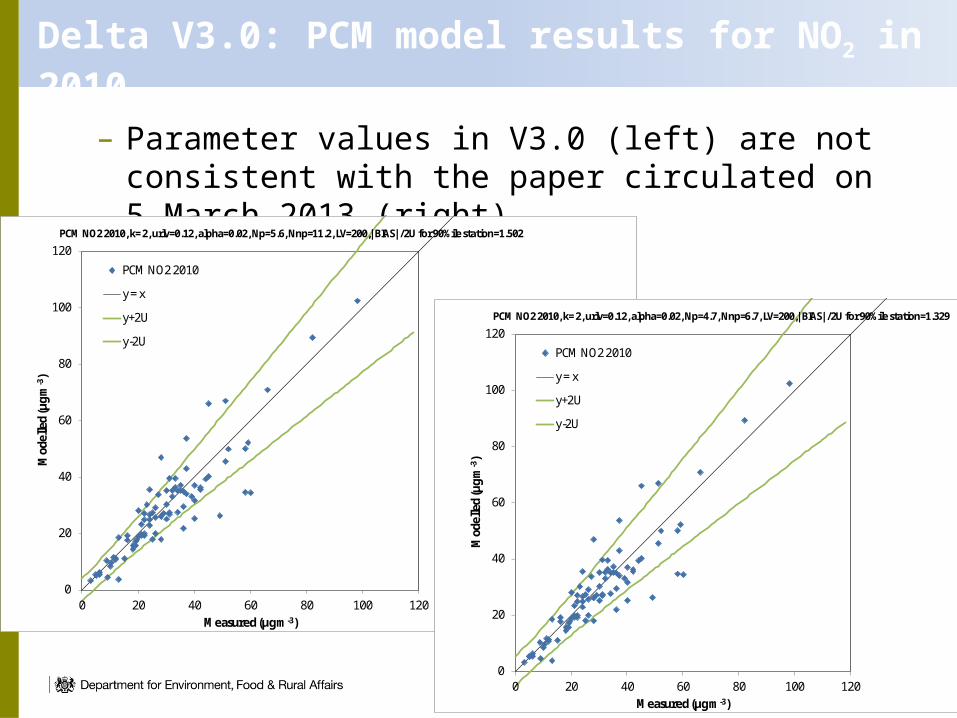
– Parameter values in V3.0 (left) are not consistent with the paper circulated on 5 March 2013 (right)
10
0
20
40
60
80
100
120
0 20 40 60 80 100 120
Mod
elle
d (µ
g m
-3)
Measured (µg m-3)
PCM NO2 2010, k= 2, urlv=0.12, alpha=0.02, Np=5.6, Nnp=11.2, LV=200,|BIAS|/2U for 90%ile station=1.502
PCM NO2 2010
y = x
y+2U
y-2U
0
20
40
60
80
100
120
0 20 40 60 80 100 120
Mod
elle
d (µ
g m
-3)
Measured (µg m-3)
PCM NO2 2010, k= 2, urlv=0.12, alpha=0.02, Np=4.7, Nnp=6.7, LV=200,|BIAS|/2U for 90%ile station=1.329
PCM NO2 2010
y = x
y+2U
y-2U
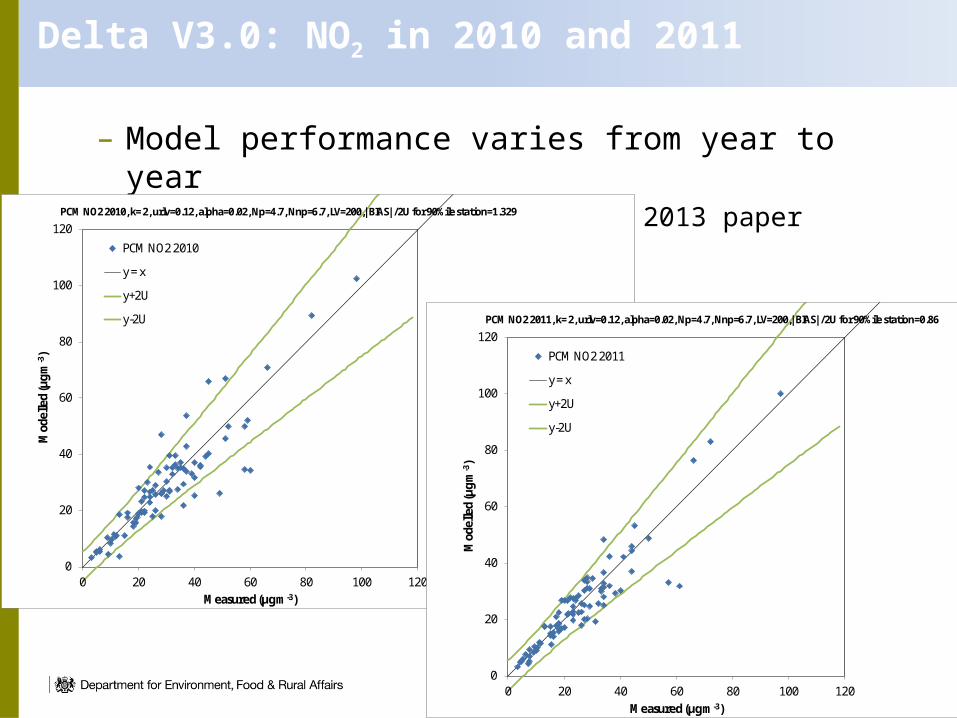
Delta V3.0: NO2 in 2010 and 2011
– Model performance varies from year to year• Using parameters from 5 March 2013 paper
11
0
20
40
60
80
100
120
0 20 40 60 80 100 120
Mod
elle
d (µ
g m
-3)
Measured (µg m-3)
PCM NO2 2010, k= 2, urlv=0.12, alpha=0.02, Np=4.7, Nnp=6.7, LV=200,|BIAS|/2U for 90%ile station=1.329
PCM NO2 2010
y = x
y+2U
y-2U
0
20
40
60
80
100
120
0 20 40 60 80 100 120
Mod
elle
d (µ
g m
-3)
Measured (µg m-3)
PCM NO2 2011, k= 2, urlv=0.12, alpha=0.02, Np=4.7, Nnp=6.7, LV=200,|BIAS|/2U for 90%ile station=0.86
PCM NO2 2011
y = x
y+2U
y-2U
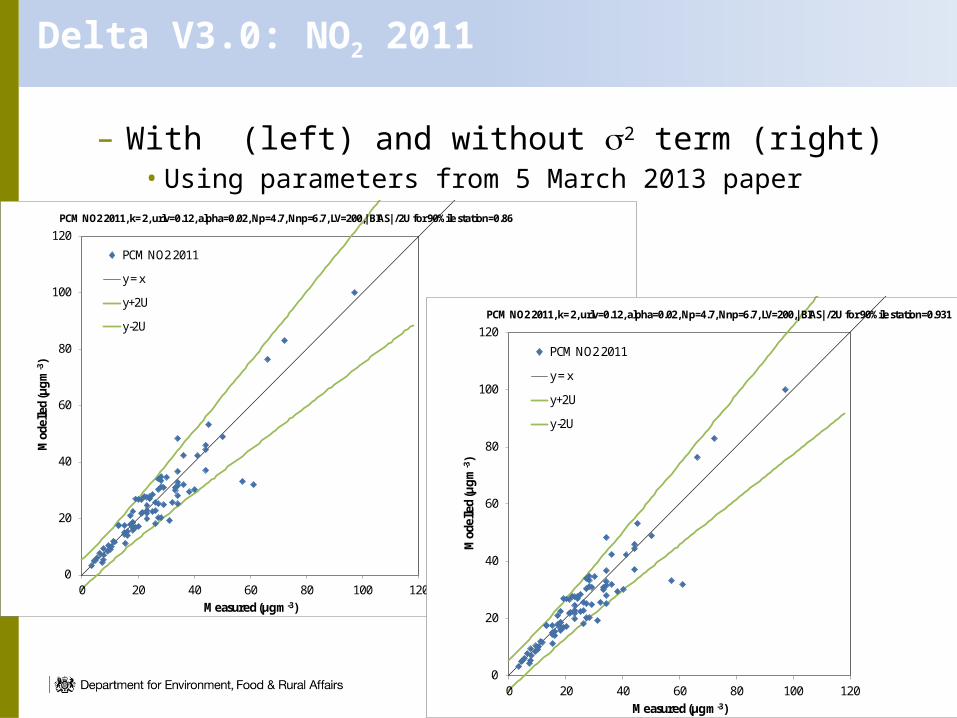
Delta V3.0: NO2 2011
– With (left) and without 2 term (right)• Using parameters from 5 March 2013 paper
12
0
20
40
60
80
100
120
0 20 40 60 80 100 120
Mod
elle
d (µ
g m
-3)
Measured (µg m-3)
PCM NO2 2011, k= 2, urlv=0.12, alpha=0.02, Np=4.7, Nnp=6.7, LV=200,|BIAS|/2U for 90%ile station=0.86
PCM NO2 2011
y = x
y+2U
y-2U
0
20
40
60
80
100
120
0 20 40 60 80 100 120
Mod
elle
d (µ
g m
-3)
Measured (µg m-3)
PCM NO2 2011, k= 2, urlv=0.12, alpha=0.02, Np=4.7, Nnp=6.7, LV=200,|BIAS|/2U for 90%ile station=0.931
PCM NO2 2011
y = x
y+2U
y-2U
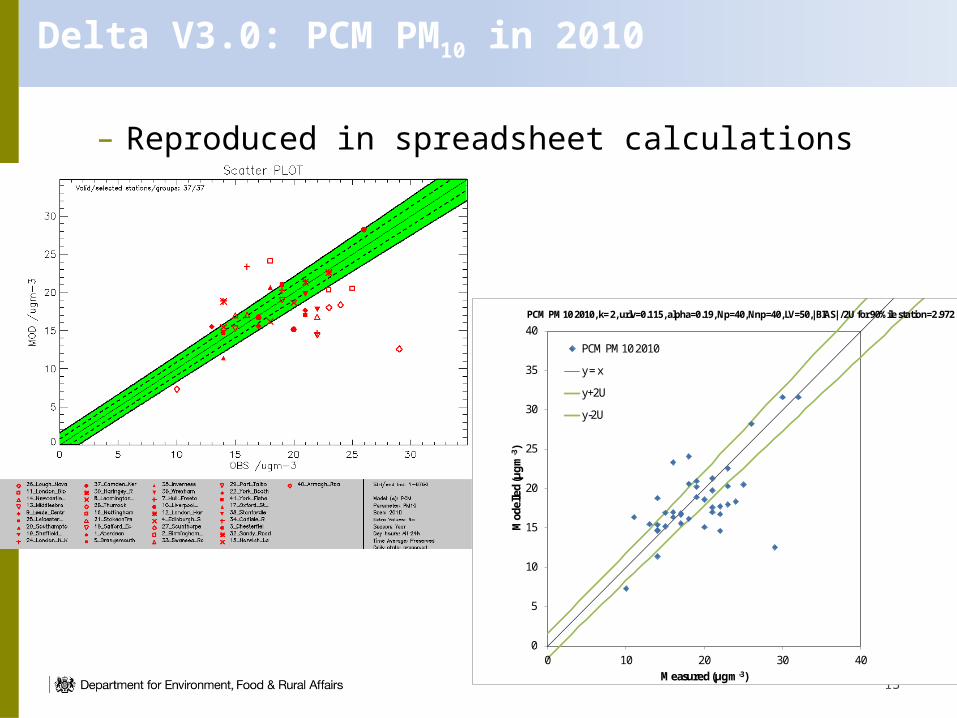
Delta V3.0: PCM PM10 in 2010
– Reproduced in spreadsheet calculations
13
0
5
10
15
20
25
30
35
40
0 10 20 30 40
Mod
elle
d (µ
g m
-3)
Measured (µg m-3)
PCM PM10 2010, k= 2, urlv=0.115, alpha=0.19, Np=40, Nnp=40, LV=50,|BIAS|/2U for 90%ile station=2.972
PCM PM10 2010
y = x
y+2U
y-2U
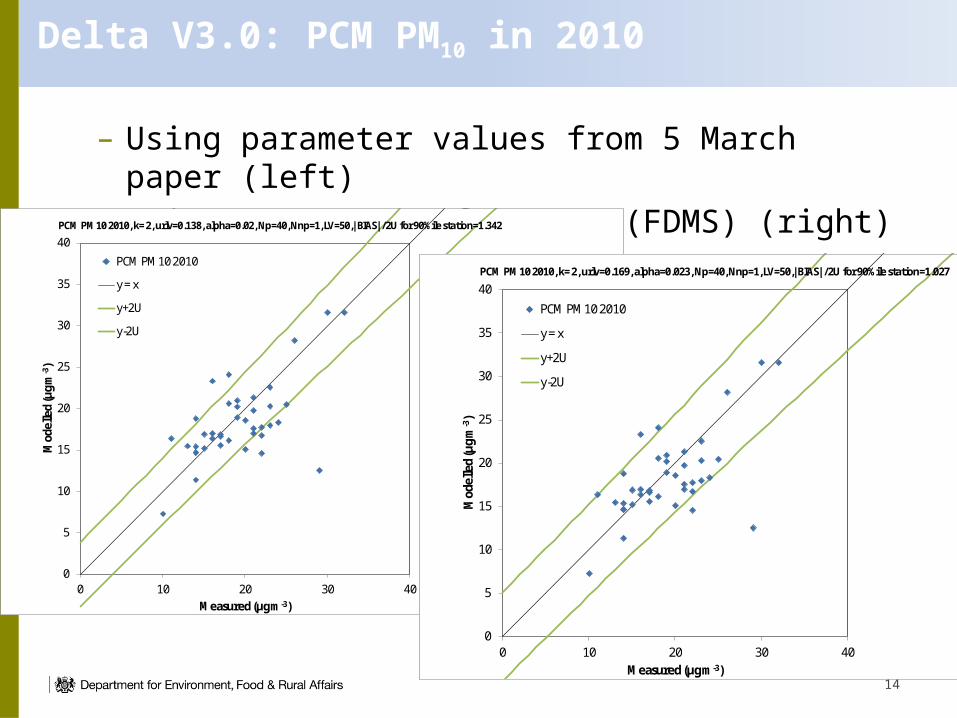
Delta V3.0: PCM PM10 in 2010
– Using parameter values from 5 March paper (left)– Using parameters for TEOM (FDMS) (right)
14
0
5
10
15
20
25
30
35
40
0 10 20 30 40
Mod
elle
d (µ
g m
-3)
Measured (µg m-3)
PCM PM10 2010, k= 2, urlv=0.138, alpha=0.02, Np=40, Nnp=1, LV=50,|BIAS|/2U for 90%ile station=1.342
PCM PM10 2010
y = x
y+2U
y-2U
0
5
10
15
20
25
30
35
40
0 10 20 30 40
Mod
elle
d (µ
g m
-3)
Measured (µg m-3)
PCM PM10 2010, k= 2, urlv=0.169, alpha=0.023, Np=40, Nnp=1, LV=50,|BIAS|/2U for 90%ile station=1.027
PCM PM10 2010
y = x
y+2U
y-2U
Conclusions and recommendations
• Input of annual data much easier• Parameters in Delta V3.0 do are not consistent
with the circulated paper– Assessment of model performance is highly sensitive
to the selection of parameters
• Recommendations– Include parameter values in Delta plots for version
control – Allow users to choose non-default values to explore
sensitivities– Will need to address all the AQD and DD4 pollutants
15