Embed Size (px)
Citation preview
FACT BOOKLET2013-2014UNIVERSITY OF KENTUCKY
- 1 -
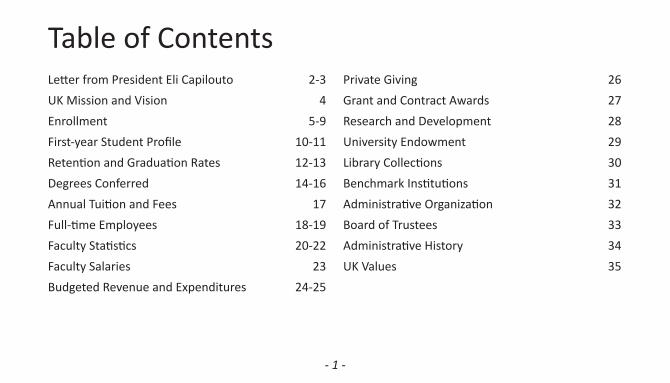
Table of ContentsLetter from President Eli Capilouto 2-3UK Mission and Vision 4Enrollment 5-9First-year Student Profile 10-11Retention and Graduation Rates 12-13Degrees Conferred 14-16Annual Tuition and Fees 17Full-time Employees 18-19Faculty Statistics 20-22Faculty Salaries 23Budgeted Revenue and Expenditures 24-25
Private Giving 26Grant and Contract Awards 27Research and Development 28University Endowment 29Library Collections 30Benchmark Institutions 31Administrative Organization 32Board of Trustees 33Administrative History 34UK Values 35
- 2 -
January 2014
We are proud to publish the 2013-14 Fact Booklet; a collection of current statistics about people and programs at the University of Kentucky. In accordance with KRS 164.250, this booklet provides important data to our stakeholders and the general public, including information on enrollment management; retention and graduation rates; research con-tracts, grants and expenditures; faculty salaries; and a summary of the 2013-2014 Operating and Capital Budget.
For the second year in a row, we established a record for the largest and most diverse first-year class in our history. Thirty percent of our freshmen came from outside the Commonwealth to pursue their undergraduate education at UK. The number of African American and Hispanic freshmen who enrolled in fall 2013 increased by 19 percent and 28 percent, respectively, from the previous year. One-hundred five of our first-year class distinguished themselves as National Merit, National Achievement or National Hispanic finalists. Just over 29,400 students are pursuing degrees at the undergraduate and graduate levels, another UK record. We continue to be the top choice for Kentucky students and those in our target recruitment regions.
The University’s public/private partnership with EdR continues to make progress. In January, the UK Board of Trustees authorized Phase II-C of the ongoing public-private partnership with EdR to construct more than 1,140 additional modern residence hall beds in two new facilities on north campus. The next phase brings the total completed/ongoing construction to more than $348 million, 5,733 beds, 202 active learning spaces and 12 buildings across campus to be completed by 2016.
Construction is underway on the dramatic renewal and expansion of the Gatton College of Business and Econom-ics. The revitalization of Commonwealth Stadium commenced in early January and work on the new Academic Science Building will start at the end of the spring 2014 semester.
These priorities embolden our mission as a renowned flagship and land grant research university. They bolster our promise to Kentucky – a covenant that has never been more vital. As we continue our ascent, we are building a better University of Kentucky, and through it, a better future for our state.
Sincerely,
Eli CapiloutoPresident
- 3 -
- 4 -
The University of Kentucky will be one of the nation’s 20 best public research universities.
VISION
MISSION
-- Adopted by the Board of Trustees, June 9, 2009
The University of Kentucky is a public, land grant university dedicated to improving people’s lives through excellence in education, research and creative work, service, and health care. As Kentucky’s flagship institution, the University plays a critical leadership role by promoting diversity, inclusion, economic development, and human well-being.
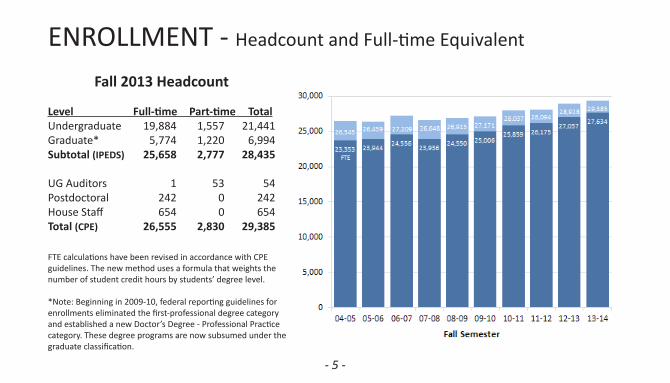
ENROLLMENT - Headcount and Full-time Equivalent
Fall 2013 Headcount
Level Full-time Part-time TotalUndergraduate 19,884 1,557 21,441Graduate* 5,774 1,220 6,994Subtotal (IPEDS) 25,658 2,777 28,435
UG Auditors 1 53 54Postdoctoral 242 0 242House Staff 654 0 654Total (CPE) 26,555 2,830 29,385
- 5 -
FTE calculations have been revised in accordance with CPE guidelines. The new method uses a formula that weights the number of student credit hours by students’ degree level.
*Note: Beginning in 2009-10, federal reporting guidelines for enrollments eliminated the first-professional degree category and established a new Doctor’s Degree - Professional Practice category. These degree programs are now subsumed under the graduate classification.
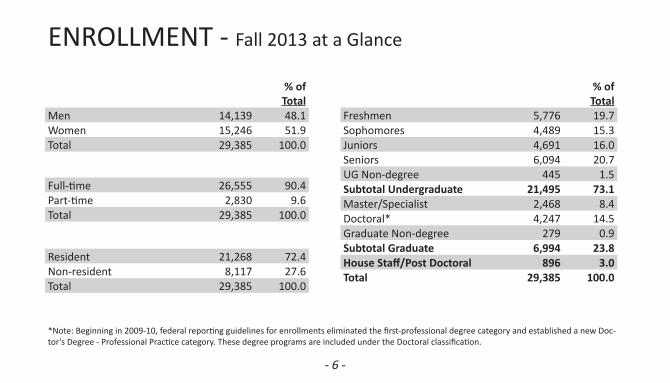
ENROLLMENT - Fall 2013 at a Glance
- 6 -
*Note: Beginning in 2009-10, federal reporting guidelines for enrollments eliminated the first-professional degree category and established a new Doc-tor’s Degree - Professional Practice category. These degree programs are included under the Doctoral classification.
% of Total
Men 14,139 48.1Women 15,246 51.9Total 29,385 100.0
Full-time 26,555 90.4Part-time 2,830 9.6Total 29,385 100.0
Resident 21,268 72.4Non-resident 8,117 27.6Total 29,385 100.0
% of Total
Freshmen 5,776 19.7Sophomores 4,489 15.3Juniors 4,691 16.0Seniors 6,094 20.7UG Non-degree 445 1.5Subtotal Undergraduate 21,495 73.1Master/Specialist 2,468 8.4Doctoral* 4,247 14.5Graduate Non-degree 279 0.9Subtotal Graduate 6,994 23.8HouseStaff/PostDoctoral 896 3.0Total 29,385 100.0
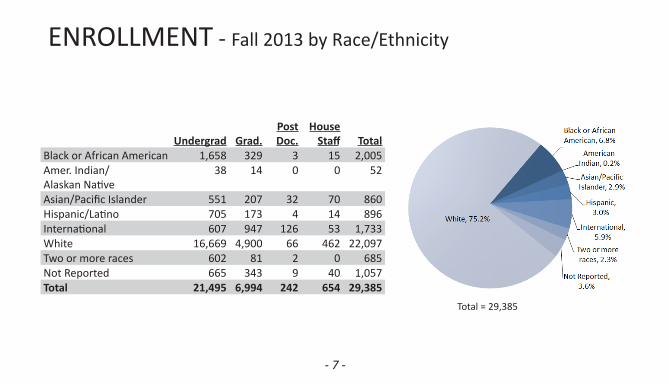
ENROLLMENT - Fall 2013 by Race/Ethnicity
- 7 -
Total = 29,385
Undergrad Grad.PostDoc.
HouseStaff Total
Black or African American 1,658 329 3 15 2,005Amer. Indian/ Alaskan Native
38 14 0 0 52
Asian/Pacific Islander 551 207 32 70 860Hispanic/Latino 705 173 4 14 896International 607 947 126 53 1,733White 16,669 4,900 66 462 22,097Two or more races 602 81 2 0 685Not Reported 665 343 9 40 1,057Total 21,495 6,994 242 654 29,385
- 8 -
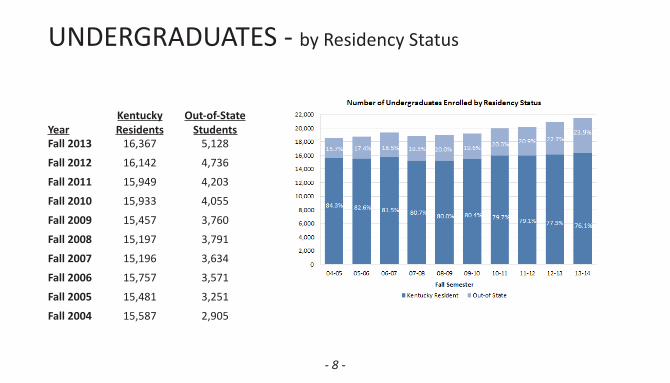
UNDERGRADUATES - by Residency Status
YearKentuckyResidents
Out-of-StateStudents
Fall 2013 16,367 5,128
Fall 2012 16,142 4,736
Fall 2011 15,949 4,203
Fall 2010 15,933 4,055
Fall 2009 15,457 3,760
Fall 2008 15,197 3,791
Fall 2007 15,196 3,634
Fall 2006 15,757 3,571
Fall 2005 15,481 3,251
Fall 2004 15,587 2,905
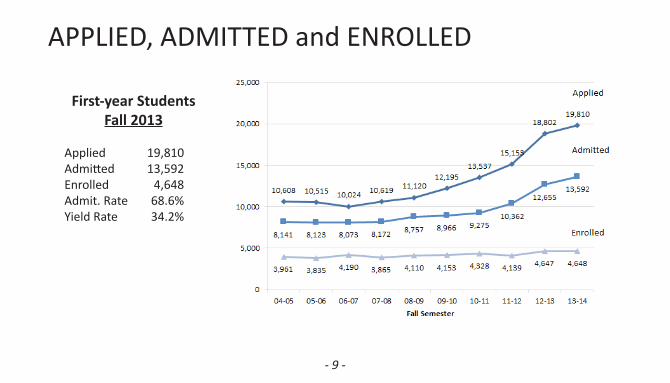
APPLIED, ADMITTED and ENROLLED
- 9 -
First-year StudentsFall 2013
Applied 19,810 Admitted 13,592 Enrolled 4,648 Admit. Rate 68.6% Yield Rate 34.2%
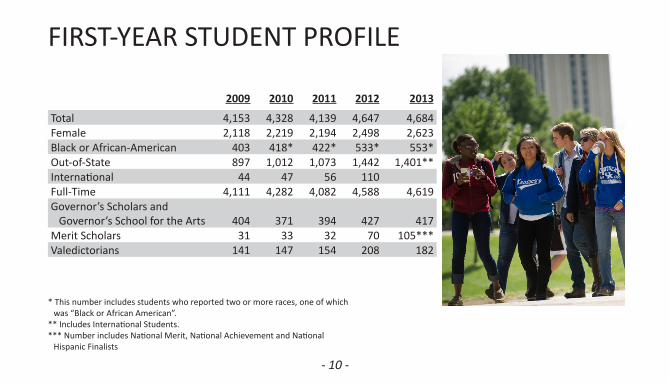
FIRST-YEAR STUDENT PROFILE
- 10 -
* This number includes students who reported two or more races, one of which was “Black or African American”.
** Includes International Students.*** Number includes National Merit, National Achievement and National
Hispanic Finalists
2009 2010 2011 2012 2013
Total 4,153 4,328 4,139 4,647 4,684Female 2,118 2,219 2,194 2,498 2,623Black or African-American 403 418* 422* 533* 553*Out-of-State 897 1,012 1,073 1,442 1,401**International 44 47 56 110Full-Time 4,111 4,282 4,082 4,588 4,619Governor’s Scholars and Governor’s School for the Arts 404 371 394 427 417Merit Scholars 31 33 32 70 105***Valedictorians 141 147 154 208 182
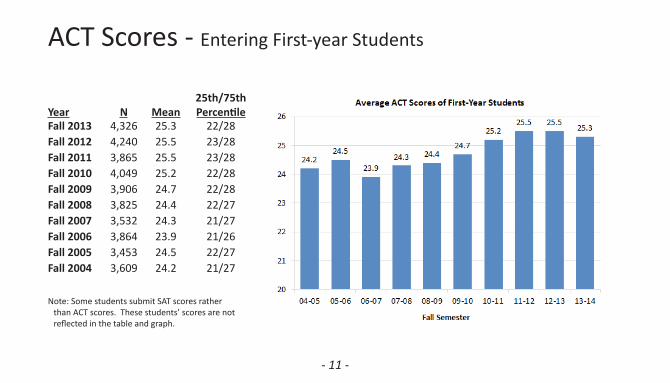
ACT Scores - Entering First-year Students
- 11 -
Note: Some students submit SAT scores rather than ACT scores. These students’ scores are not reflected in the table and graph.
Year N Mean25th/75thPercentile
Fall 2013 4,326 25.3 22/28Fall 2012 4,240 25.5 23/28Fall 2011 3,865 25.5 23/28Fall 2010 4,049 25.2 22/28Fall 2009 3,906 24.7 22/28Fall 2008 3,825 24.4 22/27 Fall 2007 3,532 24.3 21/27Fall 2006 3,864 23.9 21/26Fall 2005 3,453 24.5 22/27Fall 2004 3,609 24.2 21/27
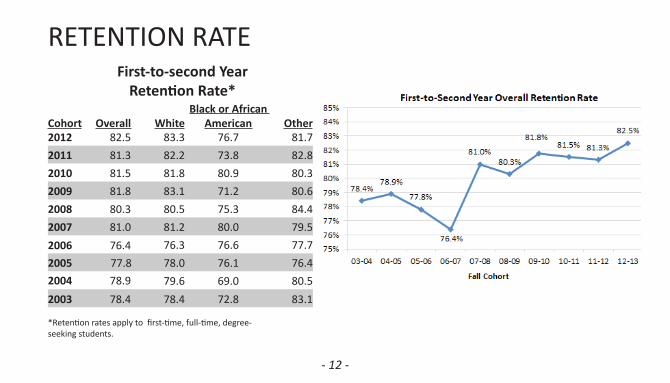
RETENTION RATE
- 12 -
*Retention rates apply to first-time, full-time, degree- seeking students.
First-to-second Year RetentionRate*
Cohort Overall WhiteBlack or African
American Other2012 82.5 83.3 76.7 81.72011 81.3 82.2 73.8 82.82010 81.5 81.8 80.9 80.32009 81.8 83.1 71.2 80.62008 80.3 80.5 75.3 84.42007 81.0 81.2 80.0 79.52006 76.4 76.3 76.6 77.72005 77.8 78.0 76.1 76.42004 78.9 79.6 69.0 80.52003 78.4 78.4 72.8 83.1
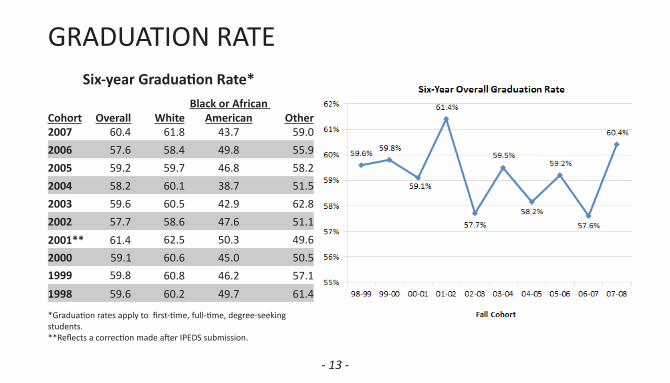
Six-yearGraduationRate*
GRADUATION RATE
- 13 -
*Graduation rates apply to first-time, full-time, degree-seeking students.**Reflects a correction made after IPEDS submission.
Cohort Overall WhiteBlack or African
American Other2007 60.4 61.8 43.7 59.02006 57.6 58.4 49.8 55.92005 59.2 59.7 46.8 58.22004 58.2 60.1 38.7 51.52003 59.6 60.5 42.9 62.82002 57.7 58.6 47.6 51.12001** 61.4 62.5 50.3 49.62000 59.1 60.6 45.0 50.51999 59.8 60.8 46.2 57.11998 59.6 60.2 49.7 61.4
- 14 -
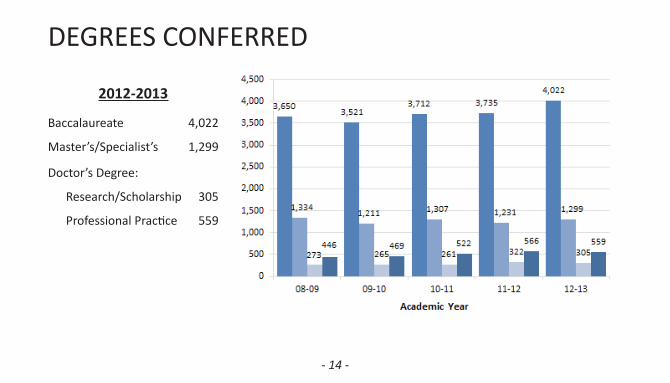
DEGREES CONFERRED
2012-2013
Baccalaureate 4,022
Master’s/Specialist’s 1,299
Doctor’s Degree:
Research/Scholarship 305
Professional Practice 559
* Includes Specialist degrees** Includes Doctor’s Degrees (Research/Scholarship) and Doctor’s Degrees (Professional Practice)
- 15 -
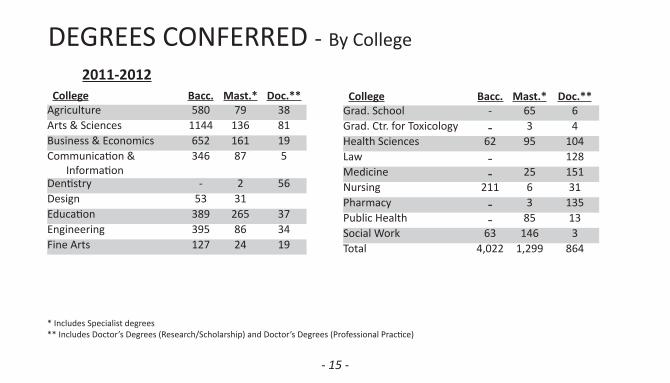
DEGREES CONFERRED - By College
2011-2012College Bacc. Mast.* Doc.**
Agriculture 580 79 38Arts & Sciences 1144 136 81Business & Economics 652 161 19Communication & Information
346 87 5
Dentistry - 2 56Design 53 31Education 389 265 37Engineering 395 86 34Fine Arts 127 24 19
College Bacc. Mast.* Doc.**Grad. School - 65 6Grad. Ctr. for Toxicology - 3 4Health Sciences 62 95 104Law - 128Medicine - 25 151Nursing 211 6 31Pharmacy - 3 135Public Health - 85 13Social Work 63 146 3Total 4,022 1,299 864
- 16 -
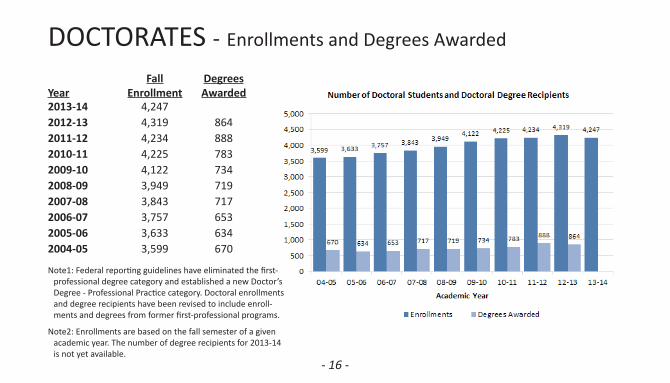
DOCTORATES - Enrollments and Degrees Awarded
YearFall
EnrollmentDegreesAwarded
2013-14 4,2472012-13 4,319 8642011-12 4,234 8882010-11 4,225 7832009-10 4,122 7342008-09 3,949 7192007-08 3,843 7172006-07 3,757 6532005-06 3,633 6342004-05 3,599 670
Note1: Federal reporting guidelines have eliminated the first-professional degree category and established a new Doctor’s Degree - Professional Practice category. Doctoral enrollments and degree recipients have been revised to include enroll-ments and degrees from former first-professional programs.
Note2: Enrollments are based on the fall semester of a given academic year. The number of degree recipients for 2013-14 is not yet available.
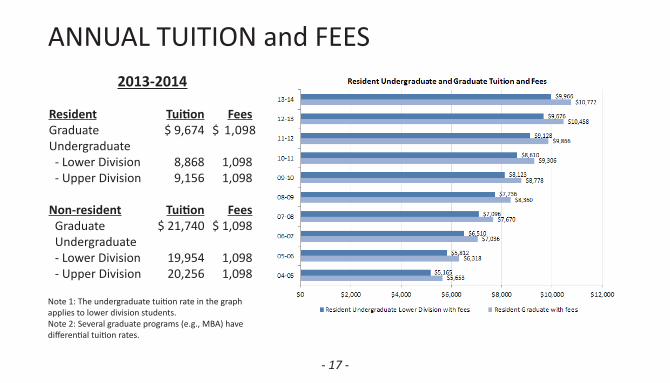
2013-2014
Resident Tuition FeesGraduate $ 9,674 $ 1,098 Undergraduate - Lower Division 8,868 1,098 - Upper Division 9,156 1,098
Non-resident Tuition Fees Graduate $ 21,740 $ 1,098 Undergraduate - Lower Division 19,954 1,098 - Upper Division 20,256 1,098
ANNUAL TUITION and FEES
- 17 -
Note 1: The undergraduate tuition rate in the graph applies to lower division students. Note 2: Several graduate programs (e.g., MBA) have differential tuition rates.
- 18 -
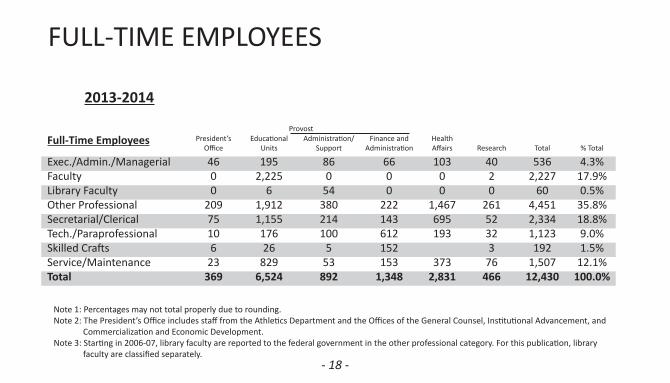
FULL-TIME EMPLOYEES
2013-2014
Note 1: Percentages may not total properly due to rounding.Note 2: The President’s Office includes staff from the Athletics Department and the Offices of the General Counsel, Institutional Advancement, and Commercialization and Economic Development.Note 3: Starting in 2006-07, library faculty are reported to the federal government in the other professional category. For this publication, library faculty are classified separately.
Provost
Full-TimeEmployees President’sOffice
Educational Units
Administration/Support
Finance andAdministration
Health Affairs Research Total % Total
Exec./Admin./Managerial 46 195 86 66 103 40 536 4.3%Faculty 0 2,225 0 0 0 2 2,227 17.9%Library Faculty 0 6 54 0 0 0 60 0.5%Other Professional 209 1,912 380 222 1,467 261 4,451 35.8%Secretarial/Clerical 75 1,155 214 143 695 52 2,334 18.8%Tech./Paraprofessional 10 176 100 612 193 32 1,123 9.0%Skilled Crafts 6 26 5 152 3 192 1.5%Service/Maintenance 23 829 53 153 373 76 1,507 12.1%Total 369 6,524 892 1,348 2,831 466 12,430 100.0%
2013-2014
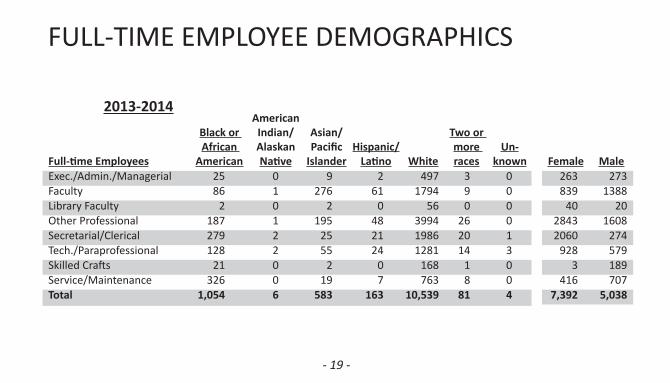
FULL-TIME EMPLOYEE DEMOGRAPHICS
- 19 -
Full-timeEmployees
Black or African
American
AmericanIndian/AlaskanNative
Asian/Pacific
IslanderHispanic/Latino White
Two or moreraces
Un-known
Exec./Admin./Managerial 25 0 9 2 497 3 0Faculty 86 1 276 61 1794 9 0Library Faculty 2 0 2 0 56 0 0Other Professional 187 1 195 48 3994 26 0Secretarial/Clerical 279 2 25 21 1986 20 1Tech./Paraprofessional 128 2 55 24 1281 14 3Skilled Crafts 21 0 2 0 168 1 0Service/Maintenance 326 0 19 7 763 8 0Total 1,054 6 583 163 10,539 81 4
Female Male263 273839 1388
40 202843 16082060 274
928 5793 189
416 7077,392 5,038
- 20 -
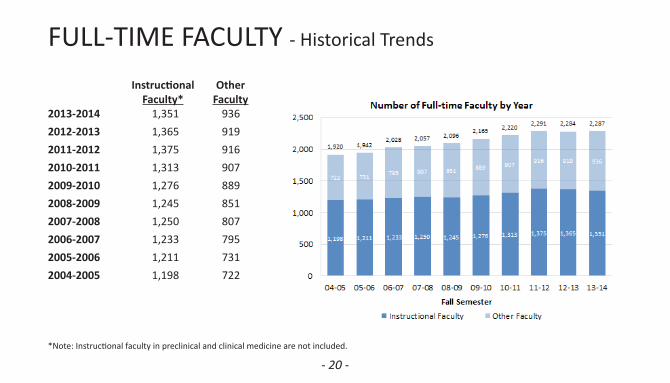
FULL-TIME FACULTY - Historical Trends
InstructionalFaculty*
Other Faculty
2013-2014 1,351 9362012-2013 1,365 9192011-2012 1,375 9162010-2011 1,313 9072009-2010 1,276 8892008-2009 1,245 8512007-2008 1,250 8072006-2007 1,233 7952005-2006 1,211 7312004-2005 1,198 722
*Note: Instructional faculty in preclinical and clinical medicine are not included.
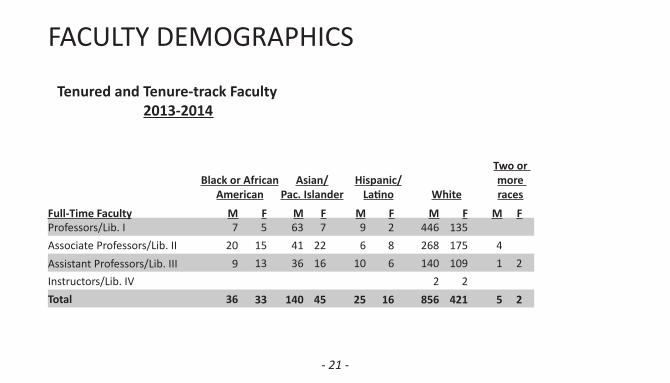
Tenured and Tenure-track Faculty 2013-2014
FACULTY DEMOGRAPHICS
- 21 -
Black or African American
Asian/Pac.Islander
Hispanic/Latino White
Two or moreraces
Full-TimeFaculty M F M F M F M F M FProfessors/Lib. I 7 5 63 7 9 2 446 135Associate Professors/Lib. II 20 15 41 22 6 8 268 175 4Assistant Professors/Lib. III 9 13 36 16 10 6 140 109 1 2Instructors/Lib. IV 2 2Total 36 33 140 45 25 16 856 421 5 2
- 22 -
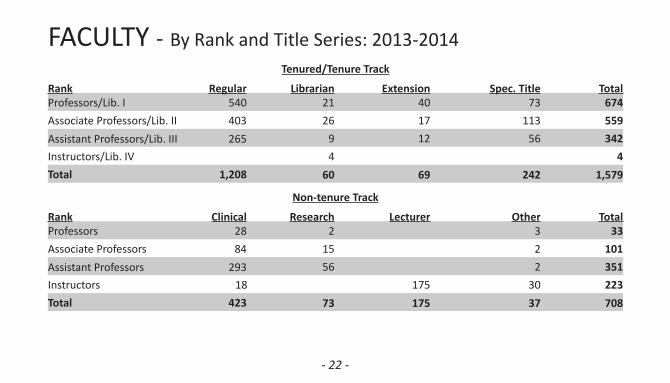
FACULTY - By Rank and Title Series: 2013-2014Tenured/TenureTrack
Rank Regular Librarian Extension Spec.Title TotalProfessors/Lib. I 540 21 40 73 674Associate Professors/Lib. II 403 26 17 113 559Assistant Professors/Lib. III 265 9 12 56 342Instructors/Lib. IV 4 4Total 1,208 60 69 242 1,579
Non-tenure Track
Rank Clinical Research Lecturer Other TotalProfessors 28 2 3 33Associate Professors 84 15 2 101Assistant Professors 293 56 2 351Instructors 18 175 30 223Total 423 73 175 37 708
- 23 -
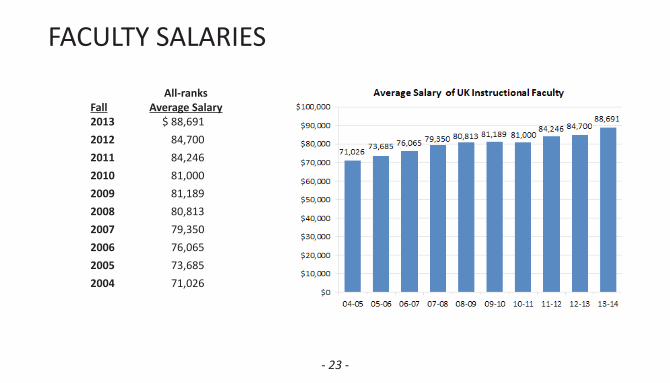
FACULTY SALARIES
FallAll-ranks
Average Salary2013 $ 88,6912012 84,7002011 84,2462010 81,0002009 81,1892008 80,8132007 79,3502006 76,0652005 73,6852004 71,026
- 24 -
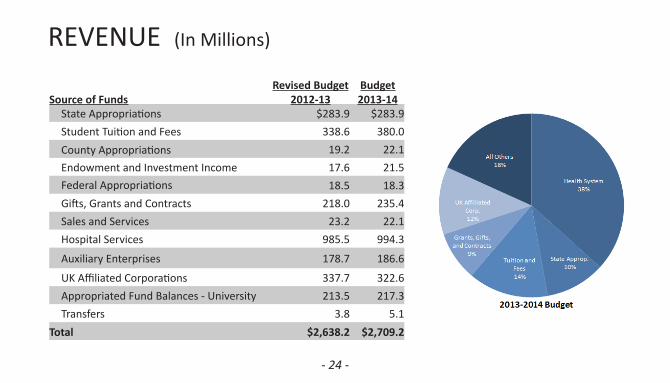
REVENUE (In Millions)
Source of FundsRevised Budget
2012-13Budget2013-14
State Appropriations $283.9 $283.9Student Tuition and Fees 338.6 380.0County Appropriations 19.2 22.1Endowment and Investment Income 17.6 21.5Federal Appropriations 18.5 18.3Gifts, Grants and Contracts 218.0 235.4Sales and Services 23.2 22.1Hospital Services 985.5 994.3
Auxiliary Enterprises 178.7 186.6
UK Affiliated Corporations 337.7 322.6Appropriated Fund Balances - University 213.5 217.3Transfers 3.8 5.1
Total $2,638.2 $2,709.2
- 25 -
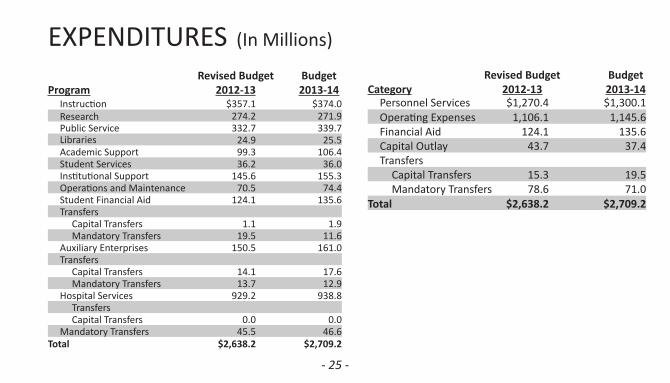
EXPENDITURES (In Millions)
Personnel Services $1,270.4 $1,300.1Operating Expenses 1,106.1 1,145.6Financial Aid 124.1 135.6Capital Outlay 43.7 37.4Transfers
Capital Transfers 15.3 19.5Mandatory Transfers 78.6 71.0
Total $2,638.2 $2,709.2
CategoryRevised Budget
2012-13Budget2013-14Program
Revised Budget2012-13
Budget2013-14
Instruction $357.1 $374.0Research 274.2 271.9Public Service 332.7 339.7Libraries 24.9 25.5Academic Support 99.3 106.4Student Services 36.2 36.0Institutional Support 145.6 155.3Operations and Maintenance 70.5 74.4Student Financial Aid 124.1 135.6Transfers
Capital Transfers 1.1 1.9Mandatory Transfers 19.5 11.6
Auxiliary Enterprises 150.5 161.0Transfers
Capital Transfers 14.1 17.6Mandatory Transfers 13.7 12.9
Hospital Services 929.2 938.8TransfersCapital Transfers 0.0 0.0
Mandatory Transfers 45.5 46.6Total $2,638.2 $2,709.2
- 26 -
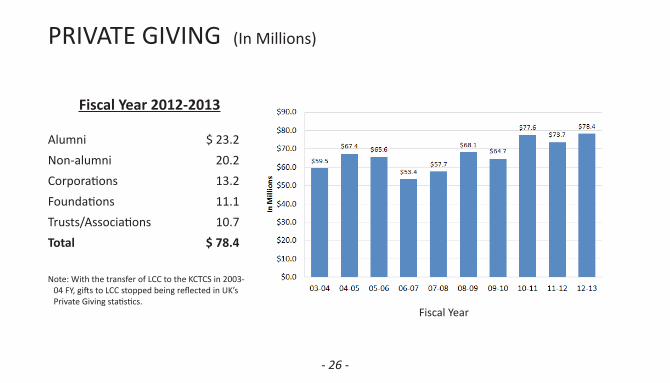
PRIVATE GIVING (In Millions)
Alumni $ 23.2Non-alumni 20.2Corporations 13.2Foundations 11.1Trusts/Associations 10.7Total $ 78.4
Note: With the transfer of LCC to the KCTCS in 2003-04 FY, gifts to LCC stopped being reflected in UK’s Private Giving statistics.
Fiscal Year
Fiscal Year 2012-2013
- 27 -
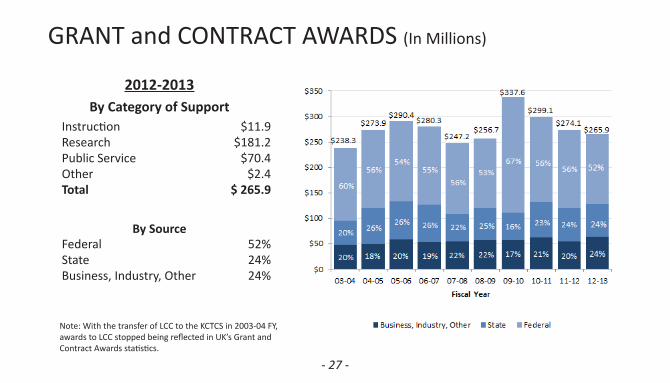
GRANT and CONTRACT AWARDS (In Millions)
Note: With the transfer of LCC to the KCTCS in 2003-04 FY, awards to LCC stopped being reflected in UK’s Grant and Contract Awards statistics.
2012-2013ByCategoryofSupport
Instruction $11.9 Research $181.2 Public Service $70.4 Other $2.4 Total $ 265.9
By SourceFederal 52%State 24%Business, Industry, Other 24%
- 28 -
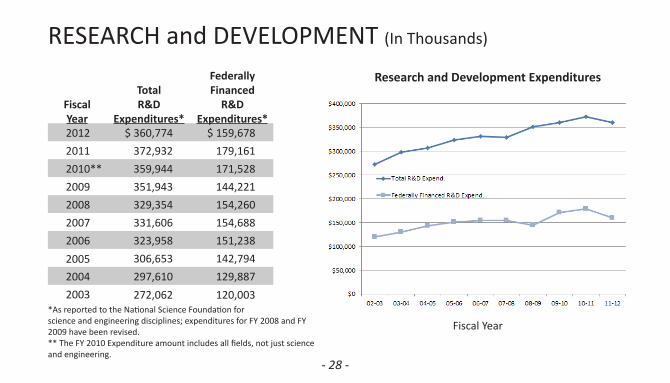
RESEARCH and DEVELOPMENT (In Thousands)
*As reported to the National Science Foundation for science and engineering disciplines; expenditures for FY 2008 and FY 2009 have been revised.** The FY 2010 Expenditure amount includes all fields, not just science and engineering.
ResearchandDevelopmentExpenditures
Fiscal Year
Fiscal Year
Total R&D
Expenditures*
FederallyFinancedR&D
Expenditures*2012 $ 360,774 $ 159,6782011 372,932 179,1612010** 359,944 171,5282009 351,943 144,2212008 329,354 154,2602007 331,606 154,6882006 323,958 151,2382005 306,653 142,7942004 297,610 129,8872003 272,062 120,003
- 29 -
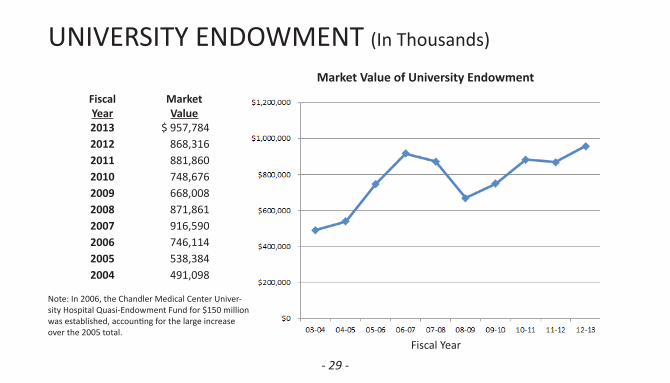
UNIVERSITY ENDOWMENT (In Thousands)
Note: In 2006, the Chandler Medical Center Univer-sity Hospital Quasi-Endowment Fund for $150 million was established, accounting for the large increase over the 2005 total.
MarketValueofUniversityEndowment
Fiscal Year
Fiscal Year
Market Value
2013 $ 957,7842012 868,316 2011 881,8602010 748,6762009 668,008 2008 871,8612007 916,5902006 746,1142005 538,3842004 491,098
- 30 -
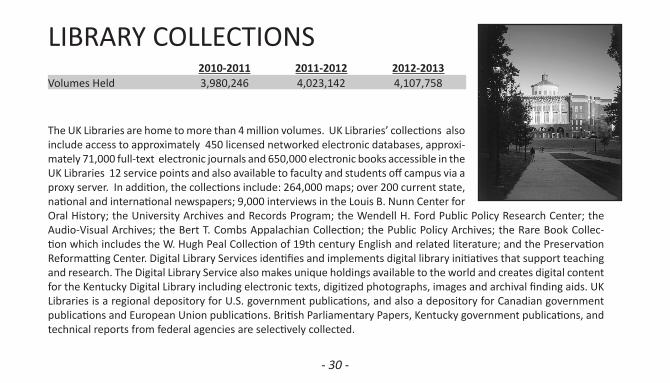
LIBRARY COLLECTIONS
The UK Libraries are home to more than 4 million volumes. UK Libraries’ collections also include access to approximately 450 licensed networked electronic databases, approxi-mately 71,000 full-text electronic journals and 650,000 electronic books accessible in the UK Libraries 12 service points and also available to faculty and students off campus via a proxy server. In addition, the collections include: 264,000 maps; over 200 current state, national and international newspapers; 9,000 interviews in the Louis B. Nunn Center for Oral History; the University Archives and Records Program; the Wendell H. Ford Public Policy Research Center; the Audio-Visual Archives; the Bert T. Combs Appalachian Collection; the Public Policy Archives; the Rare Book Collec-tion which includes the W. Hugh Peal Collection of 19th century English and related literature; and the Preservation Reformatting Center. Digital Library Services identifies and implements digital library initiatives that support teaching and research. The Digital Library Service also makes unique holdings available to the world and creates digital content for the Kentucky Digital Library including electronic texts, digitized photographs, images and archival finding aids. UK Libraries is a regional depository for U.S. government publications, and also a depository for Canadian government publications and European Union publications. British Parliamentary Papers, Kentucky government publications, and technical reports from federal agencies are selectively collected.
2010-2011 2011-2012 2012-2013Volumes Held 3,980,246 4,023,142 4,107,758
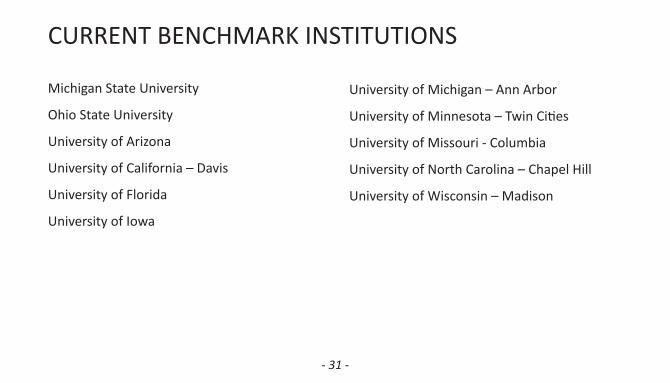
Michigan State University
Ohio State University
University of Arizona
University of California – Davis
University of Florida
University of Iowa
- 31 -
CURRENT BENCHMARK INSTITUTIONS
University of Michigan – Ann Arbor
University of Minnesota – Twin Cities
University of Missouri - Columbia
University of North Carolina – Chapel Hill
University of Wisconsin – Madison
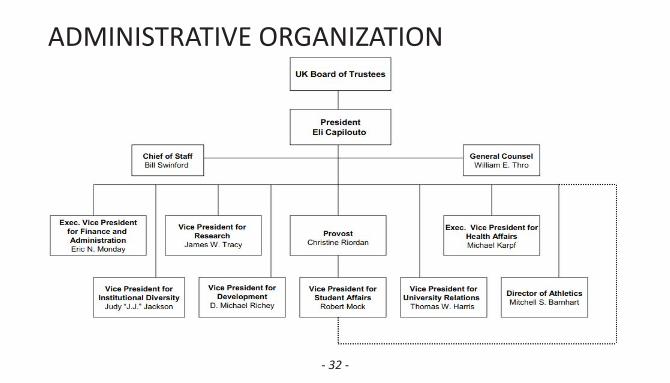
ADMINISTRATIVE ORGANIZATION
- 32 -
- 33 -
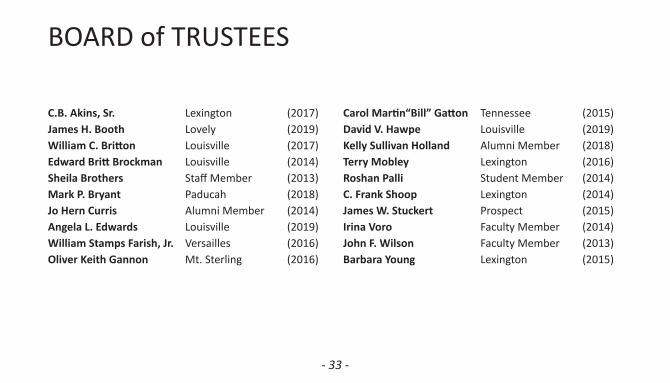
BOARD of TRUSTEES
C.B. Akins, Sr. Lexington (2017)JamesH.Booth Lovely (2019)WilliamC.Britton Louisville (2017)EdwardBrittBrockman Louisville (2014)Sheila Brothers Staff Member (2013)MarkP.Bryant Paducah (2018)Jo Hern Curris Alumni Member (2014)Angela L. Edwards Louisville (2019)WilliamStampsFarish,Jr. Versailles (2016)Oliver Keith Gannon Mt. Sterling (2016)
CarolMartin“Bill”Gatton Tennessee (2015)DavidV.Hawpe Louisville (2019)Kelly Sullivan Holland Alumni Member (2018)Terry Mobley Lexington (2016)RoshanPalli Student Member (2014)C.FrankShoop Lexington (2014)JamesW.Stuckert Prospect (2015)Irina Voro Faculty Member (2014)John F. Wilson Faculty Member (2013)Barbara Young Lexington (2015)
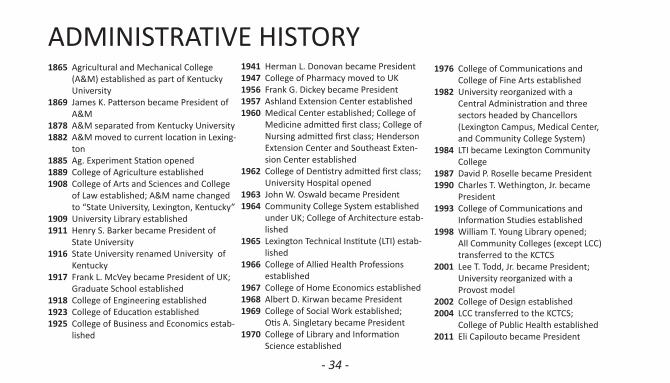
ADMINISTRATIVE HISTORY1865 Agricultural and Mechanical College
(A&M) established as part of Kentucky University
1869 James K. Patterson became President of A&M
1878 A&M separated from Kentucky University1882 A&M moved to current location in Lexing-
ton1885 Ag. Experiment Station opened1889 College of Agriculture established1908 College of Arts and Sciences and College
of Law established; A&M name changed to “State University, Lexington, Kentucky”
1909 University Library established1911 Henry S. Barker became President of
State University1916 State University renamed University of
Kentucky1917 Frank L. McVey became President of UK;
Graduate School established1918 College of Engineering established1923 College of Education established1925 College of Business and Economics estab-
lished
1941 Herman L. Donovan became President1947 College of Pharmacy moved to UK1956 Frank G. Dickey became President1957 Ashland Extension Center established1960 Medical Center established; College of
Medicine admitted first class; College of Nursing admitted first class; Henderson Extension Center and Southeast Exten-sion Center established
1962 College of Dentistry admitted first class; University Hospital opened
1963 John W. Oswald became President1964 Community College System established
under UK; College of Architecture estab-lished
1965 Lexington Technical Institute (LTI) estab-lished
1966 College of Allied Health Professions established
1967 College of Home Economics established1968 Albert D. Kirwan became President1969 College of Social Work established; Otis A. Singletary became President1970 College of Library and Information
Science established
1976 College of Communications and College of Fine Arts established1982 University reorganized with a
Central Administration and three sectors headed by Chancellors (Lexington Campus, Medical Center, and Community College System)
1984 LTI became Lexington Community College1987 David P. Roselle became President1990 Charles T. Wethington, Jr. became
President1993 College of Communications and
Information Studies established1998 William T. Young Library opened; All Community Colleges (except LCC)
transferred to the KCTCS2001 Lee T. Todd, Jr. became President;
University reorganized with a Provost model
2002 College of Design established2004 LCC transferred to the KCTCS;
College of Public Health established2011 Eli Capilouto became President
- 34 -
- 35 -
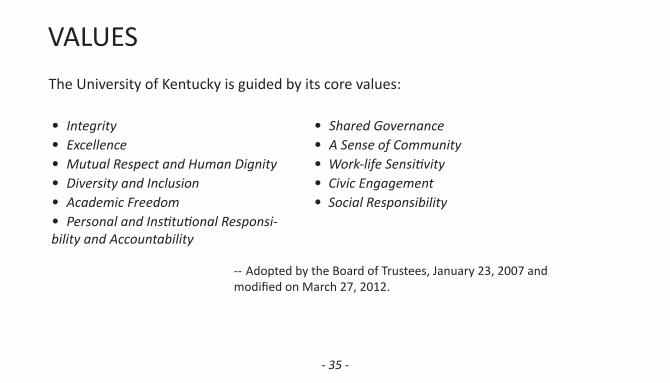
VALUESThe University of Kentucky is guided by its core values:
• Integrity• Excellence• Mutual Respect and Human Dignity• Diversity and Inclusion• Academic Freedom• Personal and Institutional Responsi-bility and Accountability
-- Adopted by the Board of Trustees, January 23, 2007 and modified on March 27, 2012.
• Shared Governance• A Sense of Community• Work-life Sensitivity • Civic Engagement• Social Responsibility