Embed Size (px)
Citation preview
UK Electricity Networks
The nature of UK electricity transmission and distribution networks in anintermittent renewable and embedded electricity generation future
By
Scott Butler
Imperial College of Science, Technology and MedicineCentre for Environmental Technology
in collaboration withParliamentary Office of Science and Technology (POST)
September 2001
IMPERIAL COLLEGE OF SCIENCE, TECHNOLOGY AND MEDICINE
(University of London)
Centre for Environmental Technology
TH Huxley School of Environment, Earth Sciences & Engineering
UK Electricity Networks
The nature of UK electricity transmission and distribution networks in anintermittent renewable and embedded electricity generation future.
By
Scott Butler
A report submitted in partial fulfilment of therequirements for the MSc and/or the DIC
September 2001
Page ii
DECLARATION OF OWN WORK
I declare that this thesis…
UK Electricity Networks: the nature of UK electricity transmission and distributionnetworks in an intermittent renewable and embedded electricity generation future.
Is entirely my own work and that where any material could be construed as the work ofothers, it is fully cited and referenced, and/or with appropriate acknowledgement given
Signature: __________________________________________
Date: _______________________________________________
Name of Student: _____________________________________
Name of Supervisor: ___________________________________
Page iii
AbstractUK Electricity Networks
The nature of UK electricity transmission and distribution networks in anintermittent renewable and embedded electricity generation future
Electricity systems have developed during the last century on the basis of large centralgenerating units. These feed into an interconnected high voltage transmission and lowervoltage distribution network. Recent developments challenge this structure.
Electricity market liberalisation introduced in 1989 has had a profound impact on thenature of the UK Electricity Supply Industry (ESI). This, along with technological advancesand increased environmental concerns, have fuelled interest in low-capital, small scale,low pollution technologies. The UK Government has also set a range of energy relatedtargets that reflect environmental concerns – to increase the contribution of renewableelectricity technologies and Combined Heat and Power (CHP), and reductions ingreenhouse gas emissions (to which the electricity industry is a major contributor). Thisthesis argues that current regulatory and commercial frameworks require amending to fullyreflect and to achieve these energy policy objectives.
CHP and other small-scale generating technologies are ‘embedded’ directly into the lowervoltage distribution networks rather than connected to the transmission network. In a’distributed’ electricity system, embedded generators would meet localised demand. Anyexcess generation is fed into active distribution networks to meet demand elsewhere. Asthe number of different components in the network increase, so does the need for more‘active’ management, and sophisticated control and monitoring at the distribution level.
The trend towards having a larger proportion of embedded and renewable generation willhave implications for the whole of the UK ESI, in particular the configuration and operationof distribution and transmission networks. A number of strategic, technical, commercialand market issues are identified in this thesis. These include regulation and chargingprinciples, the impacts of New Electricity Trading Arrangements (NETA) and the UtilitiesAct 2000, facilitation of competition in distribution networks, the variable output of certainrenewable technologies, network integrity requirements and net-metering options. Failureto develop appropriate electricity networks will be a significant constraint to embedded andlow carbon generation, and meeting Government energy targets.
This thesis argues that central to the development of flexible and active electricity networksis a clear vision of the ‘Energy Future’. Market rules, regulations and incentives need toreflect social and environmental energy policy objectives. The basic aim of Governmentpolicy should be to construct an equitable regulatory and commercial framework thatmotivates network development, and within which embedded small-scale electricitygeneration can compete fairly with central large-scale electricity generation.
Scott ButlerImperial College of Science, Technology and Medicine, LondonMSc Environmental technology – Energy Policy Option
Thesis Supervisor: Matthew LeachCollaborating Agency: The Parliamentary Office of Science and Technology (POST)

Page iv
Acknowledgements
A range of people deserve thanks for their advice, assistance and support over the last six
months. My family, friends and colleagues at Imperial College and the Parliamentary Office
of Science Technology have all contributed, providing encouragement when needed, and
as importantly, entertainment and laughter.
I would like to acknowledge the contribution of the consultees and stakeholders who
attended the ‘Group Review’. Their input provided focus and the necessary real world
perspective. Special thanks go to Stewart Boyle and Lewis Dale.
I would also like to thank my thesis supervisor, Matthew Leach, for his discerning advice,
and for reminding me of the distinction between a thesis and a report. Gary Kass deserves
a mention for a number of reasons and has a been a constant source of support, insightful
commentary and perceptive pwobing (sic). Thanks also to Sarah and Peter for the last
minute advice and assistance in printing the final document
Special thanks are reserved for Faye, for amongst many things, managing to put up with
me.
Page v
Acronyms, abbreviations and jargon
AC Alternating Current
AlternatingCurrent
Electric current that surges back and forth, in the UK at the frequency 50times a second (50 hertz).
Current Flow of electricity
CCGT Combined Cycle Gas Turbine
CEGB Central Electricity Generating Board
CHP Combined Heat and Power – an embedded generation technology thatsimultaneously produces electricity and heat
CO2 Carbon Dioxide – a greenhouse gas
Cogeneration Simultaneous generation of electricity and heat (see CHP)
Direct Current Electric current that flows in one direction
Dispatch Instructing a generator to deliver or not deliver electricity into the system
Distribution Transport and delivery of electric current to users at low voltage
DC Direct Current
DEFRA Department of Environment, Food and Rural Affairs – since June 2001 (seeDETR)
DETR Department of Environment, Transport and Regions – May 1997 to June 2001(see DEFRA)
DNOs Distribution Network Operators
DTI Department of Trade and Industry
EmbeddedGeneration
Generation connected to the distribution networks
EC European Commission
EdF Electricité de France
EGWG Embedded Generation Working Group
ESI Electricity Supply Industry
ETSU Energy Technology Support Unit
Page vi
EU European Union
Frequency Of alternating current – the number of times a second the current surges backand forth. Measured in hertz (Hz)
Grid A network of high voltage transmission lines
Intermittency Variable nature of output from certain renewable technologies, e.g. wind andsolar
GW Gigawatt – One billion watts
KV Kilovolts – One thousand volts
KW Kilowatt - One thousand watts
KWh Kilowatt-hour – unit of electrical energy. One kilowatt consumed for one hour
Load Technology that uses electricity and the amount of electricity it uses. Alsoreferred to as demand
MW Megawatt – one million watts
Mwe Megawatt of electrical output
MWth Megawatt of thermal/heat output
NETA New Electricity Trading Arrangements
NFFO Non-Fossil Fuel Obligation
NGC National Grid Company – owners and operators of the high voltagetransmission network in England and Wales
Ofgem Office of Gas and Electricity Markets – regulator of the ESI in England,Scotland and Wales since 1999
Peak load Maximum demand on the electricity system over a set period
Power The amount of energy delivered in a unit of time – measured in watts
PIU Cabinet Office Performance and Innovation Unit
POST Parliamentary Office of Science and Technology
PV Solar photovoltaic – a renewable generating technology
RCEP Royal Commission on Environmental Pollution
RECs Regional Electricity Companies

Page vii
R & D Research and Development
RO Renewables Obligation
Synchronised Surging back and forth in step
SYS Seven Year Statement – a report, produced annually by NGC
Transmission Transport of electric current at high voltages
TW Terrawatt – a trillion watts
V Volt – unit of electrical pressure which causes a current to flow
Voltage Electrical pressure between different points in a circuit
W Watt – unit of power which measures the work done when current is caused toflow in an electrical circuit
Page viii
Contents
Declaration of own work iAbstract iiAcknowledgements iiiAcronyms, abbreviations and jargon iv
1 Introduction 11.1 Aims 41.2 Objectives 41.3 Collaboration 51.4 Method 51.5 Structure of the Thesis 7
2 The History of Electricity from 1878 92.1 A Brief History of Electricity to 1989 9
The Birth of an Industry 9Centralisation, Integration and Continued Growth 10Centralisation and Nationalisation 11
2.2 The Reform of an Industry 12Rationale and Motivation for Reform 12Restructuring and Liberalisation 12Regulation 14
2.3 Discussion 15
3 The UK Electricity Supply Industry 163.1 Overview of UK ESI 16
England and Wales 16Scotland 18Northern Ireland 19
3.2 The Utilities Act 2000 and the Wholesale Electricity Market 20The Utilities Act 2000 20New Electricity Trading Arrangements (NETA) 21
3.3 Market support for Renewable and Sustainable Energy 21Non-Fossil Fuel Obligation (NFFO) 22Renewables Obligation 24
3.4 Impacts of Restructuring and Liberalisation 24Generation Costs and Technologies 24Competition for Customers and Electricity Prices 25
3.5 Other Stakeholders, Studies and Activities 26The European Union (EU) 26UK Government 27Parliament 27Reports and Studies 27
3.6 Discussion 28
4 Evolution of UK Electricity Networks 304.1 Origins and History of UK Electricity Networks 304.2 Transmission 31
The National Grid Company plc (NGC) 32Interconnection 34Transmission Network Access 35
Page ix
Transmission Network Charges 364.3 Distribution 37
Quality of Supply 37Performance Standards 38Distribution Network Connections 38
4.4 Benefits of an interconnected transmission and distribution system 39Bulk power transfers 40Economic Operation 40Customer security of supply 40Spare Generation Capacity 42Reduction in Frequency Response 43Maintaining the benefits of an interconnected electricity network 43
4.5 Discussion 44
5 Embedded and Intermittent Generation 465.1 Embedded Generation 46
Drivers for the Expansion of Embedded Generation 47Overview of Technical Implications of Embedded Generation 48
5.2 Intermittency 505.3 Embedded Generation Technologies 51
Combined Heat and Power (CHP) 52Wind 52
5.4 Electricity Storage 54Energy storage applications 54
5.5 Discussion 56
6 Identification and Analysis of Key Issues 586.1 Strategic Issues 58
Vision 58Regulation and Charging 60Skills and Innovation 61
6.2 Commercial and Market Issues 61Facilitation of Competition 61Cost and Benefits of Embedded Generation 65
6.3 Technical Issues 67System Integrity Requirements 67System Integrity Methods 69Distribution 71
6.4 UK ESI Strengths and Weaknesses 74
7 Discussion and Conclusions 767.1 Strategic Issues 767.2 Commercial and Market Issues 777.3 Technical Issues 797.4 Discussion 817.5 Final Comments 83
Critique of the Method and Areas for Further Research 85
Bibliography and References 87
Annex One Summary of Initial Meetings 95

Page x
Annex Two Consultation Document (19 July 2001) 100
Annex Three Invitation, Attendees List and Presentation 114
Annex Four Outputs from Group Discussion and Review 118
Annex Five History of Electricity up to 1989 122
Annex Six A History of UK Electricity Networks 135
Annex Seven Benefits of Interconnected Networks 138

Page xi
Boxes
Box 1 UK Electricity Pool – 1990 to 2001 13Box 2 UK Electricity Generating Companies 17Box 3 New Electricity Trading Arrangements – March 2001 onwards 22Box 4 Non Fossil Fuel Obligation 23Box 5 Renewables Obligation 24Box 6 Ancillary Services 33Box 7 Transmission Interconnection 34Box 8 Transmission Network Charges 36Box 9 Maintaining the benefits of an interconnected electricity network 43Box 10 Embedded Generation Case Study – The Netherlands 48Box 11 Intermittent Generation Case Study – Denmark 50Box 12 Embedded and Renewable Energy Technologies 53Box 13 Electricity Storage Technologies 55Box 14 Net-metering Case Study – TXU Europe and Greenpeace 73Box 15 Embedded Generation and UK ESI Strengths and Weaknesses 75
Figures
Figure 1: An Interconnected Electricity System 2Figure 2: A Distributed Electricity System 3Figure 3: A Brief History of Electricity to 1989 9Figure 4: Origins and History of UK Electricity Networks 30Figure 5: UK Electricity Transmission Network – April 1999 41Figure 6: Electricity Flow Pattern for 2001/02 42
Tables
Table 1: UK ESI – Fuel Sources for Generation, 1989 and 1999 17Table 2: UK ESI – Supply, Capacity and Demand, 1989 and 1999 25Table 3: Breakdown of UK Electricity Prices by Function 26Table 4: Electricity Transmission Networks in the UK – 1999/00 32Table 5: UK Distribution Network Operators – 1999/00 37


UK Electricity Networks, September 2001
Page 1
1 Introduction
This thesis investigates the nature of electricity transmission and distribution networks in
the UK that will be required for an electricity system that supports a greater proportion of
intermittent renewable and embedded electricity generation. Government policy and the
regulatory and commercial frameworks required to motivate the development of future
transmission and distribution networks will be analysed.
Under the 1997 Kyoto Protocol to the United Nations Framework Convention on Climate
Change, the UK has accepted a legally binding target to reduce greenhouse gas emissions
by 12.5% by 2008 - 2012, as compared to 1990 levels. The UK government has
targeted a reduction in its carbon dioxide (CO2) emissions of 20% by 2010, as compared
to 1990. As part of the Government's steps towards further reductions, it has drafted a
‘Climate Change Programme’.
A key policy of this programme is the ‘Renewables Obligation’ aimed to produce 10% of
the UK's electricity from renewable sources by 2010. Currently, renewables, including
large-scale hydro generation accounted for 2.8% of total electricity generated in the UK in
1999. Generation from renewables other than large-scale hydro doubled from 1995 to
2000 (Electricity Association, 2001).
Another policy objective is to double the capacity of Combined Heat and Power (CHP)
electricity generation to at least 10GWe by 2010. Presently, CHP is the prevalent form of
embedded generation in the UK, contributing 4,239MW of electricity in 1999 (Digest of
United Kingdom Energy Statistics, 2000). CHP is often referred to as cogeneration, a
reflection of the technology’s simultaneous production of electrical and heat energy. CHP
plant tends to be located on industrial sites and to a lesser extent, commercial sites.
The key assumption lying behind this thesis is that the contribution of small-scale and
renewable electricity generation will continue to increase, beyond 2010 targets. Indeed, in
its statutory consultation on the Renewables Obligation, the Department of Trade and
Industry (DTI) acknowledges the potential need to set more ambitious targets beyond
2010 (DTI, 2001).
The historical structure of the electricity generating industry tended towards large-scale
generation plants and grid networks, state or private monopoly control, and the vertical
integration of generation, transmission, distribution and supply functions. The transmission
UK Electricity Networks, September 2001
Page 2
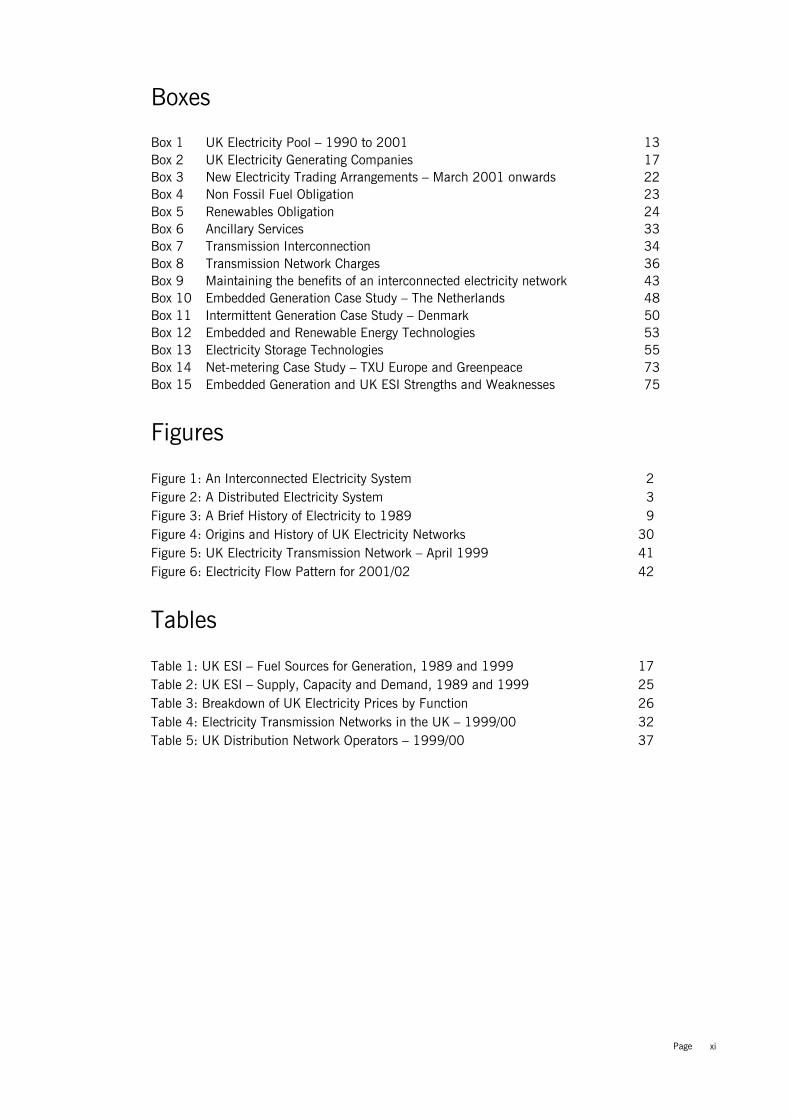
network transports electricity from generation units to distribution companies and a small
number of large industrial customers. The distribution companies then deliver the
electricity to the majority of customers through lower voltage networks. Figure 1 reflects
this process of large-scale generation supplying individual consumers through an
interconnected high voltage transmission network and local distribution system.
Figure 1: An Interconnected Electricity System
Source: National Grid Company, 2001
Since the late 1980s, the combined impact of the liberalisation of electricity markets,
technological advances, tighter financial/lending constraints, and increased environmental
concerns has fuelled interest in low-capital, small scale, fast revenue generating projects.
This is demonstrated by the rapid proliferation of combined cycle gas turbines (CCGT) in
the UK during the 1990s and the increase in CHP and other small-scale generating units
being embedded into lower voltage distribution networks rather than connected to the high
voltage transmission system.
A distributed electricity system is one in which small and micro generators are connected
directly to factories, offices, households and to lower voltage distribution networks.
Electricity not demanded by the directly connected customers is fed into the active
distribution network to meet demand elsewhere. Electricity storage systems may be
utilised to store any excess generation. Large power stations and large-scale renewables,
e.g. offshore wind, remain connected to the high voltage transmission network providing
national back up and ensure quality of supply. Again, storage may be utilised to
Power Station
GeneratorTransformer
33kV 11kV 240v
23kV 400kV
Large Factories,Heavy Industry
Medium Factories,Light Industry
To Small Factories,Commercial andResidential Areas
GENERATION
TRANSMISSIONDISTRIBUTION
SUPPLY
Transformer
gridsupplypoint
132kV
UK Electricity Networks, September 2001
Page 3
accommodate the variable output of some forms of generation. Such a distributed
electricity system is represented in Figure 2 below.
Figure 2: A Distributed Electricity System
A number of issues pertaining to the interactions between transmission and distribution
networks will arise as the contribution of embedded and intermittent renewables increase.
In the period to 2010 the current Government targets for renewables and CHP, if achieved
or approached, will result in a considerable increase in embedded generation. Assuming
that UK generating capacity in 2010 will be 70 GW, meeting the targets will result in an
estimated total of ~7 GW of renewable capacity and 10 GW of CHP. But, not all this new
capacity will be connected to distribution networks, e.g. large offshore wind.
ETSU (a sustainable energy consultancy) have estimated that, including existing embedded
generation, meeting the targets will result in excess of 20-25GW (approximately one third)
of total capacity connected to the distribution networks. ETSU arrived at this 20-25 GW
figure through 6.8 GW of renewable, 10 GW of CHP and 4-7 GW of fossil fuelled non
CHP, e.g. diesel and open cycle gas turbines. ETSU state that “this 20-25GW embedded
capacity cannot be accommodated on the currently configured networks without
significant change” (ETSU, 2001).
It is essential that debates regarding expanding renewable and embedded generation do
not lose sight of associated network developments. High investment costs and long lead
times for adapting and developing electricity networks must be fully acknowledged. Failure
to develop appropriate electricity networks will be a significant constraint to embedded and
DISTRIBUTION
Power Station
Storage
CENTRALGENERATION
gridsupplypoint
Transformer
households commercialand offices factories
small-scale generationmicro-
generation
EMBEDDED GENERATION
storage
TRANSMISSION
traditionalflows
embeddedflows
activedistribution
key:
UK Electricity Networks, September 2001
Page 4
low carbon generation, and meeting Government energy targets.
1.1 Aims
The key aim of this thesis is to assess - given the current industry, regulatory and
technology environment – the development of a transmission and distribution network that
reflects and can adapt to increased intermittent renewable and embedded electricity
generation.
The development of electricity networks may take a number of paths. Three scenarios
regarding the nature of future electricity transmission and distribution networks can be
easily constructed.
• The transmission and distribution networks continue to function and be interconnected
as now. (See Figure 1)
• The transmission system will serve as a conduit for transporting electricity and system
balancing between more locally dependent and active distribution networks. (see Figure
2)
• Isolated distribution networks develop with high-voltage transmission having a limited
role, transporting electricity from remote renewable resources, e.g. offshore wind and
providing security of supply and other services. (See Figure 2 without the active
distribution flows)
1.2 Objectives
A number of areas and issues require research to address the aims of the thesis. My
objective is to:
• Provide a historical overview of UK Electricity Supply Industry
• Provide a historical overview of UK electricity transmission and distribution networks
• Analyse the impacts of liberalisation and regulation on national electricity networks
• Analyse the current and likely future impacts of New Electricity Trading Arrangements
(NETA) on small-scale and intermittent renewable generation
• Define and assess embedded generation and intermittent renewable technologies
• Review new generating technologies (embedded generation, renewables and storage)
and electricity networks
• Assess changing generation, transmission and distribution relationships
• Identify and analyse the key issues for electricity networks relating to increased
embedded and renewable electricity generation
• Recommend future policy and regulatory structures and incentives to assist
development of transmission and distribution networks

UK Electricity Networks, September 2001
Page 5
1.3 Collaboration
This thesis was produced in collaboration with the UK Parliamentary Office of Science and
Technology (POST). POST is an office of the two Houses of Parliament (Commons and
Lords), charged with providing balanced and independent analysis of science and
technology based issues of public policy. POST carries out studies in areas such as
defence, transport, environment, energy, food and health as well as science policy.
Drawing on the talents, knowledge and expertise of the science and engineering
community, POST acts as an independent and unbiased source of information. It is
politically neutral, serves Parliament as a whole, and presents analyses and policy options
tailored to the parliamentary process.
In addition to this thesis, a four page parliamentary briefing (POSTnote) will be produced
and be distributed to over 600 parliamentarians, peers and other interested parties on the
POST mailing list. Alongside the POSTnote, a modified version of this thesis will also be
made available on the POST website (http://www.parliament.uk/post/home.htm).
The draft parliamentary briefing note will be issued for peer review by mid September
2001 and be published after parliament reconvenes following the summer recess. The
POSTnote and web report will be launched at a parliamentary seminar in autumn 2001.
1.4 Method
Initial research was conducted by reviewing current literature and papers relating to
decentralised electricity generation, cogeneration, renewable electricity generation,
technical operation of large scale electricity transmission grids and regional distribution
networks.
Also, the work and recommendations of the DTI/Ofgem Embedded Generation Working
Group (EGWG) was reviewed. The EGWG comprised representatives from key stakeholders
concerned with embedded generation and access to distribution networks. In addition, the
views of the transmission network owner and operator, the National Grid Company (NGC),
as presented to Parliamentary Select Committees and in their ‘Seven Year Statement’,
were considered.
This research was used as a basis for the historical overview of the electricity industry and
for analysing the evolution of, and rationale for the development of the current UK ESI
structure. An initial critical review of key issues for electricity networks was also
undertaken.

UK Electricity Networks, September 2001
Page 6
Preliminary discussions were held with a number of key stakeholders. These included the
National Grid Company Plc (NGC), Ofgem, Cabinet Office Performance and Innovation
Unit, Department of Trade and Industry, the then Department of Environment, Transport
and Regions (DETR) now Department for Environment, Food and Rural Affairs (DEFRA)
and the Institute of Public Policy Research (IPPR). Initial contact was in the form of
informal interviews regarding the impacts of increased intermittent renewable and
embedded electricity generation on existing transmission and distribution networks.
Key topics and areas for discussion were identified prior to the interviews (see above
paragraph) and were used as the basis for more specific and probing questions. These
interviews were used to gain a range of insights as to the specific issues of concern to the
individual/association/organisation being interviewed. Freedom to explore areas of interest
was provided, permitting a full exploration of ideas and issues (Macleod, 1997).
The lack of standard questions in the initial research stage raises concerns as to the
reliability of the outputs. Associated difficulties include ensuring that biases are ruled out
(Robson, 1993). However, it was felt that the unstructured informal interview offered the
most appropriate opportunity to quickly gather rich and instructive background material to
compare and contrast with the findings of the literature review. Annex One summarises the
outputs of these informal interviews, which fed into the structured ‘Group Review’ process
detailed below.
The outputs of these initial interviews - alongside findings from the literature review - were
used as the foundation for analysing the structure, operation and function of electricity
transmission and distribution networks in a intermittent renewable, embedded and
decentralised generation future. A key issues consultation document was produced
outlining key areas under the headings of technical; commercial and market; and policy
and strategic (Annex Two).
The ‘Key Issues’ consultation document was used as the focus for a ‘Group Review’ held
on 19 July 2001. Institutions that were represented at this review day were:
Combined Heat and Power Association
DEFRA – Sustainable Energy Policy Division
DTI – Energy Policy Directorate
Environment Agency
GPU Power
Greenpeace
Imperial College Centre for Energy Policy and Technology
UK Electricity Networks, September 2001
Page 7
National Grid Company Plc.
Ofgem
Parliamentary Office of Science and Technology
Parliamentary Renewable and Sustainable Energy Group
Scottish Power
TXU
United Utilities
The purpose of this group discussion and review was to assess issues identified in the
consultation document, highlight issues that may have been overlooked or misrepresented,
to discuss potential recommendations to address the key issues, and to identify areas for
further research. Another purpose of the Group Review was to improve communication
links and foster debate between key stakeholders in the UK ESI (Annex Three). After an
introductory presentation, that outlined the purpose and objectives of the day, each
participant was provided the opportunity to comment on the consultation document and to
offer their opinion as to the issues at hand. These comments and opinions were noted. The
plenary group was then broken up into three smaller groups. These three ‘break-out’
groups focussed on the major issues under one of the overarching technical, commercial
and market, and policy and strategic concerns. The plenary group reconvened to receive
feedback from the break-out groups and for further discussion.
The outputs of this review day (Annex Four) highlighting areas for further clarification and
analysis thereby contributing to the next stage of research.
1.5 Structure of the Thesis
Following this introduction the thesis is structured as follows:
Chapter 2 examines the history of electricity from 1878. The impact of technological
innovation, development of institutional structures and the economies of large-scale
operation are outlined, providing a base of knowledge and understanding from which
future industry developments will arise.
Chapter 3 analyses the UK electricity industry. This chapter provides an understanding of
the restructuring process, the industry relationships that have established as a result, and
the market structures and mechanisms that have been developed. From this follows a
detailed assessment of likely future developments of UK electricity networks.
Chapter 4 examines the evolution of UK electricity networks. Analysing the historical
UK Electricity Networks, September 2001
Page 8
development of this network, alongside the context and the rationale behind its operation
and construction is essential to understanding the opportunities and barriers to its future
evolution.
Chapter 5 defines the characteristics of embedded and intermittent generation and
electricity storage technologies. The technical implications of the increased contribution of
embedded and renewable generation to UK electricity supply are detailed and assessed.
Chapter 6 identifies and analyses the key issues for electricity networks related to
increased embedded and intermittent generation. Synthesising research and outputs of
consultations and the ‘Group Review’, this chapter highlights the range of issues pertaining
to the interactions between transmission and distribution networks that will arise as the
contribution of embedded and intermittent renewables increase. These implications and
issues are examined under three broad headings – strategic, commercial and market, and
technical.
Chapter 7 summarises the key issues related to the implications of increased embedded
and intermittent renewable generation on transmission and distribution networks. Key
conclusions and recommendations are highlighted.

UK Electricity Networks, September 2001
Page 9
2 The History of Electricity from 1878
Perhaps more than any other industry, the ESI illustrates the colossal impact of
technological innovation and economies of large-scale operation on modern economic life.
The purpose of this chapter is to serve as the base of knowledge and understanding from
which future industry developments will arise. But, to quote two pessimistic views,
“nations and governments have never learned anything from history, or acted upon any
lessons they might have drawn from it” (Hegel, 1830) and "history is more or less bunk"
(Henry Ford, 1916).
This chapter will review key moments in the history of electricity and the Electricity Supply
Industry (ESI) from 1878, with focus on developments of particular importance to the UK.
Reference to relevant international developments will be made throughout. It is appropriate
to begin this historical overview in 1878, the year Thomas Edison formed his Electric Light
Company, arguably the first electricity institution.
The market liberalisation introduced in 1989 has since had a profound impact on the
nature of the UK ESI. This chapter overviews the reform of the electricity industry after
1989, analysing the rationale for reform, detailing the restructuring and liberalisation
process and outlining the Electricity Pool and regulatory structure.
2.1 A Brief History of Electricity to 1989
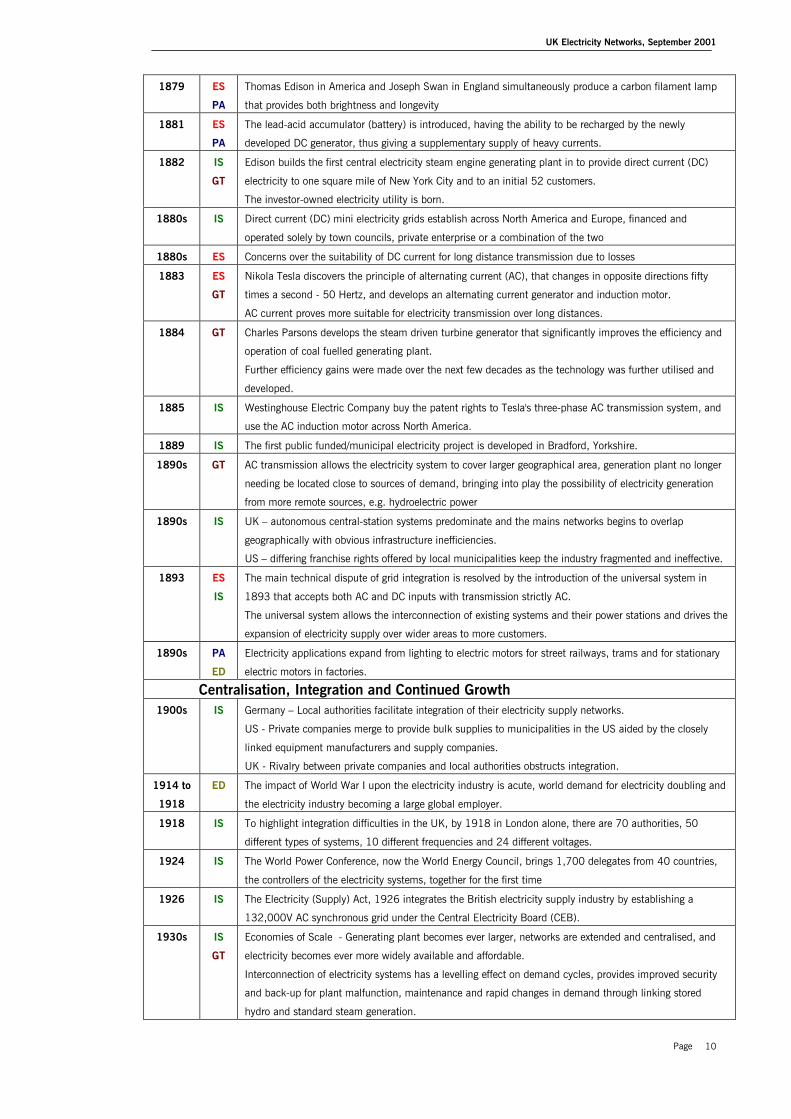
Figure 3 outlines the key historical developments in electrical science, electricity
generating technologies, practical applications of electricity, electricity demand and
institutional structures. A more detailed history of electricity, including references, is
attached to this thesis in Annex Five.
Figure 3: A Brief History of Electricity to 1989
KeyES Electrical SciencePA Practical ApplicationGT Generating TechnologyIS Institutional StructuresED Electricity Demand
Year A Brief History of ElectricityThe Birth of an Industry
1878 IS The Edison Electric Light Company is formed to “own, manufacture, operate and license the use of various
apparatus used in producing light, heat and power from electricity.” Edison’s vision is for a system that
delivers electricity to individual homes from a central power station.
UK Electricity Networks, September 2001
Page 10
1879 ES
PA
Thomas Edison in America and Joseph Swan in England simultaneously produce a carbon filament lamp
that provides both brightness and longevity
1881 ES
PA
The lead-acid accumulator (battery) is introduced, having the ability to be recharged by the newly
developed DC generator, thus giving a supplementary supply of heavy currents.
1882 IS
GT
Edison builds the first central electricity steam engine generating plant in to provide direct current (DC)
electricity to one square mile of New York City and to an initial 52 customers.
The investor-owned electricity utility is born.
1880s IS Direct current (DC) mini electricity grids establish across North America and Europe, financed and
operated solely by town councils, private enterprise or a combination of the two
1880s ES Concerns over the suitability of DC current for long distance transmission due to losses
1883 ES
GT
Nikola Tesla discovers the principle of alternating current (AC), that changes in opposite directions fifty
times a second - 50 Hertz, and develops an alternating current generator and induction motor.
AC current proves more suitable for electricity transmission over long distances.
1884 GT Charles Parsons develops the steam driven turbine generator that significantly improves the efficiency and
operation of coal fuelled generating plant.
Further efficiency gains were made over the next few decades as the technology was further utilised and
developed.
1885 IS Westinghouse Electric Company buy the patent rights to Tesla's three-phase AC transmission system, and
use the AC induction motor across North America.
1889 IS The first public funded/municipal electricity project is developed in Bradford, Yorkshire.
1890s GT AC transmission allows the electricity system to cover larger geographical area, generation plant no longer
needing be located close to sources of demand, bringing into play the possibility of electricity generation
from more remote sources, e.g. hydroelectric power
1890s IS UK – autonomous central-station systems predominate and the mains networks begins to overlap
geographically with obvious infrastructure inefficiencies.
US – differing franchise rights offered by local municipalities keep the industry fragmented and ineffective.
1893 ES
IS
The main technical dispute of grid integration is resolved by the introduction of the universal system in
1893 that accepts both AC and DC inputs with transmission strictly AC.
The universal system allows the interconnection of existing systems and their power stations and drives the
expansion of electricity supply over wider areas to more customers.
1890s PA
ED
Electricity applications expand from lighting to electric motors for street railways, trams and for stationary
electric motors in factories.
Centralisation, Integration and Continued Growth1900s IS Germany – Local authorities facilitate integration of their electricity supply networks.
US - Private companies merge to provide bulk supplies to municipalities in the US aided by the closely
linked equipment manufacturers and supply companies.
UK - Rivalry between private companies and local authorities obstructs integration.
1914 to
1918
ED The impact of World War I upon the electricity industry is acute, world demand for electricity doubling and
the electricity industry becoming a large global employer.
1918 IS To highlight integration difficulties in the UK, by 1918 in London alone, there are 70 authorities, 50
different types of systems, 10 different frequencies and 24 different voltages.
1924 IS The World Power Conference, now the World Energy Council, brings 1,700 delegates from 40 countries,
the controllers of the electricity systems, together for the first time
1926 IS The Electricity (Supply) Act, 1926 integrates the British electricity supply industry by establishing a
132,000V AC synchronous grid under the Central Electricity Board (CEB).
1930s IS
GT
Economies of Scale - Generating plant becomes ever larger, networks are extended and centralised, and
electricity becomes ever more widely available and affordable.
Interconnection of electricity systems has a levelling effect on demand cycles, provides improved security
and back-up for plant malfunction, maintenance and rapid changes in demand through linking stored
hydro and standard steam generation.
UK Electricity Networks, September 2001
Page 11
1930s PA
ED
Electricity is accepted as the energy of the future, an ever-growing number of appliances designed to be
powered by electricity appear, such as washing machines and refrigerators.
1934 ES The coil pearl lightbulb with which we are familiar with today is introduced.
1939 to
1945
IS Damage to transmission and distribution structures during World War II limits the growth in electricity
demand.
National governments make the rebuilding of the grid and supply structures a priority, being increasingly
seen as responsible for providing the public with power.
The costs of financing the large-scale generation projects limit private sector enthusiasm.
Centralisation and Nationalisation1945
onwards
IS UK – Electricity Act 1947 nationalises the electricity supply industry, as much on the basis of social
objectives for electrification for all as on potential economies. UK ESI is dominated by one large generating
and transmission company, the Central Electricity Generating Board (CEGB), which sells electricity in bulk
to 12 area distribution boards, each of which was obliged to serve a closed supply area or franchise.
US - Persists with its majority private-owned centralised structure, imposing a similar structure on
Germany and Japan in the immediate post-war years.
USSR and Eastern Europe - ESI operated under the central planning system, large power stations being
constructed by the state to drive industrialisation.
Latin America, Africa and Asia - The post-colonial nations tend to adopt the centralised, nationalised
structure.
1950s PA
ED
The US post-war consumerism boom is driven by the growth of electrical appliances available on the
market, backed by an electricity supply industry geared towards sustained growth.
Average power station size increase from 30MW to 300MW from 1950 to 1960.
1950s GT The predicted continued growth rates in electricity demand impact significantly on electricity system
planning and on project finance. New power stations ,“the bigger the better”, are constructed.
Generating technologies develop to include the combustion of oil and natural gas, as well as coal in steam
powered plants operating at fuel efficiencies of around 25% and outputs per unit of 500 MW.
Lack of suitable or a publicly acceptable sites near to areas of demand contributes to the development of
larger and more remote generating plant linked to the ever expanding high voltage transmission grid.
1956 GT UK - Nuclear powered electricity generation begins with the opening of Calder Hall. Initial capital outlay is
huge, much work needed to be done to bring them the capital costs in line with coal fired generation.
By the 1960s, design improvements appear to have achieved such cost reductions, and across the world
nuclear plant is ordered as a part of the portfolio to meet predicted increases in electricity demand.
1960s ED
GT
Annual demand growth rates in the region of 7% and large generating units (500 MW +) directly
connected to high voltage transmission networks continue to be constructed to match ever-rising demand.
1970s ED
IS
GT
US - The anticipated continuation of the high electricity demand growth patterns fails to materialise.
Generating capacity growth outstrips demand increases, some utilities being left with excess capacity and
damaged investor confidence.
The OPEC oil embargoes of 1973-1974 and 1979 and subsequent sharp hikes in fossil fuel prices,
alongside emerging concerns for the environmental impacts of electricity generation, lead to increased
operating and construction costs of power plant projects across the world.
Clean Air legislation has a significant impact on capital, fuel and operating costs, and energy conservation
legislation encourages slower growth in electricity demand.
Residential and industrial electricity prices begin to rise
1978 GT
IS
US Public Utilities Regulatory Policies Act (PURPA) – Legislation is introduced to encourage Independent
Power Producers and small-scale generation.
1979 GT The faith in nuclear electricity generation as the panacea to concerns about security of fossil fuels
diminishes as a result of near disaster at Three Mile Island, Pennsylvania in 1979.
1980s GT Environmental concerns regarding nuclear power and emissions from fossil-fuel generation continue to
increase, aided by increased scientific knowledge and focussed NGO lobbying.

UK Electricity Networks, September 2001
Page 12
1982 IS Chile – General Pinochet introduces legislation to liberalise the Chilean electricity industry.
1983 IS UK – The Electricity Act 1983, similarly to PURPA, encourages the growth of independent power
producers. The focus is on removing barriers to entry for non-utility generators and to provide independent
producers of electricity open access to electricity networks, although its effects prove limited.
1986 GT Chernobyl – the explosion at the nuclear power plant in the Ukraine raises worldwide concerns as the
safety of nuclear generation.
1989 IS UK Electricity Act 1989 – the UK ESI is privatised
2.2 The Reform of an Industry
Rationale and Motivation for Reform
In the late 1980s, the Conservative government viewed electricity as a tradable commodity
whose supply and price should be determined by market forces. Diversity of generation
sources would be at the behest of the market, the government’s role reduced to that of
ensuring fair competition, regulating natural monopoly and protecting the environment.
In the UK, the Electricity Act 1989 laid the foundations for the government’s privatisation
plans. Liberalisation was undertaken with the promise of increased efficiency, reduced
consumer prices, the more general goal of widening share ownership in the UK and to
raise revenues from the sell-off of government assets to finance tax reductions.
An additional motivation may have been the weakening of the then influential trade
unions, particularly the National Union of Mineworkers (NUM) (Parker, 2000). The
Conservative Government identified that a privatised electric utility industry would no
longer be under an obligation to purchase British coal at its then high price. The privatised
ESI would likely react by importing cheaper foreign coal or force UK price reductions. The
scope for the NUM to take action without severely damaging the British coal industry
would be removed.
Restructuring and Liberalisation
In liberalising the ESI, the Government decided to separate the natural monopoly
constituents - transmission and distribution - from those to which competition would be
introduced - generation and supply. In aiming to allow private participation, it was deemed
necessary to ‘unbundle’ the vertically integrated ESI, create industry transparency and to
break up long established industry relationships.
The Electricity Act 1989 laid the legislative foundations for the restructuring and
liberalisation of the ESI, most of which was transferred to private hands through flotation
on the stock market. More importantly, the Act introduced a competitive market into
electricity generation and supply. It was considered impractical to duplicate the
transmission and distribution networks and a system of independent regulation was

UK Electricity Networks, September 2001
Page 13
introduced. The Electricity Act introduced a regulatory system headed by a Director
General of Supply, responsible for ensuring an efficient and competitive electricity market
and for protecting customer interests.
Structural change was rapid. By April 1990, the generation, transmission, distribution and
supply elements of the UK electricity industry had been transformed. The new structure of
the ESI allowed for competition in wholesale power generation. Prices were established
through an ‘Electricity Pool’ (Box 1) and the monopoly transmission and distribution
networks were subject to independent regulation.
Box 1 UK Electricity Pool – 1990 to 2001
The liberalisation process removed, not only the electricity generator’s obligation to supply, but also thesecure market for their output. The Electricity Pool of England and Wales was created in 1990 tobalance electricity supply and demand, acting as a clearing house between generation and wholesaleconsumers of electricity. The National Grid Company (NGC) operated the ‘Electricity Pool’. The primarywholesale consumers of electricity were the RECs. All electricity generators bid into the mandatory pooland all RECs were entitled to purchase their electricity from it.
The pool operated as a spot market, with 48 half-hourly blocks per day, each priced 24 hours inadvance. The generation bids were entered in the National Grid Company ‘Goal’ program. Along withthese bids forecast for demand were computed. From these inputs, the program derived the half-hourlymarginal costs for the next day. The systems' manager ranked the bids in merit order from least to mostexpensive. The last unit needed to meet demand fixed the market clearing price (System MarginalPrice). This last unit called, by the very nature of the clearing system, was the most expensive and thusmany generators received payments higher than that which they had initially bid. Additional paymentswere on offer for ancillary services related to generation and quality of supply back up (Electricity Pool,2001).
Simple economic theory dictates that a reduction in supply will force up price and many observerssuggested that the electricity pool was open to manipulation by the large generators. They couldtogether set the system marginal price for the bulk of the time through limiting available generatingcapacity. In addition, the electricity pool was more than often bypassed in favour of longer termbilateral contracts, known as Contract for Differences, that hedged the risk of the volatile pool prices. Areview of the electricity pool led to its replacement in March 2001 by the New Electricity TradingArrangements (NETA).
In England and Wales, generation was divided between two privately owned fossil-fuel
generators, Powergen and National Power, and a nuclear generator, Nuclear Electric.
Nuclear Electric was retained under public ownership, primarily due to its uneconomic
nature. Ownership and operation of the high voltage transmission system was transferred
to the newly created National Grid Company (NGC) with a specific remit to facilitate
competition.
Fourteen Regional Electricity Companies (RECs) were set up to replace the area boards –
twelve in England and Wales and two in Scotland. The RECs were the majority owners of
the NGC until it’s flotation in 1995. Each REC supplied to a franchise market in its area
and oversaw the lower voltage distribution networks. Initially, customers with a demand in
excess of 100kW were allowed to purchase electricity from alternative suppliers to their

UK Electricity Networks, September 2001
Page 14
local REC, the threshold being phased out until its removal in May 1999. All electricity
customers now have the freedom to choose their electricity supplier.
Vertical integration of the electricity industry was preserved in Scotland with the creation of
ScottishPower and Scottish Hydro-Electric (now Scottish and Southern Energy). Nuclear
generation was assigned to a separate company called Scottish Nuclear. The four
generating stations in Northern Ireland were purchased by a number of competing
generators in 1992. Northern Ireland Electricity became responsible for transmission,
distribution and supply and was floated on the Stock Exchange in 1993.
Part privatisation of the two state-owned nuclear companies, Nuclear Electric and Scottish
Nuclear, was undertaken in July 1996. They are now overseen by a holding company,
British Energy.
Regulation
The Electricity Act 1989 created an independent regulatory system that covered England,
Wales and Scotland, headed by the Director General of Electricity and Supply. The
principal roles of the regulator were to ensure the effective introduction of competition into
the ESI alongside adequate protection of consumer interests. The regulatory offices for
electricity and gas were merged in 1999 to create the Office for Gas and Electricity
Markets (Ofgem). Ofgem is governed by the Gas and Electricity Markets Authority and its
powers are provided under the Gas Act 1986, the Electricity Act 1989 and the Utilities
Act 2000. Ofgem, through advocating competition, is focussed on promoting and
protecting the interests of gas and electricity customers and licensing and monitoring the
gas and electricity companies, taking action where necessary to ensure compliance.
Ofgem’s main tasks are (Ofgem, 2001):
• Promoting competition in all parts of the gas and electricity industries by creating the
conditions which allow companies to compete fairly and which enable customers to
make an informed choice between suppliers.
• Regulating areas of the gas and electricity industries where competition is not effective
by setting price controls and standards to ensure customers get value for money and a
reliable service.
Northern Ireland has its own regulatory body, the Office for the Regulation of Electricity
and Gas (Ofreg). OFREG duties include promoting competition in the electricity industry,
protecting electricity and gas consumers, and arbitrating in disputes between consumer
and supplier.

UK Electricity Networks, September 2001
Page 15
2.3 Discussion
The history of the electricity supply industry is complex. Many factors have, and continue
to, impact upon its development. The discoveries of the science of electricity, the
development of generating technologies, designing practical applications of electricity and
the formation of appropriate institutional structures to generate, transport and supply
electricity have all combined to produce the ESI we know today. Different combinations of
these factors in different countries, particularly institutional structures, have resulted in the
development of a range of industry configurations at various times.
The nationalisation of the UK ESI in 1947 was undertaken as much to improve the
efficiency and cost effectiveness of the ESI as to meet social objectives of the Government
– to provide affordable and consistent electricity to all (Amin, 2000). Over estimation of
demand growth and the oil crises in the 1970s resulted in generation over capacity and
increased fuel costs. These developments prompted consideration and development of
alternative generating technologies and energy storage, and the need to reconsider the
suitability of industry structures for meeting energy policy objectives. Energy policy
objectives were beginning to reflect the need for fuel diversity to ensure security of supply
(a natural response to the oil crises) and to accept emerging concerns as to the
environmental impacts associated with the electricity supply industry.
Since 1989, the UK ESI has undergone market liberalisation in order to increase efficiency
and drive down costs. Worldwide, the trend towards market liberalisation is clearly
evident. Predominately private ESIs exist in Belgium, Japan and Spain, with public-private
ESIs operating in Germany, Denmark, Sweden, Finland and the US (IEA, 2001). The
impacts of market liberalisation, as reflected in the UK ESI restructuring, are reviewed and
analysed in the next chapter.
UK Electricity Networks, September 2001
Page 16
3 The UK Electricity Supply Industry
Following 40 years in the public sector, the ESI in the UK has experienced a radical
restructuring programme since 1989. This was designed principally to create a competitive
electricity market and ensure financial independence from Government.
A full understanding of the restructuring process, the industry relationships that have
established as a result, and the market structures and mechanisms that have been
developed is essential in assessing the future development of UK electricity networks
A summary of the UK ESI will be provided, detailing generation, transmission distribution
and supply functions in England and Wales, Scotland and Northern Ireland. Recently
introduced legislation - the Utilities Act 2000 and New Electricity Trading Arrangements -
will be assessed, as will additional support offered for renewable and sustainable energy
technologies. Following this will be an analysis of the impacts of the restructuring process
on generation costs, generation technologies and electricity prices.
This chapter will close by detailing and considering stakeholders and activities that are of
relevance to the nature of electricity transmission and distribution networks in an increased
embedded and intermittent renewable electricity system.
3.1 Overview of UK ESI
England and Wales
Generation
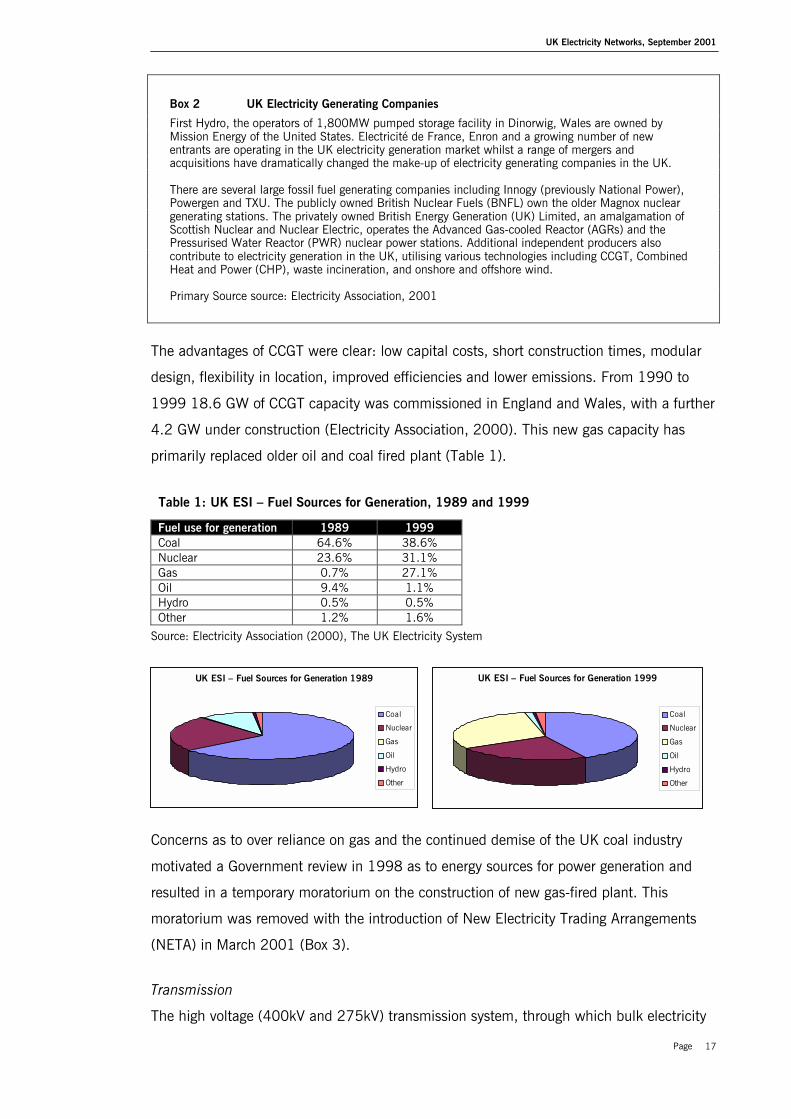
The CEGB successor companies (Powergen and National Power) are no longer the only
players in the wholesale electricity generating market. By 1999, 24 new generating
companies had entered the generation market in England and Wales (Electricity
Association, 2000). Box 2 details UK electricity generating companies.
Gas became the preferred fuel for new power generation plant in the UK. The ‘Dash for
Gas’ took advantage of abundant North Sea gas supplies and cheap world gas prices and
has had a significant impact on the mix of generation fuel sources in the UK. The
expansion of gas was a significant factor in decline of coal generation from 70% in
1990/91 to 33% in 2000 (NGC SYS, 2001).
UK Electricity Networks, September 2001
Page 17
Box 2 UK Electricity Generating Companies
First Hydro, the operators of 1,800MW pumped storage facility in Dinorwig, Wales are owned byMission Energy of the United States. Electricité de France, Enron and a growing number of newentrants are operating in the UK electricity generation market whilst a range of mergers andacquisitions have dramatically changed the make-up of electricity generating companies in the UK.
There are several large fossil fuel generating companies including Innogy (previously National Power),Powergen and TXU. The publicly owned British Nuclear Fuels (BNFL) own the older Magnox nucleargenerating stations. The privately owned British Energy Generation (UK) Limited, an amalgamation ofScottish Nuclear and Nuclear Electric, operates the Advanced Gas-cooled Reactor (AGRs) and thePressurised Water Reactor (PWR) nuclear power stations. Additional independent producers alsocontribute to electricity generation in the UK, utilising various technologies including CCGT, CombinedHeat and Power (CHP), waste incineration, and onshore and offshore wind.
Primary Source source: Electricity Association, 2001
The advantages of CCGT were clear: low capital costs, short construction times, modular
design, flexibility in location, improved efficiencies and lower emissions. From 1990 to
1999 18.6 GW of CCGT capacity was commissioned in England and Wales, with a further
4.2 GW under construction (Electricity Association, 2000). This new gas capacity has
primarily replaced older oil and coal fired plant (Table 1).
Table 1: UK ESI – Fuel Sources for Generation, 1989 and 1999
Fuel use for generation 1989 1999Coal 64.6% 38.6%Nuclear 23.6% 31.1%Gas 0.7% 27.1%Oil 9.4% 1.1%Hydro 0.5% 0.5%Other 1.2% 1.6%
Source: Electricity Association (2000), The UK Electricity System
Concerns as to over reliance on gas and the continued demise of the UK coal industry
motivated a Government review in 1998 as to energy sources for power generation and
resulted in a temporary moratorium on the construction of new gas-fired plant. This
moratorium was removed with the introduction of New Electricity Trading Arrangements
(NETA) in March 2001 (Box 3).
Transmission
The high voltage (400kV and 275kV) transmission system, through which bulk electricity
UK ESI – Fuel Sources for Generation 1989
Coal
Nuclear
Gas
Oil
Hydro
Other
UK ESI – Fuel Sources for Generation 1999
Coal
Nuclear
Gas
Oil
Hydro
Other

UK Electricity Networks, September 2001
Page 18
is transported from the electricity generators to the Regional Electricity Companies, is
owned and operated by the National Grid Company plc (NGC). NGC is an independent
company, floated on the stock market in 1995. NGC‘s statutory duties - provided under
the Electricity Act 1989, the Utilities Act 2000 and their transmission licence - include
developing and maintaining an efficient, co-ordinated and economic transmission system,
facilitating competition in electricity generation and supply and the preservation of amenity
and care for the environment (See Chapter 4).
Distribution and Supply
Distribution is the operation and maintenance of the assets which transport electricity from
the grid supply points to individual customers. It incorporates a network of overhead lines,
underground cabling, switches and transformers that operate at voltages from 132kv down
to 240v.
Twelve Regional Electricity Companies (RECs) are in control of the local monopoly
distribution networks in their franchise areas, e.g. SWALEC in South Wales. They are also
responsible for electricity supply to the bulk of consumers within their franchise areas. The
supply of electricity refers to the bulk purchase of electricity through the wholesale market
and the sale of that electricity to customers. From 1999 the supply of electricity was fully
liberalised and all consumers are now free to choose their supplier. For example, a
customer living in Westminster can choose to purchase electricity from ‘London Electricity’,
the REC, or from an alternative licensed provider such as ‘nPower’ or a renewable licensed
provider such as ‘Ecotricity’.
The direct successors to the Area Electricity Boards, the RECs licences set out a number of
public service and other obligations including ensuring continuity and supply, non-
discrimination, prohibition of cross-subsidies and price controls.
The licences required by suppliers who wish to sell to any customer attached to the
distribution networks are referred to as ‘second tier’ licences. RECs can also obtain second
tier licences to enable them to compete in distribution networks other than their own.
Holders of second-tier licences include Innogy, Powergen and British Energy.
Scotland
Scottish Power and Scottish and Southern Hydro-Electric maintain responsibility for fossil
fuel and hydro-power generation, transmission, distribution and supply. Scottish Nuclear
generating plants are managed through the privatised British Energy. British Energy is
connected to Scottish Power’s transmission system and accounts for approximately one
UK Electricity Networks, September 2001
Page 19
half of Scotland’s electricity requirements (Electricity Association, 2000).
Although remaining vertically integrated, there is a requirement on Scottish Power and
Scottish and Southern Energy to account separately for their generation, transmission,
distribution and supply activities. This is in order to ensure that there are no cross-
subsidies and that the companies are not earning excessive profits from use-of-system
charges
The Scottish transmission and distribution network is connected to the England and Wales
transmission system via an ‘interconnector’ (Box 7). Long term contracts with nuclear
generating units and the excess capacity in Scotland has limited generation trading
arrangements. But, generating plant in Scotland, irrespective of ownership, can sell to
England and Wales. Ofgem have proposed the restructuring of Scottish wholesale
electricity trading arrangements with the creation of a single British market by 2002
(Ofgem, 2001).
ScottishPower and Scottish and Southern Energy hold second tier licences and can supply
customers across the UK electricity market, likewise any second tier licence holders can
supply customers in Scotland. Alongside non-discriminatory third party access to
transmission and distribution networks in Scotland, this provides for competition in the
Scottish ESI.
Northern Ireland
In 1992, three private investors purchased the four electricity generating stations in
Northern Ireland. Northern Ireland Electricity (NIE) became responsible for transmission,
distribution and supply and was successfully floated on the Stock Exchange in 1993.
1998 saw further restructuring in Northern Ireland with the subsuming of NIE into a
holding company, Viridian Group.
NIE acts as an Independent System Operator, purchasing electricity from the generating
companies and operating the transmission and distribution networks. A separate supply
business has been established within the company. In order to facilitate competition,
second tier licences have been introduced. As in Scotland, there is no electricity pool in
Northern Ireland. All generators are required to sell their electricity to the purchasing
division of NIE who then sell it onto licenced suppliers.

UK Electricity Networks, September 2001
Page 20
3.2 The Utilities Act 2000 and the Wholesale Electricity Market
The Utilities Act 2000
The Utilities Act 2000 is the most significant piece of legislation for the UK ESI since the
Electricity Act 1989, fundamentally amending the industry structure and the regulatory
framework. The Utilities Act 2000 amended the Gas Act 1996, the Electricity Act 1989,
and updated the regulatory regime. An overview of the Utilities Act 2000 is essential in
understanding the legislative and regulatory environment in which the ESI is operating in
at present, and into the near future.
The gas and electricity sectors have converged during the 1990s since industry
restructuring, many companies now supplying both fuels to customers. Also, multi-utility
groups have been established, providing a range of gas, electricity, water and
telecommunication services.
The purpose of the Utilities Act is to advocate market development through integrated
regulation of the gas and electricity markets, the separation of electricity supply and
distribution, and the creation of the necessary framework to underpin the introduction of
NETA (Box 3). The Act provides a principal objective to the Secretary of State and the Gas
and Electricity Markets Authority to protect the interests of consumers, wherever possible
through the promotion of competition. A number of the provisions within the Act seek
improved regulation through transparency, consistency and predictability.
Combining and aligning the regulatory regimes for the gas and electricity industry is
intended to ensure that regulation keeps apace with an increasingly convergent energy
sector. A single regulatory body should improve the cost-effectiveness of regulation, allow
for more integrated thinking and assist the development of collaborative and strategic
relationships with the multi-utility corporations.
The Act introduced legislation for the separation of electricity distribution and supply,
removing the concept of a ‘Public Electricity Supplier’ (PES). The concept of a PES was
removed from April 2001, the duty to supply all customers being replaced by a statutory
duty on the licensed Distribution Network Operators (DNOs) to connect and to maintain
the connection. In order to ensure that at least one DNO is under such a duty to connect,
geographic responsibilities along the lines of the existing PES areas have been attached.
The distinction between first and second tier suppliers was also removed. Previously, PESs
were under a first tier licence that authorised them to supply electricity in their own area
and a different second tier licence to supply electricity in other areas. The concept of a
UK Electricity Networks, September 2001
Page 21
geographically exclusive area no longer applies.
From 2001, a licensed DNO is no longer permitted to hold a supply licence. Statutory
duties have been placed on DNOs similar to those placed on the transmission network
operator (NGC), requiring them to facilitate competition in generation and supply, to
develop and maintain an efficient, co-ordinated and economical system of distribution and
to be non-discriminatory in all practices. The Government intends that this duty will focus
DNOs on the need for fair access to distribution networks for embedded generation.
New Electricity Trading Arrangements (NETA)
NETA is a new wholesale electricity market that went live on March 27 2001, comprising
trading between generators and suppliers of electricity in England and Wales. The DTI has
stated that along with other market reforms, NETA could help to reduce wholesale
electricity costs by some 30% in real terms compared with 1998, worth some £2 billion a
year (DTI, 2001).
The role of the NETA Programme is not to dictate how energy will be bought and sold on
various exchanges or in bilateral contracts, but to provide mechanisms for the real time
balancing of the actual amounts of electricity generated against the amounts contracted to
be supplied (Box 3). NETA was designed to bring greater competition to the wholesale
electricity market to ensure that wholesale prices reflect underlying market conditions, to
the benefit of customers (Ofgem, 2001).
NETA has been constructed to deliver significant savings in wholesale electricity prices in
England and Wales (Energy World, 2001). However, the Balancing and Settlement Code
attaches high penalties on generators who produce less or more than contracted to. The
impact of such penalties has been felt hardest by suppliers who utilise generation
technologies that have more variable outputs, such as CHP and wind. The impacts on
small generators were significant enough for Ofgem to announce a review of the initial
impact of NETA on smaller generators on 9 April 2001, less than two weeks after its
introduction. Outputs of this review are due to be published in August 2001.
3.3 Market support for Renewable and Sustainable Energy
A sustainable energy policy can be defined as a means of finding a balance between
concerns for security of supply, economic efficiency, environmental protection and social
considerations. While energy markets have been constructed to motivate economic
efficiency, further mechanisms have been required to ensure security of supply,
environmental protection and social considerations.

UK Electricity Networks, September 2001
Page 22
Box 3 New Electricity Trading Arrangements – March 2001 onwards
NETA is more akin to commodity markets and based on bilateral trading between generators, suppliers,traders and customers. Forwards and futures markets operate from 24 hours up to several years aheadalongside a short-term bilateral market that allows fine-tuning of positions. After closure of the shortterm bilateral market, a voluntary balancing market opens, with the NGC accepting bids for incrementsor decrements of generation or demand in order to balance total system generation and demand.
Source: Yorkshire Electricity, http://www.yeg.co.uk/business/industry_news/welcome.shtml
Forwards and Futures MarketSuppliers make estimates of their demand based upon contracted loads and sales expectations. Theyuse this information to contract with generators to meet these basic requirements.
‘Bi-lateral’ trades take place in the forwards and futures markets. Contracts can be drawn up to coverrequirements several years into the future.
Power Exchange (PX)Suppliers fine-tune their positions from 24 hours before physical delivery. Suppliers are required to buyor sell electricity to cover any excess or shortfall between their actual position and that covered by thecontracts in the Forwards and Futures market.
The importance for a supplier to be accurately informed about electricity demand is clear. Prices arelikely to be volatile in the PX markets and the less a supplier is aware of their customer demandpatterns, the greater the risk.
Suppliers declare their positions by making a Final Physical Notifications (FPN), up to 3.5 hours beforephysical delivery. The PX closes 3.5 hours before real-time operation, known as ‘Gate Closure’.Settlements are undertaken on the basis of this FPN. Generators and suppliers can also makeBalancing Mechanism Offers to help secure the system.
Balancing MechanismAfter offers have closed, the system operator (NGC) ensures that the system is balanced and secured,calling on the bids made in the Power Exchange to achieve this.
SettlementsThis is effectively an accounting process whereby players in the Balancing Mechanism are subject topenalties if their positions were either over or under declared.
Primary source: Ofgem website, 2001
Renewable sources of energy currently exploited in the UK include hydro, wind, landfill
gas, biomass, municipal and industrial waste, sewage gas and to a lesser extent, solar,
wave and tidal. They have a critical role to play in contributing to the diversity,
sustainability and security of UK energy supplies, their further contribution being central to
meeting widely published Kyoto and Climate Change Programme targets.
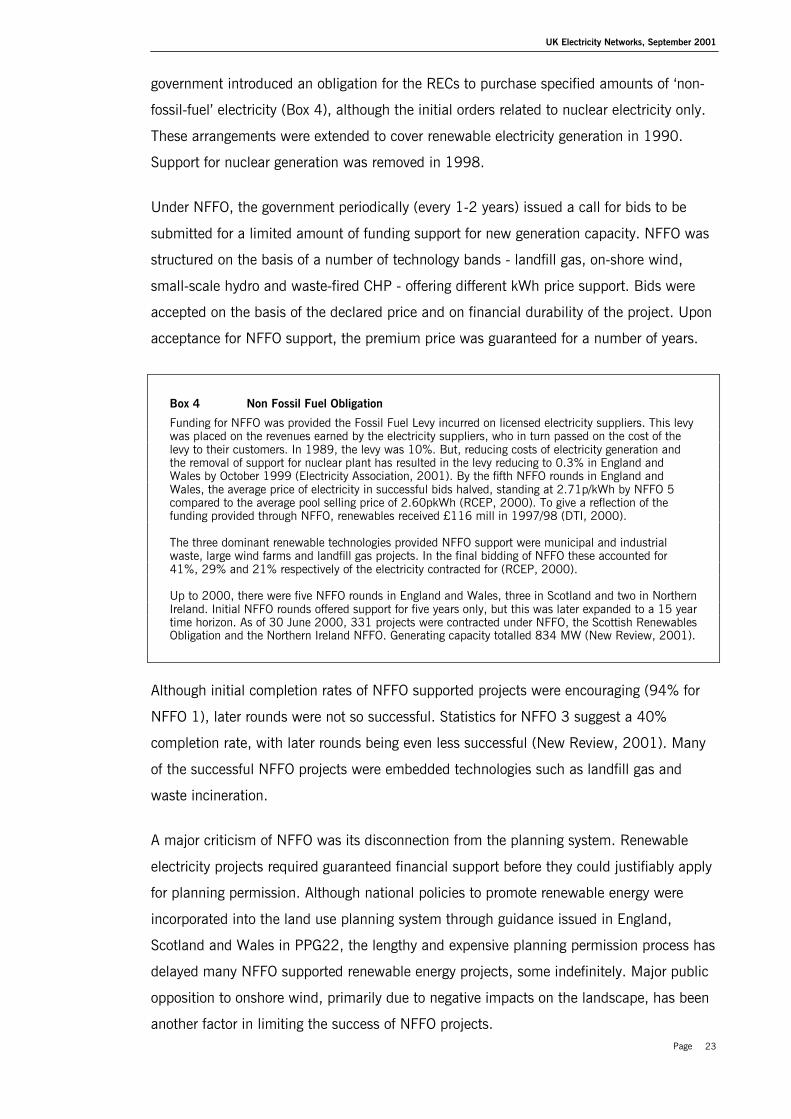
Non-Fossil Fuel Obligation (NFFO)
The government noted that, at the time of market liberalisation, the costs of nuclear
generation were too high to guarantee a market in the new structure. In 1989, the
UK Electricity Networks, September 2001
Page 23
government introduced an obligation for the RECs to purchase specified amounts of ‘non-
fossil-fuel’ electricity (Box 4), although the initial orders related to nuclear electricity only.
These arrangements were extended to cover renewable electricity generation in 1990.
Support for nuclear generation was removed in 1998.
Under NFFO, the government periodically (every 1-2 years) issued a call for bids to be
submitted for a limited amount of funding support for new generation capacity. NFFO was
structured on the basis of a number of technology bands - landfill gas, on-shore wind,
small-scale hydro and waste-fired CHP - offering different kWh price support. Bids were
accepted on the basis of the declared price and on financial durability of the project. Upon
acceptance for NFFO support, the premium price was guaranteed for a number of years.
Box 4 Non Fossil Fuel Obligation
Funding for NFFO was provided the Fossil Fuel Levy incurred on licensed electricity suppliers. This levywas placed on the revenues earned by the electricity suppliers, who in turn passed on the cost of thelevy to their customers. In 1989, the levy was 10%. But, reducing costs of electricity generation andthe removal of support for nuclear plant has resulted in the levy reducing to 0.3% in England andWales by October 1999 (Electricity Association, 2001). By the fifth NFFO rounds in England andWales, the average price of electricity in successful bids halved, standing at 2.71p/kWh by NFFO 5compared to the average pool selling price of 2.60pkWh (RCEP, 2000). To give a reflection of thefunding provided through NFFO, renewables received £116 mill in 1997/98 (DTI, 2000).
The three dominant renewable technologies provided NFFO support were municipal and industrialwaste, large wind farms and landfill gas projects. In the final bidding of NFFO these accounted for41%, 29% and 21% respectively of the electricity contracted for (RCEP, 2000).
Up to 2000, there were five NFFO rounds in England and Wales, three in Scotland and two in NorthernIreland. Initial NFFO rounds offered support for five years only, but this was later expanded to a 15 yeartime horizon. As of 30 June 2000, 331 projects were contracted under NFFO, the Scottish RenewablesObligation and the Northern Ireland NFFO. Generating capacity totalled 834 MW (New Review, 2001).
Although initial completion rates of NFFO supported projects were encouraging (94% for
NFFO 1), later rounds were not so successful. Statistics for NFFO 3 suggest a 40%
completion rate, with later rounds being even less successful (New Review, 2001). Many
of the successful NFFO projects were embedded technologies such as landfill gas and
waste incineration.
A major criticism of NFFO was its disconnection from the planning system. Renewable
electricity projects required guaranteed financial support before they could justifiably apply
for planning permission. Although national policies to promote renewable energy were
incorporated into the land use planning system through guidance issued in England,
Scotland and Wales in PPG22, the lengthy and expensive planning permission process has
delayed many NFFO supported renewable energy projects, some indefinitely. Major public
opposition to onshore wind, primarily due to negative impacts on the landscape, has been
another factor in limiting the success of NFFO projects.
UK Electricity Networks, September 2001
Page 24
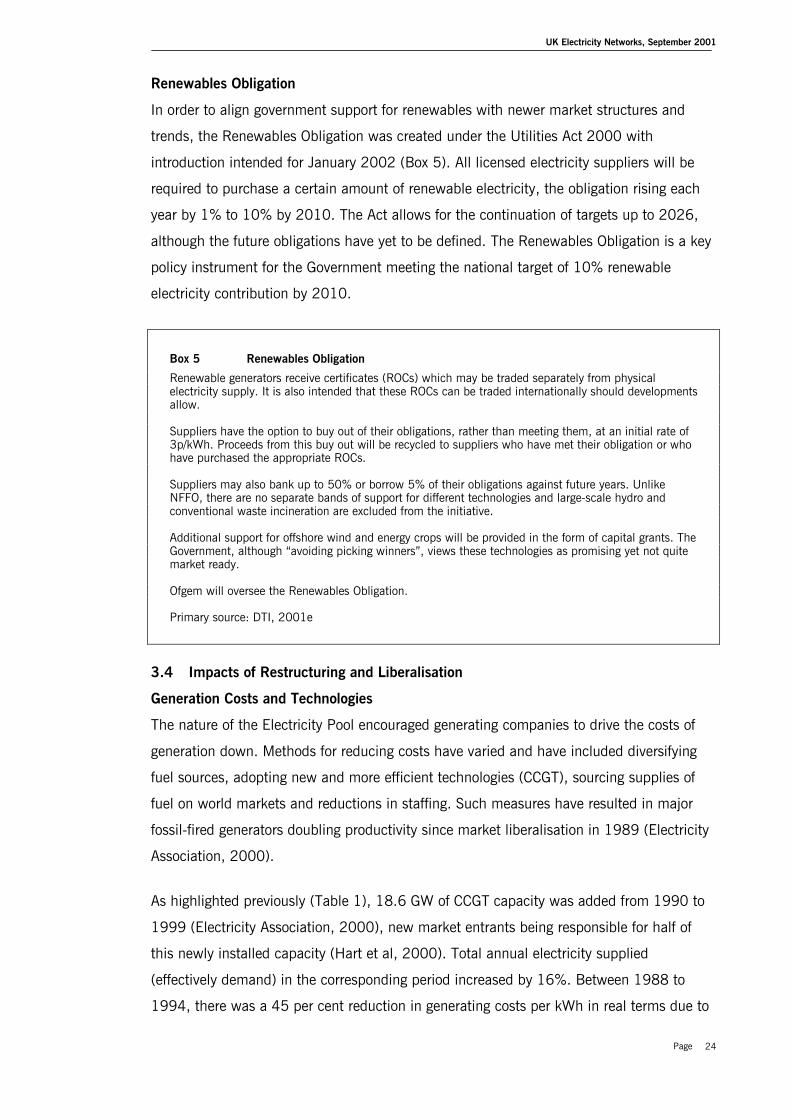
Renewables Obligation
In order to align government support for renewables with newer market structures and
trends, the Renewables Obligation was created under the Utilities Act 2000 with
introduction intended for January 2002 (Box 5). All licensed electricity suppliers will be
required to purchase a certain amount of renewable electricity, the obligation rising each
year by 1% to 10% by 2010. The Act allows for the continuation of targets up to 2026,
although the future obligations have yet to be defined. The Renewables Obligation is a key
policy instrument for the Government meeting the national target of 10% renewable
electricity contribution by 2010.
Box 5 Renewables Obligation
Renewable generators receive certificates (ROCs) which may be traded separately from physicalelectricity supply. It is also intended that these ROCs can be traded internationally should developmentsallow.
Suppliers have the option to buy out of their obligations, rather than meeting them, at an initial rate of3p/kWh. Proceeds from this buy out will be recycled to suppliers who have met their obligation or whohave purchased the appropriate ROCs.
Suppliers may also bank up to 50% or borrow 5% of their obligations against future years. UnlikeNFFO, there are no separate bands of support for different technologies and large-scale hydro andconventional waste incineration are excluded from the initiative.
Additional support for offshore wind and energy crops will be provided in the form of capital grants. TheGovernment, although “avoiding picking winners”, views these technologies as promising yet not quitemarket ready.
Ofgem will oversee the Renewables Obligation.
Primary source: DTI, 2001e
3.4 Impacts of Restructuring and Liberalisation
Generation Costs and Technologies
The nature of the Electricity Pool encouraged generating companies to drive the costs of
generation down. Methods for reducing costs have varied and have included diversifying
fuel sources, adopting new and more efficient technologies (CCGT), sourcing supplies of
fuel on world markets and reductions in staffing. Such measures have resulted in major
fossil-fired generators doubling productivity since market liberalisation in 1989 (Electricity
Association, 2000).
As highlighted previously (Table 1), 18.6 GW of CCGT capacity was added from 1990 to
1999 (Electricity Association, 2000), new market entrants being responsible for half of
this newly installed capacity (Hart et al, 2000). Total annual electricity supplied
(effectively demand) in the corresponding period increased by 16%. Between 1988 to
1994, there was a 45 per cent reduction in generating costs per kWh in real terms due to
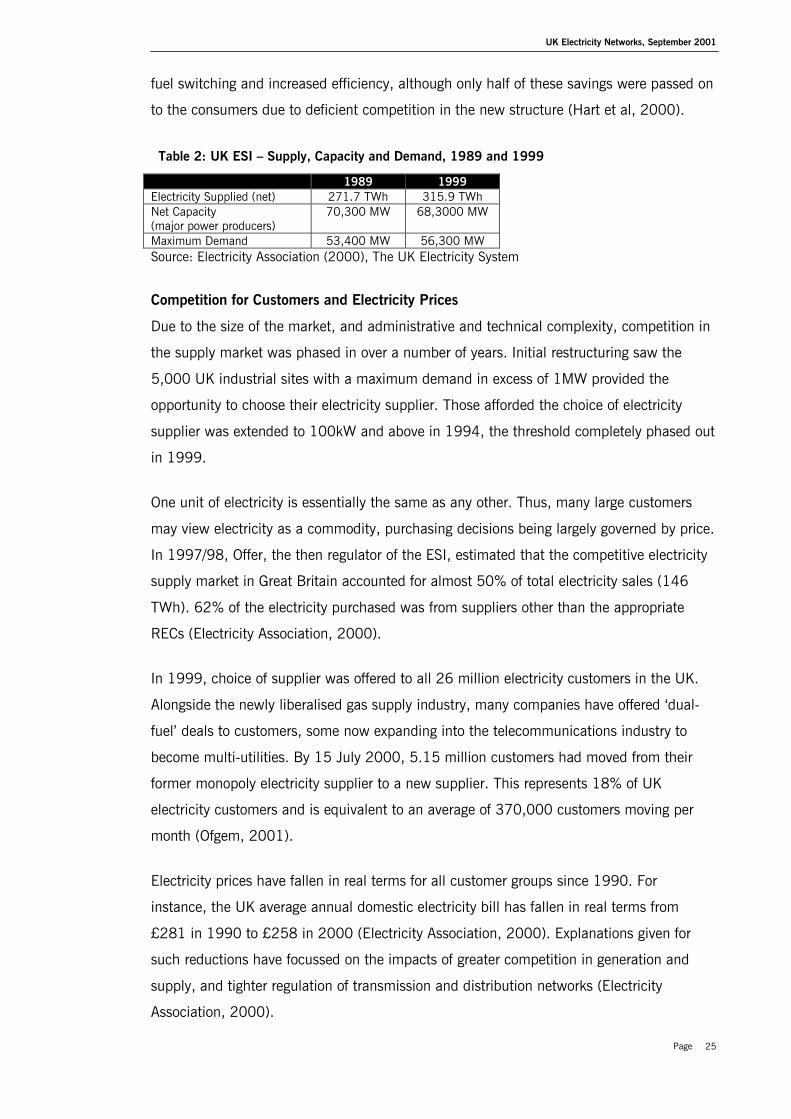
UK Electricity Networks, September 2001
Page 25
fuel switching and increased efficiency, although only half of these savings were passed on
to the consumers due to deficient competition in the new structure (Hart et al, 2000).
Table 2: UK ESI – Supply, Capacity and Demand, 1989 and 1999
1989 1999Electricity Supplied (net) 271.7 TWh 315.9 TWhNet Capacity(major power producers)
70,300 MW 68,3000 MW
Maximum Demand 53,400 MW 56,300 MWSource: Electricity Association (2000), The UK Electricity System
Competition for Customers and Electricity Prices
Due to the size of the market, and administrative and technical complexity, competition in
the supply market was phased in over a number of years. Initial restructuring saw the
5,000 UK industrial sites with a maximum demand in excess of 1MW provided the
opportunity to choose their electricity supplier. Those afforded the choice of electricity
supplier was extended to 100kW and above in 1994, the threshold completely phased out
in 1999.
One unit of electricity is essentially the same as any other. Thus, many large customers
may view electricity as a commodity, purchasing decisions being largely governed by price.
In 1997/98, Offer, the then regulator of the ESI, estimated that the competitive electricity
supply market in Great Britain accounted for almost 50% of total electricity sales (146
TWh). 62% of the electricity purchased was from suppliers other than the appropriate
RECs (Electricity Association, 2000).
In 1999, choice of supplier was offered to all 26 million electricity customers in the UK.
Alongside the newly liberalised gas supply industry, many companies have offered ‘dual-
fuel’ deals to customers, some now expanding into the telecommunications industry to
become multi-utilities. By 15 July 2000, 5.15 million customers had moved from their
former monopoly electricity supplier to a new supplier. This represents 18% of UK
electricity customers and is equivalent to an average of 370,000 customers moving per
month (Ofgem, 2001).
Electricity prices have fallen in real terms for all customer groups since 1990. For
instance, the UK average annual domestic electricity bill has fallen in real terms from
£281 in 1990 to £258 in 2000 (Electricity Association, 2000). Explanations given for
such reductions have focussed on the impacts of greater competition in generation and
supply, and tighter regulation of transmission and distribution networks (Electricity
Association, 2000).
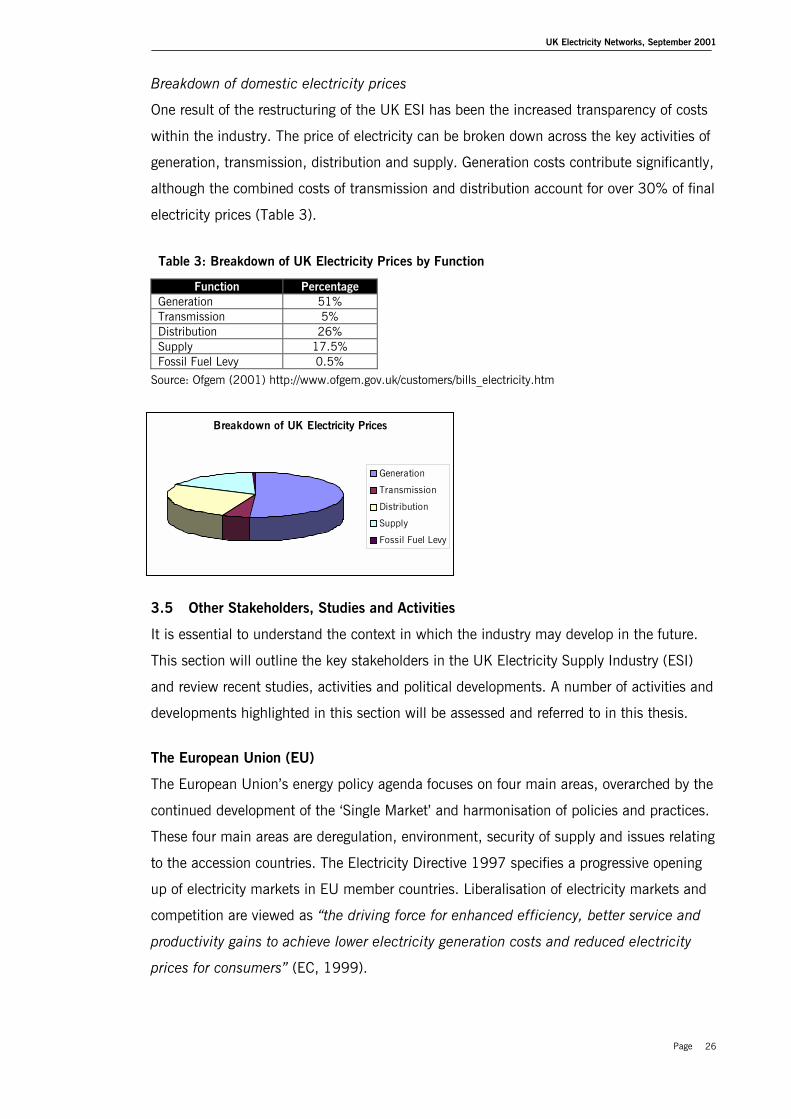
UK Electricity Networks, September 2001
Page 26
Breakdown of domestic electricity prices
One result of the restructuring of the UK ESI has been the increased transparency of costs
within the industry. The price of electricity can be broken down across the key activities of
generation, transmission, distribution and supply. Generation costs contribute significantly,
although the combined costs of transmission and distribution account for over 30% of final
electricity prices (Table 3).
Table 3: Breakdown of UK Electricity Prices by Function
Function PercentageGeneration 51%Transmission 5%Distribution 26%Supply 17.5%Fossil Fuel Levy 0.5%
Source: Ofgem (2001) http://www.ofgem.gov.uk/customers/bills_electricity.htm
3.5 Other Stakeholders, Studies and Activities
It is essential to understand the context in which the industry may develop in the future.
This section will outline the key stakeholders in the UK Electricity Supply Industry (ESI)
and review recent studies, activities and political developments. A number of activities and
developments highlighted in this section will be assessed and referred to in this thesis.
The European Union (EU)
The European Union’s energy policy agenda focuses on four main areas, overarched by the
continued development of the ‘Single Market’ and harmonisation of policies and practices.
These four main areas are deregulation, environment, security of supply and issues relating
to the accession countries. The Electricity Directive 1997 specifies a progressive opening
up of electricity markets in EU member countries. Liberalisation of electricity markets and
competition are viewed as “the driving force for enhanced efficiency, better service and
productivity gains to achieve lower electricity generation costs and reduced electricity
prices for consumers” (EC, 1999).
Breakdown of UK Electricity Prices
Generation
Transmission
Distribution
Supply
Fossil Fuel Levy
UK Electricity Networks, September 2001
Page 27
UK Government
The Government has recently announced a review of strategic issues regarding UK energy
policy, set up in response to the recommendations made by the Royal Commission for
Environmental Pollution (see below), and to take account of the UK’s commitments to
reduce CO2 emissions. The review will be set within the context of meeting the challenge
of global warming, while ensuring secure, diverse and reliable energy supplies at a
competitive price and is planned to be completed by the end of 2001.
(http://www.cabinet-office.gov.uk/innovation/2001/energy/energyscope.shtml)
Department of Trade and Industry (DTI)
The DTI is charged with working with others to meet UK government energy policy
objectives. The DTI in its initial submission to the UK Energy Review highlighted that the
UK energy strategy for the future needs to be pitched at the European, and in some cases,
the global level (DTI, 2001).
Department of Environment, Food and Rural Affairs (DEFRA)
DEFRA take the lead on CHP and energy efficiency matters, and develop policy responses
for climate change. DEFRA is a department that contributes to debates and policy
formulation regarding sustainable, renewable and embedded electricity generation.
Parliament
Recent parliamentary inquiries include those by the House of Lords Select Committee
(Electricity from Renewables), the House of Commons Select Committee on Science and
Technology (Wave and Tidal Energy) and the House of Commons Environmental Audit
Committee’s publication of memoranda on renewable energy.
The Parliamentary Renewable and Sustainable Energy Group (PRASEG) is a cross party
group for UK politicians that promotes sustainable energy issues in the UK Parliament. The
Parliamentary Energy Group (PGES) is another all party parliamentary group concerned
with energy policy, providing a link between MPs, Peers, MEPs of all parties and the ESI.
Reports and Studies
Embedded Generation Working Group (EGWG)
The joint Government/Industry Working Group on Embedded Generation Network Access
Issues considered generating plant located in distribution networks contributing a larger
proportion of total national generation. The backdrop to the EGWG was Government policy
objectives for renewable plant and CHP, and the wish among developers to introduce
various types of generating plant in distribution networks. EGWG produced a number of
UK Electricity Networks, September 2001
Page 28
detailed recommendations that will be discussed throughout this thesis.
Royal Commission on Environmental Pollution (RCEP)
The Royal Commission on Environmental Pollution (RCEP), an independent body that
advises the Queen, the Government, Parliament and the public on environmental issues,
produced a report in June 2000 entitled ‘Energy - The Changing Environment.’ (RCEP,
2000). One of the key conclusions of the report was the need for the UK Government to
plan for a 60% reduction in CO2 emissions originating from the combustion of fossil fuels
over the next 50 years. The RCEP concluded that this target can only be met with a large
expansion of renewable electricity production well beyond the 10% target for 2010,
significant and targeted improvements in industrial and domestic energy efficiency, and the
wider use of CHP for industrial, commercial and domestic purposes.
The RCEP acknowledged that the limited size of CHP and most renewable generation units
did not sit easily with existing transmission and distribution networks. These networks may
likely require modification, in terms of technology and incentives, to accommodate the
changing demands upon them.
Other Reports
A number of think tanks, consultancies, industry associations and others have produced
reports focussed on sustainable energy futures. These include the Environment Agency’s
“Sustainable Energy Vision for the UK”, the Fabian Society report “At the Energy
Crossroads”, the Forum for the Future report on “The UK’s Transition to a Low-Carbon
Economy” and The Institute for Public Policy Research “Low Carbon Initiatives” project.
3.6 Discussion
The impacts of the restructuring process that was initiated in 1989 on the UK ESI have
been profound. The primary drive for the restructuring was economic, driving costs down
through competition, reducing public sector costs and financing tax cuts for election
campaigns. Much less attention was given to social and environmental objectives, and fuel
diversity aspects of security of supply. The regulator has been charged to protect customer
needs primarily through competition. Restructuring has resulted in a sea change in the
generation mix, the ‘dash for gas’ significantly changing the nature of UK electricity
generation, and resulting in a massive decline in coal generation.
The Utilities Act 2000 and NETA have further introduced competitive measures to the
industry. The impacts of NETA on small-scale and renewable generators are of great
concern, and although support through NFFO, now replaced by the more market
UK Electricity Networks, September 2001
Page 29
orientated RO, has been provided, it seems at best that they are merely accommodating
the negative impacts of the new market mechanisms. The ‘unbundling of generation,
transmission, distribution and supply has increased transparency of costs within the
sector, highlighting, particularly, the significance of distribution activities to electricity
prices.
As detailed above, there are a number of stakeholders influencing the development of the
UK ESI, including the Government, Regulator, Parliament, industry, NGOs and others.
Viewpoints and rationales of these stakeholders may often be in conflict. Government and
industry desires for fully liberalised electricity markets must be weighed with the need to
reduce and control electricity generation related CO2 emissions. Reduction and control of
CO2 emissions will likely require some degree of government intervention, e.g. the
Renewables Obligation and the Climate Change Levy.
The relationships of the stakeholders will be critical to future developments of the ESI. The
complex interactions of government departments, government and industry forums (such
as EGWG), and relationships between generation, transmission and distribution companies
and others will all have a part to play in defining the route taken. In the near term, the
widely stated 10% and 10GWe targets set by the Government may drive renewable and
embedded generation expansion. The impacts of NETA and the outputs of the Energy
Review may amend this progress. Nevertheless, the desire and need to reduce CO2
emissions is likely to remain and as such, the UK ESI will have to adapt accordingly.
As stated in the Introduction, electricity networks need to develop in parallel with
generating technologies if government policy and targets are to be met. This is the subject
of the next chapter.
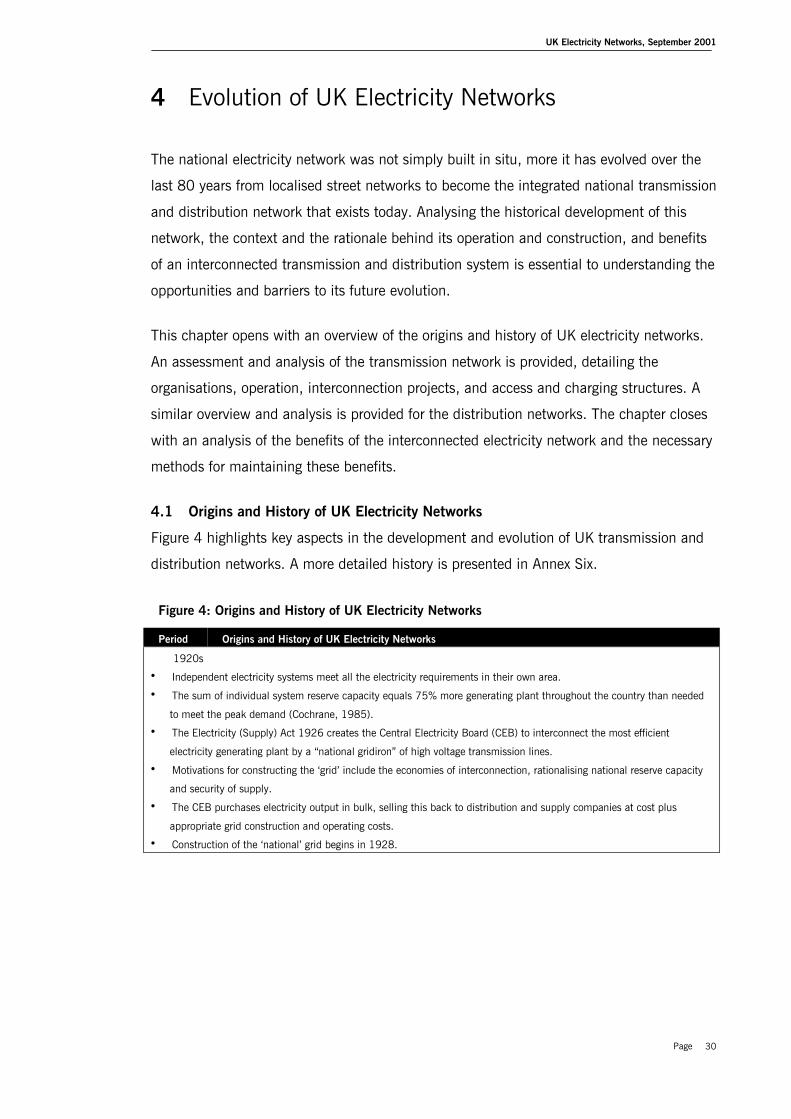
UK Electricity Networks, September 2001
Page 30
4 Evolution of UK Electricity Networks
The national electricity network was not simply built in situ, more it has evolved over the
last 80 years from localised street networks to become the integrated national transmission
and distribution network that exists today. Analysing the historical development of this
network, the context and the rationale behind its operation and construction, and benefits
of an interconnected transmission and distribution system is essential to understanding the
opportunities and barriers to its future evolution.
This chapter opens with an overview of the origins and history of UK electricity networks.
An assessment and analysis of the transmission network is provided, detailing the
organisations, operation, interconnection projects, and access and charging structures. A
similar overview and analysis is provided for the distribution networks. The chapter closes
with an analysis of the benefits of the interconnected electricity network and the necessary
methods for maintaining these benefits.
4.1 Origins and History of UK Electricity Networks
Figure 4 highlights key aspects in the development and evolution of UK transmission and
distribution networks. A more detailed history is presented in Annex Six.
Figure 4: Origins and History of UK Electricity Networks
Period Origins and History of UK Electricity Networks
1920s
• Independent electricity systems meet all the electricity requirements in their own area.
• The sum of individual system reserve capacity equals 75% more generating plant throughout the country than needed
to meet the peak demand (Cochrane, 1985).
• The Electricity (Supply) Act 1926 creates the Central Electricity Board (CEB) to interconnect the most efficient
electricity generating plant by a “national gridiron” of high voltage transmission lines.
• Motivations for constructing the ‘grid’ include the economies of interconnection, rationalising national reserve capacity
and security of supply.
• The CEB purchases electricity output in bulk, selling this back to distribution and supply companies at cost plus
appropriate grid construction and operating costs.
• Construction of the ‘national’ grid begins in 1928.
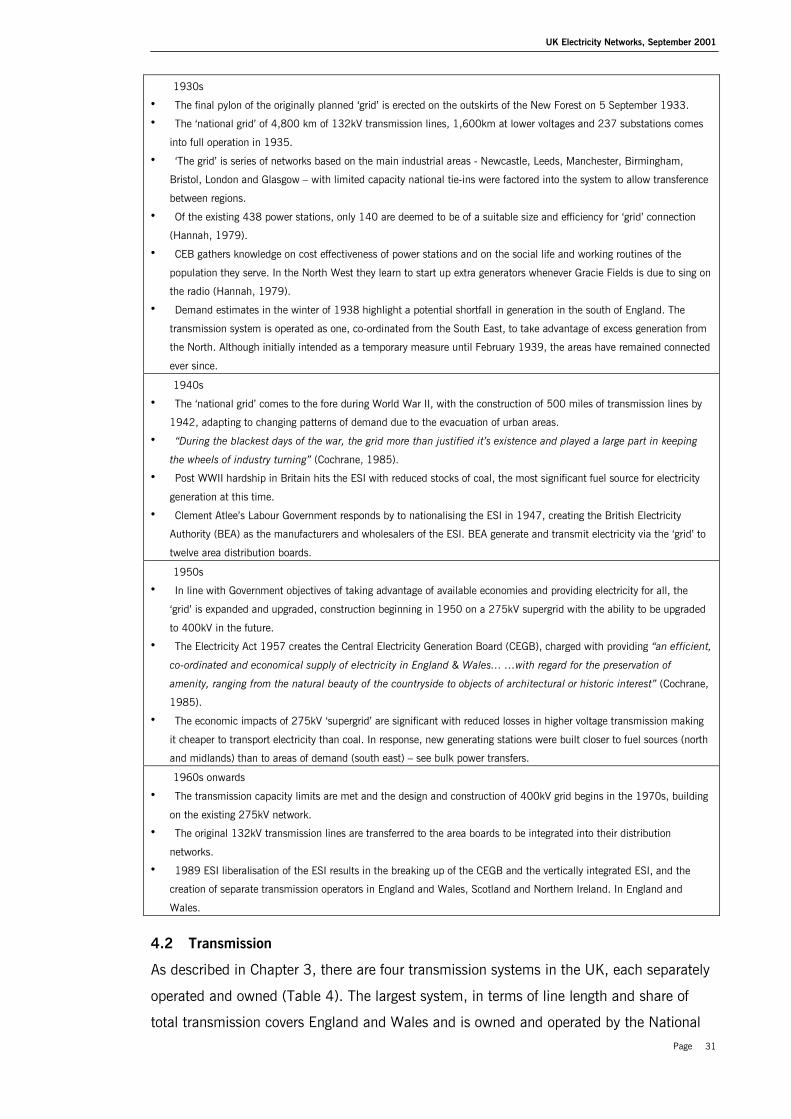
UK Electricity Networks, September 2001
Page 31
1930s
• The final pylon of the originally planned ‘grid’ is erected on the outskirts of the New Forest on 5 September 1933.
• The ‘national grid’ of 4,800 km of 132kV transmission lines, 1,600km at lower voltages and 237 substations comes
into full operation in 1935.
• ‘The grid’ is series of networks based on the main industrial areas - Newcastle, Leeds, Manchester, Birmingham,
Bristol, London and Glasgow – with limited capacity national tie-ins were factored into the system to allow transference
between regions.
• Of the existing 438 power stations, only 140 are deemed to be of a suitable size and efficiency for ‘grid’ connection
(Hannah, 1979).
• CEB gathers knowledge on cost effectiveness of power stations and on the social life and working routines of the
population they serve. In the North West they learn to start up extra generators whenever Gracie Fields is due to sing on
the radio (Hannah, 1979).
• Demand estimates in the winter of 1938 highlight a potential shortfall in generation in the south of England. The
transmission system is operated as one, co-ordinated from the South East, to take advantage of excess generation from
the North. Although initially intended as a temporary measure until February 1939, the areas have remained connected
ever since.
1940s
• The ‘national grid’ comes to the fore during World War II, with the construction of 500 miles of transmission lines by
1942, adapting to changing patterns of demand due to the evacuation of urban areas.
• “During the blackest days of the war, the grid more than justified it’s existence and played a large part in keeping
the wheels of industry turning” (Cochrane, 1985).
• Post WWII hardship in Britain hits the ESI with reduced stocks of coal, the most significant fuel source for electricity
generation at this time.
• Clement Atlee’s Labour Government responds by to nationalising the ESI in 1947, creating the British Electricity
Authority (BEA) as the manufacturers and wholesalers of the ESI. BEA generate and transmit electricity via the ‘grid’ to
twelve area distribution boards.
1950s
• In line with Government objectives of taking advantage of available economies and providing electricity for all, the
‘grid’ is expanded and upgraded, construction beginning in 1950 on a 275kV supergrid with the ability to be upgraded
to 400kV in the future.
• The Electricity Act 1957 creates the Central Electricity Generation Board (CEGB), charged with providing “an efficient,
co-ordinated and economical supply of electricity in England & Wales… …with regard for the preservation of
amenity, ranging from the natural beauty of the countryside to objects of architectural or historic interest” (Cochrane,
1985).
• The economic impacts of 275kV ‘supergrid’ are significant with reduced losses in higher voltage transmission making
it cheaper to transport electricity than coal. In response, new generating stations were built closer to fuel sources (north
and midlands) than to areas of demand (south east) – see bulk power transfers.
1960s onwards
• The transmission capacity limits are met and the design and construction of 400kV grid begins in the 1970s, building
on the existing 275kV network.
• The original 132kV transmission lines are transferred to the area boards to be integrated into their distribution
networks.
• 1989 ESI liberalisation of the ESI results in the breaking up of the CEGB and the vertically integrated ESI, and the
creation of separate transmission operators in England and Wales, Scotland and Northern Ireland. In England and
Wales.
4.2 Transmission
As described in Chapter 3, there are four transmission systems in the UK, each separately
operated and owned (Table 4). The largest system, in terms of line length and share of
total transmission covers England and Wales and is owned and operated by the National
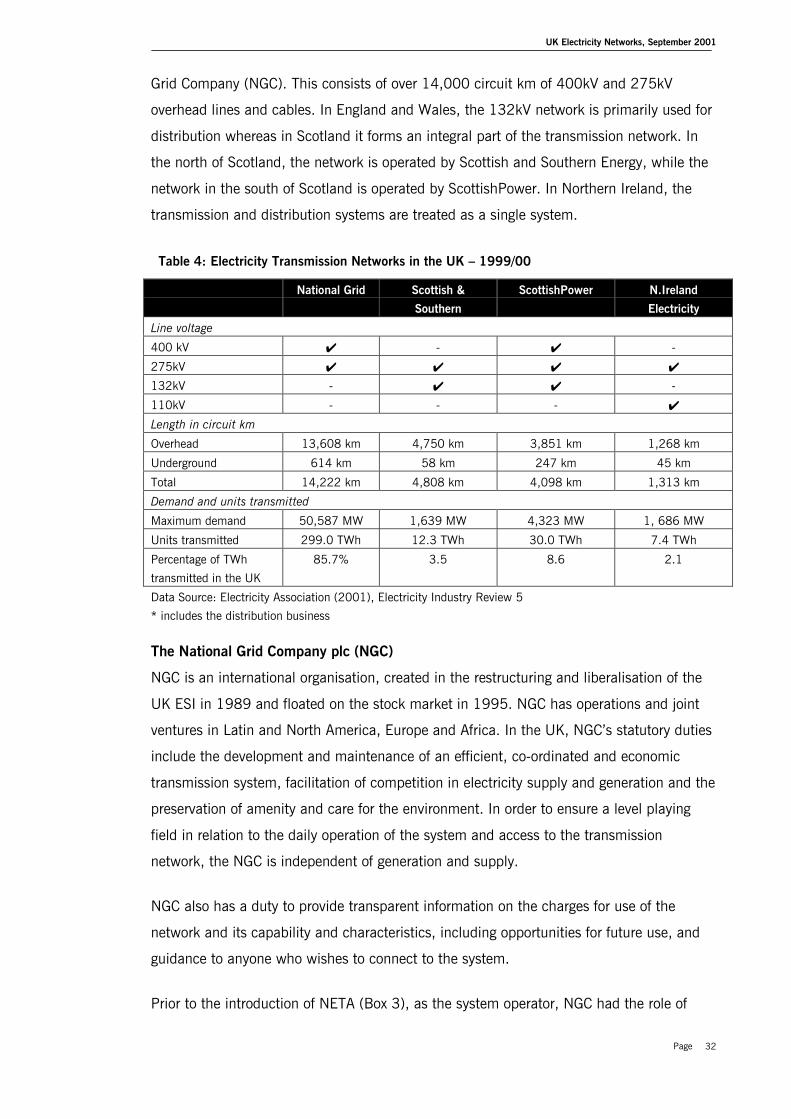
UK Electricity Networks, September 2001
Page 32
Grid Company (NGC). This consists of over 14,000 circuit km of 400kV and 275kV
overhead lines and cables. In England and Wales, the 132kV network is primarily used for
distribution whereas in Scotland it forms an integral part of the transmission network. In
the north of Scotland, the network is operated by Scottish and Southern Energy, while the
network in the south of Scotland is operated by ScottishPower. In Northern Ireland, the
transmission and distribution systems are treated as a single system.
Table 4: Electricity Transmission Networks in the UK – 1999/00
National Grid Scottish &
Southern
ScottishPower N.Ireland
Electricity
Line voltage
400 kV ✔ - ✔ -
275kV ✔ ✔ ✔ ✔
132kV - ✔ ✔ -
110kV - - - ✔
Length in circuit km
Overhead 13,608 km 4,750 km 3,851 km 1,268 km
Underground 614 km 58 km 247 km 45 km
Total 14,222 km 4,808 km 4,098 km 1,313 km
Demand and units transmitted
Maximum demand 50,587 MW 1,639 MW 4,323 MW 1, 686 MW
Units transmitted 299.0 TWh 12.3 TWh 30.0 TWh 7.4 TWh
Percentage of TWh
transmitted in the UK
85.7% 3.5 8.6 2.1
Data Source: Electricity Association (2001), Electricity Industry Review 5
* includes the distribution business
The National Grid Company plc (NGC)
NGC is an international organisation, created in the restructuring and liberalisation of the
UK ESI in 1989 and floated on the stock market in 1995. NGC has operations and joint
ventures in Latin and North America, Europe and Africa. In the UK, NGC’s statutory duties
include the development and maintenance of an efficient, co-ordinated and economic
transmission system, facilitation of competition in electricity supply and generation and the
preservation of amenity and care for the environment. In order to ensure a level playing
field in relation to the daily operation of the system and access to the transmission
network, the NGC is independent of generation and supply.
NGC also has a duty to provide transparent information on the charges for use of the
network and its capability and characteristics, including opportunities for future use, and
guidance to anyone who wishes to connect to the system.
Prior to the introduction of NETA (Box 3), as the system operator, NGC had the role of
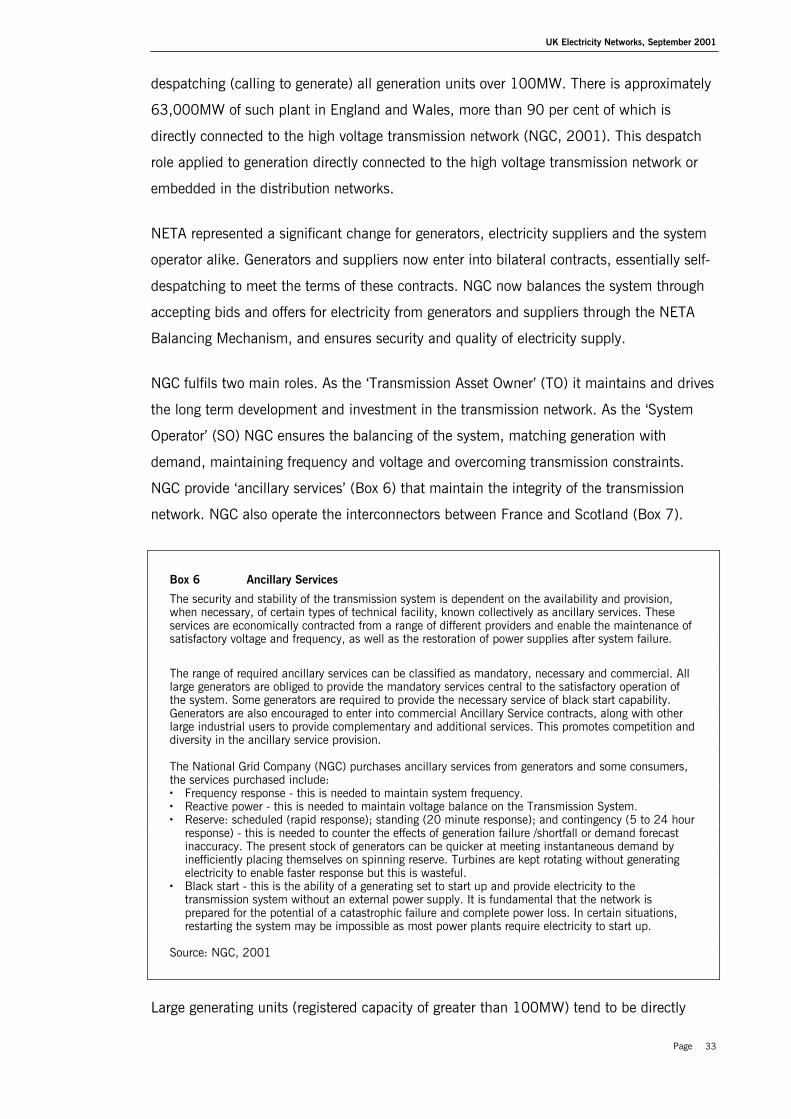
UK Electricity Networks, September 2001
Page 33
despatching (calling to generate) all generation units over 100MW. There is approximately
63,000MW of such plant in England and Wales, more than 90 per cent of which is
directly connected to the high voltage transmission network (NGC, 2001). This despatch
role applied to generation directly connected to the high voltage transmission network or
embedded in the distribution networks.
NETA represented a significant change for generators, electricity suppliers and the system
operator alike. Generators and suppliers now enter into bilateral contracts, essentially self-
despatching to meet the terms of these contracts. NGC now balances the system through
accepting bids and offers for electricity from generators and suppliers through the NETA
Balancing Mechanism, and ensures security and quality of electricity supply.
NGC fulfils two main roles. As the ‘Transmission Asset Owner’ (TO) it maintains and drives
the long term development and investment in the transmission network. As the ‘System
Operator’ (SO) NGC ensures the balancing of the system, matching generation with
demand, maintaining frequency and voltage and overcoming transmission constraints.
NGC provide ‘ancillary services’ (Box 6) that maintain the integrity of the transmission
network. NGC also operate the interconnectors between France and Scotland (Box 7).
Box 6 Ancillary Services
The security and stability of the transmission system is dependent on the availability and provision,when necessary, of certain types of technical facility, known collectively as ancillary services. Theseservices are economically contracted from a range of different providers and enable the maintenance ofsatisfactory voltage and frequency, as well as the restoration of power supplies after system failure.
The range of required ancillary services can be classified as mandatory, necessary and commercial. Alllarge generators are obliged to provide the mandatory services central to the satisfactory operation ofthe system. Some generators are required to provide the necessary service of black start capability.Generators are also encouraged to enter into commercial Ancillary Service contracts, along with otherlarge industrial users to provide complementary and additional services. This promotes competition anddiversity in the ancillary service provision.
The National Grid Company (NGC) purchases ancillary services from generators and some consumers,the services purchased include:• Frequency response - this is needed to maintain system frequency.• Reactive power - this is needed to maintain voltage balance on the Transmission System.• Reserve: scheduled (rapid response); standing (20 minute response); and contingency (5 to 24 hour
response) - this is needed to counter the effects of generation failure /shortfall or demand forecastinaccuracy. The present stock of generators can be quicker at meeting instantaneous demand byinefficiently placing themselves on spinning reserve. Turbines are kept rotating without generatingelectricity to enable faster response but this is wasteful.
• Black start - this is the ability of a generating set to start up and provide electricity to thetransmission system without an external power supply. It is fundamental that the network isprepared for the potential of a catastrophic failure and complete power loss. In certain situations,restarting the system may be impossible as most power plants require electricity to start up.
Source: NGC, 2001
Large generating units (registered capacity of greater than 100MW) tend to be directly
UK Electricity Networks, September 2001
Page 34
connected to the 400/275kV transmission system operated by the NGC, although some
are embedded within the lower voltage distribution networks. Medium (50MW–100MW)
and small (less than 50MW) generating units are currently all embedded within the
distribution networks. Embedded generation with capacity greater than 5MW is estimated
at a total of 4872 MW for 2000/01, contributing approximately 6.5% of total UK
electricity generation (NGC SYS, 2001).
Interconnection
Overhead lines connect England and Wales to Scotland with a nominal import capability of
1200MW (2001/02). A High Voltage Direct Current (HVDC) link with Electricité de France
(EdF), connects into the UK network at Sellindge in Kent with an import capability of
1976MW. A further 4MW of interconnection capacity is proposed (Box 7), which would
bring total capacity of existing and proposed interconnection links to approximately
6000MW - the equivalent to 8% of current UK generation capacity.
Box 7 Transmission Interconnection
Scotland - England and Wales interconnectorOverhead lines connect England and Wales with Scotland at 132kV, 275kV and 400kV with a nominalcapacity of 1200MW. The average level of transfers into England and Wales is approximately 10.5TWhper annum and availability has exceeded 95% for the last three years (NGC, 2001). The Anglo-ScottishInterconnector is jointly owned by National Grid, Scottish Power and Scottish and Southern Energy. It isin the process of being upgraded to 2200MW to coincide with the completion of the second Yorkshireline.
France - England and Wales interconnectorA High Voltage Direct Current (HVDC) link with Electricité de France (EdF), connects into the 400kVsystem at Sellindge in Kent with an import capability of 1976MW and has been in operation since1986. Ownership of the link is shared between National Grid and Réseau de Transport d'Electricité(RTE). The interconnector is approximately 70km in length with 45km of subsea cable. The averagelevel of transfers into England an Wales is approximately 15TWh per annum and availability hasexceeded 97% for the last three years (NGC, 2001)
Other proposed interconnectionsIn 2001, NGC signed a Joint Development Agreement with Statnett, the Norwegian grid operator, forthe development of an £400m-£500m interconnection project between the east coast of England andthe south-west coast of Norway (Financial Times, 21 May 2001). This North Sea Interconnector (NSI)will have a nominal capacity around 1200MW, and at 450 mile long is to be the longest DC subseacable in the world. Subject to consents, approvals and commitments to capacity, NGC aim to beginconstruction in 2002 with completion envisaged by 2005/06.
A feasibility study of a 1,000MW nominal capacity subsea interconnector between England and theNetherlands has recently been concluded. Subject to consents, approvals and commitments tocapacity, NGC aim to begin construction in 2003 with completion envisaged by 2005.
A study of the feasibility of a 500MW subsea interconnector between Wales and Ireland has also beenundertaken, commencing in December 1999. This report is expected to conclude on the technical andcommercial viability of the project in late 2001.
Funding for the feasibility stages of these projects was obtained from the European Commission underthe Trans-European Networks (TENS) programme.
Primary Source: Personal Communication with NGC, 2001
UK Electricity Networks, September 2001
Page 35
Transmission Network Access
NGC is required to provide open access to the transmission network, although such a
simple acknowledgement masks a number of technical requirements. Open access refers
to allowing any generator to connect to, and any distributor to draw electricity from the
transmission network. All distributors and generators seeking connection to the
transmission system must meet appropriate technical standards classified in ‘The Grid
Code’. The ‘Grid Code’ addresses planning requirements, connection conditions,
operational liaison and safety co-ordination, and is designed to ensure that technical
difficulties are not caused for others already connected to the system. The terms for access
are non-discriminatory, access being only deniable in clearly defined circumstances, such
as those related to safety.
NGC must also facilitate access to the transmission system, statutory licence duties
requiring that all requests for connection be responded to within three months. This three
month period is used by the NGC to assess and investigate the design, planning, legal and
economic aspects of the connection request. Should NGC respond with an offer of
connection, the connection applicant has a further three month period to accept.
The provision of information to potential applicants for grid connection is an important
aspect of introducing greater transparency into the ESI. NGC produces an extensive annual
Seven Year Statement (SYS). The SYS includes information on demand, generation, spare
capacity, the characteristics of the existing and planned transmission system, and its
expected performance. The SYS is produced to enable NGC “customers to evaluate
opportunities for making new and/or further use of the transmission system” (NGC SYS,
2001).
For embedded generating units larger than 100MW, NGC is required to offer terms for the
use of the transmission network within 28 days. Should network reinforcement work be
necessary to accommodate such a generator, NGC must state when the network will be
ready and set out the appropriate use of system charges.
NGC tends not to levy charges for embedded generating units smaller than 100MW. This
removes the requirement for connection and use of system agreements. However, NGC has
expressed in the past its eagerness to be provided with information concerning any such
embedded generators, concerned that such plant may have a material impact on the
transmission system.
UK Electricity Networks, September 2001
Page 36
Transmission Network Charges
NGC levies three types of transmission charge to cover the investment, maintenance and
operational costs of the transmission network: connection charges, transmission network
use of system charges and balancing use of system charges (Box 8).
Connection charges are designed to reflect the cost of installing and maintaining the assets
required for the connection of a generator or demand customers directly to the network.
Transmission network use of system charges cover the regulated cost of the transmission
network infrastructure assets and their maintenance and are shared between all
transmission customers who use the system. Balancing use of system charges cover the
costs of NGC incurred in its role as ‘System Operator’ in balancing the system and include
the costs of ancillary services.
Box 8 Transmission Network Charges
Connection chargesTransmission connection charges are ‘shallow’, that is, they cover only those assets at or very near theconnection site.
Customers may vary the design of their connections (subject to safeguards), choose whether they incurNational Grid's regulated rate of return or some other form of financing, and can choose whether toarrange for the construction of these assets themselves or whether National Grid makes thesearrangements.
Generators who connect to the distribution networks do not incur transmission connection charges butpay distribution connection charges to their host distribution company. Such generators may be ofbenefit to the host distribution company, reducing the demand on the transmission system, avoidingthe need to reinforce grid supply points and hence reducing the transmission charges levied.
Transmission Network Use of System (TNUoS) chargesTNUoS charges are shared between all transmission customers who use the system in that year and aredesigned to reflect the marginal cost of reinforcement to meet increasing imports or exports from eacharea of the country.
Generators larger than 100MW incur payments to NGC in areas where reinforcements will be requiredto accommodate increased exports. Generators may receive payments from NGC in those areas of thecountry where generation offsets the need for transmission investment. Generators below 100MW arenot subject to these charges. But, smaller generators may reduce the liability of electricity suppliers topay the TNUoS demand charge. Thus, embedded generators may receive an ‘embedded benefit’ in allareas of the country. This benefit tends to be more significant in those areas where generation ordemand reduction offsets the need for transmission investment.
Balancing Services Use of System (BSUoS) chargesBSUoS charges are levied on generators and electricity suppliers participating in the national electricitymarket. Generators larger than 100MW are required to participate in the national electricity market.Smaller generators have a choice to do so and have additional options available to them, allowing themto participate in the national market without incurring transmission charges. Small generators often aidelectricity suppliers to avoid BSUoS charges and may be able to negotiate an embedded benefit.
Connection and Use of System CodeOfgem and the DTI have noted that new transmission access, pricing and losses arrangements arenecessary to complement NETA reforms and to ensure that the full benefits of NETA are fully realisedby customers. This new Connection and Use of System Code (CUSC) was recently announced by theSecretary of State for Trade and Industry to come into force on 18 July 2001 (DTI Press Release,2001). The CUSC provides flexible governance arrangements that are intended to allow for theintroduction of new transmission access arrangements.
Primary Source: NGC SYS, 2001
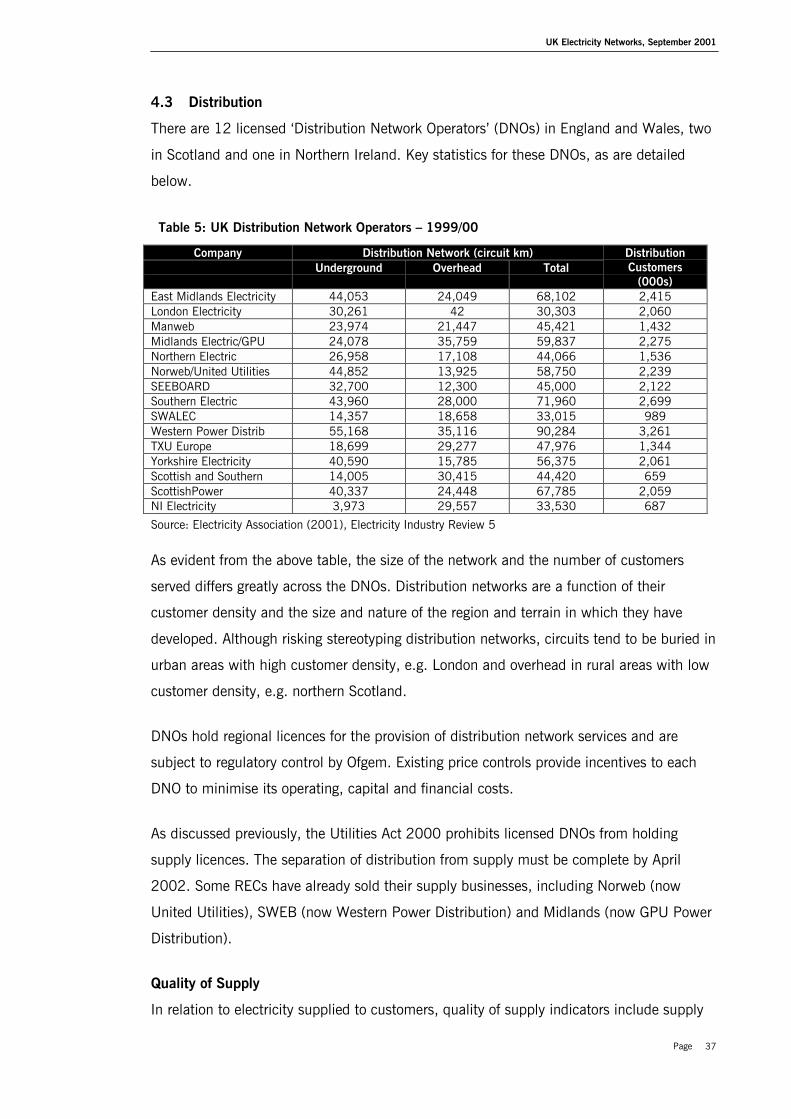
UK Electricity Networks, September 2001
Page 37
4.3 Distribution
There are 12 licensed ‘Distribution Network Operators’ (DNOs) in England and Wales, two
in Scotland and one in Northern Ireland. Key statistics for these DNOs, as are detailed
below.
Table 5: UK Distribution Network Operators – 1999/00
Company Distribution Network (circuit km)Underground Overhead Total
DistributionCustomers
(000s)East Midlands Electricity 44,053 24,049 68,102 2,415London Electricity 30,261 42 30,303 2,060Manweb 23,974 21,447 45,421 1,432Midlands Electric/GPU 24,078 35,759 59,837 2,275Northern Electric 26,958 17,108 44,066 1,536Norweb/United Utilities 44,852 13,925 58,750 2,239SEEBOARD 32,700 12,300 45,000 2,122Southern Electric 43,960 28,000 71,960 2,699SWALEC 14,357 18,658 33,015 989Western Power Distrib 55,168 35,116 90,284 3,261TXU Europe 18,699 29,277 47,976 1,344Yorkshire Electricity 40,590 15,785 56,375 2,061Scottish and Southern 14,005 30,415 44,420 659ScottishPower 40,337 24,448 67,785 2,059NI Electricity 3,973 29,557 33,530 687
Source: Electricity Association (2001), Electricity Industry Review 5
As evident from the above table, the size of the network and the number of customers
served differs greatly across the DNOs. Distribution networks are a function of their
customer density and the size and nature of the region and terrain in which they have
developed. Although risking stereotyping distribution networks, circuits tend to be buried in
urban areas with high customer density, e.g. London and overhead in rural areas with low
customer density, e.g. northern Scotland.
DNOs hold regional licences for the provision of distribution network services and are
subject to regulatory control by Ofgem. Existing price controls provide incentives to each
DNO to minimise its operating, capital and financial costs.
As discussed previously, the Utilities Act 2000 prohibits licensed DNOs from holding
supply licences. The separation of distribution from supply must be complete by April
2002. Some RECs have already sold their supply businesses, including Norweb (now
United Utilities), SWEB (now Western Power Distribution) and Midlands (now GPU Power
Distribution).
Quality of Supply
In relation to electricity supplied to customers, quality of supply indicators include supply
UK Electricity Networks, September 2001
Page 38
availability, minutes lost per customer (e.g. power cuts), security of supply, and supply
interruptions per 100 customers. The design of the network – a function of population
density and geography – and network operation and maintenance are key controllers of the
quality of electricity supplied.
It is widely agreed that increased spend by DNOs on network reinforcement and
replacement, improved overhead line repair methods, and the development of computer
controlled network management systems have improved distribution reliability and
availability of supplies during the 1990s (Electricity Association, 2001).
Performance Standards
Ofgem set overall standards of performance to provide additional incentives to DNOs to
maintain availability and quality of supplies to individual customers. DNOs must pay
certain penalties to customers related to restoring supplies after faults (within 18 hours of
fault notification), giving notice of planned interruptions (5 days notice required) and
investigation of voltage complaints (within 7 days). Three additional overall standards are
monitored on the basis of predetermined minimum levels of service. Performance
standards for the restoration of supplies within 18 hours and the correction of voltage
faults within six months are set at 100%. The standard for the restoration of supplies
within three hours is set at between 85% and 95% for different DNOs, primarily
dependent on geographical access constraints.
The Utilities Act 2000 allows Ofgem to apply performance standards to all electricity
suppliers and distributors. A new suite of standards has been designed by Ofgem to
accommodate the separation of supply and distribution businesses of the RECs. These
standards apply to all licensed DNOs and relate to the following:
• Restoration of supply following a fault
• Responding to failure of a supplier’s fuse
• Notification of planned interruptions
• Investigation and correction of voltage complaints
• Estimation of charges for connections or moving a meter
• Connection of premises to the distribution network
• Responding to customer correspondence and enquires’ and making and keeping of
appointments
Distribution Network Connections
Customer Connections - The concept of a Public Electricity Supplier (PES) was removed in
April 2001. The duty to supply all customers within a defined geographic area has been
UK Electricity Networks, September 2001
Page 39
replaced by a statutory duty on the licensed DNOs to connect and to maintain the
connection. In order to ensure that there is at least one DNO who is under a duty to
connect, geographic responsibilities along the lines of the existing areas have been
attached.
Supplier/Generator Connections - Statutory duties have been placed on DNOs similar to
those placed on the transmission network operator (NGC), requiring them to facilitate
competition in generation and supply, to develop and maintain an efficient, co-ordinated
and economic system of distribution and to be non-discriminatory in all practices. Ofgem
intend for this duty to focus DNOs on the need for fair access to distribution networks for
embedded generation (Ofgem, 2001).
Distribution Network Charges
When establishing distribution network charges in 1989, the assumption was made that
all electricity flows would be from the ‘Grid Supply Points’ to the customers. DNOs are
provided with a revenue stream from demand customers via ‘Distribution Use of System
Charges’ (DUoS) that cover the ongoing provision of the distribution network and factor the
costs of connection over the long term. Charges were established in order to cover the
costs of the price-regulated distribution activity (EGWG, 2001).
‘Embedded’ generation refers to generating capacity connected directly to the distribution
networks. Although not always the case, it tends to be small-scale renewable or CHP
plant. Embedded generators are not subject to DUoS charges, and therefore do not provide
DNOs with constant revenue streams. The DNO response is to charge embedded
generators the full cost of connection, despite a number of potential benefits that they may
provide (see below). These ‘deep’ connection charges include all the associated costs of
connection, including the protection of voltage control and the costs of equipment that
may be required due to changes in fault level (Box 6). Such ‘deep’ connection charges can
be considerable and can be a disincentive to embedded generation. Embedded generation
is discussed in more detail in Chapter 5.
4.4 Benefits of an interconnected transmission and distribution system
As outlined in Figure 4, until the 1930s, largely isolated private and municipally owned
utilities were responsible for electricity supply in England and Wales. The Electricity
(Supply) Act 1926 sought to resolve the wasteful duplication of resources. Particular
concern was given to each isolated authority installing enough generating plant to cover
the breakdown and maintenance of its generation. To provide some idea of the size of the
interconnected electricity network, the UK Electricity Transmission System is shown in

UK Electricity Networks, September 2001
Page 40
Figure 5 with significant generation plant included.
Interconnecting the separate distribution networks and utilities via a high voltage
transmission system pooled both generation and demand. An interconnected transmission
system also allowed for maintaining the quality of supply, e.g. frequency and voltage
variations, across the system and offered economic and other benefits summarised below
and detailed in Annex Seven:
Bulk power transfers
An interconnected transmission and distribution network allows for the bulk transmission
of power from generation to demand centres. Many factors impact on the decision to
construct a power station at a particular location including fuel availability, fuel transport
costs, cooling water, land availability and network connection charges. Large generating
units often have difficulty in gaining planning permission for location near to centres of
demand due to environmental and social impact concerns. Certain renewable energy
generation technologies such as wind or wave tend by their nature to be remotely located
from centres of demand.
Figure 6 shows current average bulk power transfers in the UK, demonstarting the
transmission of excess generation in the north and the midlands to the south.
Economic Operation
The interconnected transmission system provides the main national electrical link between
all participants (generation and demand). Connecting together all participants across the
transmission system makes it feasible to select the cheapest generation available in the
system - taking into account transmission losses and transmission capacity limits -
irrespective of the location of the plant.
Customer security of supply
Customer security of supply refers to providing the customer with a continuous and
uninterrupted electricity supply of the required quantity and of defined quality. This
requires electricity networks to be adequately robust to maintain supplies should
generation, transmission and/or distribution fail across varied demand patterns.
Interconnected transmission and distribution networks allow exploitation of the diversity
between individual generation sources and demand to maintain security of supply.

UK Electricity Networks, September 2001
Page 41
Figure 5: UK Electricity Transmission Network – April 1999
Source: The Electricity Association, http://www.electricity.org.uk/about_fr.html
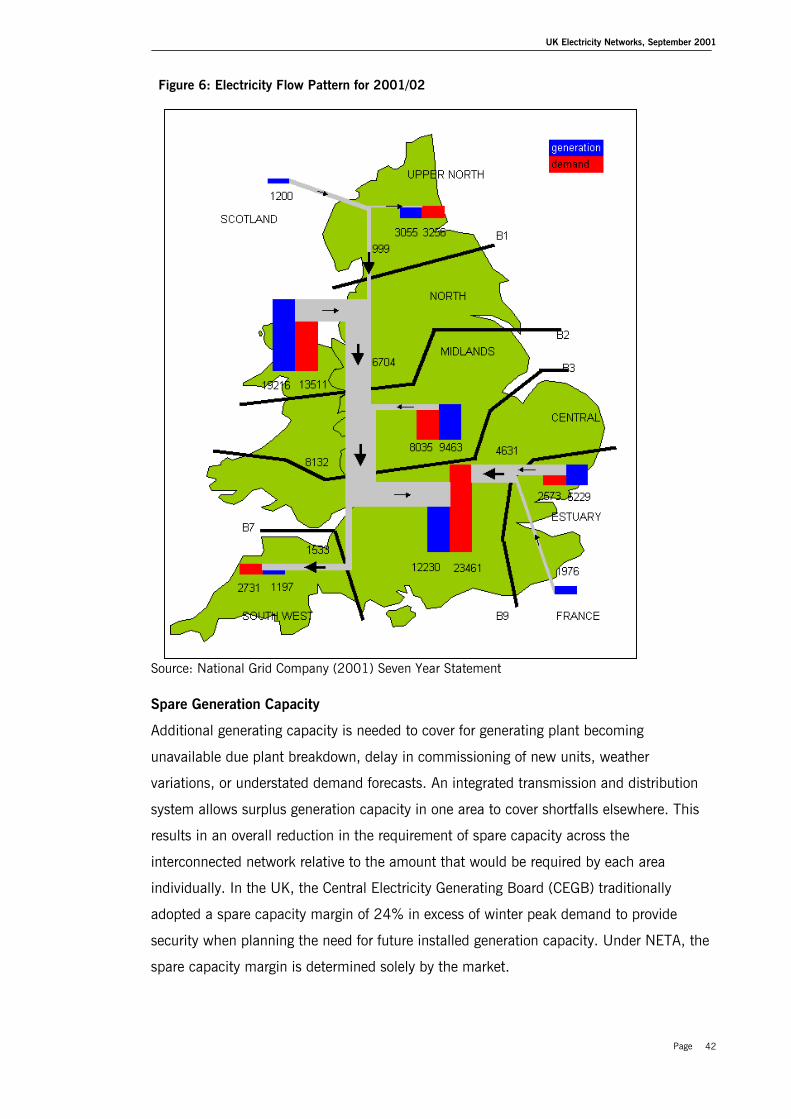
UK Electricity Networks, September 2001
Page 42
Figure 6: Electricity Flow Pattern for 2001/02
Source: National Grid Company (2001) Seven Year Statement
Spare Generation Capacity
Additional generating capacity is needed to cover for generating plant becoming
unavailable due plant breakdown, delay in commissioning of new units, weather
variations, or understated demand forecasts. An integrated transmission and distribution
system allows surplus generation capacity in one area to cover shortfalls elsewhere. This
results in an overall reduction in the requirement of spare capacity across the
interconnected network relative to the amount that would be required by each area
individually. In the UK, the Central Electricity Generating Board (CEGB) traditionally
adopted a spare capacity margin of 24% in excess of winter peak demand to provide
security when planning the need for future installed generation capacity. Under NETA, the
spare capacity margin is determined solely by the market.

UK Electricity Networks, September 2001
Page 43
Reduction in Frequency Response
System frequency varies continuously and is determined and controlled by a careful
balance between demand and generation. If system demand is greater than system
generation, frequency will fall. If generation is greater than demand, frequency rises. To
avoid an unacceptable fall (Box 9) in frequency should generating plant fail, additional
generation, electricity storage or reductions in demand need to be available that can be
called upon at very short notice (Box 6 - Ancillary Services). This is referred to as
‘frequency response’. Without an interconnected transmission system, each separate
system would be required to carry its own frequency response. Interconnection allows the
frequency response requirement to be established to cover the highest of the individual
system requirements rather than to cover for the sum of them all.
Maintaining the benefits of an interconnected electricity network
Although an interconnected electricity network can provide a number of potential benefits
(see above) maintaining these benefits requires a number of technical and administrative
responses (Box 9). The implications of increasing embedded and renewable generation on
maintaining these benefits are discussed in Chapter 6.
Box 9 Maintaining the benefits of an interconnected electricity network
Quality of Supply – Frequency and VoltageAn important factor in planning and operating the transmission and distribution networks is the need toensure that the quality of electricity supply (frequency and voltage) is maintained within specifiedstandards. In the UK, the Electricity Supply Regulations 1989 and the Grid Code specify that thefrequency delivered to the consumer must not vary from the declared value by more than ±1%.Voltages below 132 kV must not vary by more than ±6% whereas voltages higher than 132 kV mustnot vary by more than ±10% (NGC SYS, 2001).
Frequency levels are sustained, all things being equal, by ensuring that generation is always in balancewith demand plus losses in the transmission system. Reserve generation is held by the system operator,available instantly to cover against plant losses and/or surges in demand.
Voltage is affected by the nature of the network through which the electricity is transmitted. Its length,the level of electricity flow and demand (NGC SYS, 2001).
Two electrical characteristics of the transmission network are ‘capacitance’ and ‘inductance’. They haveopposite effects on the voltage, causing a rise or fall respectively, as electricity flows through thenetwork. At low flow, the voltage along a transmission line rises from the sending to the receiving end.At high flow, the voltage will fall. The longer the transmission line, the greater the effect on voltage. Atthe 'natural loading' of the line, the inductive and capacitive effects cancel out and the voltage remainsconstant along the line.
Reactive CompensationVoltage variations at the receiving end of transmission lines are corrected by special voltagecompensation plant. This is known as reactive compensation. Capacitive reactive compensationincreases the voltage level and is used for heavily loaded overhead lines. Inductive reactivecompensation reduces the voltage level and is used for lightly loaded cables.
Reactive compensation plant need not be utilised at all the times. Reactive compensation units areoften connected to the system in a floating mode, responding automatically or being switched in or outas changing system conditions dictate.
(continued over…)
UK Electricity Networks, September 2001
Page 44
Box 9 Maintaining the benefits of an interconnected electricity network (continued from previous)
Transmission system capabilityIn the UK, the ratios of generating capacity and demand vary in different areas across the country,traditionally the electricity flowing from North to South. From 1938, the transmission system hasenabled generation surpluses in one part of the country to supply demand in other parts of the country.In assessing the ability of the system to achieve this, it is split into primarily importing or predominantlyexporting areas. Connecting circuits linking such areas tend to represent the weakest links in thetransmission system and thus indicate the ability of the system to accept bulk power transfers.
System lossesElectricity flow across the transmission system causes transmission power losses, primarily due to theheating of transmission lines, cables and transformers. Other losses include the unavoidable lossesassociated with overhead lines and transformers. These include fixed losses on overhead transmissionlines, referred to as corona losses, which are a function of voltage levels and weather conditions. Fixedlosses in a transformer are iron losses that vary with the frequency of the electricity flow.
Location of Generation and Impact on Transmission Network ReinforcementThe transmission system is planned to meet the Licence Standard that specifies that the transmissioncapability of any part of the system should exceed the maximum required flow. If the forecast maximumrequired flow exceeds the transmission capability, that part of the transmission network must bereinforced.
Maximum electricity flow in any part of the system is a function of the generation and demand in thatpart. The greater the difference between generation and demand, the greater the flow. The choice ofsite of new generating plant can therefore directly influence the need for major transmissionreinforcements. For example, should a new generating plant be located in an area where generationexceeds demand (export area), the maximum electricity flow will increase. This increase in flow mayexceed the transmission capacity of the existing system and give rise to the requirement fortransmission reinforcement.
Locating new generating plant in an area where demand exceeds generation (import area) may bebeneficial to the transmission system in relation to both security of supply and voltage control. Allthings being equal, it will reduce the flow over the transmission system, the associated need foradditional reactive compensation, transmission losses, and the possible need for transmission systemreinforcement.
In the UK, there is a large net flow from north to south. Locating new generating stations in the southwould therefore appear to be beneficial to the transmission network.
Primary Source: NGC SYS, 2001
4.5 Discussion
Focussing on the rationale and motivations for the development of the interconnected
electricity networks allows for interesting comparisons with the current decisions faced by
the ESI. After the Second World War, expansion and interconnection appears to have been
as much driven by social objectives of providing electricity for all as potential economic
benefits. Such a situation is analogous with the desire to meet environmental objectives
associated with the energy policy debate today.
The role of the transmission network operator has been amended considerably since
1989. From directly calling on generators to ensure that demand is met, NGC now
provides the link between generators and suppliers by administering the NETA markets,
balancing generation and demand, providing national security and quality of supply, and
maintaining network integrity. In this way, as renewable energy sources expand

UK Electricity Networks, September 2001
Page 45
(particularly larger scale remote renewables such as offshore wind), NGC’s operation of the
largest transmission network in the UK will remain significant (see Chapter 5).
Similarly distribution networks are critical to the expansion of embedded generation
technologies. Although the size and nature of DNOs differ, access and charging principles
remain the same. Quality of supply concerns are central to their operation. The Utilities Act
2000 has separated distribution and supply functions and charged DNOs to facilitate
competition in generation and supply. Current access and charging arrangements for
distribution networks appear to discourage embedded generation and require adaptation to
fully meet the requirements of the Act.
It is important to recognise that a number of benefits are provided by an interconnected
transmission and distribution network. These include providing bulk power transfers,
ensuring utilisation of economic plant, providing cost effective spare capacity and
maintaining quality of supply. However, these benefits are delivered through a series of
technical and operational arrangements, many of which could be provided by embedded
generation, given the opportunity.
The following chapter details and analyses embedded and intermittent generation
technologies, highlighting associated implications for the operation of and interfaces
between transmission and distribution networks.
UK Electricity Networks, September 2001
Page 46
5 Embedded and Intermittent Generation
Electricity systems have developed during the last century as represented in Figure 1. In
essence, large central generating units feed into an interconnected high voltage
transmission network. Electricity is transferred through this transmission system to feed
lower voltage area distribution networks which deliver electricity to individual industrial
and domestic customers.
Due to the policy, economic, technical and environmental trends indicated in Chapter 1,
interest in connecting generation to distribution networks rather than transmission
networks has increased over the last 10 years. New terminology has been developed to
reflect this increased interest, namely ‘embedded’ and ‘dispersed’ generation.
This chapter defines embedded generation and details the drivers for expansion, and the
technical implications of their increased contribution to UK electricity supply. The
intermittent nature of certain generating technologies, particularly wind, will be analysed
alongside implications for the operation of electricity networks.
Embedded and renewable generating technologies will be detailed and assessed, again the
focus being the impacts of their generation characteristics on electricity networks. The
chapter will close by analysing electricity storage technologies and applications, a potential
support to embedded and intermittent renewable generation.
5.1 Embedded Generation
‘Embedded’ generation refers to generation connected to the distribution network rather
than the transmission network. It is important to note that, as discussed previously,
embedded generation is far from a new concept, having “been a feature of the electricity
industry since it began more than a century ago” (EGWG, 2001). There is no universal
definition of what constitutes embedded generation nor how it differs from conventional
central generation. However, common attributes have been identified as (Jenkins et al,
2000):
• Not centrally planned
• Not centrally despatched
• Normally smaller than 50 to 100 MW
• Usually connected to the distribution system
Embedded generation technologies are either small in scale or can be produced
UK Electricity Networks, September 2001
Page 47
economically in a range of sizes (ETSU, 2001). Such technologies are well matched to
generating electricity where it is needed, therefore lending themselves to being embedded
in the electricity distribution networks.
Drivers for the Expansion of Embedded Generation
The International Conference on Electricity Distribution Networks (CIRED) 1999 sought
the views of representatives from 17 countries as to the policy drivers that encouraged the
development of embedded generation. These drivers included:
• Reduction in gaseous emissions from electricity generation (mainly CO2)
• Energy efficiency and rational use of energy
• Deregulation of competition policy
• Diversification of energy sources
• National power requirements
Other motivations for embedded generation include:
• Improved technological performance of modular generating plant and control
technologies
• Increased difficulty – planning, public concerns, etc. – in locating large generating units
• Shorter construction times, lower capital costs, quicker payback periods of smaller units
• Location of generating plant nearer to the load thus reducing transmission charges
• Cultural drivers – political and cultural desires to develop low carbon energy
technologies
The development of new technologies such as modular CCGT, micro and mini CHP, fuel
cells and renewable energy, alongside the increasing awareness of the environmental
impact of power generation has resulted in increasing commercial interest in their
exploitation (ETSU, 2001).
Poor power quality and security of supply concerns, alongside the recognition of
environmental benefits, have driven the recent growth of embedded generation
technologies in the USA, e.g. California (Brooks and Butler, 2001). The principal drivers to
date in Europe have been concerns over the environment and increased awareness of the
newer technologies as market liberalisation progresses in the EU member states.
The DTI has stated that ensuring that the UK is in the forefront of the liberalisation of
electricity markets and the advancement of embedded plant is of potential profit to UK plc.
It will enhance industrial competitiveness and provide greater opportunities in overseas
markets (DTI, 2001). Such opportunities may relate to the application of new technologies
UK Electricity Networks, September 2001
Page 48
and the management of active distribution networks. With the move towards increased
liberalisation of world electricity markets, UK companies could be well placed to exploit
opportunities in establishing embedded generation projects and services.
A number of embedded generation technologies emit relatively low levels of CO2 compared
to large coal or gas fired plant. An increase in the contribution of such technologies to
overall electricity supply could assist the UK in meeting greenhouse gas emissions
reduction targets. The expansion of embedded generation can add to fuel diversity and UK
energy security. Diverse forms of generation may be developed, including renewable
technologies, such as wind, that are not reliant on imported sources of fuel.
Box 10 provides a case study of embedded generation in the Netherlands, highlighting a
number of policy considerations, discussed below and in Chapter 6.
Box 10 Embedded Generation Case Study – The Netherlands
One of the responses in the Netherlands to the oil crises of the 1970s was to structure the ESI toprovide incentives for the development of small-scale, decentralised generation. Local utilities withdense network infrastructures, built with of future capacity growth in mind.
A recent report produced by COGEN Europe looked at embedded generation in the Netherlands.Cogeneration has a 40% share of current installed capacity. A significant share of installed capacity istherefore decentralised. The Netherlands 1989 Electricity Act separated generation and distributionactivities. But, distribution companies were allowed to continue their activities in generation plant under25 MWe. This continued involvement of distributors has proved a key driver and motivation for them toaddress and resolve issues related to the increase in decentralised/embedded generation.
The Dutch experience has shown it is possible for decentralised generation to develop without majordifficulties, although strong political will to achieve this is a key element. The development of activedistribution networks was achieved through formulating adequate technical regulations and measuresthat did not entail prohibitive costs. A survey of Dutch utilities concluded that the main issues for thegrid in case of a growth of cogeneration capacity are not technical, rather organisational andcommercial/contractual (COGEN Europe, 2001).
Overview of Technical Implications of Embedded Generation
As discussed previously, distribution networks have been constructed to accept bulk power
transfers from the transmission system for distribution to customers. A significant increase
in embedded generation may result in a reversal of electricity flows, subject to generation
and demand levels at certain periods. This would require distribution networks to adapt
their passive nature to become ‘active’, having the ability to accept bi-directional electricity
flows. The major technical implications of increased embedded generation include (Jenkins
et al, 2000):
Network voltage changes
DNOs are required to supply customers at a voltage within specified standards (Box 9,
Chapter 4). This requirement has often determined the design of distribution networks,
UK Electricity Networks, September 2001
Page 49
and techniques to maximise the use of distribution circuits while maintaining voltage levels
have been developed over the years (Jenkins et al, 2000). Network voltage is in part
determined by the level of electricity flow, and embedded generation and subsequent
changes in electricity flows must be taken account of.
Network fault levels
Embedded generation increases the distribution network fault levels – the voltage that trips
the network. In urban areas, it is common for distribution networks to be operating near to
the existing fault level, therefore providing an obstacle to embedded generation (Jenkins et
al, 2000). Connected embedded generation may require upgrading of the distribution
network, an expensive undertaking currently borne by embedded generators under existing
charging principles in the UK.
Quality of Supply
Embedded generation can produce voltage variations on distribution networks, although
variations can be minimised through careful design of embedded plant and the correct
synchronisation of generators (Jenkins et al, 2000).
Protection
Embedded generation requires additional controls and monitoring to protect the generating
equipment itself, and to protect the distribution network from fault level currents and
issues associated with ‘islanded’ operation (see below).
Other technical issues related to embedded generation are assessed in more detail in
Chapter 6 and include:
• ‘Islanded’ operation - embedded generators operating disconnected from the distribution
network and supporting local supplies in the event of network failure
• Ancillary services – embedded generators providing reserve and frequency response
• Bulk power transfers - reduced electricity flows from the transmission to distribution
networks as a result of increased penetration of embedded generation development will
not necessarily result in a corresponding reduction in the bulk transfers
• Network modelling, management and control - need for network modelling to assess
the technical issues will arise in a decentralised network
• Net-metering and smart-metering - allowing customers to offset their electricity
consumption from distribution network by selling their own embedded generated
electricity to the network
• Domestic and micro-generation – ‘plug and play’ technologies
UK Electricity Networks, September 2001
Page 50
5.2 Intermittency
Several of the embedded and renewable energy technologies, e.g. wind and solar, raise
issues relating to the intermittent and variable nature of their output. This characteristic
suggests that electricity from such sources can not be guaranteed. But, intermittency
should not be confused with unpredictability, e.g. tidal electricity generation may be
intermittent but is very predictable.
The greater the contribution of intermittent generation sources to total supply, the greater
the effects of intermittency will be. However, a minority share of intermittent and variable
generation should not be a significant technical constraint (Anderson and Leach, 2001).
In providing evidence to the House of Lords Select Committee on ‘Electricity from
Renewables’ in 1999, NGC outlined the criteria that would likely trigger extra operational
costs, one of which was generation subject to fluctuating greater than 20% of peak system
demand. Using this criteria, 7,500MW of wind capacity could be accommodated within
the system (Millborrow, 2001). However, the overall output of wind generation rarely
changes enough to cause a problem for a system which must be able to cope with sudden
and substantial losses of power (Hartnell, 2000). Denmark is a country where wind
contributes significantly to total electricity supply and demonstrates the ability to accept
significant wind generation on electricity networks (Box 11).
Box 11 Intermittent Generation Case Study – Denmark
In Denmark, the capacity of installed wind generation is 2,380 MW, the overall contribution to totalelectricity generation being 13%. (James & James, 2001). The contribution of wind in certain districtsis as high as 80% (Hartnell, 2000). Accurate prediction systems for wind generation were identified asessential to allow electric utilities to plan for likely fossil-fuelled generation required. Prediction systemshave been developed using Danish Meteorological Institute data, and have proved sufficiently accurate(Hartnell, 2000).
Variation in the location of plant is another important factor. A large network of
geographically diverse wind turbines, e.g. 10 MW of capacity, would dramatically improve
the predictability and reliability of output. Estimates suggest that a separation of between
5km and 10km for two wind turbines is enough for their output to be treated as
independent (Grubb, 1991). However, some concerns remain as to the instances of totally
calm days affecting large areas of the UK
Intermittent and variable output must also be considered in relation to the role the
generation source is providing. Intermittent and variable generation sources may not be
best suited as base-load plant, contributing more to ancillary services, peak demand and

UK Electricity Networks, September 2001
Page 51
seasonal variations, e.g. higher demand for electricity in the winter when the wind speed
tends to be higher. Alternatively, the right mix and location of intermittent and variable
output, alongside appropriate aggregation, may provide opportunities for the provision of
base-load output. Certain renewable energy sources show a degree of inverse correlation
that may help flatten and ease the predictability of output, e.g. low winds on sunny days
and high winds on overcast days. By using combinations of different variable source,
hydro, storage and/or trade (interconnectors), there seems no technical reason why large
systems should not derive well over half their power from variable sources (Grubb, 1997).
At high levels of intermittent contribution to overall supply (perhaps over 20%), the effects
of intermittency will be more prominent. Back-up facilities and/or electricity storage have
been highlighted as potential technologically and economically necessary responses to
such effects (Anderson and Leach, 2001). But, although increased generation from
variable renewable sources may increase the value of storage and vice versa, storage is in
no sense the only answer (Grubb, 1997). Electricity storage is analysed in more detail in
Section 5.4.
5.3 Embedded Generation Technologies
Some conventional generating technologies can be used at a scale appropriate to
embedded and decentralised generation e.g. CCGT. But, a number of newer technologies
using a variety of fuel sources are beginning to enter the fray. Embedded generation plant
ranges from established technologies such as diesel generators to more recent technologies
such as fuel cells. It is necessary at this juncture to analyse the important embedded
generation technologies. “Understanding the interaction of embedded generation with the
power system requires an appreciation of the technology… … the characteristics of the
energy sources and… … the conditions in which the embedded generation plant is
operated” (Jenkins et al, 2000).
The output of embedded generators can be classified under two, not necessarily mutually
exclusive, categories. Certain embedded plant’s output is intended for use on-site and
tends to be in the form of combined heat and power. The other category of embedded
plant generates output for the supply of third parties and is often renewable in nature, e.g.
biomass or wind.
CHP and wind generation technologies are discussed in detail, a reflection of their likely
major contribution in the near term to Government targets. Characteristics of other
embedded and renewable technologies are overviewed in Box 12.
UK Electricity Networks, September 2001
Page 52
Combined Heat and Power (CHP)
CHP is the most significant form of embedded generation in the UK contributing 4,239
MW of electricity and 15,093 MW of thermal capacity from 1,313 sites in 1999 (Digest
of United Kingdom Energy Statistics, 2000). CHP is often referred to as cogeneration, a
reflection of the technology’s simultaneous production of electrical and heat energy. CHP
plant tends to be located on industrial sites. For example, in the UK, the chemical industry
has constructed CHP plant that generates 1,180MW of electricity and 5,970MW of heat.
The electricity produced is consumed by the host of the CHP plant, any surplus or deficit
sold to or purchased from the local DNO. The generated heat may be utilised for industrial
purposes on-site, for on-site space heating and/or linked to a local district-heating scheme.
CHP schemes are fuelled either exclusively or by a combination of gas, coal and bio-fuels
such a wood chip and sewage gas. CHP expansion has appeared to avoid the locational
bias evident in the previous geographical pattern of generation location. In England and
Wales, the installed capacity of CHP schemes has an approximate distribution of 53% in
the North and Midlands and 47% in the South (NGC SYS, 2001). Figure 6 indicates that
over 80% of total generation in England and Wales is located in the North and the
Midlands
The location of embedded CHP plant is defined by the location of the heat demand. CHP
schemes are conventionally designed to meet the electricity and heat requirements of the
host sites or defined district-heating scheme. That said, this convention is a commercial
choice rather than a necessity. Should policy and economic incentives allow, CHP plant is
capable of being designed to provide electricity and associated ancillary service to the
distribution and transmission networks to which they are connected.
CHP efficiencies reach as high as 80%, this high efficiency rating contributing to a
reduction in greenhouse gas emissions relative to traditional fossil-fuelled generating units.
The UK Government has set targets for at least 10,000MWe of CHP by 2010. The
potential for industrial, commercial, domestic and household CHP may be as high as
27,000MWe, more than 40% of UK supply (DETR, 1997)
Wind
The utilisation of wind energy is not new, documents suggesting that wind powered
irrigation schemes were common in China as far back as 2,000 years ago (Waugh, 1994).
However, it was not until the late 1970s that work began on the development of wind
power to contribute large amounts of electricity to the interconnected electricity networks.
Wind power, both on and offshore, is among the more developed and promising renewable

UK Electricity Networks, September 2001
Page 53
energy technologies and contributed 9% of UK’s renewable electricity generation in 1998
(Electricity Association, 2000). However, this still represents less than 0.2% of total
generation. ETSU have estimated that onshore and offshore wind could supply 150 TWh
of cost effective electricity (less than 4p/kWh) to UK electricity by 2010, over 40% of total
UK electricity consumption in 2000 (ETSU, 2001).
Expansion of the industry, from the first mass production of a wind turbine in Denmark in
May 1980, has been rapid. From 1993 to 2000, the market for wind turbines in Europe
grew by an average of 40% per annum, total worldwide installed capacity meeting the
equivalent of the electricity demands of 10.6 million households by January 2001 (James
& James, 2001).
Box 12 Embedded and Renewable Energy Technologies
Fuel CellsA fuel cell converts chemical energy in a fuel source directly to electrical energy. Although originallyinvented in 1839, fuel cell technology development has been slow, the main source of funding andresearch being the space industry. Multinational companies, including GE, Alstom and Siemens-Westinghouse are developing a variety of fuel cell technologies. Efficiencies can reach over 50%, twicethat of the equivalent internal combustion device (Hart et al, 2000). They are a clean technologyrelative to the emissions from traditional fossil fuel generation units. Potential fuel sources includednatural gas, biomass and hydrogen. They are modular by nature, outputs ranging from 5kW to 1MWper unit, being well suited to embedded and distributed generation. They allow generation to be locatednear to demand and can operate persistently at high capacities and efficiencies.
Renewable TechnologiesRenewable energy is derived from renewable sources, i.e. the use of which does not deplete theresource. Such sources include the sun, wind, rivers, waves, tides, heat from inside the earth and thesustainable growth of crops. In the UK, Government includes landfill gas and municipal and industrialwastes in its classification of renewable sources eligible for financial support. The location and potentialoutput of renewable electricity plant is primarily determined by the availability of the renewableresource, one of the most lucid examples being the choice of location for hydro-electric plant. Some ofthe key renewable energy technologies include:
Hydro-electric powerThis is the most widely utilised source of renewable electricity in the world, in 1998 contributing17.9% of the world's electricity generation and 2.3% of the world’s total energy supply (IEA, 2001).1.38% of UK electricity supply is generated from hydro-power, the majority of which is in Scotland(Digest of United Kingdom Energy Statistics, 2001).
Hydro electric schemes often involve the construction of large dams across valleys and the flooding ofvast areas of land, villages and towns. This has led to widespread criticism of such large schemes fromboth an environmental and social perspective, best highlighted by the ongoing debate concerning theIlisu dam project in Turkey. Lack of remaining suitable sites limits the potential in the UK. There mayremain some potential for the development of small-scale hydro projects and river run-off schemes withgenerating capacities under 5 MW.
SolarSolar photovoltaics (PVs) convert solar radiation into electricity. Costs remain high, but may fallalongside increased R & D, increased production and associated economies. Building integrated PVsystems, e.g. building facades and solar roofs, have been identified as a key commercial application ofPVs in the developed world (Hart et al, 2000).
ETSU have suggested that nearly 80% of the UK's energy needs could be met by PVs. Even on cloudydays, solar panels are capable of generating power. The cost of PVs dropped fivefold over the last 15years and is set to fall further once a mass market is established for it (TXU Europe, 2001). AlthoughUK solar programmes have traditionally been much smaller than other countries, some growth isanticipated from DTI's market incentives and reduced VAT. (continued over…)
UK Electricity Networks, September 2001
Page 54
Box 12 Embedded and Renewable Energy Technologies (continued from previous)
BiomassBiomass is biological matter such as trees, grasses and agricultural crops which can, primarily throughcombustion, be used as fuel for the production of energy. Biomass can also be used with coal inconventional power plant. Co-firing is the most economical near-term option for introducing newbiomass power generation, and lowers the air emissions from coal-fired plants (Hart et al, 2000). ETSUestimates the potential resource for energy crops and agricultural and forestry wastes is 20 TWh and15 TWh respectively by 2010. Energy crops have also been mooted as an area of great potential for thetroubled UK agricultural industry.
Wave and tidalThe UK is blessed with some of the largest wave and tidal power resources in the world. A recent reportby the House of Commons Select Committee acknowledged the high capital costs and need for furtherR & D and highlighted that energy from waves and tides was predictable and reliable.
MicropowerSome of the most radical developments in electricity generation technologies are in the area of heat andpower systems for hotels, offices, small businesses and homes (Fabian Society, 2001). Multinationalcompanies such as ABB, BG, BP Amoco, Shell, Turbec and Capstone are investing, researching anddeveloping fuel cells, solar photvoltaics and microturbines. Stirling engines are being developed forsmall-scale generation and domestic CHP systems. Capstone and BG are offering power plant down tothe 10 to 100 kW level (Hart et al, 2000).
5.4 Electricity Storage
The primary use of stored energy in the central energy supply system has been for load
levelling, managing the diurnal and seasonal variability of the electricity supply and
demand cycles (Yehia and Karkkainen, 1988). Decentralised storage systems may also
reduce losses, reduce the need for reinforcements of the transmission and distribution
system, and facilitate voltage control (Anderson and Leach, 2001). Available storage
technologies are detailed in Box 13.
Energy storage applications
Electricity storage can perform a number of functions from load levelling to postponement
of transmission system upgrades. Electricity storage applications of particular relevance to
this thesis are summarised below:
Reduction in transmission congestion
An essential element of network operation is to ensure that it is capable of transmitting
power from source to use. Bottlenecks may exist at specific points on the network at which
large generation sources and large demand areas are linked, and through which only a
certain amount of electricity can flow at any given time period (Gandy, 2000). Storage
closer to high demand areas, positioned beyond such a bottleneck and with comparatively
low cost may improve flexibility and efficiency of the network.
Reliability, predictability and flexibility
These are key elements for electricity generation. The generating characteristics of wind,
UK Electricity Networks, September 2001
Page 55
solar, wave and tidal tend to have few of these capabilities as detailed below:
• Wind - Gusty or calm days are inadequate for power production.
• Solar - Cloudy days and darkness at night result in a fall in output.
• Wave - Another power source dependent on changeable weather conditions.
• Tidal - Twice a day, turning of the tide leads to a reduced output.
Box 13 Electricity Storage Technologies
Pumped HydroUtilises the potential energy of a body of water at a relatively high elevation by linking of an upper andlower reservoir. Electrical energy is generated when the water is released to flow through turbines, theprocess continuously recycled when the water is pumped back up and recharges the upper reservoir.Pumped hydro storage is a mature technology characterised by long life and large capacity. The needfor suitable sites is a key feature and means further construction is unlikely in the UK.
RegenesysA new regenerative modular fuel cell technology developed by Innogy and encompassing an electro-chemical reaction involving two salt solutions (liquid electrolytes). The reversible process convertselectrical energy into chemical potential energy.
FlywheelsKinetic energy is stored in the rotational inertia of a spinning flywheel, electrical energy being generatedduring spin-down. Recent developments have involved using magnetic bearings and vacuumcontainment to minimise frictional losses and noise.
HydrogenThe visionary no emissions end point of the low carbon economy. Output from renewable andembedded generators may be used to create hydrogen for use in fuel cells as back up to the individualgenerator or for transportation through pipelines for central back-up and/or for transport demands.
BatteriesElectrochemical storage by creating electrically charged ions in cells, the chemical energy beingconverted back into electrical energy in direct current form.
Superconducting MagnetismDC current is circulated through a superconducting coil with energy stored in a magnetic field.
Compressed AirPower is used to compress air that is stored underground, commonly in a rock or salt cavern. The air isreleased either directly through a turbine to generate electricity or more efficiently into a combustionchamber with fuel, where it is ignited and expanded through a turbine.
CapacitorsOften used to store a relatively small amount of electrical energy in electronic circuitry. More high-powered capacitors have been developed increasing potential uses in power electronics.
Source: Aplin, Butler and Turner, 2001
Storage can be used to counteract the inherent intermittent nature of electricity generation
by renewable sources. Attachment of energy storage to renewable energy sources can
result in a more reliable, predictable and flexible supply
Store when cheap, sell when high
An issue with renewable energy is the current comparative expensive cost of generation.
Storage may be used to take advantage of price and cost differences by charging up with
surplus electricity at low cost times and discharging in peak cost periods. The process of

UK Electricity Networks, September 2001
Page 56
storing electricity when demand and costs are low and selling when the price of electricity
matches the cost of renewable sources of power could make projects more commercially
attractive.
However, storage could defer investment in new generation by allowing polluting power
stations to store electricity and sell when the price is high. Thus, energy storage may slow
the progression to high efficiency technology and renewable energy, as new power
generator construction is deferred.
Storage for combined heat and power systems (CHP)
CHP systems generate heat and power concurrently. Both may not necessarily be needed
at the same time and there may be periods whereby there is excess heat or power
production. Excess is a waste of valuable resources and impacts on the overall cost of
energy production.
Incorporating thermal and energy storage into CHP systems separates the generation and
utilisation of heat and power. This would have the impact of raising the energy service
efficiency of CHP to even greater levels. High efficiency storage systems should ultimately
lower the cost of supply.
5.5 Discussion
Although there is no clear definition of what constitutes embedded generation, a number of
key characteristics can be identified. These include connection to the distribution network,
low output capacities up to 100MW and lack of central planning. Some existing electricity
generating technologies can be scaled down to the embedded level. However, in line with
environmental and social policy objectives and trends, the newer technologies such as
small-scale gas fired CHP, fuel cells, micro-turbines and renewables are the focus of much
attention and research.
The inherent intermittent nature of many of the renewable technologies has been of great
concern. Many studies have focussed on wind technologies - seen as the most cost
effective renewable technology in the near to medium term (eg. Fabian Society, 2001).
The capabilities of the existing networks to accept intermittent wind generation, impacts of
diversity of location, and predicting outputs on the basis of meteorological data have all
been assessed. Outputs of these studies suggest that the UK networks are capable of
accepting up to at least 10% contribution to UK electricity supply from wind, all other
things being equal.

UK Electricity Networks, September 2001
Page 57
Integrating wind capacity beyond 10% appears to be dependent on a number of factors
including the array of technologies utilised, abilities to predict outputs from intermittent
sources, the progress of electricity storage technologies and the development of actively
managed transmission and distribution networks. As the number of different components
in the network increase, so does the need for more sophisticated control and monitoring at
the distribution level.
The next chapter identifies and analyses the key issues that will need to be addressed for
electricity transmission and distribution to support a greater proportion of intermittent
renewable and embedded electricity generation. The chapter will highlight and discuss the
role of government policy, the regulatory and commercial frameworks, and technical
requirements in moving to a ‘distributed energy future’.
UK Electricity Networks, September 2001
Page 58
6 Identification and Analysis of Key Issues
Chapters 2, 3 and 4 considered the historical development of the UK electricity supply
industry and the evolution of transmission and distribution networks. Chapter 5 examined
embedded and intermittent generation, electricity storage technologies, and discussed the
impacts of these technologies on existing transmission and distribution network operation.
Looking to the future, this chapter identifies and analyses the key issues that electricity
networks will need to address as a result of increased intermittent renewable and
embedded electricity generation. These issues were first identified in the literature review,
initial consultations (Annex One) and through the ‘Group Review’ held on 19 July 2001
(Annex Four). Further analysis and synthesis was then conducted.
A number of issues pertaining to the interactions between transmission and distribution
networks will arise as the contribution of embedded and intermittent renewables increase.
In the period to 2010 the current Government targets for renewables and CHP, if achieved
or approached, may result in excess of 20-25GW of total capacity connected to the
distribution networks. This level of capacity cannot be accommodated on the currently
configured networks without significant change. (ETSU, 2001)
It is therefore important that the impacts of increased embedded generation on
transmission and distribution networks in the UK are not viewed in isolation. Much of new
renewable energy and CHP plant needed to meet the Government's targets may be of small
capacity, and find it most cost-effective to connect to lower voltage distribution networks.
The trend towards having a larger proportion of embedded and renewable generation will
therefore have implications for the whole of the UK ESI, in particular the configuration and
operation of distribution and transmission networks. These implications will be examined
under three broad headings:
• Strategic Issues – Vision, Regulation and Charging, and Skills and Innovation
• Commercial and Market Issues - Facilitation of Competition; and Costs and Benefits of
Embedded Generation
• Technical Issues - System Integrity Requirements, System Integrity Methods, and
Distribution
6.1 Strategic Issues
Vision
The ‘Group Review’ highlighted that businesses within the UK ESI are concerned that there
UK Electricity Networks, September 2001
Page 59
is no clear direction for the future development of their industry (Annex Four). As detailed
in this thesis, many commentators and analysts expect an increased contribution from
small scale, decentralised, low carbon generating technologies and an expansion of some
larger scale renewables such as offshore wind and biomass. If this long-term vision is to be
realised, there is a need to supplement the current perspective of five to seven years, and
to allow longer time horizons for strategic planning.
Over the next few decades, certain technology trends may bring geographical generation
and demand patterns into balance. For instance, as detailed in Chapter 5, embedded
generation tends to be more or less evenly distributed across the country. Thus, a high
market penetration for fuel cells, micro-CHP and CHP district-heating systems would bring
electricity generation adjacent to where it is consumed in all areas of the country through
the transmission of their fuel source by the existing natural gas pipeline infrastructure.
However, other technologies may maintain or even increase the need for bulk electricity
transfers. Renewable energy resources, such as wind and wave power, are most abundant
in the north and west of the country while demand is highest in the south and east. Rural
agricultural or forestry fuel sources are required for biomass power stations. Proposed
interconnection expansion may allow access to new hydro, wind and geothermal resources
(ETSU, 2001).
Electricity network issues could be made more explicit in Government energy policy
considerations, e.g. security of supply concerns. There are real issues that need addressing
and the ESI stakeholders need to recognise the reality of obstacles, challenges, problems
and each others positions. Sharing and pooling resources across the industry to address
key issues is an essential response to the demands and issues evident in the liberalised
ESI.
There remains a tension between free market principles and the desire for long term
planning and co-ordination. Market based governance systems are emerging in a variety of
forms, but all require that individuals play a greater role, and that governments relinquish
actions to markets where feasible (Weinberg, 2001). Any long-term vision must take
account of dichotomy between central planning and liberalised markets.
Government and policy makers need to develop a vision of the long term (2050), define
desired outcomes and to construct the regulatory and financial incentives required to
achieve them. The management of transmission and distribution networks involves 30-40
year investment and infrastructure decisions, set against short-term transitional electricity
UK Electricity Networks, September 2001
Page 60
generation markets. The difficulty in aligning the two is apparent. The current Energy
Review, due to report by the end of 2001, provides the opportunity to develop a vision of
what electricity networks will do and be like in the future and how users may be charged
for access to them. The development of a coherent structure and forum across industry
and government to facilitate such a transition is therefore important (EGWG, 2001).
Regulation and Charging
Long term transmission and distribution network planning and investments run counter to
the shorter term generation investments. Certainty of the regulatory regime is another
critical factor influencing investor decisions. Reviewing industry price controls every five
years provide a short-term outlook for long-term asset and investment decisions. The
Group Review agreed that a five-year regulatory framework is not appropriate for 30-40
year assets (Annex Four). That said, one of the projected characteristics of decentralised,
small-scale generation technologies electricity is that they do not require such long term
planning nor involve large capital investments. The question remains, however, how to
regulate without knowing what your end goal is?
One approach to delivering joined-up policy goals and addressing uncertainty as to future
policy and regulatory changes is to move to ‘Performance Based Regulation’ (PBR).
Beyond simply setting performance standards (see Section 4.3) and penalising for non-
compliance, this would provide a positive incentive for DNOs by linking revenues to
performance measures - customer value through fewer interruptions, stable voltages,
speedy response to queries or requests for work or connection, low accident rates etc -
rather than the size of the capital asset base.
Many have observed, including EGWG, that the regulatory regime based on asset value is
inappropriate for meeting environmental and social objectives (EGWG, 2001). “The
primary drive within the restructured England and Wales electricity system has been for
economic efficiency (through competition); with much less concern being placed on the
social obligations of equity and security of supply” (Amin, 2000). PBR would remove the
DNO guarantee of a return on capital investments, and provide incentives for them to
reach high levels of performance at lowest cost. This may therefore encourage novel forms
of system support, including embedded generation, provided such alternatives were
cheaper than infrastructure investments.
Presently, 2% of DNO’s income is based on performance criteria. It is thought that a move
beyond 20% is needed to ensure that the incentives for embedded generation are in place
(Fabian Society, 2001). PBR could be introduced at the next Distribution Price Control
UK Electricity Networks, September 2001
Page 61
Review in 2005. EGWG and others have suggested that there appears sufficient
justification to start the ball rolling and to consider introducing appropriate measures as
soon as is possible prior to the full review in 2005 (EGWG, 2001).
While networks need to develop to allow flexibility, present distribution networks are on
the whole, simple and passive. The need for clearer price structures and signals to drive
change is evident. One of the key regulatory issues identified by EGWG is how embedded
generators are charged for access and use of the distribution and transmission networks is
a very complex area. Although discussed in more detail later in this chapter, at this point it
is important to note that consistent and long term charging structures need to be
established. Issues must be prioritised, focussing initially on how DNOs charge for
services. Incentives and profits of DNOs must also be considered.
Skills and Innovation
Skill shortages were highlighted in the ‘Group Review’ (Annex Four) as being of great
concern with only four British universities offering power engineering courses. The
decentralised electricity system would increasingly demand such skills and the
Government, industry and academia must develop appropriate incentives and information
provision to bridge this potential skills shortage
Research and Development (R & D) has been noted as another area for concern (Group
Review, 2001 and RCEP, 2000). DNOs are the major group who must define R & D
requirements yet appear reluctant to pursue embedded generation as an option. ETSU
concluded that the requirements for R & D have been clouded by the commercial and
regulatory frameworks. Companies in the UK have technology under development that
could enable embedded generation to play a more significant role in helping the DNOs
operate a safe and cost effective network. However, without clear indications of interest
from DNOs these technology providers are reluctant to invest in developing potential
solutions (ETSU, 2001). Some government funded R & D is available through the
Engineering and Physical Science Research Council ‘New and Renewable Energy
Programme’ which includes elements related to electricity networks.
6.2 Commercial and Market Issues
Facilitation of Competition
The Utilities Act 2000 requires DNOs to facilitate competition in electricity generation and
supply. Effective information flows, clear market entry processes, and equitable
transparent terms for connection and use of the distribution system are central to such a
requirement.
UK Electricity Networks, September 2001
Page 62
The existing regulatory framework does not easily allow the financial and operational
benefits of embedded generation to DNOs to be recognised. Indeed, embedded generation
often results in additional costs to DNOs rather than providing business development
opportunities. The regulatory environment could be re-structured to allow DNOs to develop
their business through increased load connections and collect revenue through Use of
System charges. DNOs will do what is asked, provided the correct incentives are in place
to motivate them (Group Review, 2001).
New Electricity Trading Arrangements (NETA)
The immediate impacts of the introduction of NETA on embedded and renewable
generation have been widely debated, and will be central to a report to be produced by
Ofgem and DTI in August 2001. To summarise the debate, NETA’s Balancing and
Settlement Code places penalties on suppliers for failing to match their contracted levels of
output, either above or below. Generators that are ‘out of balance’ are required to ‘top-up’
or ‘spill’ via the Balancing Mechanism and are subject to penalty charges. This clearly
impacts on generators who might have difficulty in accurately controlling and predicting
output, such as some renewable and embedded generators.
NETA has moved the goalposts to reflect more the economic benefits of certain types of
generation. The Group Review concurred with the concern regarding the impacts of NETA
on technologies with variable outputs. It also acknowledged that, despite Government and
Ofgem objectives and responsibilities, NETA does not attempt to address the social or
environmental aspects of energy policy (Annex Four). NETA may continue to remain
defective for smaller market players with less reliable outputs, who will continue to be
exposed to the Balancing and Settlement Code. Large generators with access to diverse
forms of generation should be able to bear the risk of the variable output of renewable and
other plant.
In relation to the transmission network, the role of the NGC is more focussed on security of
supply within their system balancing responsibilities. The role of transmission is very much
changed in the liberalised market, now more a facilitator than a constructor or maintainer
of the network.
The current market appears unlikely to be conducive to meeting renewable and CHP
targets, so meeting these targets may require Government intervention. One option would
be to pull CHP and renewable generators out of NETA. CHP and renewable technologies
are likely to need more than the oft used ‘level playing field’ to meet the targets and for
DNOs to become renewable and embedded friendly. Another option may be facilitating the
UK Electricity Networks, September 2001
Page 63
development of aggregation (see below) and supporting energy storage technologies to
smooth the variable outputs of some technologies (see Chapter 5). It is important to note
that tweaking the market by government is much more transparent in the liberalised
market and will require clear justification.
Aggregation
The concept of ‘aggregation’ or brokerage has been raised in the debates concerning the
recent California energy crisis (Brooks and Butler, 2001). Electricity supply problems in
California have been of great concern to industry, particular for the hi-tech, high-energy
users located in the state. Many of these industrial users responded to past fears of supply
security by purchasing on-site, off-grid back-up generation capability, often in the form of
diesel generators. Such generation is restricted through permits and has tended to lay idle
for much of the year, actual utilisation falling well under that permitted. Companies have
begun to establish a niche in the market through aggregating this unused capacity from a
number of sources and making it available to the grid. The DNOs could take this
aggregator role in the UK, taking excess output from CHP and other small-scale generating
technologies. Other potential ‘aggregators’ include third party ‘Trading Co-operatives’.
Such developments are advantageous to owners of embedded generation, as long as their
security of supply is guaranteed, as it offers them access to another income stream without
too much administrative time and cost. Such developments could make embedded and
distributed energy a much more viable and attractive proposition. Policies designed to ease
aggregator access to electricity networks will have a significant impact on such
developments. Indeed, some have suggested that aggregation and generation co-operatives
might be a market response by renewable and CHP generators.
Providing Incentives to Distribution Network Operators
Provided with suitable incentives, DNOs will invest in their network to augment the
potential for embedded generation connection. They could strengthen the network to
maintain acceptable fault levels and increase the scope for connecting new generation.
Amending the network’s configuration may allow more flexible operation of embedded
generation under fault conditions. New technology such as super-conducting fault level
limiters, energy storage technologies and household technologies such as energy efficient
lighting and appliances, PV, fuel cell, Stirling Engine, etc could all be encouraged by DNOs
through links with Government Departments, the Energy Savings Trust, and the Energy
Efficiency Commitments of electricity supply companies.
DNOs are ideally placed to play a significant role in developing the commercial and
UK Electricity Networks, September 2001
Page 64
technological shift required to encourage the expansion of renewable and embedded
generation, in partnership with other agencies. The right commercial and regulatory
frameworks need to be in place to facilitate this.
Minimising Red Tape on Embedded Generation Projects
Small-scale generators seek as simple contractual arrangements as possible. The existing
arrangements often require embedded generators to enter into contractual relationships
with both the NGC and DNOs. The EGWG report highlighted the need for NGC to adapt
their contractual agreements with DNOs so that embedded generators may choose to have
a single point of contact with their host DNO, and choose whether to enter into agreement
with NGC.
Licence conditions would need to be developed for DNOs to link to NGC. One point of
contact for embedded generators concerning connection would be provided, the DNO
undertaking all liaisons with NGC. Such developments could facilitate DNOs taking on the
aggregator role discussed above, and measures to stimulate aggregation require
consideration.
Provision of Information
The EGWG report highlighted the importance of information and transparency in
facilitating the development of embedded generation. Information regarding connection
points and the effect of location on likely connection charges is central to decisions on the
location of embedded plant. Developers of embedded generation have been concerned that
the information made available to them is erratic, inadequate and overly complex (EGWG,
2001). Effective information flows, accessible processes for market entry and transparent
terms for connection and use of networks are all key factors.
The Utilities Act 2000 requires DNOs to publish network development statements,
intended to inform the market place, enable developers to identify potential business
opportunities, and provide transparent costs for network connections.
EGWG acknowledged that an appropriate balance between the value and costs of
providing the information must be established (EGWG, 2001). Comparisons are readily
made with the information provided in NGC’s Seven Year Statement (SYS) which provides
information on system opportunities, policies on connection and use of system charging,
and general approaches to facilitating new market entrants. These were cited by the
EGWG as good practice and worthy of consideration for addressing the issues that are
emerging at the distribution level with respect to embedded generation. (EGWG, 2001)
UK Electricity Networks, September 2001
Page 65
However, acknowledgement must be given to the relatively increased complexity of
distribution systems, their extensive length, varied voltage levels, dynamic demand profiles
and variety.
At the very least, however, a consistent approach across DNOs to the provision of
information and the connection application process would assist embedded generation
development. General connection guidelines for embedded generation that clarify the roles
of developers and DNOs and set standards, both for the quality of information submitted
by developers and the quality of the response from DNOs, would be another encouraging
development.
Cost and Benefits of Embedded Generation
Distribution Charging Principles
At present, generator customers incur ‘deep’ connection charges. Such charges include the
costs of the direct connection and any associated costs of reinforcing the distribution
network as far as the local grid supply point. In comparison, demand customers pay
relatively shallow (‘shallowish’) connection charges along with Distribution Use of System
(DUoS) charges.
The current arrangements present a significant financial barrier to the connection of new
generation. A generator may only need a portion of the minimum reinforcement for which
it must pay. This produces clear inequities between first and subsequent generator
connections. EGWG suggested that a move towards sharing more of the benefits with
others, such as existing and future customers and future embedded generators is required.
Therefore, the duty on DNOs to facilitate competition in generation may require significant
amendments to be made to the way in which DNOs charge for the connection to and use
of distribution networks. A number of charging options exist and include:
• ‘Shallow’ charges, whereby the generator pays only for the connection to the
distribution network at the nearest suitable point. Such charges are similar to
connection charges applied to generators connecting to the transmission network.
• ‘Shallowish’ charges, whereby the generator pays for connection as above plus any
reinforcement triggered by the connection to the distribution network at the same
voltage as the connection and one voltage level above that of the connection. This
structure is analogous to the connection charges applied to load customers connecting
to distribution networks.
The introduction of ‘shallow’ and ‘shallowish’ charges would reduce the capital cost
UK Electricity Networks, September 2001
Page 66
incurred and encourage additional connections of embedded plant. EGWG acknowledged
that ‘shallow’ charges would likely to be more effective than ‘shallowish’ charges in this
respect.
An important consideration is the potential weakening of locational signals that are present
in the existing ’deep’ charging structure. ‘Shallow’ charging provides no locational signal
whereas ’shallowish’ charges may place significant costs on other users. But, varied
charges between locations could provide incentives and disincentives to plant location.
Discussions in the Group Review reflected on the option of introducing a rationed or
auctioned subsidy to fund reinforcement, thereby lessening connection charges, retaining a
locational signal in the price, and building infrastructure so that the first-comer doesn’t pay
for the second-comer’s “free ride” (Annex Four).
The above charging options may require that reinforcement costs be met through other
charges. Demand customers could pay all reinforcement costs through increased Demand
Use of System charges, although significant embedded generation would result in
significant additional costs and raise inequity concerns. Generation customers could pay all
reinforcement costs for generators through a new generator entry charge. Alternatively,
load and generation customers could pay reinforcement costs through entry and exit
charges. Such an option is equitable while providing significant encouragement overall to
the connection of new embedded generation. It could also provide the locational signals to
generators and customers lost through a move to a new charging regime.
EGWG highlighted that, regardless of any amendments made to the charging regime,
analysis and assessment of the potential short and long term impacts of options for
changes is required (EGWG, 2001). Such analysis should encompass existing embedded
generators that have already paid deep connection charges.
Recognising the Benefits of Embedded Generation
Embedded generation can provide benefits to customers through increased reliability,
uninterruptible service, energy cost savings and onsite efficiencies (NREL, 2000).
Similarly, there are a number of potential benefits to the distribution network in terms of
lower transmission and distribution losses and reduced capital requirements.
For instance, the Transmission Network Use of System charging procedures provide
locational signals as to the most economic areas for development from a transmission
system point of view. Embedded generators may also receive the benefit of the avoided
demand charges when meeting demand of local suppliers, such benefits being of higher

UK Electricity Networks, September 2001
Page 67
value in the south of the country. The potential for improving the economic efficiency of
locational signals is currently being undertaken as part of a wider review of transmission
access arrangements currently led by Ofgem.
However, it is not enough simply to recognise the true value of embedded generation. The
regulatory framework must reward this value (see charging structures).
6.3 Technical Issues
System Integrity Requirements
Security of Supply
Security of supply is a key element of Government energy policy. Indeed, committees in
the House of Commons and House of Lords have recently announced their intention to
examine energy security. The current transmission system contributes to security of supply
by ensuring that demand in a specific part of the country is not solely dependent on the
availability of generating plant located within that area. This allows for the opportunity for
any available generation, regardless of location, to be utilised to meet demand.
Therefore, the transmission system therefore will be likely to continue to play an integral
role in the future electricity system, even with higher penetration of renewables, CHP and
embedded generation. But there are examples of embedded generation being used to
provide generation reserve to a large interconnected system. In France, EdF can call on
610 MW of distributed diesel generators for such a role (Jenkins et al, 2000).
Existing methods for connecting embedded generation ensure maintenance of the security
of the overall network. But this is at a significant cost to developers. Managing the network
differently may offer opportunities for amending the methods and recognising that
operation of embedded generation in ‘island mode’ could bring security benefits under
outage conditions. ‘Islanded’ operation refers to embedded generators operating
disconnected from the distribution and transmission networks, supporting local supplies in
the event of network failure. Such an arrangement, albeit on a localised basis, could
significantly reduce frequencies and extent of ’power-cuts’. The maintenance of voltage,
frequency and network safety under such operating conditions would likely remain with the
DNOs and requires consideration.
EGWG recommended that, in the short term, measures under the existing standards
require clarification to allow recognition of the contribution of embedded generation to
network security and performance, attaching a target date of January 2003 to such a
review (EGWG, 2001). Similarly, EGWG recommended a Health and Safety Executive and

UK Electricity Networks, September 2001
Page 68
DTI review of the implications of connecting widespread embedded generation for the
safety of distribution network operation. With a potentially vast number of generators being
connected to the system, safeguards are needed to ensure DNOs can be confident that a
particular part of distribution network is ‘dead’ in the event of circuit outages.
Embedded and Renewable Generation and Ancillary Services
Facilitating and encouraging the development of open ancillary service markets that
maintain the integrity of the transmission network (Box 6) may be essential in addressing
longer-term technical issues that may arise from a larger proportion of wind and other
intermittent renewables. The NGC have established arrangements that allow small and
decentralised generators to provide reserve and frequency response through the use of
aggregating agents. The EGWG suggestion that DNOs should facilitate local ancillary
service markets is an important development.
Encouragement should be given to the most cost-effective provision of co-ordinating and
controlling the network and ensuring national standards for quality of supply. It follows
that this should ensure additional requirements can be provided in respect of reserve and
response that may be made necessary to accommodate large amounts of intermittent wind
generation. They may also allow the displacement of some of the large grid-connected
power stations that currently provide these services without any impact on system security.
Local ancillary markets would also provide embedded generation with additional income
streams.
It is essential that the continuing availability of ancillary services in the longer-term be
ensured as embedded generators progressively displace present providers. The same
aggregator agents as discussed above could assist smaller participants to provide such
services to the required capacity and levels of dependability. As identified by EGWG, DNOs
may in future perform this aggregating role as the facilitator of markets to obtain services
directly for the distribution network or to sell on to the transmission network.
Intermittent Generation
The electricity system in the UK consists of diverse generating plants linked by an
interconnected network. This interconnected network is capable of integrating a substantial
amount of intermittent renewable generation without adapting operational procedures. For
instance, the reliability of existing plant, particularly older generating units, may be more
prone to breakdown and delays in start up. The psuedo-intermittent nature of such plant is
already factored into the integrated system.
UK Electricity Networks, September 2001
Page 69
The potential benefits of storage (regenysys, hydrogen, etc.) to intermittency has been
discussed previously in Chapter 5. However, some commentators suggest that there is no
technical nor economic need for dedicated electricity storage linked to intermittent
renewable capacity because fluctuations of energy output are lower than often assumed
(Hartnell, 2000).
For instance, if the wind is not blowing in one location, it is likely to be blowing elsewhere.
Thus, geographically dispersed wind generation may resolve overall concerns over
intermittency. But, such impacts may be limited in an individual contract market such as
NETA whereby individual generators face the problems of intermittent generation of
individual wind farms. The development of wind co-operatives could be a response to such
market exposure. The geographical distribution of intermittent generation may result in
more localised impacts on transmission and distribution networks. For example, large off-
shore wind capacity in the north of Scotland would have a significant impact on the nature
and available capacity of local transmission and distribution networks.
As stated previously, intermittency should not be confused with unpredictability. Studies
have been undertaken into predicting wind generation output. Research has shown 95%
predictability for output 24 hours ahead, with suggested further gains to come (ISET,
2001).
NGC have examined the interaction of renewables, CHP and other embedded generation
with the transmission network and system operation activities. NGC have expressed
confidence that transmission related issues will not become a barrier to accommodating
the amount of renewables or CHP generation necessary to meet the Government's 2010
targets (HoC Environmental Audit Committee, 2001). They further conclude that,
depending on the location and type of technology, the transmission network might be able
to accommodate a greater proportion of renewables, CHP or other embedded generation
than that specified in the 2010 targets. NGC do not perceive potential problems with a
10% contribution from wind generation nor insurmountable problems with increased levels
(Annex Four).
System Integrity Methods
Flows between the Transmission and Distribution Networks
If the expectation is for an increasing proportion of embedded generation, electricity flows
from the transmission to the distribution networks will likely be reduced. This may delay
the need for transmission network reinforcement, although this is unlikely to remove the
need for the substations/grid supply points at these transmission-distribution interfaces.

UK Electricity Networks, September 2001
Page 70
Such interfaces may still be required to balance the fluctuation between generation and
demand in specific parts of the distribution network from minute to minute.
There is the potential for embedded generation to contribute to such a level that
distribution networks may be in a position to export electricity to the transmission system.
Grid reinforcement would only be necessary at appropriate interfaces should exports to the
transmission system exceed the existing transmission capacity or compromise quality of
supply.
Bulk Power Transfers
Reduced electricity flows from the transmission to distribution networks as a result of
increased penetration of embedded generation development will not necessarily result in a
corresponding reduction in the bulk transfers across the transmission network. Bulk
transfers are more dependent on the relationship between the location of generation and
demand, including base and peak demand patterns.
As discussed in Section 4.4 and shown in Figure 7, existing patterns of generation and
demand produce a net north to south power transfer across the transmission network of up
to 10,000MW (NGC, 2001). This pattern represents the excess generation capacity
located in the north (near coal and gas fuel supplies) relative to demand in that area.
Thus, this excess capacity is exported to meet demand in the south. Such bulk transfer
patterns are evident throughout the year. As demand falls from its winter peak, it tends to
be the output of the more expensive generation units in the south that are switched off
first, thus maintaining bulk transfer patterns.
These bulk transfer patterns indicate that new embedded generation units in the north may
only serve to displace higher cost generation in the south. This would result in increased
bulk system transfers in the same way as new transmission system connected generation
in the north. New embedded generation in the south may likely displace older and
expensive southern generation leaving north to south bulk power flows unchanged.
NGC suggest that for these reasons, bulk transfers on the transmission system are likely to
continue. This situation will remain until such a time that there is a significant shift
towards an improved regional balance between demand and generation, whether
embedded or directly connected to the transmission network. Taking the existing situation,
such a shift would require a significant increase in generation in the south.
Charges for use of the transmission system have been structured to provide incentives for

UK Electricity Networks, September 2001
Page 71
generation, using the transmission system to locate in the south of the country. Despite
such incentives, generation continues to locate in the north. Embedded generators are not
liable for these charges and have not received a direct incentive to locate in the south. But,
embedded generators may enable suppliers to avoid payments of transmission demand-
related use of system charges. Such charges are higher in the south than in the north, thus
offering an indirect incentive for embedded generators to locate in the south.
In addition, the remote and low demand locations of many of the existing renewable
energy technologies, e.g. biomass in the countryside, offshore and onshore wind in
Northern Scotland, etc., will maintain the need for bulk transfers at high voltages. Indeed,
the NGC are already in discussions with wind developers about arrangements for
transmission connections and charges.
Network Modelling, Management and Control
An increasingly active network with multi-generator connections will require complex
modelling and simulation tools to allow accurate evaluation. ETSU has identified the need
for network modelling to assess the number of technical issues that will arise in a
decentralised network (ETSU, 2001).
ETSU suggested that in the first instance, effort should focus on integrating embedded
plant through the automation. With better modelling to understand the impacts on network
operation, intelligent and automated management and control equipment would facilitate
the development of embedded technologies. (ETSU, 2001). Automatic adjustments could
be made to the network to maintain the system within the required limits, including the
dispatch of embedded plant.
Distribution
Development of Active Distribution Networks
The Group review concluded that in the short to medium term, one of the biggest technical
issues facing DNOs relates to the development of active, rather than passive distribution
networks (Annex Four). Traditionally, DNOs have focussed on passively serving demand,
building and maintaining adequate infrastructure in order to receive power from the
transmission network for delivery to customers. The passive nature of distribution networks
has been formalised and encouraged through design codes, price controls, incentives and
the regulatory environment. The role of the responsive and active management and
matching of demand and generation has been taken by the transmission network operator.
However, increased embedded generation would require active management of distribution
UK Electricity Networks, September 2001
Page 72
networks involving a stepped introduction to adapt to new management, technological and
administrative demands. Monitoring and control systems would require development to
ensure effective communication and control of fault levels, quality of supply, security of
supply and safety aspects. The impacts of a shift from uni-directional to bi-directional
electricity flow have raised safety concerns and are new territory for many DNOs.
Central to the evolution of active distribution networks remains the market mechanisms
and regulatory environment in which DNOs operate. At the distribution level, connection
agreements and contractual frameworks need to ensure equitable treatment of embedded
generation and central generation alike, truly recognising the cost and benefits of both.
In the near future, as networks are designed with a view to increasingly integrating
embedded generation, so the degree and benefits of active management will increase.
However, to date the DNOs may have stressed the costs and technological limitations of
the shift towards active distribution networks, ahead of the potential benefits.
Developing active distribution systems would require Ofgem and Government support. For
instance, investment will be needed to reconfigure the distribution network. But there is
some debate over the time-scale for the required investment (ETSU, 2001 and Annex
Four). Should embedded and intermittent generation expand rapidly, large scale
investment will be needed quickly, whereas incremental investment could be sufficient for
a gradual transition.
Net-metering and Smart-metering
‘Net-metering’ can be defined as using electricity networks as a kind of battery with fair
prices in both directions to improve the economics of small plant (Financial Times, 10
August 2000). Net-metering allows customers to offset their electricity consumption
originating from the transmission and distribution network by selling their own generated
electricity to the network. Box 14 provides details of a net-metering case study involving
TXU Europe and Greenpeace.
Small-scale generators can sell back to the distribution network. The payment they receive
should reflect the costs of operating the distribution network, distribution losses,
information management, co-ordinating supply and ensuring quality of supply, and the
benefits, e.g. removal of need for network reinforcement, provision of local ancillary
services. The potential costs associated with the metering and charging alternatives need
to be established. These include installation, meter reading, developing and implementing
new demand profiles for domestic and micro-scale generation, bi-directional metering,

UK Electricity Networks, September 2001
Page 73
implementing half-hourly metering, and addressing the stranded costs of existing metering
assets.
Box 14 Net-metering Case Study – TXU Europe and Greenpeace
A children's adventure playground in East London, powered by solar photovoltaics, has entered into agroundbreaking deal put together by Eastern Energy, a TXU company, with the support of Greenpeace.
The Eastern Energy agreement means that the playground can be paid the same price for the surpluselectricity they 'export' to the national grid during daylight hours as they pay for any conventionalelectricity they 'import'. The playground will be paid 5.51p a unit for the electricity it exports via EasternEnergy and received £250 in compensation, as it did not receive any payment from its old electricitysupplier for power previously exported.
Net metering works by the customers' standard electricity meter being modified to record the number ofexported units. When the meter is read, imported units are charged for, and a rebate is paid to thecustomer for units that are exported, at the same unit price.
The solar net contract is open to the first 1000 domestic customer applicants who either have existingsolar panels or who wish to install them. Through the contract, TXU agrees to pay the customer thesame unit price for the exported electricity as that charged per the tariff type and payment method usedto purchase electricity from Eastern Energy. This price match will initially be offered for a five-yearperiod to April 2005.
Source: TXU Europe, 2001
Metering should be economic to install and be linked to tariff arrangements that allow all
the parties concerned to measure or estimate with confidence the information they need.
The tariff level is an important factor for domestic feeds into grid. Although there are a
number of potential methods, it is essential to ensure that domestic generators get paid.
Metering options include (EGWG, 2001):
• The retention of one way meters linked to tariffs based on demand profiles that
estimate typical flows in both directions. Although this would minimise installation
costs, administration costs may be high and profiling may not encourage reductions in
energy consumption once the profile has been established
• Bi-directional meters that operate with a net energy tariff or a profiled tariff which could
estimate typical energy flows in both directions
• Import-export meters that provide measurable information on power flows in both
directions thereby reducing the reliance on estimated demand profiles.
Some have suggested that not including legislation to encourage net or dual metering in
the Utilities Act 2000 was a missed opportunity to encourage the development of
domestic micro-generation technologies (Fabians, 2001). Nevertheless, the TXU case
study (Box 10) shows the construction of net-metering arrangements is possible in the
current commercial and regulatory frameworks.
UK Electricity Networks, September 2001
Page 74
Domestic and Micro-Generation and ‘Plug and Play’
The development and application of technologies such as photovoltaics, fuel cells, micro
turbines and Stirling engines is expected to lead to a significant growth in domestic and
commercial generation. Such domestic or micro generation could meet most of a typical
household demand.
The impact of widespread micro CHP or PV systems on the demand and generation
profiles of distribution networks would be significant. A distribution network may have no
net electricity flow over certain times of the day, its role reduced to balancing the networks
and providing the appropriate level of backup capacity and security. Such a development
would have implications, not only for DNOs, but also for suppliers, generators of all sizes,
and the transmission operator.
That said, the development of domestic and micro generation is not without its pitfalls and
complications. A number of technical and financial decisions will need to be addressed.
For instance, simpler and transparent connection and payment structures need to be
established in a manner that is appropriate to micro-scale generation technology. Payment
mechanisms, via metering, profiles and fixed charges, for use of the distribution system,
selling exports and buying imported electricity must be developed (see above).
Most forms of micro-generation must comply with strict engineering standards that were
designed for larger generation plant. Work needs to be initiated to construct and apply
appropriate yet simpler engineering standards for micro-generation (3rd I-P M, 2001). Such
standards would need to be suitable for mass produced equipment and take fully into
account important security and safety issues. Producing such standards would aid the
development of what have been termed ‘plug and play’ small-scale generation units.
6.4 UK ESI Strengths and Weaknesses
Work undertaken by ETSU has identified a number of strengths of the UK ESI relevant to
the development of embedded generation, many of which are equally relevant to
renewable generation technologies (Box 15). However, as identified within this thesis and
by ETSU, there are a number of weaknesses across the UK ESI that, if not addressed, may
seriously limit options for the development of embedded and renewable generation
technologies. These weaknesses may also limit the ability of the UK ESI to take advantage
of the considerable UK and overseas business opportunities.
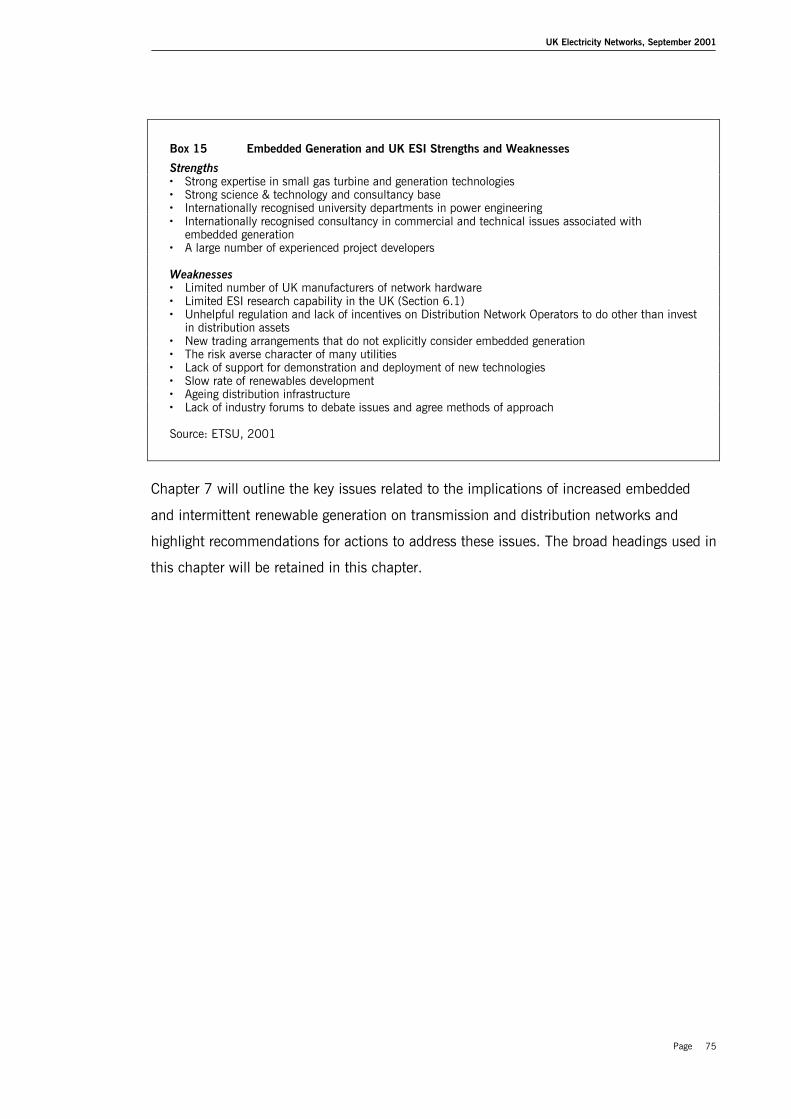
UK Electricity Networks, September 2001
Page 75
Box 15 Embedded Generation and UK ESI Strengths and Weaknesses
Strengths• Strong expertise in small gas turbine and generation technologies• Strong science & technology and consultancy base• Internationally recognised university departments in power engineering• Internationally recognised consultancy in commercial and technical issues associated with
embedded generation• A large number of experienced project developers
Weaknesses• Limited number of UK manufacturers of network hardware• Limited ESI research capability in the UK (Section 6.1)• Unhelpful regulation and lack of incentives on Distribution Network Operators to do other than invest
in distribution assets• New trading arrangements that do not explicitly consider embedded generation• The risk averse character of many utilities• Lack of support for demonstration and deployment of new technologies• Slow rate of renewables development• Ageing distribution infrastructure• Lack of industry forums to debate issues and agree methods of approach
Source: ETSU, 2001
Chapter 7 will outline the key issues related to the implications of increased embedded
and intermittent renewable generation on transmission and distribution networks and
highlight recommendations for actions to address these issues. The broad headings used in
this chapter will be retained in this chapter.

UK Electricity Networks, September 2001
Page 76
7 Discussion and Conclusions
This chapter will outline the key issues related to the implications of increased embedded
and intermittent renewable generation on transmission and distribution networks. The
broad headings used in Chapter 6 are retained. Key conclusions and recommendations are
highlighted in bold text.
7.1 Strategic Issues
Central to the development of flexible and active electricity networks is a clear vision of the
‘Energy Future’. UK Energy Policy responsibilities are split across a wide range of
departments. As evident from the ‘Group Review’, key stakeholders within the UK ESI are
concerned about the lack of focus and direction as to the future nature of their industry
(Annex Four). Thus, there is a clear need for the Government and the ESI to establish its
vision of electricity systems in the future and to put in place the appropriate regulatory
and commercial frameworks to achieve this. The Government should move away from the
short-term perspective and consider the 2010 targets and beyond.
Such an opportunity should not be missed by the Energy Review that is currently taking
place. The fear of ‘picking winners’ is justified and public money should not unnecessarily
be diverted towards technologies that will not be successful. “ Policy makers wishing to
promote these technologies need to recognise the importance of supporting the industry
during these fledgling years for the sake of longer term development of the industry”
(Amin, 2000). Establishing a vision does not necessarily entail ‘picking winners’. If the
vision is for a low carbon, decentralised energy future operating in a liberalised market,
the key to success is putting in place appropriate and flexible regulatory and commercial
frameworks. The market can decide which technologies may be successful.
Running alongside the fear of ‘picking winners’ is the concept of developing a ‘level playing
field’ through the regulatory and commercial structures. This level playing field is an
equitable regulatory and commercial framework within which transmission and distribution
connected generation can compete fairly and that is flexible to allow for future
developments in the generation mix. Although liberalised in 1989, the current UK ESI
structure still represents over 40 years of public investment and Government support. A
truly level-playing field would factor in the historical support provided to the ESI by
offering funding and support for newer technologies that may prove beneficial in
developing the transmission, distribution and generation elements of the ‘Energy Future’.

UK Electricity Networks, September 2001
Page 77
The lack of focus and direction in UK Energy Policy is not aided by the split in
responsibilities and priorities across Government departments. Some have called for the
creation of a Sustainable Energy Agency linked to the Energy Minister and focussed on
driving cross-departmental agendas related to CO2 emissions reductions, fuel poverty
strategies, UK business development and so on (Fabian Society, 2001). A Sustainable
Energy Agency would be central to the development of a coherent structure across
industry and government to facilitate the transition.
Transmission and distribution networks need to develop to allow flexibility, yet present
distribution networks are on the whole, simple and passive. The need for clearer price
structures and signals to drive change is evident. Long term transmission and distribution
network planning and investments run counter to the short-term generation transitions.
Certainty of the regulatory regime is another critical factor. Regulation must be designed
and structured to deliver joined-up policy goals and address uncertainty as to future
policy and regulatory changes.
The introduction of performance based regulation would remove the DNO guarantee of a
return on capital investments and provide incentives for them to reach high levels of
performance at lowest cost. This may therefore encourage novel forms of system support,
including embedded generation, provided such alternatives were cheaper than
infrastructure investments. Government, Ofgem and industry support must be established
to allow an increasing proportion of DNO revenues to be set on the basis of performance
based regulation.
Charging structures need to be constructed to address the structural problems that have
been made apparent since ESI liberalisation in 1989. Issues must be prioritised, focussing
initially on how DNOs charge for services. Incentives and profits of DNOs must also be
considered. Consistent and long term charging structures need to be established.
Potential skill shortages that would be increasingly demanded in a decentralised electricity
system have been highlighted. Again, Government, industry and academia must
collaborate to develop appropriate incentives and information provision to bridge the
skills gap.
7.2 Commercial and Market Issues
As required by the Utilities Act 2000, effective information flows, clear market entry
processes, and equitable transparent terms for connection and use of the distribution
system are central to DNOs facilitating competition in generation and supply. Such a
UK Electricity Networks, September 2001
Page 78
requirement. Provided with suitable incentives, DNOs will invest in their network to
augment the potential for embedded generation connection. DNOs are ideally placed to
manage the commercial and technological shift required to encourage the expansion of
renewable and embedded generation. The right commercial and regulatory frameworks
need to be in place to facilitate this. Policies designed to ease aggregator access to the
grid and to encourage such a role to be taken in the UK by the DNOs or Energy Trading
Co-operatives may have a significant impact on the developments of embedded
generation and active networks.
NETA does not attempt to address the social or environmental aspects of energy policy,
despite the stated desire in government policy to bring economic, environmental and social
issues together under the ‘sustainable development’ moniker. However, NETA has not
been favourable to embedded and renewable generators, penalising those have difficulty in
accurately controlling and predicting output – CHP and intermittent renewable generators.
Larger generators with access to diverse forms of generation should be able to adapt
internally to cover for the variable output of renewable and other plant. Smaller generators
will have to work (via storage, aggregation or co-operatives) to make their electricity
output more predictable and secure.
The current market appears unlikely to be capable of meeting renewable and CHP
targets and the Government may have to intervene. Options include pulling CHP and
renewable generators out of NETA, facilitating the development of aggregation and
supporting energy storage technologies to smooth the variable outputs of some
technologies (see Chapter 5). Any government intervention would be more transparent in
the liberalised market and require justification.
Improved information and market transparency will facilitate the development of
embedded generation. Effective information flows, accessible processes for market entry
and transparent terms for connection and use of networks are all key factors. An
appropriate balance between the value and costs of providing the information must be
established, to develop a consistent approach across DNOs towards providing
information and the connection application process.
DNOs are ideally placed to play a significant role in developing the commercial and
technological shift required to encourage the expansion of renewable and embedded
generation, in partnership with other agencies. Provided with suitable incentives and the
right commercial and regulatory frameworks, DNOs will invest in their network to
augment the potential for embedded generation connection.
UK Electricity Networks, September 2001
Page 79
The current ‘deep’ charging arrangements present a significant financial barrier to the
connection of new generation. The duty on DNOs to facilitate competition in generation
may require significant amendments to be made to the way in which DNOs charge for the
connection to and use of distribution networks. Consideration must be given to ‘shallow’
and ‘shallowish’ charging structures that would reduce the capital cost incurred and
encourage additional connections of embedded plant. As advocated by EGWG, a full
analysis and assessment of the potential short and long term impacts of options for change
is required.
Recognising and rewarding the potential benefits of embedded generation to the
distribution network in terms of lower transmission and distribution losses and reduced
capital requirements is another key development. Simpler connection arrangements for
embedded generators are needed and could facilitate DNOs taking on the aggregator role.
7.3 Technical Issues
Security of supply is a key element of energy policy, the current transmission system
contributes to this by ensuring that demand in a specific part of the country is not solely
dependent on the availability of generating plant located within that area. The
transmission system will be likely to continue to play an integral role in the future
electricity system, even with higher penetration of renewables, CHP and embedded
generation.
Managing the network differently may offer opportunities for recognising that operation of
embedded generation in ‘island mode’ could bring security benefits under outage
conditions. ‘Islanded’ operation, albeit on a localised basis, could contribute to security
of supply and significantly reduce frequencies and extent of ’power-cuts’.
In order to maintain the integrity of the transmission network in addressing longer-term
technical issues that may arise from a larger proportion of wind and other intermittent
renewables, wider ancillary service markets should be encouraged. Local ancillary markets
would also provide embedded generation with additional income streams. Facilitating and
encouraging the development of open ancillary service markets, accessible to embedded
and renewable generation would be a positive step.
The psuedo-intermittent nature of existing plant, particularly older generating units, is
already factored into the integrated system. The interconnected electricity network is
capable of integrating a substantial amount of intermittent renewable generation without
adapting operational procedures.
UK Electricity Networks, September 2001
Page 80
Some commentators suggest that there is no technical nor economic need for dedicated
electricity storage linked to intermittent renewables. However, the potential benefits of
electricity storage technologies should be further researched.
Research into predicting wind generation output has shown 95% predictability for output
24 hours ahead. Therefore, intermittency should not be confused with unpredictability.
Depending on the location and type of technology, the transmission network might be able
to accommodate a greater proportion of renewables, CHP or other embedded generation
than that specified in the 2010 targets. In examining the impact of renewables, CHP and
other embedded generation, NGC have expressed confidence that transmission related
issues will not become a barrier to accommodating the amount of renewables or CHP
generation necessary to meet the Government's 2010 targets.
If the expectation is for an increasing proportion of embedded generation, electricity flows
from the transmission to the distribution networks may be reduced. That said, bulk
transfer patterns are dependent on the relationship between the location of generation and
demand. The remote and low demand locations of many of the existing renewable energy
technologies suggest that bulk transfer patterns appear fairly persistent.
To help facilitate the development of embedded and intermittent renewable technologies,
an increasingly active network with multi-generator connections will require complex
modelling and simulation tools.
The passive nature of distribution networks has been formalised and encouraged through
design codes, price controls, incentives and the regulatory environment. The role of the
responsive and active management and matching of demand and generation has been
taken by the transmission network operator. Increased embedded generation would
require active management of distribution networks involving a stepped introduction to
adapt to new management, technological and administrative demands.
Central to the evolution of active distribution networks remains the market mechanisms
and regulatory environment in which DNOs operate. At the distribution level, connection
agreements and contractual frameworks need to ensure equitable treatment of
embedded generation and central generation alike, truly recognising the cost and
benefits of both.
Net-metering allows customers to offset their electricity consumption originating from the
UK Electricity Networks, September 2001
Page 81
transmission and distribution network by selling their own generated electricity to the
network. The potential costs associated with net-metering and charging alternatives need
to be established.
The development and application of technologies such as photovoltaics, fuel cells, micro
turbines and Stirling engines is expected to lead to a significant growth in domestic and
commercial generation. The impact of widespread micro CHP or PV systems on the
demand and generation profiles of distribution networks would be significant. Simpler
engineering standards and transparent connection and payment structures need to be
established in a manner that is appropriate to micro-scale generation technology.
7.4 Discussion
Expanding and incorporating small and intermittent electricity generating units on a
transmission and distribution network that has been constructed around centralised
generation and bulk transfers requires innovative approaches to managing and operating
the system. Alongside this, regulatory deficiencies and uncertainty obstructs the uptake of
new technologies and practices. The various arrangements have not yet been revised to
recognise the changing electricity market place that will be driven by the development of
cost effective modular generation plant that can be sited close to sites of demand and the
increasing awareness of the environmental impact of power generation (ETSU, 2001).
EGWG suggested that significant amendment to incentives and other indicators was
required, otherwise the targeted expansion of CHP and renewable generation would be
restricted (EGWG, 2001). Alignment of the incentives for all the key stakeholders is
required to create the right commercial environment in which embedded generation can
contribute to a stable and secure network whilst ensuring a diversity of fuel supplies in a
more environmentally sustainable manner. Commitment by all the parties to a co-
ordinated programme of work is essential. In particular, clear statements of intent by
Government and Ofgem are critical to the success of the programme and for providing
incentives for DNO action. Only then can the full potential for embedded generation be
realised (EGWG, 2001).
In the meantime, however commentators express concerns that “reducing energy prices
and increasing competition have been the main political drivers for liberalising energy
markets in the past decade. In contrast, sustainability and climate-change have been
paid only lip-service during most of this period” (Fabian Society, 2001). The impact of
recent policy interventions to encourage embedded and renewable generation, such as the

UK Electricity Networks, September 2001
Page 82
Renewables Obligation and the Climate Change Levy, have been severely limited by the
negative impacts of NETA on small scale and renewable generators.
The DTI, in its initial submission to the UK Energy Review, highlighted that post 2010 CO2
emissions may start to rise as nuclear plant comes to end of life, subject to which
technologies replace this generation capacity. If the Government is serious about meeting
its Kyoto, Renewable and CHP targets by 2010, and continuing progress beyond, the
focus of policy and regulation must clearly be adapted.
In the same submission, the DTI reflected that policies that imply higher energy prices
must take into account the social costs and impacts on schools, hospitals and, business
and address the overall fuel poverty strategy. Recent trends indicate a degree of synergy
between the core energy policy objectives of competitiveness, social objectives, energy
security and environment. For example, the dash for gas from secure supplies from UK
fields has reduced electricity prices and emissions. But will these synergies continue?
ETSU has acknowledged the longer term potential of embedded generation to reduce
overall costs to the consumer by providing a more efficient electricity system that generates
and delivers power close to the point of use (ETSU, 2001). However, the adaptation of
transmission and distribution networks to encourage and operate with significant quantities
of embedded generation will be an issue in delivering any long term cost reductions.
The decision whether to facilitate the development of embedded generation by establishing
a level playing field through regulation or by imposing measures to meet Government
targets is an important one. Revising regulation will impact upon the design and
management of distribution networks. But, it may not be enough in itself to meet current
Government targets for embedded generation within the timescales set.
There are a number of potential scenarios and possibilities for creating the right business
environment to encourage new approaches to embedded generation and demand
management. The two extremes are the open market environment, and the rigid regulatory
environment that requires the connection of additional embedded generation capacity.
Key characteristics of an open market environment might include: increased certainty of
the minimal performance based regulatory system, local ancillary and security services
markets, opportunities for increased DNO revenue, and an amended the generator and
demand management connection charging mechanism.
UK Electricity Networks, September 2001
Page 83
Key characteristics of a rigid regulatory environment might include: reward schemes for
each MW of renewable or good quality CHP generation connected; electricity generated or
consumption saved.
A market environment that lies between these two extremes is the most likely outcome.
Dialogue between DNOs and Ofgem is key to developing proposals and constructing
market mechanisms that will facilitate increased connection of embedded generation.
In addressing such issues, EGWG recommended that Ofgem need to ensure that the
regulatory regime supports and provides incentives to DNOs to meet their obligations to
facilitate competition in supply and generation (EGWG, 2001). Certain aspects dominate
DNO business:
• regulation and incentives;
• generation connection charging principles;
• and commercial mechanisms to support technical innovation.
Ofgem should focus initial efforts on these dominant aspects.
7.5 Final Comments
The DTI recently announced on 31 July 2001 the creation of a new body focussed on
small and low carbon generators, following up the recommendations of EGWG. Their press
release acknowledged that the “failure to address the barriers to small generation could
compromise the Government’s renewable and CHP targets for 2010” (DTI, 2001). This
announcement is a positive step.
The early steps along the road to a more sustainable energy future are crucial. They must
smooth the likely transitions rather than lay barriers in the way. The failure to expand
embedded and renewable generation technologies and to adapt transmission and
distribution networks may result from regulatory deficiencies rather than technology
constraints.
With a privatised energy industry and foreign ownership of many companies, the
development of embedded and renewable energy technologies will have to be guided
through modifications to the market rules, regulations and incentives. This includes clear
direction by the Government to its energy regulator through its Social and Environmental
Guidelines. Ofgem published their Environmental Action Plan on 20 August 2001, setting
out the “guiding principles which will determine how Ofgem will approach environmental
issues” (Ofgem, 2001). The Action Plan includes direct reference to reviewing the
UK Electricity Networks, September 2001
Page 84
treatment of embedded generation (as recommended by EGWG) and administering the
Government's policy to increase the contribution of renewables. Whether such actions will
include amending NETA to reflect more the environmental and social aspects of the energy
policy agenda remains to be seen.
The need for the Government to establish a strategic and co-ordinated approach across all
stakeholders is clear. The creation of a Sustainable Energy Vision and an associated
agency would assist in developing such an approach. Such an agency would need to:
• produce long term recommendations for further action
• assess the potential contribution of technologies to the Government’s targets
• appraise the impact on stakeholder businesses.
The expansion of the ’national grid’ after the Second World War appears to have been
driven as much by the social objective of electricity for all as by economic efficiency. A full
appreciation of the potential social and environmental benefits of embedded and
renewable generation could trigger comparable policy decisions.
The basic aim of Government policy should be to construct an equitable regulatory and
commercial framework within which transmission and distribution-connected generation
can compete fairly and which allows for future changes in the generation mix. The key
challenge is to seize the opportunity offered by the current Energy Review to create a new
electricity system that supports and stimulates, not stifles embedded and renewable
electricity generation.
UK Electricity Networks, September 2001
Page 85
Critique of the Method and Areas for Further Research
As with all Masters theses, there are limitations inherent with time, resource and other
constraints. These affect the methods available and the scope of the thesis.
Methods
Identification of the key stakeholders was undertaken by a combination of internet
searches, a review of reports and research in related areas, and consultation across the
industry. A ‘snowball’ method was used, whereby experts were interviewed and asked to
suggest other relevant stakeholders. This proved successful in identifying the key
stakeholders, as demonstrated by the attendees of the ‘Group Review’ (Annex Four) who
represented a wide range of interested parties across government, industry and other
sectors.
The rationale for using informal interviews in the first stage of contact has been discussed
previously. It was felt that, given time constraints, constructing a considered structured
questionnaire or interview was in appropriate. The informal interview provided the
opportunity to quickly gather the relevant information. The outputs of these informal
interviews contributed to the production of a ‘Key Issues Consultation Document’ that was
used as the focus of the ‘Group Review’. The fact that the ‘Group Review’ considered that
this document was a good and thorough reflection of the key issues at hand confirms that
the informal interviews were a useful and critical part of the review process.
Wider consultation and peer review at all stages of the research would have been
welcome. Time-constraints limited such opportunities, particularly the ability to hold a
second review day. However, the ‘Group Review’ confirmed the relevance of the issues
covered in the consultation document. This has been further confirmed by positive
feedback from a narrower consultation of the final thesis.
Collaborating with POST proved useful, providing ready access to people, documents,
resources and advice. The independent nature of POST helped to address stakeholder
concerns any concerns as to potential bias in the final report. Also, bringing together the
review group was a useful exercise in itself, enabling the key stakeholders to interact and
discuss matters that, as highlighted in this thesis, require further discourse.
UK Electricity Networks, September 2001
Page 86
Scope
Alongside recommendations in Chapters 6 and 7, a number of areas outside the scope of
this thesis that require further research and evaluation can be identified. These include:
• Energy efficiency and electricity demand management strategies are essential elements
of energy policy. Activities in these areas will operate concurrently with the future
development of electricity networks.
• Comparisons between UK and overseas networks in relation to operation, regulation,
etc.
• Modelling the operation and economics of distributed electricity networks.
• Detailed analysis of various electricity industry regulatory structures (actual and
theoretical). The introduction of performance based regulation is advocated in this
thesis. These analyses could take into account the regulatory experiences of other
privatised utility sectors such as gas and telecommunications.
• Customer perceptions. For instance, rre customers willing to pay more for sustainable
electricity? What is the potential uptake of domestic generation technologies, should
commercial and regulatory frameworks be amenable? What are public perceptions as to
the appropriate amount of public money that should be used to fund the development
of new technologies and networks?
Further consideration of the factors above is necessary to establish the detail of any new
measures introduced in the UK to guide electricity network development. In addition, the
conclusions and recommendations of this thesis may need further consideration in light of
the findings of the UK Energy Review, expected in December 2001.
In summary, it is my opinion that this thesis provides a thorough overview of key issues
that need to be addressed to ensure that electricity networks develop to allow the
expansion of embedded and renewable electricity technologies. It coherently brings
together the relevant technical and policy issues and highlights the importance of
electricity networks in meeting Government CHP and renewable targets. It is hoped that
this thesis will stimulate further debate and research in this area.
UK Electricity Networks, September 2001
Page 87
Bibliography and References
Amin A-L (2000) The Power of Networks: Renewable Electricity in India and SouthAfrica, SPRU – Science and Technology Research, University of Sussex
Anderson D and Leach M (2001) Intermittency of Generation within Large EnergySystems, Imperial College of Science, Technology and Medicine, UK
Aplin M, Butler S and Turner N (2001) Electrical energy storage: An assessment ofpumped hydro, flywheel and Regenesys technologies, MSc Environmental Technology –Technology Assessment, Imperial College of Science, Technology and Medicine, UK
Archard D (2001) A Sustainable Energy Vision for the UK – A Discussion Paper,Environment Agency Sustainable Development Unit
Audience Dialogue, http://www.audiencedialogue.org/kya10.html, accessed on 27/04/01
Awel Aman Tawe Windfarm – Wales, http://www.awelamantawe.co.uk/contents.html,accessed on 27/04/01
Bornemann HJ (1997) Conceptual Design of a 5 MWH/100 MW SuperconductingFlywheel Energy Storage Plant for Power Utility Applications, IEEE Transactions onApplied Superconductivity: Volume 7, Number 2, pages 398- 401
Boyle G (1996) Renewable Energy: Power for a Sustainable Future, OUP, Oxford, UK
Brooks T and Butler S (2001) The California Energy Crisis: A Lesson in How Not toLiberalise? MSc Environmental Technology – Policy Assessment, Imperial College ofScience, Technology and Medicine, UK
Bryden IG and Macfarlane DM (2000) The Utilisation of Short Term Energy Storage withTidal Current Generation Systems, Energy 2000,Volume 25, pages 893-907
Business.com,http://www.business.com/directory/energy_and_environment/electric_power_utilities/transmission_and_distribution/national_grid_group/profile/, accessed on 25/05/01
Cabinet Office PIU (2001) Energy Policy Review, http://www.cabinet-office.gov.uk/innovation/2001/energy/energyscope.shtml
Cochrane, R. (1985) Power to the people: The story of the national grid, CentralElectricity Generating Board, Newnes Books, ISBN: 0600358755
COGEN Europe (2001) Briefing 16 - Growth of decentralised power production: Achallenge for the electrical grid? The Dutch experience, The European Association for thePromotion of Cogeneration
Department of Environment, Transport and the Regions (1997) Assessment of CHPPotential, A report produced by ETSU.
UK Electricity Networks, September 2001
Page 88
Department of Trade and Industry (2000) UK Energy Sector Indicators 2000, DTI,London, UK
Department of Trade and Industry (2001a) Consultative document on electricity networkmanagement issues, http://www.dti.gov.uk/energy/egwg/condoc.pdf
Department of Trade and Industry (2001b) Embedded Generation Working Group Reportinto Network Access Issues, http://www.dti.gov.uk/energy/egwg/e_gen_report.pdf
Department of Trade and Industry (2001c) Initial Contribution to PIU Energy PolicyReview, http://www.cabinet-office.gov.uk/innovation/2001/energy/energyscope.shtml,accessed on 05/08/01
Department of Trade and Industry (2001d) New Review,http://www.dti.gov.uk/NewReview/html, accessed on 24/05/01
Department of Trade and Industry (2001e) The Renewables Obligation StatutoryConsultation, New & Renewable Energy: Prospects for the 21st Century
Department of Trade and Industry (2001f) Wilson works with Ofgem to shine a greenspotlight on small generators, Press Release, 31 July 2001
Department of Trade and Industry (2001g) New Electricity Market Goes Live, PressRelease, 27 March 2001
Department of Trade and Industry website (2001), http://www.dti.gov.uk/index.htm,accessed continuously
Digest of United Kingdom Energy Statistics 2000, Department of Trade and Industry,http://www.dti.gov.uk/epa/dukes.htm/, accessed on 24/05/01
Digest of United Kingdom Energy Statistics 2001, Department of Trade and Industry,http://www.dti.gov.uk/epa/dukes.htm/, accessed on 24/05/01
Edison Electric Institute (EEI) homepage, http://www.eei.org/resources/, accessed on10/05/01
Electricity Association (2000), The UK Electricity System, Electricity Association ServicesLimited
Electricity Association (2001), Electricity Industry Review 5, Electricity AssociationServices Limited
Electricity Association, http://www.electricity.org.uk/, accessed on 23/05/01
Electricity Pool, http://www.elecpool.com/index.html, accessed on 08/06/01
Electricty Association (2000) Renewable Electricity in the UK, Environmental BriefingNumber 7 – August 2000, Electricity Association Services Limited
Embedded Generation Working Group (2001),http://www.dti.gov.uk/energy/egwg/index.htm, accessed on 24/05/01
UK Electricity Networks, September 2001
Page 89
Encyclopedia.com, http://www.encyclopedia.com/, accessed on 10/05/01
Energy Efficiency & Renewable Resources in Electric Industry Restructuring, Public onlinegroup, http://eerr.notes.org/, accessed on 23/05/01
Energy Information Administration (EIA) - Electricity Reform Abroad and U.S. Investment(1997), http://www.eia.doe.gov/emeu/pgem/electric/contents.html, accessed on 24/05/01
Energy Information Administration (EIA) - Official energy statistics from the USgovernment, http://www.eia.doe.gov, accessed on 14/05/01
ETSU (2001) Technology Status Report: Embedded Generation and Electricity Studies, Areport by ETSU as part of the DTI’s New and Renewable Energy Programme,http://www.dti.gov.uk/renewable/embedded.htm
European Commission (1999) Opening Up to Choice: The Single Electricity Market,http://europa.eu.int/comm/energy/en/elec_single_market/elecbro.pdf
European Commission (2000) Towards a European Strategy for the Security of EnergySupply, Green Paper, European Commission, November 2000
Fabian Society (2001) At the Energy Crossroads: Policies for a Low Carbon Economy,authors - Gareth Thomas MP & Stewart T Boyle.
Foreign & Commonwealth Office (2001) UK Statement in Response to G8 RenewableEnergy Task Force Report, Press Release, 30 July 2001
Franklin Institute Online, http://sln.fi.edu/franklin/scientst/scientst.html, accessed on09/05/01
FT Energy (2001) Power Markets in Europe: The Solution to Understanding Europe'sChanging Power Markets – Executive summary, © Copyright Financial Times Energy2001, http://www.ftenergy.com/samples/PMiE_ExSum.pdf, accessed on 25/05/01
Gandy S (2000) A guide to the range and suitability of electrical energy storage systemsfor various applications and an assessment of possible policy effects, MSc EnvironmentalTechnology Thesis, Imperial College of Science, Technology and Medicine, UK
Grubb M (1991) The Integration of Renewable Energy Sources, Energy Policy, September,670:688
Grubb M with Vigotti R (1997) Renewable Energy Strategies for Europe Volume II:Electricity Systems and Primary Electricity Sources, The Royal Institute of InternationalAffairs Energy and Environmental Programme, Earthscan Publications Ltd, London
Hannah, L. (1979) Electricity before Nationalisation, The Electricity Council, MacmillanPress Ltd, ISBN: 0333220862
Harden F, Bleijs JAM, Jones R, Bromley P and Ruddell AJ (1999) Application of a Power-Controlled Flywheel Drive for Wind Power Conditioning in a Wind/Diesel Power System,Ninth International Conference on Electrical Machines and Drives, conference
UK Electricity Networks, September 2001
Page 90
publication no 468, IEEE
Hart, D. Bauen, A. Leach, M. & Papathanasiou, D. (2000) Decentralised Electricity,Financial Times Energy, ISBN: 1840833696
Hartnell, G (2000) Wind on the System – Grid integration of Wind Power, RenewableEnergy World, James & James (Science Publishers) Ltd, March – April 2000
HC 291 - House of Commons Science and Technology Committee (2000-2001) HC 291Seventh Report – Wave and tidal energy, The Stationery Office Ltd, ISBN: 0102301018
HC334 - House of Commons Environmental Audit Committee (2000-2001) HC334Memoranda – Renewable Energy, The Stationery Office Ltd, ISBN: 010230601X
Hockney RL, Driscoll CA (1997) Powering of Standby Power Supplies Using FlywheelEnergy Storage, INTELEC, pages 105-109
Inenco Group, http://www.inencogroup.com/, accessed on 20/07/01
INNOGY (2001) http://www.innogytech.com/, accessed on 27/05/01
Institut für Solare Energieversorgungstechnik (ISET), http://www.iset.uni-kassel.de/,accessed on 30/05/01
Institute of Energy (2001) Energy World: The magazine of the Institute of Energy,http://www.instenergy.org.uk/
Institution of Electrical Engineers, http://www.iee.org.uk/publish/faraday/faraday1.html,accessed on 09/05/01
International Conference on Electricity Distribution Networks (1999) CIRED PreliminaryReport of Working Group 4, CIRED Conference in Nice – June 1999
International Energy Agency - IEA (2001), Electricity Market Reform: An IEA Handbook,http://www.iea.org/pubs/studies/files/elemar/table2.pdf
International Energy Agency (2001) Key World Energy Statistics,http://www.iea.org/statist/keyworld/keystats.htm, accessed on 25/06/01
3rd Inter-Parliamentary Meeting (2001) Renewable Energy Sources in the EU,http://www.eufores.org/gotland_conclusions.htm
James & James (2001) Guide to Renewable Energy Companies 2001, James & James(Science Publishers) Ltd, ISBN: 1902916263
Jenkins, N. Allan, R. Crossley, P. Kirschen, D & Strbac, G. (2000) Embedded Generation,The Institute of Engineers, Power and Energy Series 31, ISBN: 0852967748
Lancaster University, Department of Sociology,http://www.comp.lancs.ac.uk/sociology/PeterLinks/Survey/sld001.htm, accessed on27/04/01
UK Electricity Networks, September 2001
Page 91
Macleod, C (1997) Learning Paper 5: Interview Studies, The Robert Gordon UniversityAberdeen, School of Public Administration and Law,http://umi.eee.rgu.ac.uk/modules/research/internal/resmeth/rmeth5_1.htm
Millborrow, D (2001) Operation of the UK electricity system with wind energy,unpublished consulation document??
Model T Ford Club (2001) http://www.modelt.org/tquotes.html, accessed on 21/08/01
National Assembly for Wales (2001) Strategic Study of Renewable Energy Resources inWales – Draft Report, http://www.wales.gov.uk/subitradeindustry/content/consultations/renewableresources-e.htm, accessed on 24/05/01
National Grid Company plc (2001) Seven Year Statement,http://www.nationalgrid.com/uk/
National Grid Company plc (2001) Ancillary Services,http://www.nationalgrid.com/uk/activities/mn_ancillary.html, accessed on 22/07/01
National Renewable Energy Laboratory – NREL (2000) Making Connections: Case Studiesof Interconnection Barriers and their Impact on Distributed Power Projects,http://www.nrel.gov/docs/fy00osti/28053.pdf
Northern Ireland Electricity (NIE), http://www.nie.co.uk/, accessed on 08/06/01
OFGEM (2001) Ofgem's Response to the Embedded Generation Working Group Reporton Network Access Issues, http://www.ofgem.gov.uk/docs2001/embeddedresponse.pdf,accessed on 18/05/01
OFGEM (2001) Review of the initial impact of NETA on Smaller Generators -Conclusions Report on Terms of Reference,http://www.ofgem.gov.uk/docs2001/netainitialimpact.pdf, accessed on 18/05/01
OFGEM (2001) Transmission Access and Losses under NETA - A Consultation Document,http://www.ofgem.gov.uk/docs2001/37_trans.pdf, accessed on 24/05/01
OFREG (2001) http://ofreg.nics.gov.uk/, accessed on 18/06/01
Parker, M. (2000) Thatcherism and the Fall of Coal: Politics and Economics of UK Coal1979 – 2000, Oxford University Press, ISBN: 0197300251
Patterson, W. (1999) Transforming Electricity: The coming generation of change, TheRoyal Institute of International Affairs, Earthscan Publications Ltd, ISBN: 185383341X
Ramage, J. (1997) Energy – A Guidebook: 2nd edition, Oxford University Press, Oxford
Robson, C. (1993) Real World Research, Blackwell Publishers Ltd, ISBN: 0631176896
Royal Commission on Environmental Pollution 22nd Report (2000) Energy: the changingclimate,
UK Electricity Networks, September 2001
Page 92
Schoenung, SM et al (1996) Energy storage for a competitive market, Annual Review ofEnergy and the Environment, Volume 21
Scholz Electrical Company, http://www.scholzelectrical.com.au/default.htm, accessed on09/05/01
Science and Public Policy: Journal of the International Science Policy Foundation (2000),Volume 27, Number 3, June 2000
The Education Site, http://www.the-education-site.com/menu.html, accessed on 09/05/01
Thomas Edison’s homepage, http://www.thomasedison.com/, accessed on 10/05/01
TXU Europe website, http://www.txu.com/eu/, accessed on 25/06/01
United Nations Food and Agriculture Organization - UN FAO (1990) The community'stoolbox: The idea, methods and tools for participatory assessment, monitoring andevaluation in community forestry,http://www.fao.org/docrep/x5307e/x5307e00.htm#Contents, accessed on 27/04/01
University of British Colombia , The School of Library, Archival and Information Studies,http://www.slais.ubc.ca/resources/research_methods/interviews.htm, accessed on10/05/01
US Department of Energy – Distributed Power Program,http://www.eren.doe.gov/distributedpower/, accessed on 25/06/01
US Department of Energy (2000) Strategic Plan for Distributed Energy Resources,http://www.eren.doe.gov/der/pdfs/derplanfinal.pdf
Waugh D (1994) The Wider World, Thomas Nelson & Sons Ltd
Weinberg C.J (2001) Keeping the Lights On: Sustainable Scenarios for the Future,Renewable Energy World, July to August 2001, James & James (Science Publishers) Ltd
World Energy Council, http://www.worldenergy.org/wec-geis/, accessed on 24/05/01
Yehia E and Karkkainen S (1988) Energy Storage Systems in Developing Countries,Cassell, London, UK
Yorkshire Electricity Group, http://www.yeg.co.uk/welcome01.shtml, accessed on20/07/01
PERSONAL INTERVIEWS
See Annex One for notes of the meetings detailed below.
Tim Green, Electrical Engineering, Imperial College of Science, Technology and Medicine,17 May 2001
Catherine Pearce, Parliamentary Renewable and Sustainable Energy Group (PRASEG), 30
UK Electricity Networks, September 2001
Page 93
May 2001
Chris Hewett, Institute of Public Policy Research (IPPR) – Senior Research FellowSustainability Team, 7 June 2001
Robert Gross, Cabinet Office Performance and Innovation Unit, 8 June 2001
Catherine Mitchell, Cabinet Office Performance and Innovation Unit, 8 June 2001
Arthur Cook, Ofgem – Embedded Generation Co-ordinator, 12 June 2001
Amanda Mcintyre, Ofgem – Head of Renewables and CHP, 12 June 2001
John Scott, Ofgem – Technical Director, 12 June 2001
Stewart Boyle, writer and energy consultant, 13 June 2001
Dr Amal-Lee Amin, DETR/DEFRA – Sustainable Energy Policy Division, 14 June 2001
Anthony White, Schroder Salomon Smith Barney – Managing Director European Utilities,14 June 2001
Lewis Dale, National Grid Company Plc – Regional Strategy Manager, 15 June 2001
Philip Baker, DTI – Head of Electricity Technology, 19 June 2001
Graham Bryce, DTI Energy Policy Directorate – Deputy Director International EnergyMarkets, 19 June 2001
Steve Jacobs, DTI Energy Policy Directorate, 19 June 2001
GROUP REVIEW
The following list details those that attended the Group Review on 19 July 2001 (seeAnnexes Three and Four)
Stewart Boyle Writer and Energy Consultant
Graham Meeks Combined Heat and Power Association
Dr Amal-Lee Amin DEFRA – Sustainable Energy Policy Division
Graham Bryce DTI – Energy Policy Directorate
Phillip Baker DTI – Head of Electricity Technology
Dan Archard Environment Agency – Policy Development Officer
Chris Wakeman GPU Power – DNO
Doug Parr Greenpeace
UK Electricity Networks, September 2001
Page 94
Mathew Leach Imperial College Centre for Energy Policy and Technology (ICCEPT)
Lewis Dale National Grid Company Plc.
John Benson Ofgem
David Cope Parliamentary Office of Science and Technology (POST)
Gary Kass POST
Sarah Pearce POST
Cathie Hill Scottish Power
Rob Shackleton TXU Europe
Mike Kay United Utilities

UK Electricity Networks, September 2001
Page 95
Annex One Summary of Initial Meetings
KEY POINTS FROM PRASEG MEETING ON 8 MAY 2001 – MICHAEL MEACHER
• £260 million expanded support programme for renewables and £100million to be allocated inthe Autumn.
• NETA – needs to be monitored as it appears that it is favouring the larger and verticallyintegrated players. Need for a sub-market for green and renewable producers to keep them wasyfrom the harshness and volatility of NETA?
• Alan Jones – Woking – Embedded generation is a totally different market than that which NETAserves.
MEETING WITH TIM GREEN – ELECTRICAL ENGINEERING @ IC – 17 MAY 2001
• Short to medium term – biggest impact on distribution system relates to the fact that it wasnever constructed and envisaged to have generation within it and for power to come out of it.
• Very little control of generation within distribution systems.• Modest impact on the national grid – potentially helpful in clearing up blockages.• NGC – all about security of supply – particularly under NETA within balancing responsibilities.• National Grid as little more than a reserve facility???• NG – monitoring approx 50 main generating sites and 50 bulk supplies to distribution.• Impact of technology – decision support.• NG – inability to despatch is a big issue – ability to mange balance and reserve has been eroded.
CABINET OFFICE PIU MEETING – CATHERINE MITCHELL AND ROB GROSS – 8 JUNE2001
• PIU – Resource productivity and renewables; energy efficiency and productivity• Timeframe to 2050 – what would the low carbon future look like.• Are 2010 targets going to be met, if not, why not? Etc.• What is the rationale for providing support to renewables when they are not the most cost
effective for reducing carbon emissions?• Concepts regarding the positive externalities of innovation• Foresight scenarios used as basis for assessments.• DNO view on move to active distributed energy systems– too hard and too costly while others
say that it is easy and not too expensive.• Potential big policy concern to MPs – Curbing carbon emissions and climate change while
keeping the lights on.
OFGEM – ARTHUR COOK, JOHN SCOTT, AMANDA MCINTYRE – 12 JUNE 2001
• AC – Embedded Generation Co-ordinator - incentives and price controls, connection chargingmechanisms.
• JS – Technical Director – interested in embedded generation and sees big issues as informationand incentives, quality of supply – voltage, freq, harm and impacts on industrial processes,distribution and transmission impacts.
• Amanda McIntyre – Head of Renewables and CHP – adminsters CCL and compliance with RO,

UK Electricity Networks, September 2001
Page 96
other duties relating to Ofgems Enviro Action Plan.• Ofgem – long term development strategies and consultation with DNOs regarding pseudo SYS.• Overall management of the power system is a key issue made more difficult in an island context.• Synchronisation of generation often taken for granted but needs to be managed by somebody,
even in an islanded network.• Variability is an important issue.• Safety concerns more a distribution issue – currently uni-directional flow BUT two way flow
required to be accommodated.• Transmission network (expensive, only where justified) not as prevelant as distribution networks.• What would be the ultimate decentralised scenario and how would we introduce measures to
counteract problems, demands, etc?
STEWART BOYLE – WRITER AND ENERGY CONSULTANT – 13 JUNE 2001
• Lots of interesting stuff BUT informal chat so didn’t write much down BUT initial feedback ondraft likely to be very useful and gave good contacts.
• Offshore wind is essential component for reaching targets BUT intermittency and transmissionissues. Work has been undertaken into predicting wind from meteorological data. From 18months work already down to 95% predictable for 24 hours ahead THUS how intermittent isintermittent???
• Contact for above: Peter Zacharias – Tel: +49 5617294242; email [email protected]
• BG have identified potential market for 100,000 replacement boilers per annum and are lookingat domestci micro-chp – plug and play systems BUT need easier planning regs, aggregation andnet-metering???
• “Net metering” – allowing customers to offset their electricity consumption originating from thegrid by selling their own generated electricity to the grid for the same price.
• Dan Reicher – previous US assistant secretary of state for energy “small-scale energy systemsneed policy support right now to get fair access to the market at affordable prices” (FT, 10August 2000).
• June 2000 – ABB launched Alternative Energy Solutions, selling its large scale power plantbusiness and concentrating on systems smaller than 10MW. This business strategy – aiming forannual sales of $1bn by 2005 and $2.5bn by 2010 – assumes a move away from thecentralised large scale plant and national grids to a small-scale, local virtual utility systemlinking small industrial and domestic electric and heat plant.
• Net metering – “using the grid as a kind of battery with fair prices in both directions improvesthe economics of small plant” (FT, 10 August 2000).
• Small scale generators selling back to grid + a fee that reflects the costs of the grid,transmission losses, information management, co-ordinating supply and ensuring quality ofsupply????
DETR/DEFRA – DR AMAL-LEE AMIN – 14 JUNE 2001
• Look at Sacramento Municipal Utility District – an interesting case study for decentralised andislanded system.
• Asset based regulation “v” performance based regulation• DETR/DEFRA concerns: Sustainable Energy Policy, lead on CHP and energy efficiency,
embedded generation and longer term efficiency issues, 2010 and beyond.• Renewables obligation is through to 2026.
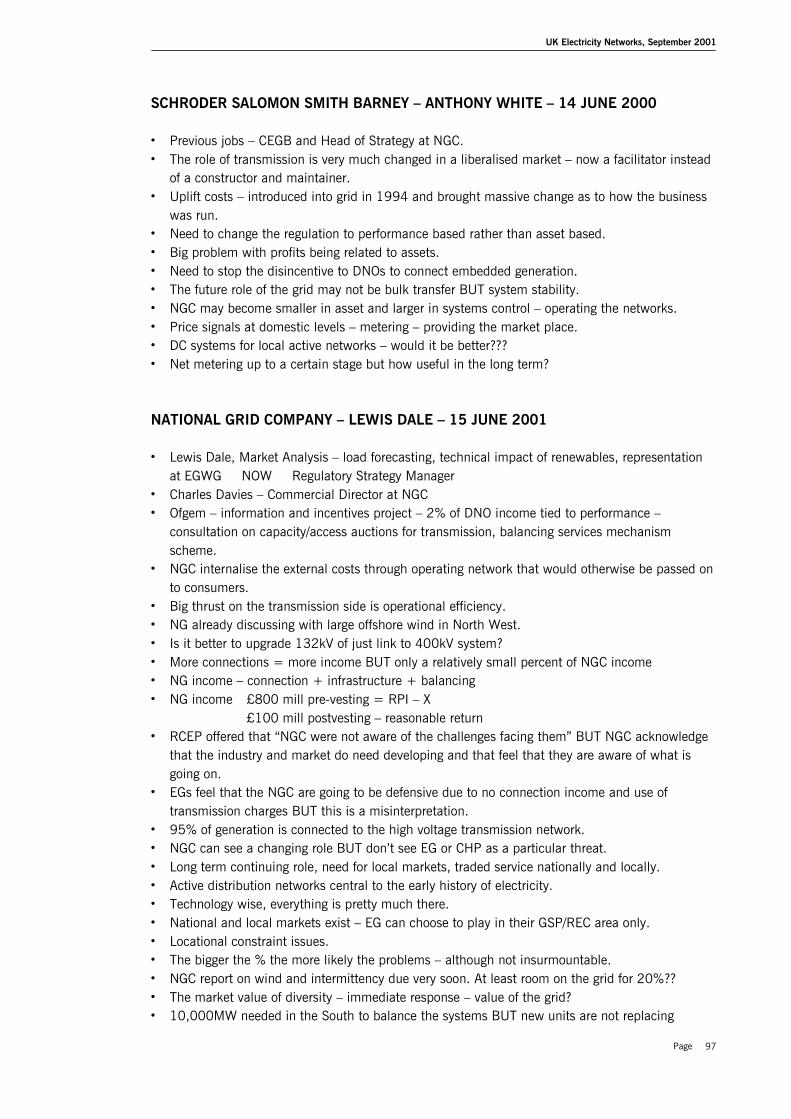
UK Electricity Networks, September 2001
Page 97
SCHRODER SALOMON SMITH BARNEY – ANTHONY WHITE – 14 JUNE 2000
• Previous jobs – CEGB and Head of Strategy at NGC.• The role of transmission is very much changed in a liberalised market – now a facilitator instead
of a constructor and maintainer.• Uplift costs – introduced into grid in 1994 and brought massive change as to how the business
was run.• Need to change the regulation to performance based rather than asset based.• Big problem with profits being related to assets.• Need to stop the disincentive to DNOs to connect embedded generation.• The future role of the grid may not be bulk transfer BUT system stability.• NGC may become smaller in asset and larger in systems control – operating the networks.• Price signals at domestic levels – metering – providing the market place.• DC systems for local active networks – would it be better???• Net metering up to a certain stage but how useful in the long term?
NATIONAL GRID COMPANY – LEWIS DALE – 15 JUNE 2001
• Lewis Dale, Market Analysis – load forecasting, technical impact of renewables, representationat EGWG NOW Regulatory Strategy Manager
• Charles Davies – Commercial Director at NGC• Ofgem – information and incentives project – 2% of DNO income tied to performance –
consultation on capacity/access auctions for transmission, balancing services mechanismscheme.
• NGC internalise the external costs through operating network that would otherwise be passed onto consumers.
• Big thrust on the transmission side is operational efficiency.• NG already discussing with large offshore wind in North West.• Is it better to upgrade 132kV of just link to 400kV system?• More connections = more income BUT only a relatively small percent of NGC income• NG income – connection + infrastructure + balancing• NG income £800 mill pre-vesting = RPI – X
£100 mill postvesting – reasonable return• RCEP offered that “NGC were not aware of the challenges facing them” BUT NGC acknowledge
that the industry and market do need developing and that feel that they are aware of what isgoing on.
• EGs feel that the NGC are going to be defensive due to no connection income and use oftransmission charges BUT this is a misinterpretation.
• 95% of generation is connected to the high voltage transmission network.• NGC can see a changing role BUT don’t see EG or CHP as a particular threat.• Long term continuing role, need for local markets, traded service nationally and locally.• Active distribution networks central to the early history of electricity.• Technology wise, everything is pretty much there.• National and local markets exist – EG can choose to play in their GSP/REC area only.• Locational constraint issues.• The bigger the % the more likely the problems – although not insurmountable.• NGC report on wind and intermittency due very soon. At least room on the grid for 20%??• The market value of diversity – immediate response – value of the grid?• 10,000MW needed in the South to balance the systems BUT new units are not replacing

UK Electricity Networks, September 2001
Page 98
existing Southern plant.• Bulk transfer patterns appear resilient.• If only concerned with diversity – local low voltage transmission may be OK• NGC – “a long term role with new opportunities”• Meeting on 4 July between NGC and RCEP to flesh out 2050 scenarios• NGC issues for the future: will there be nuclear?• Large gas fired plant or micro- CHP, Fuel cell, etc.?• Massive renewables development?• April 2006 – New price control review on Transmission Access – a critical juncture?• 4 technical impacts: intermittency
interfaces – fault levels and controlspotential bulk-transfer reinforcementtechnological change (if not grid connected plant controlling frequencythen whom???)
• More underground cabling in UK for amenity reasons than anywhere else in Europe.• Big potential for improving existing lines – 400kV currently 300% more efficient than at time of
initial construction.• The geographical nature and trends for demand are very important to grid reinforcement.• Forecasts suggest that surplus capacity will widen over the next few years – BUT NETA??• Biggest rise in capacity expected in northern england, while increased demand in the south is
expected to outstrip rises in local generation capacity – bulk power transfers remain.• Extent of over capacity – reduced long and medium term electricity prices?? – slower
development of new plant.SYS forecasts• Peak winter demand increasing by 1.4% annually over next seven years (9.8%) from 53.1GW to
58.6GW• Capacity to rise by 18.8% over next seven years from 67.7GW to 86.5GW• Potential surplus increases from 26.1% to 45% by 2007-08 (24% in 1990 at restructuring)
DTI ENERGY POLICY DIRECTORATE – GRAHAM BRYCE, PHILLIP BAKER AND STEVEJACOBS - 19 JUNE 2001
• Finland system operator – VVR have done a lot of work into intermittency and transmission.• Neta and the balancing mechanism are unique – only other system with self-dispatch is
Nordpool.• Before means Electricity pool – NETA IS THE NEW GOD• Going back to the future – system previously had more regional control.• Big jump from merit-order despatch to self-despatching system.• There is no capacity encouragement in NETA• Must be very careful and clear with definitions – what is the national grid??• Scottish and Southern matters – a very different tpe and way of operating their network.• Frequency balancing – look at Europe with automatic frequency control. Very different in the UK
– impact of intermittency on freq control.• The move to NETA more important than the shift to the pool.• Even under NETA, the NGC has retained the right to force generation should circumstances
dictate BUT not for embedded plant. DNOS may need similar powers.• 1970s – 25% of generating plant was connected to distribution networks.• Development of active systems requires Ofgem and Govt support to reach any degree of
significance in the near to medium term.• Security of supply is a big political and technical issue – already of concernto NGC on a bad

UK Electricity Networks, September 2001
Page 99
winters night.• DNOs love OCGT due to it’s highly controllable nature – CHP less so.• Renewables Obligation – level of buy out price may well decide whether targets will be met.• Suppliers deal with uncertainty as well as generators.• Key stakeholders – Network operators – generators – suppliers – consumers• Net metering – a misnomer often used by people who don’t understand. The tariff level is the
most important factor for domestic feeds into grid. Although a number of potential methods,must ensure that domestic generators get paid – a big debate in itself hidden behind a simplifiesterm.
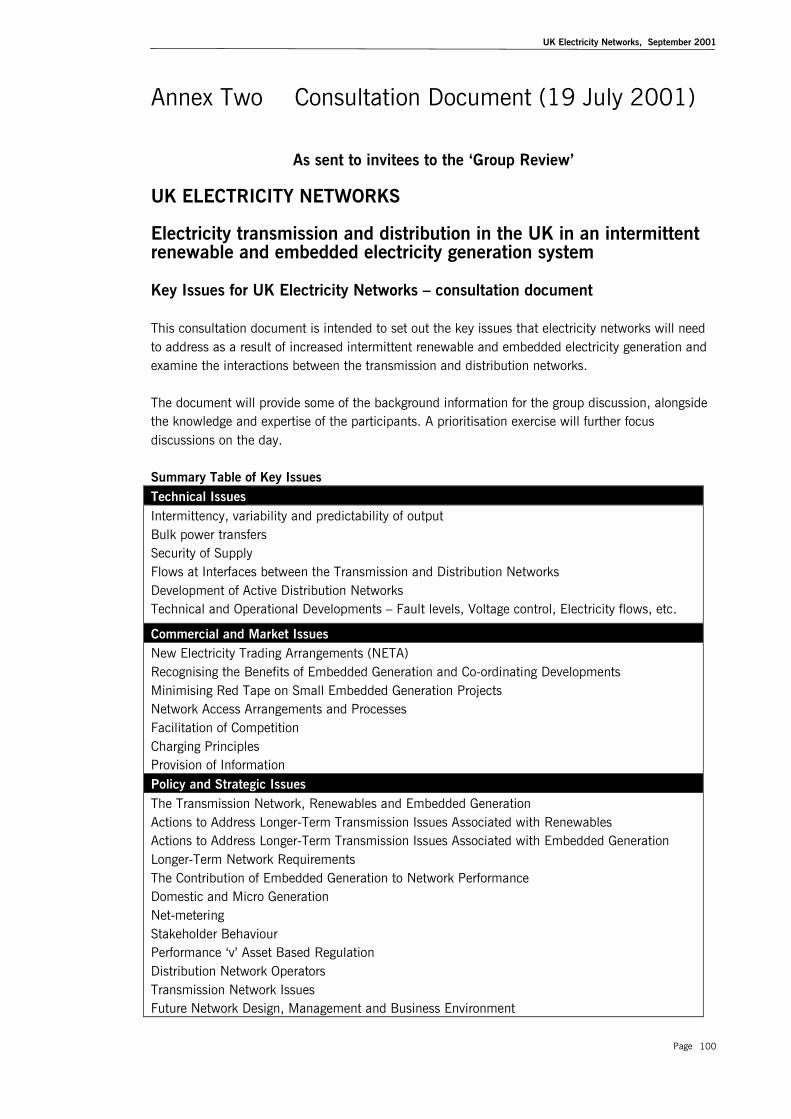
UK Electricity Networks, September 2001
Page 100
Annex Two Consultation Document (19 July 2001)
As sent to invitees to the ‘Group Review’
UK ELECTRICITY NETWORKS
Electricity transmission and distribution in the UK in an intermittentrenewable and embedded electricity generation system
Key Issues for UK Electricity Networks – consultation document
This consultation document is intended to set out the key issues that electricity networks will needto address as a result of increased intermittent renewable and embedded electricity generation andexamine the interactions between the transmission and distribution networks.
The document will provide some of the background information for the group discussion, alongsidethe knowledge and expertise of the participants. A prioritisation exercise will further focusdiscussions on the day.
Summary Table of Key IssuesTechnical IssuesIntermittency, variability and predictability of outputBulk power transfersSecurity of SupplyFlows at Interfaces between the Transmission and Distribution NetworksDevelopment of Active Distribution NetworksTechnical and Operational Developments – Fault levels, Voltage control, Electricity flows, etc.
Commercial and Market IssuesNew Electricity Trading Arrangements (NETA)Recognising the Benefits of Embedded Generation and Co-ordinating DevelopmentsMinimising Red Tape on Small Embedded Generation ProjectsNetwork Access Arrangements and ProcessesFacilitation of CompetitionCharging PrinciplesProvision of InformationPolicy and Strategic IssuesThe Transmission Network, Renewables and Embedded GenerationActions to Address Longer-Term Transmission Issues Associated with RenewablesActions to Address Longer-Term Transmission Issues Associated with Embedded GenerationLonger-Term Network RequirementsThe Contribution of Embedded Generation to Network PerformanceDomestic and Micro GenerationNet-meteringStakeholder BehaviourPerformance ‘v’ Asset Based RegulationDistribution Network OperatorsTransmission Network IssuesFuture Network Design, Management and Business Environment
UK Electricity Networks, September 2001
Page 101
The views of the transmission network owner and operator, the National Grid Company (NGC), aspresented to Parliamentary Select Committees and in their ‘Seven Year Statement’ will behighlighted. Also, the work and recommendations of the DTI/Ofgem Embedded Generation WorkingGroup (EGWG) will be reviewed. EGWG comprised representatives from key stakeholders concernedwith embedded generation and access to distribution networks and included embedded generators,DNOs, NGC, suppliers, small and large consumers, the Energy Savings Trust, Ofgem, DETR and theDTI.
The key issues will then be regarded in relation to technical, commercial and market, and policyand strategic concerns.
Interactions between the transmission and distribution networksA number of issues pertaining to the interactions between transmission and distribution networkswill arise as the contribution of embedded and intermittent renewables increase. It is thus importantthat the impacts of increased embedded generation on transmission and distribution networks inthe UK are not viewed in isolation.
The bulk of new renewable energy and CHP plant needed to meet the Government's targets willlikely be of small capacity. Although such generating plant may find it most cost-effective to connectto lower voltage distribution networks, the trend towards having a larger proportion of embeddedgeneration will interact with the high voltage transmission network in a number of respects. The linkbetween transmission, distribution and embedded generation is exemplified by the NGC treatingnew embedded generation capacity as negative demand on the transmission system for networkplanning purposes (NGC SYS, 2001).
The Transmission Network and the National Grid Company’s (NGC) PerspectiveIn the near term, the 10% renewables and 10 GWe CHP targets set by the Government for 2010appear likely to have a modest impact on the transmission network. Indeed, in some instancesthese targets may prove to be beneficial, e.g. by locating embedded generation plant beyond atransmission-distribution interface nearing full capacity. In evidence to the House of CommonsEnvironmental Audit Committee, NGC stated that “for transmission, we do not foresee any specificissues that would impose a barrier to meeting the government's 2010 targets for renewablegeneration” (HC344).
NGC have contributed to the embedded and renewable electricity generation debate throughrepresentation on a number of working groups and advisory panels, including EGWG. NGC has alsopresented evidence over the last couple of years to the House of Lords Select Committee onEuropean Communities report into “Electricity from Renewables”, the House of Commons SelectCommittee on Science and Technology report into “Wave and Tidal Energy” and to the House ofCommons Environmental Audit Committee. Furthermore, embedded and renewable electricitygeneration issues are reported in the National Grid’s annual ‘Seven Year Statement’.
NGC have also highlighted four major technical impacts of current electricity trends and policy:(Personal Consultation, 2001)• Intermittency of renewable and emebedded generation• interfaces – fault levels and controls• potential bulk-transfer reinforcement• technological change (if not grid connected plant controlling frequency then whom?)
Distribution Networks and The Embedded Generation Working Group ReportThe joint Government/Industry Working Group on Embedded Generation Network Access Issues was
UK Electricity Networks, September 2001
Page 102
convened in March 2000 and had a very specific remit to consider:
• Ways of assessing the degree to which distribution network operators (DNOs) facilitatecompetition in generation as well as supply;
• Ensuring that design and operation processes take fully into account the contribution made byembedded plant to the operation of the network;
• The charging regimes employed towards the connection and operation of such plant;• The information provided both with respect to the structure of charges applied to embedded
generators (including micro generators and the use of dual or net metering) and to theopportunities geographically to developers to connect plant; and
• The scope in the longer term to design and operate networks with much higher concentration ofembedded plant.
For the Government’s targets of 10GWe by CHP and 10% contribution to total electricity generationby renewable plant by 2010 to be achieved, distribution networks will have to accommodate farmore embedded plant than is currently the case. Additionally, under the Utilities Act 2000, there isa new duty on DNOs to facilitate competition in generation and supply. The group concluded thatcurrent regulatory framework, financial incentives and network design approaches are not geared tomeeting such objectives.
The group suggested that significant amendment to incentives and other indicators was required,otherwise the targeted expansion of CHP and renewable generation would be restricted. Alignmentof the incentives for all the key stakeholders is required to create the right commercial environmentin which embedded generation can contribute to a stable and secure network whilst ensuring adiversity of fuel supplies in a more environmentally sustainable manner. Only then can the fullpotential for embedded generation be realised.
EGWG identified an extensive range of design, operational, charging and information issuesrequiring amendment, highlighting that short-term action was a real possibility. The group alsoacknowledged that other amendments may require more long-term revisions of the regulatoryregime, design and operational codes and procedures, and in some cases, the legislation. Workneeds to start immediately in view of the next distribution price control review in 2005.Commitment by all the parties to a co-ordinated programme of work is essential. In particular, clearstatements of intent by Government and Ofgem are critical to the success of the programme and forincentivising DNO action.
The group stated that “many recommendations will require significant changes in approach fromDNOs, Ofgem and embedded generators themselves” (DTI-EGWG, 2000). It also acknowledgedthat the quick implementation of changes may result in extra costs. “The implications of this forcompanies and customers will have to be balanced against the benefits of embedded generation”(DTI – EGWG, 2001).
The EGWG report detailed two main recommendations:
Recommendation 1
“Ofgem should review the structure of regulatory incentives on DNOs in the light of the newstatutory duty on DNOs to facilitate competition, - in particular to assess the effect this newframework will have on all the stakeholders including DNOs, Generators, Customers and Suppliers”(EGWG, 2001)
UK Electricity Networks, September 2001
Page 103
EGWG acknowledged that such a fundamental review would only be practicable at the next pricecontrol review in 2005. But, it suggested that some changes were feasible within the framework ofthe present price control structure and a co-ordinated and managed programme of work needed tobegin immediately under Ofgem leadership to:
• Construct a charging regime for embedded generators that fully reflects the DNOs duty tofacilitate competition in generation as well as in supply. Ofgem, DNOs and embedded generatorsneed to address the financial implications of adopting shallower charges for connection ofembedded plant in advance of the next price control review.
• Review and prepare guidance to allow DNOs to interpret design and operational codes to fullyaccount for the contribution of embedded generation to network performance. Such guidanceneeds to be closely followed by a more thorough review of the codes and of the governancearrangements for distribution networks.
• Establish more consistent provision of information by DNOs to developers of embeddedgeneration and demand.
Recommendation 2
“A Group should be established under Government leadership to co-ordinate and take forward theimplementation of the present Group’s recommendations for the longer term” (DTI-EGWG, 2001).
The EGWG highlighted that their recommendations needed to be initiated immediately because“without the changes recommended in this report, it is unlikely that the level of embeddedgeneration envisaged by the Government will be accommodated on distribution networks” (DTI-EGWG, 2001). The final caveat of the EGWG was that it was essential that solutions be equitableto all players, not imposing excessive costs on customers and preserving security of supply.
Key Issues – Technical
Intermittent, Variable and Predictable OutputSeveral of the promising embedded and renewable energy technologies, e.g. wind and solar, raiseissues relating to the intermittent and variable nature of their output, suggesting that electricity fromsuch sources can not be guaranteed.
The greater the contribution of intermittent generation sources to total supply, the greater the effectsof intermittency will be. A minority share of intermittent and variable generation should not be asignificant technical constraint. The problems provided by high levels of intermittent contributionmay be counteracted by the introduction of reserve generation and/or electricity storage.
Variation in the location of plant is another important factor. A large network of geographicallydiverse wind turbines, e.g. 10 MW of capacity, would dramatically improve the predictability andreliability of output. Estimates suggest that a separation of between 5km and 10km for two windturbines is enough for their output to be treated as independent (Grubb, 1991).
Intermittency should not be confused with unpredictability. For example, tidal electricity generationmay be intermittent but is very predictable. Wind is a likely essential component for reaching bothrenewables and CO2 reduction targets, yet is an intermittent source of electricity. Studies usingmeteorological data have been undertaken into predicting wind generation output. After 18 monthsresearch, 95% predictability for output 24 hours ahead has been reported with suggested furthergains to come (ISET, 2001). An imminent NGC report on wind generation and intermittency hasconcluded that, subject to the variety in location of turbines, there is room on transmission system

UK Electricity Networks, September 2001
Page 104
for 20% contribution by wind without significant technical impact. This may challange the view ofwind electricity generation being beset by intermittent output problems.
Intermittent and variable output must also be considered in relation to the role the generationsource is providing. Intermittent and variable generation sources may not be best suited as base-load plant, contributing more to ancillary services, peak demand and seasonal variations, e.g.higher demand for electricity in the winter when the wind speed tends to be higher. Alternatively,the right mix and location of intermittent and variable output, alongside appropriate aggregation,may provide opportunities for the provision of base-load output. Certain renewable energy sourcesshow a degree of inverse correlation that may help flatten and ease the predictability of output, e.g.low winds on sunny days and high winds on overcast days.
Studies as to the ability of the existing UK networks to accommodate variable wind generationsuggests that up to a one third contribution is achievable (Grubb, 1991).
reliability of existing plant – psuedo-intermittency already factored into the system.
Bulk Power TransfersReduced electricity flows from the transmission to distribution networks as a result of increasedpenetration of embedded generation development will not necessarily result in a correspondingreduction in the bulk transfers across the transmission network. Bulk transfers are more dependenton the relationship between geographical location of generation and geographic patterns of demand.
Existing patterns of generation and demand produce a north to south power transfer across thetransmission network of up to 10,000MW (NGC, 2001). This pattern represents the excessgeneration capacity located in the north (near coal and gas fuel supplies) relative to demand in thatarea. Thus, this excess capacity is exported to meet demand in the south. Such bulk transferpatterns are evident throughout the year. As demand reduces against the annual peak, it tends tobe the output of the more expensive generation units in the south that are switched off first.
These bulk transfer patterns indicate that new embedded generation units in the north may onlyserve to displace higher cost generation in the south. This would result in increased bulk systemtransfers in the same way as new transmission system connected generation in the north. Newembedded generation in the south may likely displace older and expensive southern generationleaving north to south bulk power flows unchanged.
NGC suggest for these reasons, bulk transfers on the transmission system are likely to continue.This situation will remain until such a time that there is a significant shift towards an improvedregional balance between demand and generation, whether embedded or directly connected to thetransmission network. Taking the existing situation, such a shift will require a significant increase ingeneration in the south.
Charges for use of the transmission system have been structured to provide incentives for generationusing the transmission system to locate in the south of the country. Embedded generators are notliable for these charges and have not received a direct incentive to locate in the south. But,embedded generators may enable suppliers to avoid payments of transmission demand-related useof system charges. Such charges are higher in the south than in the north, thus offering an indirectincentive for embedded generators to locate in the south. Despite such incentives, generationcontinues to locate in the north.
In addition, the remote and low demand locations of many of the existing renewable energy

UK Electricity Networks, September 2001
Page 105
technologies, e.g. biomass in the countryside, offshore and onshore wind in Northern Scotland, etc.,will maintain the need for bulk transfers at high voltages. Indeed, the NGC are already indiscussions with wind developers as to arrangements for transmission connections and charges.
Security of SupplyThe current transmission system contributes to security of supply by ensuring that demand in aspecific part of the country is not solely dependent on the availability of generating plant locatedwithin that area. This allows for the opportunity for any available generation, regardless of location,to be utilised to meet demand. The transmission system therefore may continue to play an integralrole in the future electricity system, even with higher penetration of renewables, CHP andembedded generation.
Flows at Interfaces between the Transmission and Distribution NetworksIf the expectation is for an increasing proportion of embedded generation, electricity flows from thetransmission to the distribution networks will likely be reduced. This may impact on thetransmission network through delaying the need for network reinforcement, although this is unlikelyto remove the need for the substations/Grid Supply Points at these transmission-distributioninterfaces. Such interfaces may still be required to balance the fluctuation between generation anddemand in specific parts of the distribution network from minute to minute.
There is the potential for embedded generation to contribute to such a level that distributionnetworks may be in a position to export electricity to the transmission system. Grid reinforcementwould only be necessary at appropriate interfaces should the level of exports to the transmissionsystem be at a level that exceeded the existing transmission capacity.
Development of Active Distribution NetworksIn the short to medium term, one of the biggest technical issues facing DNOs relates to thedevelopment of active, rather than passive distribution networks. As steam-based embeddedgeneration has been de-commissioned over the last 25 years, distribution networks have tended tofocus on passively serving demand. DNOs have built and maintained adequate infrastructure inorder to receive power form the transmission network for delivery to customers. The passive natureof distribution networks has been formalised and encouraged through design codes, price controls,incentives and the regulatory environment. The role of the responsive and active management andmatching of demand and generation has been taken by the transmission network operator.
Increased embedded generation would require the active management of distribution networksinvolving a stepped introduction to adapt to new management, technological and administrativedemands. Monitoring and control systems would require development to ensure effectivecommunication and control of fault levels, quality of supply, security of supply and safety aspects.The impacts of shift from uni-directional to bi-directional electricity flow has raised safety concernsand is new territory for many DNOs.
Central to the evolution of active distribution networks remains the market mechanisms andregulatory environment in which DNOs operate. At the distribution level, connection agreementsand contractual frameworks need to ensure equitable treatment of embedded generation and centralgeneration alike.
As networks are designed with a view to increasingly integrating embedded generation, so thedegree and benefits of active management will increase. The DNOs approaches to addressing theshift towards active distribution networks have tended to play up the costs and technologicallimitations. In the 1970s, a significant amount (approximately 25% compared to 5% in 2000) of
UK Electricity Networks, September 2001
Page 106
generating capacity was connected to distribution networks. However, the recent history ofinterlinked active distribution networks appears to have been easily forgotten. A shift to activedistribution systems would be more back to the future than a new age, but their development wouldlikely require Ofgem and Government support to reach any degree of significance in the near tomedium term.
Technical and Operational DevelopmentsThe increased presence of embedded generation in distribution networks has technical implicationsin four key areas:
• Fault levels – Connecting embedded generation in urban areas may increase existing fault levelsabove plant capabilities.
• Voltage control – Connecting embedded generation to rural 11kV circuits may increase voltagesabove statutory limits.
• Electricity flows – Connecting inappropriately sized generation may cause flows to exceed plantcapabilities and/or adversely affect network losses.
• Network security - Existing methods for connecting embedded generation ensure maintenance ofthe security of the overall network. But, this is at a significant cost to developers. Managing thenetwork differently may offer opportunities for amending the methods and recognise thatoperation of embedded generation in island mode could bring security benefits under outageconditions.
Key Issues – Commercial and Market
New Electricity Trading Arrangements (NETA)The immediate impacts of the introduction of NETA on embedded and renewable generation havebeen widely debated and will be central to a report to be produced by Ofgem and DTI in August2001. To summarise the debate, NETA’s Balancing and Settlement Code places penalties onsuppliers for failing to match their contracted levels of output, either above or below. Generatorsthat are ‘out of balance’ are required to ‘top-up’ or ‘spill’ via the Balancing Mechanism and aresubject to penalty charges. This clearly impacts on generators who might have difficulty inaccurately controlling and predicting output, such as renewable and embedded generators.
In relation to the transmission network, the role of the NGC is more focussed on security of supplywithin their system balancing responsibilities. The role of transmission is very much changed in theliberalised market, now more a facilitator than a constructor or maintainer of the network.
Recognising the Benefits of Embedded Generation and Co-ordinating DevelopmentsThe Transmission Network Use of System charging procedures provide locational signals as to themost economic areas for development from a transmission system point of view. Embeddedgenerators may also receive the benefit of the avoided demand charges when meeting demand oflocal suppliers, such benefits being of higher value in the south of the country.
The potential for improving the economic efficiency of locational signals is currently beingundertaken as part of a wider review of transmission access arrangements currently led by Ofgem.
Minimising Red Tape on Small Embedded Generation ProjectsEmbedded generators seek as simple contractual arrangements as possible. The existingarrangements often require embedded generators to enter into contractual relationships with boththe NGC and DNOs. The EGWG report highlighted the need for NGC to adapt their contractualagreements with DNOs so that embedded generators may choose to have a single point of contact
UK Electricity Networks, September 2001
Page 107
with their host DNO, any choose whether to enter into agreement with NGC.
Network Access Arrangements and ProcessesThe EGWG report highlighted the importance of information and transparency in facilitating thedevelopment of embedded generation. Effective information flows, accessible processes for marketentry and transparent terms for connection and use of networks are all key factors. NGC's responsesto such issues include the provision of information on system opportunities through its annual SevenYear Statement, policies on connection and use of system charging, and general approaches tofacilitating new market entrants. These were cited by the EGWG as good practice and worthy ofconsideration for addressing the issues that are emerging at the distribution level with respect toembedded generation.
Facilitation of CompetitionThe Utilities Act 2000 requires DNOs to facilitate competition in electricity generation and supply.Effective information flows, clear market entry processes, and equitable transparent terms forconnection and use of the distribution system are central to such a requirement.
The existing regulatory framework does not provide financial or operational benefits to DNOs fromembedded generation. Indeed, embedded generation often results in additional costs to DNOs ratherthan providing business development opportunities. The regulatory environment could be re-structured to allow DNOs to develop their business through increased load connections and collectrevenue through Use of System charges. EGWG recommended that Ofgem should consider whatregulatory changes are needed to provide such incentives by January 2002.
Charging PrinciplesAt present, generator customers incur ‘deep’ connection charges. Such charges include the costs ofthe direct connection and any associated costs of reinforcing the distribution network as far as thelocal grid supply point. In comparison, demand customers pay relatively shallow (‘shallowish’)connection charges along with Distribution Use of System (DUoS) charges.
The current arrangements may present a significant financial barrier to the connection of newgeneration. A generator may only need a portion of the capability of the minimum reinforcement forwhich it must pay. This produces clear inequities between primary and secondary generatorconnections. EGWG suggested that a move towards sharing more of the benefits with others, suchas existing and future customers and future embedded generators is required.
The duty on DNOs to facilitate competition in generation may require move away from the currentcharging arrangements; significant amendments may be needed to the way in which DNOs chargefor the connection to and use of distribution networks. A number of charging options exist andinclude:
• ‘Shallow’ charges, whereby the generator pays only for the connection to the distributionnetwork at the nearest suitable point at an appropriate . Such charges are similar to connectioncharges applied to generators connecting to the transmission network.
• ‘Shallowish’ charges, whereby the generator pays connection as above plus any reinforcementtriggered by the connection to the distribution network at the same voltage as the connectionand one voltage level above that of the connection. This structure is analogous to the connectioncharges applied to load customers connecting to distribution networks.
The introduction of ‘shallow’ and ‘shallowish’ charges would reduce the capital cost incurred andencourage additional connections of embedded plant. EGWG acknowledged that ‘shallow’ charges

UK Electricity Networks, September 2001
Page 108
would likely to be more effective than ‘shallowish’ charges in this respect.
An important consideration is the potential weakening of locational signals that are present in theexisting ’deep’ charging structure. ‘Shallow’ charging provides no locational signal whereas’shallowish’ charges may place significant costs on other users. But, various charges betweenlocations could provide incentives and disincentives to plant location.
The above charging options may require that reinforcement costs be met through other charges.Demand customers could pay all reinforcement costs through increased DuoS charges, althoughsignificant embedded generation would result in significant additional costs and raise inequityconcerns. Generation customers could pay all reinforcement costs for generators through a newgenerator entry charge. Alternatively, load and generation customers could pay reinforcement coststhrough entry and exit charges. Such an option is equitable while providing significantencouragement overall to the connection of new embedded generation. It could also provide thelocational signals to generators and customers lost through a move to a new charging regime.
EGWG highlighted that it was “for Ofgem to consider, in the light of wider Government policyobjectives, to what degree embedded generation should be encouraged through connection chargingpolicies” (DTI – EGWG, 2001). Regardless of any amendments made to the charging regime,analysis and assessment of the potential short and long term impacts of options for changes isrequired. Such analysis should encompass existing embedded generators that have already paiddeep connection charges.
Provision of InformationInformation regarding connection points and the effect of location on likely connection charges iscentral to decisions on the location of embedded plant. Developers of embedded generation havebeen concerned that the information made available to them is erratic, inadequate and overlycomplex.
The Utilities Act 2000 and proposed licence conditions requires DNOs to publish networkdevelopment statements. NGC’s Seven Year Statement is considered to be a valuable source ofinformation about generation opportunities. EGWG identified the critical information required bygeneration developers, analysed cost effective ways of providing such information and establishedminimum standards to which all DNOs might be expected to work in future.
In order to meet the proposed licence requirement on DNOs to publish a network developmentstatement, certain network information needs to be made available. Such a development statementshould inform the market-place, enable developers to identify potential business opportunities, andprovide transparent costs for network connections.
EGWG acknowledged that an appropriate balance between the value and costs of providing theinformation must be established. Comparisons are readily made with the information provided inNGC’s SYS. But, acknowledgement must be given to the relative increased complexity ofdistribution systems, their extensive length, varied voltage levels, dynamic demand profiles andvariety of networks.
A consistent approach across DNOs as to the provision of information and the connectionapplication process would assist embedded generation development. General connection guidelinesfor embedded generation that clarify the roles of developers and DNOs and set standards, both forthe quality of information submitted by developers and the quality of the response from DNOs,would be another encouraging development.

UK Electricity Networks, September 2001
Page 109
Key Issues - Policy and Strategic
The Transmission Network, Renewables and Embedded GenerationIn developing their approach to renewables, CHP and other embedded generation, NGC haveexamined their likely interaction with the transmission network and system operation activities,identifying areas where NGC activities may affect development of such projects. NGC, as part of theEGWG, expressed their willingness to actively work to ensure NGC approaches fit with the actionsand options identified by the group for ensuring that renewables and CHP are treated on anequitable basis relative to other users of distribution and transmission networks.
EGWG identified a number of transmission issues in its report. NGC have expressed in evidenceprovided to the House of Common Environmental Audit Select Committee in May 2001 theirconfidence that transmission related issues will not become a barrier to accommodating the amountof renewables or combined heat and power generation necessary to meet the Government's targets.They further added that, depending on the location and type of technology that penetrates themarket, the transmission network may be able to accommodate a greater proportion of renewables,CHP or other embedded generation than that specified in the 2010 targets.
Actions to Address Longer-Term Transmission Issues Associated with RenewablesFacilitating and encouraging the development of open ancillary service markets may be essential inaddressing longer-term technical issues that may arise from a larger proportion of wind and otherintermittent renewables. The NGC have established arrangements that allow small anddecentralised generators to provide reserve and frequency response through the use of aggregatingagents. The EGWG suggestion that DNOs should facilitate local ancillary service markets is animportant development.
Encouragement should be given to the most cost-effective provision of national frequency controland reserve demand. It follows that this should ensure that additional requirements can be providedin respect of reserve and response that may be made necessary to accommodate large amounts ofintermittent wind generation. They may also allow the displacement of some of the large grid-connected power stations that currently provide these services without any impact on systemsecurity. Local ancillary markets would also provide embedded generation with additional incomestreams.
Actions to Address Longer-Term Transmission Issues Associated with Embedded GenerationIt is essential that the continuing availability of ancillary services in the longer-term is ensured asembedded generators progressively displace present providers. The same aggregator agents asdiscussed above could assist smaller participants to provide such services to the required capacityand levels of dependability. As identified by EGWG, this aggregating role may in future beperformed by DNOs as the facilitator of markets to obtain services directly for the distributionnetwork or to sell on to transmission network.
Longer-Term Network RequirementsCertain technology trends may bring geographical generation and demand patterns into balance. Forinstance, high market penetration levels for fuel cells, micro-CHP and CHP district heating systemswould bring electricity generation adjacent to where it is consumed in all areas of the countrythrough the transmission of their fuel source by the existing by gas pipeline infrastructure.
But, other technologies may maintain or even increase the need for bulk electricity transfers.Renewable energy resources, such as wind and wave power, are most abundant in the north andwest of the country. Rural agricultural or forestry fuel sources will likely be required for biomass
UK Electricity Networks, September 2001
Page 110
power stations. Proposed interconnection expansion may allow access to new hydro, wind andgeothermal resources.
The Contribution of Embedded Generation to Network PerformanceEGWG identified three main areas that required further assessment through a co-ordinatedprogramme of work needed to be put in place by Ofgem. Such a programme should include a cleartimetable for delivery. The three main areas are:
• Design codes - The contribution to network security from embedded generation and the potentialeffects on system performance as experienced by customers need further analysis. In the shortterm, measures under the existing standards require clarification to allow recognition of thecontribution of embedded generation to network security and performance. EGWG attached atarget date of January 2003 to such a review.
• Ancillary services – The ability of embedded generators to provide services to the network, otherthan security, also require review by Ofgem. Such a review should focus on services such asvoltage support; provision or absorption of reactive power, frequency response; reserve and blackstart. This would provide a differentiation between services that could be traded with the NGC orwith others and the local security and system performance concerns of DNOs. Aggregation ofancillary services provided by small independent embedded generation by DNOs or others couldease appropriate trading arrangements with the NGC. EGWG attached a target date of January2003 to such a review.
• Islanded operation - A review of the benefits and disadvantages of allowing embeddedgenerators to operate in islanded mode and supporting local supplies in the event of networkfailure is required. Such an arrangement, albeit on a localised basis, can significantly lower thenumber of customer minutes lost. The maintenance of voltage, frequency and network safetyunder such operating conditions would likely remain with the DNOs and requires consideration.The group recommended a Health and Safety Executive and DTI review of the implications ofconnecting widespread embedded generation for the safety of distribution network operation.With a potential vast number of generators being connected to the system, safeguards areneeded to ensure DNOs can be confident that a particular part of distribution network is ‘dead’in the event of circuit outages.
EGWG offered that Ofgem need to ensure that incentives for DNOs to action the above are in place,assessing the costs and benefits of the changes proposed with a view to making any necessarylicence changes.
Domestic and Micro GenerationMicro generation technology such as Stirling Engine or Fuel Cell based central heating systems andPhotovoltaic (PV) roof systems may have significant implications for the future operation ofdistribution networks. Domestic or micro generation could meet most of a typical householddemand (average of less than 1 kW but can have a peak of around 10 kW). The impact ofwidespread micro CHP or PV systems on the demand and generation profiles of distributionnetworks would be significant.
A distribution network may likely have no net electricity flow over certain times of the day, its rolereduced to balancing the networks and providing the appropriate level of backup capacity andsecurity. Such a development would have implications, not only for DNOs, but for suppliers,generators of all sizes, and the transmission operator.
That said, the development of domestic and micro generation is not without its pitfalls andcomplications. A number of technical and financial decisions will need to be addressed:
UK Electricity Networks, September 2001
Page 111
• Connection charges - simpler and transparent connection and payment structures need to beconsidered for smaller generators. Distributor charging options would need to be established in amanner that is appropriate to micro-scale generation technology.
• Payment mechanisms, via metering, profiles and fixed charges, for use of the distributionsystem, selling exports and buying imported electricity – There is a key requirement to establishpotential costs associated with the metering and charging alternatives including those related toinstallation costs;meter reading cost; developing and implementing new demand profiles fordomestic and micro-scale generation; costs and effects of bi-directional metering (often knownas net metering) solutions; costs of implementing half-hourly metering; and the stranded costs ofexisting metering assets.
Technical requirements for connection to the distribution network that enable parallel operation -Most forms of micro-generation must comply with complex engineering recommendations. Workneeds to be initiated to construct and apply appropriate yet simpler engineering standards. Suchstandards would need to be suitable for mass produced equipment and take fully into accountimportant security and safety issues.
Metering arrangements for measuring the generation output, export to and import from the network- Metering should be economic to install and be linked to tariff arrangements that allow all theparties concerned to measure or estimate with confidence the information they need. Optionsinclude :
• The retention of one way meters linked to demand profile based tariffs that estimates typicalflows in both directions. Although this would minimise installation costs, administration costsmay be high;
• Bi-directional meters that operate with a net energy tariff or a profiled tariff which could estimatetypical energy flows in both directions;.
• Import-export meters that provide measurable information on power flows in both directionsthereby reducing the reliance on estimated demand profiles. Such a meter, alongside supportivelegislation, could allow householder generators to benefit from Renewable ObligationCertificates.
Net-metering“Net metering” – allowing customers to offset their electricity consumption originating from thetransmission and distribution network by selling their own generated electricity to the network forthe same price.
The tariff level is the most important factor for domestic feeds into grid. Although a number ofpotential methods, must ensure that domestic generators get paid – a big debate in itself hiddenbehind a simplified term of ‘net-metering’.
Net metering – “using the grid as a kind of battery with fair prices in both directions improves theeconomics of small plant” (FT, 10 August 2000).
Small scale generators selling back to grid + a fee that reflects the costs of the grid, transmissionlosses, information management, co-ordinating supply and ensuring quality of supply????
Price signals at domestic levels – metering – providing the market place.
Net metering up to a certain stage but how useful in the long term?
UK Electricity Networks, September 2001
Page 112
Stakeholder BehaviourIf Government climate change and energy targets are to be met, the role of embedded generationand demand side management need to be recognised as an integral part of the electricity networkdesign and operation. The potential for varied changes to stakeholder behaviour must beacknowledged. Such stakeholder behaviour may include:
• Amending the present incentives system to one that is neutral towards assets employed oroperating costs and that rewards DNOs on the basis of improved performance. Current DNOincentives focus on the value of capital assets.
• The development, by embedded generators and other stakeholders, of more controllablegeneration, capable of providing integrated voltage control, security, etc.
• The development of tariff and metering arrangements that facilitate active demand andgeneration management.
• NGC adapting its agreements with DNOs to manage the impacts on the transmission systemfrom the connection of a new embedded generator. This would allow an embedded generator tobenefit from having only a single point of contact with its host network operator.
Performance ‘v’ Asset Based RegulationRequirement to change the regulation to performance based rather than asset based?
Linking DNO revenues to performance measures, (customer value through fewer interruptions,stable voltages, speedy response to queries or requests for work or connection, low accident ratesetc) rather than the size of the capital asset base. This would remove the DNO guarantee of a returnon capital investments and incentivise them to reach high levels of performance at lowest cost. Thismay therefore encourage novel forms of system support, including embedded generation providedsuch alternatives were cheaper than infrastructure investments.
Distribution Network OperatorsProvided with suitable incentives, DNOs may invest in their network to augment the potential forembedded generation connection. They could strengthen the network to maintain acceptable faultlevels and increase the scope for connecting new generation. Amending the network’s configurationmay allow more flexible operation of embedded generation under fault conditions. New technologysuch as super conducting fault level limiters, energy storage technologies and householdtechnologies such as energy efficient lighting and appliances, PV, fuel cell, Stirling Engine, etc couldall be encourage by DNOs.
DNOs are ideally placed to manage the commercial and technological shift required to encouragethe expansion of renewable and embedded generation. That said, the right commercial andregulatory frameworks need to be in place to facilitate this.
Transmission Network IssuesThe future role of the grid may not be bulk transfer BUT system stability?
NGC may become smaller in asset and larger in systems control – operating the networks.
NG income – connection + infrastructure + balancing
NG income £800 mill pre-vesting = RPI – X
£100 mill postvesting – reasonable return
UK Electricity Networks, September 2001
Page 113
The market value of diversity – immediate response – value of the grid?
Future Network Design, Management and Business EnvironmentWhen considering the implications of introducing embedded generation into distribution networks,the key issues that arise are :• Possible future changes to regulatory process and incentives• Future treatment of DNO business costs• Lack of incentives to establish a local ‘ancillary’ services market• Treatment of connection charges
The decision whether to facilitate the development of embedded generation by establishing a levelplaying field through regulation or by imposing measures to meet Government targets is animportant one. Revising regulation will impact upon the design and management of distributionnetworks. But, it may not be enough in itself to meet current Government targets for embeddedgeneration within the timescales set.
There are a number of potential scenarios and possibilities for creating the right businessenvironment to encourage new approaches to embedded generation and demand management. Thetwo extremes are the open market environment and the rigid regulatory environment that requiresthe connection of additional embedded generation capacity.
Key characteristics of an open market environment might include: increased certainty of theminimal performance based regulatory system; local ancillary and security services markets;opportunities for increased DNO revenue; and an amended the generator and demand managementconnection charging mechanism.
Key characteristics of a rigid regulatory environment might include: reward schemes for each MW ofrenewable or good quality CHP generation connected; electricity generated or consumption saved.
A market environment that lies between these two extremes is the most likely outcome. DNO andOfgem consultation to develop proposals and construct market mechanisms that will facilitateincreased connection of embedded generation is key to market development.
In addressing such issues, EGWG recommended that Ofgem need to ensure that the regulatoryregime supports and incentivises DNOs to meet their obligations to facilitate competition in supplyand generation. Certain aspects dominate DNO business: regulation and incentives; generationconnection charging principles; and commercial mechanisms to support technical innovation.Ofgem should focus initial efforts on these dominate aspects.
The need for the Government to establish a strategic and co-ordinated approach across allstakeholders to research and development seems clear. Such a group needs to produce long termrecommendations for further action and to assess their potential contribution to the government’stargets and impact on stakeholder businesses.

UK Electricity Networks, September 2001
Page 114
Annex Three Invitation, Attendees List and
Presentation
Invitation to Group Discussion and Review
UK ELECTRICITY NETWORKSElectricity transmission and distribution in the UK in an intermittent renewable and embeddedelectricity generation systemDate: Thursday 19 July 2001Time: 1:45pm to 5pmVenue: Atlee Suite, Portcullis House, Embankment, Westminster
POST is an office of the two Houses of Parliament (Commons and Lords), charged with providingbalanced and objective analysis of science and technology based issues of relevance to Parliament.POST carries out studies in areas such as defence, transport, environment and health as well asscience policy. Drawing on the talents, knowledge and expertise of the science and engineeringcommunity, POST acts as an independent and unbiased source of information. It is politicallyneutral, serves Parliament as a whole and presents analyses and policy options tailored to theparliamentary process.
The purpose of this group discussion and review is to assess the initial draft of the key issueschapter of POST’s report concerning electricity transmission and distribution in the UK in anintermittent renewable and embedded electricity generation system.
The review meeting is also intended to discuss potential recommendations to address the key issuesand to identify areas for further research. The ultimate output of this consultation process will be a4 page parliamentary briefing (distributed to 600+ parliamentarians) and a more detailed report tobe made available on the POST website (http://www.parliament.uk/post/home.htm).
Proposed Timetable
Facilitation will be provided by Stewart Boyle, a writer and energy consultant.
Time Activity Welcome and introductions
2:00pm to 2:25pm Welcome, background and introductory presentation Review of draft chapter detailing key issues
2:25pm to 2:45pm Scope of issues, major omissions, additional concerns not covered, etc. Focussed review of key issues – technical, market and strategic
2:45pm to 3:00pm Prioritisation Exercise3:00pm to 3:40pm Break into groups for focussed discussions3:40pm to 4:00pm Tea and coffee break (continue break-out group discussion?)4:00pm to 4:20pm Continuation of smaller group discussions4:20pm to 4:40pm Mini presentations from the review groups4:40pm to 4:55pm Drawing together of key themes and debates4:55pm to 5:00pm Next steps and closing remarks
UK Electricity Networks, September 2001
Page 115
Attendees list
Facilitator: Stewart Boyle
Name Organisation Confirmed ActualDavid Millborrow British Wind Energy Association � �
Catherine Mitchell Cabinet Office – PIU � �
Graham Meeks Combined Heat and Power Association ? �
Dr Amal-Lee Amin DEFRA – Sustainable Energy Policy Division � �
Graham Bryce DTI – Energy Policy Directorate � �
Phillip Baker DTI – Head of Electricity Technology � �
Steve Jacobs DTI – Energy Policy Directorate ? �
Dan Archard Environment Agency – Policy Development Officer � �
Chris Wakeman GPU Power – DNO � �
Doug Parr Greenpeace � �
Tim Green Imperial College – Electrical Engineering ? �
Mathew Leach ICCEPT � �
David Tolley Innogy � �
Chris Hewett Institute for Public Policy Research (IPPR) � �
Lewis Dale National Grid Company Plc. � �
John Benson Ofgem � �
Dr Ashok Kumar MP Parliamentary Group for Energy Studies � �
David Cope Parliamentary Office of Science and Technology � �
Gary Kass Parliamentary Office of Science and Technology � �
Sarah Pearce Parliamentary Office of Science and Technology � �
Scott Butler Parliamentary Office of Science and Technology � �
Gareth Thomas MP PRASEG � �
Keith Allott Royal Commission on Environmental Pollution ? �
Anthony White Schroder Salomon Smith Barney � �
Cathie Hill Scottish Power � �
Martin Cotterel Sundog Energy � �
Rob Shackleton TXU – Regulation � �
Mike Kay United Utilities � �
Groups for break-out discussions
Strategic Technical MarketDavid Cope – POSTSarah Pearce – POSTSteve Jacobs – DTIMatthew Leach – Imperial CollegeChris Wakeman – GPUDan Archard – Environment AgencyDoug Parr – GreenpeaceDr Ashok Kumar MP – PGES
Gary Kass – POSTPhillip Baker – DTIGraham Meeks - CHPADr Amal-Lee Amin - DEFRATim Green – Imperial CollegeLewis Dale - NGCCathie Hill – Scottish Power
Scott Butler – POSTGraham Bryce – DTIJohn Benson - OfgemGareth Thomas MP – PRASEGMike Kay – United UtilitiesKeith Allott – RCEPRob Shackelton - TXU
Names in bold indicate the chairpersons of the break-out groups.
UK Electricity Networks, September 2001
Page 116
Presentation
Slide 1 Outline of PresentationContext of the ReportPublication and timetablePurpose of the dayTimetable of eventsOutputs of the day
Slide 2 Context of the ReportGovt set targets of 10% renewables and 10 GWe CHP by 2010 and further targets beyond?Other UK responses to global climate change concerns, e.g the Climate Change Levy and theRenewables Obligation.Impact of liberalised electricity markets, technological advance, tighter financial/lending constraints,and increased environmental concernsExpansion of interest in low-capital, small scale, fast revenue generating projects.
Slide 3 Context of the Report cont...How will electricity transmission and distribution networks adapt to these changing circumstances?Will the transmission and distribution networks continue to function as before?Will the transmission system serve as a conduit for transporting electricity between more locallydependent regional grids?Will high-voltage transmission have a role at all?
Slide 4 Publication and timetable4 page Parliamentary Briefing (POST Note) to 600+ interested partiesDetailed Report made available on internetPublished in Autumn 2001Formal launch in Autumn 2001
UK Electricity NetworksGroup Discussion and Review
19 July 2001Portcullis House, Westminster

UK Electricity Networks, September 2001
Page 117
Slide 5 ActivitiesScope of issues, major omissions, additional concerns not covered, etc.Prioritisation exercise (Stewart Boyle)Focussed Group DiscussionsPresentation of Group Discussion OutputsDrawing together of key themes/debatesNext steps and closing remarks
Slide 6 Outputs of the DayHighlight factual errors and omissions from the consultation documentsEncourage open debate concerning key issuesGenerate a consensus as to critical areas/issues that need addressingFocus further researchFoster ongoing collaborative relationships
UK Electricity Networks, September 2001
Page 118
Annex Four Outputs from Group Discussion and
Review
UK ELECTRICITY NETWORKSElectricity transmission and distribution in the UK in an intermittent renewable and embeddedelectricity generation system
GROUP DISCUSSION AND REVIEWDate: Thursday 19 July 2001Time: 1:45pm to 5pmVenue: Atlee Suite, Portcullis House, Embankment, Westminster
INITIAL POINTS - ROUND TABLE• General feeling around the table that the identification of key issues captured most of the salient
points.• Must be aware of the target audience, particularly in respect of the longer document.• Long term of decentralised energy – need to move away from the short-term perspective to really
looking at 2010 and beyond.• The move towards a decentralised and disaggregated energy system appears inevitable.• 2010 targets may mean up to 16GW of embedded generation – the interfaces between
transmission and distribution, aggregation of generation and micro-generation are very important• Regulatory incentives are the key – liberalisation broke the momentum of the large-scale
centrally planned industry and increased the transparency of the ESI, thus highlighting structuralproblems
• Decentralised electricity systems are central to the sustainable energy vision.• Clear need to prioritise issues –how do DNOs charge for services? Distribution network charging
structures are critical• What will networks do and be like in the future and how do we charge for it?• Investment and skills implications – regulation needs to reflect this and DNOs need a way out of
the RPI-X straightjacket.• First steps are very important in order to smooth the transition rather than laying a number of
barriers that required to be breached.
PRIORITISATION EXERCISEIn expanding initial discussions, the group highlighted the following as being priorities for action:
Market• Need to recognise the true value of embedded generation (renewable and CHP) and regulation
must reward this value.• Renewable and embedded generation targets can not be met by edict alone, and require
appropriate support, incentives and regulatory frameworks.• The current market appears unlikely to be capable of meeting renewable and CHP targets. Thus,
there is a need to intervene in the market to encourage generation, transmission anddistribution. Likely to need more than just a level playing field to meet the targets and to getDNOs renewable and embedded friendly.
• Impacts of NETA on small generators is of great concern.• Distributed energy will never be properly valued unless the value of the power being provided is
truly charged to the customer.

UK Electricity Networks, September 2001
Page 119
Technical• Dispersed wind may resolve intermittency BUT what impact in a decentralised market – Need
for wind co-operative?• Human Resources issues – appropriate staffing levels and available technical skills• The microprocessor as the driver for a sophisticated decentralised control system.
Strategic• There is a need for industry and government to accept that there are diffuse arrangements of
decision making. At present distribution networks are on the whole, simple and passive. Theneed for clearer price structures and signals to drive change is evident. In the short to mediumterm, embedded generation may be viewed as negative load on the networks.
• Certainty of regulatory regime is critical. The price control every 5 years gives a short-termoutlook for long-term asset/investment decisions. Long term network designs “v” short termgeneration transitions. One of the characteristics of decentralisation electricity s that it doesn’trequire long term planning and have the attached worries of sinking big assets.
• Transmission and distribution networks = 60 year investment/infrastructure decisions “v” shortterm transitional generation markets – How do you match the two????
• Need for sharing/pooling of resources across the industry to address key issues• Who decides what needs to be done? – particularly at a technical level. Central control required
to a certain degree – setting of standards, etc.• How do you regulate without knowing what your end goal is – need for a vision taking account
of dichotomy between central planning and liberalised market• Controls of the system – central “v” distributed – virtual networks.• Customer behaviour and protection is very important and must ensure that the lights are kept
on.
BREAK-OUT GROUP DISCUSSIONSThe attendees broke up into smaller discussion groups to focus on key issues under the broadheadings of market, technical and strategic. The break-out groups presented their discussions to thefull group. Summaries of these presentations are provided below:
Market IssuesNETA AND MARKET MECHANISMS• Has moved the goalposts to reflect more the economic benefits of certain types of generation.• NETA does not attempt to address the social and environmental aspects of energy policy• If NETA settles down, it may remain bad for small players but could be good for diverse large
suppliers.• Tweaking the market by government is much more transparent in the liberalised market and
requires or justification.
RECOGNISING THE BENEFITS• Crucial to recognise the benefits of embedded generation to the distribution network in terms of
losses and reduced capital requirements.
RED TAPE• Licence conditions for DNOs to link to NGC, e.g. one point of contact for connection with DNO-
NGC liaison being taken by the DNO.• Could facilitate the aggregator role to be played by DNOs.·• Always need someone to facilitate supply• Need for measures to stimulate aggregation

UK Electricity Networks, September 2001
Page 120
CHARGING• Very complex area but needs to be established and consistent• Congestion charging in Active Distribution Networks – matching of the transmission and
distribution networks to the generation market
NET METERING• Profiling “v” Half hourly metering
INCREASED CONNECTION OF EMBEDDED PLANT• DNOs will do what is asked, provided the correct incentives are in place to motivate.
CERTAINTY AND PROVISION OF INFO• Development of standard framework of charges for connections of less than 50 MW• Provision of information may be less of an issue under a better charging structure.
Technical IssuesINTERMITTENCY• NGC has no issue with 10% wind – can’t verify 20% but do not perceive insurmountable
problems with increased levels of wind.• Predictability as an issue – market responses to lower reliability/capacity security?• Impact of storage – pumped storage, regenerative fuel cells (on generators and aggregators)• The mechanical and electrical inertia of the system will change as intermittent generation
increases.• Intermittency as an element of active management – local ancillary markets, bootstrapping
needs planning.• Geographical distribution of intermittent generation and impacts on local transmission and
distribution network.
BULK TRANSFERS• Mismatch between location of supply (source “v” acceptability) and demand• Balance best resource location and demand location• Impact of the size of generation• Capture all costs – economic, environmental and social• Strategic issues: planning process/community involvement• Potential of increasing the capacity of transmission and distribution networks without new lines
ACTIVE NETWORKS• Relevance of 25% embedded in 1970s? – networks themselves are very different now• Technology gap in using the current network in active mode• Market views self despatch as important• Active management of a distribution network is not necessarily the same as active management
of a transmission network (e.g. Islanding – local and regional)• Investment is needed for the distribution network – via an incremental path NOT a major cash
injection• Who has the incentive to do anything at the moment?• Valuing ancillary services within distribution markets
PLUG AND PLAY• Needs greater emphasis in the report• Standardisation – PV, MicroCHP, etc.• Smarter metering – customer interests, equity/inclusiveness, ESCOs

UK Electricity Networks, September 2001
Page 121
Strategic IssuesVISION• Develop a coherent structure across industry and government to facilitate development• Need to look at the long term (2050) outcomes and regulatory/financial incentives to achieve
them• How can networks develop to allow flexibility?• At what level /scale would the network start to restrict expansion of embedded generation and
renewables?
DIALOGUE• Develop a coherent structure across industry and government to facilitate development• Need to bring network issues into Government policy considerations• Mistrust – everyone should recognise that there are real issues to address• Need to recognise the reality of obstacles, challenges, problems and each others positions
SKILLS AND INNOVATION• Skill shortgaes of great concern• Only 3 or 4 Universities offer power engineering courses• A new system will demand these skills• R&D on networks considerably reduced after privatisation – limited research capacity• How do you provide incentives for technical developments?
REGULATION – CHARGING• Must be designed and structure in order to deliver joined-up policy goals• Uncertainty over future policy/regulatory changes• A 5 year regulatory framework is not appropriate for 40-50 year assets.• Legislation to allow net or dual metering – not in the Utilities Act• Virtual utilities and aggregation (assists competition) + ancillary service provision• Offsetting costs by Network Operator?• Maintaining return on assets within a new regulatory framework?
FINAL COMMENTS OF GROUP• The ESI was restructured to become saleable assets BUT the priorities today seem somewhat
different.• The assets have been sweated BUT what now?• Sea change – Ten year transitions of the ESI?• Big tension between free market principles and the desire for long term planning and co-
ordination• Technical – short term is OK and the lights can be kept on – Long term issues/problems can be
resolved BUT at a cost• Incentives and profits – is RPI – X an appropriate regime for meeting environmental and social
objectives?• The failure to expand embedded generation and renewables may likely be as a result of
regulatory failure NOT technical failure• Applied R&D concerns• Need for real leadership.
UK Electricity Networks, September 2001
Page 122
Annex Five History of Electricity up to 1989
This annex will review key moments in the history of electricity and the Electricity Supply Industry
(ESI) up to 1989. The period post 1989 will be considered in more detail in Chapter 2 and Annex
Six. The work of the electricity pioneers will be examined and the evolution of the ESI will be
overviewed across appropriate time periods. Although the focus will be on the UK, references to
relevant international developments will be made throughout. Perhaps more than any other
industry, the ESI illustrates the colossal impact of technological innovation and economies of large
scale operation on modern economic life. The purpose of this chapter, through summarising the
history of the ESI, is to attempt to serve as the base of knowledge and understanding from which
future developments will arise. However, to quote a pessimistic view, “nations and governments
have never learned anything from history, or acted upon any lessons they might have drawn from it”
(Hegel, 1830).
ANCIENT ORIGINS
Ancient Greece and Thales of Miletus - 7th to 4th century BC
Electrical storms played a significant part in the creation of life on Earth and electricity has been
around as long as the Earth itself. Magnetic and electrical phenomena have been familiar concepts
for centuries. Myth has it that that the word magnet originates from Magnus, the name of a
shepherd boy in ancient Greece whom placed the tip of his staff on a rock while tending his flock on
Mount Ida. The rock exerted such a pull on his staff that he couldn't free it (The Education Site,
2001). However, it is more likely to originate from Magnesia, rocks found in Asia Minor, that are
natural magnets and formed from an iron ore now known as Magnetite. Magnesia were believed to
have great powers, ranging from curing many ailments to attracting lovers.
In the seventh century BC, Thales of Miletus, the Greek philosopher and mathematician, noted that
rubbing the stone amber on cloth would attract light objects, concluding that the amber had
become magnetic. However, he remained troubled by the fact that his rubbed amber could not pick
up metals whereas Magnetite would attract iron without having to be rubbed.
The Chinese and the Arabs - 4th century BC to 1600
Around 376 BC, Haung Ti, a Chinese general, was made aware that, when suspended from a piece
of thread, a piece of Magnetite would align with the direction of the Earth's North and South (Scholz
Electric, 2001). This knowledge was quickly employed to aid his soldiers in finding their way over
the long distances they travelled. The compass was in effect born, although it took until the
thirteenth century for the Chinese to employ the Magnetite compass on board their ships, after
which it was soon adopted by the Arab sailors. Through them, the compass was brought to Europe.

UK Electricity Networks, September 2001
Page 123
1600 TO 1830 - THE ORIGINAL ELECTRICITY PIONEERS
William Gilbert, Otto Von Guericke and Francis Hauksbee
By 1600, the compass was in common use. William Gilbert, the Physician to Queen Elizabeth I,
explored the behaviour of static electricity. Continuing the work and deliberations of Thales, he
realised that a force was created when a piece of amber was rubbed with wool and attracted light
objects. He became aware that Thales had not been able to separate the difference between static
electricity on the amber and magnetism in the Magnetite. He derived the word 'electrica' to refer to
substances that acted like amber from the Latin term electricus, meaning to "produce from amber
by friction." This term has its roots in the Greek term elektor, which means beaming sun (Education
Site, 2001).
After Gilbert’s discovery that a force of electric charge is created by friction of different materials, a
number of further studies were undertaken. In 1660, Otto Von Guericke built the first static
electricity generator. A glass ball was turned by hand and rubbed against a cloth, creating sparks of
static electricity. He also showed that electricity could be transmitted by using a wet string to
conduct electricity several feet.
Research by Francis Hauksbee at the Royal Society in London resulted in the discovery in 1709 of
the effects of putting a small amount of Mercury in the glass of Von Guericke's generator and
evacuating the air from it. When a charge was built up on the ball and then a hand placed onto it,
the glass ball would glow at a brightness sufficient to read by. This effect was similar to the strange
glow seen around ships in electrical storms known as St. Elmo's Fire. Unbeknownst to himself,
Hauksbee had created the Neon Light (Encyclopedia.com, 2001)
Benjamin Franklin
Benjamin Franklin further developed the work of Gilbert and announced in 1747 that this electric
charge exists of two types of electric forces, an attractive force and a repulsive force. He gave the
charges names and symbols, positive (+) and negative (-), to identify the two forces. Franklin
suspected correctly that lightning was an electric current in nature, and that a lightning bolt was
really a spark of electricity. His famous stormy kite flight in June of 1752 led him to develop many
of the terms that we still use today when we discuss electricity - battery, conductor, condenser,
charge, discharge, uncharged, negative, minus, plus, electric shock, and electrician (Franklin
Institute, 2000).
Alessandro Volta
In 1786, Luigi Galvani, an Italian professor of medicine, found that the leg of a dead frog twitched
violently when touched by a metal knife. Galvani proposed that this meant that the muscles of the
frog must contain electricity. By 1792, another Italian scientist, Alessandro Volta, demonstrated
that the main factors in Galvani's discovery were in fact the two different metals - the steel knife

UK Electricity Networks, September 2001
Page 124
and the tin plate upon which the frog was lying. Volta showed that electricity is created when
moisture comes between two different metals. This led him to invent the first electric battery or
primary cell, the voltaic pile, which he made from thin sheets of copper and zinc separated by
paper soaked in salt water.
A new kind of electricity was discovered. Electricity that flowed steadily like a current of water
instead of discharging itself in a single spark or shock. Volta demonstrated that electricity could be
made to travel from one place to another by wire, thereby making an important contribution to the
science of electricity. The unit of electrical potential, the Volt, is named after Volta (Scholz Electric,
2001).
Hans Christian Oersted and Andre Marie Ampere
Volta’s discovery enabled more experiments to be carried out with a reasonably controllable and
sustained flow of electricity. During one experiment in 1820, a Danish Scientist, Hans Christian
Oersted, noticed that a current of electricity would cause a deflection on a compass needle. Oersted
deduced that this was a consequence of the wire’s electric current producing magnetism and
introduced the world to electromagnetism.
Oersted's discovery quickly led to many different ideas and theories about the relationship between
electricity and magnetism. In the same year, a French physicist, Andre Marie Ampere, showed that
two parallel conductors carrying currents travelling in the same direction attract each other and, if
travelling in opposite directions, repel each other. He formulated the laws that govern the
interaction of currents with magnetic fields in a circuit. As a result, the unit of electric current, the
amp, was derived from his name.
Georg Simon Ohm
In 1827, the German physicist, Georg Simon Ohm, discovered one of the most fundamental laws of
current electricity. Ohm closely examined Volta's principle of the electric battery and Ampere’s work
on the relationship of currents in a circuit. He was able to demonstrate from his experiments the
simple relationship between resistance, current and voltage, Ohm's famous law, stating that the
flow of current is directly proportional to voltage and inversely proportional to resistance, allowed
scientists for the first time to work out the amounts of current, voltage and resistance in electric
currents, and the variations of one through changes in the others. Altering circuit components such
as resistances enabled the design of circuits to perform specific functions. This new unit of electrical
resistance, the ohm, was named after him.
1830 to 1880 - THE BIG BREAKTHROUGHS
Michael Faraday
UK Electricity Networks, September 2001
Page 125
The English scientist, Michael Faraday, was enthused by the invention of the electromagnet and
wondered if electricity could produce magnetism, then why couldn't magnetism produce electricity?
In 1831, Faraday found the solution and demonstrated the continual production of electric current
from mechanical induction. Electricity was produced through magnetism by motion, a magnet
moving inside a coil of copper wire creating a tiny electric current to flow through the wire (IEE,
2001). Faraday founded the science of electromagnetism and his discoveries form the basis of the
electrical industry today (IEE, 2001).
Developments occurred at a rapid rate after Faraday's experiments. As a new source of energy,
electricity’s full potential was not realised and the race to develop generators that could be of
industrial use was on.
Primary and secondary cells
Continuing the work undertaken by Volta, in 1836, the Daniell Cell became the first moderately
efficient cell (battery). This was followed by the Leclanche cell in 1866, said to be the forerunner of
the modern dry battery that is used in portable radios today. 1881 saw the introduction of the lead-
acid accumulator (battery) that had the ability to be recharged by the newly developed DC
generator, thus giving a supplementary supply of heavy currents. With this progress the primary
batteries became less important, although remained in use for limited purposes, such as telegraphy.
The lead-acid battery or the secondary cell is still used comprehensively today, for example in motor
vehicles (Scholz Electric, 2001).
The Electric Telegraph and the telephone
The main characteristic of the primary cells, i.e. the provision of a constant source of significant
amounts of electric power at reasonably low voltage, made them an essential component of the
early communications system. Alongside the invention of a practical electromagnet, they opened the
way for development of the electric telegraph and later the telephone. The idea of an electric
telegraph was conceived by an American, Samuel Morse, in 1831. It proved practical in 1837,
when Morse was able to make use of a supply of electricity from batteries alongside the
electromagnet to complete his invention. It was based on the sending of coded messages over wires
by means of electrical impulses. These impulses were identified as means of communication as
dots and dashes and referred to as “Morse Code”. This electric telegraph was the first system of
electrical communication.
By 1875, the Scot Alexander Graham Bell realised that electricity may be utilised for other forms of
communication than Morse Code over telegraph wires. He focussed on acoustics and sound, based
on the principle that if Morse Code created electrical impulses in an electrical circuit, some means
of sound causing vibration in the air could also create electrical impulses in a circuit (Scholz
Electric, 2001). On 7 March 1876, his invention was officially patented and a successful
demonstration was made at an Exhibition Hall in Philadelphia. Although others were working on

UK Electricity Networks, September 2001
Page 126
similar inventions, including Elisha Gray and Thomas Edison, Bell won the day and the honour of
inventing the “electrical speech machine”, more commonly referred to as the telephone.
Electric motors and lighting
Much development work focussed on electric motors and lighting against the strong competition of
the well established steam engines and gas lighting. Claims were made as to the harmful effects of
using electricity; causing headaches, skin disorders and the onset of allergies, much of this negative
feeling originating from the threatened gas and steam industries.
Electric carbon arc lighting had been exhibited in experimental form in 1808 by Sir Humphry
Davey, the British scientist, who demonstrated how electricity can jump across two carbon roads.
Davey used a large battery to provide the heavy current required by the arc lights for his
demonstration as no means of mechanically generating electricity had as yet been developed.
Arc lights worked on the principle that when two carbon rods in a circuit are brought together, an
arc is created. This arc gives off a brilliant incandescence and can be maintained as long as the
rods are just separated and kept mechanically fed. The arc lights took a heavy current from their
battery sources and it was not until around 1860, when adequate generating sources were
available, that practical use was made of them. Arc lights were used mainly for street lighting and
in picture theatres and continued to be used until the early 1900s but were eventually superseded
by the incandescent light.
Private companies, such as Siemens in Germany and Cromptons in Britain, began to be established
to provide electric lighting for streets, theatres and galleries, and to the more avant-garde and
wealthy homes.
The incandescent bulb
Progress continued apace, and after arc lights were put to practical use, efforts were geared towards
further developing lighting technology. Such experiments centred on the development of a universal
light for use in the home or office, rather than just for street lighting. Initially platinum was used for
a filament and enclosed it in a glass bulb. But, it soon burnt out and it was not until 1879 that an
adequate lamp was produced.
In 1879, Thomas Edison in America and Joseph Swan in England simultaneously produced a
carbon filament lamp that provided both brightness and longevity. Edison replaced platinum with a
filament of carbonised bamboo fibre and Swan used a carbon filament, from parchmentised cotton
thread. Edison wanted to bring light into every home and factory and proclaimed the news of this
achievement to the world, patenting his invention on 21 December 1879 (Thomas Edison’s
Homepage, 2001). The impact of the electric lightbulb was substantial, creating the first extensive
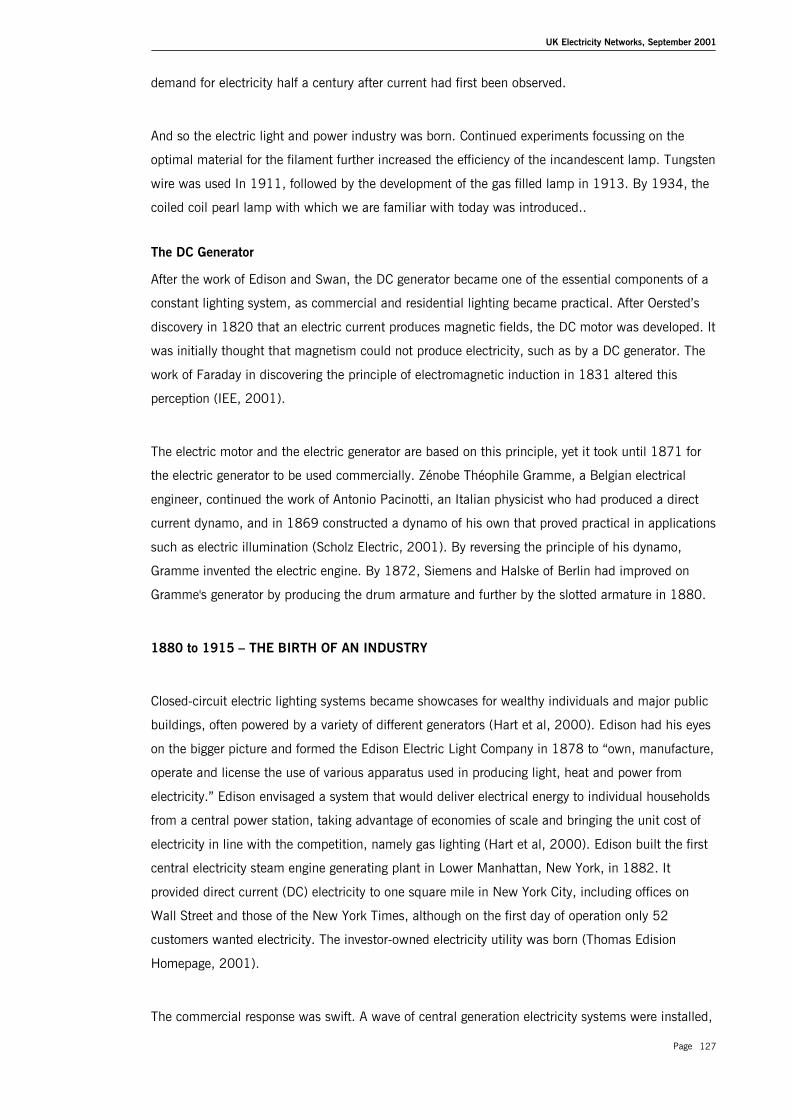
UK Electricity Networks, September 2001
Page 127
demand for electricity half a century after current had first been observed.
And so the electric light and power industry was born. Continued experiments focussing on the
optimal material for the filament further increased the efficiency of the incandescent lamp. Tungsten
wire was used In 1911, followed by the development of the gas filled lamp in 1913. By 1934, the
coiled coil pearl lamp with which we are familiar with today was introduced..
The DC Generator
After the work of Edison and Swan, the DC generator became one of the essential components of a
constant lighting system, as commercial and residential lighting became practical. After Oersted’s
discovery in 1820 that an electric current produces magnetic fields, the DC motor was developed. It
was initially thought that magnetism could not produce electricity, such as by a DC generator. The
work of Faraday in discovering the principle of electromagnetic induction in 1831 altered this
perception (IEE, 2001).
The electric motor and the electric generator are based on this principle, yet it took until 1871 for
the electric generator to be used commercially. Zénobe Théophile Gramme, a Belgian electrical
engineer, continued the work of Antonio Pacinotti, an Italian physicist who had produced a direct
current dynamo, and in 1869 constructed a dynamo of his own that proved practical in applications
such as electric illumination (Scholz Electric, 2001). By reversing the principle of his dynamo,
Gramme invented the electric engine. By 1872, Siemens and Halske of Berlin had improved on
Gramme's generator by producing the drum armature and further by the slotted armature in 1880.
1880 to 1915 – THE BIRTH OF AN INDUSTRY
Closed-circuit electric lighting systems became showcases for wealthy individuals and major public
buildings, often powered by a variety of different generators (Hart et al, 2000). Edison had his eyes
on the bigger picture and formed the Edison Electric Light Company in 1878 to “own, manufacture,
operate and license the use of various apparatus used in producing light, heat and power from
electricity.” Edison envisaged a system that would deliver electrical energy to individual households
from a central power station, taking advantage of economies of scale and bringing the unit cost of
electricity in line with the competition, namely gas lighting (Hart et al, 2000). Edison built the first
central electricity steam engine generating plant in Lower Manhattan, New York, in 1882. It
provided direct current (DC) electricity to one square mile in New York City, including offices on
Wall Street and those of the New York Times, although on the first day of operation only 52
customers wanted electricity. The investor-owned electricity utility was born (Thomas Edision
Homepage, 2001).
The commercial response was swift. A wave of central generation electricity systems were installed,
UK Electricity Networks, September 2001
Page 128
not only be Edison’s companies and licensees, but also by electrical engineers such as Werner Von
Siemens in Germany and Charles Merz of England. Offering electricity from public-supply mains
avoided the high costs of installing individual generators on individual premises, and the first
electricity mini-grids began to develop.
Such projects remained expensive and few people could afford the service, typified by the initial
slow growth rate of privately-run central power stations. Funding from the public purse seemed to
offer the greatest potential, 1889 seeing the first municipal electricity development in Britain at
Bradford (Hart et al, 2000). Industry growth was stimulated by reductions in the overall costs of
production and supply as the scale and number of projects grew.
Transmission and mini-grids
Through the 1880s, mini-grids were established across North America and Europe. These
developments were financed and operated solely by town councils, solely be private enterprise or by
a mixture of the two (Hart etal, 2000). The US model tended towards private ownership and
Germany towards a public and private partnership. Meanwhile, in the UK the constant clashes of
the private sector, local government and Parliament limited initial progress, as fears of the creation
of tyrannical and monopolistic electric lighting companies came to the fore.
Research continued and offered that DC/one way current had it’s limitations in relation to
transmission over long distances. As a DC system expanded with wires extended ever further, the
cost of losses from the wires became prohibitive, likewise the restorative response of using heavier
transmission wires (IEE, 2001). Alternating current (AC) generation, current that surges rapidly
back and forth in the circuit, was the alternative. A device known as a transformer could raise or
lower the voltage of AC electricity as required. As defined in Ohms Law, “in an electric wire carrying
a given amount of power, the higher the voltage the lower the current and therefore the lower the
losses in the wire” (Patterson, 1999). A transformer allows AC voltage to be stepped up, thus
lowering current prior to transmission over the wires. A transformer at the other end of the system
can be used to lower voltage before delivery to end users. In this manner, transmission losses were
significantly reduced, allowing for remote-sited electricity generation, e.g. hydropower.
Although opposed by Edison, one of his employees, Nikola Tesla, an inventor from Croatia, was
working on developing an alternating current induction motor. Tesla discovered the rotating
magnetic field in 1883, the principle of alternating current, that changed in opposite directions fifty
times a second, referred to as 50 Hertz. The alternating current generator has a rotating magnetic
field. Tesla then developed plans for an induction motor, that would become his first step towards
the successful utilisation of alternating current (Scholz Electric, 2000).
In 1885, George Westinghouse, head of the Westinghouse Electric Company and one of Edison’s
UK Electricity Networks, September 2001
Page 129
main competitors, bought the patent rights to Tesla's three-phase system of alternating current. In
1886, the first alternating current power station was placed in operation. Tesla set up his own
laboratory and announced his invention of the AC motor in 1888. Westinghouse then hired Tesla to
sell AC transmission using the AC induction motor across North America. All, bar Edison, agreed
that AC was superior to DC (Thomas Edison Homepage, 2001). Even Edison's Electric Company,
now named General Electric, switched to AC, ousting their founder in the process. All modern day
electric motors such as fans, air conditioners, and refrigerators run on principles established by
Tesla.
The comparable reduction in losses due to the change from DC to AC allowed the electricity system
to cover larger geographical areas. Generation plant need no longer be located close to sources of
demand, bringing into play the possibility of electricity generation from more remote sources, e.g.
hydroelectric power stations., and transportation to clustered demand points. This high voltage
transport of electricity was called “transmission” so as to differentiate it from the lower voltage
“distribution” of electricity direct to users (Patterson, 1999).
Concept of load diversity
Samuel Insull, a contemporary of Edisons, chose not to join the revloution at the General Elctric
Company, rather he decided to focus his attention to utility operations. Insull began to shape and
define important economic concepts that still govern modern utility planning and pricing today.
Insull noted that generating plant had high fixed costs, initial high investment for plant and
distribution, and low operating costs. He offered that having more customers connected to the
system would increased revenues, therby spreading the fixed costs across a wider customer base
(Hart et al, 2000). This would bring costs down, and thus encourage more customers. The
development of the demand meter made it possible for Insull to more accurately price electricty,
setting rates to cover the fixed and variable costs of generation and distribution.
Insull also noted that separate companies often provided electricty for specific purposes only, e.g.
residential lighting, for trams, etc. Demand patterns were clearly identifiable, such as demand for
lighting at night. Generating plant was often idle for significant parts of the day. Simple economic
analysis identified that higher profits were available the longer the plant was in use (Hart et al,
2000). A lower average kWh cost was also possible. Electricity, with the exception of batteries and
pumped hydro and newer technologies such as flywheels and regenysys, cannot be readily stored.
Insull recognised that the key was to find the right mix of customers to utilise the plant for as much
of the day as possible. In order to maximise plants to their fullest, one might factor for the early
morning and late afternoon tram demand peaks, the daytime business demand load and the
evening residential lighting demand patterns, all of which could be provided at cheaper costs by one
continuous generating plant (Hat et al, 2000).
UK Electricity Networks, September 2001
Page 130
The universal system
Those wishing to develop electricity systems now had a choice between DC or AC generation. In the
UK, central-station systems were autonomous and the mains networks began to overlap
geographically with obvious infrastructure inefficiencies. While in the US, differing franchise rights
offered by local municipalities kept the industry fragmented and ineffective. As demand for
electricity increased throughout the 1890s and 1900s, de facto monopolies began to be established
as rival companies competed over unserviced areas rather that duplicating existing systems
(Patterson, 1999). But, industry competition developed as a growing number of companies fought
over the ever-shrinking unserviced areas. A patchwork of different systems across North America
and Europe arose, varying in ownership, financing and technology.
The call for integration between mini-grids became undeniable, the economies of scale for power
generation dictating that fewer and larger power plants would drive down unit costs and make
electricity affordable to increased domestic and industrial users alike. The main technical dispute
was resolved by the introduction of the universal system in 1893 that used AC-DC converters and
transformers. The universal system accepted both AC and DC inputs, transmission was strictly AC,
and delivery to users at either AC or DC as demanded. “The universal system made possible the
interconnection of existing systems and their power stations, permitting amalgamation and steady
expansion of electricity supply over ever wider areas to more and more customers, not only for
lighting but also for electric motors for street railways or trams, and in due course also for stationary
electric motors in factories.” (Patterson, 1999)
As high voltage AC transmission became the norm, hydroelectricity came to the fore and was
tapped wherever possible. Steam powered generation often required the regular delivery of bulk
supplies of coal and emitted smoke, soot and ash over the local environment. Early 20th century
steam powered generators were operating at fuel efficiencies of under 10 per cent (Patterson,
1999). However, the major industrial areas of the UK, Germany, Russia and the USA tended to
have little hydroelectric potential close enough to areas of demand whereas coal was plentiful.
England in the 1880's was the centre of the industrialised world and was powered by large, noisy
and inefficient reciprocating steam engines that had captured the energy of coal and transformed
Britain.
In 1884, Charles Parsons developed the steam driven turbine generator that significantly improved
the efficiency and operation of coal fuelled generating plant. Although comparatively simple in it’s
conception relative to current technology and practices, the fundamentals remain the same. In
steam driven turbine generation, heat is generated by burning fuel such as coal, peat, oil or gas.
This heat is used to convert water to high pressure steam. The steam is then heated again to
increase it's temperature and pressure and is then fed into the turbine. Further efficiency gains were
harvested over the next few decades as the technology was further utilised and developed.
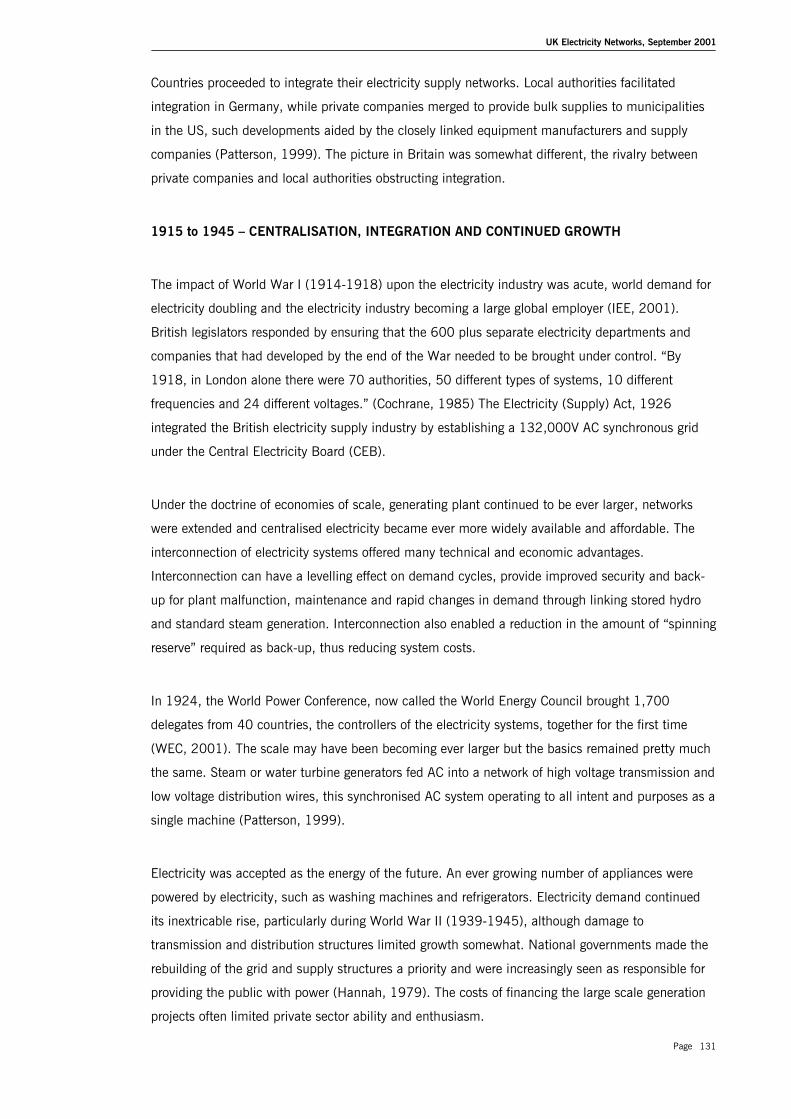
UK Electricity Networks, September 2001
Page 131
Countries proceeded to integrate their electricity supply networks. Local authorities facilitated
integration in Germany, while private companies merged to provide bulk supplies to municipalities
in the US, such developments aided by the closely linked equipment manufacturers and supply
companies (Patterson, 1999). The picture in Britain was somewhat different, the rivalry between
private companies and local authorities obstructing integration.
1915 to 1945 – CENTRALISATION, INTEGRATION AND CONTINUED GROWTH
The impact of World War I (1914-1918) upon the electricity industry was acute, world demand for
electricity doubling and the electricity industry becoming a large global employer (IEE, 2001).
British legislators responded by ensuring that the 600 plus separate electricity departments and
companies that had developed by the end of the War needed to be brought under control. “By
1918, in London alone there were 70 authorities, 50 different types of systems, 10 different
frequencies and 24 different voltages.” (Cochrane, 1985) The Electricity (Supply) Act, 1926
integrated the British electricity supply industry by establishing a 132,000V AC synchronous grid
under the Central Electricity Board (CEB).
Under the doctrine of economies of scale, generating plant continued to be ever larger, networks
were extended and centralised electricity became ever more widely available and affordable. The
interconnection of electricity systems offered many technical and economic advantages.
Interconnection can have a levelling effect on demand cycles, provide improved security and back-
up for plant malfunction, maintenance and rapid changes in demand through linking stored hydro
and standard steam generation. Interconnection also enabled a reduction in the amount of “spinning
reserve” required as back-up, thus reducing system costs.
In 1924, the World Power Conference, now called the World Energy Council brought 1,700
delegates from 40 countries, the controllers of the electricity systems, together for the first time
(WEC, 2001). The scale may have been becoming ever larger but the basics remained pretty much
the same. Steam or water turbine generators fed AC into a network of high voltage transmission and
low voltage distribution wires, this synchronised AC system operating to all intent and purposes as a
single machine (Patterson, 1999).
Electricity was accepted as the energy of the future. An ever growing number of appliances were
powered by electricity, such as washing machines and refrigerators. Electricity demand continued
its inextricable rise, particularly during World War II (1939-1945), although damage to
transmission and distribution structures limited growth somewhat. National governments made the
rebuilding of the grid and supply structures a priority and were increasingly seen as responsible for
providing the public with power (Hannah, 1979). The costs of financing the large scale generation
projects often limited private sector ability and enthusiasm.
UK Electricity Networks, September 2001
Page 132
1945 TO 1985 – CENTRALISATION AND NATIONALISATION
Energy policy agenda
Energy policy can be defined as a means of finding a balance between concerns for security of
supply, economic efficiency, environmental protection and social considerations. Such concern may
often be in conflict and relative views as to the most important may differ with government,
economic cycles and other factors.
Governments took the opportunity to amend administrative and technological systems and to
strengthen the centralised structure of the industry, many going as far as full nationalisation.
Electricity had become a public service, the post-war years seeing the creation of Electricite de
France and Enel of Italy, amongst others (Hart et al, 2000).
In the UK in 1947 and 1948, Clement Atlee’s Labour government under the Electricity Act,
nationalised the electricity supply industry. Prior to this nationalisation, there existed 300 electricity
supply companies with average generating plant capacity of 10 MW. The main goals were the
provision of electricity to all parts of the country and the removal of variations in voltages and price
tariffs. “In England Wales, the drive for equity became particularly prominent following World
War II. Subsequently, socially driven regulation led to the extension of the national grid to rural
areas with little concern of the economic viability of these decisions” (Amin, 2000). The structure
of the nationalised industry in England and Wales was dominated by one large generating and
transmission company, the Central Electricity Generating Board (CEGB), which sold electricity in
bulk to 12 area distribution boards, each of which was obligated to serve a closed supply area or
franchise (Cochrane, 1985). A co-ordinating body, the Electricity Council, dealt with overall policy
matters. In Scotland and Northern Ireland there were vertically integrated boards which also
exercised regional monopolies. This monopolistic system was characterised by centrally planned
investment, an engineering-led approach and a cost-plus pricing mechanism.
The US persisted with its majority private-owned centralised structure, imposing a similar structure
on Germany and Japan in the immediate post-war years. The Soviet Union and Eastern Europe
electricity structures were operated under the central planning system. large power stations being
constructed by the state to drive industrialisation. The post-colonial nations of Latin America, Africa
and Asia tended to adopt the centralised, nationalised structure (Patterson, 1999).
The US post-war consumerism boom has been attached largely to the growth of electrical
appliances available on the market backed by an electricity supply industry geared towards
sustained growth. The period from 1950 to 1960 saw average power station size increase from
30MW to 300MW, the cost of generation and price per unit falling accordingly (Hart et al, 2000).
Central generated electricity had become part of everyday life.

UK Electricity Networks, September 2001
Page 133
The predicted continued growth rates in electricity demand impacted significantly on electricity
system planning and on project finance. With an ever increasing obligation to supply, new power
stations were clearly required and according to the mantra of the day, “the bigger the better.”
Generating technology had developed to include the combustion of oil and natural gas, as well as
coal in steam powered plants operating at fuel efficiencies of around 40 per cent and outputs per
unit of 500 MW. Lack of suitable or a publicly acceptable sites near to areas of demand contributed
to the development of larger and more remote generating plant linked to the ever expanding high
voltage transmission grid.
Nuclear powered electricity generation had also entered the equation, Queen Elizabeth II opening
the world’s first nuclear power station at Calder Hall (now Sellafield) in 1954. Although the early
proponents of nuclear suggested that it would be too cheap to even meter, the initial capital outlay
was huge and much work was needed to be done to bring them the capital costs in line with coal
fired generation. By the 1960s, design improvements appeared to have achieved such cost
reductions and across the world nuclear plant was ordered as a part of the portfolio to meet the
predicted increases in demand (Patterson, 1999).
Excess capacity and the oil crisis
In the US, the impact of prolonged economic growth was increasing inflation and higher interest
rates. The anticipated continuation of the high electricity demand growth patterns of the 1960s
failed to materialise. Generating capacity growth began to outstrip demand increases, some utilities
being left with excess capacity and damaged investor confidence. The consequence was an increase
in residential and industrial electricity prices. In the US, between 1975 and 1985, residential and
industrial electricity prices rose by 13% and 28% in real terms respectively (EIA, 2001).
The OPEC oil embargo of 1973-1974 and subsequent sharp hikes in fossil fuel process, alongside
growing concerns for the environmental impacts of electricity generation led to increased operating
and construction costs of power plant projects across the world. Clean Air legislation had significant
impact on capital, fuel and operating costs and energy conservation legislation encouraged slower
growth in electricity demand (Patterson, 1999). As the security of fossil fuels became a key
concern, many countries responded by undertaking orders to expand the contribution of nuclear
generation. But, the faith in nuclear electricity generation soon diminished as a result of near
disaster at Three Mile Island, Pennsylvania in 1979.
The ESI was having to look at itself in a new light. Its purpose was no longer to simply continue to
provide ever increasing amounts of electricity of cheaper prices. The world beyond the customers
electricity meter was no longer an untouchable and uninspiring domain. Demand-side management
through conservation, advice and better technology, e.g. energy efficient light bulbs, became
essential, particularly in the US for maintaining revenues and profitability (Brooks & Butler, 2001).
UK Electricity Networks, September 2001
Page 134
In response to the oil crises of 1974 and 1979, energy policy in the 1970s was driven by perceived
fossil fuel shortages, the common response in most developed countries being increased state
intervention. For example, the introduction in the US of the Public Utilities Regulatory Policies Act
(PURPA) in 1978 encouraged the development of smaller, non utility power producers through the
elimination of many prohibitive procedural and planning regulations. Many of these independent
power producers initially used renewable energy sources, often wind, although later used natural
gas.
UK - Electricity Act 1983
One of the first acts of electricity reform by the Conservative government elected in 1979 was the
Electricity Act 1983. Similar to legislation passed in the US, the Electricity Act of 1983 was
designed to encourage the growth of independent power producers. It was focussed on removing
barriers to entry to non-utility generators and to provide independent producers of electricity open
access to the national grid., the Act requiring the CEGB to purchase electricity from private
producers at avoided costs, that is, at a price equal to the costs the board would have incurred to
produce the same quantity of electricity itself. Its effects were limited due to the low rates of return
that the CEGB allowed incumbent power producers discouraging new entrants and the failure to
fully remove the unfair access to the grid that incumbent power producers had over new entrants.
The period post 1989 is detailed in Section 2.2 and Annex Six.
UK Electricity Networks, September 2001
Page 135
Annex Six A History of UK Electricity Networks
IntroductionThis appendix will review the origins and history of UK electricity networks from 1920 to thepresent day. The technological, legislative and market developments over this period are highlightedthroughout.
1920s – The Weir Report and the Electricity (Supply) Act 1926In the 1920s, most electricity systems operated independently, meeting all the electricityrequirements in their own area. Operating the system with sufficient capacity to meet the worstcase scenario likely to arise was essential. Each area provider needed to factor in enough reserveplant to provide electricity during maintenance or plant breakdown, leading to 75% more generatingplant throughout the country than was needed to meet the peak demand (Cochrane, 1985).
The government report headed by Lord Weir published in 1925 led to the drafting of the Electricity(Supply) Act, 1926. The Central Electricity Board (CEB) was created and given the job ofinterconnecting the most efficient electricity generating plant by a “national gridiron” of high voltagetransmission lines. Once this transmission network was constructed, the CEB would specify levels ofgeneration to achieve lowest overall costs. The CEB would then purchase electricity output in bulkand sell this back to distribution and supply companies at cost plus appropriate grid constructionand operating costs (Hannah, 1979).
The CEB was also charged with co-ordinating annual overhaul programmes in order to maintain thebest possible availability of generating units and transmission capacity. The inevitable short-termproblems related to plant breakdown and transmission faults were factored into the decision makingprocess.
The fundamental philosophy behind the grid was, not that long distance transmission waseconomic, but rather that intra-regional interconnection of the generating stations in each areawould bring significant economies (Cochrane, 1985). Another rationale for the development of alinked transmission network was concerned with security of supply. If anything were to go wrong ata local power station, the grid would be able to provide supplies from somewhere else. Many criticslabelled the Weir report and the Act as an unprecedented experiment that was likely to have highlydetrimental effects on electricity supply, and would prove cumbersome and unworkable (Cochrane,1985).
Such criticisms were somewhat dismissed by the government, although the dream of electricity forall in England, Scotland and Wales did not start to be realised until the middle of 1928 whenconstruction on a national grid system began. The job of building the national grid was immense,through the design of a complex and resilient electrical system, negotiation of suitable routes,location of generating plant and other factors. Although more expensive than the 33kV or 66kVtransmission options on the table, the decision to transmit at 132kV was justified by cheaper linecosts per unit of power transmitted and by lower losses in transmission at higher voltages (Hannah,1979).
The initial vision of Weir report of a national gridiron was scaled down to a series of networks, eachwith grid and operational control and based on the main industrial areas. Limited capacity nationaltie-ins were factored into the system to allow transference between regions. The six grid areas inEngland and Wales were Newcastle, Leeds, Manchester, Birmingham, Bristol and London, while in

UK Electricity Networks, September 2001
Page 136
Scotland the grid was focussed on the Glasgow area (Cochrane, 1985). Of the existing 438 powerstations, only 140 were deemed to be of a suitable size and efficiency for grid connection (Hannah,1979). By despatching load at grid control centres, in addition to knowing which power stationshad the lowest costs, the CEB developed a wealth of knowledge on the social life and workingroutines of the population they served. In the North West, for example, they learned to start up extragenerators whenever Gracie Fields was due to sing on the radio (Hannah, 1979).
1930 to 1945 – Completion of the National Grid and the Integrated Single NetworkThe development of the 132kV transmission system and the construction of associatedtransformers, switch gear, metering and control apparatus of a type needed to deal with highvoltages required much innovation and technological development. The CEB reported that theconstruction and design of the national grid spurred technological development and thedevelopment of the export business of the UK electrical manufacturing industry (Cochrane, 1985).
The final pylon of the originally planned grid was erected on the outskirts of the New Forest on 5September 1933. The national grid consisted of 4,800 km of 132kV transmission lines, 1,600kmat lower voltages and 237 substations and came into full operation in 1935. The savings impactswere almost immediate. By 1938, £3,25 million was saved on generating costs and reserve plantwas down from 75% to 15%, saving a further £22 million (Cochrane, 1985). The mid-thirties alsosaw the introduction of larger capacity generating stations, such as Battersea in London, withratings of 60MW to 100MW.
The next stage of development for the national grid was based on the premise that if savings werebeing accrued with the grid working as seven independent networks, what savings might beavailable if the system was unified? On 29 October 1937, a grid control engineer decided to testwhether the transmission system could operate as an integrated single system, seemingly withoutthe permission of the appropriate authorities. The integrated system operated perfectly adequately.
Demand estimates in the harsh winter of 1938 highlighted a potential shortfall in generation in thesouth of England. This triggered the decision to run the transmission system as one, co-ordinatedfrom the South East, to take advantage of excess generation from the North. If the measure ofefficient spare capacity planning is that when everything seems to be going wrong supplies can bemaintained, the CEB and the grid had passed the crucial test (Hannah, 1979). Although initiallyintended as a temporary measure until February 1939, the areas have remained connected eversince.
The national grid came to the fore during World War II. People were evacuated from urban areasand the impact on geographical patterns of demand were significant. The CEB responded throughthe construction of over 500 miles of transmission lines by 1942 to transfer electricity from theevacuated urban areas. The national grid enabled the electricity to keep flowing, regardless ofdamage to individual plant in different areas. “During the blackest days of the war, the grid morethan justified its existence and played a large part in keeping the wheels of industry turning”(Cochrane, 1985).
Post World War II years – Nationalisation of the Electricity Supply IndustryThe immediate post WWII years may be best summed up by the words of the then UK PrimeMinister, Clement Atlee. “You cant fight a war and scrape the bottom of the barrel, throwing ineverything you’ve got, and then start up again as if nothing has happened.” The ESI was far fromimmune to the hardships of post-war Britain, particularly affected by reduced stocks of coal, themost significant fuel source for electricity generation at the time.
UK Electricity Networks, September 2001
Page 137
Atlee’s Labour Government response was to nationalise the ESI in 1947. The British ElectricityAuthority (BEA) was created, effectively becoming the manufacturers and wholesalers of the ESI ingenerating and transmitting electricity via the grid to large substations/bulk supply points. Twelvearea distribution boards were the retailers of the ESI, purchasing in bulk from the BEA fordistribution to the homes, shops, factories and other electricity users (Hannah, 1979).
1950s – Grid expansion, the CEGB and InterconnectionThe grid network was expanded, construction beginning in 1950 on a 275kV supergrid with theability to be upgraded to 400kV in the future. The new pylons were twice the size of the existing132kV ones. There can be few people who think that a series of large metal structures supporting anetwork of cables actually improves the landscape, and from the very start of the grid’s constructionthe impact of the thousand of miles of obtrusive transmission lines has been the subject of publicdisquiet and environmental concern. The proposed expansion triggered much protest from groupsconcerned with environment and landscape protection. More restrictive Town & Country PlanningRegulations and the development of National Parks, Areas of National Beauty and Sites of SpecificScientific Interest also complicated the routing of new transmission lines.
The Electricity Act (1957) created the Central Electricity Generating Board (CEGB). The CEGB’soften contradictory charge was to provide “an efficient, co-ordinated and economical supply ofelectricity in England & Wales… …with regard for the preservation of amenity, ranging from thenatural beauty of the countryside to objects of architectural or historic interest” (Cochrane, 1985).
The economic impacts of 275kV supergrid were significant. Reduced losses in higher voltagetransmission meant that it had become cheaper to transport electricity than coal. New generatingstations, rather than being built close to areas of demand, began to be constructed near to fuelsources. Coal powered units with capacities of 2000MW and above were constructed in theMidlands and North East England to serve the growing demand in the South. 1985 figures showthat there was an 8,000MW to 9,000MW average daily feed from the coal fired generating units inthe Midlands and North East into the south, effectively transporting ‘coal by wire’ (Cochrane,1985). Transmission capacity limits were soon reached and in the 1970s the design andconstruction of 400kV grid began, building on the existing 275kV network. Most of the original132kV transmission lines were transferred to the area boards to be integrated into their distributionnetworks.
Discussions began as early as 1949 between the BEA and Electricitie de France (EdF) about theviability of constructing a cross-channel electricity transmission link between the UK and France.Agreement was reached in 1957. DC submarine cables were laid on sea-bed with a transmissioncapacity of 160 MW. Although successful when in operation, the cables suffered consistent damagedue to trawler fishing and other activities on one of the busiest stretches of water in the world.
1980s to present day– DC interconnection with France and ESI LiberalisationThe 1970s saw plans for the construction of a 2,000MW DC UK-France interconnector. Thecabling was buried in the seabed to avoid the damage experienced by the previous development.The UK-France interconnector has been operating on a fully commercial basis since 1986.
1989 saw the liberalisation of the ESI in the UK that resulted in the breaking up of the CEGB andthe creation of separate transmission operators in England and Wales, Scotland and NorthernIreland. In England and Wales, the National Grid Company was created, originally owned by theRegional Electricity Companies but later becoming a plc in 1995
UK Electricity Networks, September 2001
Page 138
Annex Seven Benefits of Interconnected Networks
IntroductionUntil the 1930s, largely isolated private and municipally owned utilities were responsible forelectricity supply in England and Wales. The Electricity (Supply) Act 1926 sought to resolve thewasteful duplication of resources. Particular concern was given to each isolated authority installingenough generating plant to cover the breakdown and maintenance of its generation.
Interconnecting separate utilities with a high voltage transmission system pooled both generationand demand. An interconnected transmission system also allowed for maintaining the quality ofsupply - in terms of frequency variations, voltage level, voltage waveforms, voltage fluctuations andharmonic levels - across the system and may provide economic and other benefits detailed below:
The following detail is primarily based on Appendix C to the National Grid Company’s Seven YearStatement, 2001 (http://www.nationalgrid.com/uk/)
Bulk power transfersMany factors impact on the decision to construct a power station at a particular location. Theseinclude fuel availability, fuel transport costs, cooling water, land availability and the grid connectioncharges. In the case of CHP stations a local market for the heat output is also be a major factor.
Large generating units often have difficulty in gaining planning permission for location near tocentres of demand due to environmental and social impact concerns. Renewable energy generationtechnologies such as wind or wave tend by their nature to be remotely located away from centres ofdemand. An interconnected transmission system allows for the bulk transmission of power fromgeneration to demand centres.
Economic OperationThe interconnected transmission system provides the main national electrical link between allparticipants (generation and demand). Connecting together all participants across the transmissionsystem makes it feasible to select the cheapest generation available in the system. This providesmarket participants with the opportunity to trade with the most competitive players. The networkoperator can accept the most attractive bids and offers via a balancing mechanism to meet thedemand, irrespective of the location of the generating plant.
Customer security of supplyIn this context, security refers to providing the demand customer with a continuous anduninterrupted electricity supply of the required quantity and of defined quality. This requires that thegeneration, transmission and distribution systems to be adequately robust to maintain suppliesunder conditions of plant breakdown or weather-induced malfunctions across varied demandpatterns.
Interruption to electricity supply may occur due to insufficient or unavailable generation,transmission or distribution capacity. In the UK, the system operator manages the transmissionsystem in accordance with strict standards laid down in the Transmission Licence.
Security of supply may not ne maximised when the sources of electricity are close to the demandthey supply. Transmission circuits have tended to be more reliable than individual generating units(NGC SYS, 2001), enhanced security seemingly delivered by providing sufficient transmission

UK Electricity Networks, September 2001
Page 139
capability between customers and the national reserve of generation. The transmission systemallows the network operator to exploit the diversity between individual generation sources anddemand.
Reduction in Plant MarginThe ideal would be a system where total installed generation capacity meets forecast maximumdemand. But, additional capacity is required for security to cover the reality of generating plantbecoming unavailable due to breakdown, delay in commissioning of new units, climatic variations –a particularly cold spell increasing demand, understated demand forecasts and other factors.
An integrated transmission and distribution system permits the use of surplus generation capacity inone area to cover shortfalls elsewhere. The need for additional installed generation capacity acrossan integrated system is smaller than the sum of individual area requirements.
In the UK, the CEGB traditionally adopted a planning margin of 24% to provide security whenplanning the need for future installed generation capacity. Under the pre-NETA Electricity Poolarrangements, capacity payments in respect of available generation capacity were incorporated.Such capacity payments were a function of Loss of Load Probability (LOLP) and the Value of LostLoad (VOLL) and were intended to provide a signal of capacity requirements. Under NETA the plantmargin is determined by market forces.
Reduction in Frequency ResponseIn the UK, NGC has a statutory obligation to maintain frequency between certain specified limits.System frequency varies continuously and is determined and controlled by a careful balancebetween demand and generation. A situation whereby demand is greater than generation results ina fall in frequency whereas, if generation is greater than demand, frequency rises.
With the exception of pumped-storage and new technologies such as fuel cells and regenysys,electricity cannot be stored in substantial quantities. To avoid an unacceptable fall in frequencyshould generating plant fail, additional generation needs to be available that can be called upon atvery short notice. This is referred to as frequency response.
Without an interconnected transmission system, each separate system would be required to carryits own frequency response. Interconnection allows the net frequency response requirement to beestablished equal to highest of the individual system requirements in order to cover for the largestpotential loss of generation rather than the sum of them all.
Frequency and voltageAn important factor in planning and operating the transmission system to provide secure andeconomic supplies of electricity is ensuring that the quality of the supply - frequency and voltage -are maintained at a satisfactory level. In the UK, the Electricity Supply Regulations 1989 and theGrid Code specify the frequency and voltage delivered to the consumer must not vary from thedeclared value by more than ±1% (frequency) and ±6% (voltages below 132kV) and ±10%(voltages at 132kV and above) respectively (NGC SYS, 2001).
FrequencyThe speed at which generating units operate defines frequency. Satisfactory levels are sustainedthrough ensuring that the MW generated is always in balance with the MW demand plus the MWlost in the transmission system. Frequency remains the same at all points on the transmissionsystem regardless of the distance from the generation source. As discussed previously, shoulddemand exceed generation then frequency will fall and vice versa. Adjustments made to both

UK Electricity Networks, September 2001
Page 140
generation and demand ensure transmission system frequency does not vary beyond the requiredlimits around the nominal value (50Hz). The system operator holds reserve generation at all times,available instantly to cover against plant losses and/or surges in demand.
VoltageThe control of voltage, albeit more complex, is also defined by the generating unit. Voltage ismodified by the nature of the network through which the power is transmitted. Its length, the levelof power flow and the electrical characteristics of the customers' demand all have an effect (NGCSYS, 2001).
Two electrical characteristics of the transmission network are capacitance and inductance. Theyhave reverse effects on the voltage, causing a rise or fall respectively, as power flows through thenetwork. At low power flow the capacitive effect is dominant, the voltage along a transmission linerising from the sending to the receiving end. At high power flow, the inductive effect is dominantand the voltage will fall. The longer the transmission line, the greater the effect on voltage. At whatis called the 'natural loading' of the line, the inductive and capacitive effects cancel out and thevoltage remains constant along the line.
Reactive CompensationA low voltage at the receiving end of a long and heavily loaded transmission line, rather thanrectified through adjustment of the generation at the remote sending end, is corrected locally by aspecial voltage compensation plant. This is known as reactive compensation.
Capacitive reactive compensation increases the voltage level and is used for heavily loadedoverhead lines. Inductive reactive compensation reduces the voltage level and is used for lightlyloaded cables.
Reactive compensation plant need not be utilised at all the times. It is more common for reactivecompensation units to be connected to the system in a floating mode, responding automatically orbeing switched in or out as changing system conditions dictate. Such scenarios include as thedemand level changes and maintenance of acceptable voltage levels following a system fault.
Transmission system capabilityIn the UK, there is a variety of ratios of generating capacity and demand in different areas acrossthe country, traditionally the electricity flowing from North to South. From 1938, the transmissionsystem has enabled generation surpluses in one part of the country to supply load in other parts ofthe country. In assessing the ability of the system to achieve this brief, the system is split intoprimarily importing or predominantly exporting areas. Connecting circuits linking such areas tend torepresent the weakest links in the transmission system and thus indicate the ability of the system toaccept bulk power transfers. The circuits which link areas together are the system boundaries.
System lossesPower flow across the transmission system causes transmission power losses. The bulk of theselosses are a function of the square of the current flowing through the circuit or transformer windings(I2R) causing heating of transmission lines, cables and transformers. Such losses, by their verynature, are often referred to as variable power loss.
Other losses include the unavoidable losses associated with overhead lines and transformers.Although termed fixed losses, although stable relative to the variable losses and fairly constant, theycan and do vary.

UK Electricity Networks, September 2001
Page 141
Fixed losses on overhead transmission lines are referred to as corona losses which are a function ofvoltage levels and weather conditions. Fixed losses in a transformer are iron losses, occuring in theiron core of the transformer when subjected to an alternating magnetic field. Iron losses vary withthe frequency of the power flow producing the alternating magnetic field.
Impact on Transmission of Generation Plant LocationThe transmission system is planned to meet the Licence Standard, thus ensuring that the firmtransmission capability of any part of the system exceeds the maximum required power flow. If theforecast maximum required power flow exceeds the firm transmission capability, then that part ofthe transmission system must be reinforced.
The maximum power flow in any part of the system is a function of the generation and demand inthat part. The greater the difference between generation and demand, the greater the power flow.The choice of site of new generating plant can therefore directly influence the need for majortransmission reinforcements. For example, should a new generating plant be located in an exportingarea (generation exceeds demand), the maximum power flow will increase. This increase in powerflow may exceed the firm transmission capacity of the existing system and give rise to therequirement for transmission reinforcement.
Positioning new generating plant in an importing area may be preferable for the transmissionsystem compared to a more distant site in relation to both security of supply and voltage control. Allthings being equal, it will reduce the imports over the transmission system, the associated need foradditional reactive compensation, transmission losses, and the possible need for transmissionsystem reinforcement. In the UK, the transmission system currently carries heavy power flows fromNorth to South. Locating new generating stations in the South would therefore be generallybeneficial to the transmission network.