Embed Size (px)
Citation preview
1
UK Biobank Haematology Data Companion Document
AUTHORS Simon M Sheard Rob Nicholls James Froggatt FOR INFORMATION
Date: 24/10/17 Doc Reference: 0010 – Haematology Summary for Researchers
Status: For Information
2
CONTENTS
EXECUTIVE SUMMARY ..................................................................................................................................... 4
1 SCOPE FOR UK BIOBANK HAEMATOLOGY DATA RELEASE ........................................................................ 5
2 INSTRUMENTS AND METHODOLOGY ....................................................................................................... 5
2.1 THE SAMPLING AND ANALYSIS PROCESS ........................................................................................................... 5 2.1.1 Measured Parameters .................................................................................................................... 6 2.1.2 Derived Values ................................................................................................................................ 6 2.1.3 Calculated Values ............................................................................................................................ 6
2.2 INSTRUMENT QC ......................................................................................................................................... 8
3 DATA FLOW AND STORAGE ...................................................................................................................... 8
3.1 ROUTES INTO LIMS ..................................................................................................................................... 8 3.1.1 Transfer Method ............................................................................................................................. 9 3.1.2 Instrument Identifier ....................................................................................................................... 9 3.1.3 Date / Time Stamp .......................................................................................................................... 9 3.1.4 Duplicate Date / Time Stamps ...................................................................................................... 10 3.1.5 Error Codes .................................................................................................................................... 11
4 RESULT SETS AND PRECISION ................................................................................................................. 12
4.1 RESULTS SETS ........................................................................................................................................... 12 4.2 RESULT PRECISION ..................................................................................................................................... 12
5 DATA CLEANING ..................................................................................................................................... 13
6 FREQUENTLY ASKED QUESTIONS............................................................................................................ 14
3
VERSION CONTROL Version Issued Changes v1.0 23/06/15 None – first issue v1.1 06/01/16 Update of section on Data Cleaning v1.2 26/01/16 Update to reflect cessation of haematology analysis in Jan 2016 v1.3 28/01/16 Updates to Instruments and Methodology, Data Flow and
Storage, Data Cleaning and FAQ v1.4 29/01/16 Update of section 2 following internal review v1.5 05/02/16 Addition of agglutination error code, correction to table
numbers v1.6 22/03/16 Addition of Transfer Method, modify Instrument Identifier,
amend Parameter Summary table, amend Data Cleaning, amend Error Codes and general changes for consistency and formatting
v1.7 v1.8 v1.9
11/04/16 12/04/16 24/10/17
Addition of instrument reportable ranges and layout modifications Correction of IRF formula and minor amendment to FAQ for clarity Added section 3.1.4 to explain duplicate date/time stamps
4
Executive Summary This document is intended as a companion document for the UK Biobank Haematology data; the document is divided into six parts, between them providing information on:
1. Scope for UK Biobank Haematology Data Release 2. Instruments and Methodology 3. Data Flow and Storage 4. Units and Result Sets 5. Data Cleaning 6. FAQ
Any queries not answered in this document, or any questions arising from the information presented in this document, should be raised with the UK Biobank Access Team.

5
1 Scope for UK Biobank Haematology Data Release Samples have been collected from participants for haematology analysis during a number of cohort recruitment / recontact phases: pilot, baseline recruitment, repeat assessment and imaging. The current release of haematology data includes results from baseline recruitment, repeat assessment and imaging only. The data collected during the pilot phase will be made available as part of a later release. Some participants have provided samples for analysis for multiple phases and therefore have more than one set of haematology results; the relevant phase is indicated as part of the set of results. Informational flags provided by the instrument indicating conditions such as partial aspiration are not part of the current release; these flags will also be made available as part of a later release.
2 Instruments and Methodology Four Beckman Coulter LH750 instruments were utilised to analyse samples collected in 4ml EDTA (Ethylenediaminetetraacetic acid) vacutainers for the (circa) 500,000 participants of the UK Biobank baseline cohort. Two of these original systems were later used to provide haematology data for the 20,000 participants who attended a repeat assessment visit; these same 2 instruments continued to be utilised to capture data for participants who re-attended the UK Biobank facility as part of the imaging project repeat assessment (this was discontinued at the end of the imaging pilot in January 2016). The LH750 Haematology Analyser is a quantitative, automated haematology analyser and leukocyte differential counter for in vitro diagnostic use in clinical laboratories. It provides automated reticulocyte analysis and enumeration of nucleated red blood cells (NRBCs) as well as an automated method for enumeration of RBCs and WBCs in body fluids. All collected samples were analysed using one or more of the LH750 instruments. Samples were typically analysed at the UK Biobank central laboratory within 24 hours of blood draw.
2.1 The Sampling and Analysis Process The Beckman analyser uses a combination of measurement techniques to provide information on the sample submitted for analysis. A maximum of thirty one (31) parameters are reported by the instrument; some of these are measured, some calculated and some derived. These are categorised into the following subsets:
- Complete Blood Count (CBC)
- Differential (DIFF)
- Reticulocytes (RETIC)
The Complete Blood Count Data Set includes the full red and white blood cell counts (RBC) & (WBC). The Differential Data Set includes all individual white blood cell populations. The data extracted includes the proportion of each of these populations out of the whole white blood cell population, as a percentage (DIFF%) and the total number of each cell type (DIFF#). The Reticulocyte Data Set provides information relating to immature red blood cells. This includes the proportion of reticulocytes out of the red blood cell population (as a percentage - RET%), the total number of reticulocytes in the sample (RET#), the proportion of high light scatter (immature) reticulocytes (IRF) and the average volume of individual reticulocytes (MRV).
6
2.1.1 Measured Parameters The set of parameters directly measured by the Coulter method include:
- Red Blood Cell Count (RBC)
- White Blood Cell Count (WBC)
- Haemoglobin Concentration (HGB)
- Platelet Count (PLT)
- Differential Parameters (DIFF%) - the proportion of specific leukocytes in the WBC population
- Reticulocyte Parameters (RET%) – the number of reticulocytes per 100 Red Blood Cells
2.1.2 Derived Values Multiple scatter plots and histograms are produced for each sample; from these, other values are obtained through derivation (within the instrument). These values include:
- Mean Corpuscular Volume (MCV) – the average volume of red blood cells
- Red Cell Distribution Width (RDW) – the spread of the red blood cell population
- Mean Platelet Volume (MPV) – the average volume of individual platelets in the sample
- Percentage Nucleated Red Blood Cells (NRBC%) – the number of nucleated RBC’s per 100 WBC’s
2.1.3 Calculated Values In addition to the derived results, the instrument also reports a number of calculated results:
- Haematocrit (HCT) – The relative volume of RBC’s to whole blood (Mean red blood cell volume (MCV) x Red blood cell count (RBC)) / 10
- Mean Corpuscular Haemoglobin (MCH) – the mass of haemoglobin in the average RBC (Haemoglobin concentration (HGB) / Red blood cell count (RBC)) x 10
- Mean Corpuscular Haemoglobin Concentration (MCHC) – the average mass of haemoglobin per the relative volume of RBC’s in the whole blood sample (Haemoglobin concentration (HGB) / Haematocrit) x 100
- Differential Absolute Quantities (DIFF#) – the number of each leukocyte in the WBC sample (% Proportion of specific leukocyte / 100) x (White blood cell count (WBC))
- Reticulocyte Absolute Quantity (RET#) – the number of reticulocytes in the RBC sample (% Proportion of reticulocyte in RBC sample / 100) x (Red blood cell count (RBC))
- Nucleated Red Blood Cell Quantity (NRBC#) – the total number of nucleated red blood cells in the sample (Percentage nucleated red blood cells (NRBC%) / 100) x (White blood cell count (WBC))
- Immature Reticulocyte Fraction (IRF) – a calculated ratio using the count of the highest light scatter reticulocytes to the total count of reticulocytes (High Light Scatter Reticulocytes (HLR#) / Total reticulocytes (RET#))
- Mean Reticulocyte Volume (MRV) – average volume of individual reticulocytes in the sample Calculation unknown
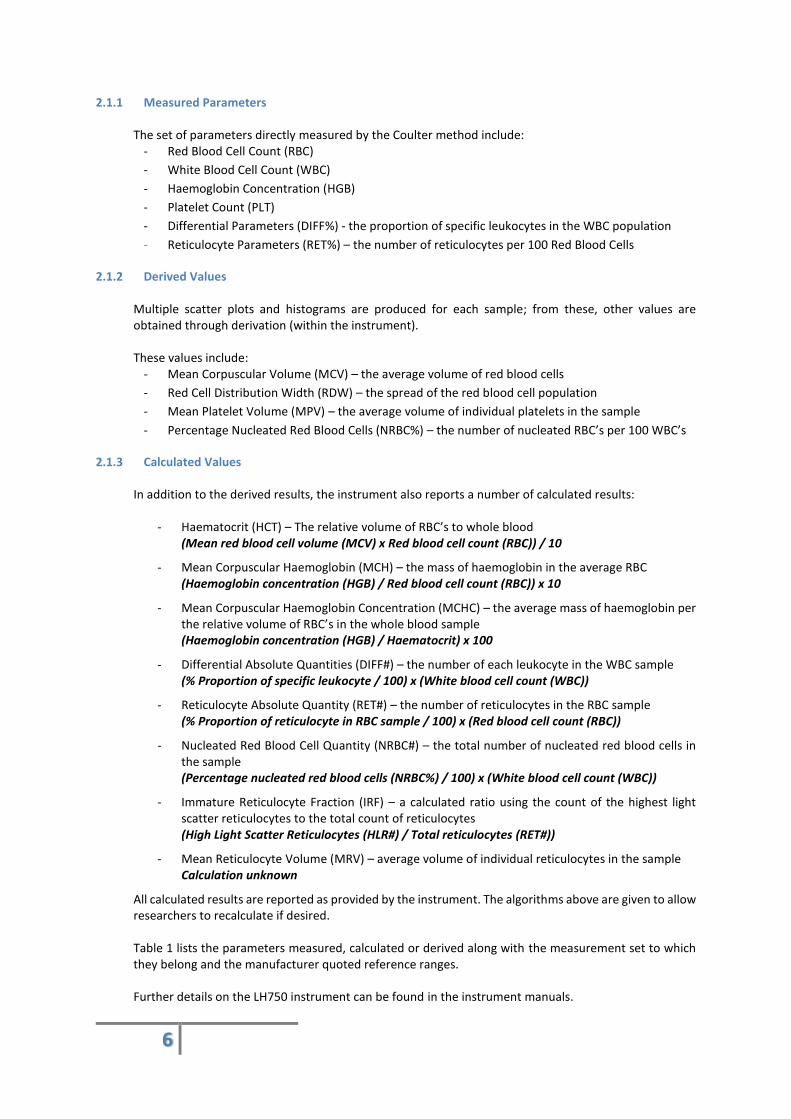
All calculated results are reported as provided by the instrument. The algorithms above are given to allow researchers to recalculate if desired. Table 1 lists the parameters measured, calculated or derived along with the measurement set to which they belong and the manufacturer quoted reference ranges. Further details on the LH750 instrument can be found in the instrument manuals.
7
Abbreviation Parameter Source Set Unit Analyser Operating Range Analyser Reportable Range Reference Range Quoted by
Manufacturer
WBC White Blood Cell or leukocyte count Measured CBC x 109 cells/L 0.00 to 900.00 x 10⁹ cells/L 0.00 to 400.00 x 10⁹ cells/L 3.53 to 9.57 x 10⁹ cells/L
RBC Red Blood Cell or erythrocyte count Measured CBC x 1012 cells/L 0.00 to 20.00 x 10¹² cells/L 0.00 to 8.00 x 10¹² cells/L 3.96 to 5.50 x 10¹² cells/L
HGB Haemoglobin concentration Measured CBC g/dL 0.0 – 99.9 g/dL 0.0 – 25.0 g/dL 12.14 – 16.27 g/dL
HCT Haematocrit (relative volume of erythrocytes) Calculated CBC % 0.0 – 99.9 % N/A 35.39 – 47.19 %
MCV Mean Corpuscular (erythrocyte) Volume Derived CBC fL 0.0 – 300.0 fL 0.0 – 150.0 fL 76.9 – 94.7 fL
MCH Mean Corpuscular (erythrocyte) Haemoglobin Calculated CBC pg 0.0 – 99.9 pg N/A 25.69 – 32.95 pg
MCHC Mean Corpuscular (erythrocyte) Hgb Concn Calculated CBC g/dL 0.0 – 99.9 g/dL N/A 33.34 – 35.47 g/dL
RDW Red Cell (erythrocyte volume) Distribution Width Derived CBC % 0.0 – 99.9 % N/A 12.09 – 15.19%
PLT Platelet or thrombocyte count Measured CBC x 109 cells/L 0.00 – 5000 x 109 cells/L 0.00 – 3000 x 109 cells/L 169.06 – 397.10 x 10⁹ cells/L
MPV Mean Platelet (thrombocyte) Volume Derived CBC fL 0.0 – 99.9 fL N/A 7.54 – 11.24 fL
LY% Lymphocyte percent Measured DIFF % 0 – 100 % 0 – 100 % 18.39 – 44.42 %
MO% Monocyte percent Measured DIFF % 0 – 100 % 0 – 100 % 4.69 – 12.66 %
NE% Neutrophil percent Measured DIFF % 0 – 100 % 0 – 100 % 41.71 – 73.74 %
EO% Eosinophil percent Measured DIFF % 0 – 100 % 0 – 100 % 0.75 – 8.06 %
BA% Basophil percent Measured DIFF % 0 – 100 % 0 – 100 % 0.17 – 1.37 %
LY# Lymphocyte number Calculated DIFF/CBC x 109 cells/L 0.00 – 900.00 x 10⁹ cells/L 0.00 – 400.00 x 10⁹ cells/L 0.65 – 4.25 x 10⁹ cells/L
MO# Monocyte number Calculated DIFF/CBC x 109 cells/L 0.00 – 900.00 x 10⁹ cells/L 0.00 – 400.00 x 10⁹ cells/L 0.17 – 1.21 x 10⁹ cells/L
NE# Neutrophil number Calculated DIFF/CBC x 109 cells/L 0.00 – 900.00 x 10⁹ cells/L 0.00 – 400.00 x 10⁹ cells/L 1.47 – 7.06 x 10⁹ cells/L
EO# Eosinophil number Calculated DIFF/CBC x 109 cells/L 0.00 – 900.00 x 10⁹ cells/L 0.00 – 400.00 x 10⁹ cells/L 0.03 – 0.77 x 10⁹ cells/L
BA# Basophil number Calculated DIFF/CBC x 109 cells/L 0.00 – 900.00 x 10⁹ cells/L 0.00 – 400.00 x 10⁹ cells/L 0.01 – 0.13 x 10⁹ cells/L
NRBC% Nucleated Red Blood Cell percent Derived DIFF/CBC % 0.0 or 2.0 – 600 % 0.0 or 2.0 – 600 % N/A
NRBC# Nucleated Red Blood Cell number Calculated DIFF/CBC x 109 cells/L Not stated Not stated Not stated
RET% Reticulocyte percent Measured RETIC % 0.00 – 100 % 0.00 – 30.0 % 0.45 – 2.28 %
RET# Reticulocyte number Calculated RETIC/CBC x 1012 cells/L 0.00 – 999.9 x 10¹² cells/L 0.0000 – 0.7500 x 10¹² cells/L 0.02 – 0.11 x 10¹² cells/L
HLR% High Light scatter Reticulocytes % Derived RETIC % Not stated Not stated Not stated
HLR# High Light scatter Reticulocytes # Calculated RETIC x 1012 cells/L Not stated Not stated Not stated
IRF Immature Reticulocyte Fraction Calculated RETIC Ratio Not stated Not stated 0.163 – 0.362
MRV Mean Reticulocyte Volume Calculated RETIC fL Not stated Not stated 102.73 – 124.89 fL
MSCV Mean Sphered Cell Volume Derived RETIC fL Not stated Not stated Not stated
PCT Platelet crit Calculated CBC % Not stated Not stated Not stated
PDW Platelet Distribution Width Derived CBC % Not stated Not stated Not stated
Table 1 - Parameter Summary (The operating range reflects the range of values over which the instrument displays, prints and transmits results. Values that are above the operating range are inhibited and the value is replaced by pluses ( +++++) – see Section 3.1.4. The reportable range identifies the values where the instrument is accurate and reflects the range studied by the manufacturer in their accuracy testing.)
8
2.2 Instrument QC Prior to the analysis of any participant samples, daily analyser maintenance was carried out according to the manufacturers’ recommendations. Furthermore, a number of Quality Control (QC) checks were performed on the systems. Three manufacturers’ controls were run on each system at start up;
- Beckman Coulter Latron Contol - Beckman Coulter 5C Cell Control - Beckman Coulter Retic C Control
Acceptance parameters for all control materials are lot-specific and were taken from the associated IFU (Information For User) data sheets that accompanied individual reagent control lots. If parameters for all the control material were successfully met (QC checked passed), then the analyser(s) in question were deemed acceptable for use for the day, and participant samples were analysed. If analyser(s) failed any of these QC checks, samples were not measured on that specific instrument until an investigation had been performed and successful resolution applied. Regular Preventative Maintenance (PM) activities were undertaken by Beckman and service / repair activities carried out by Beckman as required.
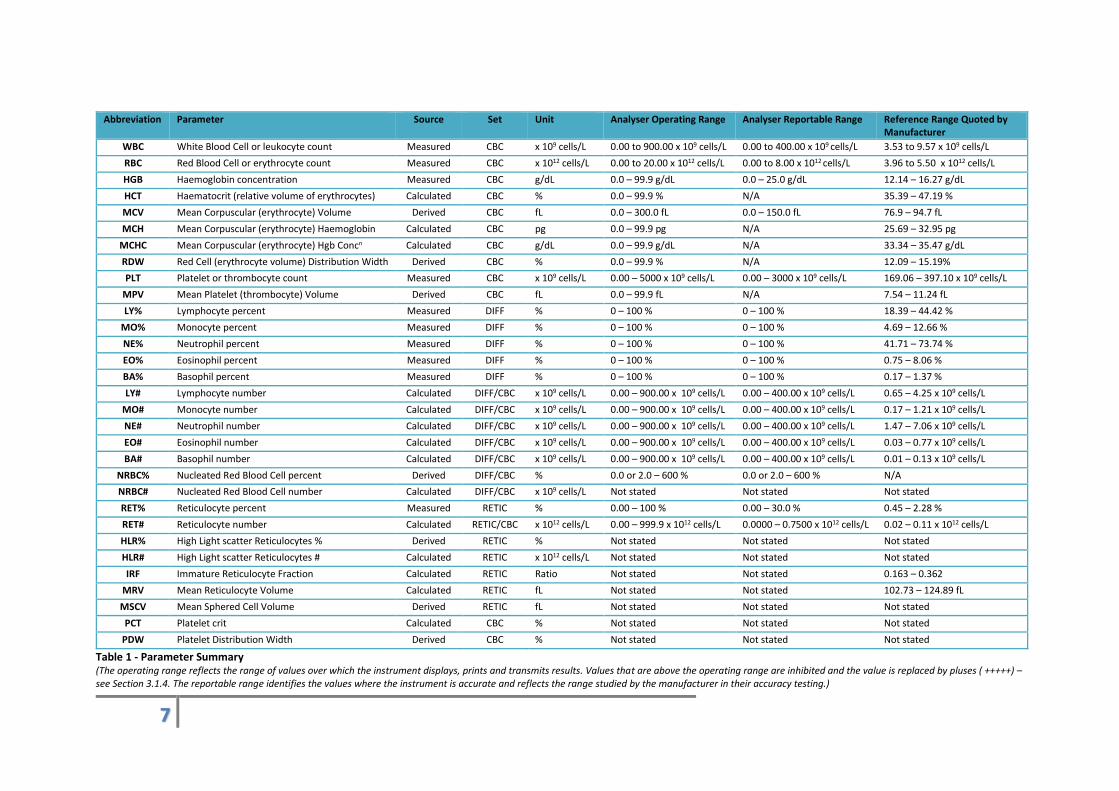
3 Data Flow and Storage All haematology data made available through Showcase has a similar data history summarised below:
3.1 Routes into LIMS Data are produced by the instrument and, in the normal course of events, transmitted directly to LIMS. In this case, LIMS automatically receives both the instrument data and the instrument identifier. In cases where the automatic transfer failed (or for some other reason, did not take place), data can be transferred to LIMS via a “backup route”. A final route into LIMS is via an archive file. Alongside the data provided by the instrument, LIMS (and Showcase) also hold information on the route into LIMS, the instrument identifier and the time of venepuncture and of analysis.
Instrument UK Biobank LIMS Data Showcase
9
3.1.1 Transfer Method
A data cleaning exercise undertaken during 2015 has resulted in the majority of the results in LIMS (and hence in Showcase) being transferred from the backup and archive files. The following codes are used to describe the route into LIMS:
Code Description
Direct Direct transfer to LIMS
Backup Data transfer from backup file
Archive Data transfer from archive file Table 2 – Transfer Methods
The transfer method affects the precision with which the data are recorded in LIMS. This is discussed further in section 4.2.
3.1.2 Instrument Identifier The instrument used is specified as per the following table:
Code Description
Unspecified Unspecified instrument
AJ38695 Instrument serial number: AJ38695
AH49855 Instrument serial number: AH49855
AK30431 Instrument serial number: AK30431
AK26401 Instrument serial number: AK26401 Table 3 - Instrument Identifiers
The specific instrument on which measurements were made was not recorded during the pilot phase.
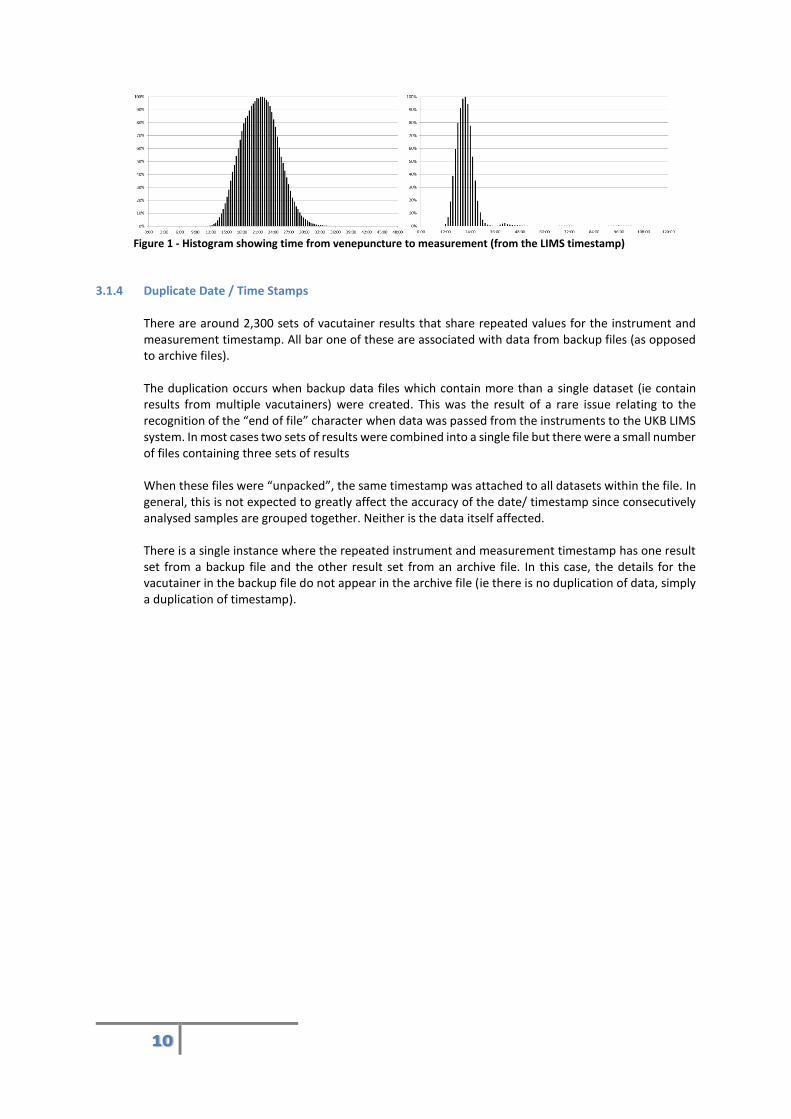
3.1.3 Date / Time Stamp Each measurement result is transferred into LIMS as a discrete value. Each is stored in LIMS alongside identifying parameters such as date / time stamp, the vacutainer, participant identifier plus various quality parameters. For data which were input to LIMS via direct data transfer from the instrument, the analysis date / time stamp held in LIMS actually refers to the time at which the data were received into LIMS, rather than the analysis time. Generally, the import time to LIMS is close to the time at which the data are acquired and generally the results from one vacutainer will have a single date / time stamp. However, if there was an issue transferring the data then a single vacutainer may have multiple date / time stamps associated with the different measured parameters. In addition, the date / time stamp may be several hours or even days after the actual time of analysis if there were issues uploading the data. This is the exception rather than the norm. If data are imported into LIMS from the backup file route, the above is still true; however, if imported from the archive file, the time stamp relates to actual time of analysis. The modal value of Δt (time from venepuncture to analysis), based on the time stamps recorded in LIMS is around 22 hours. This is consistent with UK Biobank operating procedures and confirms that for the majority of samples the time recorded in LIMS is a good approximation to the actual time of analysis.
10
Figure 1 - Histogram showing time from venepuncture to measurement (from the LIMS timestamp)
3.1.4 Duplicate Date / Time Stamps
There are around 2,300 sets of vacutainer results that share repeated values for the instrument and measurement timestamp. All bar one of these are associated with data from backup files (as opposed to archive files). The duplication occurs when backup data files which contain more than a single dataset (ie contain results from multiple vacutainers) were created. This was the result of a rare issue relating to the recognition of the “end of file” character when data was passed from the instruments to the UKB LIMS system. In most cases two sets of results were combined into a single file but there were a small number of files containing three sets of results When these files were “unpacked”, the same timestamp was attached to all datasets within the file. In general, this is not expected to greatly affect the accuracy of the date/ timestamp since consecutively analysed samples are grouped together. Neither is the data itself affected. There is a single instance where the repeated instrument and measurement timestamp has one result set from a backup file and the other result set from an archive file. In this case, the details for the vacutainer in the backup file do not appear in the archive file (ie there is no duplication of data, simply a duplication of timestamp).

11
3.1.5 Error Codes The Beckman Coulter LH750 reports codes when irregularities occur. Such behaviour is specified by the instrument manuals. For ease of representation, when these errors occur, the numeric result is assigned a value of -1 and the code output by the instrument is translated into a “numeric error code” as described below:
Instrument Code
Meaning / Description Numeric Error Code
..... Incomplete computation occurred: Incomplete computation may occur in place of calculated parameters because a voteout or overrange occurred for a primary parameter used in the calculation. (i.e. The system directly measures certain CBC parameters (WBC/RBC/PLT) and derives the other parameters from these, where the system is unable to measure one of these parameters …. appears alongside this parameter and also alongside any parameter calculated using these
-1
- - - - - Total voteout occurred: If this code appears for WBC, the WBC and NRBC absolute count results appear as an incomplete computation (.....) since the absolute counts are calculated from the non-numeric WBC.
-2
::::: Flow cell clog was detected: -3
+++++ Result exceeds the instrument's operating range; +++++ does not apply to NRBC%.
-4
Table 4 - Instrument Error Codes
12
4 Result Sets and Precision
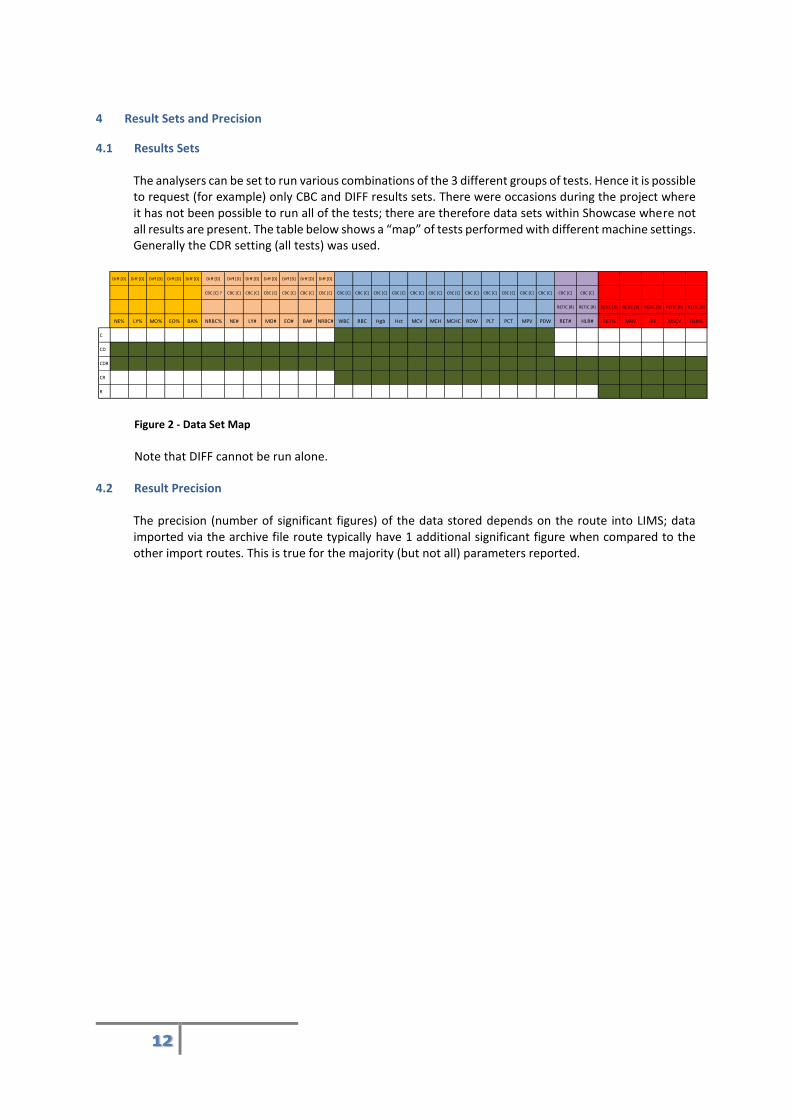
4.1 Results Sets The analysers can be set to run various combinations of the 3 different groups of tests. Hence it is possible to request (for example) only CBC and DIFF results sets. There were occasions during the project where it has not been possible to run all of the tests; there are therefore data sets within Showcase where not all results are present. The table below shows a “map” of tests performed with different machine settings. Generally the CDR setting (all tests) was used.
Figure 2 - Data Set Map
Note that DIFF cannot be run alone.
4.2 Result Precision The precision (number of significant figures) of the data stored depends on the route into LIMS; data imported via the archive file route typically have 1 additional significant figure when compared to the other import routes. This is true for the majority (but not all) parameters reported.
Diff [D] Diff [D] Diff [D] Diff [D] Diff [D] Diff [D] Diff [D] Diff [D] Diff [D] Diff [D] Diff [D] Diff [D]
CBC [C] ? CBC [C] CBC [C] CBC [C] CBC [C] CBC [C] CBC [C] CBC [C] CBC [C] CBC [C] CBC [C] CBC [C] CBC [C] CBC [C] CBC [C] CBC [C] CBC [C] CBC [C] CBC [C] CBC [C] CBC [C]
RETIC [R] RETIC [R] RETIC [R] RETIC [R] RETIC [R] RETIC [R] RETIC [R]
NE% LY% MO% EO% BA% NRBC% NE# LY# MO# EO# BA# NRBC# WBC RBC Hgb Hct MCV MCH MCHC RDW PLT PCT MPV PDW RET# HLR# RET% MRV IRF MSCV HLR%
C 5 5 5 5 5 5 5 5 5 5 5 5
CD 5 5 5 5 5 5 5 5 5 5 5 5 5 5 5 5 5 5 5 5 5 5 5 5
CDR 5 5 5 5 5 5 5 5 5 5 5 5 5 5 5 5 5 5 5 5 5 5 5 5 5 5 5 5 5 5 5
CR 5 5 5 5 5 5 5 5 5 5 5 5 5 5 5 5 5 5 5
R 5 5 5 5 5
13
5 Data Cleaning Following identification of some anomalies in the Showcase haematology data in 2014, an exercise to investigate the cause(s) was undertaken and a revised data set was issued in early 2016 with the anomalies addressed. The approach taken is summarised as follows:
- Re-import data from archive files where available (to provide higher precision and actual time of analysis). Where archive files are unavailable, then re-import from backup files.
- Assign date/time stamps based on file contents or name (backup files). - Assign instrument identifier by matching to original LIMS entry or file directory name. - Assign import route identifiers. - Ensure HCT values reported consistently as % rather than mixture of ratio and %.
14
6 Frequently Asked Questions
6.1. Why are some data sets reported to higher precision than other? 6.2. There are error codes associated with the data; what do these mean? 6.3. Why are there no values strictly greater than 0% or strictly less than 2.0% for the nucleated red blood
count percentage? There are many values at 0% and many at 2% and the scale of measurement seems to be at a resolution of 0.1%.
6.4. I am seeing a strong within day variation in basophil / monocyte counts. These counts seem to be in anti-phase as the total white count doesn’t exhibit the same degree of variation. Could this be to do with drift in the flow-cytometry gates over the course of the day. Are the basophil/monocyte gates adjacent in the relevant scattergram?
6.5. There are some values in the dataset where the analysis time is before the venepuncture time. This is not possible.
6.6. There are a large number of BA# values of 0.0 x 10⁹ cells/L which is below the reference range. 6.7. There is a cluster of RET/HLR outlier values obtained during one particular week.
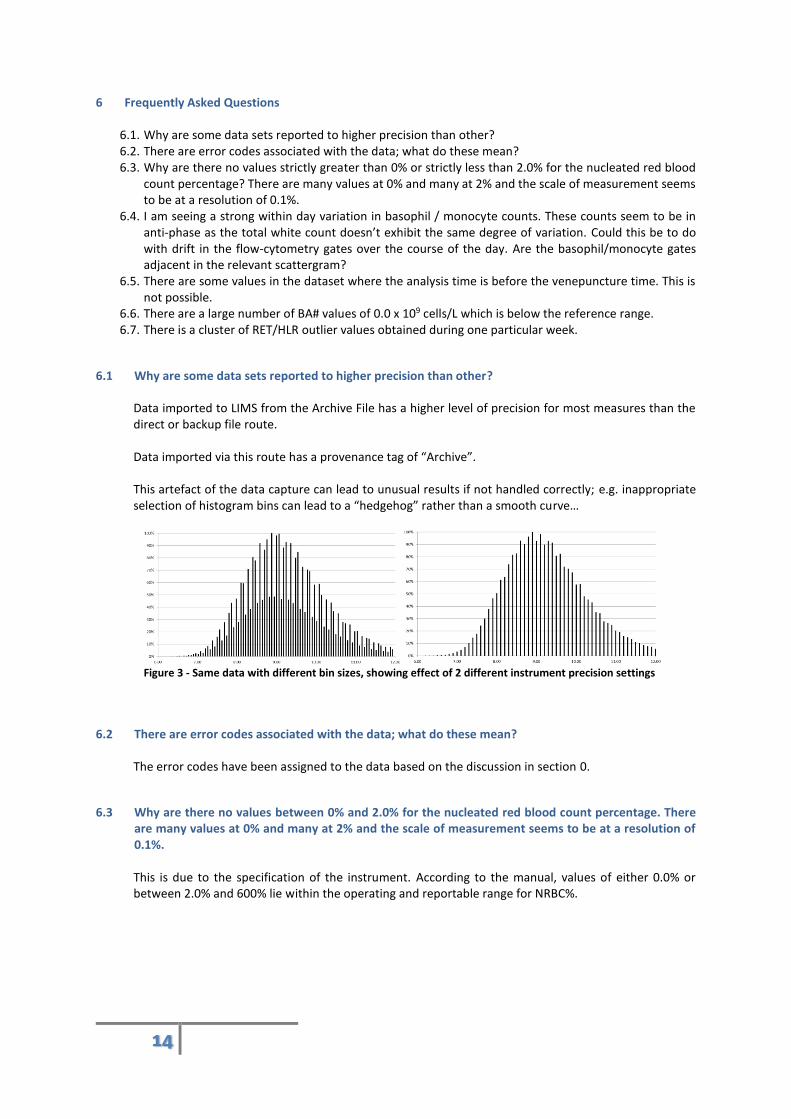
6.1 Why are some data sets reported to higher precision than other? Data imported to LIMS from the Archive File has a higher level of precision for most measures than the direct or backup file route. Data imported via this route has a provenance tag of “Archive”. This artefact of the data capture can lead to unusual results if not handled correctly; e.g. inappropriate selection of histogram bins can lead to a “hedgehog” rather than a smooth curve…
Figure 3 - Same data with different bin sizes, showing effect of 2 different instrument precision settings
6.2 There are error codes associated with the data; what do these mean? The error codes have been assigned to the data based on the discussion in section 0.
6.3 Why are there no values between 0% and 2.0% for the nucleated red blood count percentage. There are many values at 0% and many at 2% and the scale of measurement seems to be at a resolution of 0.1%. This is due to the specification of the instrument. According to the manual, values of either 0.0% or between 2.0% and 600% lie within the operating and reportable range for NRBC%.

15
6.4 I am seeing a strong within day variation in basophil / monocyte counts. These counts seem to be in anti-phase as the total white count doesn’t exhibit the same degree of variation. Could this be to do with drift in the flow-cytometry gates over the course of the day. Are the basophil/monocyte gates adjacent in the relevant scattergram? Beckman advised, regarding the identification of cell types in the flow cell:
- The technology used is VCS (Volume, Conductivity and Scatter) - no antibodies are involved which is where it differs to some cytometric methods.
- The cells pass through the flow cell in a focused stream. As a cell passes through the cell is sized (volume), the light scatter is measured (scatter) and a third measurement (conductivity) is also carried out.
- Each cell is then plotted on a 3D data plot. - Cells of the same type tend to cluster together. - At the end of the analysis various algorithms analyse the position and distribution of these cell
clusters to identify the cell type. - As samples age, cells deteriorate; this can result in these measurements differing from those
expected from normal fresh samples, as a result the cell clusters, (or some cells within a particular cell type) may fall in the wrong area of the 3D plot and therefore be misclassified.
6.5 There are some values in the dataset where the analysis time is before the venepuncture time. This is not possible. There are 74 values in the dataset where the analysis time is before the venepuncture time. All 74 values relate the Oxford assessment centre and fall in the same time period (venepuncture 18-21 August 2007; analysis 2-5 August 2007). It is believed that these errors relate to an issue which occurred with the local real time clock at the clinic when blood was collected.
6.6 There are a large number of BA# values of 0.0 x 10⁹ cells/L which is below the reference range. The data provided by the backup file and direct transfer are not sufficiently precise for the DIFF# datasets. This is readily apparent when the BA# results are considered; a significant number of BA# results have a value of 0.0 x 10⁹ cells/L which lies outside the lower end of the reference range of 0.01 x 10⁹ cells/L. The reported value of 0.0 is an artefact of rounding in the data exported by the instrument. Algorithms are provided for the calculation of the DIFF# parameters allowing researchers to recalculate if desired.
6.7 There is a cluster of RET/HLR outlier values obtained during one particular week. There are 682 RET and HLR outlier values obtained 22-29 August 2008. All RET# values greater than 0.21 x 10¹² cells/L were obtained on AJ38695; these values are assumed to be associated with an instrument malfunction.