Embed Size (px)
Citation preview
UK Asset Resolution Limited Interim Financial Report 30 September 2013
UKAR Interim Financial Report 30 September 2013 Page 1 of 75
UK Asset Resolution Limited
Interim Financial Report
for the 9 months ended 30 September 2013
14 November 2013
UK Asset Resolution Limited Interim Financial Report 30 September 2013
UKAR Interim Financial Report 30 September 2013 Page 2 of 75
Introduction
On 1 October 2010 UK Asset Resolution Limited ('UKAR') was established as the holding company for Bradford &Bingley plc ('B&B') and Northern Rock (Asset Management) plc ('NRAM'), bringing together the two brands undershared management and a common Board of Directors. UKAR is a private limited company incorporated anddomiciled in the United Kingdom, and is wholly owned by the Treasury Solicitor as nominee for HM Treasury. HMTreasury's investment in UKAR is managed on the Government's behalf by UK Financial Investments Limited ('UKFI').UKAR's mission is 'maximising value for the taxpayer'.
All shares in B&B were transferred to the Treasury Solicitor as nominee for HM Treasury on 29 September 2008 as aresult of The Bradford & Bingley plc Transfer of Securities and Property etc. Order 2008. On 1 October 2010 allshares in B&B were acquired via a share-for-share exchange by UKAR. UKAR is B&B's ultimate parent undertaking.B&B considers Her Majesty's Government to remain its ultimate controlling party.
All shares in NRAM were transferred to the Treasury Solicitor as nominee for HM Treasury on 22 February 2008 as aresult of The Northern Rock Transfer Order 2008. On 1 October 2010 all shares in NRAM were acquired via a share-for-share exchange by UKAR. UKAR is NRAM's ultimate parent undertaking. NRAM considers Her Majesty'sGovernment to remain its ultimate controlling party.
The 2012 Annual Reports & Accounts of UKAR, B&B and NRAM, and their Interim Financial Reports for the sixmonths ended 30 June 2013, are available on their websites www.ukar.co.uk, www.bbg.co.uk and www.nram.co.uk.
The accounting reference dates of UKAR, B&B and NRAM have been changed from 31 December to 31 March, toalign to the year end of their ultimate parent, HM Treasury. The next Annual Reports and Accounts of UKAR, B&Band NRAM will cover 15 months to 31 March 2014.
This second 2013 Interim Financial Report for B&B and NRAM is required by the Financial Conduct Authority's('FCA's') Disclosure and Transparency Rules as a consequence of the extended accounting period. UKAR as anindividual company has no listed debt in issue and therefore is not required to issue an Interim Financial Report.UKAR has voluntarily issued the UKAR Group information contained in this report.
This UK Asset Resolution Limited Interim Financial Report comprises three sections:
Section A - Summary of the financial performance and nine month results of the UK Asset Resolution LimitedGroup.
Section B - Interim Financial Report of Bradford & Bingley plc, prepared in accordance with IAS 34.
Section C - Interim Financial Report of Northern Rock (Asset Management) plc, prepared in accordance with IAS34.
UK Asset Resolution Limited Interim Financial Report 30 September 2013
UKAR Interim Financial Report 30 September 2013 Page 3 of 75
Contents Page
Section A - Summary results of UK Asset Resolution Limited
Key performance indicators 5Financial review 6Primary Statements for the UKAR Group 15
Section B - Bradford & Bingley plc Interim Financial Report
Interim Financial Report 17Key performance indicators 20Primary Statements 22Notes to the Financial Information 28Statement of Directors' Responsibilities 44Independent Review Report 45
Section C - Northern Rock (Asset Management) plc Interim Financial Report
Interim Financial Report 46Key performance indicators 49Primary Statements 51Notes to the Financial Information 57Statement of Directors' Responsibilities 72Independent Review Report 73
Contact information 74
UK Asset Resolution Limited Interim Financial Report 30 September 2013
UKAR Interim Financial Report 30 September 2013 Section A - UKAR Page 4 of 75
Section ASummary results of
UK Asset Resolution Limitedfor the 9 months ended 30 September 2013
UK Asset Resolution Limited Interim Financial Report 30 September 2013
UKAR Interim Financial Report 30 September 2013 Section A - UKAR Page 5 of 75
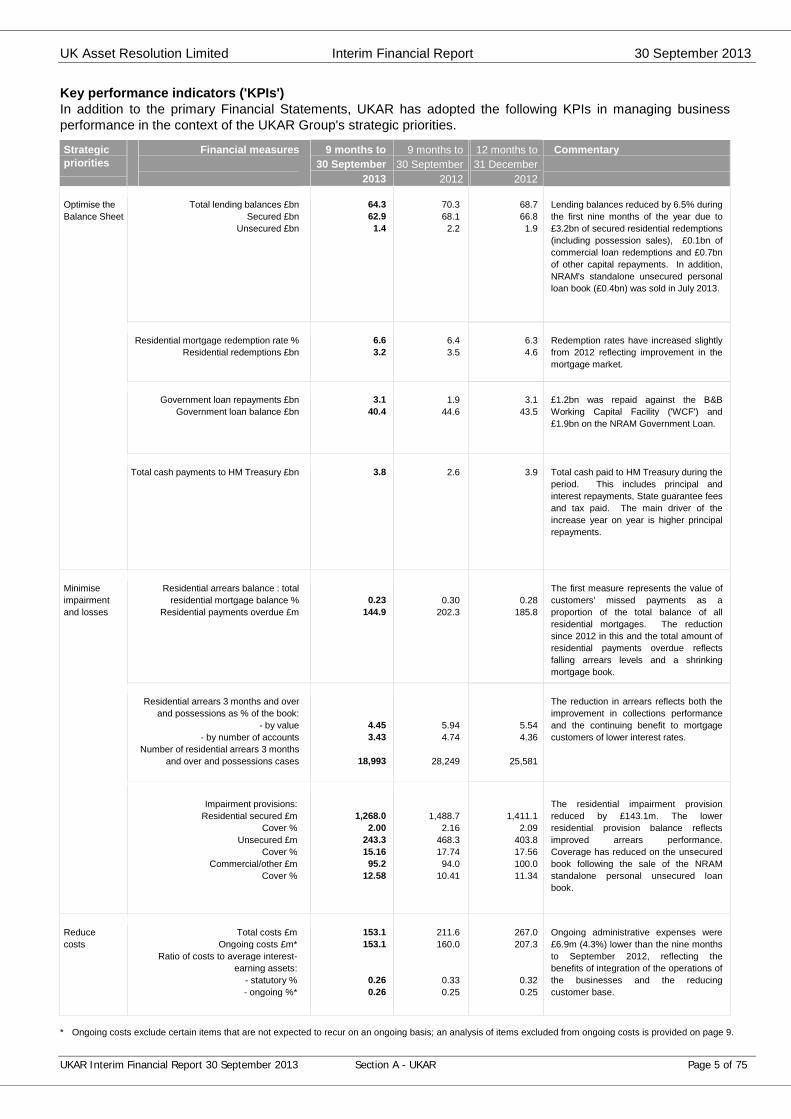
Key performance indicators ('KPIs')In addition to the primary Financial Statements, UKAR has adopted the following KPIs in managing businessperformance in the context of the UKAR Group's strategic priorities.
Strategicpriorities
Financial measures 9 months to 30 September
2013
9 months to30 September
2012
12 months to31 December
2012
Commentary
Total lending balances £bnSecured £bn
Unsecured £bn
64.362.9
1.4
70.368.1
2.2
68.766.81.9
Lending balances reduced by 6.5% duringthe first nine months of the year due to£3.2bn of secured residential redemptions(including possession sales), £0.1bn ofcommercial loan redemptions and £0.7bnof other capital repayments. In addition,NRAM's standalone unsecured personalloan book (£0.4bn) was sold in July 2013.
Residential mortgage redemption rate %Residential redemptions £bn
6.63.2
6.43.5
6.34.6
Redemption rates have increased slightlyfrom 2012 reflecting improvement in themortgage market.
Government loan repayments £bnGovernment loan balance £bn
3.140.4
1.944.6
3.143.5
£1.2bn was repaid against the B&BWorking Capital Facility ('WCF') and£1.9bn on the NRAM Government Loan.
Optimise theBalance Sheet
Total cash payments to HM Treasury £bn 3.8 2.6 3.9 Total cash paid to HM Treasury during theperiod. This includes principal andinterest repayments, State guarantee feesand tax paid. The main driver of theincrease year on year is higher principalrepayments.
Residential arrears balance : totalresidential mortgage balance %
Residential payments overdue £m0.23
144.90.30
202.30.28
185.8
The first measure represents the value ofcustomers’ missed payments as aproportion of the total balance of allresidential mortgages. The reductionsince 2012 in this and the total amount ofresidential payments overdue reflectsfalling arrears levels and a shrinkingmortgage book.
Residential arrears 3 months and overand possessions as % of the book:
- by value- by number of accounts
Number of residential arrears 3 monthsand over and possessions cases
4.453.43
18,993
5.944.74
28,249
5.544.36
25,581
The reduction in arrears reflects both theimprovement in collections performanceand the continuing benefit to mortgagecustomers of lower interest rates.
Minimiseimpairmentand losses
Impairment provisions:Residential secured £m
Cover %Unsecured £m
Cover %Commercial/other £m
Cover %
1,268.02.00
243.315.1695.2
12.58
1,488.72.16
468.317.7494.0
10.41
1,411.12.09
403.817.56100.011.34
The residential impairment provisionreduced by £143.1m. The lowerresidential provision balance reflectsimproved arrears performance.Coverage has reduced on the unsecuredbook following the sale of the NRAMstandalone personal unsecured loanbook.
Reducecosts
Total costs £mOngoing costs £m*
Ratio of costs to average interest-earning assets:
- statutory %- ongoing %*
153.1153.1
0.260.26
211.6160.0
0.330.25
267.0207.3
0.320.25
Ongoing administrative expenses were£6.9m (4.3%) lower than the nine monthsto September 2012, reflecting thebenefits of integration of the operations ofthe businesses and the reducingcustomer base.
* Ongoing costs exclude certain items that are not expected to recur on an ongoing basis; an analysis of items excluded from ongoing costs is provided on page 9.
UK Asset Resolution Limited Interim Financial Report 30 September 2013
UKAR Interim Financial Report 30 September 2013 Section A - UKAR Page 6 of 75
Financial review
Performance
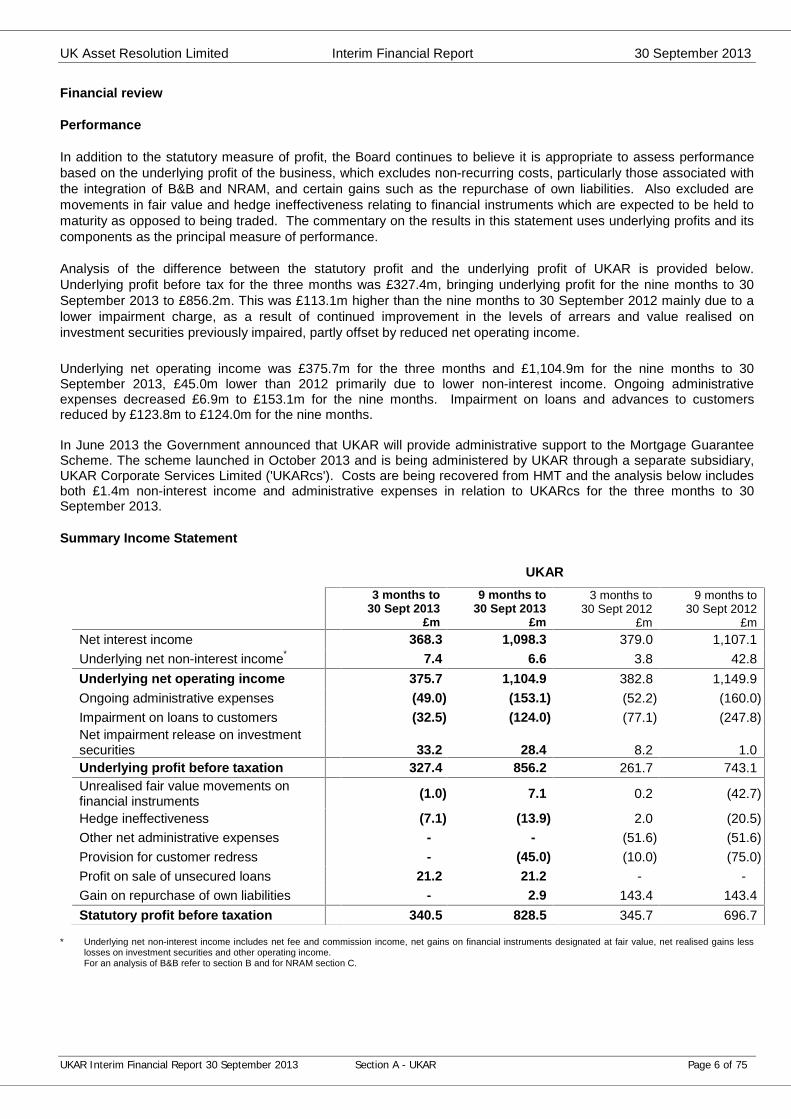
In addition to the statutory measure of profit, the Board continues to believe it is appropriate to assess performancebased on the underlying profit of the business, which excludes non-recurring costs, particularly those associated withthe integration of B&B and NRAM, and certain gains such as the repurchase of own liabilities. Also excluded aremovements in fair value and hedge ineffectiveness relating to financial instruments which are expected to be held tomaturity as opposed to being traded. The commentary on the results in this statement uses underlying profits and itscomponents as the principal measure of performance.
Analysis of the difference between the statutory profit and the underlying profit of UKAR is provided below.Underlying profit before tax for the three months was £327.4m, bringing underlying profit for the nine months to 30September 2013 to £856.2m. This was £113.1m higher than the nine months to 30 September 2012 mainly due to alower impairment charge, as a result of continued improvement in the levels of arrears and value realised oninvestment securities previously impaired, partly offset by reduced net operating income.
Underlying net operating income was £375.7m for the three months and £1,104.9m for the nine months to 30September 2013, £45.0m lower than 2012 primarily due to lower non-interest income. Ongoing administrativeexpenses decreased £6.9m to £153.1m for the nine months. Impairment on loans and advances to customersreduced by £123.8m to £124.0m for the nine months.
In June 2013 the Government announced that UKAR will provide administrative support to the Mortgage GuaranteeScheme. The scheme launched in October 2013 and is being administered by UKAR through a separate subsidiary,UKAR Corporate Services Limited ('UKARcs'). Costs are being recovered from HMT and the analysis below includesboth £1.4m non-interest income and administrative expenses in relation to UKARcs for the three months to 30September 2013.
Summary Income Statement
* Underlying net non-interest income includes net fee and commission income, net gains on financial instruments designated at fair value, net realised gains lesslosses on investment securities and other operating income.For an analysis of B&B refer to section B and for NRAM section C.
UKAR3 months to
30 Sept 2013£m
9 months to30 Sept 2013
£m
3 months to30 Sept 2012
£m
9 months to30 Sept 2012
£mNet interest income 368.3 1,098.3 379.0 1,107.1Underlying net non-interest income* 7.4 6.6 3.8 42.8Underlying net operating income 375.7 1,104.9 382.8 1,149.9Ongoing administrative expenses (49.0) (153.1) (52.2) (160.0)Impairment on loans to customers (32.5) (124.0) (77.1) (247.8)Net impairment release on investmentsecurities 33.2 28.4 8.2 1.0Underlying profit before taxation 327.4 856.2 261.7 743.1Unrealised fair value movements onfinancial instruments (1.0) 7.1 0.2 (42.7)
Hedge ineffectiveness (7.1) (13.9) 2.0 (20.5)Other net administrative expenses - - (51.6) (51.6)Provision for customer redress - (45.0) (10.0) (75.0)Profit on sale of unsecured loans 21.2 21.2 - -Gain on repurchase of own liabilities - 2.9 143.4 143.4Statutory profit before taxation 340.5 828.5 345.7 696.7
UK Asset Resolution Limited Interim Financial Report 30 September 2013
UKAR Interim Financial Report 30 September 2013 Section A - UKAR Page 7 of 75
Financial review (continued)
UKAR
Net interest income 3 months to30 Sept 2013
9 months to30 Sept 2013
3 months to30 Sept 2012
9 months to 30 Sept 2012
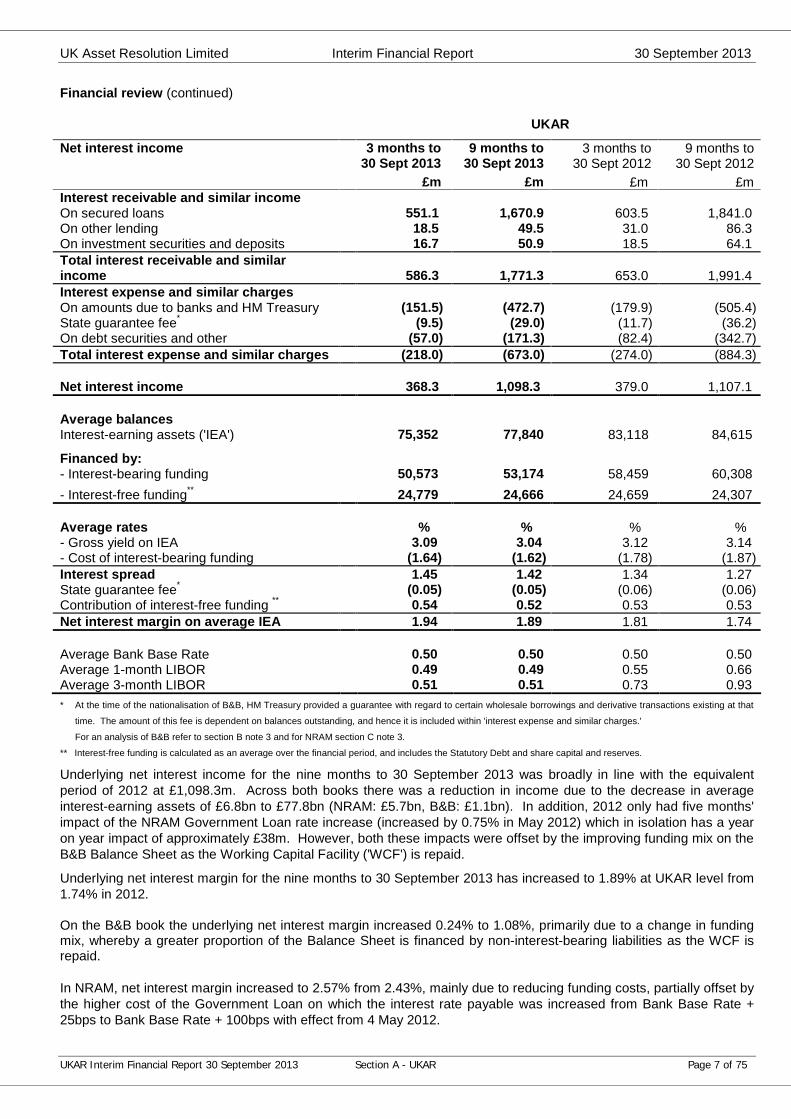
£m £m £m £mInterest receivable and similar incomeOn secured loans 551.1 1,670.9 603.5 1,841.0On other lending 18.5 49.5 31.0 86.3On investment securities and deposits 16.7 50.9 18.5 64.1Total interest receivable and similarincome 586.3 1,771.3 653.0 1,991.4Interest expense and similar chargesOn amounts due to banks and HM Treasury (151.5) (472.7) (179.9) (505.4)State guarantee fee* (9.5) (29.0) (11.7) (36.2)On debt securities and other (57.0) (171.3) (82.4) (342.7)Total interest expense and similar charges (218.0) (673.0) (274.0) (884.3)
Net interest income 368.3 1,098.3 379.0 1,107.1
Average balancesInterest-earning assets ('IEA') 75,352 77,840 83,118 84,615
Financed by:- Interest-bearing funding 50,573 53,174 58,459 60,308- Interest-free funding** 24,779 24,666 24,659 24,307
Average rates % % % %- Gross yield on IEA 3.09 3.04 3.12 3.14- Cost of interest-bearing funding (1.64) (1.62) (1.78) (1.87)Interest spread 1.45 1.42 1.34 1.27State guarantee fee* (0.05) (0.05) (0.06) (0.06)Contribution of interest-free funding ** 0.54 0.52 0.53 0.53Net interest margin on average IEA 1.94 1.89 1.81 1.74
Average Bank Base Rate 0.50 0.50 0.50 0.50Average 1-month LIBOR 0.49 0.49 0.55 0.66Average 3-month LIBOR 0.51 0.51 0.73 0.93* At the time of the nationalisation of B&B, HM Treasury provided a guarantee with regard to certain wholesale borrowings and derivative transactions existing at that
time. The amount of this fee is dependent on balances outstanding, and hence it is included within 'interest expense and similar charges.'
For an analysis of B&B refer to section B note 3 and for NRAM section C note 3.
** Interest-free funding is calculated as an average over the financial period, and includes the Statutory Debt and share capital and reserves.
Underlying net interest income for the nine months to 30 September 2013 was broadly in line with the equivalentperiod of 2012 at £1,098.3m. Across both books there was a reduction in income due to the decrease in averageinterest-earning assets of £6.8bn to £77.8bn (NRAM: £5.7bn, B&B: £1.1bn). In addition, 2012 only had five months'impact of the NRAM Government Loan rate increase (increased by 0.75% in May 2012) which in isolation has a yearon year impact of approximately £38m. However, both these impacts were offset by the improving funding mix on theB&B Balance Sheet as the Working Capital Facility ('WCF') is repaid.
Underlying net interest margin for the nine months to 30 September 2013 has increased to 1.89% at UKAR level from1.74% in 2012.
On the B&B book the underlying net interest margin increased 0.24% to 1.08%, primarily due to a change in fundingmix, whereby a greater proportion of the Balance Sheet is financed by non-interest-bearing liabilities as the WCF isrepaid.
In NRAM, net interest margin increased to 2.57% from 2.43%, mainly due to reducing funding costs, partially offset bythe higher cost of the Government Loan on which the interest rate payable was increased from Bank Base Rate +25bps to Bank Base Rate + 100bps with effect from 4 May 2012.
UK Asset Resolution Limited Interim Financial Report 30 September 2013
UKAR Interim Financial Report 30 September 2013 Section A - UKAR Page 8 of 75
Financial review (continued)
Underlying net non-interest income
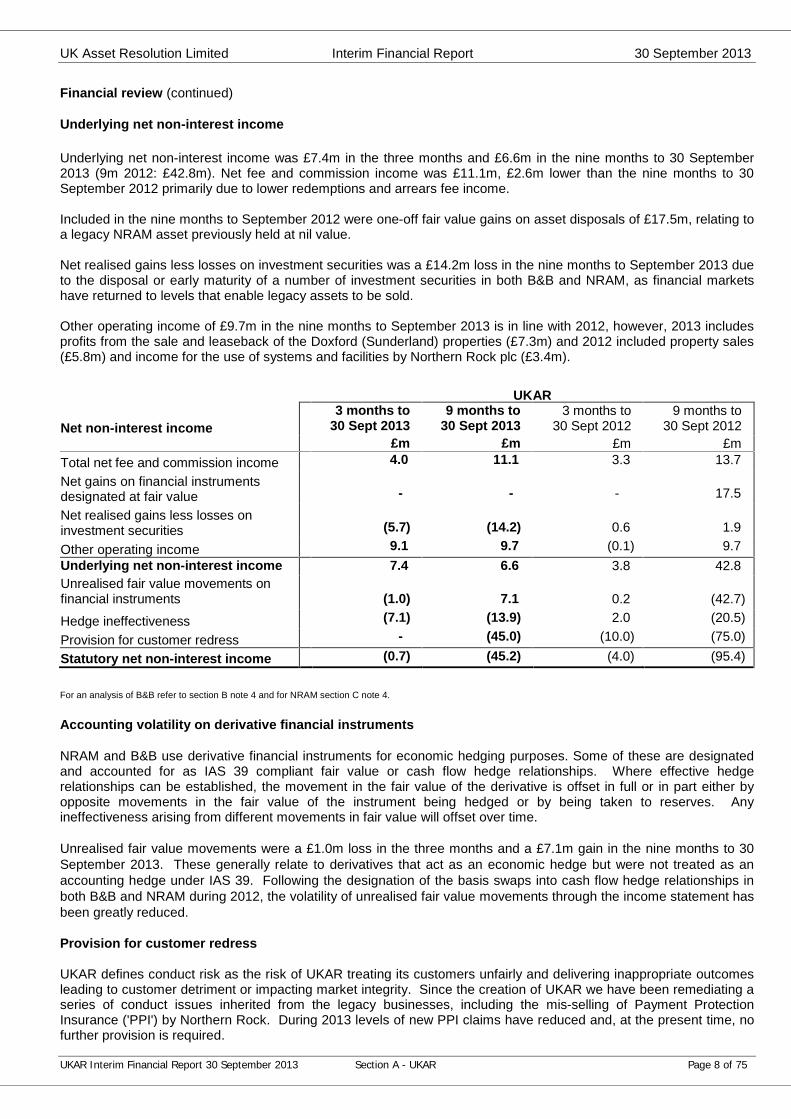
Underlying net non-interest income was £7.4m in the three months and £6.6m in the nine months to 30 September2013 (9m 2012: £42.8m). Net fee and commission income was £11.1m, £2.6m lower than the nine months to 30September 2012 primarily due to lower redemptions and arrears fee income.
Included in the nine months to September 2012 were one-off fair value gains on asset disposals of £17.5m, relating toa legacy NRAM asset previously held at nil value.
Net realised gains less losses on investment securities was a £14.2m loss in the nine months to September 2013 dueto the disposal or early maturity of a number of investment securities in both B&B and NRAM, as financial marketshave returned to levels that enable legacy assets to be sold.
Other operating income of £9.7m in the nine months to September 2013 is in line with 2012, however, 2013 includesprofits from the sale and leaseback of the Doxford (Sunderland) properties (£7.3m) and 2012 included property sales(£5.8m) and income for the use of systems and facilities by Northern Rock plc (£3.4m).
UKAR
Net non-interest income3 months to
30 Sept 20139 months to
30 Sept 20133 months to
30 Sept 20129 months to
30 Sept 2012£m £m £m £m
Total net fee and commission income 4.0 11.1 3.3 13.7Net gains on financial instrumentsdesignated at fair value - - - 17.5
Net realised gains less losses oninvestment securities (5.7) (14.2) 0.6 1.9
Other operating income 9.1 9.7 (0.1) 9.7Underlying net non-interest income 7.4 6.6 3.8 42.8Unrealised fair value movements onfinancial instruments (1.0) 7.1 0.2 (42.7)
Hedge ineffectiveness (7.1) (13.9) 2.0 (20.5)
Provision for customer redress - (45.0) (10.0) (75.0)
Statutory net non-interest income (0.7) (45.2) (4.0) (95.4)
For an analysis of B&B refer to section B note 4 and for NRAM section C note 4.
Accounting volatility on derivative financial instruments
NRAM and B&B use derivative financial instruments for economic hedging purposes. Some of these are designatedand accounted for as IAS 39 compliant fair value or cash flow hedge relationships. Where effective hedgerelationships can be established, the movement in the fair value of the derivative is offset in full or in part either byopposite movements in the fair value of the instrument being hedged or by being taken to reserves. Anyineffectiveness arising from different movements in fair value will offset over time.
Unrealised fair value movements were a £1.0m loss in the three months and a £7.1m gain in the nine months to 30September 2013. These generally relate to derivatives that act as an economic hedge but were not treated as anaccounting hedge under IAS 39. Following the designation of the basis swaps into cash flow hedge relationships inboth B&B and NRAM during 2012, the volatility of unrealised fair value movements through the income statement hasbeen greatly reduced.
Provision for customer redress
UKAR defines conduct risk as the risk of UKAR treating its customers unfairly and delivering inappropriate outcomesleading to customer detriment or impacting market integrity. Since the creation of UKAR we have been remediating aseries of conduct issues inherited from the legacy businesses, including the mis-selling of Payment ProtectionInsurance ('PPI') by Northern Rock. During 2013 levels of new PPI claims have reduced and, at the present time, nofurther provision is required.
UK Asset Resolution Limited Interim Financial Report 30 September 2013
UKAR Interim Financial Report 30 September 2013 Section A - UKAR Page 9 of 75
Financial review (continued)
Provision for customer redress (continued)
A further issue that has previously been reported was in respect of non-compliant Consumer Credit Act ('CCA') loans,being loans where the original loan amount offered was under £25,000. In 2012 £271m was provided for remediatingnon-compliant CCA loans and 126,000 customers have now been contacted and their accounts corrected. At June2013 we provided a further £47m primarily on accounts previously sold by Northern Rock plc prior to nationalisation,which were subject to the same problem and released £2m in respect of provisions for other remediation activities.
UKAR are not remediating customers with loans that fall outside the limit of the CCA regulation but who have beenissued with CCA documentation in the past. We have obtained legal advice and have concluded that this is thecorrect course of action but it is possible that this could, in the future, be tested in the courts. We have noted thiscontingent liability in the attached Interim Financial Report of NRAM. Since discovering the issues with the CCAloans, a review of customer documentation has been conducted to ensure customers have been treatedappropriately. As a result, no further provisions have been made as at September.
Ongoing administrative expenses
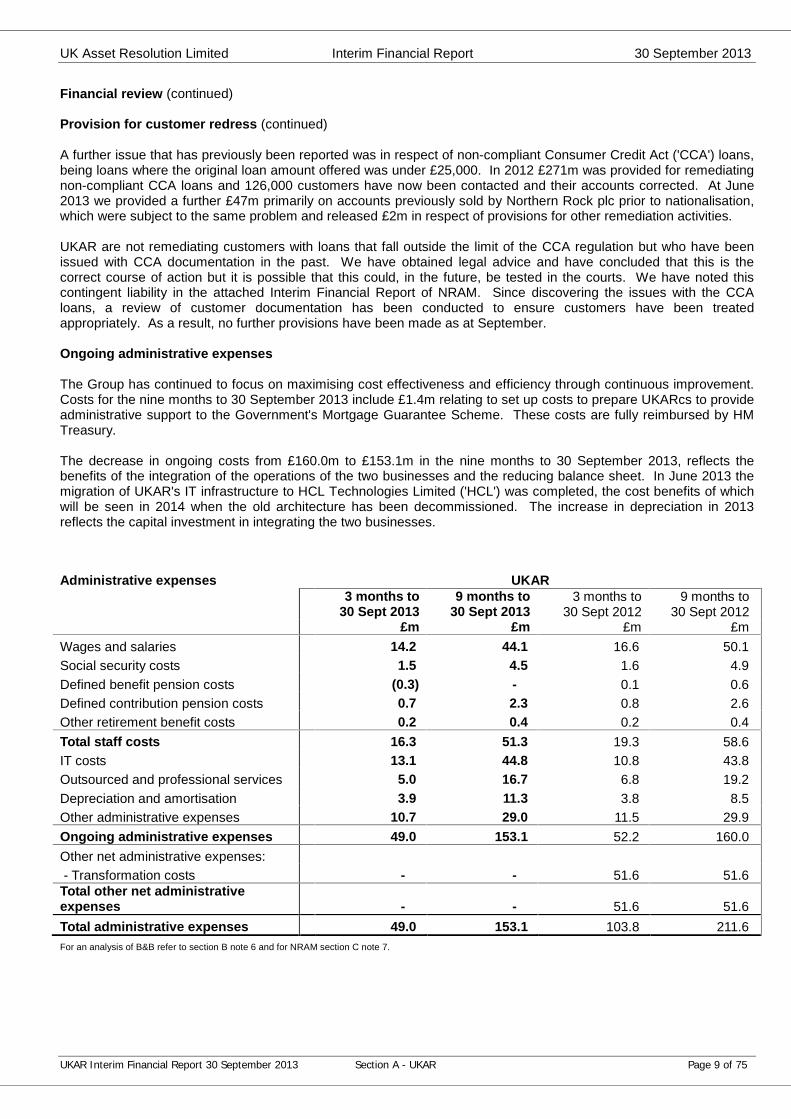
The Group has continued to focus on maximising cost effectiveness and efficiency through continuous improvement.Costs for the nine months to 30 September 2013 include £1.4m relating to set up costs to prepare UKARcs to provideadministrative support to the Government's Mortgage Guarantee Scheme. These costs are fully reimbursed by HMTreasury.
The decrease in ongoing costs from £160.0m to £153.1m in the nine months to 30 September 2013, reflects thebenefits of the integration of the operations of the two businesses and the reducing balance sheet. In June 2013 themigration of UKAR's IT infrastructure to HCL Technologies Limited ('HCL') was completed, the cost benefits of whichwill be seen in 2014 when the old architecture has been decommissioned. The increase in depreciation in 2013reflects the capital investment in integrating the two businesses.
Administrative expenses UKAR3 months to
30 Sept 20139 months to
30 Sept 20133 months to
30 Sept 20129 months to
30 Sept 2012£m £m £m £m
Wages and salaries 14.2 44.1 16.6 50.1Social security costs 1.5 4.5 1.6 4.9Defined benefit pension costs (0.3) - 0.1 0.6Defined contribution pension costs 0.7 2.3 0.8 2.6Other retirement benefit costs 0.2 0.4 0.2 0.4Total staff costs 16.3 51.3 19.3 58.6IT costs 13.1 44.8 10.8 43.8Outsourced and professional services 5.0 16.7 6.8 19.2Depreciation and amortisation 3.9 11.3 3.8 8.5Other administrative expenses 10.7 29.0 11.5 29.9Ongoing administrative expenses 49.0 153.1 52.2 160.0Other net administrative expenses:- Transformation costs - - 51.6 51.6
Total other net administrativeexpenses - - 51.6 51.6Total administrative expenses 49.0 153.1 103.8 211.6For an analysis of B&B refer to section B note 6 and for NRAM section C note 7.
UK Asset Resolution Limited Interim Financial Report 30 September 2013
UKAR Interim Financial Report 30 September 2013 Section A - UKAR Page 10 of 75
Financial review (continued)
Other net administrative expenses
No 'other net administrative expenses' have been incurred in 2013. The £51.6m incurred in the nine months to 30September 2012 mainly reflects investment in UKAR's IT platform through the transfer to the new outsourced providerHCL and costs associated with the exit from the Gosforth site.
Arrears and loan impairment
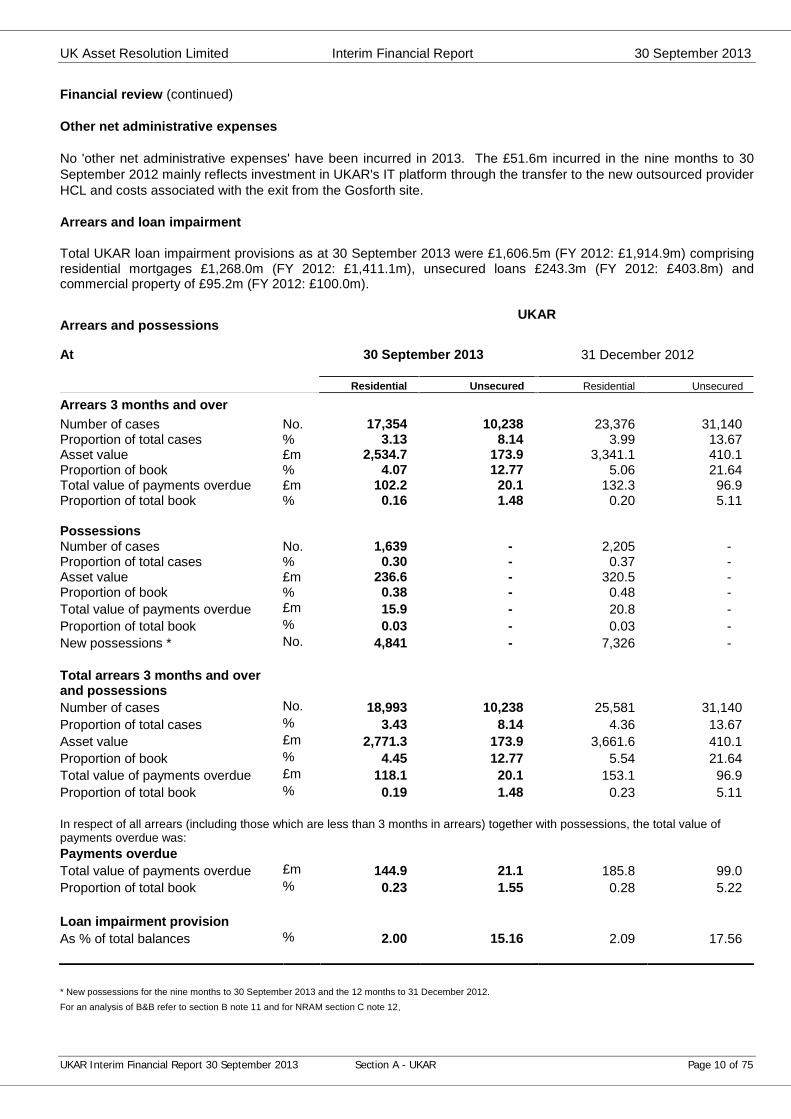
Total UKAR loan impairment provisions as at 30 September 2013 were £1,606.5m (FY 2012: £1,914.9m) comprisingresidential mortgages £1,268.0m (FY 2012: £1,411.1m), unsecured loans £243.3m (FY 2012: £403.8m) andcommercial property of £95.2m (FY 2012: £100.0m).
Arrears and possessionsUKAR
At 30 September 2013 31 December 2012
Residential Unsecured Residential Unsecured
Arrears 3 months and overNumber of cases No. 17,354 10,238 23,376 31,140Proportion of total cases % 3.13 8.14 3.99 13.67Asset value £m 2,534.7 173.9 3,341.1 410.1Proportion of book % 4.07 12.77 5.06 21.64Total value of payments overdue £m 102.2 20.1 132.3 96.9Proportion of total book % 0.16 1.48 0.20 5.11
PossessionsNumber of cases No. 1,639 - 2,205 -Proportion of total cases % 0.30 - 0.37 -Asset value £m 236.6 - 320.5 -Proportion of book % 0.38 - 0.48 -Total value of payments overdue £m 15.9 - 20.8 -Proportion of total book % 0.03 - 0.03 -New possessions * No. 4,841 - 7,326 -
Total arrears 3 months and overand possessionsNumber of cases No. 18,993 10,238 25,581 31,140Proportion of total cases % 3.43 8.14 4.36 13.67Asset value £m 2,771.3 173.9 3,661.6 410.1Proportion of book % 4.45 12.77 5.54 21.64Total value of payments overdue £m 118.1 20.1 153.1 96.9Proportion of total book % 0.19 1.48 0.23 5.11
In respect of all arrears (including those which are less than 3 months in arrears) together with possessions, the total value ofpayments overdue was:Payments overdueTotal value of payments overdue £m 144.9 21.1 185.8 99.0Proportion of total book % 0.23 1.55 0.28 5.22
Loan impairment provisionAs % of total balances % 2.00 15.16 2.09 17.56
* New possessions for the nine months to 30 September 2013 and the 12 months to 31 December 2012.For an analysis of B&B refer to section B note 11 and for NRAM section C note 12.
UK Asset Resolution Limited Interim Financial Report 30 September 2013
UKAR Interim Financial Report 30 September 2013 Section A - UKAR Page 11 of 75
Financial review (continued)
Arrears and loan impairment (continued)
Arrears and loan impairment: residential loans
Strong arrears performance continues. UKAR has seen arrears in both companies fall notwithstanding thechallenging economic conditions. At UKAR level, the number of mortgage accounts 3 or more months in arrears,including those in possession, has reduced by 26% since 31 December 2012.
UKAR adheres to the FCA's regulatory guidance regarding Treating Customers Fairly and continues to work closelywith customers experiencing, or likely to experience, financial difficulty in maintaining their mortgage payments.UKAR offers a range of measures to support these customers depending upon their individual circumstances andability to pay with the long term aim of sustaining their mortgage commitments and remaining in their homes.Possession continues to be a last resort.
The total number of cases 3 or more months in arrears, including those in possession, reduced by 26% from 25,581at 31 December 2012 to 18,993 at 30 September 2013. The total value of debt owed by residential customers hasreduced from £185.8m at 31 December 2012 to £144.9m at 30 September 2013 equivalent to 0.23% of mortgagebalances (FY 2012: 0.28%).
Provisions for residential loan impairment held on the Balance Sheet have reduced by £143.1m since 31 December2012 to £1,268.0m (FY 2012: £1,411.1m) reflecting the reduction in arrears cases.
Total UKAR fraud and professional negligence provisions have decreased by £4.1m since 31 December 2012 to£367.5m (FY 2012: £371.6m). Total UKAR fraud provisions represent coverage of 47% of suspected fraud andprofessional negligence cases (FY 2012: 46%). Within the B&B book, fraud and professional negligence provisionshave reduced since 31 December 2012 by £14.8m to £301.5m (FY 2012: £316.3m). The NRAM provision hasincreased by £10.7m to £66.0m (FY 2012: £55.3m) having recategorised provisions relating to commercial loanswhere potential professional negligence is now being investigated.
As a proportion of balances, the residential impairment provision was 2.00% (FY 2012: 2.09%). The residential loanimpairment charge was £74.3m for the nine months to September 2013, £103.4m lower than the nine months to 30September 2012 as the charge benefited from lower arrears volumes.
The number of properties in possession for UKAR decreased from 2,205 at the end of 2012 to 1,639 at 30 September2013. Within B&B, possession stock decreased from 717 cases at 31 December 2012 to 514 at 30 September 2013.In NRAM possession stock reduced to 1,125 cases from 1,488 at 31 December 2012. A total of 4,841 propertieswere taken into possession in the nine month period (FY 2012: 7,326).
In addition to residential property possessions, we also have a number of buy-to-let properties managed by Law ofProperty Act ('LPA') receivers. Our LPA 'for sale' stock decreased from 306 cases at 31 December 2012 to 224 at 30September 2013.
During the nine months, 5,407 cases (FY 2012: 7,826) were sold following possession and a further 230 cases (FY2012: 1,237) were sold which were under LPA management. Realised losses on properties sold following possessionor sold by an LPA were £251.0m (FY 2012: £458.8m), all of which had previously been fully provided for. Withinthese losses were fraudulent and professional negligence losses within B&B of £18.8m (FY 2012: £55.8m).
Arrears and loan impairment: unsecured loans
The standalone NRAM unsecured personal loan book was sold in July 2013 and hence is excluded from the arrearsfigures in the table on page 10. Comparative figures for December 2012 include these loans.
The number of unsecured loans 3 months or more in arrears was 10,238 cases (FY 2012: 31,140). The charge forunsecured loan impairment for the nine months to 30 September 2013 was lower than the equivalent period in 2012at £40.3m (9m 2012: £64.2m). Asset coverage was 15.2% at 30 September 2013 (FY 2012: 17.6%).
The provision for unsecured loans was £243.3m (FY 2012: £403.8m). Realised losses in the nine months toSeptember 2013 were £57.5m (FY 2012: £155.4m), all of which had previously been fully provided for.
UK Asset Resolution Limited Interim Financial Report 30 September 2013
UKAR Interim Financial Report 30 September 2013 Section A - UKAR Page 12 of 75
Financial review (continued)
Arrears and loan impairment (continued)
Arrears and loan impairment: commercial loans
The provision for the commercial book has decreased to £95.2m from £100.0m at 31 December 2012, with coverageat 12.6% (FY 2012: 11.3%). We continually review the level of provisions against each individual loan based oncurrent and future property valuations, future rental income projections, tenant quality and general market conditions.
Net impairment release on investment securities
UKAR continues to review securities held on our Balance Sheets and believes the risk of further impairment is notsignificant. During the nine months to September we have identified a number of assets in both B&B and NRAMwhere events have occurred that cause us to reverse impairments previously charged. These have resulted in a netcredit to impairment of £28.4m (9m 2012: £1.0m).
Taxation
The total Income Statement tax charge for the three month period was £82.5m bringing the tax charge for the ninemonth period ended 30 September 2013 to £198.6m (9m 2012: £124.8m). Given the statutory profit before taxation of£828.5m (9m 2012 £696.7m) this equates to an effective tax rate of 24.0% (9m 2012: 17.9%). The 2012 rate wassignificantly lower due to the release of tax provisions in NRAM.
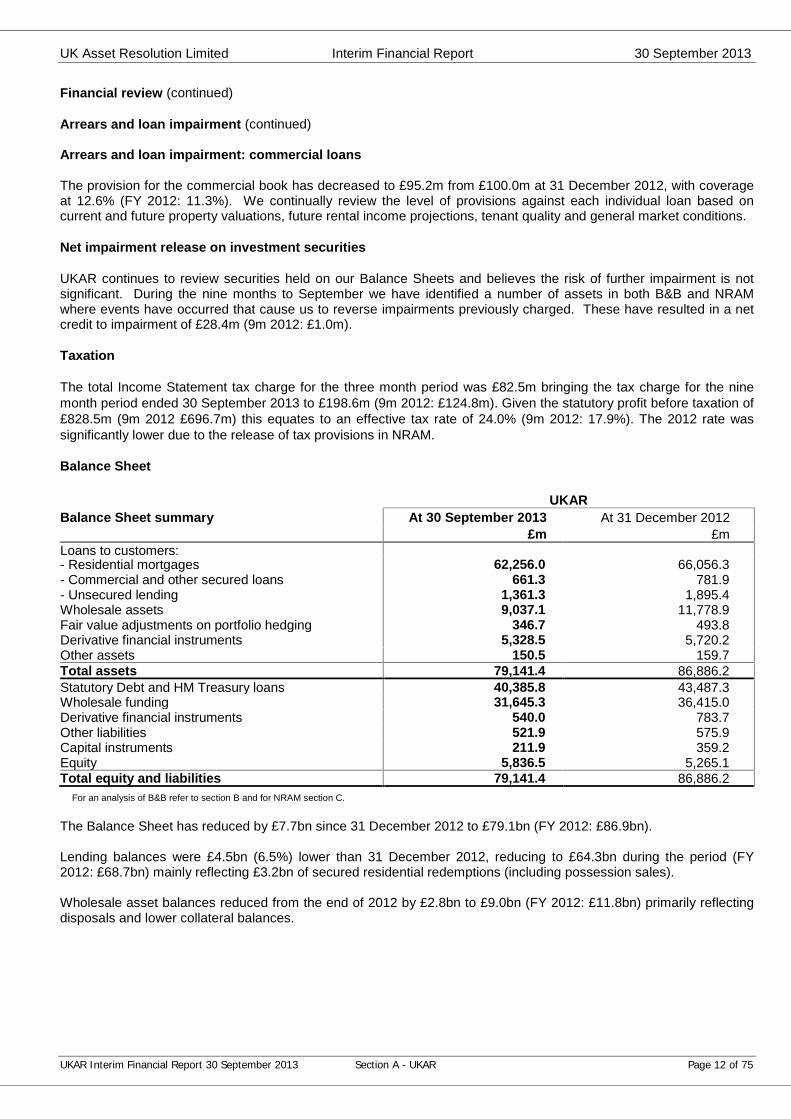
Balance Sheet
UKARBalance Sheet summary At 30 September 2013 At 31 December 2012
£m £mLoans to customers:- Residential mortgages 62,256.0 66,056.3- Commercial and other secured loans 661.3 781.9- Unsecured lending 1,361.3 1,895.4Wholesale assets 9,037.1 11,778.9Fair value adjustments on portfolio hedging 346.7 493.8Derivative financial instruments 5,328.5 5,720.2Other assets 150.5 159.7Total assets 79,141.4 86,886.2Statutory Debt and HM Treasury loans 40,385.8 43,487.3Wholesale funding 31,645.3 36,415.0Derivative financial instruments 540.0 783.7Other liabilities 521.9 575.9Capital instruments 211.9 359.2Equity 5,836.5 5,265.1Total equity and liabilities 79,141.4 86,886.2
For an analysis of B&B refer to section B and for NRAM section C.
The Balance Sheet has reduced by £7.7bn since 31 December 2012 to £79.1bn (FY 2012: £86.9bn).
Lending balances were £4.5bn (6.5%) lower than 31 December 2012, reducing to £64.3bn during the period (FY2012: £68.7bn) mainly reflecting £3.2bn of secured residential redemptions (including possession sales).
Wholesale asset balances reduced from the end of 2012 by £2.8bn to £9.0bn (FY 2012: £11.8bn) primarily reflectingdisposals and lower collateral balances.

UK Asset Resolution Limited Interim Financial Report 30 September 2013
UKAR Interim Financial Report 30 September 2013 Section A - UKAR Page 13 of 75
Financial review (continued)
Liabilities
The WCF and HM Treasury loans reduced by £3.1bn from 31 December 2012 to £40.4bn (FY 2012: £43.5bn) due torepayments having been made in the period (B&B: £1.2bn, NRAM: £1.9bn). UKAR did not draw down on any facilityduring the period. In addition, £4.0bn of other external wholesale funding was repaid in the nine months to 30September 2013 (9m 2012: £4.0bn).
Cash payments
At the end of 2012, UKAR had £27.8bn of funding from HM Treasury, plus a further £15.7bn owed to the FinancialServices Compensation Scheme ('FSCS'). Repayment of this debt remains a primary objective of UKAR. In the ninemonth period a further £3.1bn (FY 2012: £3.1bn) of HM Treasury debt was repaid. In addition, other cash flows weregenerated for Her Majesty's Government in the form of State guarantee fees, interest and taxes. The Boardconsiders the total of all these cash flows paid to HM Treasury to be an important measure. Total cash paymentsduring the nine months to 30 September 2013 to HM Treasury were £3.8bn (FY 2012: £4.0bn).
Capital
The Group's capital is provided by its shareholders (currently HM Treasury) and the holders of subordinated notesand subordinated liabilities.
The regulated Group companies met their capital requirements in full throughout the year and have received noadditional capital from HM Treasury.
Capital Resources - B&B plc (company only)
At 30 September 2013 31 December 2012£m £m
Share capital and reserves 2,590.3 2,382.6Available-for-sale reserve adjustments (23.8) (17.1)Cash flow hedge reserve adjustments (48.9) (86.8)Net pension adjustment - (103.3)Less: deductions (515.2) (521.3)Tier 1 capital 2,002.4 1,654.1Capital instruments 80.5 83.6Total capital 2,082.9 1,737.7
Capital Resources - NRAM plc (company only)
At 30 September 2013 31 December 2012£m £m
Share capital and reserves 2,997.2 2,515.1Available-for-sale reserve adjustments 45.8 73.7Cash flow hedge reserve adjustments (136.9) (192.2)Net pension adjustment (56.4) (43.0)Reserve capital instruments 101.4 101.4Tier one notes 41.3 41.9Less: deductions (0.9) (1.1)Tier 1 capital 2,991.5 2,495.8Subordinated notes 23.4 23.4Subordinated liabilities - 150.7Total capital 3,014.9 2,669.9
UK Asset Resolution Limited Interim Financial Report 30 September 2013
UKAR Interim Financial Report 30 September 2013 Section A - UKAR Page 14 of 75
Financial review (continued)
Capital Resources (continued)
B&B plc total capital resources and Tier 1 capital are £345.2m and £348.3m higher than 31 December 2012respectively, the increases being a result of profits in the year and reduced pension adjustments. In 2012, B&B's Tier1 capital was adjusted to reflect future payments which B&B had committed to make to address the deficit on thedefined benefit pension scheme (31 December 2012: £103.3m). At 30 September 2013, as permitted by thePrudential Regulation Authority's ('PRA's') capital rules, B&B has elected to make no such adjustment but to leave thepension deficit as per the Balance Sheet.
NRAM plc total capital resources are £345.0m higher than 31 December 2012 due to profits generated in the year,partially offset by the maturity of £150.7m subordinated liabilities. Tier 1 capital is £495.7m higher due to profitsgenerated in the period.
B&B and NRAM operate under the rules of the Prudential Sourcebook for Mortgage and Home Finance Firms, andInsurance Intermediaries ('MIPRU'). The regulated companies within the UKAR Group are required to hold capital inexcess of 1% of total Balance Sheet assets plus any undrawn commitments. However, the Board believes it shouldhold capital above 1% reflecting the increased risk in the business compared to a standard MIPRU firm. At 30September 2013 capital in B&B plc represented 5.7% of B&B company assets; NRAM plc capital represented 7.1% ofNRAM company assets.
OTHER INFORMATION
Board changes
Phillip McLelland, Finance Director will leave UKAR at the end of November for a new role with Provident Financialplc. UKFI has appointed Christopher Fox as one of their representative Non-Executive Directors to manage HMGovernment's shareholdings in UKAR, replacing Jim O'Neil. In addition, as indicated in our 2012 Report & Accounts,Lady Louise Patten will be stepping down as a Non-Executive Director at the end of the year having served on theB&B Board since 2003. At the beginning of 2014, the UKAR Board will, therefore, comprise the Chairman, fourindependent Directors, two UKFI nominated Directors and one Executive Director.
UK Asset Resolution Limited
UKAR was established on 1 October 2010 to facilitate the orderly management of the closed mortgage books of bothB&B and NRAM to maximise value for taxpayers. The Executive team of UKAR manages both organisations focusingon this common objective, while ensuring that both companies continue to treat customers fairly, deliver consistentlyhigh levels of service and support those customers facing financial difficulty.
Bradford & Bingley plc
On 29 September 2008, all of B&B’s retail branches and its savings accounts were transferred to Banco SantanderGroup. The remainder of the business, including the mortgage books of B&B and specialist lending arm MortgageExpress, were nationalised and taken into public ownership by the Government. B&B is permanently closed to newlending, but continues to provide services to some 193,000 existing mortgage borrowers, with 269,000 mortgageaccounts.
Northern Rock (Asset Management) plc
Northern Rock was nationalised and taken into Government ownership in February 2008 and was then restructuredinto two legal entities with effect from 1 January 2010 - Northern Rock plc and Northern Rock (Asset Management)plc. NRAM retained the majority of the pre-existing mortgage book and all pre-existing unsecured loan accounts.NRAM is permanently closed to new lending, but continues to provide services to some 298,000 existing borrowers,with 285,000 mortgage accounts and 126,000 unsecured loan accounts.
UK Asset Resolution Limited Interim Financial Report 30 September 2013
UKAR Interim Financial Report 30 September 2013 Section A - UKAR Page 15 of 75
UK Asset Resolution Limited - Consolidated Financial Results
Consolidated Income Statement3 months to
30 Sept 20139 months to
30 Sept 20133 months to 30
Sept 20129 months to
30 Sept 2012£m £m £m £m
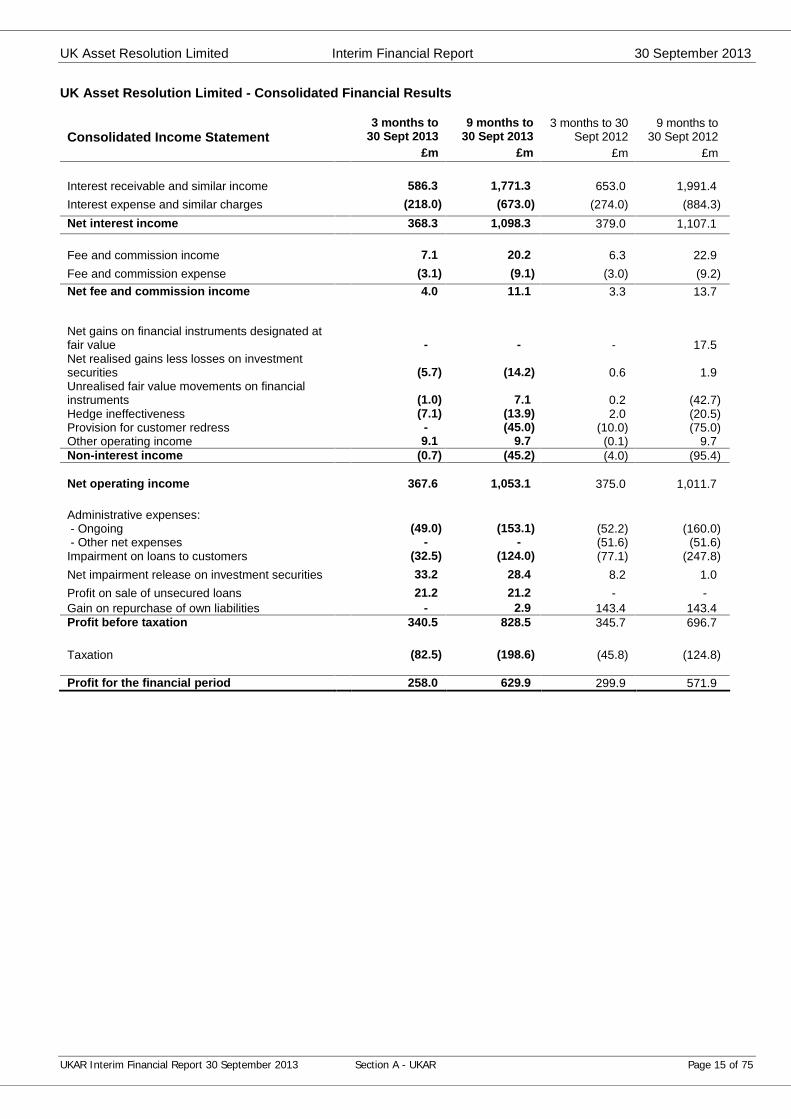
Interest receivable and similar income 586.3 1,771.3 653.0 1,991.4Interest expense and similar charges (218.0) (673.0) (274.0) (884.3)Net interest income 368.3 1,098.3 379.0 1,107.1
Fee and commission income 7.1 20.2 6.3 22.9Fee and commission expense (3.1) (9.1) (3.0) (9.2)Net fee and commission income 4.0 11.1 3.3 13.7
Net gains on financial instruments designated atfair value - - - 17.5Net realised gains less losses on investmentsecurities (5.7) (14.2) 0.6 1.9Unrealised fair value movements on financialinstruments (1.0) 7.1 0.2 (42.7)Hedge ineffectiveness (7.1) (13.9) 2.0 (20.5)Provision for customer redress - (45.0) (10.0) (75.0)Other operating income 9.1 9.7 (0.1) 9.7Non-interest income (0.7) (45.2) (4.0) (95.4)
Net operating income 367.6 1,053.1 375.0 1,011.7
Administrative expenses:- Ongoing (49.0) (153.1) (52.2) (160.0)- Other net expenses - - (51.6) (51.6)
Impairment on loans to customers (32.5) (124.0) (77.1) (247.8)Net impairment release on investment securities 33.2 28.4 8.2 1.0Profit on sale of unsecured loans 21.2 21.2 - -Gain on repurchase of own liabilities - 2.9 143.4 143.4Profit before taxation 340.5 828.5 345.7 696.7
Taxation (82.5) (198.6) (45.8) (124.8)
Profit for the financial period 258.0 629.9 299.9 571.9
UK Asset Resolution Limited Interim Financial Report 30 September 2013
UKAR Interim Financial Report 30 September 2013 Section A - UKAR Page 16 of 75
Consolidated Financial Results (continued)
Consolidated Balance Sheet
At 30 September 2013 31 December 2012 £m £m
Assets
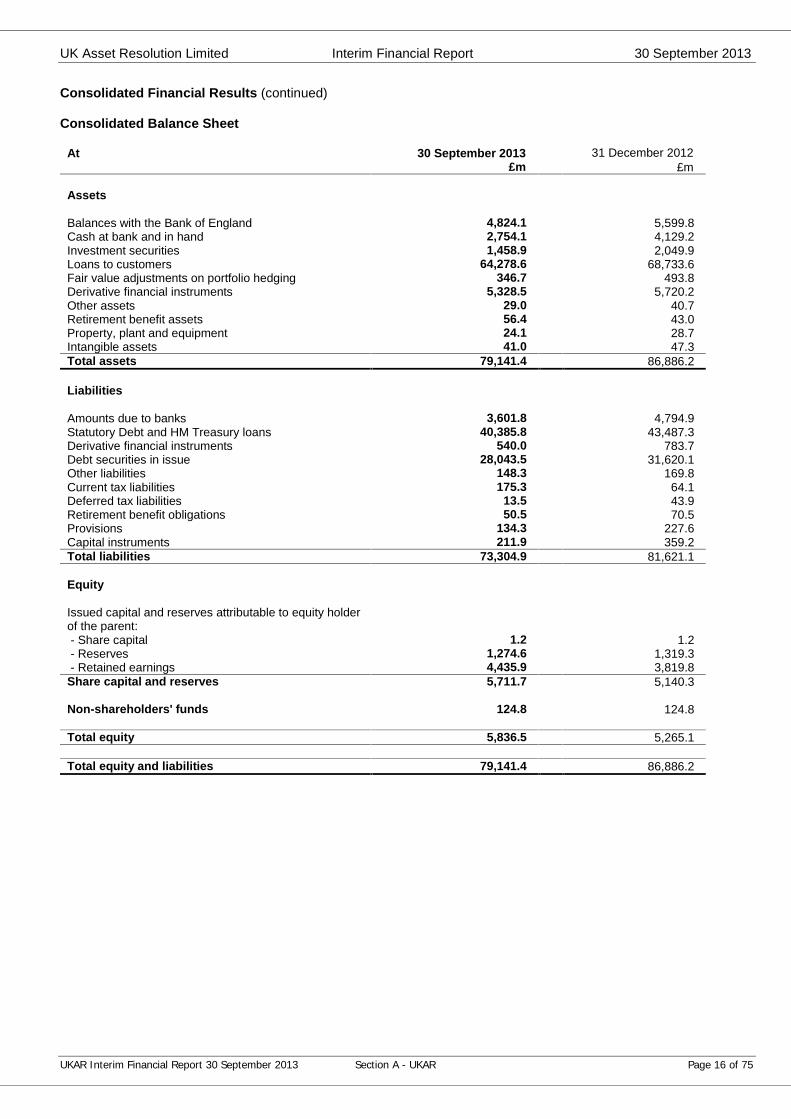
Balances with the Bank of England 4,824.1 5,599.8Cash at bank and in hand 2,754.1 4,129.2Investment securities 1,458.9 2,049.9Loans to customers 64,278.6 68,733.6Fair value adjustments on portfolio hedging 346.7 493.8Derivative financial instruments 5,328.5 5,720.2Other assets 29.0 40.7Retirement benefit assets 56.4 43.0Property, plant and equipment 24.1 28.7Intangible assets 41.0 47.3Total assets 79,141.4 86,886.2
Liabilities
Amounts due to banks 3,601.8 4,794.9Statutory Debt and HM Treasury loans 40,385.8 43,487.3Derivative financial instruments 540.0 783.7Debt securities in issue 28,043.5 31,620.1Other liabilities 148.3 169.8Current tax liabilities 175.3 64.1Deferred tax liabilities 13.5 43.9Retirement benefit obligations 50.5 70.5Provisions 134.3 227.6Capital instruments 211.9 359.2Total liabilities 73,304.9 81,621.1
Equity
Issued capital and reserves attributable to equity holderof the parent:- Share capital 1.2 1.2- Reserves 1,274.6 1,319.3- Retained earnings 4,435.9 3,819.8
Share capital and reserves 5,711.7 5,140.3
Non-shareholders' funds 124.8 124.8
Total equity 5,836.5 5,265.1
Total equity and liabilities 79,141.4 86,886.2
Bradford & Bingley plc Interim Financial Report 30 September 2013
UKAR Interim Financial Report 30 September 2013 Section B - B&B Page 17 of 75
Section BBradford & Bingley plc
Interim Financial Reportfor the 9 months ended 30 September 2013
Bradford & Bingley plc Interim Financial Report 30 September 2013
UKAR Interim Financial Report 30 September 2013 Section B - B&B Page 18 of 75
Bradford & Bingley plc
Interim Financial Report for the 9 months ended 30 September 2013
KEY HIGHLIGHTS
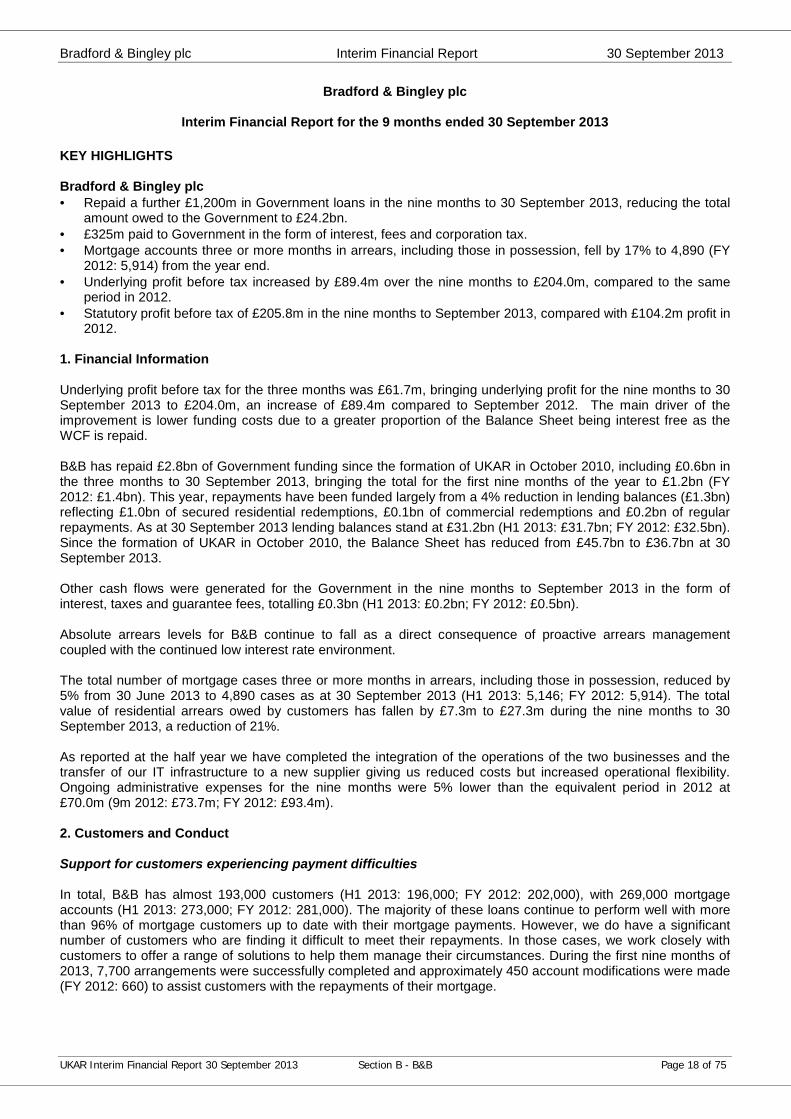
Bradford & Bingley plc Repaid a further £1,200m in Government loans in the nine months to 30 September 2013, reducing the total
amount owed to the Government to £24.2bn. £325m paid to Government in the form of interest, fees and corporation tax. Mortgage accounts three or more months in arrears, including those in possession, fell by 17% to 4,890 (FY
2012: 5,914) from the year end. Underlying profit before tax increased by £89.4m over the nine months to £204.0m, compared to the same
period in 2012. Statutory profit before tax of £205.8m in the nine months to September 2013, compared with £104.2m profit in
2012.
1. Financial Information
Underlying profit before tax for the three months was £61.7m, bringing underlying profit for the nine months to 30September 2013 to £204.0m, an increase of £89.4m compared to September 2012. The main driver of theimprovement is lower funding costs due to a greater proportion of the Balance Sheet being interest free as theWCF is repaid.
B&B has repaid £2.8bn of Government funding since the formation of UKAR in October 2010, including £0.6bn inthe three months to 30 September 2013, bringing the total for the first nine months of the year to £1.2bn (FY2012: £1.4bn). This year, repayments have been funded largely from a 4% reduction in lending balances (£1.3bn)reflecting £1.0bn of secured residential redemptions, £0.1bn of commercial redemptions and £0.2bn of regularrepayments. As at 30 September 2013 lending balances stand at £31.2bn (H1 2013: £31.7bn; FY 2012: £32.5bn).Since the formation of UKAR in October 2010, the Balance Sheet has reduced from £45.7bn to £36.7bn at 30September 2013.
Other cash flows were generated for the Government in the nine months to September 2013 in the form ofinterest, taxes and guarantee fees, totalling £0.3bn (H1 2013: £0.2bn; FY 2012: £0.5bn).
Absolute arrears levels for B&B continue to fall as a direct consequence of proactive arrears managementcoupled with the continued low interest rate environment.
The total number of mortgage cases three or more months in arrears, including those in possession, reduced by5% from 30 June 2013 to 4,890 cases as at 30 September 2013 (H1 2013: 5,146; FY 2012: 5,914). The totalvalue of residential arrears owed by customers has fallen by £7.3m to £27.3m during the nine months to 30September 2013, a reduction of 21%.
As reported at the half year we have completed the integration of the operations of the two businesses and thetransfer of our IT infrastructure to a new supplier giving us reduced costs but increased operational flexibility.Ongoing administrative expenses for the nine months were 5% lower than the equivalent period in 2012 at£70.0m (9m 2012: £73.7m; FY 2012: £93.4m).
2. Customers and Conduct
Support for customers experiencing payment difficulties
In total, B&B has almost 193,000 customers (H1 2013: 196,000; FY 2012: 202,000), with 269,000 mortgageaccounts (H1 2013: 273,000; FY 2012: 281,000). The majority of these loans continue to perform well with morethan 96% of mortgage customers up to date with their mortgage payments. However, we do have a significantnumber of customers who are finding it difficult to meet their repayments. In those cases, we work closely withcustomers to offer a range of solutions to help them manage their circumstances. During the first nine months of2013, 7,700 arrangements were successfully completed and approximately 450 account modifications were made(FY 2012: 660) to assist customers with the repayments of their mortgage.
Bradford & Bingley plc Interim Financial Report 30 September 2013
UKAR Interim Financial Report 30 September 2013 Section B - B&B Page 19 of 75
2. Customers and Conduct (continued)
Support for customers experiencing payment difficulties (continued)
We also work with a range of non-fee charging debt advice agencies to help customers reorganise their financesand ensure, wherever possible, that they can continue as homeowners. Research conducted by YouGov and theMoney Advice Service shows that individuals who seek advice are twice as likely to have their debt becomemanageable within 12 months compared to those who do not. The number of B&B customers referred to debtadvice agencies in the first nine months of 2013 was 222 (FY 2012: 486). The reduction in referrals reflects thefall in the number of customers in arrears.
In some circumstances, however, the most appropriate course of action is for customers to sell their property andwe support this process, where suitable, through assisted voluntary sales. Repossession proceedings forcustomers in arrears are viewed as a last resort but in some situations this is inevitable and the best course ofaction to prevent further indebtedness. The number of properties taken into possession in the first nine months of2013 was 1,338 (FY 2012 1,760).
Support for customers with interest only mortgages
It is a key objective for UKAR to work with customers to achieve the most appropriate outcome for their particularsituation. In addition to our contact strategies for customers in financial difficulty, a further area of focus for UKARis whether our interest only customers have plans in place to repay their mortgage at the end of their term. Asreported at the half year we have been proactively writing to or calling interest only customers with mortgageterms of ten years or less remaining, reminding them of their obligations and explaining how we can help. Thisactivity is designed to ensure customers are aware of the need to plan for the repayment of their loan at the endof its term and to encourage them to share details of their plans so we can help ensure they are robust. We havehad an excellent response to the campaign so far.
OTHER INFORMATION
Bradford & Bingley plc
On 29 September 2008, all of B&B’s retail branches and its savings accounts were transferred to BancoSantander Group. The remainder of the business, including the mortgage books of B&B and specialist lendingarm Mortgage Express, were nationalised and taken into public ownership by the Government. B&B ispermanently closed to new lending, but continues to provide services to some 193,000 existing mortgageborrowers, with 269,000 mortgage accounts.
Bradford & Bingley plc Interim Financial Report 30 September 2013
UKAR Interim Financial Report 30 September 2013 Section B - B&B Page 20 of 75
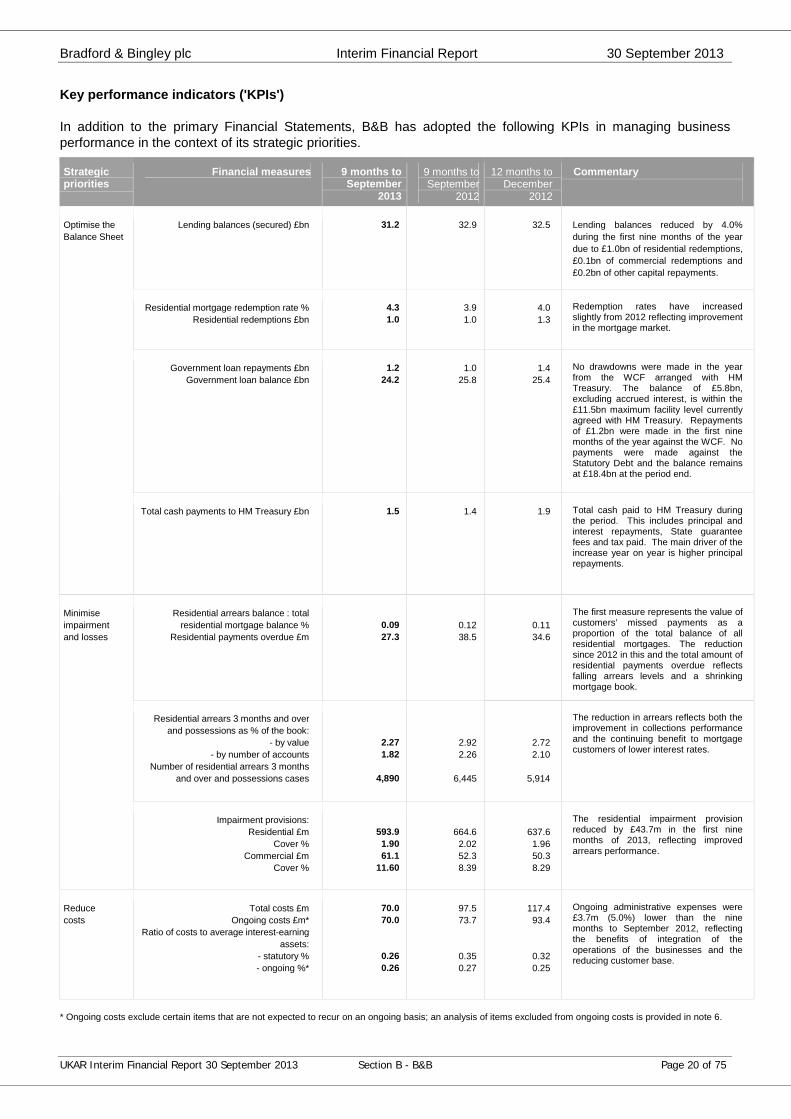
Key performance indicators ('KPIs')
In addition to the primary Financial Statements, B&B has adopted the following KPIs in managing businessperformance in the context of its strategic priorities.
Strategicpriorities
Financial measures 9 months toSeptember
2013
9 months toSeptember
2012
12 months toDecember
2012
Commentary
Lending balances (secured) £bn 31.2 32.9 32.5 Lending balances reduced by 4.0%during the first nine months of the yeardue to £1.0bn of residential redemptions,£0.1bn of commercial redemptions and£0.2bn of other capital repayments.
Residential mortgage redemption rate %Residential redemptions £bn
4.31.0
3.91.0
4.01.3
Redemption rates have increasedslightly from 2012 reflecting improvementin the mortgage market.
Government loan repayments £bnGovernment loan balance £bn
1.224.2
1.025.8
1.425.4
No drawdowns were made in the yearfrom the WCF arranged with HMTreasury. The balance of £5.8bn,excluding accrued interest, is within the£11.5bn maximum facility level currentlyagreed with HM Treasury. Repaymentsof £1.2bn were made in the first ninemonths of the year against the WCF. Nopayments were made against theStatutory Debt and the balance remainsat £18.4bn at the period end.
Optimise theBalance Sheet
Total cash payments to HM Treasury £bn 1.5 1.4 1.9 Total cash paid to HM Treasury duringthe period. This includes principal andinterest repayments, State guaranteefees and tax paid. The main driver of theincrease year on year is higher principalrepayments.
Residential arrears balance : totalresidential mortgage balance %
Residential payments overdue £m0.09 27.3
0.1238.5
0.1134.6
The first measure represents the value ofcustomers’ missed payments as aproportion of the total balance of allresidential mortgages. The reductionsince 2012 in this and the total amount ofresidential payments overdue reflectsfalling arrears levels and a shrinkingmortgage book.
Residential arrears 3 months and overand possessions as % of the book:
- by value- by number of accounts
Number of residential arrears 3 monthsand over and possessions cases
2.271.82
4,890
2.922.26
6,445
2.722.10
5,914
The reduction in arrears reflects both theimprovement in collections performanceand the continuing benefit to mortgagecustomers of lower interest rates.
Minimiseimpairmentand losses
Impairment provisions:Residential £m
Cover %Commercial £m
Cover %
593.91.9061.1
11.60
664.62.0252.38.39
637.61.9650.38.29
The residential impairment provisionreduced by £43.7m in the first ninemonths of 2013, reflecting improvedarrears performance.
Reducecosts
Total costs £mOngoing costs £m*
Ratio of costs to average interest-earningassets:
- statutory %- ongoing %*
70.070.0
0.260.26
97.573.7
0.350.27
117.493.4
0.320.25
Ongoing administrative expenses were£3.7m (5.0%) lower than the ninemonths to September 2012, reflectingthe benefits of integration of theoperations of the businesses and thereducing customer base.
* Ongoing costs exclude certain items that are not expected to recur on an ongoing basis; an analysis of items excluded from ongoing costs is provided in note 6.
Bradford & Bingley plc Interim Financial Report 30 September 2013
UKAR Interim Financial Report 30 September 2013 Section B - B&B Page 21 of 75
Business review
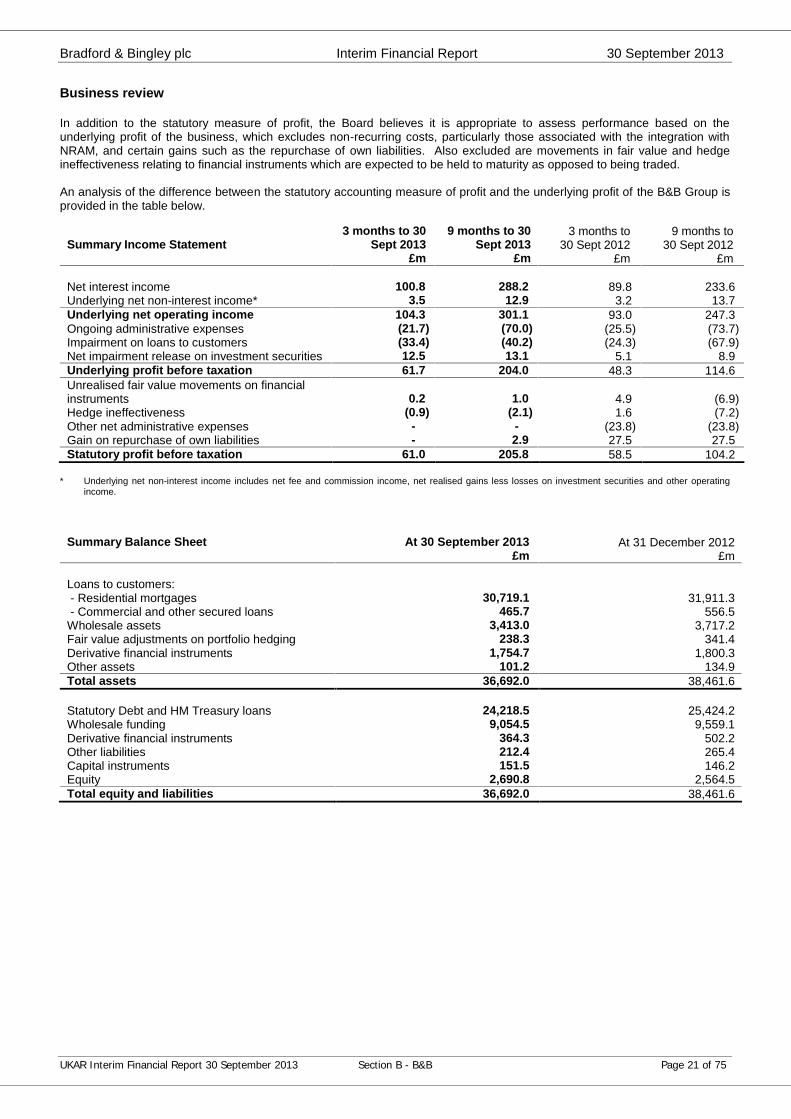
In addition to the statutory measure of profit, the Board believes it is appropriate to assess performance based on theunderlying profit of the business, which excludes non-recurring costs, particularly those associated with the integration withNRAM, and certain gains such as the repurchase of own liabilities. Also excluded are movements in fair value and hedgeineffectiveness relating to financial instruments which are expected to be held to maturity as opposed to being traded.
An analysis of the difference between the statutory accounting measure of profit and the underlying profit of the B&B Group isprovided in the table below.
* Underlying net non-interest income includes net fee and commission income, net realised gains less losses on investment securities and other operatingincome.
Summary Balance Sheet At 30 September 2013 At 31 December 2012£m £m
Loans to customers:- Residential mortgages 30,719.1 31,911.3- Commercial and other secured loans 465.7 556.5
Wholesale assets 3,413.0 3,717.2Fair value adjustments on portfolio hedging 238.3 341.4Derivative financial instruments 1,754.7 1,800.3Other assets 101.2 134.9Total assets 36,692.0 38,461.6
Statutory Debt and HM Treasury loans 24,218.5 25,424.2Wholesale funding 9,054.5 9,559.1Derivative financial instruments 364.3 502.2Other liabilities 212.4 265.4Capital instruments 151.5 146.2Equity 2,690.8 2,564.5Total equity and liabilities 36,692.0 38,461.6
Summary Income Statement3 months to 30
Sept 20139 months to 30
Sept 20133 months to
30 Sept 20129 months to
30 Sept 2012£m £m £m £m
Net interest income 100.8 288.2 89.8 233.6Underlying net non-interest income* 3.5 12.9 3.2 13.7Underlying net operating income 104.3 301.1 93.0 247.3Ongoing administrative expenses (21.7) (70.0) (25.5) (73.7)Impairment on loans to customers (33.4) (40.2) (24.3) (67.9)Net impairment release on investment securities 12.5 13.1 5.1 8.9Underlying profit before taxation 61.7 204.0 48.3 114.6Unrealised fair value movements on financialinstruments 0.2 1.0 4.9 (6.9)Hedge ineffectiveness (0.9) (2.1) 1.6 (7.2)Other net administrative expenses - - (23.8) (23.8)Gain on repurchase of own liabilities - 2.9 27.5 27.5Statutory profit before taxation 61.0 205.8 58.5 104.2
Bradford & Bingley plc Interim Financial Report 30 September 2013
UKAR Interim Financial Report 30 September 2013 Section B - B&B Page 22 of 75
Bradford & Bingley plc Condensed Financial Statements
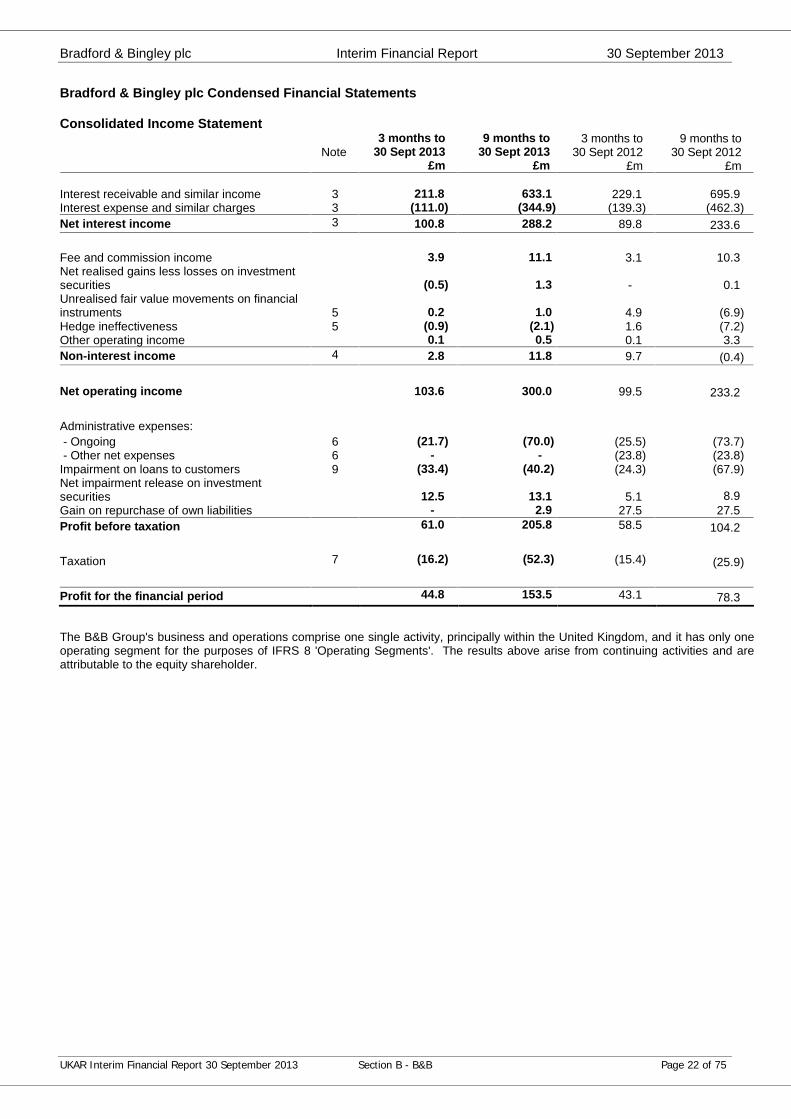
Consolidated Income Statement
Note3 months to
30 Sept 20139 months to
30 Sept 20133 months to
30 Sept 20129 months to
30 Sept 2012£m £m £m £m
Interest receivable and similar income 3 211.8 633.1 229.1 695.9Interest expense and similar charges 3 (111.0) (344.9) (139.3) (462.3)Net interest income 3 100.8 288.2 89.8 233.6
Fee and commission income 3.9 11.1 3.1 10.3Net realised gains less losses on investmentsecurities (0.5) 1.3 - 0.1Unrealised fair value movements on financialinstruments 5 0.2 1.0 4.9 (6.9)Hedge ineffectiveness 5 (0.9) (2.1) 1.6 (7.2)Other operating income 0.1 0.5 0.1 3.3Non-interest income 4 2.8 11.8 9.7 (0.4)
Net operating income 103.6 300.0 99.5 233.2
Administrative expenses:- Ongoing 6 (21.7) (70.0) (25.5) (73.7)- Other net expenses 6 - - (23.8) (23.8)
Impairment on loans to customers 9 (33.4) (40.2) (24.3) (67.9)Net impairment release on investmentsecurities 12.5 13.1 5.1 8.9Gain on repurchase of own liabilities - 2.9 27.5 27.5Profit before taxation 61.0 205.8 58.5 104.2
Taxation 7 (16.2) (52.3) (15.4) (25.9)
Profit for the financial period 44.8 153.5 43.1 78.3
The B&B Group's business and operations comprise one single activity, principally within the United Kingdom, and it has only oneoperating segment for the purposes of IFRS 8 'Operating Segments'. The results above arise from continuing activities and areattributable to the equity shareholder.
Bradford & Bingley plc Interim Financial Report 30 September 2013
UKAR Interim Financial Report 30 September 2013 Section B - B&B Page 23 of 75
Bradford & Bingley plc Condensed Financial Statements (continued)
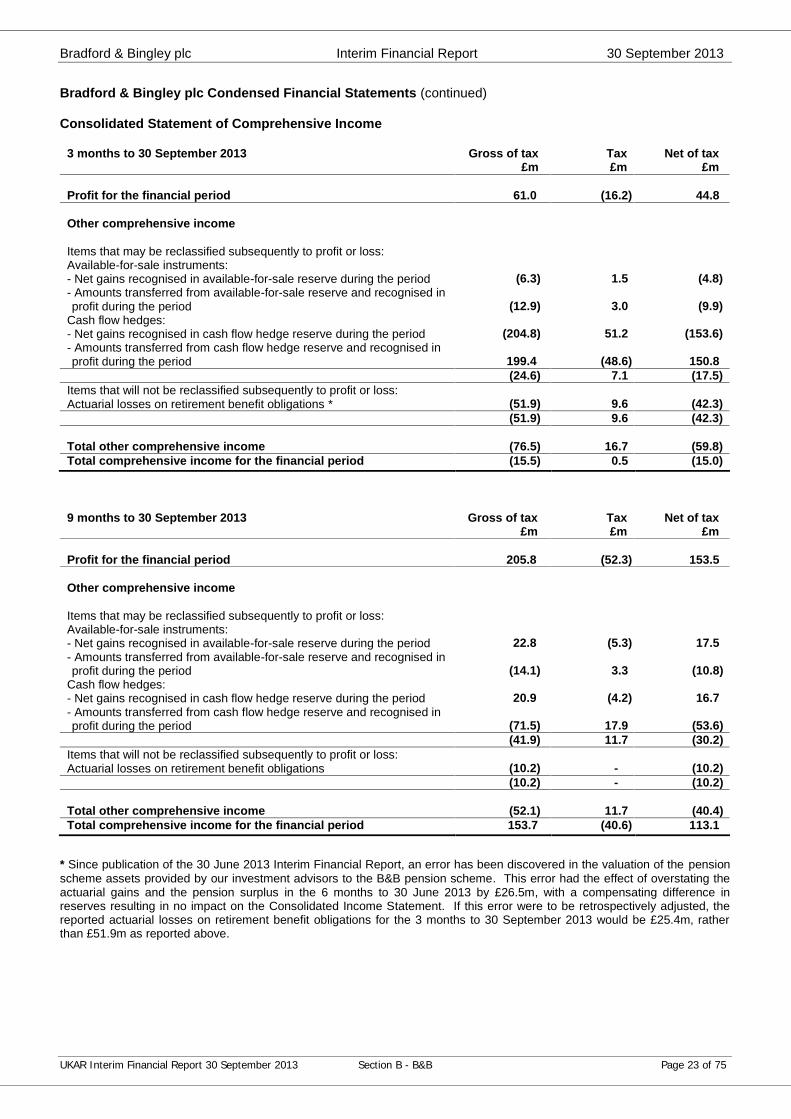
Consolidated Statement of Comprehensive Income
3 months to 30 September 2013 Gross of tax Tax Net of tax£m £m £m
Profit for the financial period 61.0 (16.2) 44.8
Other comprehensive income
Items that may be reclassified subsequently to profit or loss:Available-for-sale instruments:- Net gains recognised in available-for-sale reserve during the period (6.3) 1.5 (4.8)- Amounts transferred from available-for-sale reserve and recognised inprofit during the period (12.9) 3.0 (9.9)
Cash flow hedges:- Net gains recognised in cash flow hedge reserve during the period (204.8) 51.2 (153.6)- Amounts transferred from cash flow hedge reserve and recognised inprofit during the period 199.4 (48.6) 150.8
(24.6) 7.1 (17.5)Items that will not be reclassified subsequently to profit or loss:Actuarial losses on retirement benefit obligations * (51.9) 9.6 (42.3)
(51.9) 9.6 (42.3)
Total other comprehensive income (76.5) 16.7 (59.8)Total comprehensive income for the financial period (15.5) 0.5 (15.0)
9 months to 30 September 2013 Gross of tax Tax Net of tax£m £m £m
Profit for the financial period 205.8 (52.3) 153.5
Other comprehensive income
Items that may be reclassified subsequently to profit or loss:Available-for-sale instruments:- Net gains recognised in available-for-sale reserve during the period 22.8 (5.3) 17.5- Amounts transferred from available-for-sale reserve and recognised inprofit during the period (14.1) 3.3 (10.8)
Cash flow hedges:- Net gains recognised in cash flow hedge reserve during the period 20.9 (4.2) 16.7- Amounts transferred from cash flow hedge reserve and recognised inprofit during the period (71.5) 17.9 (53.6)
(41.9) 11.7 (30.2)Items that will not be reclassified subsequently to profit or loss:Actuarial losses on retirement benefit obligations (10.2) - (10.2)
(10.2) - (10.2)
Total other comprehensive income (52.1) 11.7 (40.4)Total comprehensive income for the financial period 153.7 (40.6) 113.1
* Since publication of the 30 June 2013 Interim Financial Report, an error has been discovered in the valuation of the pensionscheme assets provided by our investment advisors to the B&B pension scheme. This error had the effect of overstating theactuarial gains and the pension surplus in the 6 months to 30 June 2013 by £26.5m, with a compensating difference inreserves resulting in no impact on the Consolidated Income Statement. If this error were to be retrospectively adjusted, thereported actuarial losses on retirement benefit obligations for the 3 months to 30 September 2013 would be £25.4m, ratherthan £51.9m as reported above.
Bradford & Bingley plc Interim Financial Report 30 September 2013
UKAR Interim Financial Report 30 September 2013 Section B - B&B Page 24 of 75
Bradford & Bingley plc Condensed Financial Statements (continued)
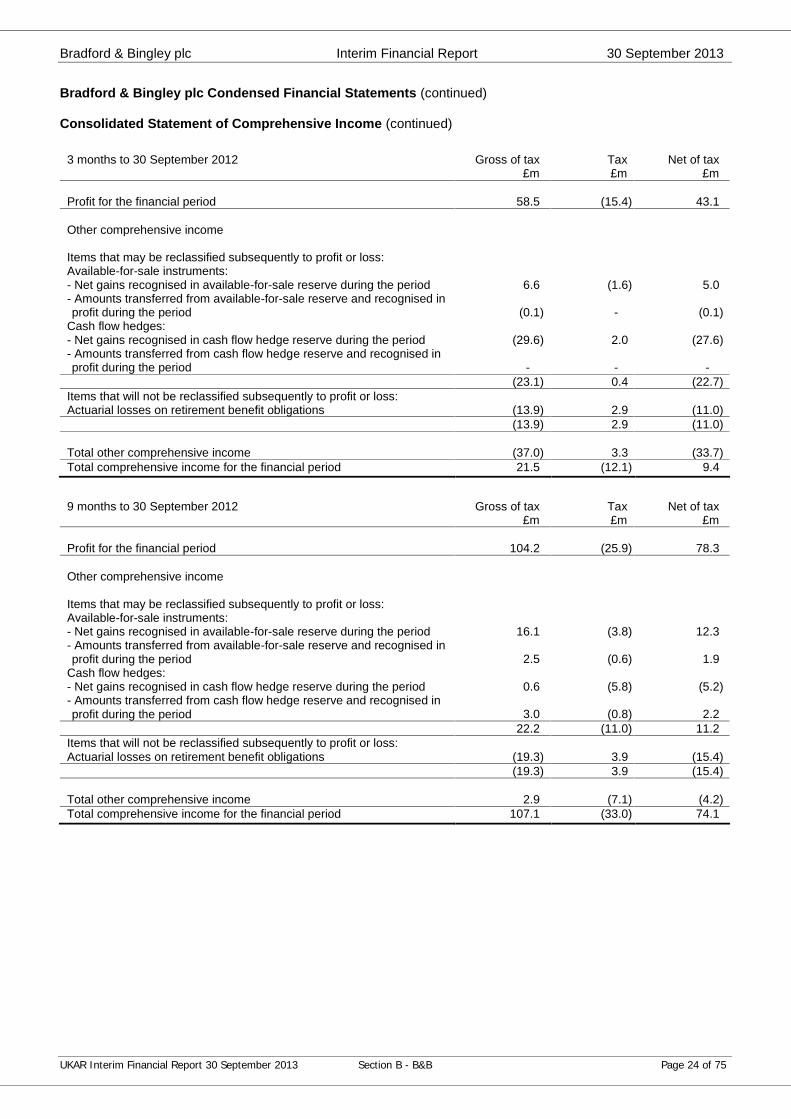
Consolidated Statement of Comprehensive Income (continued)
3 months to 30 September 2012 Gross of tax Tax Net of tax£m £m £m
Profit for the financial period 58.5 (15.4) 43.1
Other comprehensive income
Items that may be reclassified subsequently to profit or loss:Available-for-sale instruments:- Net gains recognised in available-for-sale reserve during the period 6.6 (1.6) 5.0- Amounts transferred from available-for-sale reserve and recognised inprofit during the period (0.1) - (0.1)
Cash flow hedges:- Net gains recognised in cash flow hedge reserve during the period (29.6) 2.0 (27.6)- Amounts transferred from cash flow hedge reserve and recognised inprofit during the period - - -
(23.1) 0.4 (22.7)Items that will not be reclassified subsequently to profit or loss:Actuarial losses on retirement benefit obligations (13.9) 2.9 (11.0)
(13.9) 2.9 (11.0)
Total other comprehensive income (37.0) 3.3 (33.7)Total comprehensive income for the financial period 21.5 (12.1) 9.4
9 months to 30 September 2012 Gross of tax Tax Net of tax£m £m £m
Profit for the financial period 104.2 (25.9) 78.3
Other comprehensive income
Items that may be reclassified subsequently to profit or loss:Available-for-sale instruments:- Net gains recognised in available-for-sale reserve during the period 16.1 (3.8) 12.3- Amounts transferred from available-for-sale reserve and recognised inprofit during the period 2.5 (0.6) 1.9
Cash flow hedges:- Net gains recognised in cash flow hedge reserve during the period 0.6 (5.8) (5.2)- Amounts transferred from cash flow hedge reserve and recognised inprofit during the period 3.0 (0.8) 2.2
22.2 (11.0) 11.2Items that will not be reclassified subsequently to profit or loss:Actuarial losses on retirement benefit obligations (19.3) 3.9 (15.4)
(19.3) 3.9 (15.4)
Total other comprehensive income 2.9 (7.1) (4.2)Total comprehensive income for the financial period 107.1 (33.0) 74.1
Bradford & Bingley plc Interim Financial Report 30 September 2013
UKAR Interim Financial Report 30 September 2013 Section B - B&B Page 25 of 75
Bradford & Bingley plc Condensed Financial Statements (continued)
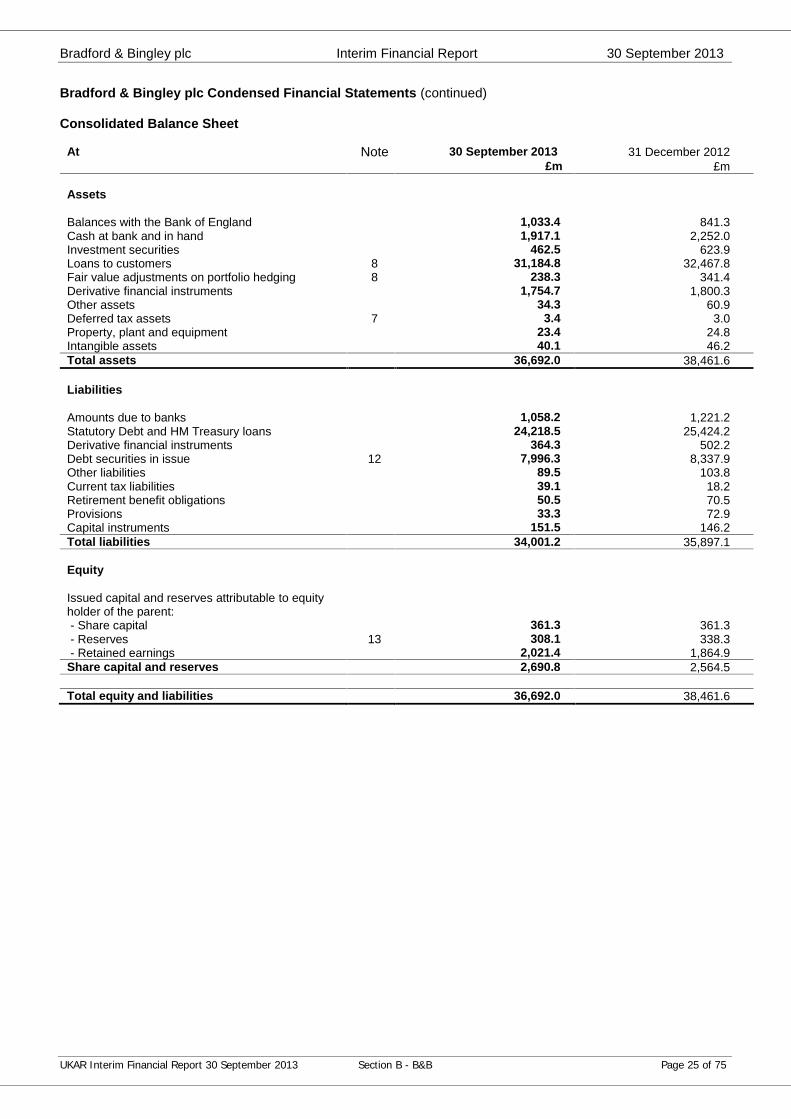
Consolidated Balance Sheet
At Note 30 September 2013 31 December 2012£m £m
Assets
Balances with the Bank of England 1,033.4 841.3Cash at bank and in hand 1,917.1 2,252.0Investment securities 462.5 623.9Loans to customers 8 31,184.8 32,467.8Fair value adjustments on portfolio hedging 8 238.3 341.4Derivative financial instruments 1,754.7 1,800.3Other assets 34.3 60.9Deferred tax assets 7 3.4 3.0Property, plant and equipment 23.4 24.8Intangible assets 40.1 46.2Total assets 36,692.0 38,461.6
Liabilities
Amounts due to banks 1,058.2 1,221.2Statutory Debt and HM Treasury loans 24,218.5 25,424.2Derivative financial instruments 364.3 502.2Debt securities in issue 12 7,996.3 8,337.9Other liabilities 89.5 103.8Current tax liabilities 39.1 18.2Retirement benefit obligations 50.5 70.5Provisions 33.3 72.9Capital instruments 151.5 146.2Total liabilities 34,001.2 35,897.1
Equity
Issued capital and reserves attributable to equityholder of the parent:- Share capital 361.3 361.3- Reserves 13 308.1 338.3- Retained earnings 2,021.4 1,864.9
Share capital and reserves 2,690.8 2,564.5
Total equity and liabilities 36,692.0 38,461.6
Bradford & Bingley plc Interim Financial Report 30 September 2013
UKAR Interim Financial Report 30 September 2013 Section B - B&B Page 26 of 75
Bradford & Bingley plc Condensed Financial Statements (continued)
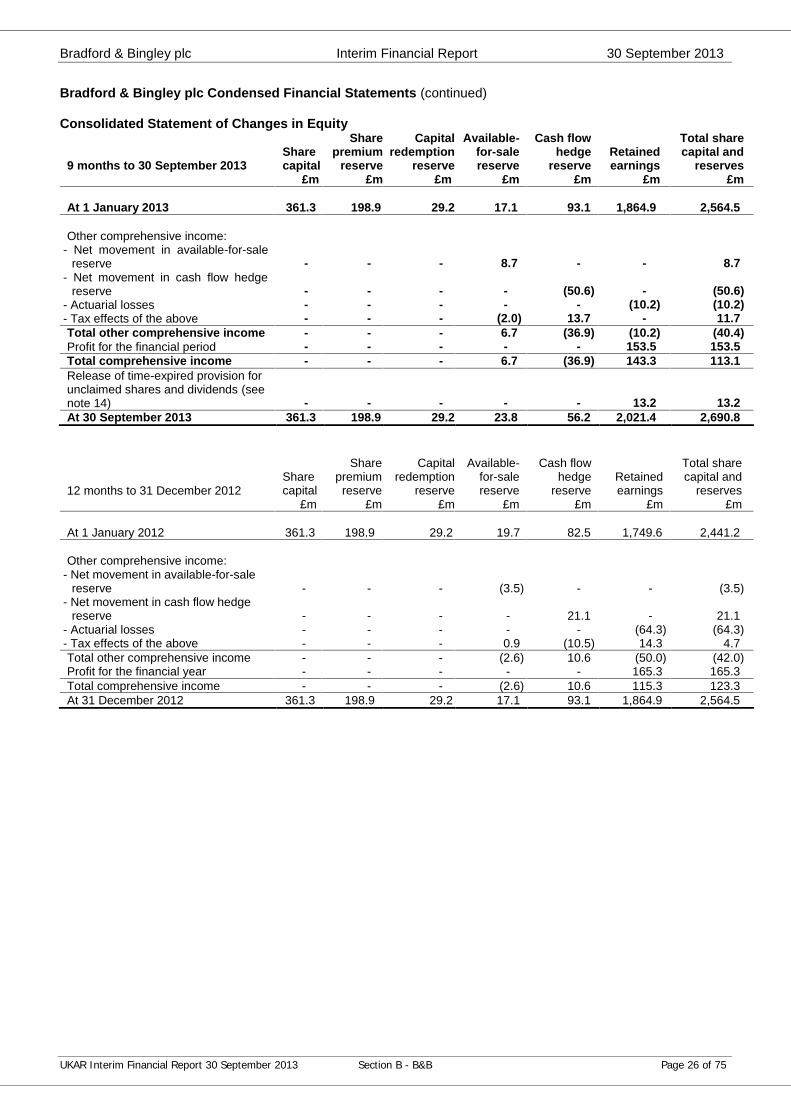
Consolidated Statement of Changes in Equity
9 months to 30 September 2013Sharecapital
Sharepremium
reserve
Capitalredemption
reserve
Available-for-salereserve
Cash flowhedge
reserveRetainedearnings
Total sharecapital and
reserves£m £m £m £m £m £m £m
At 1 January 2013 361.3 198.9 29.2 17.1 93.1 1,864.9 2,564.5
Other comprehensive income:- Net movement in available-for-sale
reserve - - - 8.7 - - 8.7- Net movement in cash flow hedge
reserve - - - - (50.6) - (50.6)- Actuarial losses - - - - - (10.2) (10.2)- Tax effects of the above - - - (2.0) 13.7 - 11.7Total other comprehensive income - - - 6.7 (36.9) (10.2) (40.4)Profit for the financial period - - - - - 153.5 153.5Total comprehensive income - - - 6.7 (36.9) 143.3 113.1Release of time-expired provision forunclaimed shares and dividends (seenote 14) - - - - - 13.2 13.2At 30 September 2013 361.3 198.9 29.2 23.8 56.2 2,021.4 2,690.8
12 months to 31 December 2012Sharecapital
Sharepremium
reserve
Capitalredemption
reserve
Available-for-salereserve
Cash flowhedge
reserveRetainedearnings
Total sharecapital and
reserves£m £m £m £m £m £m £m
At 1 January 2012 361.3 198.9 29.2 19.7 82.5 1,749.6 2,441.2
Other comprehensive income:- Net movement in available-for-sale
reserve - - - (3.5) - - (3.5)- Net movement in cash flow hedge
reserve - - - - 21.1 - 21.1- Actuarial losses - - - - - (64.3) (64.3)- Tax effects of the above - - - 0.9 (10.5) 14.3 4.7Total other comprehensive income - - - (2.6) 10.6 (50.0) (42.0)Profit for the financial year - - - - - 165.3 165.3Total comprehensive income - - - (2.6) 10.6 115.3 123.3At 31 December 2012 361.3 198.9 29.2 17.1 93.1 1,864.9 2,564.5
Bradford & Bingley plc Interim Financial Report 30 September 2013
UKAR Interim Financial Report 30 September 2013 Section B - B&B Page 27 of 75
Bradford & Bingley plc Condensed Financial Statements (continued)
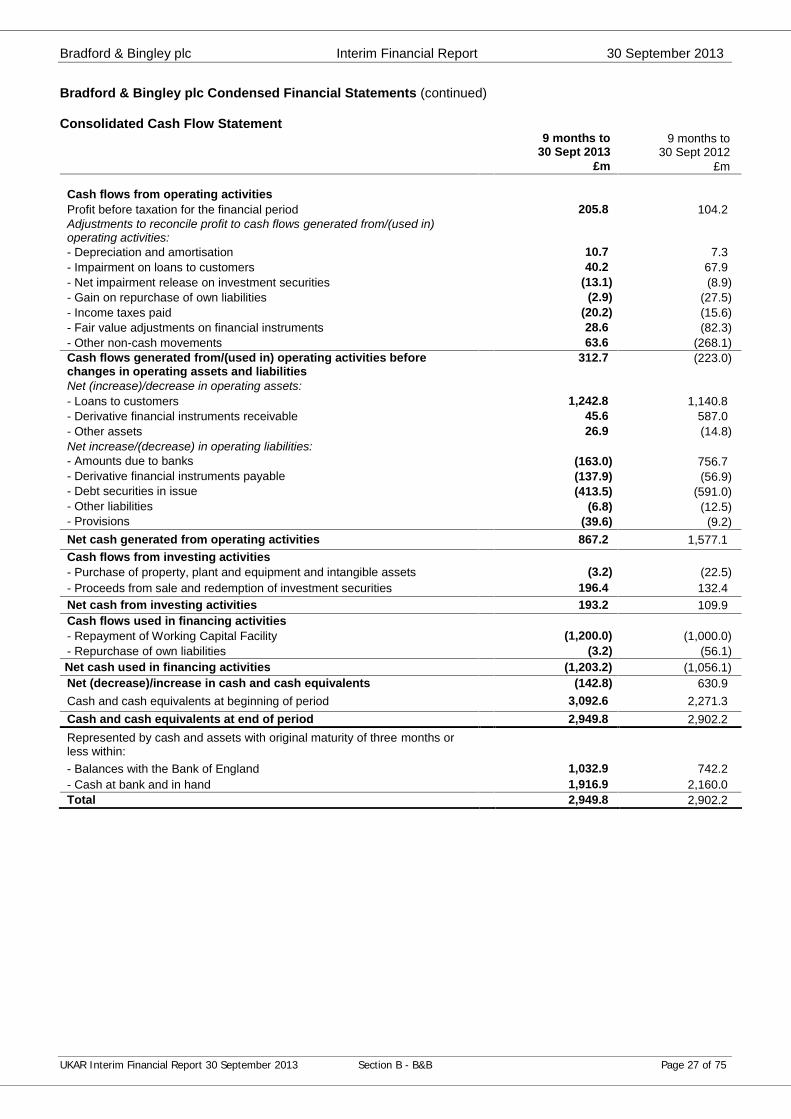
Consolidated Cash Flow Statement9 months to
30 Sept 20139 months to
30 Sept 2012£m £m
Cash flows from operating activitiesProfit before taxation for the financial period 205.8 104.2Adjustments to reconcile profit to cash flows generated from/(used in)operating activities:- Depreciation and amortisation 10.7 7.3- Impairment on loans to customers 40.2 67.9- Net impairment release on investment securities (13.1) (8.9)- Gain on repurchase of own liabilities (2.9) (27.5)- Income taxes paid (20.2) (15.6)- Fair value adjustments on financial instruments 28.6 (82.3)- Other non-cash movements 63.6 (268.1)Cash flows generated from/(used in) operating activities beforechanges in operating assets and liabilities
312.7 (223.0)
Net (increase)/decrease in operating assets:- Loans to customers 1,242.8 1,140.8- Derivative financial instruments receivable 45.6 587.0- Other assets 26.9 (14.8)Net increase/(decrease) in operating liabilities:- Amounts due to banks (163.0) 756.7- Derivative financial instruments payable (137.9) (56.9)- Debt securities in issue (413.5) (591.0)- Other liabilities (6.8) (12.5)- Provisions (39.6) (9.2)Net cash generated from operating activities 867.2 1,577.1Cash flows from investing activities- Purchase of property, plant and equipment and intangible assets (3.2) (22.5)- Proceeds from sale and redemption of investment securities 196.4 132.4Net cash from investing activities 193.2 109.9Cash flows used in financing activities- Repayment of Working Capital Facility (1,200.0) (1,000.0)- Repurchase of own liabilities (3.2) (56.1)Net cash used in financing activities (1,203.2) (1,056.1)Net (decrease)/increase in cash and cash equivalents (142.8) 630.9Cash and cash equivalents at beginning of period 3,092.6 2,271.3Cash and cash equivalents at end of period 2,949.8 2,902.2Represented by cash and assets with original maturity of three months orless within:- Balances with the Bank of England 1,032.9 742.2- Cash at bank and in hand 1,916.9 2,160.0Total 2,949.8 2,902.2
Bradford & Bingley plc Interim Financial Report 30 September 2013
UKAR Interim Financial Report 30 September 2013 Section B - B&B Page 28 of 75
Notes to the Financial Information
1. Reporting entity
Bradford & Bingley plc ('B&B') is a public limited company incorporated and domiciled in the United Kingdom.
The financial information in this Interim Financial Report consolidates B&B and its subsidiaries (including special purposevehicles ('SPVs')), together referred to as the B&B Group. B&B's Consolidated Financial Statements for the year ended 31December 2012 are included in B&B's 2012 Annual Report & Accounts available on B&B's website www.bbg.co.uk.
As explained in B&B's 2012 Annual Report & Accounts, B&B's accounting reference date has been changed from 31December to 31 March to align to the year end of B&B's ultimate parent, HM Treasury. B&B's next Annual Report & Accountswill cover the 15 months to 31 March 2014. On 6 August 2013, B&B published an Interim Financial Report for the six monthsended 30 June 2013. This is available on B&B's website www.bbg.co.uk.
2. Basis of preparation
This Interim Financial Report has been prepared on a going concern basis. At the date of approval of this Interim FinancialReport B&B is reliant on the financing facilities and also upon the guarantee arrangements provided to B&B by HM Treasury.Withdrawal of the financing facilities or the guarantee arrangements would have a significant impact on B&B's operations andits ability to continue as a going concern, in which case adjustments may have to be made to reduce the carrying value ofassets to recoverable amounts and to provide for further liabilities that might arise. At the date of approval of this InterimFinancial Report, HM Treasury has confirmed its intentions to continue to provide funding until at least 1 January 2016.
In preparing this Interim Financial Report, and the Interim Financial Report for the six months ended 30 June 2013, includingthe 2012 comparative financial information where applicable, the B&B Group has adopted for the first time the followingstatements:
- IFRS 13 ‘Fair Value Measurement’. This statement is mandatory for 2013 financial statements. This standard sets outprinciples for how to measure the fair value of financial assets and liabilities. It does not change which items are carried atfair value. IFRS 13 has not had any material impact on the B&B Group's fair values.
- The June 2011 amendments to IAS 1 ‘Presentation of Financial Statements’ relating to ‘Presentation of Items of OtherComprehensive Income’. This statement is mandatory for 2013 financial statements, with 2012 comparative information.
- The June 2011 amendments to IAS 19 ‘Employee Benefits’. This statement is mandatory for 2013 financial statements, with2012 comparative information. This was applied in calculating the 2013 cost of the defined benefit pension scheme, and inthe calculation of defined benefit scheme assets and obligations as at 30 September 2013.
- The Annual Improvements to IFRSs 2009-2011 Cycle, issued in May 2012. These changes are mandatory for 2013 financialstatements, with 2012 comparative information. These changes had no material impact on the B&B Group.
There have been no other material changes to the accounting policies previously applied by the B&B Group in preparing, anddetailed in, its Annual Report & Accounts for the year ended 31 December 2012, which were prepared in accordance withIFRS as adopted by the European Union.
The Directors consider that the B&B Group's accounting policies are the most appropriate to its circumstances, have beenconsistently applied in dealing with items which are considered material and are supported by reasonable and prudentestimates and judgements.
The preparation of this Interim Financial Report requires the use of estimates and assumptions that affect the reported valuesof assets and liabilities at the Balance Sheet date and the reported amounts of revenues and expenses during the reportingperiod. Although these estimates are based on management's best knowledge of the amount, event or actions, actual resultsultimately may differ from those estimates.
This Interim Financial Report has been prepared in accordance with IAS 34 'Interim Financial Reporting'.
The information in this document does not include all of the disclosures required by IFRS in full annual financial statements,and it should be read in conjunction with the Consolidated Financial Statements of B&B for the year ended 31 December2012.
Bradford & Bingley plc Interim Financial Report 30 September 2013
UKAR Interim Financial Report 30 September 2013 Section B - B&B Page 29 of 75
Notes to the Financial Information (continued)
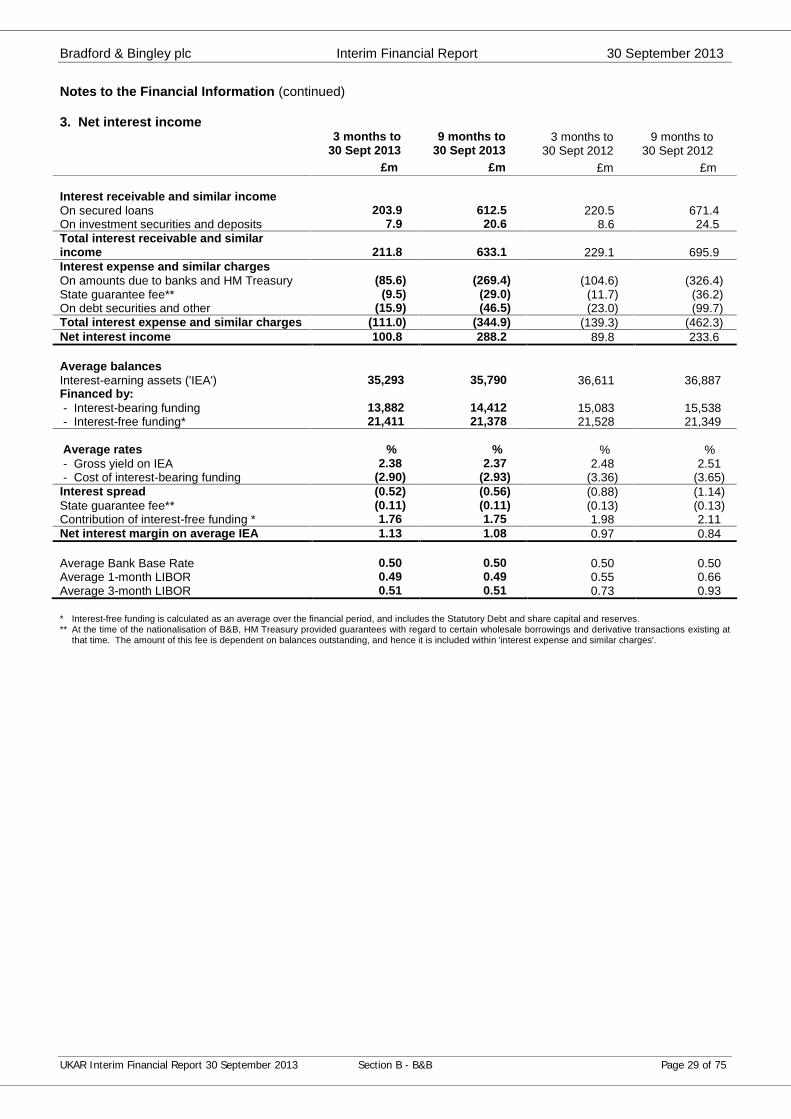
3. Net interest income3 months to
30 Sept 20139 months to
30 Sept 20133 months to
30 Sept 20129 months to
30 Sept 2012£m £m £m £m
Interest receivable and similar incomeOn secured loans 203.9 612.5 220.5 671.4On investment securities and deposits 7.9 20.6 8.6 24.5Total interest receivable and similarincome 211.8 633.1 229.1 695.9Interest expense and similar chargesOn amounts due to banks and HM Treasury (85.6) (269.4) (104.6) (326.4)State guarantee fee** (9.5) (29.0) (11.7) (36.2)On debt securities and other (15.9) (46.5) (23.0) (99.7)Total interest expense and similar charges (111.0) (344.9) (139.3) (462.3)Net interest income 100.8 288.2 89.8 233.6
Average balancesInterest-earning assets ('IEA') 35,293 35,790 36,611 36,887Financed by:- Interest-bearing funding 13,882 14,412 15,083 15,538- Interest-free funding* 21,411 21,378 21,528 21,349
Average rates % % % %- Gross yield on IEA 2.38 2.37 2.48 2.51- Cost of interest-bearing funding (2.90) (2.93) (3.36) (3.65)
Interest spread (0.52) (0.56) (0.88) (1.14)State guarantee fee** (0.11) (0.11) (0.13) (0.13)Contribution of interest-free funding * 1.76 1.75 1.98 2.11Net interest margin on average IEA 1.13 1.08 0.97 0.84
Average Bank Base Rate 0.50 0.50 0.50 0.50Average 1-month LIBOR 0.49 0.49 0.55 0.66Average 3-month LIBOR 0.51 0.51 0.73 0.93
* Interest-free funding is calculated as an average over the financial period, and includes the Statutory Debt and share capital and reserves.** At the time of the nationalisation of B&B, HM Treasury provided guarantees with regard to certain wholesale borrowings and derivative transactions existing at
that time. The amount of this fee is dependent on balances outstanding, and hence it is included within 'interest expense and similar charges'.

Bradford & Bingley plc Interim Financial Report 30 September 2013
UKAR Interim Financial Report 30 September 2013 Section B - B&B Page 30 of 75
Notes to the Financial Information (continued)
4. Net non-interest income3 months to
30 Sept 20139 months to
30 Sept 20133 months to
30 Sept 20129 months to
30 Sept 2012£m £m £m £m
Total net fee and commission income 3.9 11.1 3.1 10.3Net realised gains less losses on investmentsecurities (0.5) 1.3 - 0.1Other operating income 0.1 0.5 0.1 3.3Underlying net non-interest income 3.5 12.9 3.2 13.7Unrealised fair value movements on financialinstruments 0.2 1.0 4.9 (6.9)Hedge ineffectiveness (0.9) (2.1) 1.6 (7.2)Statutory net non-interest income 2.8 11.8 9.7 (0.4)
5. Unrealised fair value movements on financial instruments and hedge ineffectiveness
3 months to30 Sept 2013
9 months to30 Sept 2013
3 months to30 Sept 2012
9 months to30 Sept 2012
£m £m £m £mNet gain/(loss) in fair value:- fair value movements on derivatives which are economic hedges but are not in hedge accounting relationships 0.2 1.0 4.9 (6.9)
Unrealised fair value movements 0.2 1.0 4.9 (6.9)
Net gains/(losses) on fair value hedginginstruments 9.8 128.2 (1.4) 2.8Net (losses)/gains on fair value hedged itemsattributable to hedged risk (10.7) (130.3) 3.0 (10.0)Net hedge ineffectiveness (losses)/gains (0.9) (2.1) 1.6 (7.2)
Total (0.7) (1.1) 6.5 (14.1)
Bradford & Bingley plc Interim Financial Report 30 September 2013
UKAR Interim Financial Report 30 September 2013 Section B - B&B Page 31 of 75
Notes to the Financial Information (continued)
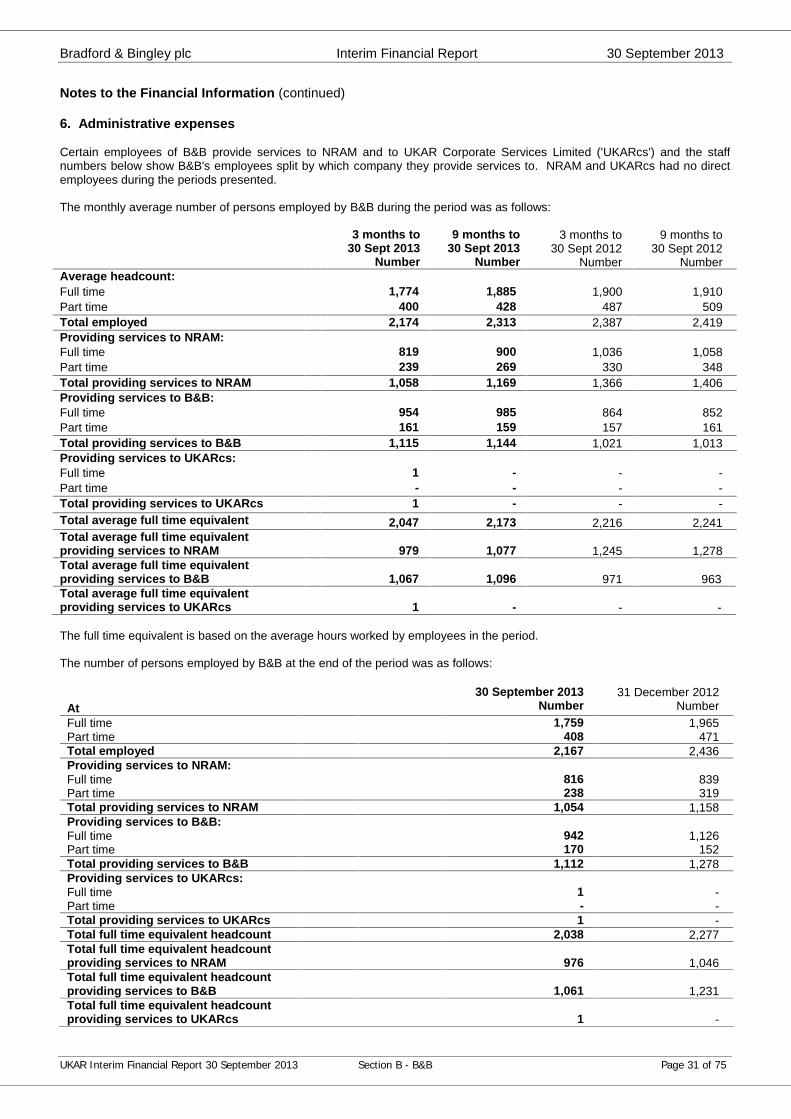
6. Administrative expenses
Certain employees of B&B provide services to NRAM and to UKAR Corporate Services Limited ('UKARcs') and the staffnumbers below show B&B's employees split by which company they provide services to. NRAM and UKARcs had no directemployees during the periods presented.
The monthly average number of persons employed by B&B during the period was as follows:
3 months to 30 Sept 2013
Number
9 months to30 Sept 2013
Number
3 months to30 Sept 2012
Number
9 months to30 Sept 2012
NumberAverage headcount:Full time 1,774 1,885 1,900 1,910Part time 400 428 487 509Total employed 2,174 2,313 2,387 2,419Providing services to NRAM:Full time 819 900 1,036 1,058Part time 239 269 330 348Total providing services to NRAM 1,058 1,169 1,366 1,406Providing services to B&B:Full time 954 985 864 852Part time 161 159 157 161Total providing services to B&B 1,115 1,144 1,021 1,013Providing services to UKARcs:Full time 1 - - -Part time - - - -Total providing services to UKARcs 1 - - -Total average full time equivalent 2,047 2,173 2,216 2,241Total average full time equivalentproviding services to NRAM 979 1,077 1,245 1,278Total average full time equivalentproviding services to B&B 1,067 1,096 971 963Total average full time equivalentproviding services to UKARcs 1 - - -
The full time equivalent is based on the average hours worked by employees in the period.
The number of persons employed by B&B at the end of the period was as follows:
At 30 September 2013
Number 31 December 2012
NumberFull time 1,759 1,965Part time 408 471Total employed 2,167 2,436Providing services to NRAM:Full time 816 839Part time 238 319Total providing services to NRAM 1,054 1,158Providing services to B&B:Full time 942 1,126Part time 170 152Total providing services to B&B 1,112 1,278Providing services to UKARcs:Full time 1 -Part time - -Total providing services to UKARcs 1 -Total full time equivalent headcount 2,038 2,277Total full time equivalent headcountproviding services to NRAM 976 1,046Total full time equivalent headcountproviding services to B&B 1,061 1,231Total full time equivalent headcountproviding services to UKARcs 1 -
Bradford & Bingley plc Interim Financial Report 30 September 2013
UKAR Interim Financial Report 30 September 2013 Section B - B&B Page 32 of 75
Notes to the Financial Information (continued)
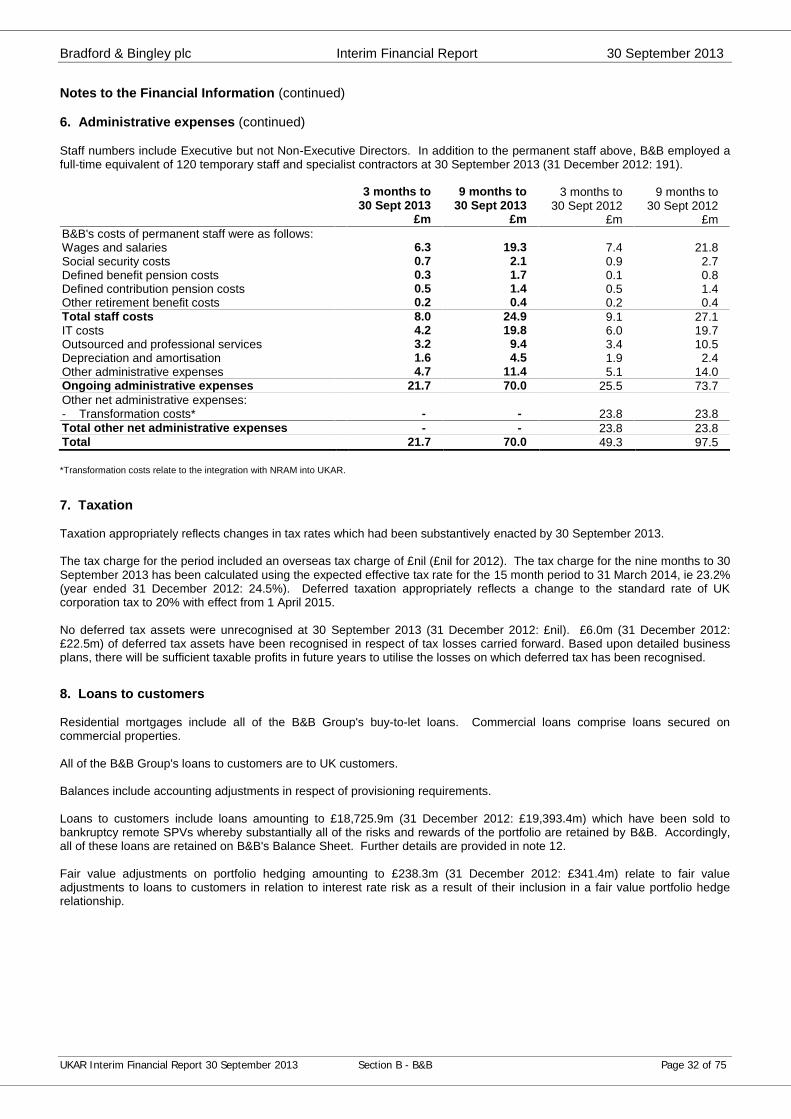
6. Administrative expenses (continued)
Staff numbers include Executive but not Non-Executive Directors. In addition to the permanent staff above, B&B employed afull-time equivalent of 120 temporary staff and specialist contractors at 30 September 2013 (31 December 2012: 191).
3 months to 30 Sept 2013
9 months to 30 Sept 2013
3 months to 30 Sept 2012
9 months to 30 Sept 2012
£m £m £m £mB&B's costs of permanent staff were as follows:Wages and salaries 6.3 19.3 7.4 21.8Social security costs 0.7 2.1 0.9 2.7Defined benefit pension costs 0.3 1.7 0.1 0.8Defined contribution pension costs 0.5 1.4 0.5 1.4Other retirement benefit costs 0.2 0.4 0.2 0.4Total staff costs 8.0 24.9 9.1 27.1IT costs 4.2 19.8 6.0 19.7Outsourced and professional services 3.2 9.4 3.4 10.5Depreciation and amortisation 1.6 4.5 1.9 2.4Other administrative expenses 4.7 11.4 5.1 14.0Ongoing administrative expenses 21.7 70.0 25.5 73.7Other net administrative expenses:- Transformation costs* - - 23.8 23.8Total other net administrative expenses - - 23.8 23.8Total 21.7 70.0 49.3 97.5
*Transformation costs relate to the integration with NRAM into UKAR.
7. Taxation
Taxation appropriately reflects changes in tax rates which had been substantively enacted by 30 September 2013.
The tax charge for the period included an overseas tax charge of £nil (£nil for 2012). The tax charge for the nine months to 30September 2013 has been calculated using the expected effective tax rate for the 15 month period to 31 March 2014, ie 23.2%(year ended 31 December 2012: 24.5%). Deferred taxation appropriately reflects a change to the standard rate of UKcorporation tax to 20% with effect from 1 April 2015.
No deferred tax assets were unrecognised at 30 September 2013 (31 December 2012: £nil). £6.0m (31 December 2012:£22.5m) of deferred tax assets have been recognised in respect of tax losses carried forward. Based upon detailed businessplans, there will be sufficient taxable profits in future years to utilise the losses on which deferred tax has been recognised.
8. Loans to customers
Residential mortgages include all of the B&B Group's buy-to-let loans. Commercial loans comprise loans secured oncommercial properties.
All of the B&B Group's loans to customers are to UK customers.
Balances include accounting adjustments in respect of provisioning requirements.
Loans to customers include loans amounting to £18,725.9m (31 December 2012: £19,393.4m) which have been sold tobankruptcy remote SPVs whereby substantially all of the risks and rewards of the portfolio are retained by B&B. Accordingly,all of these loans are retained on B&B's Balance Sheet. Further details are provided in note 12.
Fair value adjustments on portfolio hedging amounting to £238.3m (31 December 2012: £341.4m) relate to fair valueadjustments to loans to customers in relation to interest rate risk as a result of their inclusion in a fair value portfolio hedgerelationship.

Bradford & Bingley plc Interim Financial Report 30 September 2013
UKAR Interim Financial Report 30 September 2013 Section B - B&B Page 33 of 75
Notes to the Financial Information (continued)
8. Loans to customers (continued)
Loans to customers and redemptions comprise the following product types:
Balances At 30 September 2013£m %
At 31 December 2012£m %
Residential mortgagesBuy-to-let 20,077.1 65 20,694.4 65Self Cert 6,289.4 21 6,561.8 20Standard and other 4,352.6 14 4,655.1 15Total residential mortgages 30,719.1 100 31,911.3 100Residential loans 30,719.1 99 31,911.3 98Commercial loans 465.7 1 556.5 2
Total 31,184.8 100 32,467.8 100
Redemptions3 months to
30 Sept 20139 months to
30 Sept 20133 months to
30 Sept 20129 months to
30 Sept 2012£m £m £m £m
Residential mortgagesBuy-to-let (205.1) (533.6) (167.9) (475.6)Self Cert (86.2) (215.2) (74.2) (217.3)Standard and other (104.6) (274.5) (102.3) (304.4)Total residential mortgages (395.9) (1,023.3) (344.4) (997.3)Residential loans (395.9) (1,023.3) (344.4) (997.3)Commercial loans (53.2) (79.4) (13.5) (19.4)
Total (449.1) (1,102.7) (357.9) (1,016.7)
Redemptions comprise full redemptions and voluntary partial redemptions, but exclude overpayments and regular monthlypayments.
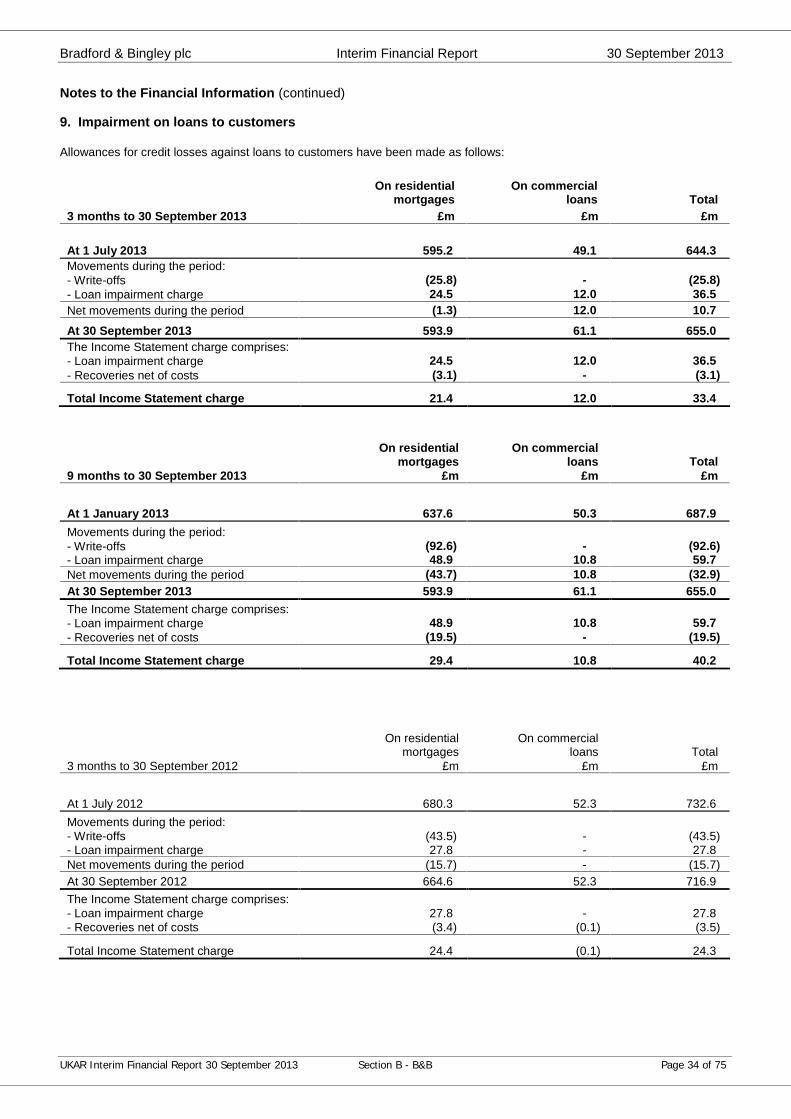
Bradford & Bingley plc Interim Financial Report 30 September 2013
UKAR Interim Financial Report 30 September 2013 Section B - B&B Page 34 of 75
Notes to the Financial Information (continued)
9. Impairment on loans to customers
Allowances for credit losses against loans to customers have been made as follows:
On residential mortgages
On commercial loans Total
3 months to 30 September 2013 £m £m £m
At 1 July 2013 595.2 49.1 644.3Movements during the period:- Write-offs (25.8) - (25.8)- Loan impairment charge 24.5 12.0 36.5Net movements during the period (1.3) 12.0 10.7At 30 September 2013 593.9 61.1 655.0The Income Statement charge comprises:- Loan impairment charge 24.5 12.0 36.5- Recoveries net of costs (3.1) - (3.1)
Total Income Statement charge 21.4 12.0 33.4
On residential mortgages
On commercial loans Total
9 months to 30 September 2013 £m £m £m
At 1 January 2013 637.6 50.3 687.9Movements during the period:- Write-offs (92.6) - (92.6)- Loan impairment charge 48.9 10.8 59.7Net movements during the period (43.7) 10.8 (32.9)At 30 September 2013 593.9 61.1 655.0The Income Statement charge comprises:- Loan impairment charge 48.9 10.8 59.7- Recoveries net of costs (19.5) - (19.5)
Total Income Statement charge 29.4 10.8 40.2
On residential mortgages
On commercial loans Total
3 months to 30 September 2012 £m £m £m
At 1 July 2012 680.3 52.3 732.6Movements during the period:- Write-offs (43.5) - (43.5)- Loan impairment charge 27.8 - 27.8Net movements during the period (15.7) - (15.7)At 30 September 2012 664.6 52.3 716.9The Income Statement charge comprises:- Loan impairment charge 27.8 - 27.8- Recoveries net of costs (3.4) (0.1) (3.5)
Total Income Statement charge 24.4 (0.1) 24.3
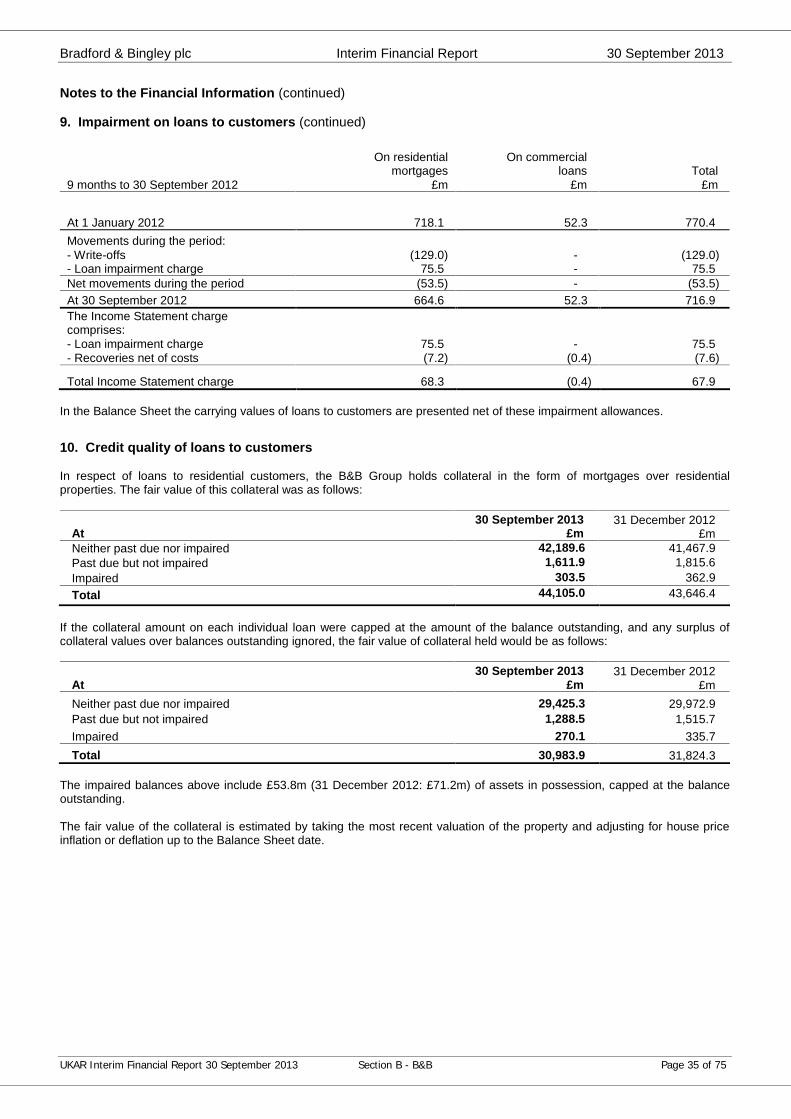
Bradford & Bingley plc Interim Financial Report 30 September 2013
UKAR Interim Financial Report 30 September 2013 Section B - B&B Page 35 of 75
Notes to the Financial Information (continued)
9. Impairment on loans to customers (continued)
On residentialmortgages
On commercial loans Total
9 months to 30 September 2012 £m £m £m
At 1 January 2012 718.1 52.3 770.4Movements during the period:- Write-offs (129.0) - (129.0)- Loan impairment charge 75.5 - 75.5Net movements during the period (53.5) - (53.5)At 30 September 2012 664.6 52.3 716.9The Income Statement chargecomprises:- Loan impairment charge 75.5 - 75.5- Recoveries net of costs (7.2) (0.4) (7.6)
Total Income Statement charge 68.3 (0.4) 67.9
In the Balance Sheet the carrying values of loans to customers are presented net of these impairment allowances.
10. Credit quality of loans to customers
In respect of loans to residential customers, the B&B Group holds collateral in the form of mortgages over residentialproperties. The fair value of this collateral was as follows:
At30 September 2013
£m31 December 2012
£mNeither past due nor impaired 42,189.6 41,467.9Past due but not impaired 1,611.9 1,815.6Impaired 303.5 362.9Total 44,105.0 43,646.4
If the collateral amount on each individual loan were capped at the amount of the balance outstanding, and any surplus ofcollateral values over balances outstanding ignored, the fair value of collateral held would be as follows:
At30 September 2013
£m31 December 2012
£mNeither past due nor impaired 29,425.3 29,972.9Past due but not impaired 1,288.5 1,515.7Impaired 270.1 335.7Total 30,983.9 31,824.3
The impaired balances above include £53.8m (31 December 2012: £71.2m) of assets in possession, capped at the balanceoutstanding.
The fair value of the collateral is estimated by taking the most recent valuation of the property and adjusting for house priceinflation or deflation up to the Balance Sheet date.
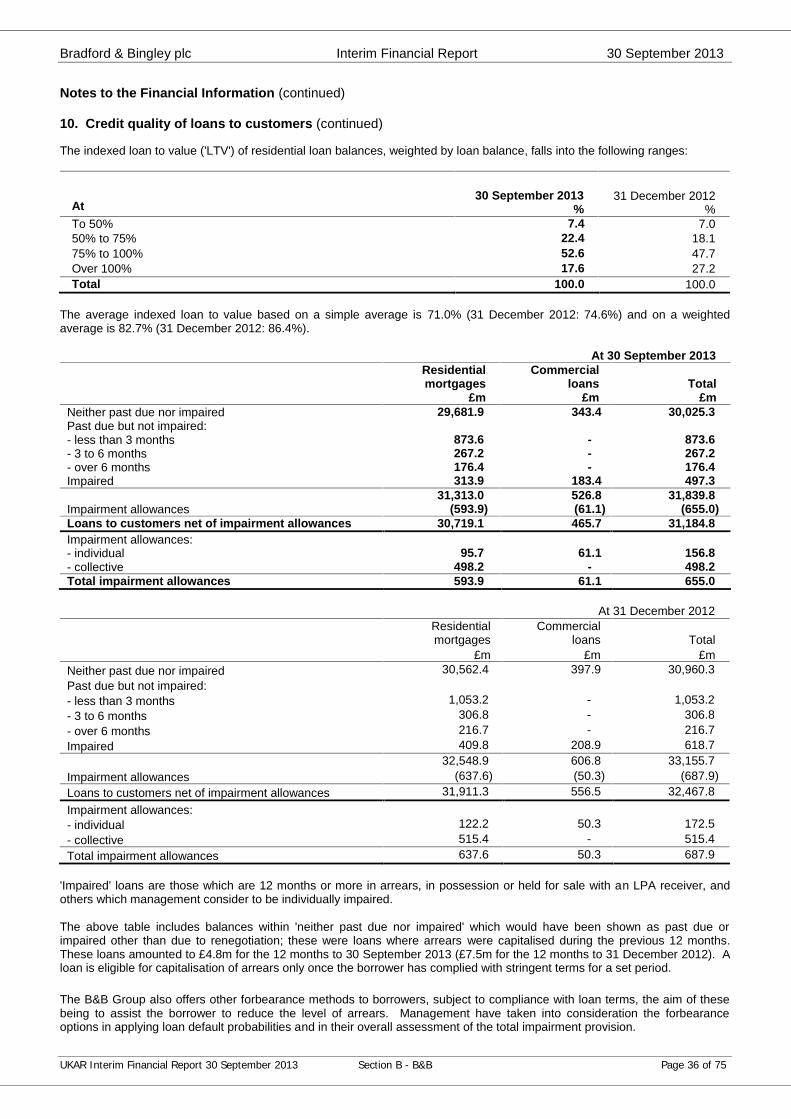
Bradford & Bingley plc Interim Financial Report 30 September 2013
UKAR Interim Financial Report 30 September 2013 Section B - B&B Page 36 of 75
Notes to the Financial Information (continued)
10. Credit quality of loans to customers (continued)
The indexed loan to value ('LTV') of residential loan balances, weighted by loan balance, falls into the following ranges:
At30 September 2013
%31 December 2012
%To 50% 7.4 7.050% to 75% 22.4 18.175% to 100% 52.6 47.7Over 100% 17.6 27.2Total 100.0 100.0
The average indexed loan to value based on a simple average is 71.0% (31 December 2012: 74.6%) and on a weightedaverage is 82.7% (31 December 2012: 86.4%).
At 30 September 2013 Residentialmortgages
Commercialloans Total
£m £m £mNeither past due nor impaired 29,681.9 343.4 30,025.3Past due but not impaired:- less than 3 months 873.6 - 873.6- 3 to 6 months 267.2 - 267.2- over 6 months 176.4 - 176.4Impaired 313.9 183.4 497.3
31,313.0 526.8 31,839.8Impairment allowances (593.9) (61.1) (655.0)Loans to customers net of impairment allowances 30,719.1 465.7 31,184.8Impairment allowances:- individual 95.7 61.1 156.8- collective 498.2 - 498.2Total impairment allowances 593.9 61.1 655.0
At 31 December 2012Residentialmortgages
Commercial loans Total
£m £m £mNeither past due nor impaired 30,562.4 397.9 30,960.3Past due but not impaired:- less than 3 months 1,053.2 - 1,053.2- 3 to 6 months 306.8 - 306.8- over 6 months 216.7 - 216.7Impaired 409.8 208.9 618.7
32,548.9 606.8 33,155.7Impairment allowances (637.6) (50.3) (687.9)Loans to customers net of impairment allowances 31,911.3 556.5 32,467.8Impairment allowances:- individual 122.2 50.3 172.5- collective 515.4 - 515.4Total impairment allowances 637.6 50.3 687.9
'Impaired' loans are those which are 12 months or more in arrears, in possession or held for sale with an LPA receiver, andothers which management consider to be individually impaired.
The above table includes balances within 'neither past due nor impaired' which would have been shown as past due orimpaired other than due to renegotiation; these were loans where arrears were capitalised during the previous 12 months.These loans amounted to £4.8m for the 12 months to 30 September 2013 (£7.5m for the 12 months to 31 December 2012). Aloan is eligible for capitalisation of arrears only once the borrower has complied with stringent terms for a set period.
The B&B Group also offers other forbearance methods to borrowers, subject to compliance with loan terms, the aim of thesebeing to assist the borrower to reduce the level of arrears. Management have taken into consideration the forbearanceoptions in applying loan default probabilities and in their overall assessment of the total impairment provision.
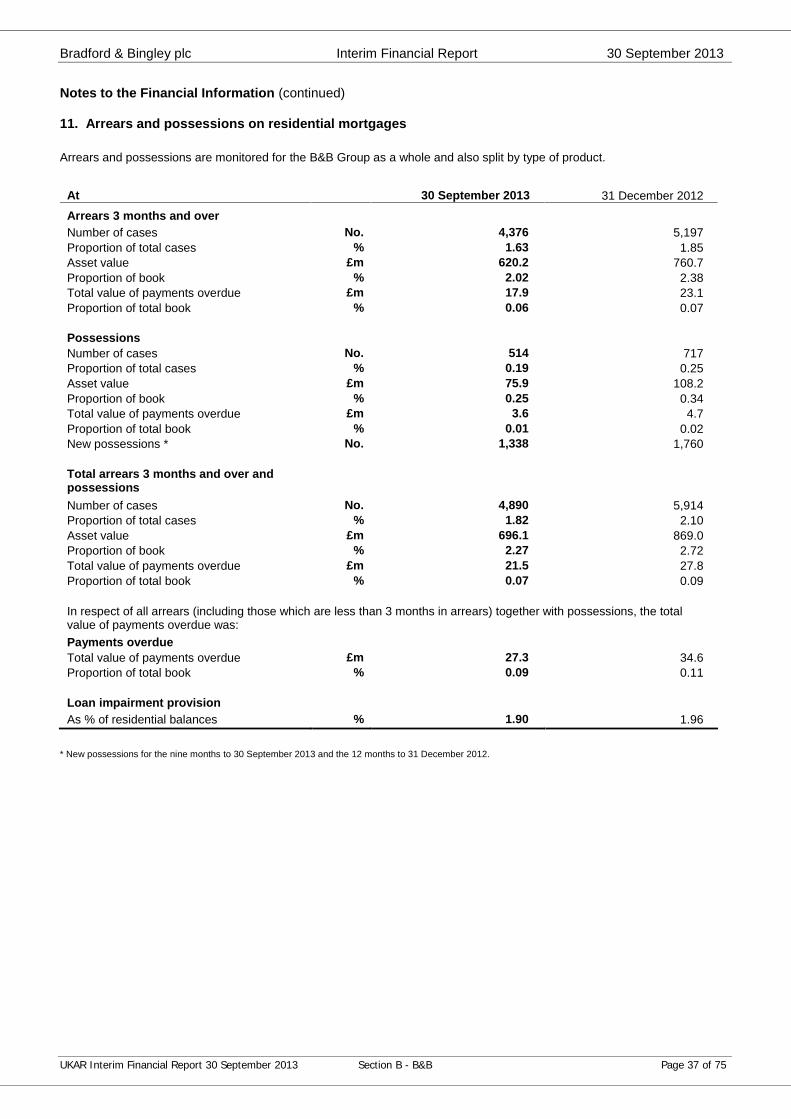
Bradford & Bingley plc Interim Financial Report 30 September 2013
UKAR Interim Financial Report 30 September 2013 Section B - B&B Page 37 of 75
Notes to the Financial Information (continued)
11. Arrears and possessions on residential mortgages
Arrears and possessions are monitored for the B&B Group as a whole and also split by type of product.
At 30 September 2013 31 December 2012
Arrears 3 months and overNumber of cases No. 4,376 5,197Proportion of total cases % 1.63 1.85Asset value £m 620.2 760.7Proportion of book % 2.02 2.38Total value of payments overdue £m 17.9 23.1Proportion of total book % 0.06 0.07
PossessionsNumber of cases No. 514 717Proportion of total cases % 0.19 0.25Asset value £m 75.9 108.2Proportion of book % 0.25 0.34Total value of payments overdue £m 3.6 4.7Proportion of total book % 0.01 0.02New possessions * No. 1,338 1,760
Total arrears 3 months and over andpossessionsNumber of cases No. 4,890 5,914Proportion of total cases % 1.82 2.10Asset value £m 696.1 869.0Proportion of book % 2.27 2.72Total value of payments overdue £m 21.5 27.8Proportion of total book % 0.07 0.09
In respect of all arrears (including those which are less than 3 months in arrears) together with possessions, the totalvalue of payments overdue was:
In respect of all arrears (including those which are less than 3months in arrears) together with possessions, the total value ofpayments overdue was:Payments overdue
Total value of payments overdue £m 27.3 34.6Proportion of total book % 0.09 0.11
Loan impairment provisionAs % of residential balances % 1.90 1.96
* New possessions for the nine months to 30 September 2013 and the 12 months to 31 December 2012.
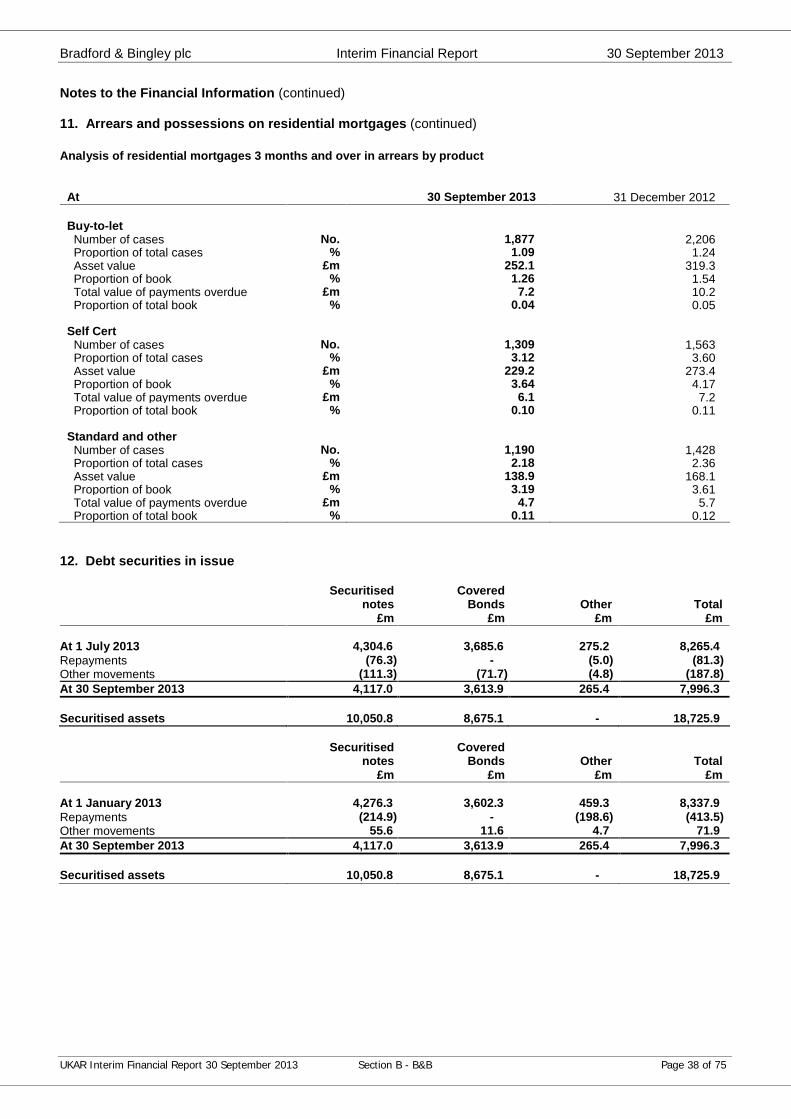
Bradford & Bingley plc Interim Financial Report 30 September 2013
UKAR Interim Financial Report 30 September 2013 Section B - B&B Page 38 of 75
Notes to the Financial Information (continued)
11. Arrears and possessions on residential mortgages (continued)
Analysis of residential mortgages 3 months and over in arrears by product
At 30 September 2013 31 December 2012
Buy-to-let Number of cases No. 1,877 2,206 Proportion of total cases % 1.09 1.24 Asset value £m 252.1 319.3 Proportion of book % 1.26 1.54 Total value of payments overdue £m 7.2 10.2 Proportion of total book % 0.04 0.05
Self Cert Number of cases No. 1,309 1,563 Proportion of total cases % 3.12 3.60 Asset value £m 229.2 273.4 Proportion of book % 3.64 4.17 Total value of payments overdue £m 6.1 7.2 Proportion of total book % 0.10 0.11
Standard and other Number of cases No. 1,190 1,428 Proportion of total cases % 2.18 2.36 Asset value £m 138.9 168.1 Proportion of book % 3.19 3.61 Total value of payments overdue £m 4.7 5.7 Proportion of total book % 0.11 0.12
12. Debt securities in issue
Securitised notes
Covered Bonds Other Total
£m £m £m £m
At 1 July 2013 4,304.6 3,685.6 275.2 8,265.4Repayments (76.3) - (5.0) (81.3)Other movements (111.3) (71.7) (4.8) (187.8)At 30 September 2013 4,117.0 3,613.9 265.4 7,996.3
Securitised assets 10,050.8 8,675.1 - 18,725.9
Securitised notes
Covered Bonds Other Total
£m £m £m £m
At 1 January 2013 4,276.3 3,602.3 459.3 8,337.9Repayments (214.9) - (198.6) (413.5)Other movements 55.6 11.6 4.7 71.9At 30 September 2013 4,117.0 3,613.9 265.4 7,996.3
Securitised assets 10,050.8 8,675.1 - 18,725.9

Bradford & Bingley plc Interim Financial Report 30 September 2013
UKAR Interim Financial Report 30 September 2013 Section B - B&B Page 39 of 75
Notes to the Financial Information (continued)
12. Debt securities in issue (continued)
Securitised notes
Covered Bonds Other Total
£m £m £m £m
At 1 July 2012 4,518.6 3,575.7 576.2 8,670.5Repayments (70.6) - - (70.6)Repurchase (83.9) - - (83.9)Other movements (57.7) (47.3) (2.4) (107.4)At 30 September 2012 4,306.4 3,528.4 573.8 8,408.6
Securitised assets 10,517.6 9,101.1 - 19,618.7
Securitised notes
Covered Bonds Other Total
£m £m £m £m
At 1 January 2012 4,823.7 3,990.3 691.5 9,505.5Repayments (309.0) (190.3) (91.7) (591.0)Repurchase (83.9) - - (83.9)Other movements (124.4) (271.6) (26.0) (422.0)At 30 September 2012 4,306.4 3,528.4 573.8 8,408.6
Securitised assets 10,517.6 9,101.1 - 19,618.7
Other movements comprise exchange rate movements, accrued interest and hedge accounting adjustments.
The B&B Group issued debt securities to securitise loans and advances to customers through SPVs and Covered Bonds andalso raised unsecured medium term funding, the amounts of which are shown above. Certain of these were subject to fairvalue hedge designation and the carrying values of these instruments include unamortised adjustments in respect of the notesthat were hedged.
HM Treasury has provided guarantees with regards to certain wholesale borrowings; B&B pays a fee for these guarantees asshown in note 3.
Securitised assets represent loans to customers which have been used to securitise issued notes, including notes which areheld by other B&B companies.
13. Reserves
Reserves comprise the following:
At 30 September 2013 31 December 2012£m £m
Share premium reserve 198.9 198.9Capital redemption reserve 29.2 29.2Available-for-sale reserve 23.8 17.1Cash flow hedge reserve 56.2 93.1Total 308.1 338.3
14. Release of time-expired provision for unclaimed shares and dividends
Following demutualisation of Bradford & Bingley Building Society in 2000, a number of shares in B&B were unclaimed as theRegistered Holders could not be traced. In accordance with B&B's Articles of Association, these shares were sold in March2004 and the proceeds held by B&B for a further period of nine years to satisfy any claims received from the RegisteredHolders who were originally entitled to the shares. During the period from demutualisation to 31 March 2013 B&B soughtperiodically to trace the Registered Holders. The Registered Holders' entitlement to the proceeds of the sale of the unclaimedshares expired in March 2013, and the remaining provision of £13.2m was, therefore, released to retained earnings.
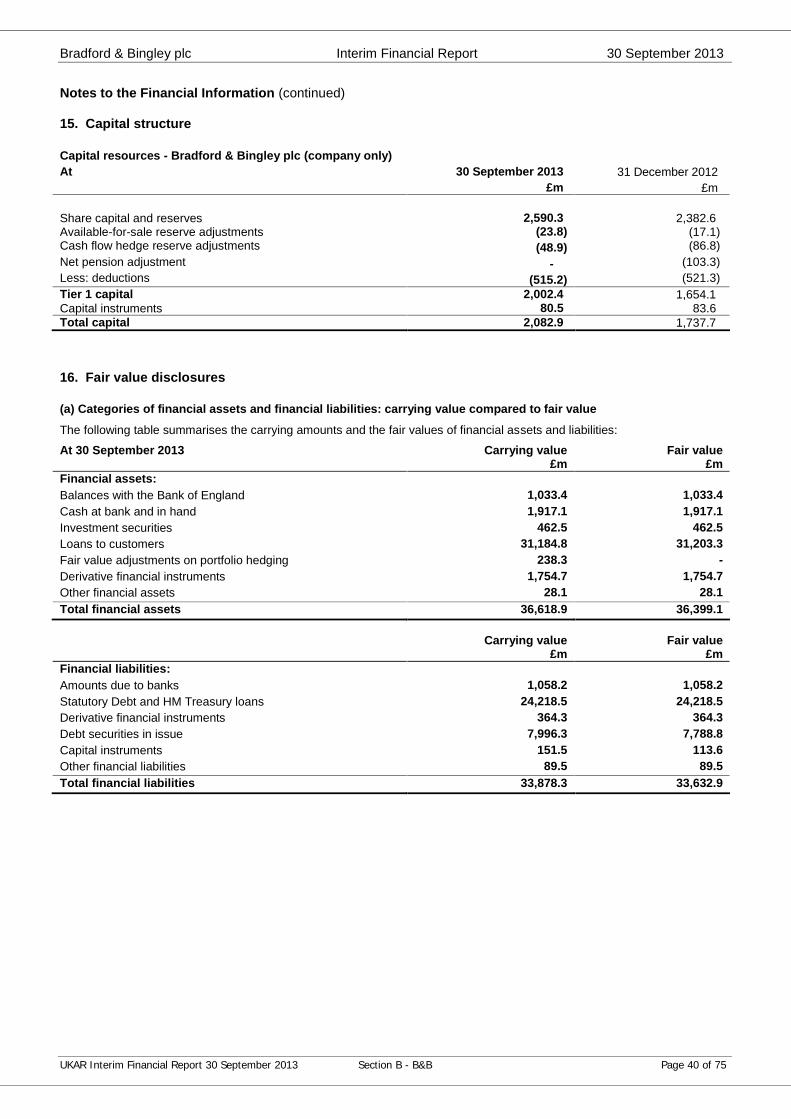
Bradford & Bingley plc Interim Financial Report 30 September 2013
UKAR Interim Financial Report 30 September 2013 Section B - B&B Page 40 of 75
Notes to the Financial Information (continued)
15. Capital structure
Capital resources - Bradford & Bingley plc (company only)At 30 September 2013 31 December 2012
£m £m
Share capital and reserves 2,590.3 2,382.6Available-for-sale reserve adjustments (23.8) (17.1)Cash flow hedge reserve adjustments (48.9) (86.8)Net pension adjustment - (103.3)Less: deductions (515.2) (521.3)Tier 1 capital 2,002.4 1,654.1Capital instruments 80.5 83.6Total capital 2,082.9 1,737.7
16. Fair value disclosures
(a) Categories of financial assets and financial liabilities: carrying value compared to fair value
The following table summarises the carrying amounts and the fair values of financial assets and liabilities:
At 30 September 2013 Carrying value£m
Fair value£m
Financial assets:Balances with the Bank of England 1,033.4 1,033.4Cash at bank and in hand 1,917.1 1,917.1Investment securities 462.5 462.5Loans to customers 31,184.8 31,203.3Fair value adjustments on portfolio hedging 238.3 -Derivative financial instruments 1,754.7 1,754.7Other financial assets 28.1 28.1Total financial assets 36,618.9 36,399.1
Carrying value£m
Fair value£m
Financial liabilities:Amounts due to banks 1,058.2 1,058.2Statutory Debt and HM Treasury loans 24,218.5 24,218.5Derivative financial instruments 364.3 364.3Debt securities in issue 7,996.3 7,788.8Capital instruments 151.5 113.6Other financial liabilities 89.5 89.5Total financial liabilities 33,878.3 33,632.9
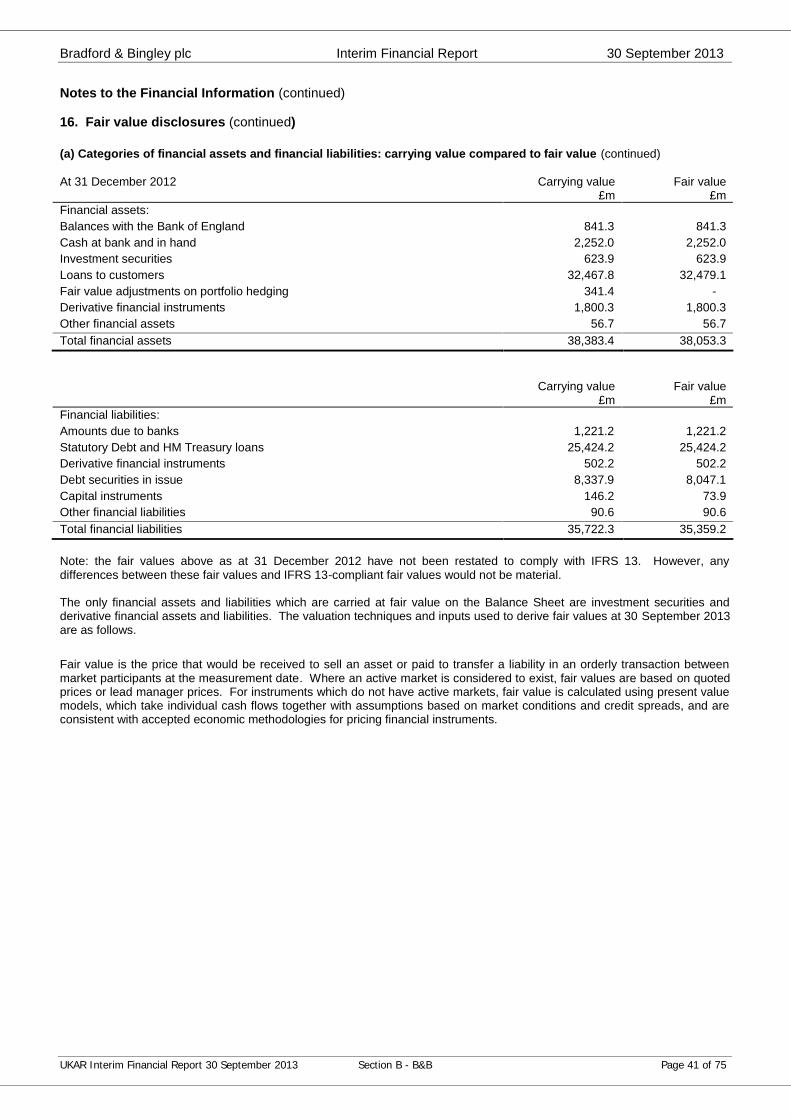
Bradford & Bingley plc Interim Financial Report 30 September 2013
UKAR Interim Financial Report 30 September 2013 Section B - B&B Page 41 of 75
Notes to the Financial Information (continued)
16. Fair value disclosures (continued)
(a) Categories of financial assets and financial liabilities: carrying value compared to fair value (continued)
At 31 December 2012 Carrying value£m
Fair value£m
Financial assets:Balances with the Bank of England 841.3 841.3Cash at bank and in hand 2,252.0 2,252.0Investment securities 623.9 623.9Loans to customers 32,467.8 32,479.1Fair value adjustments on portfolio hedging 341.4 -Derivative financial instruments 1,800.3 1,800.3Other financial assets 56.7 56.7Total financial assets 38,383.4 38,053.3
Carrying value£m
Fair value£m
Financial liabilities:Amounts due to banks 1,221.2 1,221.2Statutory Debt and HM Treasury loans 25,424.2 25,424.2Derivative financial instruments 502.2 502.2Debt securities in issue 8,337.9 8,047.1Capital instruments 146.2 73.9Other financial liabilities 90.6 90.6Total financial liabilities 35,722.3 35,359.2
Note: the fair values above as at 31 December 2012 have not been restated to comply with IFRS 13. However, anydifferences between these fair values and IFRS 13-compliant fair values would not be material.
The only financial assets and liabilities which are carried at fair value on the Balance Sheet are investment securities andderivative financial assets and liabilities. The valuation techniques and inputs used to derive fair values at 30 September 2013are as follows.
Fair value is the price that would be received to sell an asset or paid to transfer a liability in an orderly transaction betweenmarket participants at the measurement date. Where an active market is considered to exist, fair values are based on quotedprices or lead manager prices. For instruments which do not have active markets, fair value is calculated using present valuemodels, which take individual cash flows together with assumptions based on market conditions and credit spreads, and areconsistent with accepted economic methodologies for pricing financial instruments.
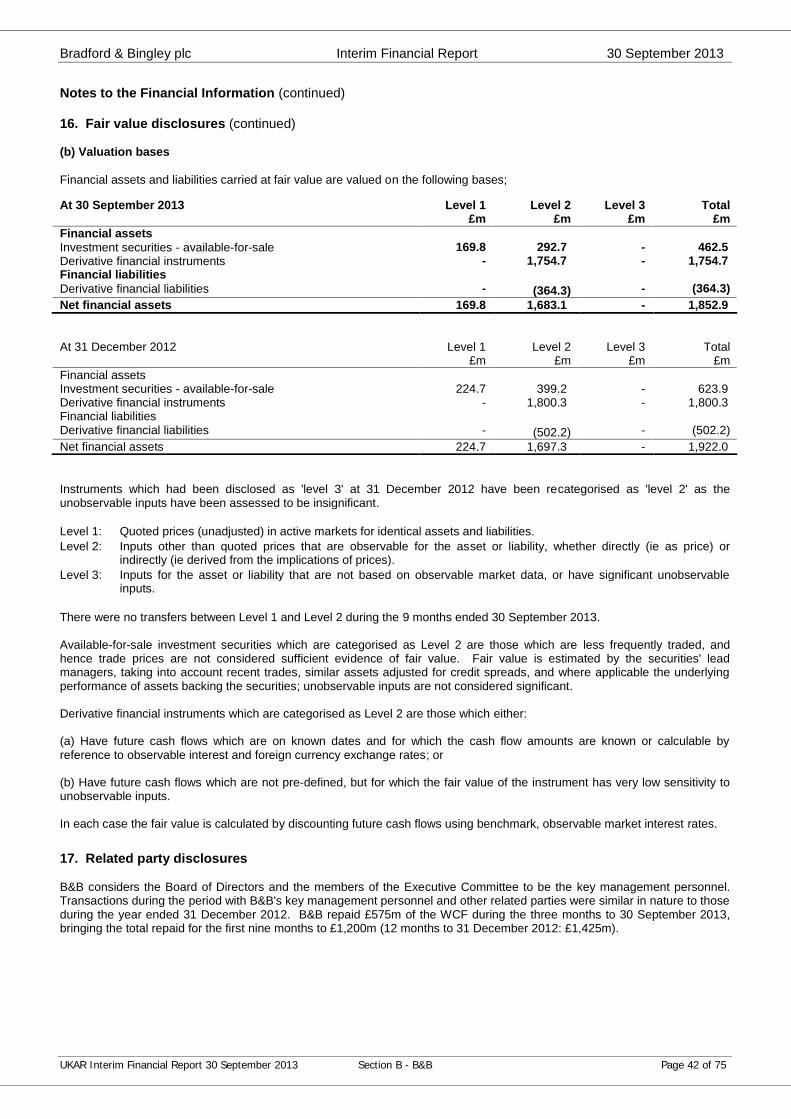
Bradford & Bingley plc Interim Financial Report 30 September 2013
UKAR Interim Financial Report 30 September 2013 Section B - B&B Page 42 of 75
Notes to the Financial Information (continued)
16. Fair value disclosures (continued)
(b) Valuation bases
Financial assets and liabilities carried at fair value are valued on the following bases;
Instruments which had been disclosed as 'level 3' at 31 December 2012 have been recategorised as 'level 2' as theunobservable inputs have been assessed to be insignificant.
Level 1: Quoted prices (unadjusted) in active markets for identical assets and liabilities.Level 2: Inputs other than quoted prices that are observable for the asset or liability, whether directly (ie as price) or
indirectly (ie derived from the implications of prices).Level 3: Inputs for the asset or liability that are not based on observable market data, or have significant unobservable
inputs.
There were no transfers between Level 1 and Level 2 during the 9 months ended 30 September 2013.
Available-for-sale investment securities which are categorised as Level 2 are those which are less frequently traded, andhence trade prices are not considered sufficient evidence of fair value. Fair value is estimated by the securities' leadmanagers, taking into account recent trades, similar assets adjusted for credit spreads, and where applicable the underlyingperformance of assets backing the securities; unobservable inputs are not considered significant.
Derivative financial instruments which are categorised as Level 2 are those which either:
(a) Have future cash flows which are on known dates and for which the cash flow amounts are known or calculable byreference to observable interest and foreign currency exchange rates; or
(b) Have future cash flows which are not pre-defined, but for which the fair value of the instrument has very low sensitivity tounobservable inputs.
In each case the fair value is calculated by discounting future cash flows using benchmark, observable market interest rates.
17. Related party disclosures
B&B considers the Board of Directors and the members of the Executive Committee to be the key management personnel.Transactions during the period with B&B's key management personnel and other related parties were similar in nature to thoseduring the year ended 31 December 2012. B&B repaid £575m of the WCF during the three months to 30 September 2013,bringing the total repaid for the first nine months to £1,200m (12 months to 31 December 2012: £1,425m).
At 30 September 2013 Level 1£m
Level 2£m
Level 3£m
Total£m
Financial assetsInvestment securities - available-for-sale 169.8 292.7 - 462.5Derivative financial instruments - 1,754.7 - 1,754.7Financial liabilitiesDerivative financial liabilities - (364.3) - (364.3)Net financial assets 169.8 1,683.1 - 1,852.9
At 31 December 2012 Level 1£m
Level 2£m
Level 3£m
Total£m
Financial assetsInvestment securities - available-for-sale 224.7 399.2 - 623.9Derivative financial instruments - 1,800.3 - 1,800.3Financial liabilitiesDerivative financial liabilities - (502.2) - (502.2)Net financial assets 224.7 1,697.3 - 1,922.0
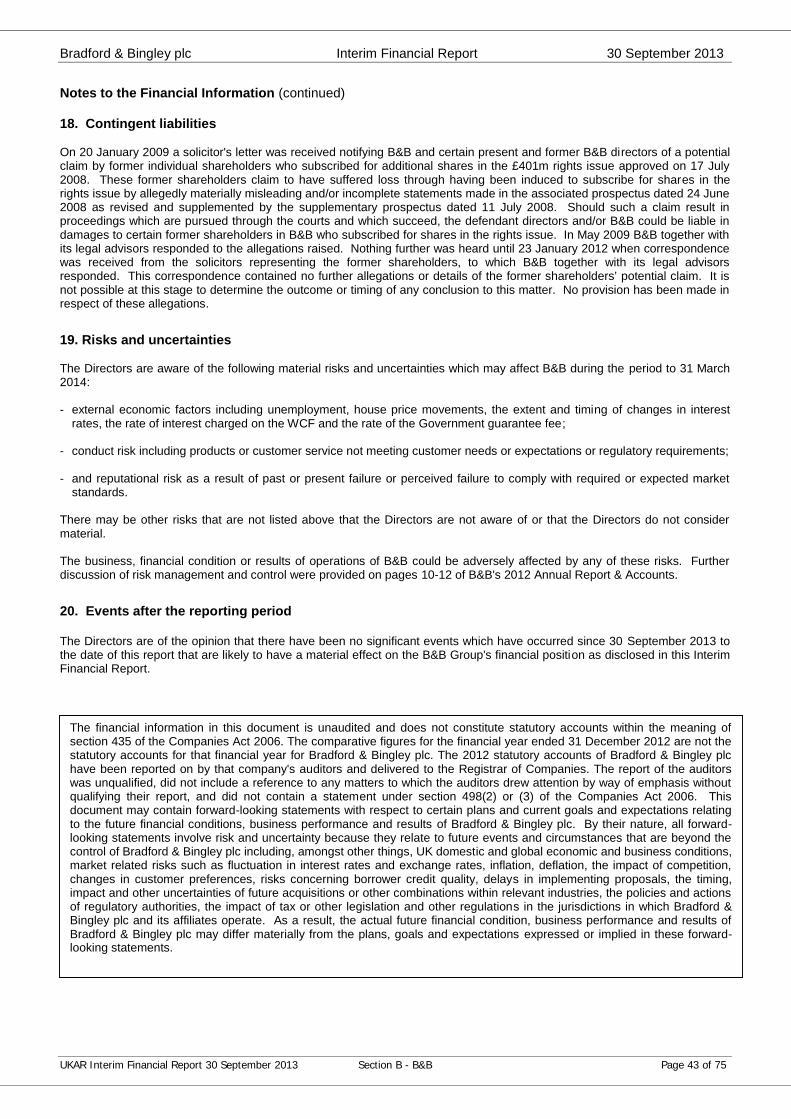
Bradford & Bingley plc Interim Financial Report 30 September 2013
UKAR Interim Financial Report 30 September 2013 Section B - B&B Page 43 of 75
Notes to the Financial Information (continued)
18. Contingent liabilities
On 20 January 2009 a solicitor's letter was received notifying B&B and certain present and former B&B directors of a potentialclaim by former individual shareholders who subscribed for additional shares in the £401m rights issue approved on 17 July2008. These former shareholders claim to have suffered loss through having been induced to subscribe for shares in therights issue by allegedly materially misleading and/or incomplete statements made in the associated prospectus dated 24 June2008 as revised and supplemented by the supplementary prospectus dated 11 July 2008. Should such a claim result inproceedings which are pursued through the courts and which succeed, the defendant directors and/or B&B could be liable indamages to certain former shareholders in B&B who subscribed for shares in the rights issue. In May 2009 B&B together withits legal advisors responded to the allegations raised. Nothing further was heard until 23 January 2012 when correspondencewas received from the solicitors representing the former shareholders, to which B&B together with its legal advisorsresponded. This correspondence contained no further allegations or details of the former shareholders’ potential claim. It isnot possible at this stage to determine the outcome or timing of any conclusion to this matter. No provision has been made inrespect of these allegations.
19. Risks and uncertainties
The Directors are aware of the following material risks and uncertainties which may affect B&B during the period to 31 March2014:
- external economic factors including unemployment, house price movements, the extent and timing of changes in interestrates, the rate of interest charged on the WCF and the rate of the Government guarantee fee;
- conduct risk including products or customer service not meeting customer needs or expectations or regulatory requirements;
- and reputational risk as a result of past or present failure or perceived failure to comply with required or expected marketstandards.
There may be other risks that are not listed above that the Directors are not aware of or that the Directors do not considermaterial.
The business, financial condition or results of operations of B&B could be adversely affected by any of these risks. Furtherdiscussion of risk management and control were provided on pages 10-12 of B&B's 2012 Annual Report & Accounts.
20. Events after the reporting period
The Directors are of the opinion that there have been no significant events which have occurred since 30 September 2013 tothe date of this report that are likely to have a material effect on the B&B Group's financial position as disclosed in this InterimFinancial Report.
The financial information in this document is unaudited and does not constitute statutory accounts within the meaning ofsection 435 of the Companies Act 2006. The comparative figures for the financial year ended 31 December 2012 are not thestatutory accounts for that financial year for Bradford & Bingley plc. The 2012 statutory accounts of Bradford & Bingley plchave been reported on by that company's auditors and delivered to the Registrar of Companies. The report of the auditorswas unqualified, did not include a reference to any matters to which the auditors drew attention by way of emphasis withoutqualifying their report, and did not contain a statement under section 498(2) or (3) of the Companies Act 2006. Thisdocument may contain forward-looking statements with respect to certain plans and current goals and expectations relatingto the future financial conditions, business performance and results of Bradford & Bingley plc. By their nature, all forward-looking statements involve risk and uncertainty because they relate to future events and circumstances that are beyond thecontrol of Bradford & Bingley plc including, amongst other things, UK domestic and global economic and business conditions,market related risks such as fluctuation in interest rates and exchange rates, inflation, deflation, the impact of competition,changes in customer preferences, risks concerning borrower credit quality, delays in implementing proposals, the timing,impact and other uncertainties of future acquisitions or other combinations within relevant industries, the policies and actionsof regulatory authorities, the impact of tax or other legislation and other regulations in the jurisdictions in which Bradford &Bingley plc and its affiliates operate. As a result, the actual future financial condition, business performance and results ofBradford & Bingley plc may differ materially from the plans, goals and expectations expressed or implied in these forward-looking statements.
Bradford & Bingley plc Interim Financial Report 30 September 2013
UKAR Interim Financial Report 30 September 2013 Section B - B&B Page 44 of 75
Statement of Directors' Responsibilities
The Directors confirm that this Interim Financial Report has been prepared in accordance with IAS 34 as adoptedby the European Union and that the management commentary and related notes includes a fair review of theinformation required by DTR 4.2.7 and DTR 4.2.8, namely:
An indication of important events that have occurred during the first nine months and their impact on thecondensed Financial Statements and a description of the principal risks and uncertainties for theremaining three months of the financial period; and
Material related party transactions in the first nine months and any material changes in the related partytransactions described in the last annual report.
The Directors of Bradford & Bingley plc at the date of this report are:
Richard PymKent AtkinsonRichard BanksMichael BuckleyChristopher FoxSue LangleyPhillip McLellandKeith MorganLouise PattenJohn Tattersall
On behalf of the Board
Richard Banks Phillip McLellandChief Executive Officer Finance Director13 November 2013 13 November 2013
Bradford & Bingley plc. Registered Office: Croft Road, Crossflatts, Bingley, West Yorkshire BD16 2UA.Registered in England and Wales under company number 03938288.
Bradford & Bingley plc Interim Financial Report 30 September 2013
UKAR Interim Financial Report 30 September 2013 Section B - B&B Page 45 of 75
Independent Review Report to Bradford & Bingley plc
Introduction
We have been engaged by the company to review the condensed set of Financial Statements in the InterimFinancial Report for the nine months ended 30 September 2013, which comprise the Consolidated IncomeStatement, Consolidated Statement of Comprehensive Income, Consolidated Balance Sheet, ConsolidatedStatement of Changes in Equity, Consolidated Cash Flow Statement and the related notes. We have read theother information contained in the Interim Financial Report and considered whether it contains any apparentmisstatements or material inconsistencies with the information in the condensed set of Financial Statements.
Directors' responsibilities
The Interim Financial Report is the responsibility of, and has been approved by, the Directors. The Directors areresponsible for preparing the Interim Financial Report in accordance with the Disclosure and Transparency Rulesof the United Kingdom's Financial Conduct Authority.
As disclosed in note 2, the Annual Financial Statements of the Group are prepared in accordance with IFRS asadopted by the European Union. The condensed set of Financial Statements included in this Interim FinancialReport has been prepared in accordance with International Accounting Standard 34 'Interim Financial Reporting',as adopted by the European Union.
Our responsibility
Our responsibility is to express to the company a conclusion on the condensed set of Financial Statements in theInterim Financial Report based on our review. This report, including the conclusion, has been prepared for andonly for the company for the purpose of the Disclosure and Transparency Rules of the Financial ConductAuthority and for no other purpose. We do not, in producing this report, accept or assume responsibility for anyother purpose or to any other person to whom this report is shown or into whose hands it may come save whereexpressly agreed by our prior consent in writing.
Scope of review
We conducted our review in accordance with International Standard on Review Engagements (UK and Ireland)2410 'Review of Interim Financial Information Performed by the Independent Auditor of the Entity', issued by theAuditing Practices Board for use in the United Kingdom. A review of interim financial information consists ofmaking enquiries, primarily of persons responsible for financial and accounting matters, and applying analyticaland other review procedures. A review is substantially less in scope than an audit conducted in accordance withInternational Standards on Auditing (UK and Ireland), and consequently does not enable us to obtain assurancethat we would become aware of all significant matters that might be identified in an audit. Accordingly, we do notexpress an audit opinion.
Conclusion
Based on our review, nothing has come to our attention that causes us to believe that the condensed set ofFinancial Statements in the Interim Financial Report for the nine months ended 30 September 2013 is notprepared, in all material respects, in accordance with International Accounting Standard 34 as adopted by theEuropean Union and the Disclosure and Transparency Rules of the United Kingdom's Financial ConductAuthority.
PricewaterhouseCoopers LLPChartered AccountantsBristol13 November 2013
The maintenance and integrity of the Bradford & Bingley plc website is the responsibility of the Directors; the work carried out by the auditorsdoes not involve consideration of these matters and, accordingly, the auditors accept no responsibility for any changes that may haveoccurred to the Financial Statements since they were initially presented on the website.
Legislation in the United Kingdom governing the preparation and dissemination of financial statements may differ from legislation in otherjurisdictions.
Northern Rock (Asset Management) plc Interim Financial Report 30 September 2013
UKAR Interim Financial Report 30 September 2013 Section C - NRAM Page 46 of 75
Section CNorthern Rock (Asset Management) plc
Interim Financial Reportfor the 9 months ended 30 September 2013
Northern Rock (Asset Management) plc Interim Financial Report 30 September 2013
UKAR Interim Financial Report 30 September 2013 Section C - NRAM Page 47 of 75
Northern Rock (Asset Management) plc
Interim Financial Report for the 9 months ended 30 September 2013
KEY HIGHLIGHTS
Northern Rock (Asset Management) plc Repaid a further £1,893m in Government loans in the nine months to 30 September 2013, reducing the total
owed to the Government to £16.2bn. £413m paid to Government in the form of interest, fees and corporation tax. Mortgage accounts three or more months in arrears fell by 28% to 14,103 (FY 2012: 19,667) from the year
end. Underlying profit before tax increased by £23.7m over the nine months to £652.2m, compared to the same
period in 2012. Statutory profit before tax of £622.7m in the nine months to September 2013, compared with £592.5m in
2012.
1. Financial Information
Underlying profit before tax for the three months was £265.7m, bringing underlying profit for the nine months to 30September 2013 to £652.2m, an increase of £23.7m compared to September 2012. The main driver of theimprovement is lower arrears and a correspondingly reduced loan impairment charge.
NRAM has repaid £5.6bn of Government funding since the formation of UKAR in October 2010, including £1.2bnin the three months to 30 September 2013, bringing the total for the first nine months of the year to £1.9bn (FY2012: £1.7bn). This year, repayments have been funded largely from an 8.8% reduction in lending balances(£3.2bn) reflecting £2.2bn of secured residential redemptions, £0.6bn of regular repayments and the sale ofNRAM's standalone unsecured personal loan book (£0.4bn). As at 30 September 2013 lending balances stand at£33.1bn (H1 2013: £34.4bn; FY 2012: £36.3bn). Since October 2010, the Balance Sheet has reduced from£67.9bn to £42.6bn at 30 September 2013.
Other cash flows were generated for the Government in the nine months to September 2013 in the form ofinterest, taxes and guarantee fees, totalling £0.4bn (H1 2013: £0.3bn; FY 2012: £0.4bn).
The sale of the NRAM standalone unsecured personal loan book was completed in July and generated a profitbefore tax of £21.2m. Net proceeds totalling £0.3bn from the sale were used towards the repayment of the NRAMgovernment loan during the third quarter of 2013.
Absolute arrears levels for NRAM continue to fall as a direct consequence of proactive arrears managementcoupled with the continued low interest rate environment.
The total number of mortgage cases three or more months in arrears, including those in possession, reduced by13% from 30 June 2013 to 14,103 cases at 30 September 2013 (H1 2013: 16,186; FY 2012: 19,667). The totalvalue of residential arrears owed by customers has fallen by £33.5m to £117.6m during the nine months to 30September 2013, a reduction of 22%.
As reported at the half year we have completed the integration of the operations of the two businesses and thetransfer of our IT infrastructure to a new supplier giving us reduced costs and increased operational flexibility.Ongoing administrative expenses for the nine months to September 2013 were 5% lower than the equivalentperiod in 2012 at £81.7m (9m 2012: £86.3m; FY 2012: £113.9m).
2. Customers and Conduct
Provision for customer redress
NRAM defines conduct risk as the risk of NRAM treating its customers unfairly and delivering inappropriateoutcomes leading to customer detriment. Since the creation of UKAR we have been remediating a series ofconduct issues inherited from the legacy business, including mis-selling of PPI by Northern Rock. During 2013levels of PPI claims have reduced and, at the present time, no further provision is required.
Northern Rock (Asset Management) plc Interim Financial Report 30 September 2013
UKAR Interim Financial Report 30 September 2013 Section C - NRAM Page 48 of 75
2. Customers and Conduct (continued)
Provision for customer redress (continued)
A further issue that has previously been reported was in respect of non-compliant CCA loans, being loans wherethe original loan amount offered was under £25,000. In 2012, £271m was provided for remediating non-compliantCCA loans and 126,000 customers have now been contacted and their accounts corrected. At June 2013, weprovided a further £47m primarily on accounts previously sold by Northern Rock plc in 2008 prior tonationalisation which were subject to the same problem and released £2m in respect of provisions for otherremediation activities.
NRAM are not remediating customers with loans that fall outside the limit of the CCA regulation but who havebeen issued with CCA documentation in the past. We have obtained legal advice and have concluded that this isthe correct course of action but it is possible that this could, in the future, be tested in the courts. We havereported this contingent liability in note 19. Since discovering the issues with the CCA loans, a review ofcustomer documentation has been conducted to ensure customers have been treated appropriately. As a result,no further provisions have been made as at September.
Support for customers experiencing payment difficulties
In total, NRAM has almost 298,000 customers (H1 2013: 388,000; FY 2012: 412,000), with 285,000 mortgageaccounts (H1 2013: 292,000; FY 2012: 305,000) and 126,000 unsecured personal loan accounts (H1 2013212,000; FY 2012: 228,000). The majority of these loans continue to perform well with more than 90% ofmortgage customers up to date with their mortgage payments. However, NRAM does have a significant numberof customers who are finding it difficult to meet their repayments. In those cases, we work closely with customersto offer a range of solutions to help them manage their circumstances. During the first nine months of 2013,35,700 arrangements were successfully completed and approximately 1,100 account modifications were made(FY 2012: 3,300) to assist customers with the repayments of their mortgage.
We also work with a range of non-fee charging debt advice agencies to help customers reorganise their financesand ensure, wherever possible, that they can continue as homeowners. Research conducted by YouGov and theMoney Advice Service shows that individuals who seek advice are twice as likely to have their debt becomemanageable within 12 months compared to those who do not. The number of NRAM customers referred to debtadvice agencies in the first nine months of 2013 was 3,068 (FY 2012: 5,587). The reduction in referrals reflectsthe fall in the number of customers in arrears.
In some circumstances, however, the most appropriate course of action is for customers to sell their property andwe support this process, where suitable, through assisted voluntary sales. Repossession proceedings forcustomers in arrears are viewed as a last resort but in some situations this is inevitable and the best course ofaction to prevent further indebtedness. The number of properties taken into possession in the first nine monthswas 3,503 (FY 2012 5,566).
Support for customers with interest only mortgages
It is a key objective for UKAR to work with customers to achieve the most appropriate outcome for their particularsituation. In addition to our contact strategies for customers in financial difficulty, a further area of focus for UKARis whether our interest only customers have plans in place to repay their mortgage at the end of their term. Asreported at the half year we have been proactively writing to or calling interest only customers with mortgageterms of ten years or less remaining, reminding them of their obligations and explaining how we can help. Thisactivity is designed to ensure customers are aware of the need to plan for the repayment of their loan at the endof its term and to encourage them to share details of their plans so we can help ensure they are robust. We havehad an excellent response to the campaign so far.
OTHER INFORMATION
Northern Rock (Asset Management) plc
Northern Rock was nationalised and taken into Government ownership in February 2008 and was thenrestructured into two legal entities with effect from 1 January 2010 - Northern Rock plc and Northern Rock (AssetManagement) plc. NRAM retained the majority of the pre-existing mortgage book and all pre-existing unsecuredloan accounts. NRAM is permanently closed to new lending, but continues to provide services to some 298,000existing borrowers, with 285,000 mortgage accounts and 126,000 unsecured loan accounts.
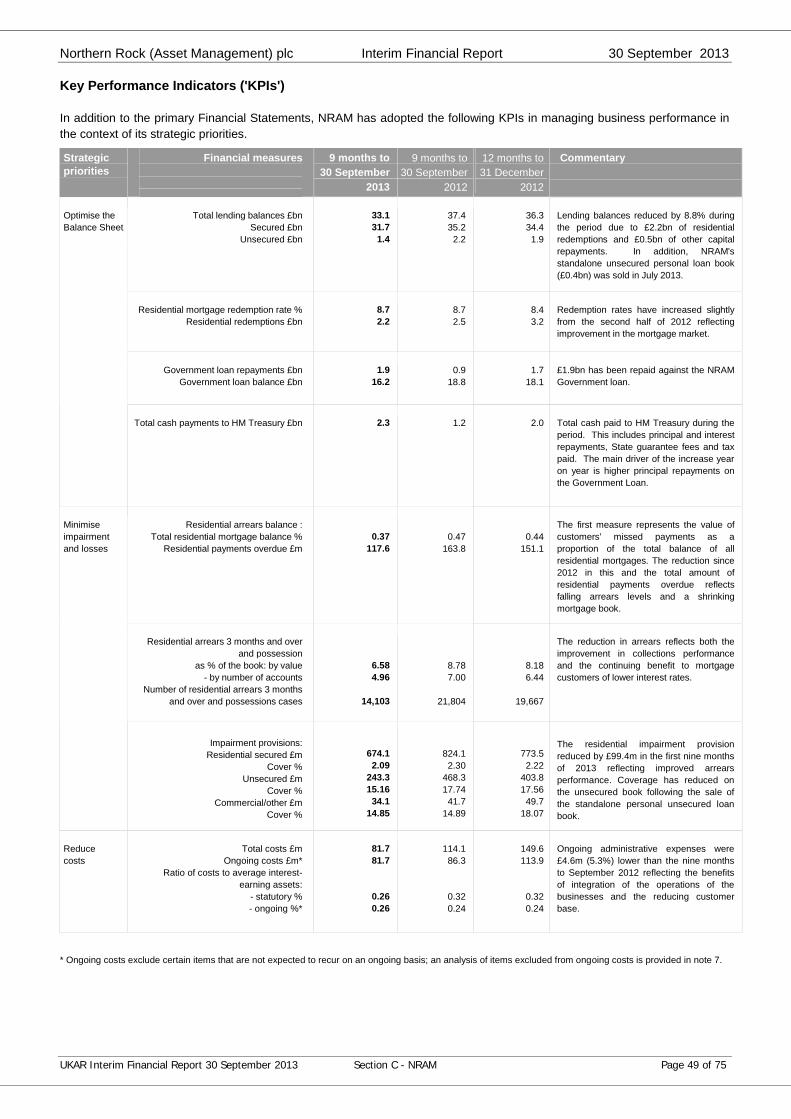
Northern Rock (Asset Management) plc Interim Financial Report 30 September 2013
UKAR Interim Financial Report 30 September 2013 Section C - NRAM Page 49 of 75
Key Performance Indicators ('KPIs')
In addition to the primary Financial Statements, NRAM has adopted the following KPIs in managing business performance inthe context of its strategic priorities.
Strategicpriorities
Financial measures 9 months to 30 September
2013
9 months to30 September
2012
12 months to31 December
2012
Commentary
Total lending balances £bnSecured £bn
Unsecured £bn
33.131.7
1.4
37.435.2
2.2
36.334.41.9
Lending balances reduced by 8.8% duringthe period due to £2.2bn of residentialredemptions and £0.5bn of other capitalrepayments. In addition, NRAM'sstandalone unsecured personal loan book(£0.4bn) was sold in July 2013.
Residential mortgage redemption rate %Residential redemptions £bn
8.72.2
8.72.5
8.43.2
Redemption rates have increased slightlyfrom the second half of 2012 reflectingimprovement in the mortgage market.
Government loan repayments £bnGovernment loan balance £bn
1.916.2
0.918.8
1.718.1
£1.9bn has been repaid against the NRAMGovernment loan.
Optimise theBalance Sheet
Total cash payments to HM Treasury £bn 2.3 1.2 2.0 Total cash paid to HM Treasury during theperiod. This includes principal and interestrepayments, State guarantee fees and taxpaid. The main driver of the increase yearon year is higher principal repayments onthe Government Loan.
Residential arrears balance :Total residential mortgage balance %
Residential payments overdue £m0.37
117.60.47
163.80.44
151.1
The first measure represents the value ofcustomers’ missed payments as aproportion of the total balance of allresidential mortgages. The reduction since2012 in this and the total amount ofresidential payments overdue reflectsfalling arrears levels and a shrinkingmortgage book.
Residential arrears 3 months and overand possession
as % of the book: by value- by number of accounts
Number of residential arrears 3 monthsand over and possessions cases
6.584.96
14,103
8.787.00
21,804
8.186.44
19,667
The reduction in arrears reflects both theimprovement in collections performanceand the continuing benefit to mortgagecustomers of lower interest rates.
Minimiseimpairmentand losses
Impairment provisions:Residential secured £m
Cover %Unsecured £m
Cover %Commercial/other £m
Cover %
674.12.09
243.315.1634.1
14.85
824.12.30
468.317.7441.7
14.89
773.52.22
403.817.5649.7
18.07
The residential impairment provisionreduced by £99.4m in the first nine monthsof 2013 reflecting improved arrearsperformance. Coverage has reduced onthe unsecured book following the sale ofthe standalone personal unsecured loanbook.
Reducecosts
Total costs £mOngoing costs £m*
Ratio of costs to average interest-earning assets:
- statutory %- ongoing %*
81.781.7
0.260.26
114.186.3
0.320.24
149.6113.9
0.320.24
Ongoing administrative expenses were£4.6m (5.3%) lower than the nine monthsto September 2012 reflecting the benefitsof integration of the operations of thebusinesses and the reducing customerbase.
* Ongoing costs exclude certain items that are not expected to recur on an ongoing basis; an analysis of items excluded from ongoing costs is provided in note 7.
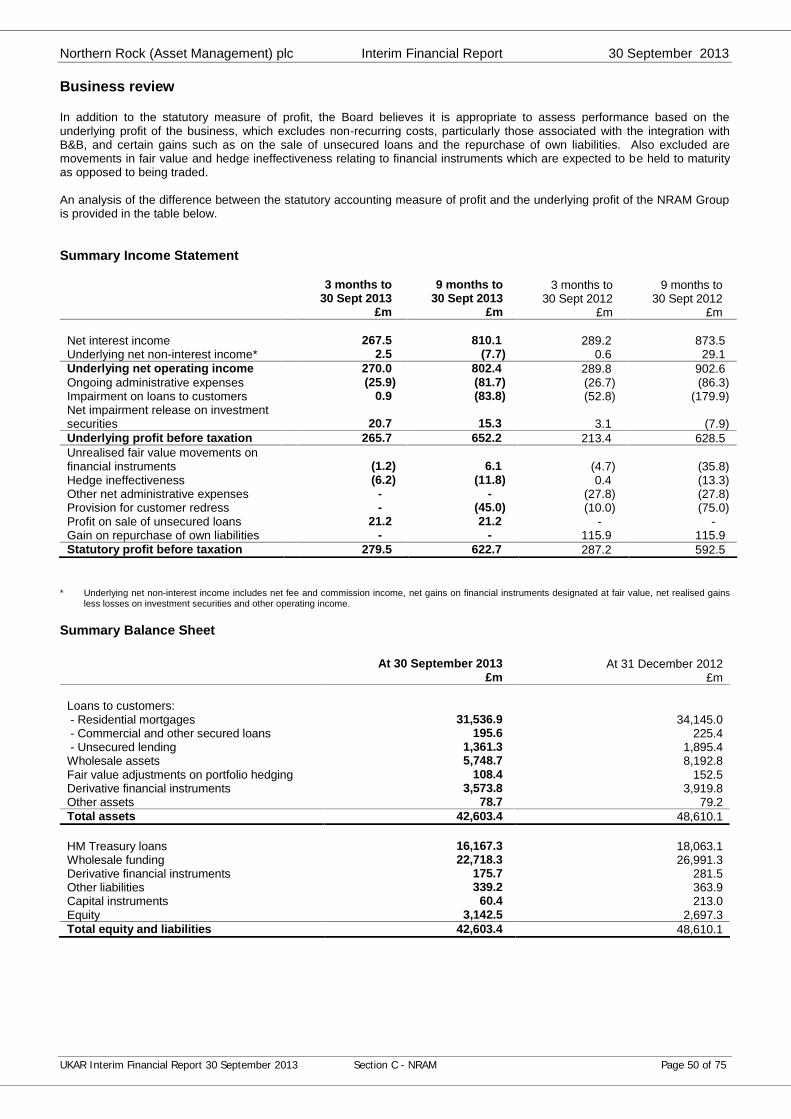
Northern Rock (Asset Management) plc Interim Financial Report 30 September 2013
UKAR Interim Financial Report 30 September 2013 Section C - NRAM Page 50 of 75
Business review
In addition to the statutory measure of profit, the Board believes it is appropriate to assess performance based on theunderlying profit of the business, which excludes non-recurring costs, particularly those associated with the integration withB&B, and certain gains such as on the sale of unsecured loans and the repurchase of own liabilities. Also excluded aremovements in fair value and hedge ineffectiveness relating to financial instruments which are expected to be held to maturityas opposed to being traded.
An analysis of the difference between the statutory accounting measure of profit and the underlying profit of the NRAM Groupis provided in the table below.
Summary Income Statement
* Underlying net non-interest income includes net fee and commission income, net gains on financial instruments designated at fair value, net realised gainsless losses on investment securities and other operating income.
Summary Balance Sheet
At 30 September 2013 At 31 December 2012£m £m
Loans to customers:- Residential mortgages 31,536.9 34,145.0- Commercial and other secured loans 195.6 225.4- Unsecured lending 1,361.3 1,895.4
Wholesale assets 5,748.7 8,192.8Fair value adjustments on portfolio hedging 108.4 152.5Derivative financial instruments 3,573.8 3,919.8Other assets 78.7 79.2Total assets 42,603.4 48,610.1
HM Treasury loans 16,167.3 18,063.1Wholesale funding 22,718.3 26,991.3Derivative financial instruments 175.7 281.5Other liabilities 339.2 363.9Capital instruments 60.4 213.0Equity 3,142.5 2,697.3Total equity and liabilities 42,603.4 48,610.1
3 months to 30 Sept 2013
9 months to 30 Sept 2013
3 months to 30 Sept 2012
9 months to 30 Sept 2012
£m £m £m £m
Net interest income 267.5 810.1 289.2 873.5Underlying net non-interest income* 2.5 (7.7) 0.6 29.1Underlying net operating income 270.0 802.4 289.8 902.6Ongoing administrative expenses (25.9) (81.7) (26.7) (86.3)Impairment on loans to customers 0.9 (83.8) (52.8) (179.9)Net impairment release on investmentsecurities 20.7 15.3 3.1 (7.9)Underlying profit before taxation 265.7 652.2 213.4 628.5Unrealised fair value movements onfinancial instruments (1.2) 6.1 (4.7) (35.8)Hedge ineffectiveness (6.2) (11.8) 0.4 (13.3)Other net administrative expenses - - (27.8) (27.8)Provision for customer redress - (45.0) (10.0) (75.0)Profit on sale of unsecured loans 21.2 21.2 - -Gain on repurchase of own liabilities - - 115.9 115.9Statutory profit before taxation 279.5 622.7 287.2 592.5
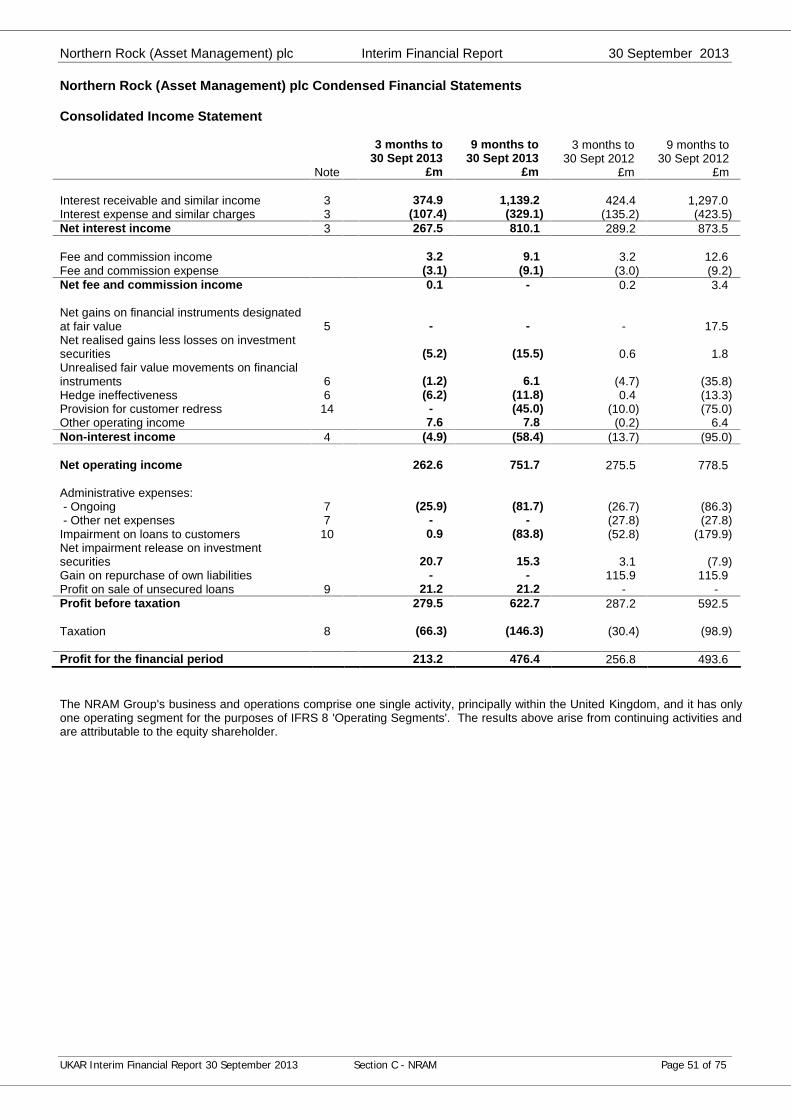
Northern Rock (Asset Management) plc Interim Financial Report 30 September 2013
UKAR Interim Financial Report 30 September 2013 Section C - NRAM Page 51 of 75
Northern Rock (Asset Management) plc Condensed Financial Statements
Consolidated Income Statement
3 months to 30 Sept 2013
9 months to 30 Sept 2013
3 months to 30 Sept 2012
9 months to 30 Sept 2012
Note £m £m £m £m
Interest receivable and similar income 3 374.9 1,139.2 424.4 1,297.0Interest expense and similar charges 3 (107.4) (329.1) (135.2) (423.5)Net interest income 3 267.5 810.1 289.2 873.5
Fee and commission income 3.2 9.1 3.2 12.6Fee and commission expense (3.1) (9.1) (3.0) (9.2)Net fee and commission income 0.1 - 0.2 3.4
Net gains on financial instruments designatedat fair value 5 - - - 17.5Net realised gains less losses on investmentsecurities (5.2) (15.5) 0.6 1.8Unrealised fair value movements on financialinstruments 6 (1.2) 6.1 (4.7) (35.8)Hedge ineffectiveness 6 (6.2) (11.8) 0.4 (13.3)Provision for customer redress 14 - (45.0) (10.0) (75.0)Other operating income 7.6 7.8 (0.2) 6.4Non-interest income 4 (4.9) (58.4) (13.7) (95.0)
Net operating income 262.6 751.7 275.5 778.5
Administrative expenses:- Ongoing 7 (25.9) (81.7) (26.7) (86.3)- Other net expenses 7 - - (27.8) (27.8)
Impairment on loans to customers 10 0.9 (83.8) (52.8) (179.9)Net impairment release on investmentsecurities 20.7 15.3 3.1 (7.9)Gain on repurchase of own liabilities - - 115.9 115.9Profit on sale of unsecured loans 9 21.2 21.2 - -Profit before taxation 279.5 622.7 287.2 592.5
Taxation 8 (66.3) (146.3) (30.4) (98.9)
Profit for the financial period 213.2 476.4 256.8 493.6
The NRAM Group's business and operations comprise one single activity, principally within the United Kingdom, and it has onlyone operating segment for the purposes of IFRS 8 'Operating Segments'. The results above arise from continuing activities andare attributable to the equity shareholder.
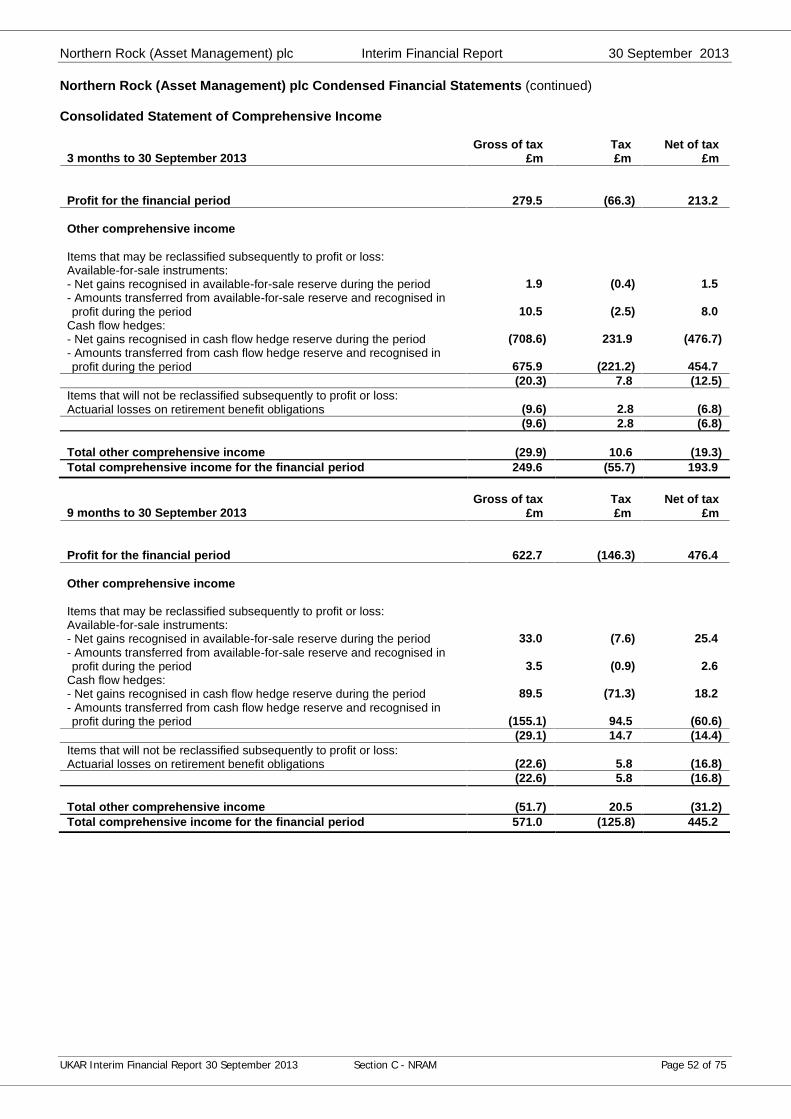
Northern Rock (Asset Management) plc Interim Financial Report 30 September 2013
UKAR Interim Financial Report 30 September 2013 Section C - NRAM Page 52 of 75
Northern Rock (Asset Management) plc Condensed Financial Statements (continued)
Consolidated Statement of Comprehensive Income
Gross of tax Tax Net of tax3 months to 30 September 2013 £m £m £m
Profit for the financial period 279.5 (66.3) 213.2
Other comprehensive income
Items that may be reclassified subsequently to profit or loss:Available-for-sale instruments:- Net gains recognised in available-for-sale reserve during the period 1.9 (0.4) 1.5- Amounts transferred from available-for-sale reserve and recognised inprofit during the period 10.5 (2.5) 8.0
Cash flow hedges:- Net gains recognised in cash flow hedge reserve during the period (708.6) 231.9 (476.7)- Amounts transferred from cash flow hedge reserve and recognised inprofit during the period 675.9 (221.2) 454.7
(20.3) 7.8 (12.5)Items that will not be reclassified subsequently to profit or loss:Actuarial losses on retirement benefit obligations (9.6) 2.8 (6.8)
(9.6) 2.8 (6.8)
Total other comprehensive income (29.9) 10.6 (19.3)Total comprehensive income for the financial period 249.6 (55.7) 193.9
Gross of tax Tax Net of tax9 months to 30 September 2013 £m £m £m
Profit for the financial period 622.7 (146.3) 476.4
Other comprehensive income
Items that may be reclassified subsequently to profit or loss:Available-for-sale instruments:- Net gains recognised in available-for-sale reserve during the period 33.0 (7.6) 25.4- Amounts transferred from available-for-sale reserve and recognised inprofit during the period 3.5 (0.9) 2.6
Cash flow hedges:- Net gains recognised in cash flow hedge reserve during the period 89.5 (71.3) 18.2- Amounts transferred from cash flow hedge reserve and recognised inprofit during the period (155.1) 94.5 (60.6)
(29.1) 14.7 (14.4)Items that will not be reclassified subsequently to profit or loss:Actuarial losses on retirement benefit obligations (22.6) 5.8 (16.8)
(22.6) 5.8 (16.8)
Total other comprehensive income (51.7) 20.5 (31.2)Total comprehensive income for the financial period 571.0 (125.8) 445.2
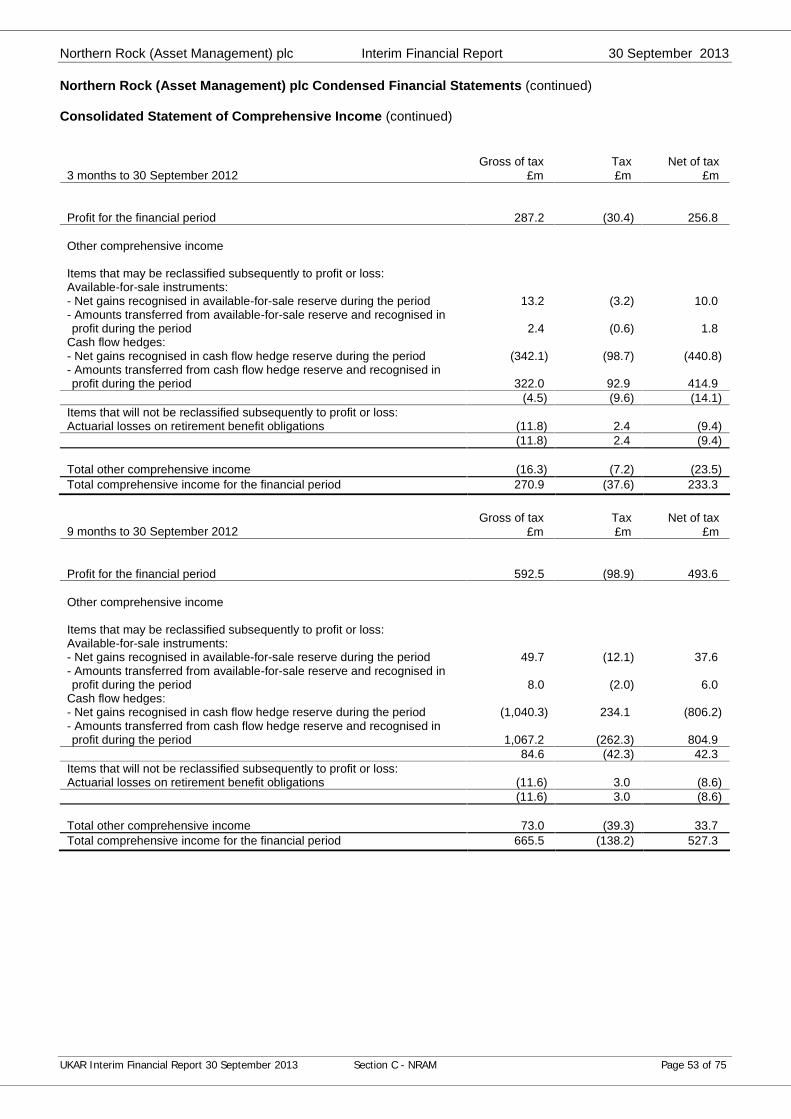
Northern Rock (Asset Management) plc Interim Financial Report 30 September 2013
UKAR Interim Financial Report 30 September 2013 Section C - NRAM Page 53 of 75
Northern Rock (Asset Management) plc Condensed Financial Statements (continued)
Consolidated Statement of Comprehensive Income (continued)
Gross of tax Tax Net of tax3 months to 30 September 2012 £m £m £m
Profit for the financial period 287.2 (30.4) 256.8
Other comprehensive income
Items that may be reclassified subsequently to profit or loss:Available-for-sale instruments:- Net gains recognised in available-for-sale reserve during the period 13.2 (3.2) 10.0- Amounts transferred from available-for-sale reserve and recognised inprofit during the period 2.4 (0.6) 1.8
Cash flow hedges:- Net gains recognised in cash flow hedge reserve during the period (342.1) (98.7) (440.8)- Amounts transferred from cash flow hedge reserve and recognised inprofit during the period 322.0 92.9 414.9
(4.5) (9.6) (14.1)Items that will not be reclassified subsequently to profit or loss:Actuarial losses on retirement benefit obligations (11.8) 2.4 (9.4)
(11.8) 2.4 (9.4)
Total other comprehensive income (16.3) (7.2) (23.5)Total comprehensive income for the financial period 270.9 (37.6) 233.3
Gross of tax Tax Net of tax9 months to 30 September 2012 £m £m £m
Profit for the financial period 592.5 (98.9) 493.6
Other comprehensive income
Items that may be reclassified subsequently to profit or loss:Available-for-sale instruments:- Net gains recognised in available-for-sale reserve during the period 49.7 (12.1) 37.6- Amounts transferred from available-for-sale reserve and recognised inprofit during the period 8.0 (2.0) 6.0
Cash flow hedges:- Net gains recognised in cash flow hedge reserve during the period (1,040.3) 234.1 (806.2)- Amounts transferred from cash flow hedge reserve and recognised inprofit during the period 1,067.2 (262.3) 804.9
84.6 (42.3) 42.3Items that will not be reclassified subsequently to profit or loss:Actuarial losses on retirement benefit obligations (11.6) 3.0 (8.6)
(11.6) 3.0 (8.6)
Total other comprehensive income 73.0 (39.3) 33.7Total comprehensive income for the financial period 665.5 (138.2) 527.3
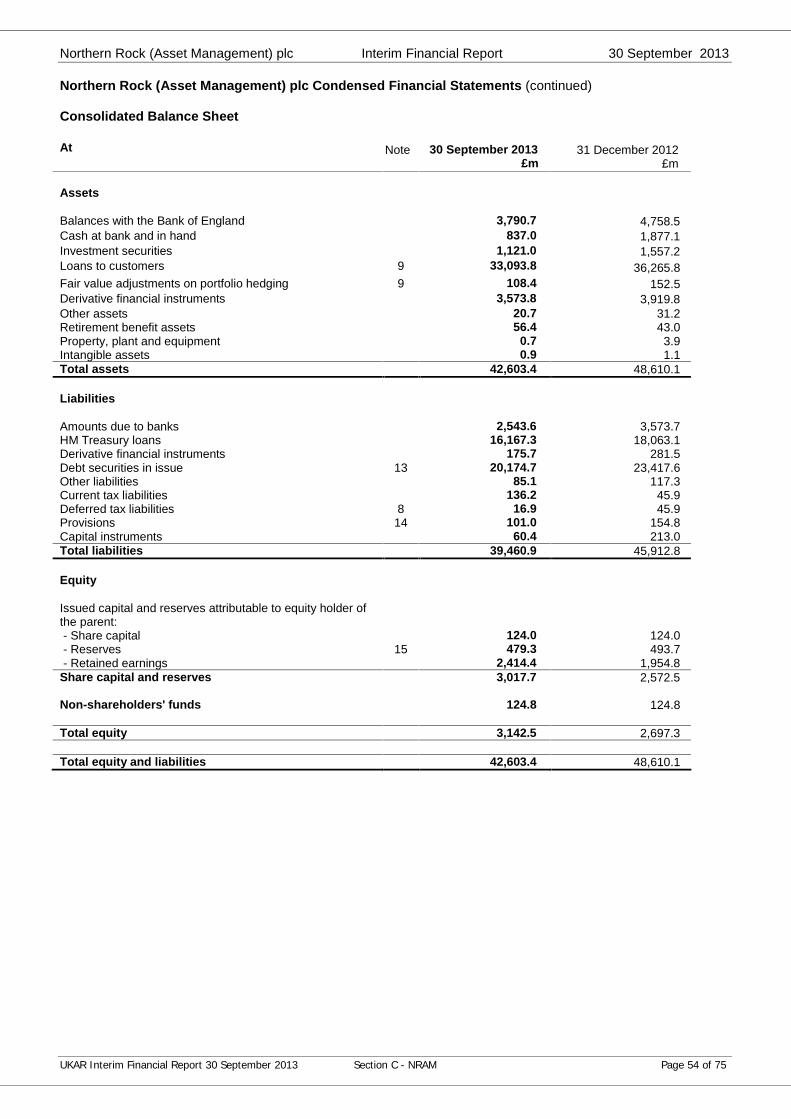
Northern Rock (Asset Management) plc Interim Financial Report 30 September 2013
UKAR Interim Financial Report 30 September 2013 Section C - NRAM Page 54 of 75
Northern Rock (Asset Management) plc Condensed Financial Statements (continued)
Consolidated Balance Sheet
At Note 30 September 2013 31 December 2012£m £m
Assets
Balances with the Bank of England 3,790.7 4,758.5Cash at bank and in hand 837.0 1,877.1Investment securities 1,121.0 1,557.2Loans to customers 9 33,093.8 36,265.8Fair value adjustments on portfolio hedging 9 108.4 152.5Derivative financial instruments 3,573.8 3,919.8Other assets 20.7 31.2Retirement benefit assets 56.4 43.0Property, plant and equipment 0.7 3.9Intangible assets 0.9 1.1Total assets 42,603.4 48,610.1
Liabilities
Amounts due to banks 2,543.6 3,573.7HM Treasury loans 16,167.3 18,063.1Derivative financial instruments 175.7 281.5Debt securities in issue 13 20,174.7 23,417.6Other liabilities 85.1 117.3Current tax liabilities 136.2 45.9Deferred tax liabilities 8 16.9 45.9Provisions 14 101.0 154.8Capital instruments 60.4 213.0Total liabilities 39,460.9 45,912.8
Equity
Issued capital and reserves attributable to equity holder ofthe parent:- Share capital 124.0 124.0- Reserves 15 479.3 493.7- Retained earnings 2,414.4 1,954.8
Share capital and reserves 3,017.7 2,572.5
Non-shareholders' funds 124.8 124.8
Total equity 3,142.5 2,697.3
Total equity and liabilities 42,603.4 48,610.1

Northern Rock (Asset Management) plc Interim Financial Report 30 September 2013
UKAR Interim Financial Report 30 September 2013 Section C - NRAM Page 55 of 75
Northern Rock (Asset Management) plc Condensed Financial Statements (continued)
Consolidated Statement of Changes in Equity
Sharecapital
Sharepremium
reserve
Capitalredemption
reserveOther
reservesRetainedearnings
Total sharecapital and
reserves
Non-share-
holders'funds
Totalequity9 months to
30 September 2013 £m £m £m £m £m £m £m £m
At 1 January 2013 124.0 403.2 7.3 83.2 1,954.8 2,572.5 124.8 2,697.3
Other comprehensive income:- Net movement in available-
for-sale reserve - - - 36.5 - 36.5 - 36.5- Net movement in cash flow
hedge reserve - - - (65.6) - (65.6) - (65.6)- Actuarial losses - - - - (22.6) (22.6) - (22.6)- Tax effects of the above - - - 14.7 5.8 20.5 - 20.5Total other comprehensiveincome - - - (14.4) (16.8) (31.2) - (31.2)Profit for the financial period - - - - 476.4 476.4 - 476.4Total comprehensive income - - - (14.4) 459.6 445.2 - 445.2At 30 September 2013 124.0 403.2 7.3 68.8 2,414.4 3,017.7 124.8 3,142.5
Sharecapital
Sharepremium
reserve
Capitalredemption
reserveOther
reservesRetainedearnings
Total sharecapital and
reserves
Non-share-
holders'funds
Totalequity12 months to
31 December 2012 £m £m £m £m £m £m £m £m
At 1 January 2012 124.0 403.2 7.3 3.2 1,560.9 2,098.6 125.7 2,224.3
Other comprehensive income:- Net movement in available-
for-sale reserve - - - 67.4 - 67.4 - 67.4- Net movement in cash flow
hedge reserve - - - 64.1 - 64.1 - 64.1- Actuarial losses - - - - (22.9) (22.9) - (22.9)- Tax effects of the above - - - (51.5) 5.3 (46.2) - (46.2)Total other comprehensiveincome - - - 80.0 (17.6) 62.4 - 62.4Profit for the financial year - - - - 411.3 411.3 - 411.3Total comprehensive income - - - 80.0 393.7 473.7 - 473.7Gain on repurchase of equity - - - - 0.2 0.2 (0.9) (0.7)At 31 December 2012 124.0 403.2 7.3 83.2 1,954.8 2,572.5 124.8 2,697.3
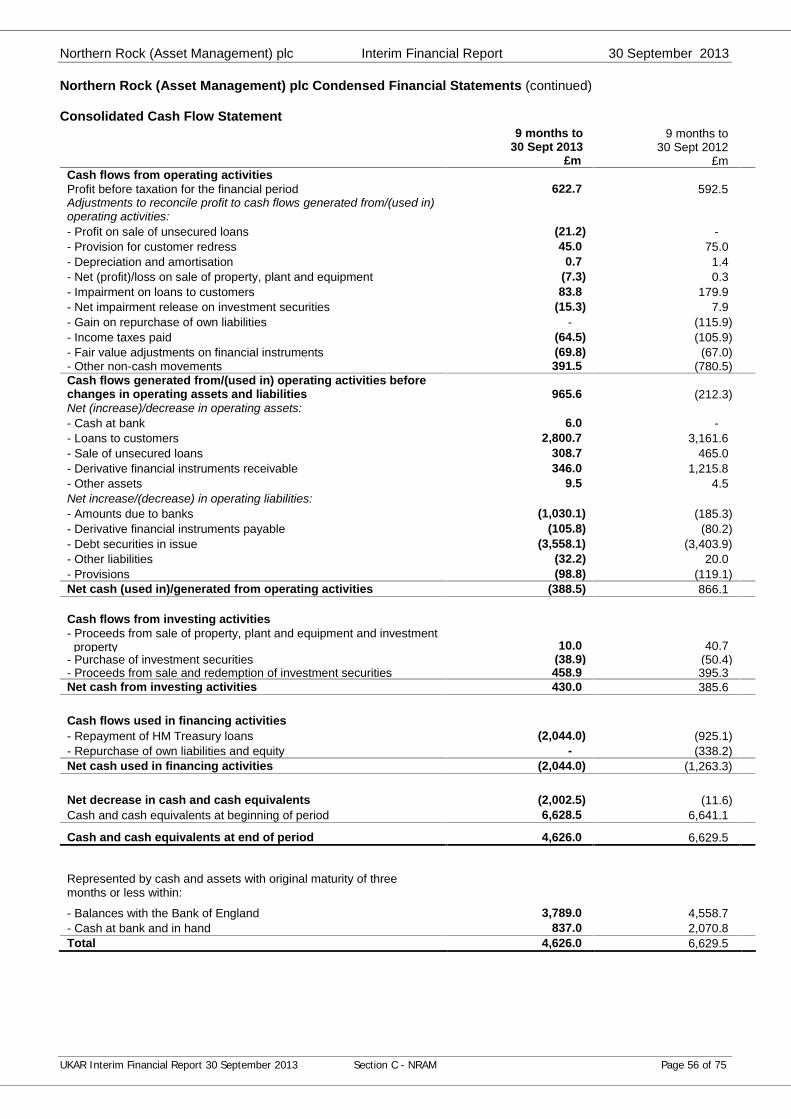
Northern Rock (Asset Management) plc Interim Financial Report 30 September 2013
UKAR Interim Financial Report 30 September 2013 Section C - NRAM Page 56 of 75
Northern Rock (Asset Management) plc Condensed Financial Statements (continued)
Consolidated Cash Flow Statement9 months to
30 Sept 20139 months to
30 Sept 2012£m £m
Cash flows from operating activitiesProfit before taxation for the financial period 622.7 592.5Adjustments to reconcile profit to cash flows generated from/(used in)operating activities:- Profit on sale of unsecured loans (21.2) -- Provision for customer redress 45.0 75.0- Depreciation and amortisation 0.7 1.4- Net (profit)/loss on sale of property, plant and equipment (7.3) 0.3- Impairment on loans to customers 83.8 179.9- Net impairment release on investment securities (15.3) 7.9- Gain on repurchase of own liabilities - (115.9)- Income taxes paid (64.5) (105.9)- Fair value adjustments on financial instruments (69.8) (67.0)- Other non-cash movements 391.5 (780.5)Cash flows generated from/(used in) operating activities beforechanges in operating assets and liabilities 965.6 (212.3)Net (increase)/decrease in operating assets:- Cash at bank 6.0 -- Loans to customers 2,800.7 3,161.6- Sale of unsecured loans 308.7 465.0- Derivative financial instruments receivable 346.0 1,215.8- Other assets 9.5 4.5Net increase/(decrease) in operating liabilities:- Amounts due to banks (1,030.1) (185.3)- Derivative financial instruments payable (105.8) (80.2)- Debt securities in issue (3,558.1) (3,403.9)- Other liabilities (32.2) 20.0- Provisions (98.8) (119.1)Net cash (used in)/generated from operating activities (388.5) 866.1
Cash flows from investing activities- Proceeds from sale of property, plant and equipment and investment
property 10.0 40.7- Purchase of investment securities (38.9) (50.4)- Proceeds from sale and redemption of investment securities 458.9 395.3Net cash from investing activities 430.0 385.6
Cash flows used in financing activities- Repayment of HM Treasury loans (2,044.0) (925.1)- Repurchase of own liabilities and equity - (338.2)Net cash used in financing activities (2,044.0) (1,263.3)
Net decrease in cash and cash equivalents (2,002.5) (11.6)Cash and cash equivalents at beginning of period 6,628.5 6,641.1
Cash and cash equivalents at end of period 4,626.0 6,629.5
Represented by cash and assets with original maturity of threemonths or less within:
- Balances with the Bank of England 3,789.0 4,558.7- Cash at bank and in hand 837.0 2,070.8Total 4,626.0 6,629.5
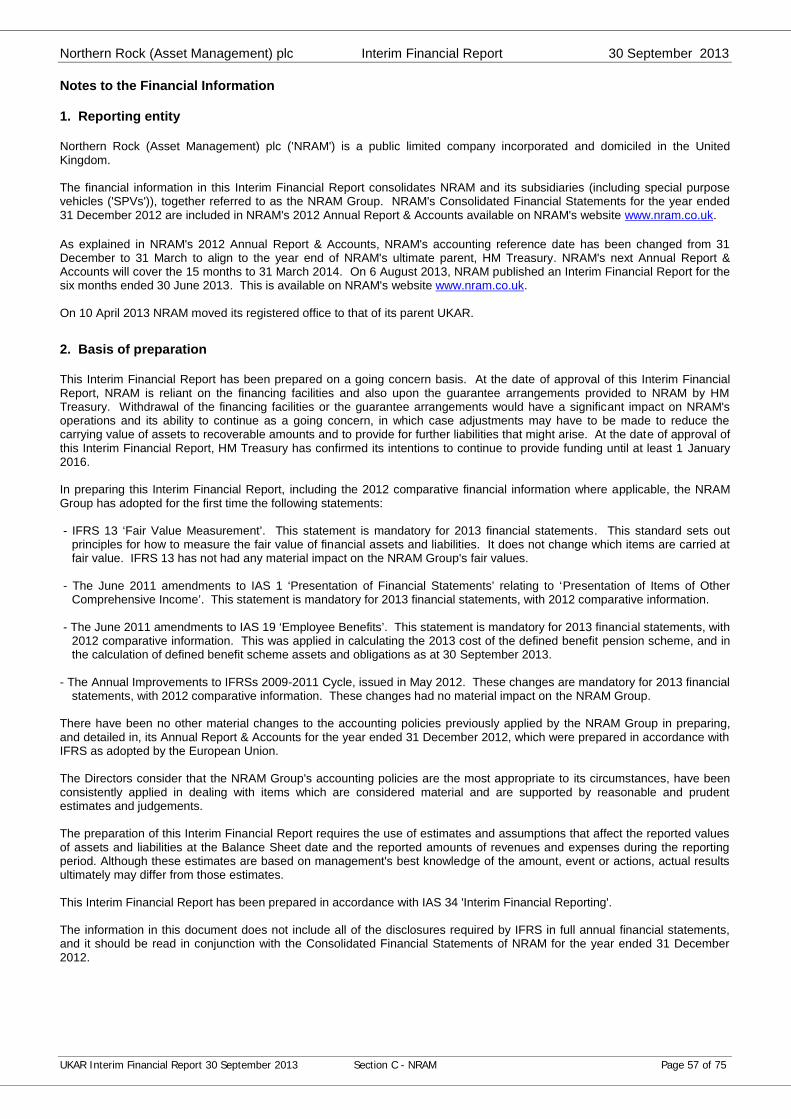
Northern Rock (Asset Management) plc Interim Financial Report 30 September 2013
UKAR Interim Financial Report 30 September 2013 Section C - NRAM Page 57 of 75
Notes to the Financial Information
1. Reporting entity
Northern Rock (Asset Management) plc ('NRAM') is a public limited company incorporated and domiciled in the UnitedKingdom.
The financial information in this Interim Financial Report consolidates NRAM and its subsidiaries (including special purposevehicles ('SPVs')), together referred to as the NRAM Group. NRAM's Consolidated Financial Statements for the year ended31 December 2012 are included in NRAM's 2012 Annual Report & Accounts available on NRAM's website www.nram.co.uk.
As explained in NRAM's 2012 Annual Report & Accounts, NRAM's accounting reference date has been changed from 31December to 31 March to align to the year end of NRAM's ultimate parent, HM Treasury. NRAM's next Annual Report &Accounts will cover the 15 months to 31 March 2014. On 6 August 2013, NRAM published an Interim Financial Report for thesix months ended 30 June 2013. This is available on NRAM's website www.nram.co.uk.
On 10 April 2013 NRAM moved its registered office to that of its parent UKAR.
2. Basis of preparation
This Interim Financial Report has been prepared on a going concern basis. At the date of approval of this Interim FinancialReport, NRAM is reliant on the financing facilities and also upon the guarantee arrangements provided to NRAM by HMTreasury. Withdrawal of the financing facilities or the guarantee arrangements would have a significant impact on NRAM'soperations and its ability to continue as a going concern, in which case adjustments may have to be made to reduce thecarrying value of assets to recoverable amounts and to provide for further liabilities that might arise. At the date of approval ofthis Interim Financial Report, HM Treasury has confirmed its intentions to continue to provide funding until at least 1 January2016.
In preparing this Interim Financial Report, including the 2012 comparative financial information where applicable, the NRAMGroup has adopted for the first time the following statements:
- IFRS 13 ‘Fair Value Measurement’. This statement is mandatory for 2013 financial statements. This standard sets outprinciples for how to measure the fair value of financial assets and liabilities. It does not change which items are carried atfair value. IFRS 13 has not had any material impact on the NRAM Group's fair values.
- The June 2011 amendments to IAS 1 ‘Presentation of Financial Statements’ relating to ‘Presentation of Items of OtherComprehensive Income’. This statement is mandatory for 2013 financial statements, with 2012 comparative information.
- The June 2011 amendments to IAS 19 ‘Employee Benefits’. This statement is mandatory for 2013 financial statements, with2012 comparative information. This was applied in calculating the 2013 cost of the defined benefit pension scheme, and inthe calculation of defined benefit scheme assets and obligations as at 30 September 2013.
- The Annual Improvements to IFRSs 2009-2011 Cycle, issued in May 2012. These changes are mandatory for 2013 financialstatements, with 2012 comparative information. These changes had no material impact on the NRAM Group.
There have been no other material changes to the accounting policies previously applied by the NRAM Group in preparing,and detailed in, its Annual Report & Accounts for the year ended 31 December 2012, which were prepared in accordance withIFRS as adopted by the European Union.
The Directors consider that the NRAM Group's accounting policies are the most appropriate to its circumstances, have beenconsistently applied in dealing with items which are considered material and are supported by reasonable and prudentestimates and judgements.
The preparation of this Interim Financial Report requires the use of estimates and assumptions that affect the reported valuesof assets and liabilities at the Balance Sheet date and the reported amounts of revenues and expenses during the reportingperiod. Although these estimates are based on management's best knowledge of the amount, event or actions, actual resultsultimately may differ from those estimates.
This Interim Financial Report has been prepared in accordance with IAS 34 'Interim Financial Reporting'.
The information in this document does not include all of the disclosures required by IFRS in full annual financial statements,and it should be read in conjunction with the Consolidated Financial Statements of NRAM for the year ended 31 December2012.
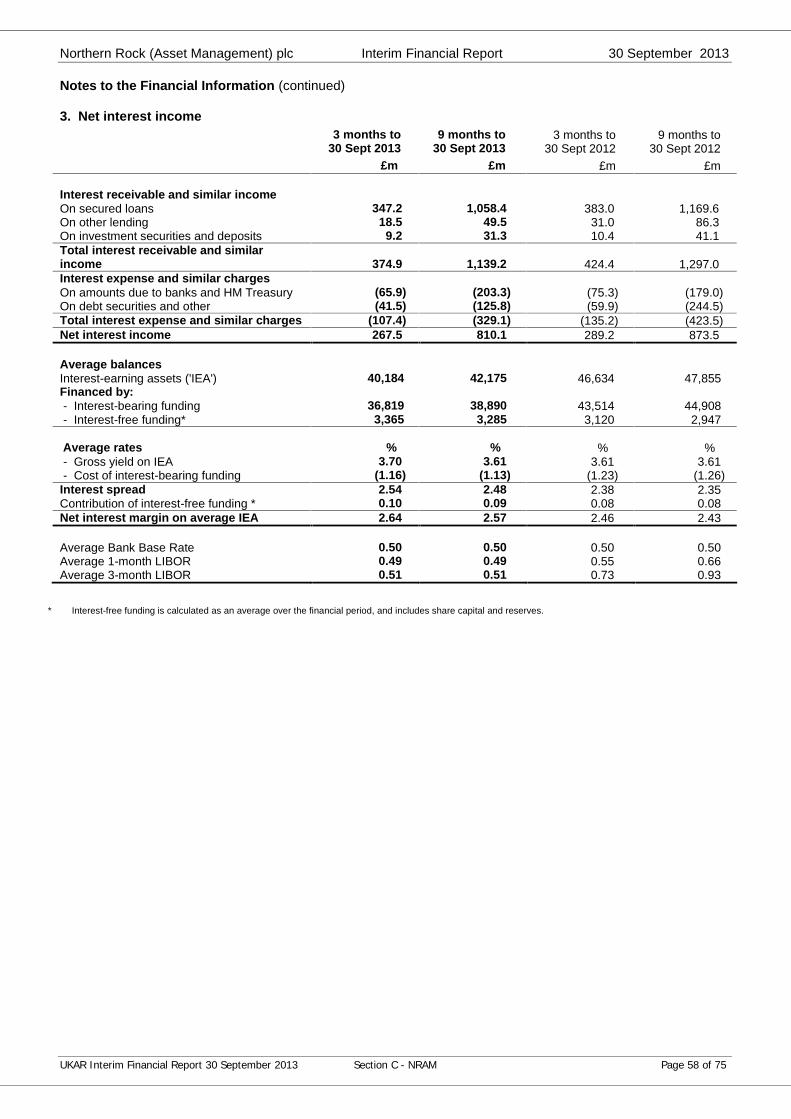
Northern Rock (Asset Management) plc Interim Financial Report 30 September 2013
UKAR Interim Financial Report 30 September 2013 Section C - NRAM Page 58 of 75
Notes to the Financial Information (continued)
3. Net interest income3 months to
30 Sept 20139 months to
30 Sept 20133 months to
30 Sept 20129 months to
30 Sept 2012£m £m £m £m
Interest receivable and similar incomeOn secured loans 347.2 1,058.4 383.0 1,169.6On other lending 18.5 49.5 31.0 86.3On investment securities and deposits 9.2 31.3 10.4 41.1Total interest receivable and similarincome 374.9 1,139.2 424.4 1,297.0Interest expense and similar chargesOn amounts due to banks and HM Treasury (65.9) (203.3) (75.3) (179.0)On debt securities and other (41.5) (125.8) (59.9) (244.5)Total interest expense and similar charges (107.4) (329.1) (135.2) (423.5)Net interest income 267.5 810.1 289.2 873.5
Average balancesInterest-earning assets ('IEA') 40,184 42,175 46,634 47,855Financed by:- Interest-bearing funding 36,819 38,890 43,514 44,908- Interest-free funding* 3,365 3,285 3,120 2,947
Average rates % % % %- Gross yield on IEA 3.70 3.61 3.61 3.61- Cost of interest-bearing funding (1.16) (1.13) (1.23) (1.26)
Interest spread 2.54 2.48 2.38 2.35Contribution of interest-free funding * 0.10 0.09 0.08 0.08Net interest margin on average IEA 2.64 2.57 2.46 2.43
Average Bank Base Rate 0.50 0.50 0.50 0.50Average 1-month LIBOR 0.49 0.49 0.55 0.66Average 3-month LIBOR 0.51 0.51 0.73 0.93
* Interest-free funding is calculated as an average over the financial period, and includes share capital and reserves.
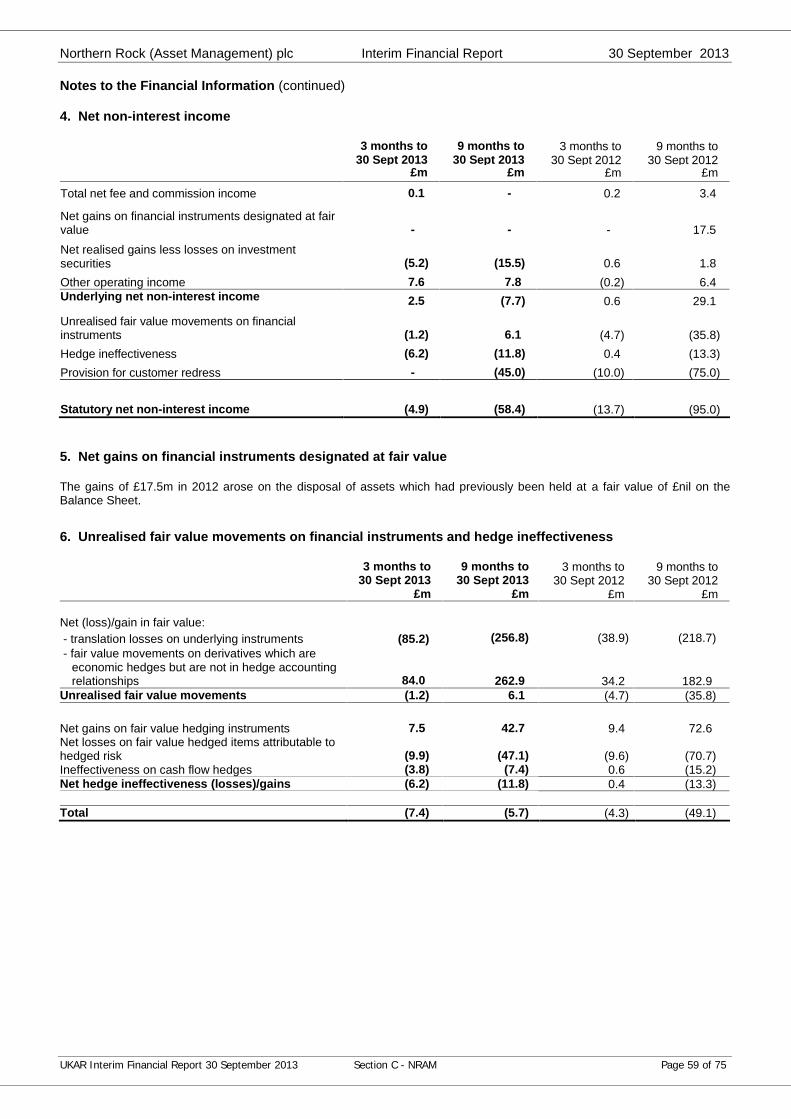
Northern Rock (Asset Management) plc Interim Financial Report 30 September 2013
UKAR Interim Financial Report 30 September 2013 Section C - NRAM Page 59 of 75
Notes to the Financial Information (continued)
4. Net non-interest income
3 months to30 Sept 2013
9 months to30 Sept 2013
3 months to30 Sept 2012
9 months to30 Sept 2012
£m £m £m £m
Total net fee and commission income 0.1 - 0.2 3.4
Net gains on financial instruments designated at fairvalue - - - 17.5Net realised gains less losses on investmentsecurities (5.2) (15.5) 0.6 1.8Other operating income 7.6 7.8 (0.2) 6.4Underlying net non-interest income 2.5 (7.7) 0.6 29.1
Unrealised fair value movements on financialinstruments (1.2) 6.1 (4.7) (35.8)Hedge ineffectiveness (6.2) (11.8) 0.4 (13.3)Provision for customer redress - (45.0) (10.0) (75.0)
Statutory net non-interest income (4.9) (58.4) (13.7) (95.0)
5. Net gains on financial instruments designated at fair value
The gains of £17.5m in 2012 arose on the disposal of assets which had previously been held at a fair value of £nil on theBalance Sheet.
6. Unrealised fair value movements on financial instruments and hedge ineffectiveness
3 months to 30 Sept 2013
9 months to 30 Sept 2013
3 months to 30 Sept 2012
9 months to30 Sept 2012
£m £m £m £m
Net (loss)/gain in fair value:- translation losses on underlying instruments (85.2) (256.8) (38.9) (218.7)- fair value movements on derivatives which are
economic hedges but are not in hedge accountingrelationships 84.0 262.9 34.2 182.9
Unrealised fair value movements (1.2) 6.1 (4.7) (35.8)
Net gains on fair value hedging instruments 7.5 42.7 9.4 72.6Net losses on fair value hedged items attributable tohedged risk (9.9) (47.1) (9.6) (70.7)Ineffectiveness on cash flow hedges (3.8) (7.4) 0.6 (15.2)Net hedge ineffectiveness (losses)/gains (6.2) (11.8) 0.4 (13.3)
Total (7.4) (5.7) (4.3) (49.1)
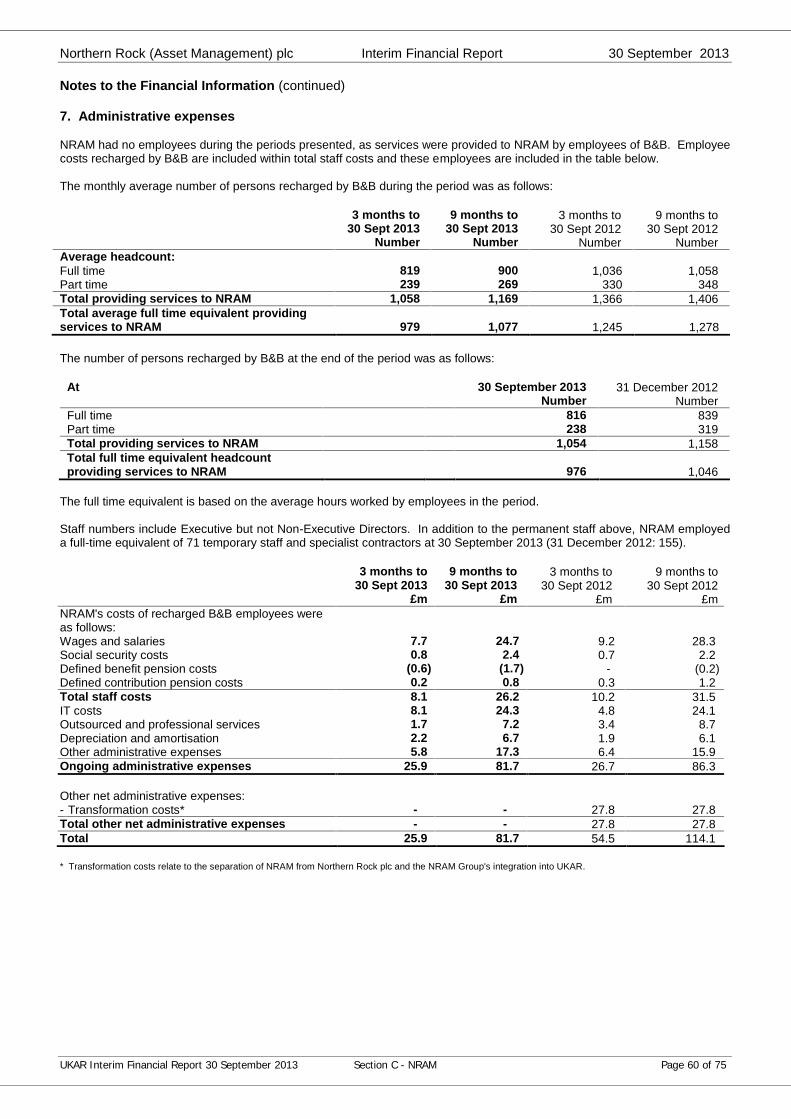
Northern Rock (Asset Management) plc Interim Financial Report 30 September 2013
UKAR Interim Financial Report 30 September 2013 Section C - NRAM Page 60 of 75
Notes to the Financial Information (continued)
7. Administrative expenses
NRAM had no employees during the periods presented, as services were provided to NRAM by employees of B&B. Employeecosts recharged by B&B are included within total staff costs and these employees are included in the table below.
The monthly average number of persons recharged by B&B during the period was as follows:
3 months to30 Sept 2013
Number
9 months to 30 Sept 2013
Number
3 months to 30 Sept 2012
Number
9 months to 30 Sept 2012
NumberAverage headcount:Full time 819 900 1,036 1,058Part time 239 269 330 348Total providing services to NRAM 1,058 1,169 1,366 1,406Total average full time equivalent providingservices to NRAM 979 1,077 1,245 1,278
The number of persons recharged by B&B at the end of the period was as follows:
At 30 September 2013Number
31 December 2012Number
Full time 816 839Part time 238 319Total providing services to NRAM 1,054 1,158Total full time equivalent headcountproviding services to NRAM 976 1,046
The full time equivalent is based on the average hours worked by employees in the period.
Staff numbers include Executive but not Non-Executive Directors. In addition to the permanent staff above, NRAM employeda full-time equivalent of 71 temporary staff and specialist contractors at 30 September 2013 (31 December 2012: 155).
3 months to 30 Sept 2013
9 months to 30 Sept 2013
3 months to 30 Sept 2012
9 months to30 Sept 2012
£m £m £m £mNRAM's costs of recharged B&B employees wereas follows:Wages and salaries 7.7 24.7 9.2 28.3Social security costs 0.8 2.4 0.7 2.2Defined benefit pension costs (0.6) (1.7) - (0.2)Defined contribution pension costs 0.2 0.8 0.3 1.2Total staff costs 8.1 26.2 10.2 31.5IT costs 8.1 24.3 4.8 24.1Outsourced and professional services 1.7 7.2 3.4 8.7Depreciation and amortisation 2.2 6.7 1.9 6.1Other administrative expenses 5.8 17.3 6.4 15.9Ongoing administrative expenses 25.9 81.7 26.7 86.3
Other net administrative expenses:- Transformation costs* - - 27.8 27.8Total other net administrative expenses - - 27.8 27.8Total 25.9 81.7 54.5 114.1
* Transformation costs relate to the separation of NRAM from Northern Rock plc and the NRAM Group's integration into UKAR.
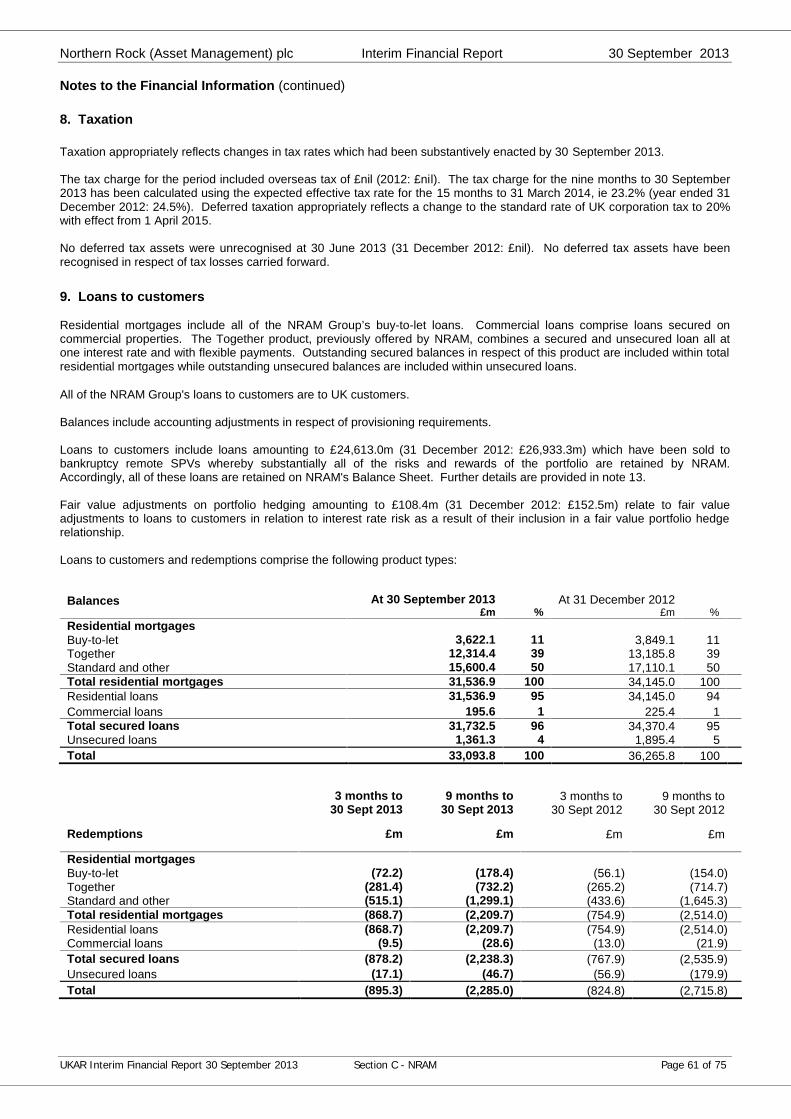
Northern Rock (Asset Management) plc Interim Financial Report 30 September 2013
UKAR Interim Financial Report 30 September 2013 Section C - NRAM Page 61 of 75
Notes to the Financial Information (continued)
8. Taxation
Taxation appropriately reflects changes in tax rates which had been substantively enacted by 30 September 2013.
The tax charge for the period included overseas tax of £nil (2012: £nil). The tax charge for the nine months to 30 September2013 has been calculated using the expected effective tax rate for the 15 months to 31 March 2014, ie 23.2% (year ended 31December 2012: 24.5%). Deferred taxation appropriately reflects a change to the standard rate of UK corporation tax to 20%with effect from 1 April 2015.
No deferred tax assets were unrecognised at 30 June 2013 (31 December 2012: £nil). No deferred tax assets have beenrecognised in respect of tax losses carried forward.
9. Loans to customers
Residential mortgages include all of the NRAM Group’s buy-to-let loans. Commercial loans comprise loans secured oncommercial properties. The Together product, previously offered by NRAM, combines a secured and unsecured loan all atone interest rate and with flexible payments. Outstanding secured balances in respect of this product are included within totalresidential mortgages while outstanding unsecured balances are included within unsecured loans.
All of the NRAM Group's loans to customers are to UK customers.
Balances include accounting adjustments in respect of provisioning requirements.
Loans to customers include loans amounting to £24,613.0m (31 December 2012: £26,933.3m) which have been sold tobankruptcy remote SPVs whereby substantially all of the risks and rewards of the portfolio are retained by NRAM.Accordingly, all of these loans are retained on NRAM's Balance Sheet. Further details are provided in note 13.
Fair value adjustments on portfolio hedging amounting to £108.4m (31 December 2012: £152.5m) relate to fair valueadjustments to loans to customers in relation to interest rate risk as a result of their inclusion in a fair value portfolio hedgerelationship.
Loans to customers and redemptions comprise the following product types:
Balances At 30 September 2013£m %
At 31 December 2012£m %
Residential mortgagesBuy-to-let 3,622.1 11 3,849.1 11Together 12,314.4 39 13,185.8 39Standard and other 15,600.4 50 17,110.1 50Total residential mortgages 31,536.9 100 34,145.0 100Residential loans 31,536.9 95 34,145.0 94Commercial loans 195.6 1 225.4 1Total secured loans 31,732.5 96 34,370.4 95Unsecured loans 1,361.3 4 1,895.4 5Total 33,093.8 100 36,265.8 100
3 months to 30 Sept 2013
9 months to 30 Sept 2013
3 months to 30 Sept 2012
9 months to 30 Sept 2012
Redemptions £m £m £m £m
Residential mortgagesBuy-to-let (72.2) (178.4) (56.1) (154.0)Together (281.4) (732.2) (265.2) (714.7)Standard and other (515.1) (1,299.1) (433.6) (1,645.3)Total residential mortgages (868.7) (2,209.7) (754.9) (2,514.0)Residential loans (868.7) (2,209.7) (754.9) (2,514.0)Commercial loans (9.5) (28.6) (13.0) (21.9)Total secured loans (878.2) (2,238.3) (767.9) (2,535.9)Unsecured loans (17.1) (46.7) (56.9) (179.9)Total (895.3) (2,285.0) (824.8) (2,715.8)
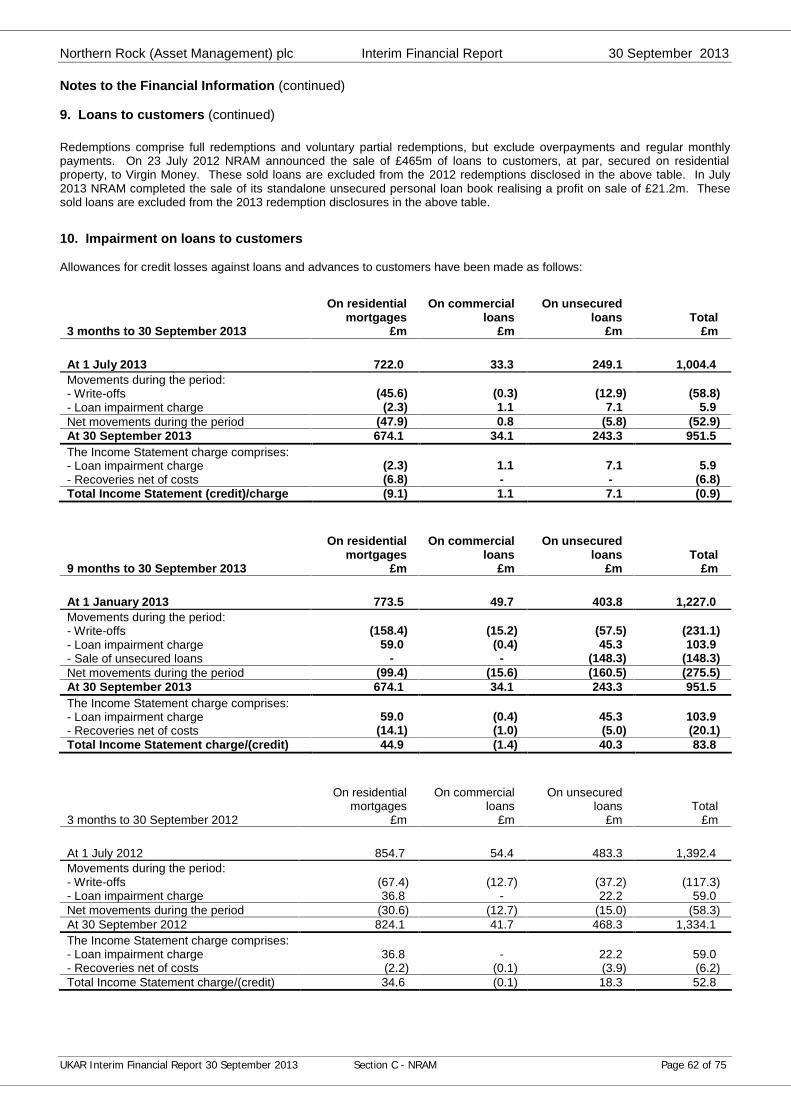
Northern Rock (Asset Management) plc Interim Financial Report 30 September 2013
UKAR Interim Financial Report 30 September 2013 Section C - NRAM Page 62 of 75
Notes to the Financial Information (continued)
9. Loans to customers (continued)
Redemptions comprise full redemptions and voluntary partial redemptions, but exclude overpayments and regular monthlypayments. On 23 July 2012 NRAM announced the sale of £465m of loans to customers, at par, secured on residentialproperty, to Virgin Money. These sold loans are excluded from the 2012 redemptions disclosed in the above table. In July2013 NRAM completed the sale of its standalone unsecured personal loan book realising a profit on sale of £21.2m. Thesesold loans are excluded from the 2013 redemption disclosures in the above table.
10. Impairment on loans to customers
Allowances for credit losses against loans and advances to customers have been made as follows:
3 months to 30 September 2013
On residential mortgages
£m
On commercialloans
£m
On unsecured loans
£mTotal
£m
At 1 July 2013 722.0 33.3 249.1 1,004.4Movements during the period:- Write-offs (45.6) (0.3) (12.9) (58.8)- Loan impairment charge (2.3) 1.1 7.1 5.9Net movements during the period (47.9) 0.8 (5.8) (52.9)At 30 September 2013 674.1 34.1 243.3 951.5The Income Statement charge comprises:- Loan impairment charge (2.3) 1.1 7.1 5.9- Recoveries net of costs (6.8) - - (6.8)Total Income Statement (credit)/charge (9.1) 1.1 7.1 (0.9)
9 months to 30 September 2013
On residential mortgages
£m
On commercialloans
£m
On unsecured loans
£mTotal
£m
At 1 January 2013 773.5 49.7 403.8 1,227.0Movements during the period:- Write-offs (158.4) (15.2) (57.5) (231.1)- Loan impairment charge 59.0 (0.4) 45.3 103.9- Sale of unsecured loans - - (148.3) (148.3)Net movements during the period (99.4) (15.6) (160.5) (275.5)At 30 September 2013 674.1 34.1 243.3 951.5The Income Statement charge comprises:- Loan impairment charge 59.0 (0.4) 45.3 103.9- Recoveries net of costs (14.1) (1.0) (5.0) (20.1)Total Income Statement charge/(credit) 44.9 (1.4) 40.3 83.8
3 months to 30 September 2012
On residential mortgages
£m
On commercialloans
£m
On unsecured loans
£mTotal
£m
At 1 July 2012 854.7 54.4 483.3 1,392.4Movements during the period:- Write-offs (67.4) (12.7) (37.2) (117.3)- Loan impairment charge 36.8 - 22.2 59.0Net movements during the period (30.6) (12.7) (15.0) (58.3)At 30 September 2012 824.1 41.7 468.3 1,334.1The Income Statement charge comprises:- Loan impairment charge 36.8 - 22.2 59.0- Recoveries net of costs (2.2) (0.1) (3.9) (6.2)Total Income Statement charge/(credit) 34.6 (0.1) 18.3 52.8
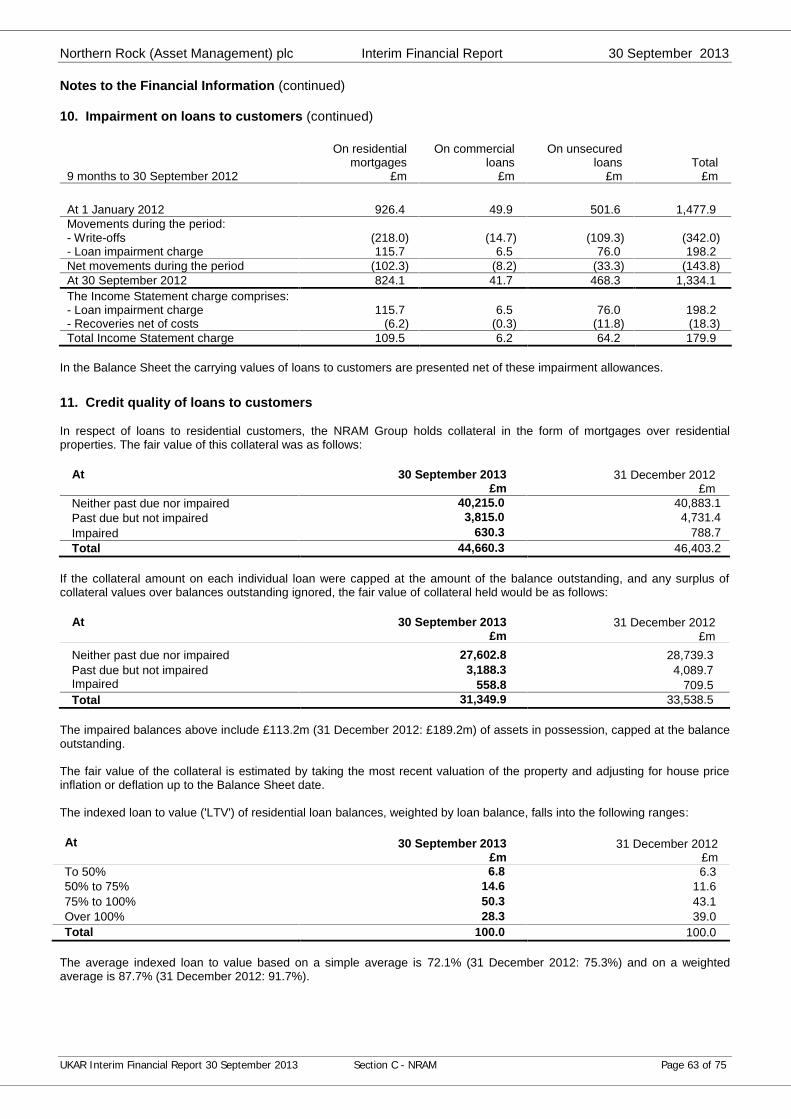
Northern Rock (Asset Management) plc Interim Financial Report 30 September 2013
UKAR Interim Financial Report 30 September 2013 Section C - NRAM Page 63 of 75
Notes to the Financial Information (continued)
10. Impairment on loans to customers (continued)
9 months to 30 September 2012
On residential mortgages
£m
On commercialloans
£m
On unsecured loans
£mTotal
£m
At 1 January 2012 926.4 49.9 501.6 1,477.9Movements during the period:- Write-offs (218.0) (14.7) (109.3) (342.0)- Loan impairment charge 115.7 6.5 76.0 198.2Net movements during the period (102.3) (8.2) (33.3) (143.8)At 30 September 2012 824.1 41.7 468.3 1,334.1The Income Statement charge comprises:- Loan impairment charge 115.7 6.5 76.0 198.2- Recoveries net of costs (6.2) (0.3) (11.8) (18.3)Total Income Statement charge 109.5 6.2 64.2 179.9
In the Balance Sheet the carrying values of loans to customers are presented net of these impairment allowances.
11. Credit quality of loans to customers
In respect of loans to residential customers, the NRAM Group holds collateral in the form of mortgages over residentialproperties. The fair value of this collateral was as follows:
At 30 September 2013 £m
31 December 2012£m
Neither past due nor impaired 40,215.0 40,883.1Past due but not impaired 3,815.0 4,731.4Impaired 630.3 788.7Total 44,660.3 46,403.2
If the collateral amount on each individual loan were capped at the amount of the balance outstanding, and any surplus ofcollateral values over balances outstanding ignored, the fair value of collateral held would be as follows:
At 30 September 2013 £m
31 December 2012£m
Neither past due nor impaired 27,602.8 28,739.3Past due but not impaired 3,188.3 4,089.7Impaired 558.8 709.5Total 31,349.9 33,538.5
The impaired balances above include £113.2m (31 December 2012: £189.2m) of assets in possession, capped at the balanceoutstanding.
The fair value of the collateral is estimated by taking the most recent valuation of the property and adjusting for house priceinflation or deflation up to the Balance Sheet date.
The indexed loan to value ('LTV') of residential loan balances, weighted by loan balance, falls into the following ranges:
The average indexed loan to value based on a simple average is 72.1% (31 December 2012: 75.3%) and on a weightedaverage is 87.7% (31 December 2012: 91.7%).
At 30 September 2013 £m
31 December 2012£m
To 50% 6.8 6.350% to 75% 14.6 11.675% to 100% 50.3 43.1Over 100% 28.3 39.0Total 100.0 100.0
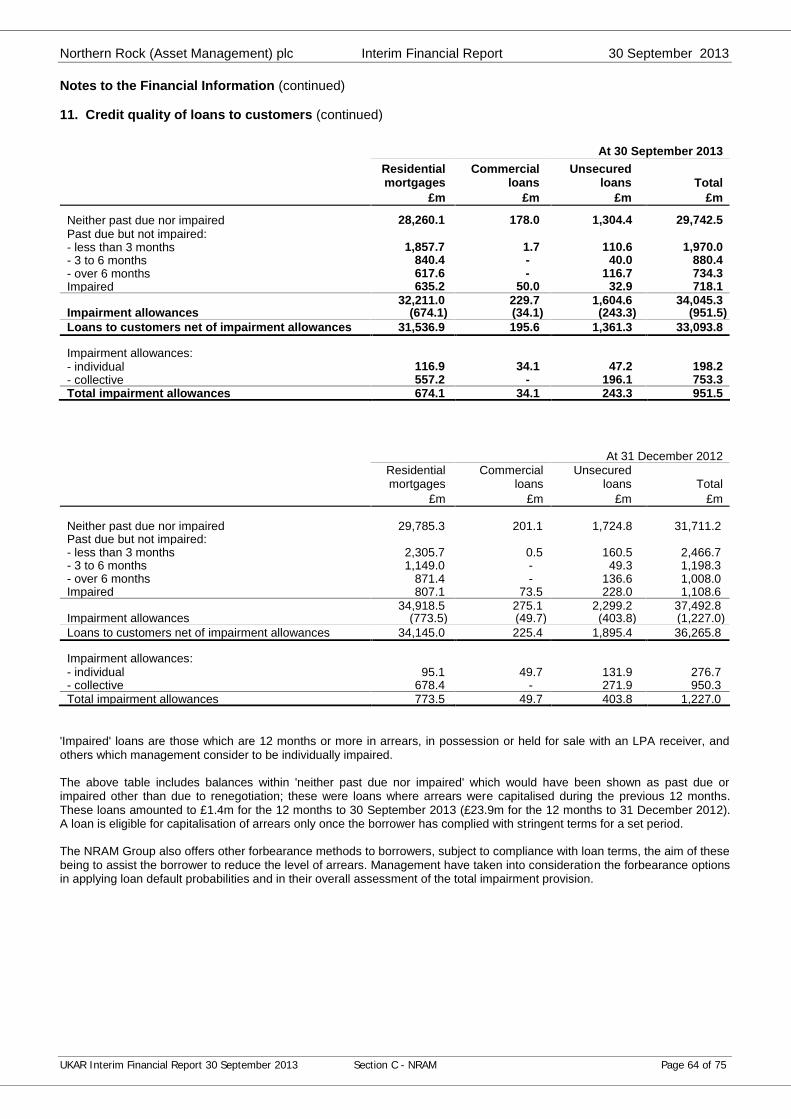
Northern Rock (Asset Management) plc Interim Financial Report 30 September 2013
UKAR Interim Financial Report 30 September 2013 Section C - NRAM Page 64 of 75
Notes to the Financial Information (continued)
11. Credit quality of loans to customers (continued)
At 30 September 2013 Residentialmortgages
Commercialloans
Unsecuredloans Total
£m £m £m £m
Neither past due nor impaired 28,260.1 178.0 1,304.4 29,742.5Past due but not impaired:- less than 3 months 1,857.7 1.7 110.6 1,970.0- 3 to 6 months 840.4 - 40.0 880.4- over 6 months 617.6 - 116.7 734.3Impaired 635.2 50.0 32.9 718.1
32,211.0 229.7 1,604.6 34,045.3Impairment allowances (674.1) (34.1) (243.3) (951.5)Loans to customers net of impairment allowances 31,536.9 195.6 1,361.3 33,093.8
Impairment allowances:- individual 116.9 34.1 47.2 198.2- collective 557.2 - 196.1 753.3Total impairment allowances 674.1 34.1 243.3 951.5
At 31 December 2012 Residentialmortgages
Commercialloans
Unsecuredloans Total
£m £m £m £m
Neither past due nor impaired 29,785.3 201.1 1,724.8 31,711.2Past due but not impaired:- less than 3 months 2,305.7 0.5 160.5 2,466.7- 3 to 6 months 1,149.0 - 49.3 1,198.3- over 6 months 871.4 - 136.6 1,008.0Impaired 807.1 73.5 228.0 1,108.6
34,918.5 275.1 2,299.2 37,492.8Impairment allowances (773.5) (49.7) (403.8) (1,227.0)Loans to customers net of impairment allowances 34,145.0 225.4 1,895.4 36,265.8
Impairment allowances:- individual 95.1 49.7 131.9 276.7- collective 678.4 - 271.9 950.3Total impairment allowances 773.5 49.7 403.8 1,227.0
'Impaired' loans are those which are 12 months or more in arrears, in possession or held for sale with an LPA receiver, andothers which management consider to be individually impaired.
The above table includes balances within 'neither past due nor impaired' which would have been shown as past due orimpaired other than due to renegotiation; these were loans where arrears were capitalised during the previous 12 months.These loans amounted to £1.4m for the 12 months to 30 September 2013 (£23.9m for the 12 months to 31 December 2012).A loan is eligible for capitalisation of arrears only once the borrower has complied with stringent terms for a set period.
The NRAM Group also offers other forbearance methods to borrowers, subject to compliance with loan terms, the aim of thesebeing to assist the borrower to reduce the level of arrears. Management have taken into consideration the forbearance optionsin applying loan default probabilities and in their overall assessment of the total impairment provision.
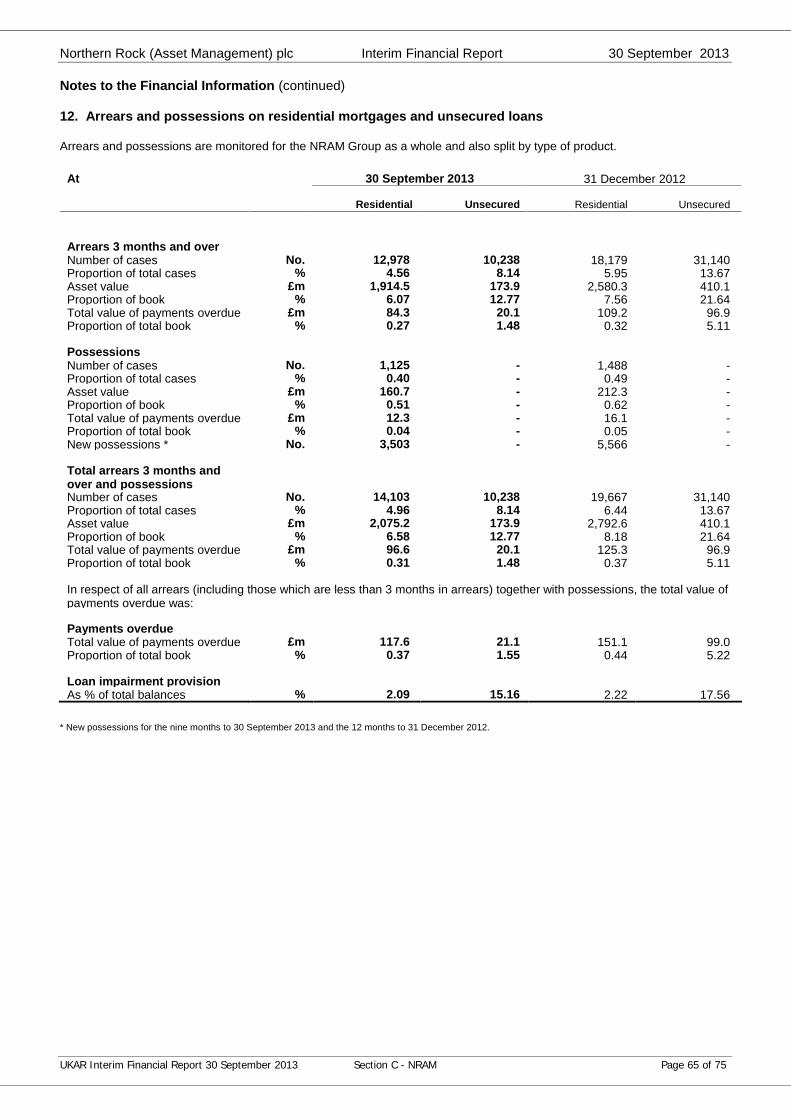
Northern Rock (Asset Management) plc Interim Financial Report 30 September 2013
UKAR Interim Financial Report 30 September 2013 Section C - NRAM Page 65 of 75
Notes to the Financial Information (continued)
12. Arrears and possessions on residential mortgages and unsecured loans
Arrears and possessions are monitored for the NRAM Group as a whole and also split by type of product.
At 30 September 2013 31 December 2012
Residential Unsecured Residential Unsecured
Arrears 3 months and overNumber of cases No. 12,978 10,238 18,179 31,140Proportion of total cases % 4.56 8.14 5.95 13.67Asset value £m 1,914.5 173.9 2,580.3 410.1Proportion of book % 6.07 12.77 7.56 21.64Total value of payments overdue £m 84.3 20.1 109.2 96.9Proportion of total book % 0.27 1.48 0.32 5.11
PossessionsNumber of cases No. 1,125 - 1,488 -Proportion of total cases % 0.40 - 0.49 -Asset value £m 160.7 - 212.3 -Proportion of book % 0.51 - 0.62 -Total value of payments overdue £m 12.3 - 16.1 -Proportion of total book % 0.04 - 0.05 -New possessions * No. 3,503 - 5,566 -
Total arrears 3 months andover and possessionsNumber of cases No. 14,103 10,238 19,667 31,140Proportion of total cases % 4.96 8.14 6.44 13.67Asset value £m 2,075.2 173.9 2,792.6 410.1Proportion of book % 6.58 12.77 8.18 21.64Total value of payments overdue £m 96.6 20.1 125.3 96.9Proportion of total book % 0.31 1.48 0.37 5.11
In respect of all arrears (including those which are less than 3 months in arrears) together with possessions, the total value ofpayments overdue was:
Payments overdueTotal value of payments overdue £m 117.6 21.1 151.1 99.0Proportion of total book % 0.37 1.55 0.44 5.22
Loan impairment provisionAs % of total balances % 2.09 15.16 2.22 17.56
* New possessions for the nine months to 30 September 2013 and the 12 months to 31 December 2012.
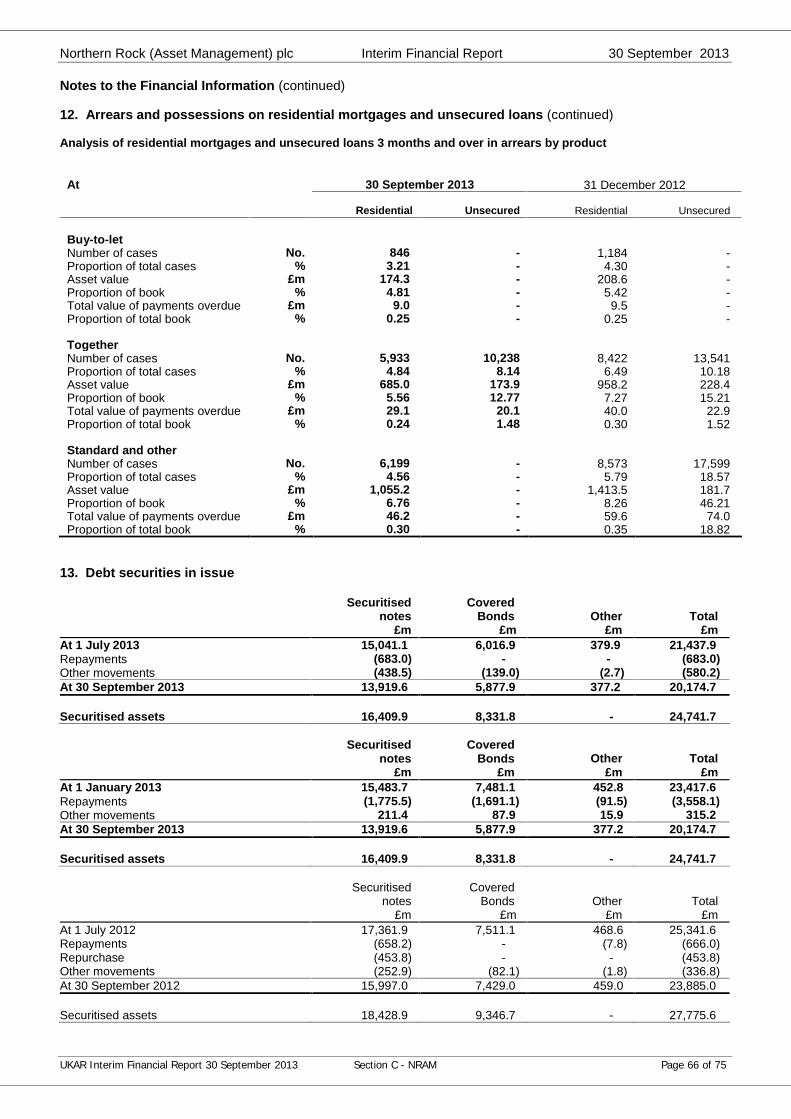
Northern Rock (Asset Management) plc Interim Financial Report 30 September 2013
UKAR Interim Financial Report 30 September 2013 Section C - NRAM Page 66 of 75
Notes to the Financial Information (continued)
12. Arrears and possessions on residential mortgages and unsecured loans (continued)
Analysis of residential mortgages and unsecured loans 3 months and over in arrears by product
At 30 September 2013 31 December 2012
Residential Unsecured Residential Unsecured
Buy-to-letNumber of cases No. 846 - 1,184 -Proportion of total cases % 3.21 - 4.30 -Asset value £m 174.3 - 208.6 -Proportion of book % 4.81 - 5.42 -Total value of payments overdue £m 9.0 - 9.5 -Proportion of total book % 0.25 - 0.25 -
TogetherNumber of cases No. 5,933 10,238 8,422 13,541Proportion of total cases % 4.84 8.14 6.49 10.18Asset value £m 685.0 173.9 958.2 228.4Proportion of book % 5.56 12.77 7.27 15.21Total value of payments overdue £m 29.1 20.1 40.0 22.9Proportion of total book % 0.24 1.48 0.30 1.52
Standard and otherNumber of cases No. 6,199 - 8,573 17,599Proportion of total cases % 4.56 - 5.79 18.57Asset value £m 1,055.2 - 1,413.5 181.7Proportion of book % 6.76 - 8.26 46.21Total value of payments overdue £m 46.2 - 59.6 74.0Proportion of total book % 0.30 - 0.35 18.82
13. Debt securities in issue
Securitised notes
CoveredBonds Other Total
£m £m £m £mAt 1 July 2013 15,041.1 6,016.9 379.9 21,437.9Repayments (683.0) - - (683.0)Other movements (438.5) (139.0) (2.7) (580.2)At 30 September 2013 13,919.6 5,877.9 377.2 20,174.7
Securitised assets 16,409.9 8,331.8 - 24,741.7
Securitised notes
CoveredBonds Other Total
£m £m £m £mAt 1 January 2013 15,483.7 7,481.1 452.8 23,417.6Repayments (1,775.5) (1,691.1) (91.5) (3,558.1)Other movements 211.4 87.9 15.9 315.2At 30 September 2013 13,919.6 5,877.9 377.2 20,174.7
Securitised assets 16,409.9 8,331.8 - 24,741.7
Securitised notes
Covered Bonds Other Total
£m £m £m £mAt 1 July 2012 17,361.9 7,511.1 468.6 25,341.6Repayments (658.2) - (7.8) (666.0)Repurchase (453.8) - - (453.8)Other movements (252.9) (82.1) (1.8) (336.8)At 30 September 2012 15,997.0 7,429.0 459.0 23,885.0
Securitised assets 18,428.9 9,346.7 - 27,775.6
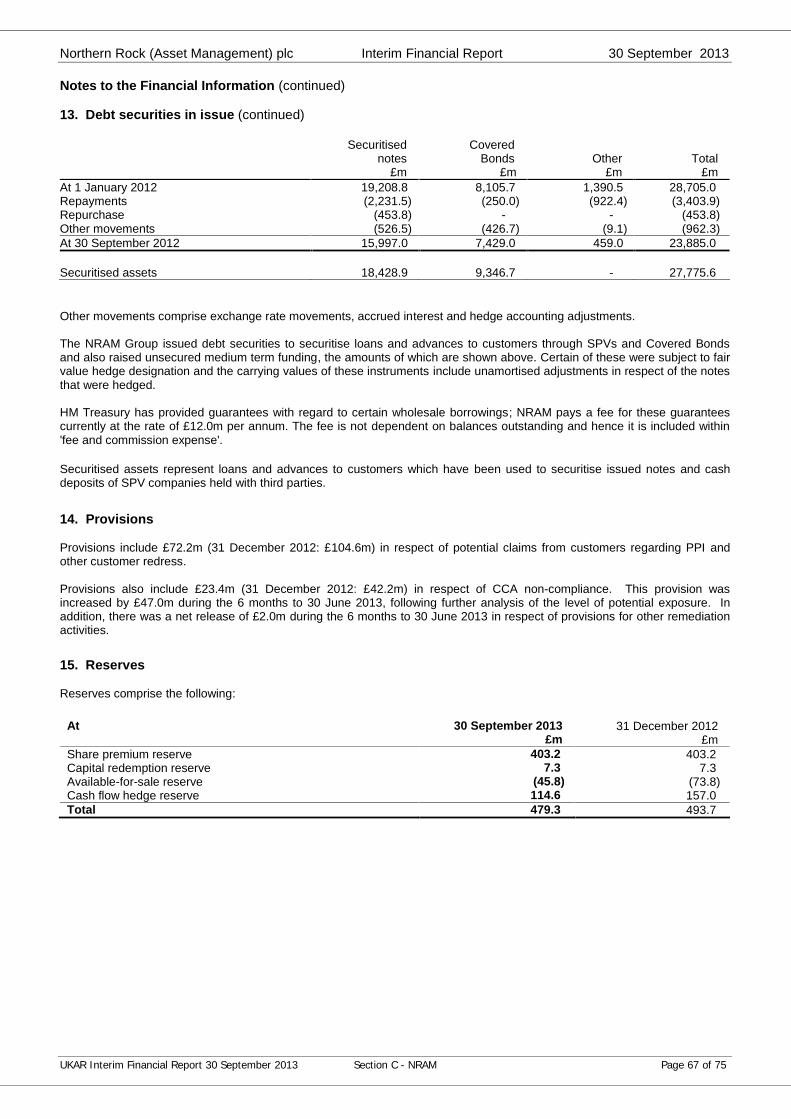
Northern Rock (Asset Management) plc Interim Financial Report 30 September 2013
UKAR Interim Financial Report 30 September 2013 Section C - NRAM Page 67 of 75
Notes to the Financial Information (continued)
13. Debt securities in issue (continued)
Securitised notes
CoveredBonds Other Total
£m £m £m £mAt 1 January 2012 19,208.8 8,105.7 1,390.5 28,705.0Repayments (2,231.5) (250.0) (922.4) (3,403.9)Repurchase (453.8) - - (453.8)Other movements (526.5) (426.7) (9.1) (962.3)At 30 September 2012 15,997.0 7,429.0 459.0 23,885.0
Securitised assets 18,428.9 9,346.7 - 27,775.6
Other movements comprise exchange rate movements, accrued interest and hedge accounting adjustments.
The NRAM Group issued debt securities to securitise loans and advances to customers through SPVs and Covered Bondsand also raised unsecured medium term funding, the amounts of which are shown above. Certain of these were subject to fairvalue hedge designation and the carrying values of these instruments include unamortised adjustments in respect of the notesthat were hedged.
HM Treasury has provided guarantees with regard to certain wholesale borrowings; NRAM pays a fee for these guaranteescurrently at the rate of £12.0m per annum. The fee is not dependent on balances outstanding and hence it is included within'fee and commission expense'.
Securitised assets represent loans and advances to customers which have been used to securitise issued notes and cashdeposits of SPV companies held with third parties.
14. Provisions
Provisions include £72.2m (31 December 2012: £104.6m) in respect of potential claims from customers regarding PPI andother customer redress.
Provisions also include £23.4m (31 December 2012: £42.2m) in respect of CCA non-compliance. This provision wasincreased by £47.0m during the 6 months to 30 June 2013, following further analysis of the level of potential exposure. Inaddition, there was a net release of £2.0m during the 6 months to 30 June 2013 in respect of provisions for other remediationactivities.
15. Reserves
Reserves comprise the following:
At 30 September 2013 31 December 2012£m £m
Share premium reserve 403.2 403.2Capital redemption reserve 7.3 7.3Available-for-sale reserve (45.8) (73.8)Cash flow hedge reserve 114.6 157.0Total 479.3 493.7
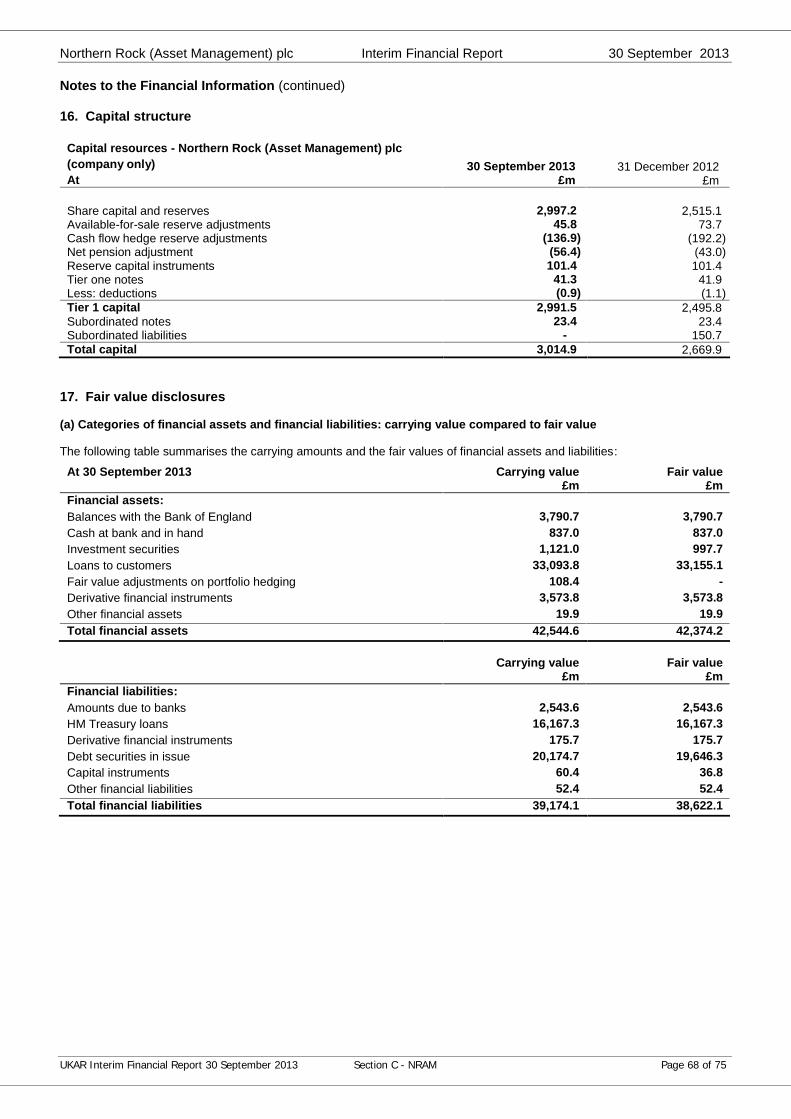
Northern Rock (Asset Management) plc Interim Financial Report 30 September 2013
UKAR Interim Financial Report 30 September 2013 Section C - NRAM Page 68 of 75
Notes to the Financial Information (continued)
16. Capital structure
Capital resources - Northern Rock (Asset Management) plc(company only)At
30 September 2013£m
31 December 2012£m
Share capital and reserves 2,997.2 2,515.1Available-for-sale reserve adjustments 45.8 73.7Cash flow hedge reserve adjustments (136.9) (192.2)Net pension adjustment (56.4) (43.0)Reserve capital instruments 101.4 101.4Tier one notes 41.3 41.9Less: deductions (0.9) (1.1)Tier 1 capital 2,991.5 2,495.8Subordinated notes 23.4 23.4Subordinated liabilities - 150.7Total capital 3,014.9 2,669.9
17. Fair value disclosures
(a) Categories of financial assets and financial liabilities: carrying value compared to fair value
The following table summarises the carrying amounts and the fair values of financial assets and liabilities:
At 30 September 2013 Carrying value£m
Fair value£m
Financial assets:Balances with the Bank of England 3,790.7 3,790.7Cash at bank and in hand 837.0 837.0Investment securities 1,121.0 997.7Loans to customers 33,093.8 33,155.1Fair value adjustments on portfolio hedging 108.4 -Derivative financial instruments 3,573.8 3,573.8Other financial assets 19.9 19.9Total financial assets 42,544.6 42,374.2
Carrying value£m
Fair value£m
Financial liabilities:Amounts due to banks 2,543.6 2,543.6HM Treasury loans 16,167.3 16,167.3Derivative financial instruments 175.7 175.7Debt securities in issue 20,174.7 19,646.3Capital instruments 60.4 36.8Other financial liabilities 52.4 52.4Total financial liabilities 39,174.1 38,622.1
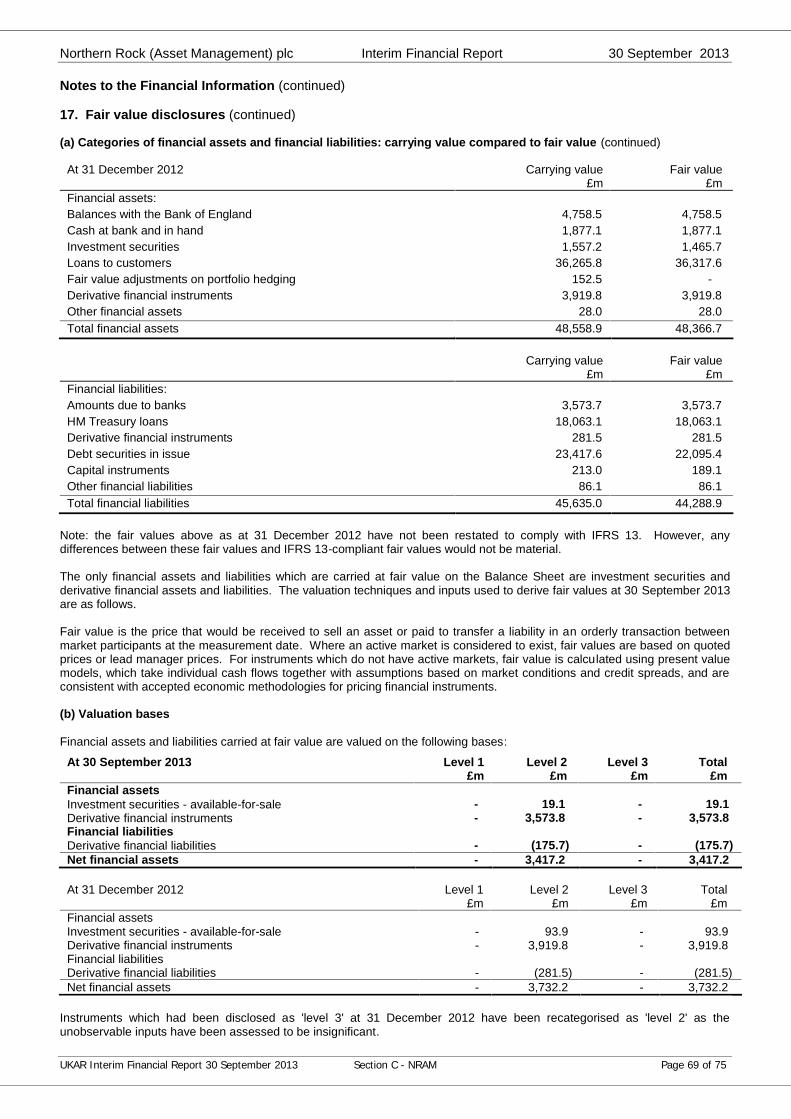
Northern Rock (Asset Management) plc Interim Financial Report 30 September 2013
UKAR Interim Financial Report 30 September 2013 Section C - NRAM Page 69 of 75
Notes to the Financial Information (continued)
17. Fair value disclosures (continued)
(a) Categories of financial assets and financial liabilities: carrying value compared to fair value (continued)
At 31 December 2012 Carrying value£m
Fair value£m
Financial assets:Balances with the Bank of England 4,758.5 4,758.5Cash at bank and in hand 1,877.1 1,877.1Investment securities 1,557.2 1,465.7Loans to customers 36,265.8 36,317.6Fair value adjustments on portfolio hedging 152.5 -Derivative financial instruments 3,919.8 3,919.8Other financial assets 28.0 28.0Total financial assets 48,558.9 48,366.7
Carrying value£m
Fair value£m
Financial liabilities:Amounts due to banks 3,573.7 3,573.7HM Treasury loans 18,063.1 18,063.1Derivative financial instruments 281.5 281.5Debt securities in issue 23,417.6 22,095.4Capital instruments 213.0 189.1Other financial liabilities 86.1 86.1Total financial liabilities 45,635.0 44,288.9
Note: the fair values above as at 31 December 2012 have not been restated to comply with IFRS 13. However, anydifferences between these fair values and IFRS 13-compliant fair values would not be material.
The only financial assets and liabilities which are carried at fair value on the Balance Sheet are investment securities andderivative financial assets and liabilities. The valuation techniques and inputs used to derive fair values at 30 September 2013are as follows.
Fair value is the price that would be received to sell an asset or paid to transfer a liability in an orderly transaction betweenmarket participants at the measurement date. Where an active market is considered to exist, fair values are based on quotedprices or lead manager prices. For instruments which do not have active markets, fair value is calculated using present valuemodels, which take individual cash flows together with assumptions based on market conditions and credit spreads, and areconsistent with accepted economic methodologies for pricing financial instruments.
(b) Valuation bases
Financial assets and liabilities carried at fair value are valued on the following bases:
At 30 September 2013 Level 1£m
Level 2£m
Level 3£m
Total£m
Financial assetsInvestment securities - available-for-sale - 19.1 - 19.1Derivative financial instruments - 3,573.8 - 3,573.8Financial liabilitiesDerivative financial liabilities - (175.7) - (175.7)Net financial assets - 3,417.2 - 3,417.2
At 31 December 2012 Level 1£m
Level 2£m
Level 3£m
Total£m
Financial assetsInvestment securities - available-for-sale - 93.9 - 93.9Derivative financial instruments - 3,919.8 - 3,919.8Financial liabilitiesDerivative financial liabilities - (281.5) - (281.5)Net financial assets - 3,732.2 - 3,732.2
Instruments which had been disclosed as 'level 3' at 31 December 2012 have been recategorised as 'level 2' as theunobservable inputs have been assessed to be insignificant.

Northern Rock (Asset Management) plc Interim Financial Report 30 September 2013
UKAR Interim Financial Report 30 September 2013 Section C - NRAM Page 70 of 75
Notes to the Financial Information (continued)
17. Fair value disclosures (continued)
(b) Valuation bases (continued)
Level 1: Quoted prices (unadjusted) in active markets for identical assets and liabilities.Level 2: Inputs other than quoted prices that are observable for the asset or liability, whether directly (ie as price) or
indirectly (ie derived from the implications of prices).Level 3: Inputs for the asset or liability that are not based on observable market data, or have significant unobservable
inputs.
There were no transfers between Level 1 and Level 2 during the 9 months ended 30 September 2013.
Available-for-sale investment securities which are categorised as Level 2 are those which are less frequently traded, andhence trade prices are not considered sufficient evidence of fair value. Fair value is estimated by the securities' leadmanagers, taking into account recent trades, similar assets adjusted for credit spreads, and where applicable the underlyingperformance of assets backing the securities; unobservable inputs are not considered significant.
Derivative financial instruments which are categorised as Level 2 are those which either:
(a) Have future cash flows which are on known dates and for which the cash flow amounts are known or calculable byreference to observable interest and foreign currency exchange rates; or
(b) Have future cash flows which are not pre-defined, but for which the fair value of the instrument has very low sensitivity tounobservable inputs.
In each case the fair value is calculated by discounting future cash flows using benchmark, observable market interest rates.
18. Related party disclosures
NRAM considers the Board of Directors and the members of the Executive Committee to be the key management personnel.Transactions during the period with NRAM's key management personnel and other related parties were similar in nature tothose during the year ended 31 December 2012. NRAM repaid £1,172m of the HM Treasury loan during the three months to30 September 2013 bringing the total repaid for the first nine months of the year to £1,893m (12 months to 31 December 2012:£1,674m) and during the 6 months ended 30 June 2013 repaid in full the HM Treasury PIK interest of £150.9m (2012: £nil).
19. Contingent liabilities
The CCA regulates certain classes of mortgages and loans, including the unsecured element of the Together mortgageproduct. As detailed in the NRAM Group's 2012 Annual Report & Accounts, NRAM did not comply with the requirements ofthe CCA in respect of some documentation provided to certain customers with CCA-regulated loans and therefore made aprovision during 2012 for NRAM's best estimate of the cost of providing remediation to those customers. During the 6 monthsto 30 June 2013, the provision was increased by a further £47.0m following further analysis of the level of potential exposure.If any customers were to make a formal legal claim against NRAM in respect of these or other loans, NRAM would incur costsin defending its position, and should any such claim result in proceedings against NRAM which are pursued through the courtsand which succeed, NRAM could be liable for remediation to those claimant customers and potentially other customers withthe same circumstances. No formal legal claims have been received from any customers in respect of loans which are notCCA-regulated and no provision has been made.
As described in the NRAM Group's 2012 Annual Report & Accounts, on 23 July 2012 NRAM announced the sale of £465m ofloans to customers, at par, secured on residential property, to Virgin Money. Under the terms of the sale, NRAM providedcertain warranties. Any claim under the warranties must be made by 28 March 2014. NRAM's maximum liability under thesewarranties is limited to £35m.
In July 2013 the NRAM Group completed the £400m sale of its standalone unsecured personal loan book, realising a profit onsale of £21m. Under the terms of the sale, NRAM provided certain warranties. Any claim under the warranties must be madeby 12 March 2015. NRAM's maximum liability under these warranties is limited to £35m.
Northern Rock (Asset Management) plc Interim Financial Report 30 September 2013
UKAR Interim Financial Report 30 September 2013 Section C - NRAM Page 71 of 75
Notes to the Financial Information (continued)
20. Risks and uncertainties
The Directors are aware of the following material risks and uncertainties which may affect NRAM during the period to 31March 2014:
- external economic factors including unemployment, house price movements, the extent and timing of changes in interestrates and the rate of interest charged on the HM Treasury loan;
- conduct risk including products or customer service not meeting customer needs or expectations or regulatory requirements;
- and reputational risk as a result of past or present failure or perceived failure to comply with required or expected marketstandards.
There may be other risks that are not listed above that the Directors are not aware of or that the Directors do not considermaterial.
The business, financial condition or results of operations of NRAM could be adversely affected by any of these risks. Furtherdiscussion of risk management and control were provided on pages 11-13 of NRAM's 2012 Annual Report & Accounts.
21. Events after the reporting period
The Directors are of the opinion that there have been no significant events which have occurred since 30 September 2013 tothe date of this report that are likely to have a material effect on the NRAM Group's financial position as disclosed in thisInterim Financial Report.
The financial information in this document is unaudited and does not constitute statutory accounts within the meaning ofsection 435 of the Companies Act 2006. The comparative figures for the financial year ended 31 December 2012 are notthe statutory accounts for that financial year for Northern Rock (Asset Management) plc. The 2012 statutory accounts ofNorthern Rock (Asset Management) plc have been reported on by that company's auditors and delivered to the Registrarof Companies. The report of the auditors was unqualified, did not include a reference to any matters to which the auditorsdrew attention by way of emphasis without qualifying their report, and did not contain a statement under section 498(2) or(3) of the Companies Act 2006. This document may contain forward-looking statements with respect to certain plans andcurrent goals and expectations relating to the future financial conditions, business performance and results of NorthernRock (Asset Management) plc. By their nature, all forward-looking statements involve risk and uncertainty because theyrelate to future events and circumstances that are beyond the control of Northern Rock (Asset Management) plc including,amongst other things, UK domestic and global economic and business conditions, market related risks such as fluctuationin interest rates and exchange rates, inflation, deflation, the impact of competition, changes in customer preferences, risksconcerning borrower credit quality, delays in implementing proposals, the timing, impact and other uncertainties of futureacquisitions or other combinations within relevant industries, the policies and actions of regulatory authorities, the impact oftax or other legislation and other regulations in the jurisdictions in which Northern Rock (Asset Management) plc and itsaffiliates operate. As a result, the actual future financial condition, business performance and results of Northern Rock(Asset Management) plc may differ materially from the plans, goals and expectations expressed or implied in theseforward-looking statements.
Northern Rock (Asset Management) plc Interim Financial Report 30 September 2013
UKAR Interim Financial Report 30 September 2013 Section C - NRAM Page 72 of 75
Statement of Directors' Responsibilities
The Directors confirm that this Interim Financial Report has been prepared in accordance with IAS 34 as adoptedby the European Union and that the management commentary and related notes includes a fair review of theinformation required by DTR 4.2.7 and DTR 4.2.8, namely:
An indication of important events that have occurred during the first nine months and their impact on thecondensed Financial Statements and a description of the principal risks and uncertainties for theremaining three months of the financial period; and
Material related party transactions in the first nine months and any material changes in the related partytransactions described in the last annual report.
The Directors of Northern Rock (Asset Management) plc at the date of this report are:
Richard PymKent AtkinsonRichard BanksMichael BuckleyChristopher FoxSue LangleyPhillip McLellandKeith MorganLouise PattenJohn Tattersall
On behalf of the Board
Richard Banks Phillip McLellandChief Executive Officer Finance Director13 November 2013 13 November 2013
Northern Rock (Asset Management) plc. Registered Office: Croft Road, Crossflatts, Bingley, West Yorkshire BD16 2UA.Registered in England and Wales under company number 03273685.
Northern Rock (Asset Management) plc Interim Financial Report 30 September 2013
UKAR Interim Financial Report 30 September 2013 Section C - NRAM Page 73 of 75
Independent Review Report to Northern Rock (Asset Management) plc
Introduction
We have been engaged by the company to review the condensed set of Financial Statements in the InterimFinancial Report for the nine months ended 30 September 2013, which comprise the Consolidated IncomeStatement, Consolidated Statement of Comprehensive Income, Consolidated Balance Sheet, ConsolidatedStatement of Changes in Equity, Consolidated Cash Flow Statement and the related notes. We have read theother information contained in the Interim Financial Report and considered whether it contains any apparentmisstatements or material inconsistencies with the information in the condensed set of Financial Statements.
Directors' responsibilities
The Interim Financial Report is the responsibility of, and has been approved by, the Directors. The Directors areresponsible for preparing the Interim Financial Report in accordance with the Disclosure and Transparency Rulesof the United Kingdom's Financial Conduct Authority.
As disclosed in note 2, the Annual Financial Statements of the Group are prepared in accordance with IFRS asadopted by the European Union. The condensed set of Financial Statements included in this Interim FinancialReport has been prepared in accordance with International Accounting Standard 34 'Interim Financial Reporting'as adopted by the European Union.
Our responsibility
Our responsibility is to express to the company a conclusion on the condensed set of Financial Statements in theInterim Financial Report based on our review. This report, including the conclusion, has been prepared for andonly for the company for the purpose of the Disclosure and Transparency Rules of the Financial ConductAuthority and for no other purpose. We do not, in producing this report, accept or assume responsibility for anyother purpose or to any other person to whom this report is shown or into whose hands it may come save whereexpressly agreed by our prior consent in writing.
Scope of review
We conducted our review in accordance with International Standard on Review Engagements (UK and Ireland)2410 'Review of Interim Financial Information Performed by the Independent Auditor of the Entity', issued by theAuditing Practices Board for use in the United Kingdom. A review of interim financial information consists ofmaking enquiries, primarily of persons responsible for financial and accounting matters, and applying analyticaland other review procedures. A review is substantially less in scope than an audit conducted in accordance withInternational Standards on Auditing (UK and Ireland), and consequently does not enable us to obtain assurancethat we would become aware of all significant matters that might be identified in an audit. Accordingly, we do notexpress an audit opinion.
Conclusion
Based on our review, nothing has come to our attention that causes us to believe that the condensed set ofFinancial Statements in the Interim Financial Report for the nine months ended 30 September 2013 is notprepared, in all material respects, in accordance with International Accounting Standard 34 as adopted by theEuropean Union and the Disclosure and Transparency Rules of the United Kingdom's Financial ConductAuthority.
PricewaterhouseCoopers LLPChartered AccountantsBristol13 November 2013
The maintenance and integrity of the Northern Rock (Asset Management) plc website is the responsibility of the Directors; the work carried outby the auditors does not involve consideration of these matters and, accordingly, the auditors accept no responsibility for any changes thatmay have occurred to the Financial Statements since they were initially presented on the website.
Legislation in the United Kingdom governing the preparation and dissemination of financial statements may differ from legislation in otherjurisdictions.
UK Asset Resolution Limited Interim Financial Report 30 September 2013
Page 74 of 75
Contact informationThe 2013 Interim Financial Reports for B&B and NRAM are available on their websites at www.bbg.co.uk andwww.nram.co.uk within the Corporate Information sections.
Contacts
BrunswickJonathan Glass / Nick CosgroveTel: +44 20 7404 5959Email: [email protected]
Investor relations contacts
Neil VanhamTel: +44 1274 806341Email: [email protected]

UK Asset Resolution Limited - Registered Office: Croft Road, Crossflatts, Bingley, West Yorkshire BD16 2UA.Registered in England and Wales under company number 07301961. www.ukar.co.uk Page 75 of 75