Embed Size (px)
Citation preview
- 1 -
UistViz: 26 Years of UIST Coauthor Network Visualization Ruofei Du
Makeability Lab | HCIL Computer Science Dept. University of Maryland
ABSTRACT In this report, the author built a UIST coauthor network from 1988 to 2013 based on NodeXL. The publication data comes from DBLP[1] and the affiliation data comes from Google Scholar. The author proposed four headlines according to the visualization of UIST coauthor network. Finally, the author provides several suggestions to improve NodeXL.
Author Keywords Information Visualization; UIST; Coauthor Network; DBLP; NodeXL
INTRODUCTION UIST stands for the ACM Symposium on User Interface Software and Technology, which is generally recognized as one of the top conferences (such as SIGCHI, CSCW) in the Human-Computer Interaction field. This conference brings people from diverse areas including graphical & web user interfaces, tangible and ubiquitous computing, virtual & augmented reality, multimedia, new input & output devices and CSCW. [8]
In previous CMSC 734 NodeXL Application Projects, several visualization on SIGCHI, VAST, InfoVis has been proposed by [3][4]. To my knowledge, no one has investigated into UIST coauthor network before. To better understand the community of UIST conference, the author starts this UIST Viz project.
In this report, the author imports 1033 publications in DBLP XML database[6] from UIST 1988 to UIST 2013. In the constructed undirected graph, each node indicates an author and each edge corresponds a coauthor relationship between two authors. The weight of edges is proportional to the counts of coauthor publications. The major metric provided by NodeXL is as follows:
Graph Metric Value
Vertex 1932
Edge 4598
Connected Component 234
Maximum Degree 52.00
Median Degree 4.00
Table 1. Graph Metric of UIST Coauthor Network.
The overview of the graph generated by Fruchterman-Reingold Layout in NodeXL is displayed in Figure 1.
Figure 1: The overview of the coauthor graph in UIST.
The size of the node corresponds to the author’s total number of coauthors. The color is categorized into three classes: dark blue indicates more than 10 publications; the lighter blue indicates 5~10 publications; while the lightest blue indicate 1~5 publications. The edge width corresponds to the weight of the edge (i.e. the number of publications between two nodes).
HEADLINE 1: THERE ARE TWO COMPONENTS AMONG AUTHORS WITH 15 PUBLICATIONS AND ONLY ONE CONNECTS THE INDUSTRIAL RESEARCH LABS. It is really hard for a paper to be published in UIST. From 2003 to 2013, only 42.27 papers are accepted on average per year with an overall acceptance rate of 20% according to [9].
In order to find out who has published the most papers in UIST, I filter authors with 15 publications or more by NodeXL. There are 11 authors: Scott E. Hudson, Ravin Balakrishnan, Rober C. Miller, Brad A. Myers, Takeo Igarashi, Steven Feiner, Patrick Baudisch, Shahram Izadi, Ken Hinckley, George W. Fitzmaurice and Tovi Grossman.
CMSC 734 2013 Fall NodeXL Application Report Computer Science Department University of Maryland, College Park
- 2 -
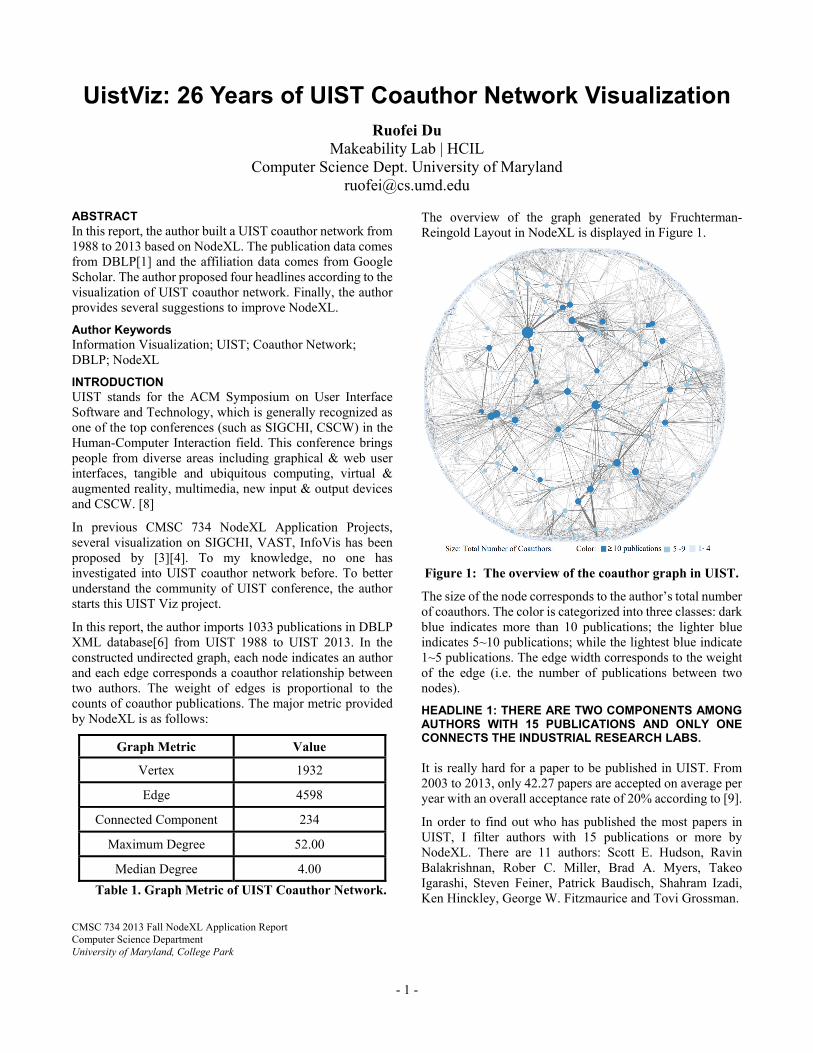
Figure 2. The Big Graph: The coauthor network with no less than 15 publications. (Author Name Labels)
The filtered network is illustrated is Figure 2. The size of the node is proportional to the total publications. The width of the edge corresponds to the co-authored publications between two authors.
To my astonishment, there are two components in this graph. The left component has the biggest node “Scott E. Hudson” while the right component has the second biggest node “Ravin Balakrishnan”. The biggest collaboration is between Tovi Grossman and George W. Fitzmaurice. They coauthored 11 papers for UIST, which is actually the maximum coauthor-ship of the graph. So why does it occur?
Figure 3. The Big Graph: The coauthor network with no less than 15 publications. (Affiliation Labels)
To solve the puzzle of the two big components. I applied affiliation labels on the same graph. On the left component, these are professors from CMU, Columbia University and MIT. On the right component, there are two researchers from Microsoft and two from Autodesk Research. So it seems that the right components have more collaboration with the industrial field. Additionally, I found it is Prof. Balakrishnan
from University of Toronto that has collaboration with both Microsoft Research and Autodesk Research.
In conclusion, among the authors with 15 publications or more in UIST, there are two major components. One consists of professors from Stanford University, MIT and Columbia University; the other consists of professors from University of Toronto, University of Tokyo, Potsdam University and researchers from Microsoft and Autodesk Research, which indicate an active collaboration between academia and industrial field.
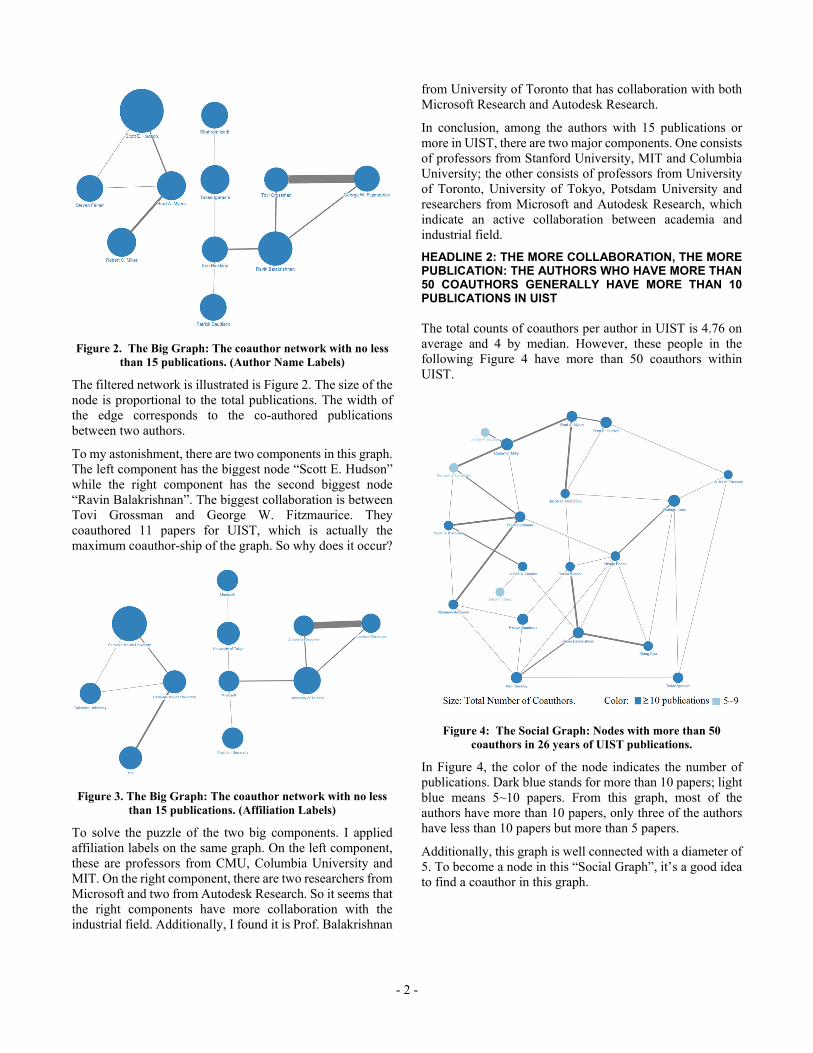
HEADLINE 2: THE MORE COLLABORATION, THE MORE PUBLICATION: THE AUTHORS WHO HAVE MORE THAN 50 COAUTHORS GENERALLY HAVE MORE THAN 10 PUBLICATIONS IN UIST The total counts of coauthors per author in UIST is 4.76 on average and 4 by median. However, these people in the following Figure 4 have more than 50 coauthors within UIST.
Figure 4: The Social Graph: Nodes with more than 50 coauthors in 26 years of UIST publications.
In Figure 4, the color of the node indicates the number of publications. Dark blue stands for more than 10 papers; light blue means 5~10 papers. From this graph, most of the authors have more than 10 papers, only three of the authors have less than 10 papers but more than 5 papers.
Additionally, this graph is well connected with a diameter of 5. To become a node in this “Social Graph”, it’s a good idea to find a coauthor in this graph.
- 3 -
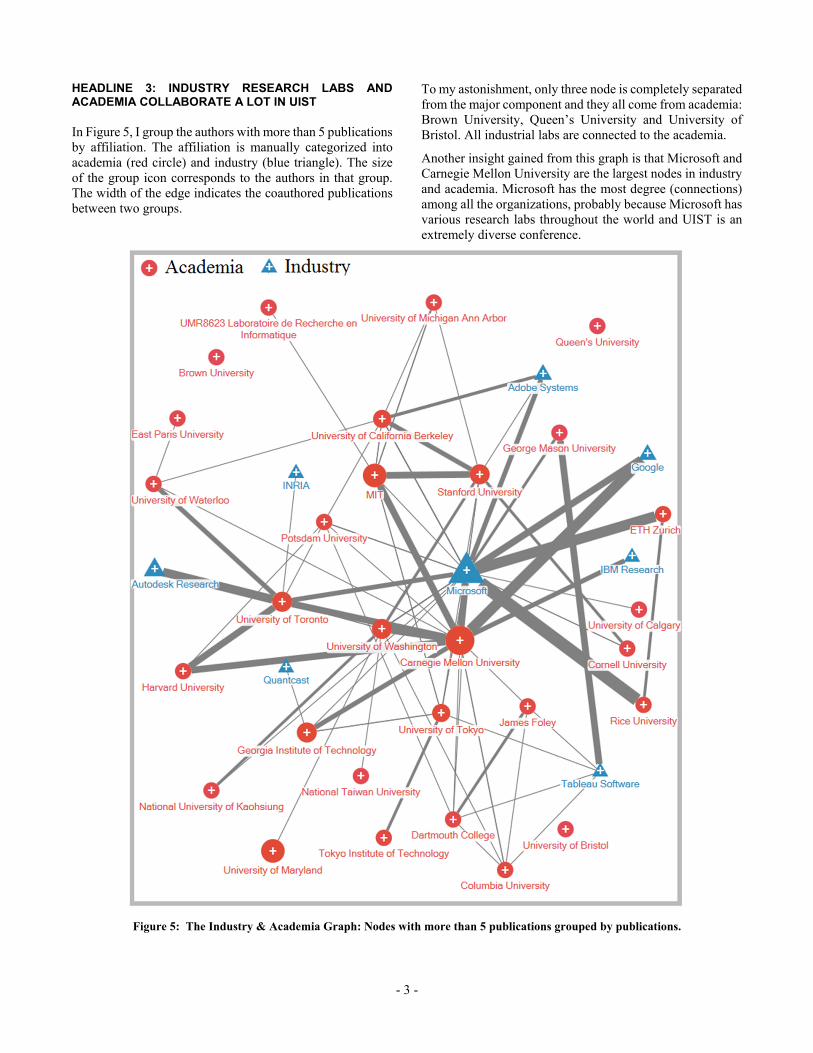
HEADLINE 3: INDUSTRY RESEARCH LABS AND ACADEMIA COLLABORATE A LOT IN UIST In Figure 5, I group the authors with more than 5 publications by affiliation. The affiliation is manually categorized into academia (red circle) and industry (blue triangle). The size of the group icon corresponds to the authors in that group. The width of the edge indicates the coauthored publications between two groups.
To my astonishment, only three node is completely separated from the major component and they all come from academia: Brown University, Queen’s University and University of Bristol. All industrial labs are connected to the academia.
Another insight gained from this graph is that Microsoft and Carnegie Mellon University are the largest nodes in industry and academia. Microsoft has the most degree (connections) among all the organizations, probably because Microsoft has various research labs throughout the world and UIST is an extremely diverse conference.
Figure 5: The Industry & Academia Graph: Nodes with more than 5 publications grouped by publications.
- 4 -
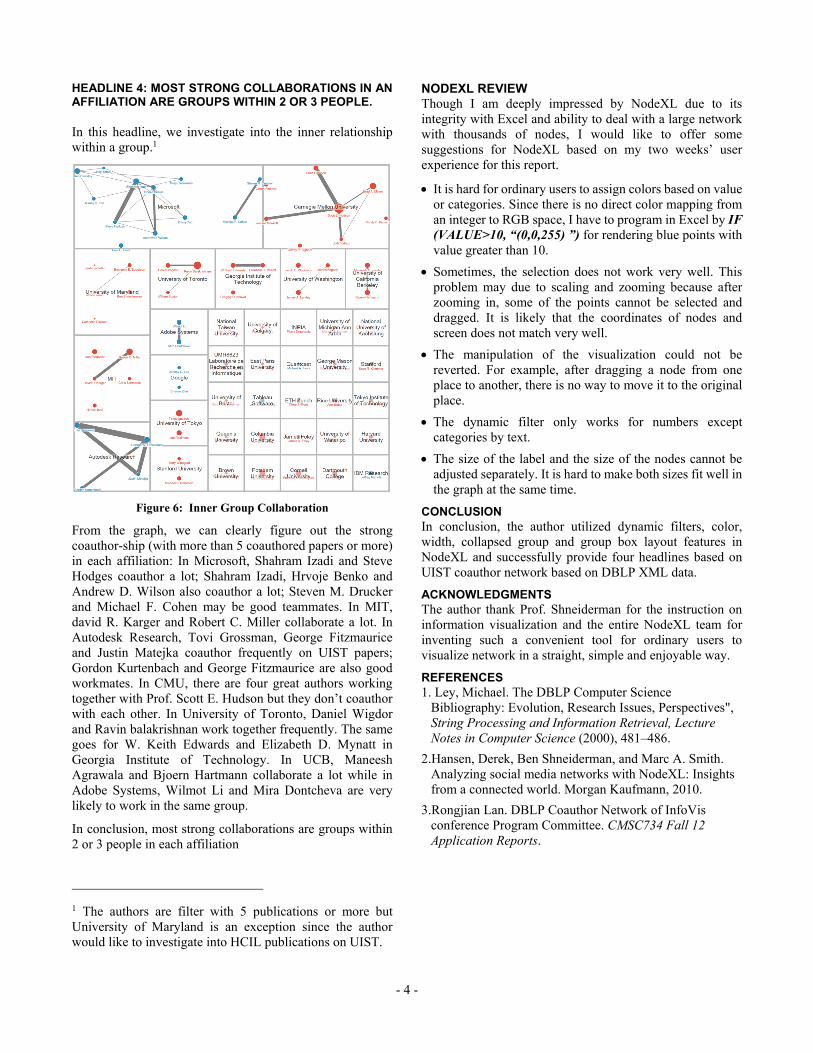
HEADLINE 4: MOST STRONG COLLABORATIONS IN AN AFFILIATION ARE GROUPS WITHIN 2 OR 3 PEOPLE. In this headline, we investigate into the inner relationship within a group.1
Figure 6: Inner Group Collaboration
From the graph, we can clearly figure out the strong coauthor-ship (with more than 5 coauthored papers or more) in each affiliation: In Microsoft, Shahram Izadi and Steve Hodges coauthor a lot; Shahram Izadi, Hrvoje Benko and Andrew D. Wilson also coauthor a lot; Steven M. Drucker and Michael F. Cohen may be good teammates. In MIT, david R. Karger and Robert C. Miller collaborate a lot. In Autodesk Research, Tovi Grossman, George Fitzmaurice and Justin Matejka coauthor frequently on UIST papers; Gordon Kurtenbach and George Fitzmaurice are also good workmates. In CMU, there are four great authors working together with Prof. Scott E. Hudson but they don’t coauthor with each other. In University of Toronto, Daniel Wigdor and Ravin balakrishnan work together frequently. The same goes for W. Keith Edwards and Elizabeth D. Mynatt in Georgia Institute of Technology. In UCB, Maneesh Agrawala and Bjoern Hartmann collaborate a lot while in Adobe Systems, Wilmot Li and Mira Dontcheva are very likely to work in the same group.
In conclusion, most strong collaborations are groups within 2 or 3 people in each affiliation
1 The authors are filter with 5 publications or more but University of Maryland is an exception since the author would like to investigate into HCIL publications on UIST.
NODEXL REVIEW Though I am deeply impressed by NodeXL due to its integrity with Excel and ability to deal with a large network with thousands of nodes, I would like to offer some suggestions for NodeXL based on my two weeks’ user experience for this report.
It is hard for ordinary users to assign colors based on value or categories. Since there is no direct color mapping from an integer to RGB space, I have to program in Excel by IF (VALUE>10, “(0,0,255) ”) for rendering blue points with value greater than 10.
Sometimes, the selection does not work very well. This problem may due to scaling and zooming because after zooming in, some of the points cannot be selected and dragged. It is likely that the coordinates of nodes and screen does not match very well.
The manipulation of the visualization could not be reverted. For example, after dragging a node from one place to another, there is no way to move it to the original place.
The dynamic filter only works for numbers except categories by text.
The size of the label and the size of the nodes cannot be adjusted separately. It is hard to make both sizes fit well in the graph at the same time.
CONCLUSION In conclusion, the author utilized dynamic filters, color, width, collapsed group and group box layout features in NodeXL and successfully provide four headlines based on UIST coauthor network based on DBLP XML data.
ACKNOWLEDGMENTS The author thank Prof. Shneiderman for the instruction on information visualization and the entire NodeXL team for inventing such a convenient tool for ordinary users to visualize network in a straight, simple and enjoyable way.
REFERENCES 1. Ley, Michael. The DBLP Computer Science
Bibliography: Evolution, Research Issues, Perspectives", String Processing and Information Retrieval, Lecture Notes in Computer Science (2000), 481–486.
2.Hansen, Derek, Ben Shneiderman, and Marc A. Smith. Analyzing social media networks with NodeXL: Insights from a connected world. Morgan Kaufmann, 2010.
3.Rongjian Lan. DBLP Coauthor Network of InfoVis conference Program Committee. CMSC734 Fall 12 Application Reports.

- 5 -
4.Lee, Hanseung. Infovis, VAST, and CHI co-author network analysis. CMSC734 Fall 12 Application Reports.
5.Google Scholar: http://scholar.google.com
6.DBLP XML Database: http://dblp.uni-trier.de/xml/
7.Source code and data of this report: www.duruofei.com/uistviz/uistviz.zip
8.UIST 2013 Official Website: http://www.acm.org/uist/uist2013/
9.ACM Digital Library: http://dl.acm.org


![[UIST 2015] FlexiBend: Enabling Interactivity of Multi-Part, Deformable Fabrications](https://img.pdfslide.us/doc/110x75/587b4a171a28abff1a8b4877/uist-2015-flexibend-enabling-interactivity-of-multi-part-deformable-fabrications.jpg)