Embed Size (px)
Citation preview

Variation in Compulsory Psychiatric In-Patient Admission in England: a Cross-Classified, Multilevel Analysis
Scott Weich a*, Orla McBride b, Liz Twigg c, Craig Duncan d, Patrick Keown e, David Crepaz-Keay f, Eva Cyhlarova g, Helen Parsons h, Jan Scott i, Kamaldeep Bhui j
a ScHARR University of Sheffield Sheffield S1 4DA t: 0114 222 0856 e: [email protected]* Corresponding author
b School of Psychology University of Ulster County Londonderry Ulster BT48 7JL
c Department of Geography University of Portsmouth Buckingham Building Portsmouth PO1 3HE
d Department of Geography University of Portsmouth Buckingham Building Portsmouth PO1 3HE
e Newcastle University Academic Psychiatry Campus for Ageing & Vitality Newcastle upon Tyne NE4 6BE
f Mental Health Foundation 1 London Bridge Walk London SE1 2SX
g London School of Economics and Political Science Houghton Street London WC2A 2AE h Division of Health Sciences Warwick Medical School University of Warwick Coventry CV4 7AL
1

I Newcastle University Academic Psychiatry Campus for Ageing & Vitality Newcastle upon Tyne NE4 6BE
j Centre for Psychiatry Barts and The London School of Medicine & Dentistry Queen Mary University of London London EC1M 6BQ
Word Count: 3,159 words
2
Abstract (258 words; 243 words excluding funding statement)
Background
The increasing rate of compulsory admission to psychiatric in-patient beds in England is
concerning. Studying variation between places and services could be key to identifying
targets for interventions to reverse this. We modelled spatial variation in compulsory
admissions in England using national patient-level data, and quantified the extent to which
patient, local area and service setting characteristics accounted for this variation.
Methods
Cross-sectional, multilevel analysis of the 2010/11 Mental Health Minimum Data Set
(MHMDS). Data were available for 1,238,188 patients, covering 64 NHS Provider Trusts (93%)
and 31,865 Census Lower Super Output Areas (LSOAs) (98%). Primary outcome was
compulsory admission to a mental illness bed, compared with people admitted voluntarily or
receiving only community-based care.
Outcomes
7∙5% and 5∙6% of the variance in compulsory admission occurred at LSOA- and Provider
Trust-levels, respectively, after adjusting for patient characteristics. Black patients were
almost three times more likely to be admitted compulsorily than White patients (OR 2∙94,
95% CI 2∙90-2∙98). Compulsory admission was greater in more deprived areas (OR 1∙22,
95% CI 1∙18-1∙27) and in areas with more non-white residents (OR 1∙51, 95% CI 1∙43-
1∙59), after adjusting for confounders.
Interpretation
Compulsory psychiatric in-patient admission varies significantly between local areas and
services, independent of patient, area and service characteristics. Compulsory admission
rates appear to reflect local factors, especially socio-economic and ethnic population
3
composition. Understanding how these condition access to and use of mental health care is
likely to be important for developing interventions to reduce compulsion.
Funding
The study was funded by the NIHR Health Services and Delivery Research Programme
(10/1011/70).
4

Introduction
Many European countries have witnessed increased rates of compulsory admissions to
psychiatric in-patient beds in recent decades.1 In England, the total number of such
admissions (excluding short-term assessment orders) exceeded 63,000 in 2015/16, a 9%
increase on the previous year and an increase of around 43% since the introduction of the
2007 Mental Health Act (MHA).2 This is concerning to service users, clinicians, regulators and
policy makers,3-5 particularly since compulsory treatment is stigmatising and may hamper
engagement with services.6 Explanations for greater use of compulsion have been suggested,
including increased use of illicit drugs and alcohol, secular changes in support networks,7,8
fewer psychiatric beds and failure to provide alternatives.9,10 . Attempts to reduce compulsory
treatment through advance directives and enhanced crisis care plans have had only modest
effects,11 highlighting the need for further intervention strategies.
Compulsory admission rates vary between places, 9 and this may hold clues to causes of
upward national trends. Investment in mental health services, bed capacity and provision of
community-based alternatives vary between places,12 as do patients and the communities in
which they live.13 Elucidating the effects of service setting factors and local area
characteristics across large and representative samples, and differentiating these from
variation due to differences between patients, may represent the best way to identify
intervention targets. Our aims were to describe and model spatial variation in compulsory
admissions in England using national patient-level data, and to quantify the extent to which
adjusting for patient, local area and service setting characteristics accounted for this variation.
Methods
Data source and study sample5
Compulsory admissions in England are recorded in the Mental Health Minimum Dataset
(MHMDS),14 a mandatory administrative dataset. Individual patient records in the MHMDS
include spatial/service setting identifiers (Table 1) allowing linkage to external data sources.
We used data for 2010-2011.
<< Table 1 about here >>
Following data quality checks, data from 8 Provider Trusts were excluded, including 3
independent Provider Trusts which lacked spatial identification codes. Of 5 NHS Provider
Trusts excluded, one had no in-patient beds and four lacked data on patients’ legal status. The
final study sample consisted of 1,238,188 patients who received care from 64 NHS Provider
Trusts. Due to data-coding errors and missing data, analytic samples for alternative models
varied slightly.
Outcomes
The main outcome was compulsory admission, defined as time spent in an in-patient mental
illness bed while subject to the Mental Health Act (MHA) (2007). We excluded patients
detained under sections of the Act concerned only with conveyance to, and/or assessment in,
a Place of Safety, or for short-term (≤72 hours) assessment only as these do not in themselves
direct admission to an-patient mental health bed. Likewise, we excluded sections of the Act
relating to guardianship or supervisedcommunity treatment. Patients detained under short-
term assessment sections and subsequently admitted compulsorily to a mental health bed
were included in the compulsory admission group; those discharged from short-term
assessment orders or who were admitted voluntarily were not. Patients excluded from the
compulsory admission group were included in the unexposed group, which comprised those
6
treated as voluntary inpatients and/or in the community. Around 95% of those admitted
compulsorily were detained under MHA Sections 2 and 3. This group also included those
subject to Sections 4, 35, 36, 37, 38, 47 and 48.
No single variable in the MHMDS described the study outcome. Rather, it was derived from
several variables, including admissions and discharges, bed days, receipt of community
treatment, and legal detention status.15 We were able to identify whether a patient had been
admitted compulsorily and the highest level of legal restriction (according to the MHA (2007))
in the reporting period, but not the number or duration of episodes. Therefore, each patient
could only be counted once regardless of number of compulsory admissions in the study year.
The unexposed group therefore comprised all patients who received any type of care other
than compulsory admission. Cross-tabulating MHMDS data on community treatment (e.g.
number of contacts with professionals) with admission data enabled us to identify patients
who received only community care.
Exposures
MHMDS contained reasonably complete data (% missing) on a limited number of patient
characteristics, namely age (<0∙01%), sex (0∙03%) and ethnicity (9∙6%). Several patient-
level variables could not be included in our analysis due to high levels of missing data: marital
status (15%); accommodation status (64%), employment status (75%) and diagnosis (81%).
MHMDS spatial identifiers were used to link patient records to external data sources that
included variables characterising local areas and mental health services that were potentially
7
associated with mental health outcomes (Table 4). Data sources and measures used to derive
variables at LSOA-level and Provider Trust-level are shown as supplementary material.
Statistical analysis
Multilevel models (MM) were applied using MLwIN 16 to estimate variation in compulsory
admission , starting with null (unconditional) models which partitioned total variance in
compulsory admission between each level in the model. Five discrete levels were identified in
the MHMDS, in addition to patients (Table 1), although computational limitations meant that
not all could be included in a single model. Moreover, these levels did not nest neatly within
each other, necessitating use of cross-classified multilevel models (CCMMs) and increasing
computational complexity.17 Patients were nested within LSOAs but SOAs were not nested
neatly within Provider Trusts, i.e. patients within any one LSOA could be treated in different
Trusts. Such cross-classification results in a data structure that, in effect, increases the
number of units at the LSOA level. In the examples shown in figure 1, LSOA 2 is represented
twice because patients attend Hospital A and Hospital B.
We aimed to specify and estimate the most detailed models possible. Preliminary work
suggested that null models with more than four levels, and conditional models with more
than three levels, were unstable (ie failed to converge with acceptable MCMC diagnostics);
moreover, there was limited variance in compulsory admission at Strategic Health Authority
(SHA)-level. We therefore present findings from competing four-level null models, the results
of which informed selection of a preferred three-level model. Finally, multivariate models
were used to determine how much of the total variance was explained by patient-level
explanatory variables only, and then by explanatory variables at individual, local area- and
service setting levels. 8
Since the outcome was binary, multilevel logistic regression was used. Following convention,
we assumed the binary outcome was defined by a continuous latent variable and patient-
level variance was standardized to the logistic variance of π2/3=3∙29.18 In this way, variances
at each level could be summed, allowing the proportion of (unexplained) variation, the
Variance Partition Coefficient (VPC), to be calculated at each level. As this method only
provides an approximate measure of the VPC in models with binary responses, we also
calculated Median Odds Ratios (MORs) for our final models.19 If the MOR is equal to 1, there
is no variation between higher-level settings; large (and statistically significant) MORs indicate
substantial higher-level variation.
Markov Chain Monte Carlo (MCMC) Bayesian methods were used to estimate all models.20 All
null models were estimated twice, using all available data (n=1,149,541 to 1,207,916) and
then only complete cases (n=1,149,541). MCMC diagnostics were used to determine the
number of iterations in each model. We examined the estimate trace, the plot of the
posterior distribution and the autocorrelation function. The number of chains was evaluated
using Raftery-Lewis and Brooks-Draper prospective diagnostics.20 We used the Bayesian
Deviance Information Criterion (DIC) statistic to compare the fit of alternative MMs.21 Models
with lower DIC values suggest a better, more parsimonious model; a difference of 10 or more
is considered substantial. DIC values are only comparable across models with the same
observed data and hence were estimated using only complete cases.
To estimate variance explained by patient, local area and service setting characteristics, we
used the pseudo R-squared approach outlined by Snijders and Bosker18 (p306). Variance
explained at, for example, patient-level was estimated as the proportion of total variance
attributable to the fixed part of a model that included patient-level explanatory variables, 9
divided by the total variance. Total variance is equal to the sum of the variances of the fixed
part of the model and (unexplained) variances at each higher level.
The statistical significance of fixed-part estimates were tested by deriving Z ratios and
comparing these against a normal distribution. Odds ratios (95% credible intervals, CI) are
reported to show their size. We do not report p values, in keeping with standard practice for
reporting Bayesian model results.. MORs are directly comparable to these fixed-part odds
ratios. Patients were only excluded from analyses where data were missing.
Results
Table 2 shows the characteristics of the study sample. Of these patients, 42,915 (3 5%) had ∙
been compulsorily admitted to hospital under the MHA at least once during the study year.
<< Table 2 about here >>
Null (unconditional) models
Table 3 shows alternative null models with four levels. Overall, between 75∙1% and 84∙5%
of the variance in compulsory admission to hospital was at patient-level; between 6∙4% and
6∙7% was at LSOA-level; between 5∙6% and 7∙2% was at PCT-level; between 1∙9% and
2∙7% was at GP-level; and between 6∙9% and 12∙3% was at Provider Trust-level.
Inclusion of PCTs and Provider Trusts in the same model resulted in reduction in patient-level
variance and commensurate increase in variance between Provider Trusts (from about 7% to
about 12%). On further investigation we found that in one-third of Provider Trusts, over 80%
of patients originated from a single PCT. It is likely, therefore, that reduced variance at
10
patient level in models 3 and 4 is due to conflation of patient- and higher-level variance
caused by clustering of patients within a small number of PCTs per Trust, a problem
exacerbated by cross-classification in the data.16,22 We therefore considered that estimates of
higher-level variance in Models 1 and 2 were more reliable than those of Models 3 and 4.
Model comparisons using DIC statistic revealed that Models 2 and 3 were superior to Models
1 and 4, with Model 3 fitting slightly better than Model 2. These results indicated that the
most appropriate CCMM comprised patients, LSOAs, GP Practices and Provider Trusts.
<< Table 3 about here >>
Multivariate models
The computationally complex four-level multivariate CCMM produced an unstable solution in
terms of MCMC diagnostics. We therefore selected the most important spatial levels for
inclusion in more complex models. We did this on the basis of our null models (Table 3,
Model 2), and following the a priori view that patients and Provider Trusts were essential to
any model: the former was the level at which most variation occurred and the latter
represented the locus at which compulsory admission decisions are made. We therefore
included patient, LSOA and Provider Trust as the three levels in multivariate models.
Table 4 shows the results of patient-LSOA-Provider Trust CCMMs, with and without
covariates. The null model was based on an MCMC model with burn-in of 500 and
Monitoring Chain Length of 50,000. The model with covariates was run for 100,000
iterations; MCMC diagnostics indicated that burn-in and chain length were sufficiently large.
The null model shows that while the majority of the variance in compulsory admission
occurred at patient-level, 8∙3% and 7∙0% occurred at LSOA- and Provider Trust-levels,
11

respectively. We estimated that patient-level covariates explained 8∙0% of the total variance
in risk of being compulsorily admitted. Covariates at LSOA- and Provider Trust-levels were
estimated as explaining only a further 2∙2% of this variance, 1∙1% at each of the higher
levels. In total, therefore, just over 10% of the total variance in compulsory admission was
explained by covariates.
Given the limited explanatory power of covariates, the percentage share of the remaining
(unexplained) variance at higher-levels did not change substantially once these were included
in the model. Following inclusion of patient-level covariates, variance fell to 7∙5% and 5∙6%
for LSOAs and Provider Trusts, respectively. After further inclusion of LSOA- and Provider
Trust-level covariates, this remained unchanged at 7∙5% at LSOA-level and fell slightly to
5∙2% at Provider Trust-level.
<< Table 4 about here >>
At patient level, after adjusting for all covariates, men had a higher probability of being
compulsorily admitted to hospital than women (OR 1∙29, 95% CI 1∙27- 1∙31). Patients who
were 18 years old or younger were least likely to be admitted compulsorily; compared with
this group, the risk of compulsory admission was greatest among those aged 18–35 years (OR
1∙92, 95% CI 1∙82-2∙02) and fell with age, but remained statistically significant even in the
oldest age group (65 years and older) (OR 1 12, 95% CI 1∙ ∙02-1∙22). The largest associations
with compulsory admission at patient-level were observed for ethnicity, with Black patients
having the highest rate of compulsory admission compared to the White reference group (OR
2∙94, 95% CI 2∙90-2∙98). Patients of Asian and mixed ethnicity were also significantly more
12
likely to have been admitted compulsorily (Table 4).
At LSOA level, compulsory admission was associated with socio-economic deprivation in a
manner which suggested a dose-response effect. Odds ratios for compulsory admission rose
steadily by deprivation quintile, to a peak of 1∙22 (95% CI 1∙18 to 1∙27) among those living
in LSOAs with deprivation scores in the top quintile (most deprived) compared to those living
in the least deprived areas. The association between compulsory admission and ethnic
density was also statistically significant and also appeared to show a dose-response effect,
with patients living in LSOAs with the most non-white residents having much higher risks of
being admitted compulsorily (OR 1∙51, 95% CI 1∙43-1∙59). No statistically significant
association was found between compulsory admission and LSOA population density (Table 4).
At Provider Trust level, no statistically significant associations were found between
compulsory admission and bed numbers, length of stay, in-patient services performance,
Patient Environment and Action Team (PEAT) scores, staff satisfaction or annual number of
admissions. Similarly, there was no statistically significant difference in the rate of
compulsory admission between London Trusts and those outside the capital. Only one
Provider Trust-level covariate was significantly associated with greater compulsory admission:
patients receiving care from a Trust whose community mental health services were rated
‘same as/better than other Trusts’ versus those rated ‘worse than other Trusts’ (OR 1 93, ∙
95% CI 1 39-2 48).∙ ∙
The limited power of LSOA, Provider-Trust and patient characteristics in explaining spatial
variation in compulsory admission is confirmed by the MORs for LSOAs and Provider Trusts
(Table 4). After adjusting for all covariates , these were greater than 1 and larger than the
13
ORs for many patient characteristics and all LSOA- and Provider Trust-level characteristics, at
1 86 (95% CI 82-1 89) and 1 67 (95% CI 1 51-1 85), respectively.∙ ∙ ∙ ∙ ∙ ∙
Discussion
Main findings
We found statistically significant variance at both local area- and service setting-level in
compulsory admission in England, independent of patient characteristics. Although most
variance in compulsory admission was observed between patients, almost 13% occurred
between local areas (LSOAs) and service settings (NHS Provider Trusts), after adjusting for
patient characteristics. Slightly more variance was observed between local areas than
between Provider Trusts.
Most variance in compulsory admission remained unexplained, even after adjusting for a
large number of patient, local-area and service-setting characteristics. We estimated that
these covariates explained only around 10% of the total variance in compulsory admission.
Most of the explained variance was accounted for by patient-level characteristics; area- and
Provider Trust-level characteristics accounted for only just over 2% of total variance in
multivariate models. Mean odds ratios (MORs) confirmed the significance of this unexplained
higher-level variance in compulsory admission between LSOAs and between Provider Trusts.
The non-significance of most Provider Trust-level variables, including measures relating to bed
capacity was notable. However, Trusts with community services rated ‘same as/better than’
other Trusts were almost twice as likely to admit patients compulsorily, suggesting that better
community mental health services may be associated with increased risk of compulsory
admission, perhaps due to greater awareness of treatment needs. This phenomenon has 14
been observed previously, for Assertive Outreach and Crisis Resolution services.23,24
We found statistically significant associations at patient and local-area levels. Black patients
were almost three times more likely to be admitted compulsorily than White patients, in
keeping with evidence from elsewhere,25 after adjusting for area- and Provider Trust-level
characteristics. Compulsory admission was significantly associated with local-area deprivation
and the proportion of non-white residents (in LSOAs), after adjusting for other covariates
including individual ethnicity.
Strengths and limitations
This was the largest and most complete study of its kind and the national representativeness
of the sample, deriving from routine clinical activity, was a major strength. The complex data
structure reflects the real world settings in which patients live and use mental health services.
Multilevel models provided a means to examine this complexity. The availability of patient-
level data and the ability to link this to area-level variables were strengths.
Routine administrative data sources like MHMDS have limitations. Data were not available to
allow us to ascertain the number and duration of compulsory admission episodes.
Consequently, we modelled the likelihood that a patient was compulsorily admitted at some
point during the study period. This precluded us from exploring re-admissions and ‘revolving
door’ patients and the contribution they make to compulsory admission rates.
We were limited in the patient, local area- and Trust-level variables that were available and
residual confounding was likely. The most significant omission was information about
patients’ diagnoses, socio-economic status and clinical status.26 Previous studies have found
15
modest and contrasting associations between individual-level socio-economic status and the
incidence of psychotic disorders.27 We used total number of mental illness beds as we could
not distinguish between bed types. The capping of official bed occupancy statistics at 100%
may also have biased our findings towards the null and reduced estimates of explained
variance.28 Finally, s this was a cross-sectional study, we could not investigate factors
associated with changes in compulsory admission rates.
Interpretation of our findings
Our findings, based on the first-ever analysis of complete national data, indicate significant
(and substantial) variation in compulsory admission at both local area- and Provider Trust-
levels. Despite adjusting for a large number of potential confounders, covariates explained
only a limited amount of variation. The most likely explanation was the absence of
information on key variables, including diagnosis and illness severity, previous history of
admission and/or compulsion, engagement with services, isolation, and drug and alcohol use
(individual); availability of adequate housing, social care and other support services (area);
and bed pressures, crisis intervention response times and local service configuration and
quality (Provider Trust).
Nevertheless, our findings suggest that compulsory admission rates are not uniform, and may
reflect local factors, such as the challenges of delivering home-based crisis care in areas with
high levels of socio-economic deprivation. Further research is needed to elucidate factors
that account for spatial variation in compulsory admission, and to understand the ways in
which factors such as area-level deprivation and ethnic density condition access to and
delivery of mental health care. And whereas previous interventions to reduce compulsory
admission have focused on the individual (patient) level, such as Community Treatment 16
Orders and enhanced care plans, 11 our findings suggest that interventions will need to
operate at more than one spatial level to be effective. 29
Contributors
SW, LT, PK, JS, KB, DC-K and EC had the original idea for this study and were responsible for
study hypotheses, design and data specification. SW had overall responsibility for the
conduct of the study and is the guarantor of this manuscript. SW, OM and LT were
responsible for the analysis strategy. OM undertook the data analysis (with advice from SW,
LT and HP) and results were interpreted by all authors. OM and SW had full access to all the
data in the study and take responsibility for the integrity of the data and the accuracy of the
analyses. CD was responsible for drafting the present manuscript, through several drafts, and
all authors contributed to this. SW, the lead author and the manuscript's guarantor, affirms
that the manuscript is an honest, accurate, and transparent account of the study being
reported; that no important aspects of the study have been omitted; and that any
discrepancies from the study as planned have been explained.
Funding
The work was supported by the National Institute for Health Research Health Services and
Delivery Research Programme (project number 10/1011/70). The funder of the study had no
role in study design, data collection, data analysis, data interpretation or writing of the
manuscript. The corresponding author had full access to the data in the study and had final
responsibility for the decision to submit for publication.
Conflicts of interest
17
All authors had financial support from the National Institute for Health Research Health
Services and Delivery Research Programme (project number 10/1011/70) for the submitted
work but no other financial relationships with any organizations that might have an interest in
the submitted work in the previous three years or other relationships or activities that could
have influenced the submitted work.
Acknowledgements
Data were provided under license and re-used with the permission of The Health and Social
Care Information Centre. All rights reserved. Permissions were obtained from the NHS Data
Access and Advisory Group and Warwick Medical School Biomedical Research Ethics
Committee. The views and opinions expressed therein are those of the authors and do not
necessarily reflect those of the NHS, the NIHR, MRC, CCF, NETSCC, the HS&DR Programme or
the Department of Health.
Panel: Research in context
Evidence before this study
Although several studies have been done in the UK and other European countries to examine
individual, local area and service provider factors associated with spatial variation in the use
of compulsory admission, few studies have looked at the relative contribution of factors at all
three levels simultaneously. We searched PubMed for articles published between January 1,
2000 and December 31st 2016 with the search terms: (compulsory[All Fields] AND
admission[All Fields]) OR (involuntary[All Fields] AND admission[All Fields]). Over 730 articles
were found, 38 of which were of direct relevance to the present study. Much of the previous
work has consisted of ecological studies. By working at a single aggregate level, these studies
have been unable to account for the autocorrelation arising from the grouping of patients in
18
higher-level settings, be they local areas or service providers. They have also been unable to
provide an estimate of the relative size of the variation at each of the higher-levels, or the
contribution of level-specific factors in explaining this variation. This research has also been
restricted to sub-national samples, either particular regions, cities or hospitals, limiting both
generalisability and the extent of observed variation.
Added value of this study
Our findings are based on the first-ever multilevel analysis of nationally representative service
use data in England, comprising data on over 1.2m patients. This study’s results confirm the
occurrence of spatial variation in rates of compulsory psychiatric admission and show that this
occurs to a substantial and significant degree, and independently, between both local areas
and mental health service providers. This amounts to strong evidence of significant variation
in compulsorily admission between both local areas and services, independent of patient
characteristics. Although we found highly significant associations between local area socio-
economic deprivation and ethnic density, little of the variation between places and service
providers was explained by the variables characterising local areas, services or patients
themselves.
Implications of all the available evidence
Compulsory admission rates in England vary between people and places to a significant
degree. Understanding how local factors, particularly socio-economic deprivation and ethnic
density, condition access to and use of mental health services may be key to developing
interventions and strategies to reduce compulsion.
19
References
1 Fakhoury W, Priebe S. Deinstitutionalization and reinstitutionalization: major changes in the provision of mental healthcare. Psychiatry 2007; 6: 313–6.
2 NHS Digital. Inpatients formally detained in hospitals under the Mental Health Act 1983, and patients subject to supervised community treatment. Uses of the Mental Health Act: Annual Statistics, 2015/16, Health and Social Care Information Centre; 2016.
3 Care Quality Commission. Monitoring the Mental Health Act in 2014/15. 2014.
4 House of Commons Health Committee. Post-Legislative Scrutiny of the Mental Health Act 2007: First Report of Session 2013–14. London: House of Commons; 2013.
5 Department of Health. Mental Health Crisis Care Concordat. Improving outcomes for people experiencing mental health crisis. 2014; 1–54.
6 Thornicroft G, Brohan E, Rose D, Sartorius N, Leese M, for the INDIGO Study Group. Global pattern of experienced and anticipated discrimination against people with schizophrenia: a cross-sectional survey. Lancet 2009; 373: 408–415.
7 Wall S, Hotopf M, Wessely S, Churchill R. Trends in the use of the Mental Health Act: England, 1984-96. BMJ 1999; 318: 1520–1.
8 van der Post LFM, Mulder CL, Peen J, Visch I, Dekker J, Beekman ATF. Social support and risk of compulsory admission: part IV of the Amsterdam Study of Acute Psychiatry. Psychiatr Serv 2012; 63: 577–83.
9 Keown P, Mercer G, Scott J. Retrospective analysis of hospital episode statistics, involuntary admissions under the Mental Health Act 1983, and number of psychiatric beds in England 1996-2006. BMJ 2008; 337: a1837.
10 Keown P, Weich S, Bhui KS, Scott J. Association between provision of mental illness beds and rate of involuntary admissions in the NHS in England 1988-2008: ecological study. BMJ 2011; 343: d3736.
11 de Jong MH, Kamperman AM, Oorschot M, Priebe S, Bramer W, van de Sande R, Van Gool AR, Mulder CL. Interventions to reduce compulsory psychiatric admissions: a systematic review and meta-analysis. JAMA Psychiatry 2016;73: 657–64.
12 Appleby J, Gregory S. NHS spending. Local variations in priorities: an update. King’s Fund, London, 2008.
13 Kirkbride JB, Jones PB, Ullrich S, Coid JW. Social deprivation, inequality, and the neighborhood-level incidence of psychotic syndromes in East London. Schizophr Bull 2014; 40: 169–80.
14 The NHS Information Centre. MHMDS Statistics: Data Quality and Methodology. 2011.
15 Weich S, McBride O, Twigg L, Keown P. Variation in compulsory psychiatric inpatient admission in England: a cross-sectional, multilevel analysis. Heal Serv Del Res 2014. 2: 49.
20
16 Rasbash, J., Steele, F., Browne, W.J., Goldstein, H. A user’s guide to MLwiN v2.26. Centre for Multilevel Modelling, University of Bristol. 2012.
17 Fielding A, Goldstein H. Cross-Classified and Multiple Membership Structures in Models: An Introduction and Review. Research Report RR791 for DfES. Department for Education and Skills, 2006.
18 Snijders TA, Bosker R. Multilevel Analysis: An Introduction to Basic and Advanced Multilevel Modeling (2nd Edition). London: Sage, 2012.
19 Larsen, K, Merlo J. Appropriate assessment of neighborhood effects on individual health: integrating random and fixed effects in multilevel logistic regression. American Journal of Epidemiology 2005. 161: 81-8.
20 Browne, W.J. MCMC Estimation in MLwiN v2.1. Centre for Multilevel Modelling, University of Bristol, 2009.
21 Spiegelhalter D, Best N, Carlin B, van der Linde A. Bayesian measures of model complexity and fit. Journal of the Royal Statistical Society Series B (Statistical Methodology) 2002; 64: 583-639.
22 Clarke P. When can group level clustering be ignored? Multilevel models versus single-level models with sparse data. J Epidemiol Community Health 2008; 62: 752–8.
23 Keown P, Tacchi MJ, Niemiec S, Hughes J. Changes to mental healthcare for working age adults: impact of a crisis team and an assertive outreach team. Psychiatrist. 2007; 31: 288-92.
24 Tyrer P, Gordon F, Nourmand S, et al. Controlled comparison of two crisis resolution and home treatment teams. Psychiatrist 2010; 34: 50–4.
25 Mental Health Act Commission. Count Me In 2008: Results of the 2008 National Census of Inpatients in Mental Health and Learning Disability Services in England and Wales. London: Commission for Healthcare Audit and Inspection. 2008.
26 Gajwani R, Parsons H, Birchwood M, Singh SP. Ethnicity and detention: are Black and minority ethnic (BME) groups disproportionately detained under the Mental Health Act 2007? Soc Psychiatry Psychiatr Epidemiol 2016; 51: 703–11.
27 Wicks S, Hjern A, Gunnell D, Lewis G, Dalman C. Social adversity in childhood and the risk of developing psychosis: A national cohort study. Am J Psychiatry 2005; 162: 1652–7.
28 Department of Health. KH03 Quarterly Bed Availability and Occupancy: Data Definitions. 2010.
29 Johnson S. Can we reverse the rising tide of compulsory admissions? Lancet 2013; 381: 1603-4.
21
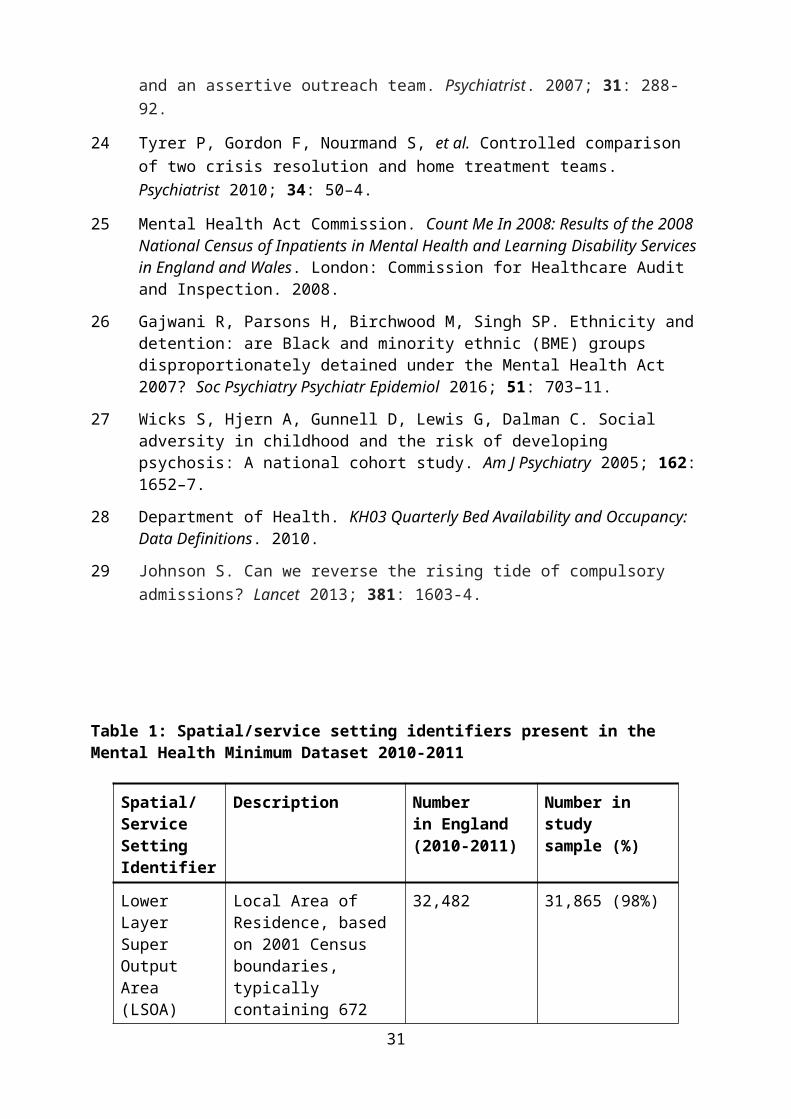
Table 1: Spatial/service setting identifiers present in the Mental Health Minimum Dataset 2010-2011
Spatial/Service Setting Identifier
Description Number in England (2010-2011)
Number instudy sample (%)
Lower Layer Super Output Area (LSOA)
Local Area of Residence, based on 2001 Census boundaries, typically containing 672 households and 1,614 residents
32,482 31,865 (98%)
GP Practice Primary Care Provider 10,203 9,492 (93%)
NHS Provider Trust
Provider of Secondary Mental Health Care
69 64 (93%)
Primary Care Trust (PCT)
Commissioner of Secondary Mental Health Care
152 146 (96%)
Strategic Health Authority (SHA)
Responsible for quality of all health care provision
10 10 (100%)
22
Table 2: Demographic characteristics of patients receiving secondary care mental health services during 2010/11 in the Mental Health Minimum Dataset
Service use status in 2010/11
Community care only
1,133,541 (91.5%)
Informal admission only61,732 (5.0%)
Compulsory admission
42,915 (3.5%)
Sex
Male 495,945 (43.7%) 31,739 (51.4%) 22,920 (53.4%)
Female 637,177 (56.2%) 29,972 (48.6%) 19,983 (46.6%)
Missing 419 (< 0.01%) 21 (< 0.01%) 12 (< 0.01%)
Age
<18 years 20,861 (1.8%) 620 (1.0%) 402 (0.9%)
18-35 years 296,268 (26.1%) 16,219 (27.5%) 13,874 (32.3%)
36-64 years 455,252 (40.2%) 26,401 (42.7%) 20,006 (46.6%)
≥65 years 361,078 (31.9%) 17,733 (28.8%) 8,633 (20.2%)
Missing 82 (< 0.01%) 759 (0.01%) 0 (0%)
Ethnicity
White 911,292 (80.4%) 53,747 (87.1%) 32,130 (74.9%)
Mixed 11,965 (1.1%) 789 (1.3%) 1,027 (2.4%)
Asian or Asian British 41,780 (3.7%) 1,993 (3.2%) 2,771 (6.5%)
Black or Black British 32,116 (2.8%) 2,168 (3.5%) 4,965 (11.6%)
Other ethnicity 19,992 (1.8%) 1,009 (1.6%) 1,052 (2.5%)
Missing 116,396 (10.2%) 2,026 (3.3%) 970 (2.1%)
23

Table 3: Results of four-level cross-classified null models
Model and levels Variance (se) % variation (95% CI) DIC statistic*
Model 1
322,505.7 Patient 3.29 84.5
LSOA 0.248 (0.008) 6.4 (6.0-6.8)
GP 0.075 (0.004) 1.9 (1.7-2.1)
PCT 0.280 (0.036) 7.2 (5.5-8.9)
Model 2
321,749.2 Patient 3.29 83.7
LSOA 0.264 (0.010) 6.7 (6.2-7.2)
GP 0.106 (0.005) 2.7 (2.4-2.9)
Provider Trust 0.271 (0.053) 6.9 (4.3-9.5)
Model 3
321,392.94 Patient 3.29 75.1
LSOA 0.280 (0.008) 6.4 (6.1-6.7)
PCT 0.271 (0.037) 6.2 (4.5-7.8)
Provider Trust 0.539 (0.104) 12.3 (7.7-17.0)
Model 4
324,247.78 Patient 3.29 79.8
GP 0.108(0.004) 2.6 (2.4-2.8)
PCT 0.230 (0.032) 5.6 (4.1-7.1)
Provider Trust 0.496 (0.096) 12.0 (7.5-16.6)
*DIC statistic estimated using complete cases only (n=1,149,541)
24

Table 4: Results of three-level (patient-LSOA-Provider Trust) cross-classified models
Level Covariates Null model Patient-level covariates (95% CI)
Patient-, LSOA-, and Trust-level covariates (95% CI)
Patient Sex Men 1.29 (1.27-1.31) 1.29 (1.27-1.31)Age Under 18 years 1.00 1.00
18-35 years 1.96 (1.85-2.07) 1.92 (1.82-2.02)36-64 years 1.83 (1.72-1.94) 1.79 (1.68-1.89)≥65 years 1.11 (1.00-1.22) 1.12 (1.02-1.22)
Ethnicity White 1.00 1.00Mixed 1.88 (1.81-1.96) 1.81 (1.74-1.88)Asian 1.53 (1.49-1.57) 1.41 (1.37-1.46)Black 3.11 (3.07-3.14) 2.94 (2.90-2.98)Other 1.06 (0.99-1.13) 1.00 (0.93-1.07)Missing 0.25 (0.18-0.31) 0.25 (0.18-0.32)
LSOA Deprivation (least to most deprived)1
First quintile 1.00Second quintile 1.14 (1.09-1.18)Third quintile 1.20 (1.16-1.24)Fourth quintile 1.21 (1.17-1.26)Fifth quintile 1.22 (1.18-1.27)
Population density(least to most densely populated)2
First quintile 1.00Second quintile 1.02 (0.97-1.07)Third quintile 1.04 (0.99-1.09)Fourth quintile 1.01 (0.96-1.06)Fifth quintile 1.01 (0.95-1.07)
Ethnic density(% white British inhabitants)3
95–100% 1.0081-94% 1.14 (1.10-1.18)68-80% 1.28 (1.23-1.34)22-67% 1.40 (1.34-1.46)1-21% 1.51 (1.43-1.59)
Provider Trust Bed capacity4 %occupied beds 1.01 (0.99-1.03)Length of stay5 Median stay
(days) 0.99 (0.98-1.01)
Community mental health services performance6
Worse than other Trusts
1.00
Same/Better than other Trusts
1.93 (1.39-2.48)
Missing 1.12 (0.21-2.03)Inpatient mental health services performance7
Worse than other Trusts
1.00
Same/Better than other Trusts
1.01 (0.56-1.45)
Missing 1.45 (0.66-2.24)PEAT8 Privacy and
dignity score1.18 (0.67-1.69)
Staff Survey9 %Staff satisfied with care
0.99 (0.97-1.02)
Hospital No. mental health 1.00 (1.00-1.00)
25
admissions10 admissionsTrust location London 1.00
Outside London 0.74 (0.32-1.17)Unexplained variance (SE)Patient 3.29 3.29 3.29LSOA 0.323 (0.009)** 0.284 (0.007)** 0.283 (0.008)Provider Trust 0.271 (0.051)** 0.213 (0.039)** 0.195 (0.045)%Unexplained variance (VPC)†(95% CI)Patient 84.7 86.9 87.6LSOA 8.3 (7.9-8.8) 7.5 (7.1-7.9) 7.5 (7.1-7.9)Provider Trust 7.0 (4.4-9.6) 5.6 (3.6-7.6) 5.2 (2.8-7.5)MOR‡ (95% CI)LSOA 1.94 (1.90-1.97) 1.86 (1.83-1.88) 1.86 (1.82-1.89)Provider Trust 1.83 (1.66-2.06) 1.71 (1.57-1.90) 1.67 (1.51-1.85)
† Variance partition coefficient‡ Mean odds ratio
1. English indices of deprivation 2010: Department for Communities and Local Government.2. Mid-2010 population estimates: Office for National Statistics.3. 2011 Census aggregate data: Office for National Statistics. 4. Beds Open Overnight: Department of Health.5. Hospital Episodes Statistics: Department of Health.6. NHS Community Mental Health Service User Survey, 2011: Care Quality Commission.7. Mental Health Acute Inpatient Service Users Survey, 2009: Healthcare Commission.8. Patient Environment and Action Team (PEAT) scores, 2010: Health and Social Care Information Centre.9. NHS Staff Survey, 2010: Care Quality Commission.10. Hospital Episodes Statistics: Department of Health.
26
Supplementary Material
External data sources linked to patient-level MHMDS records
Data Source Measure Level Time Frame
URL Reference
Department for Communities and Local Governments’ English Indices of Deprivation
Deprivation LSOA 2010 https://www.gov.uk/government/statistics/english-indices-of-deprivation-2010
Office for National Statistics’ Mid-2010 Population Estimates
Population density LSOA 2010 http://webarchive.nationalarchives.gov.uk/20160105160709/http://www.ons.gov.uk/ons/rel/sape/soa-mid-year-pop-est-engl-wales-exp/mid-2002-to-mid-2010-revised/stb---super-output-area-population-estimates--mid-2002-to-mid-2010--revised-.html
Office for National Statistics’ 2011 Census Estimates
Ethnic density LSOA 2011 http://infuse.ukdataservice.ac.uk/
Department of Health’s Beds Open Overnight (BOO) Data
Available and occupied mental health beds
Provider Trust
2010/11
https://www.england.nhs.uk/statistics/statistical-work-areas/bed-availability-and-occupancy/bed-data-overnight/
Department of Health’s Hospital Episode Statistics (HES)
Median length of stay;Number of mental health hospital admission episodes
Provider Trust
2010/11
http://digital.nhs.uk/catalogue/PUB02570
NHS Community Mental Health Service User Survey
Performance on a variety of domains including health and social care workers, medication, helpfulness of talking therapies, care plan management, crisis care and day-to-day living
Provider Trust
2011 http://www.nhssurveys.org/surveys/515
27

Healthcare Commission’s Mental Health Acute Inpatient Service Users Survey
Performance on a variety of domains including ward accommodation, staff communication, medications and treatment and patient rights
Provider Trust
2009 http://dx.doi.org/10.5255/UKDA-SN-6421-1.
Health and Social Care Information Centre’s Patient Environment and Action Team (PEAT) Scores
Performance in patient safety in the following areas: environment, food, and dignity and respect
Provider Trust
2011 http://www.nrls.npsa.nhs.uk/patient-safety-data/peat/
NHS Staff Survey Performance on workplace environment including workloads, training, staff communication, health and well-being
Provider Trust
2010 http://www.nhsstaffsurveys.com/Page/1023/Past-Results/Staff-Survey-2010-Detailed-Spreadsheets/
28
Supplementary material
Multilevel modelsA multilevel model (MLM), also known as a hierarchical model, is a statistical model designed to work with data that is clustered or grouped. For example patients may be grouped in residential neighbourhoods and also within treatment centres or hospitals which, in turn, may be grouped within geographical regions or management areas. MLMs capture the complexity of factors that influence (health) outcomes across these different levels or contexts. For example, individual characteristics or personal traits (e.g. age, gender, behaviours) may influence an individual’s risk of poor health but health may also be influenced by the characteristics of residential neighbourhood such as the area’s socio-economic deprivation profile, population density, pollution levels or social and cultural norms. Similarly, hospital characteristics and regional governance structures may influence the quality and level of care that any one patient receives. Multilevel modelling approaches ensure that the influence that each of these levels has on the outcome is modelled correctly and their relative effects are not conflated. Furthermore, the models can also acknowledge that the association between an outcome and an explanatory variable might vary according to different types of context or settings. For example, the strength and direction of the relationship between (say) ethnicity and mental health at the individual level may vary according to neighbourhood deprivation.
The variance or heterogeneity in any particular outcome can also be apportioned across the different levels and comparisons can be made between a null (or empty) model and subsequent models which contain explanatory variables. This is similar in concept to observing the changes in the R2 statistic in an ordinary regression model whereby the value (usually expressed as a percentage) estimates how much of the original variation in the outcome variable has been explained by one or more of the explanatory variables. In models where the outcome is categorical, the calculation of R2 is more problematic and a number of alternative approaches can be used to approximate this. For a full description of their application in MLMs, see (1).
Importantly, MLMs acknowledge that individuals nested or clustered within any one group are more likely to behave similarly and observations are therefore not independent. Standard errors around modelled estimates are adjusted in MLMs to take this clustering into account. A good introduction to MLM is provided by (2) and (3). Excellent tutorial material and information on software to run multilevel models can be found on the website for the Centre for Multilevel Modelling at the University of Bristol (www.bristol.ac.uk/cmm).
Markov Chain Monte Carlo (MCMC) Bayesian estimation Parameter estimates (ie constants, gradients and variances) in multilevel models can be generated using traditional frequentist maximum likelihood methods or via Bayesian MCMC approaches. The latter have many advantages when outcomes are categorical, model structures are complex and when there are only a few higher level units.
In frequentist approaches the sample of data is just one from all the infinite number of samples that could have been selected. Model parameters are estimated with the goal of having as close fit to the data as possible (maximum likelihood) and the standard error of estimates may be used to infer characteristics of the population. Usually a significance value (p value) is used to indicate the likelihood that the finding was not due to random (chance) variation (ie what the data can reveal about the sample and the population from which it was
29
derived), and a confidence interval may also be calculated. This interval specifies the range of values within which a population parameter will be found within a given level of probability. Importantly a frequentist approach does not take into account any prior beliefs about the parameter values. By contrast, a Bayesian approach is not concerned with the idea of samples drawn from hypothetical populations but instead builds sequences of models which incorporate ‘prior’ knowledge into the process of estimating likely values of the resultant ‘posterior’ estimates (ie the posterior distribution). These posterior estimates are then used as the prior knowledge in each of the subsequent iterations of the model. With a Bayesian approach the results are scrutinised in terms of the degree of support for a particular parameter given the data and these prior beliefs. Bayesian models can be run with a high degree or low belief in a prior value. For example, results from previous well established research could be used to provide priors with strong support. Alternatively if there was reason to have less faith in a particular prior then this could also be taken into account (known as diffuse or flat priors) and the number of model runs (iterations) would be increased.
Bayesian methods are computationally intensive and Markov Chain Monte Carlo estimation is the sampling engine used to generate a distribution of estimates for each parameter (ie the posterior distribution).1 Rather than generating a point estimate with its associated standard error and p value (as in the frequentist approach), this posterior distribution is used to derive model results. The modal value will represent the most common draw across the iterations (ie across the simulations) and the 95% credible interval (the Bayesian alternative to a confidence interval) around this modal value can be found at the 2.5% cut-offs when the values are ranked. Unlike a frequentist confidence interval, a Bayesian credible interval applies to the parameter and not the data. It indicates the range within which the parameter falls, at the 95% level of probability. The use of p values is not appropriate because the Bayesian approach estimates the likely values of the resultant posterior estimates (i.e. the posterior distribution) rather than testing null hypotheses.
When models and data structures are very complex, the number of MCMC iterations (the ‘chain length’) required to find acceptable parameter estimates may be very large and models may run for several hours or even days. MLwiN (4) provides a number of prospective and retrospective diagnostic measures which can be used to inform the chain length and evaluate the results of the MCMC process. These are fully documented elsewhere (5) but a summary of some key diagnostics are given below.
First a ‘burn-in’ period of runs is used to establish starting values for the parameter estimates after which a chain length of several thousand iterations are used to create the posterior distribution of the estimates. Results from the burn-in may be unstable and so they are not included in the posterior distribution.
A trace graphic (ie the value of the estimate at each iteration plotted in sequence) should exhibit random noise and not show any trending or ‘stickiness’ (ie blocks of very similar values) which would suggest that the chain length is insufficient and more runs are needed to generate stable estimates. 1 There are many different MCMC algorithms. MLwiN, for example uses a combination of Gibbs sampling and Metropolis-Hastings sampling. A more detailed description of how they work and their application is given by (5).
30
The ‘stickiness’ of the values can also be assessed via the autocorrelation function which provides the correlation between the trace values and the trace values lagged by 1,2 etc. Whilst a degree of autocorrelation is to be expected in the initial runs of the model, this should eventually head towards zero.
The Raftery-Lewis diagnostic indicates the chain length (Nhat) required to estimate a specific quantile of the posterior distribution to a stated level of tolerance and precision (6). This is therefore a useful prospective diagnostic to help set the chain length (ie the number of simulations required by the model). Similarly the Brooks-Draper diagnostic indicates the required simulations to provide the posterior mean to a stated level of precision and confidence (5).
References1. Goldstein H, Browne W, Rasbash J. Partitioning variation in multilevel models. Underst
Stat. 2002;1(4):223. 2. Goldstein H. Multilevel Statistical Models, 4th edition. Chichester: John Wiley & Sons;
2011. 3. Snijders TAB, Bosker RJ. Multilevel analysis : an introduction to basic and advanced
multilevel modeling. SAGE; 2011. 4. Charlton C, Rasbash J, Browne W., Healy M, Cameron B. MLwiN Version 3.00. University of
Bristol: Centre for Multilevel Modelling; 2017. 5. Browne WJ. MCMC estimation in MLwiN Version 3.00. Centre for Multilevel Modelling,
University of Bristol; 2017. 6. Raftery AE, Lewis S. How many iterations in the Gibbs sampler? In: Bernado J, Berfer J,
Dawid A, Smith A, editors. Bayesian Statistics. Oxford: Oxford University Press; 1992. p. 763-773.
31