Embed Size (px)
DESCRIPTION
OTC
Citation preview
i /,zl ELSEVIER 0 9 5 1 - 8 3 3 9 ( 9 4 ) 0 0 0 2 1 - 2
Marine Structures 9 (1996) 21 !-257 Elsevier Science Limited Printed in Great Britain.
0951-8339/96/$9.50
Experimental and Theoretical Studies in Subsea Pipeline Buckling
Neil Taylor & Vinh Tran
School of Construction, Sheffield Hallam University, Sheffield, UK
(Received 18 November 1993; revised version received 7 August 1994; accepted 26 September 1994)
ABSTRACT
Field failures of trenched and/or buried subsea pipelines due to in-service buckling have recently been admitted in literature. Herein presented are the results of a recently completed series of model tests involving full thermo- mechanical system representation. The problematical vertical buckling mode, applicable to trenched and/or buried subsea pipelines, is considered in terms of both isolated prop and contact undulation imperfection topolo- gies. Experimental data is compared with that obtained from a suite of computer-based theoretical models. It is contended that highly satisfactory experimental/theoretical correlation is provided regarding definition of the crucial upheaval buckling state subject to adequate imperfection specifica- tion.
Key words: subsea pipelines, trenched, buried, in-service, buckling, imperfection, upheaval.
A D E F Fo. I
NOTATION
Cross-sectional area Pipe diameter Direct modulus Shear force at prop Anchor shear capacity Second moment of area of cross-section
211
212 N. Taylor, V. Tran
L Lfap
L i
Lo Ls Lu Mx N P Po
Pu T 7' V kl, k2 n
P q t uy Us
V
Vi~ Vo
Vm
Vom
V, x
X
O~
OA t~ ay #
Buckle length Anchorage spacing Buckle length of the prop imperfection topology Buckle length of the contact undulation imperfection topology Slip length Buckle length at upheaval state Bending moment Maximum bending moment Buckle force Pre-buckling force Buckle force at quasi-idealised state Buckle force at upheaval Temperature Pressure-equivalent temperature rise Potential energy Characteristic coefficients v/P/E1 Internal pressure rise Submerged or otherwise self-weight of pipeline per unit length Wall thickness of pipe Resultant flexurally induced end shortening Resultant longitudinal movement at buckle/slip length interface Vertical displacement of the pipe Vertical displacement of the imperfection topologies Maximum vertical amplitude of the buckled pipe Maximum vertical amplitude of the imperfection topology dv/dx etc Spatial coordinate Coefficient of linear thermal expansion Axial friction coefficient Empathetic coefficient Limiting linear stress Poisson's ratio
INTRODUCTION
The development of marginal offshore fields in the North Sea has led to the employment of smaller bore subsea pipelines, subject to seabed tren- ching and/or burial for protection, for hydrocarbon transport. Given the ability of the pipeline/seabed interface to generate the necessary frictional resistance to axial movement, a subsea pipeline laid at ambient tempera-
Subsea pipeline buckling 213
ture and subsequently employed to carry high temperature oil or gas under pressure is thereby subject to the institution of axial compressive forces caused by the constrained thermal and pressure actions and buck- ling can ensue.l-3
Trenching and/or burial largely obviate lateral mode buckling 4-6 so that resistance to (vertical) displacement of the pipe is provided by the pipe's weight, :its flexural stiffness and the resistance of any overburden or cover. Conversely, vertical or upheaval buckling is triggered by localised imper- fections producing overbend singularities. Of crucial importance is the upheaval state, i.e. when the pipeline lifts off t he imperfection and becomes exposed to additional risk.
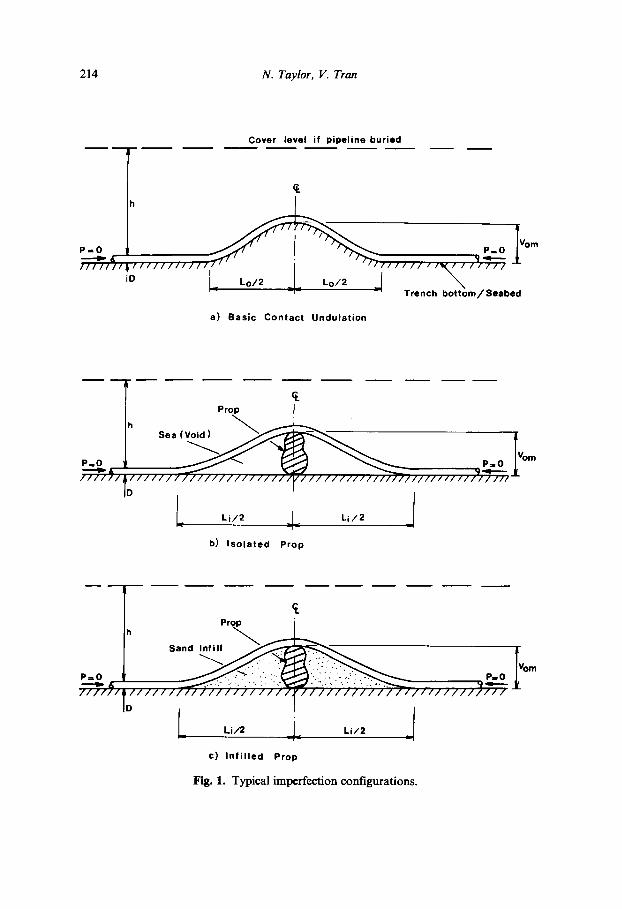
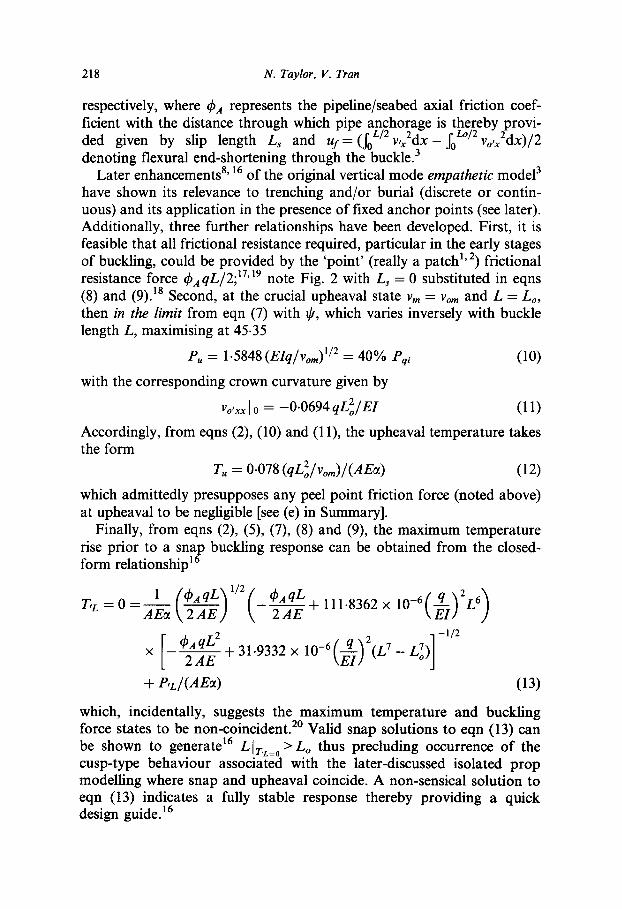
Three basic types of initial imperfection (i.e. axial compression P = 0) can be identified as illustrated in Fig. 1. In the first case, the pipeline remains in continuous contact with some distinct vertical undulation in an otherwise idealised horizontal and straight line, although the latter will clearly be subject to some uneveness of profile of lesser degree in practice. The isolated prop alternatively features a sharp vertical irregularity such that voids (sea-filled) exist to either side. The prop represents the under- crossing of a non-parallel pipe or the presence of an intervening rock; stop-start trenching procedures can also be responsible. The third case occurs where the above voids become infilled with leaching sand and represents a special sub-case of the first. The initial imperfection is deno- ted by amplitude Vom and wavelength Lo or L; as shown. Whilst L; is determined from simple statics, Lo is subject to individual engineering judgement. 3
Although theoretical studies of upheaval buckling have been avail- able in literature for more than a decade, experimental programmes have, to date, been largely restricted to those required for the provi- sion of necessary empirical data. Experiments have focussed upon the geotechnical/structural interface characteristics associated with pull-out and friction tests. 6-9 Full thermo-mechanical pipeline buckling experi- mentation is both complex and cost ly--prototype field parameters include Li (Fig. 1) occupying approximately 24 m 1° whilst buckling can typically affect up to 100m of pipe. 6 Following the recent disclo- sure of in-service fa i lu res 4'10'11 a number of full system experimental programmes have been established 12'13 and herein presented are the results of a series of model tests involving both isolated and infilled prop technologies--recall Fig. 1. These results are compared with the respective output from an in-house developed suite of computer-based theoretical models. As theory dictates the structure of an experi- ment, 14 these models will now be briefly described and the key factors identified.
214 N. Taylor, V. Tran
Cover level if pipeline buried
P-O l / I / / / / / / / / / I I I / / / / / ~ / / I I / / /
D L Lo/2 Lo/2 J \ ,_ 311 a) Saslc Contact Undulation
~ m Trench bottom/Seabed
"'""t'""
Prop I
Sea IV ° P.O P=O m .~D& y -me---
/ / / / / / / / / / / / / / / / / ~ / / / / / / / / / / / / / / / / / / / / / I / I / / / / / / / /
b) Isolated Prop
P=O iI h
"~'~" b
/ / / / / / T ~ / / / /
Pr~,,x
Sand Infill
/ / / / / / / / / / / / / / /
L I
Li/2 _ Lil2 . i
c) Infilled Prop
Fig. l. Typical imperfection configurations.
Subsea pipeline buckling 215
THEORETICAL PROPOSITIONS
Fundamentals
A discrete model is available for each of the three configurations illu- strated in Fig. 1. All models presume system symmetry and seabed/ trench-bottom rigidity, together with relatively small deformations and linear elastic properties. Overall, each model's formulation includes interpreting the in-service, internally generated temperature and pres- sure rises over ambient suffered by the pipe, T and p respectively, in terms of the so-called pre-buckling force Po by means of the familiar expression 1-3,15
Po = AE~ T + (0.5 - #)ApD/(2t) (1)
where A denotes the net cross-sectional area of the pipe of outer diameter D and wall thickness t, whilst E and # are the appropriate direct modulus and Poisson's ratio respectively with ~ denoting the respective coefficient of linear thermal expansion. Merging the known action parameters T and p leads to computational convenience such that eqn (1) can be written
Po = A E e ( T + T') (2)
where T' = pD(0.5 - #)/(2Eet) ..~ pD/(24t) for typical material values in N mm units. Herein, action T alone is thereby considered, with pressure- equivalent T' to be applied as a back-end reduction as necessary.
Additionally, each model possesses longitudinal equilibrium and compatibility statements, problem definition being completed by means of individual buckling/flexural relationships.
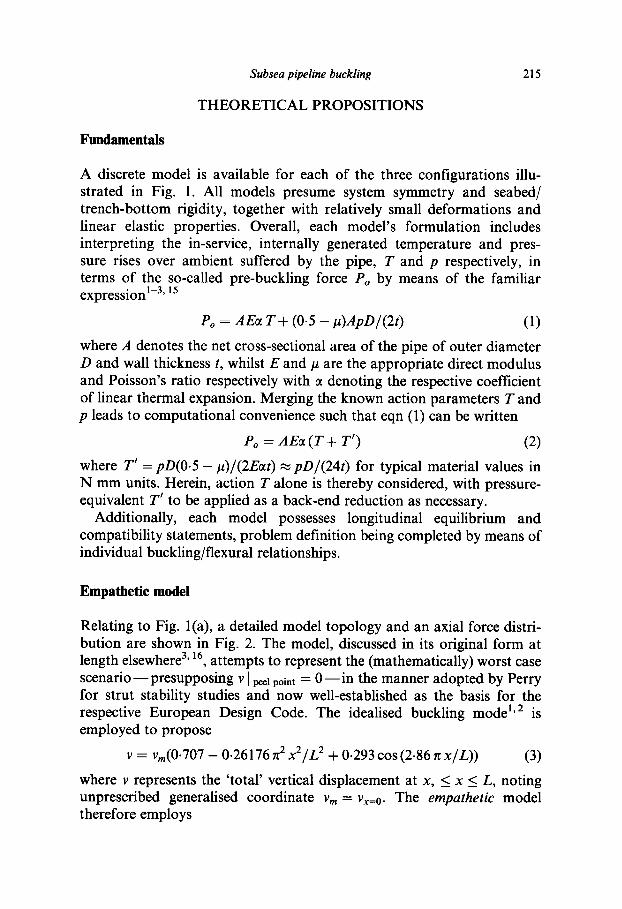
Empathetic model
Relating to Fig. l(a), a detailed model topology and an axial force distri- bution are shown in Fig. 2. The model, discussed in its original form at length elsewhere 3' 16, attempts to represent the (mathematically) worst case scenario-- presupposing v [ peel p o i n t : - 0 - - in the manner adopted by Perry for strut stability studies and now well-established as the basis for the respective European Design Code. The idealised buckling mode l'a is employed to propose
v = Vm(0"707 -- 0.26176rr2x2/L a + 0 .293cos (2 .86nx /L ) ) (3)
where v represents the 'total' vertical displacement at x, < x < L, noting unprescribed generalised coordinate Vm = Vx=o. The empathetic model therefore employs
t-..)
q -T~
r..
Buc
kle
v "~
P
eel
poin
t (v
=V
,x =
V,x
x =
0)
m-
om
~.
u=O
-v°
"-.
0
= //
1/1/
/ll/
////
////
////
////
////
////
////
//fI
r 11
1111
~lT
-III
l/ll
llll
llll
llll
tlll
ll/l
lll
"='--
~q
L/2
~ =x
qL
/2,~
.
..
..
L
~,q
L/2
~._
I _
L ._
Lo/2
--
_I
_ Lo
/2
J ..
~
eAqL
/' Ls
_I..
_,~
L/2
J~
L/2
~ LS
~[
(a)
Top
olog
y
Po
J C
AqL
/2
Po
/ _
_
Pre
-bu
ckli
ng
pr
est,
ress
~
._
(b)
Axi
al
For
ce
Dis
trib
uti
on
Fig.
2.
Fully
mob
ilise
d po
st-b
uckl
ing
empa
thet
ic im
perf
ectio
n m
odel
ling
(ver
tical
mod
e).
Subsea pipeline buckling 217
Vo =: Vom (0-707 -- --0-26176 ~ 2 x2/L2 o + 0.293 cos (2"86~x/Lo)) (4)
where vo denotes imperfection displacement above the horizontal datum surface at x, 0 < x < Lo, with Vom = vo Ix=o, in conjunction with the unique amplitude/wavelength relationship also originating from idealised studies 1-3,
Vom/t4o : 2.407 x 10 -3 q / E l = vm/L 4 (5)
where q denotes the pipe's submerged self-weight (or effective download) per unit length and I represents the pipe's cross-sectional second moment of area. The specific or ernpathetic relationship between eqns (3), (4) and (5) involves the imperfect pipe adopting an idealised, buckled amplitude/ wavelength profile at zero axial compression thereby directly reducing resistance to buckling.
Accordingly, the datum (i.e. ambient) state conservatively considers the curved pipe, bearing directly onto the contact undulation, to be stress-free when initially de formed- - i . e , when maintaining an amplitude of Yon under zero axial compression (P = 0). From Fig. 2, therefore, the pipeline is taken to be gradually heated above ambient with initial upheaval or lift- off, i.e. Vm > Yore, occurring at some value of axial compression within the pipe P = Pu, with post-upheaval buckling occurring for P > P u . The empathetic pre- and post-buckling deformation states adopt common modal forms as noted above, v lx <_= Lo > Vo occur simultaneously at uphea- val. The buckling mode 3' 16 employs a potential energy (lO formulation for L > Lo with equilibrium states given by V, Vm = 0 to yield
4 5 . 3 6 3 E I v m / L 3 - ~ P E I v o m / ( L L 2 o ) + O . O 7 3 q L - O . 9 3 6 P v m / L = O (6)
where kv : - f ( L , Lo), a complex, dimensionless function formally defined in previous study 3. In accordance with the requirements of the potential energy theorem, eqn (5) is not employed within V. Substituting eqn (5) into the characteristic eqn (6) therefore yields the pipe buckling force 3
P = Pqi(1 - ~(Lo - L)2/75"6), L > Lo (7)
with Pqi = 8 0 " 7 6 E I / L 2 = 3"962(EIq/vm) 1/2 denoting the corresponding idealised buckle force value at any buckle length L > Lo 1' 2.
Presuming fully mobilised friction resistance 1'2' 17 to be developed, the model definition is completed by means of the longitudinal equilibrium and compatibility expressions
Po - P = dPA q L / 2 + dp A qLs (8)
and
(Po - P ) L / 2 A E + d? A qL~/2 A E - uf = 0 (9)
218 N. Taylor, V. Tran
respectively, where ~bA represents the pipeline/seabed axial friction coef- ficient with the distance through which pipe anchorage is thereby provi- ded given by slip length Ls and uf= (foL/2V,x2dx - fo~/2Vo,x2dx)/2 denoting flexural end-shortening through the buckle. 3
Later enhancements 8' 16 of the original vertical mode empathetic model 3 have shown its relevance to trenching and/or burial (discrete or contin- uous) and its application in the presence of fixed anchor points (see later). Additionally, three further relationships have been developed. First, it is feasible that all frictional resistance required, particular in the early stages of buckling, could be provided by the 'point' (really a patch 1' 2) frictional resistance force q~aqL/2; 17'19 note Fig. 2 with Ls = 0 substituted in eqns (8) and (9). 18 Second, at the crucial upheaval state Vm = Vom and L = Lo, then in the limit from eqn (7) with ~, which varies inversely with buckle length L, maximising at 45-35
eu = 1-5848 (EIq/vom) 1/2 = 40% Pqi (10)
with the corresponding crown curvature given by
Vo,xx I o = -0.0694 qL2o/EI (11)
Accordingly, from eqns (2), (10) and (11), the upheaval temperature takes the form
Tu -- 0.078 (qZ2o/Vom)/(.4Ecx) (12)
which admittedly presupposes any peel point friction force (noted above) at upheaval to be negligible [see (e) in Summary].
Finally, from eqns (2), (5), (7), (8) and (9), the maximum temperature rise prior to a snap buckling response can be obtained from the closed- form relationship 16
I : ( P A q L ~ I / 2 ( d?AqL ( ~ / ) 2L6 ) T,L = 0 =-~-d~ \ 2 A E J 2 A----E + 111-8362 x 10 -6
[ dpAqL2 lO-6(._q_q'~2(L7 - L7o)] -1/2 x 2AE q- 31.9332 x \ E l l
+ P,L/(AE~) (13)
which, incidentally, suggests the maximum temperature and buckling force states to be non-coincident. 2° Valid snap solutions to eqn (13) can be shown to generate 16 LIrL= ° >Lo thus precluding occurrence of the cusp-type behaviour associated with the later-discussed isolated prop modelling where snap and upheaval coincide. A non-sensical solution to eqn (13) indicates a fully stable response thereby providing a quick design guide. 16
Subsea pipeline buckling 219
Isolated prop model
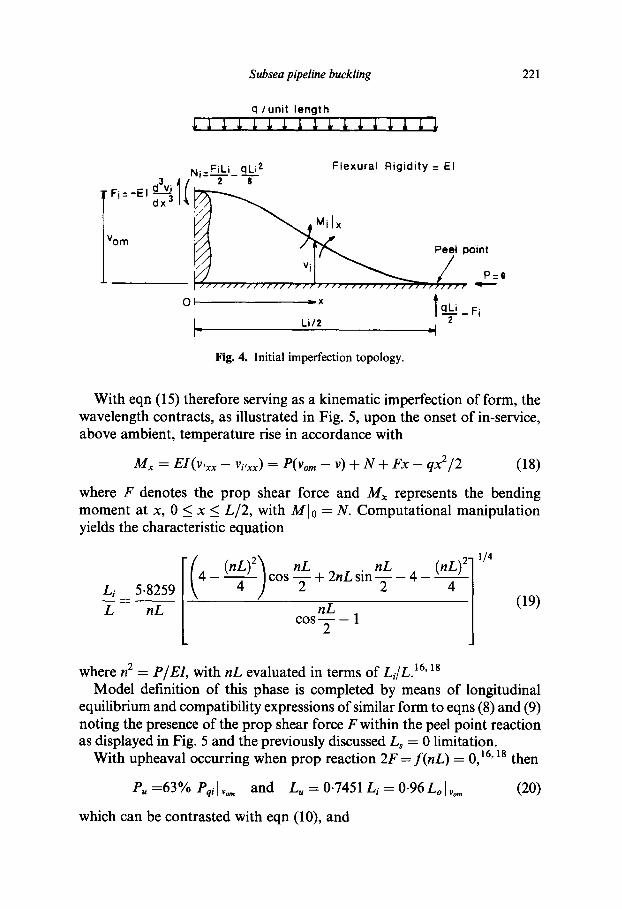
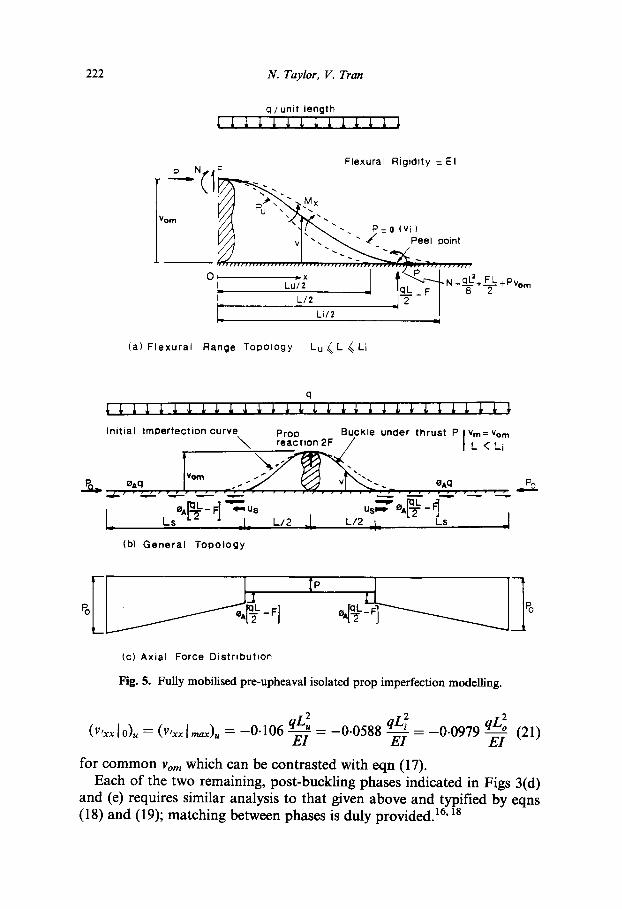
The rather more complex behavioral history suggested in Fig. 3 serves to illustrate the key states or phases of the isolated prop configuration, former studies' assumptions 6'21 regarding which have recently been questioned 16'1s'22 as noted below. The datum state shown in Fig. 3 refers to the as-laid initial, imperfect lie whilst the attendant voids permit pre-buckling flexural movement of the pipe to occur under in- service temperature and pressure cyclic actions, this activity thereby serving as an energy release mechanism. Upheaval is deemed to occur when wavelength L has reduced from L = L i to some value L = Lu whereupon wavelength reduction is reversed, growing until thermal action :is ceased or model limitations upon deformation magnitudes or constitutive properties are reached. In addition to the static determi- nation of Li in terms of imperfection amplitude Vo,,,, equations for longitudinal equilibrium and compatibility together with an appropriate buckling/flexural expression are required for each of the phases (c), (d) and (el) shown in Fig. 3. Noting the details of Fig. 4 together with boundary conditions
Vi I Li/2 = Vitx ]Li/2 ~" Vi'xx [Li/2 = Vi'x 10 = 0 (14)
where vi denotes initial vertical deflection (vii0 = Vom), then statics affords
vi = q(2 Li[Li/2 - x] 3 - 3[Li/2 - x]4)/(72 EI) (15)
and L; = 5 . 8 2 5 9 (VornEI/q) 1/4 (16)
together with the initial crown curvature being given by
Vexx [0 = v,,xx I,,~x = -0-0417 qL~/(EI) (17)
Whilst the foregoing is hardly contentious, being widely avail- able,6.16,18,21, 22 the role of the implied flexural stressing typified by Milx in Fig. 4 has recently been investigated. 16'18 Its inclusion within any ensuing upheaval study, note below, first suggests acceptance of a previous, fictitious stress-free-when-straight datum state and, second, thereby reduces such analysis 6'21 into effectively replicating established idealised study. 1'2 Furthermore, interpreting Milx as being only a component of residual stress in the as-laid state, other components involving fabrication and laying operations, 23 then thermal stress-reliev- ing under in-service conditions must be considered. 5 Given the foregoing, the conservative assumption Milx = 0 is thereby made in the absence of definitive, field residual stress data, i.e. the familiar stress-free-when-
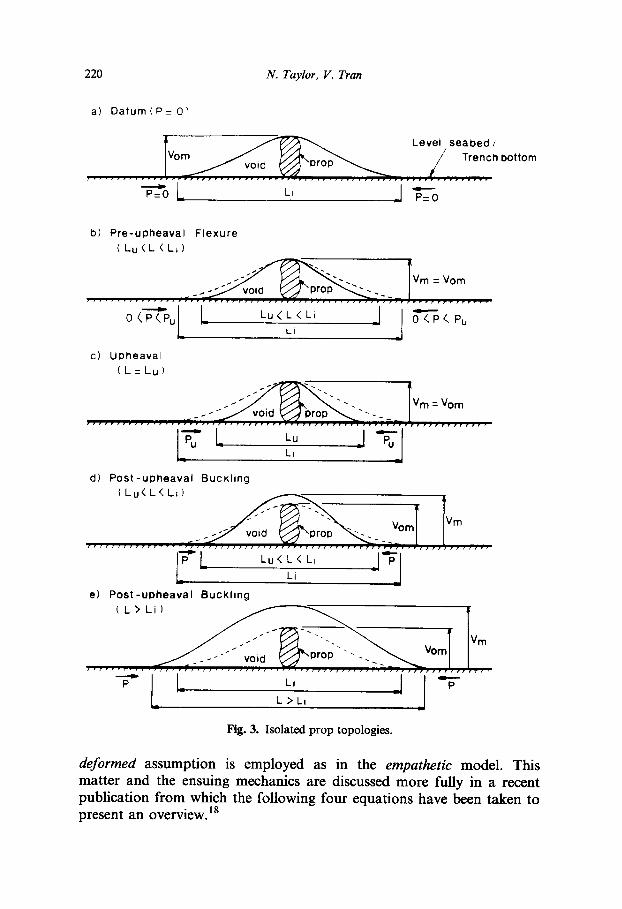
220 N. Taylor, V, Trmz
a) Datum(P_- O!
~ Level seabed/ Vom Trench bottom
b) Pre-upheaval Flexure (Lu<L ~,Li)
A
oG-~u L _L ~u<L<L,Li J O<~--P(Pu c) Upheaval
(L=Lu)
.... - ~ vo,o ~"..,J prop ~,,,.~= - -. _ - I
._ Li
d) Post-upheaval Buckling ( Lu< L< Li)
t r / I , , r t r r , / , ' . ' r " " I t I r I r l / I I r I , / r i r v l r r r t , , , t , , i i r ~ , , , ~ r , , l / r r , r r , , , ,
I-~L ,I cJ Lu<L<Li
L - Li
e) Post-upheaval Buckhng
(L>L i ) ~ 1 1
- L d i - P L Li p L>Li
Fig. 3. Isolated prop topologies.
deformed assumption is employed as in the empathetic model. This matter and the ensuing mechanics are discussed more fully in a recent publication from which the following four equations have been taken to present an overview. 18
Subsea pipeline buckling
c l /un i t length
221
Ni= .~ . i ClLi z Ftexural Rigidi ty = El
×
V°m 1/.-~ " T ~ Peel point
OI = x l q L i - F i [__ Li/2 -2- t- '-I
Fig. 4. Initial imperfection topology.
With eqn (15) therefore serving as a kinematic imperfection of form, the wavelength contracts, as illustrated in Fig. 5, upon the onset of in-service, above ambient, temperature rise in accordance with
Mx = EI(v,xx - Vi,xx) = P ( v o m - v ) q - N + Fx - qx2/2 (18)
where F denotes the prop shear force and Mx represents the bending moment at x, 0 < x < L/2, with MI0 -- N. Computational manipulation yields the characteristic equation
Li 5.8259 L nL
.(4 - n~ 2.) nL nL (nL) 2"
( ) c o s - ~ - + 2nLsin-~ 4 4
nL c o s y - 1
1/4
(19)
where n 2 = P/E1, with nL evaluated in terms of Li/L. 16" 18 Model definition of this phase is completed by means of longitudinal
equilibrium and compatibility expressions of similar form to eqns (8) and (9) noting the presence of the prop shear force F within the peel point reaction as displayed in Fig. 5 and the previously discussed Ls = 0 limitation.
With upheaval occurring when prop reaction 2F = f(nL) = 0,16' is then
Pu =63% Pqilvom and Lu = 0.7451L; = 0"96Lol,om (20)
which can be contrasted with eqn (10), and
222 N. Taylor, V. Tran
Q/unit length L I J, ,~ J, ~ J, J, L J, J, J, J, ;
Fiexural Rigidity =El
~ MX
~ ' ~ . P=0 (vi) v l ' ' , . ~ , Pe :. point
E L/2 I ~ I
(a) Flexural Range Topology Lu.~L ~Li
Po~
q
Initial ImDertectioncurve Prop BucKle under thrust P lVm=Vo m react,on 2F / I L <Li T.-
oAq - . - . . eAq t , . , , . . . . . . . . . . . . . . . . .
" = u, us--" L Ls eA--'~-~'L F] J_ L/2 J_ L/2_L Ls _]
(b) General Topology
(c) Axial Force Distribution
Fig. 5. Fully mobifised pre-upheaval isolated prop imperfection modelling.
qL2i qL2o (V,xx 10)u = (V,xx I,,~x), = - 0 . 1 0 6 qL2u - 0 . 0 5 8 8 = - 0 . 0 9 7 9 (21) E1 = ~ --El
for c o m m o n l~om which can be contrasted with eqn (17). Each o f the two remaining, post -buckl ing phases indicated in Figs 3(d)
and (e) requires similar analysis to that given above and typified by eqns (18) and (19); match ing between phases is duly provided. 16,18
Subsea pipeline buckling 223
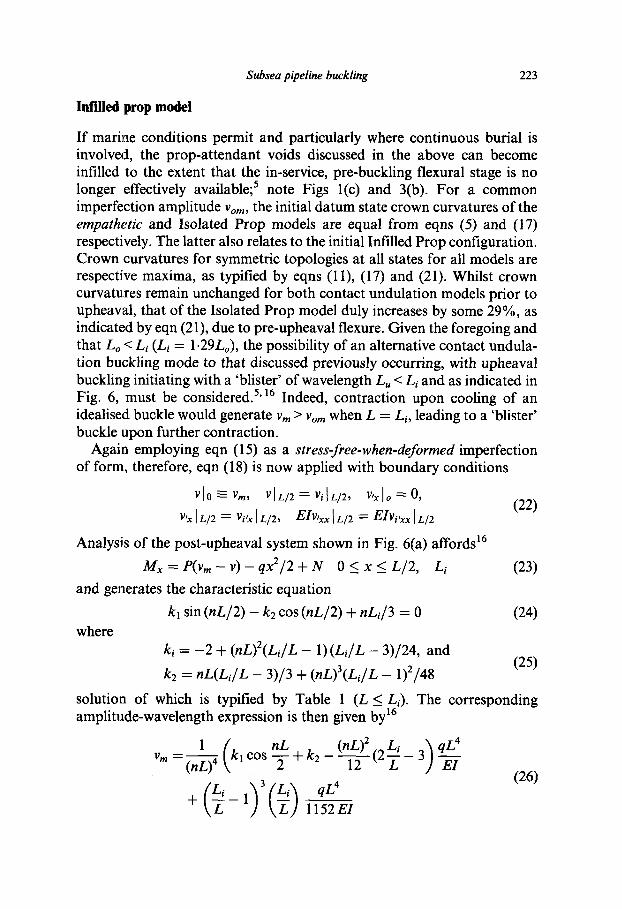
Intilled prop model
If marine conditions permit and particularly where continuous burial is involved, the prop-attendant voids discussed in the above can become infilled to the extent that the in-service, pre-buckling flexural stage is no longer effectively available; 5 note Figs l(c) and 3(b). For a common imperfection amplitude Vom, the initial datum state crown curvatures of the empathet ic and Isolated Prop models are equal from eqns (5) and (17) respectively. The latter also relates to the initial Infilled Prop configuration. Crown curvatures for symmetric topologies at all states for all models are respective maxima, as typified by eqns (1 I), (17) and (21). Whilst crown curvatures remain unchanged for both contact undulation models prior to upheaval, that of the Isolated Prop model duly increases by some 29%, as indicated by eqn (21), due to pre-upheaval flexure. Given the foregoing and that Lo < Li (L; = 1.29Lo), the possibility of an alternative contact undula- tion buckling mode to that discussed previously occurring, with upheaval buckling initiating with a 'blister' of wavelength Lu < Li and as indicated in Fig. 6, must be considered. 5' 16 Indeed, contraction upon cooling of an idealised buckle would generate Vm > Vo,,, when L = Li, leading to a 'blister' buckle upon further contraction.
Again employing eqn (15) as a stress-free-when-deformed imperfection of forrn, therefore, eqn (18) is now applied with boundary conditions
vl0- vlL/2 = villi2, v,xlo =0, (22)
V,xlL/2 = Vi'xlL/2, Etv,xx ILl2 = EIvi,xx I L/2
Analysis of the post-upheaval system shown in Fig. 6(a) affords 16
Mx = P(vm - v) - qx2/2 + N 0 < x < L / 2 , L i (23)
and generates the characteristic equation
kl sin (nL /2 ) - k2 cos (nL /2 ) + nL i /3 = 0 (24) where
k, = - 2 + (nL)2(L i /L - 1) ( L i / L - 3)/24, and
k2 = n L ( L i / L - 3)/3 + (nL)3(L i /L - 1)2/48 (25)
solution of which is typified by Table 1 (L < L/). The corresponding amplitude-wavelength expression is then given by 16
1 ( nL (nL)2 ~ ) q L 4 vm - (nL) 4 kl cos -~- + k2 - 1----~(2 - 3 E1
(26) 3 q L 4
+ (~2__1) (~2 )1152E1
224 N. Taylor, 1I. Tran
V n-
I
I N
0 } / / 1 / / / / '
q / u n i t length
V,xxxlo=-3q~i I Mx
Peel point
I I / l l l l l l l l l l l l / I / l / l l l / l l l l l l l l l l l l l l /
X
L i12
(a) Flexural Range Topology L ~< Li
Pp.
q
Buckle under thrust PI Vm >Vom I Initial Imperfection curve L < Li
Vm om . . . . . ~ ? . . . . . . . . . . . . . . . . . . . . . . . . v . l ~ 0 . , o~.q . . . . .
oAqLI2 ~ Lil2 =_r~ "x Lil2 "~"~, eAqLI2--
Ls ~ L/2 L/2 Us~ Ls
(b) General Topology
Jl JJ L -oL'2 IP
eAq LIz-L L-.,.....~
(c) Axial Force DTstribu~ion
Fig. 6. Fully mobilised initial post-upheaval infilled prop imperfection modelling-- (Z < Zi).
noting that the latter term denotes peel point height (v ~ 0). Model defi- nition for L < Li is again completed by incorporation of eqns (8) and (9) noting the Ls = 0 limitation. With upheaval occurring as Vm "---> vo,,, in the l imit [see (e) in the Summary], then
Subsea pipeline buckling 225
Pu = 25-2 % eq, l~. as L = L~ --+ 0 (27)
whilst upheaval crown and maximum curvature remains in accord with eqn (17). 16
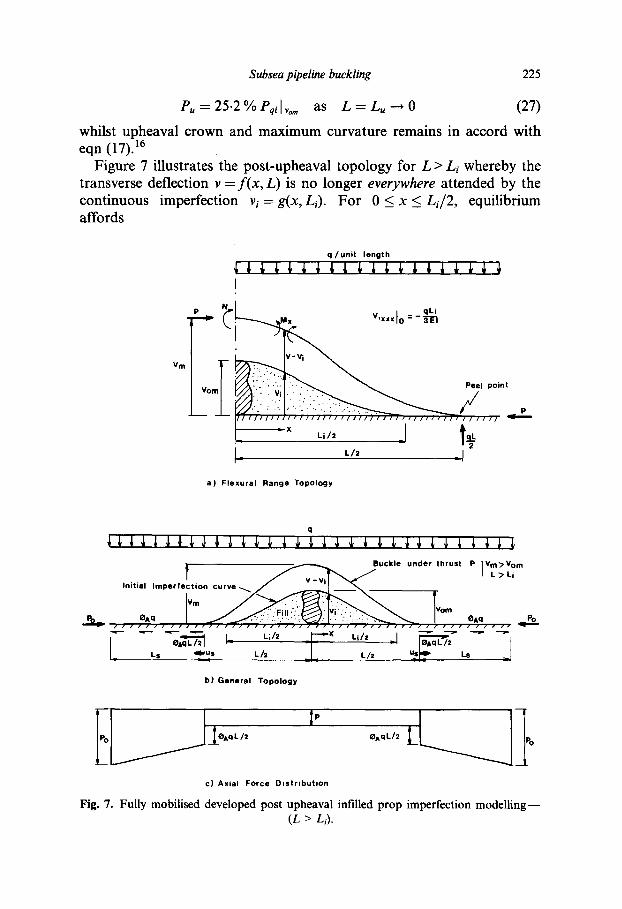
Figure 7 illustrates the post-upheaval topology for L > Li whereby the transverse deflection v =f(x, L) is no longer everywhere attended by the continuous imperfection v, = g(x, Li). For 0 < x < L~/2, equilibrium affords
Vm
q/uni t length
I
~ - / .L, L 1 ~ - - - - ~ V'xxxlo : " 3-~
"~ " Peeg point
J / l l l l l l l l l f l l l l l l l l l / l l l l / l ' ~ - , / l l l l l l l t l l l l
I .x ,,,, I t ~
a) Fiexural Range Topology
q = = = = = = = = = = = = = = = = = = = = = = = = = = = = = = =
~ Buckle under thrust P IVrn>Vom / v. v ; ~ . . ~ "I I L > L i
Initial Imperfection c u r v e ~ . ~ / _ '] ~ .
V m
L L. O'~u_s I~- L/: ;13 ~ X Li/IL ,2 ~1 " _ ~ LS'-"
b) General Topology
oIzIJ qc I P
c) Axial Force Distribution
Fig. 7. Fully mobilised developed post upheaval infiiled prop imperfection modelling-- (L > Li).
226 N. Taylor, V. Tran
Mx = EI(v,xx - Vi,xx) = e(vm - v) - qx2/2 + N (28)
whilst for Li /2 <_ x <_ L /2 ,
Mx = Elv,xx = P(vm - v) - qx2/2 + N (29)
The boundary conditions appertaining to eqns (28) and (29) are
I,'10 ~--- Pm, lhx l0 : 0 and VlL/2 : I~'x [L/2 : l~'xx ]L/2 : 0 (30)
respectively, with matching conditions at x = Li /2
q - - c o s ( L - L i ) - s i n ( L - L i ) - v,x Ein3 ~ (31)
_ q ( ~ s i n n n ) V,xx E i n 2 -~ (L - L i ) - c o s -~ ( t - t i ) - 1
Following customary manipulation 16 involving eqn (18), the characteristic equation then becomes
n L n L n L n L i n L i n L i n L i sin 2 2 cos -~ -+s in ~ - ~ - c o s ~ - ~ - - 0 (32)
with the solution typified in Table 1 (L > Zi); full matching at L = L; is demonstrated. The infilled prop model is completed by inclusion of eqns (8) and (9), again noting their now unlikely, but possible Ls = 0 limitation.
Summary
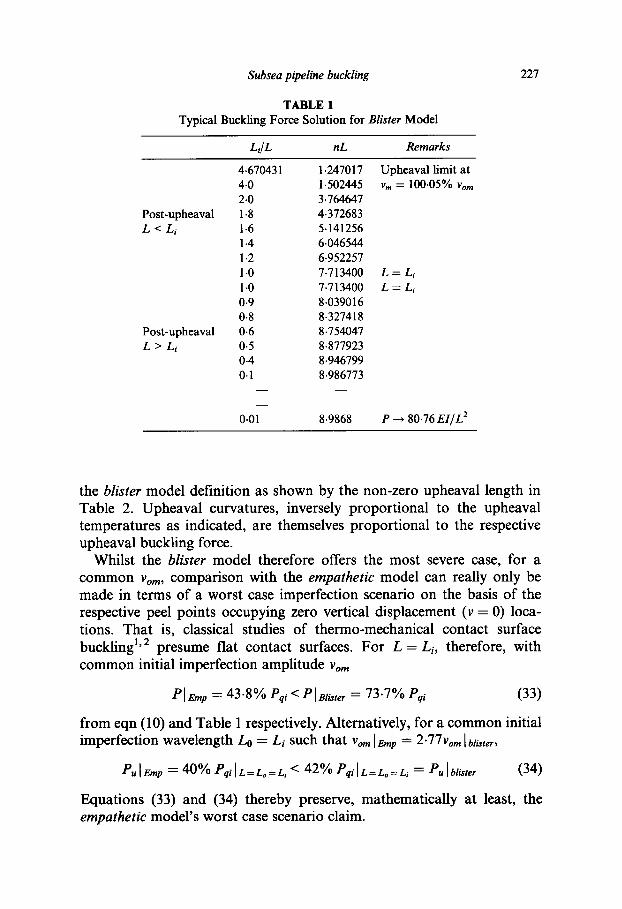
The proposed isolated and infilled prop models, hereafter termed the isoprop and blister models, are based upon actual physical imperfections whilst the empathetic model derives from mathematical reasoning. Whilst the blister model generates a solution in keeping with that provided by an elastic interpretation of an infilled prop formulation available elsewhere, 5 the isoprop model, is as discussed therein, generates a solution at odds with its predecessors. 6'21 However, solutions for nL, L >_ Li, for both the isoprop and blister models are in agreement which supports the case for the former given the latter's support elsewhere 5 and the anticipated reduction of initial imperfection effects as post-upheaval buckling devel- ops. Given the obvious importance to designers of the upheaval state, Table 2 summarises the key, individual characteristics of the various models concerned at upheaval for a common imperfection amplitude Vom.
Upheaval is determined in each case by reducing initial post-buckling amplitude expressions Vm ~ Vom; for example, use is made of eqns (5) and (7) or eqn (26) here. For isoprop, upheaval can also be computed by reducing the pre-upheaval prop force to zero. Numerical limitations effect
Subsea pipeline buckling 227
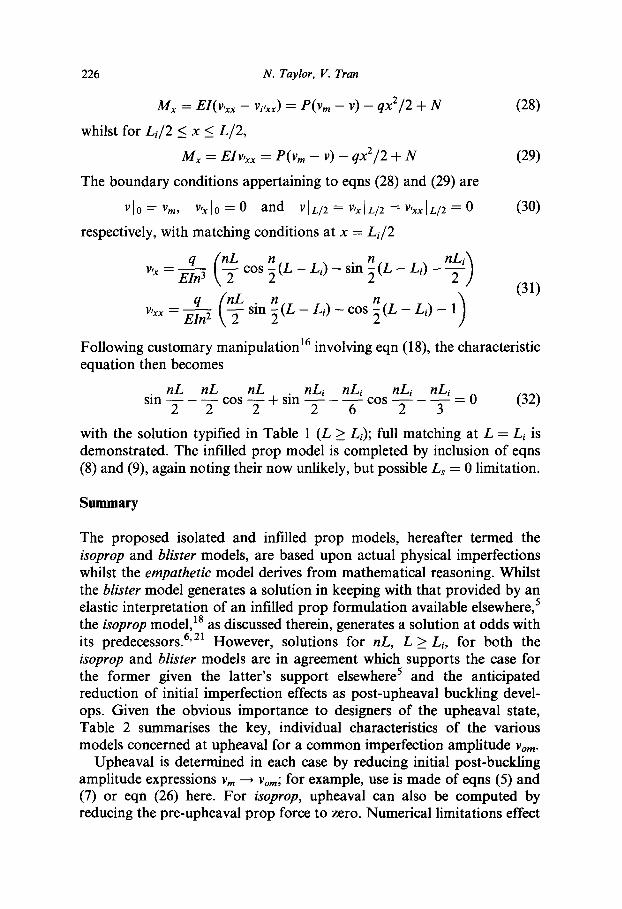
TABLE 1 Typical Buckling Force Solution for Blister Model
Li/L nL Remarks
Post-upheaval L < L i
Post-upheaval L > Li
4.670431 1.247017 Upheaval limit at 4.0 1.502445 vm = 100.05% yore 2.0 3.764647 1.8 4.372683 1-6 5.141256 1-4 6.046544 1.2 6.952257 1-0 7.713400 L : L i 1.0 7-713400 L : Li 0-9 8.039016 0.8 8-327418 0.6 8-754047 0.5 8.877923 0-4 8.946799 0-1 8.986773
0.01 8.9868 P ~ 80.76 EI/L 2
the blister model definition as shown by the non-zero upheaval length in Table 2. Upheaval curvatures, inversely proportional to the upheaval temperatures as indicated, are themselves proportional to the respective upheaval buckling force.
Whilst the blister model therefore offers the most severe case, for a common Vom, comparison with the empathetic model can really only be made in terms of a worst case imperfection scenario on the basis of the respective peel points occupying zero vertical displacement (v = 0) loca- tions. That is, classical studies of thermo-mechanical contact surface buckling 1'2 presume fiat contact surfaces. For L = L~, therefore, with common initial imperfection amplitude yore
PIEmp = 43-8% Pqi < Plmi~ter = 73.7% Pqi (33)
from eqn (10) and Table 1 respectively. Alternatively, for a common initial imperfection wavelength L0 = L; such that Vom letup = 2"77Vom I btt, ter,
PulEmp : 40% PqiIL:Lo:L, < 42% PqiIL=Lo=L, = e.,lbt~ste, (34)
Equations (33) and (34) thereby preserve, mathematically at least, the empathetic model's worst case scenario claim.
t,,J
to
o
o
TA
BL
E 2
M
odel
Cha
ract
eris
tics
at
Uph
eava
l
Uph
eava
l le
ngth
%
lde
alis
ed b
uckl
e L
(u)
forc
e at
uph
eava
l as
Vm
--~
F
ore
Phe
nom
enon
M
odel
%
Lo
% L
i 3"
962(
EIq/
vom
) U2
isop
rop
96
74-5
63
Is
olat
ed p
rop
Ref
s 6
and
19
100
77
100
Con
tact
E
mpa
thet
ic
100
77
40
undu
lati
on
Bli
ster
****
and
27
.6
21-4
25
.2
Ref
5 (
elas
tic)
Uph
eava
l te
mpe
ratu
re*
coef
ficie
nt o
f res
pect
ive
indi
vidu
al**
(q/A
EcO
( 1/c
ur V
)u I ..
...
-4-9
8
-5.6
***
- 1
.42
(-1
.41
@ v
,. =
Vom )
Uph
eava
l te
mpe
ratu
re*
base
d on
O.0
78(q
/AEc
O[L
o2 /V
om]
1-5
7
_~
2.49
19
,~
1-0
0.63
Not
es:
(cur
v)u
deno
tes
(v~x
)u o
r Vo
,xx o
r Ve
xx.
* A
ssum
e L
s =
0 an
d dp
AqL
/2(+
F )
<< P
u at
uph
eava
l.
**
Em
ploy
ing
resp
ecti
ve m
odel
's v
lu =
f(x
).
***
Est
imat
e o
nly
--as
sum
es v
~,~x
=
Vo,x~
at c
row
n gi
ven
Pu =
Pq
i and
Lu
= Lo
. **
** N
umer
ical
lim
itat
ions
res
tric
t up
heav
al t
o 10
0.05
% y
ore (
see
Tab
le 1
).
Subsea pipeline buckling
TABLE 3 Pipeline Parameters
229
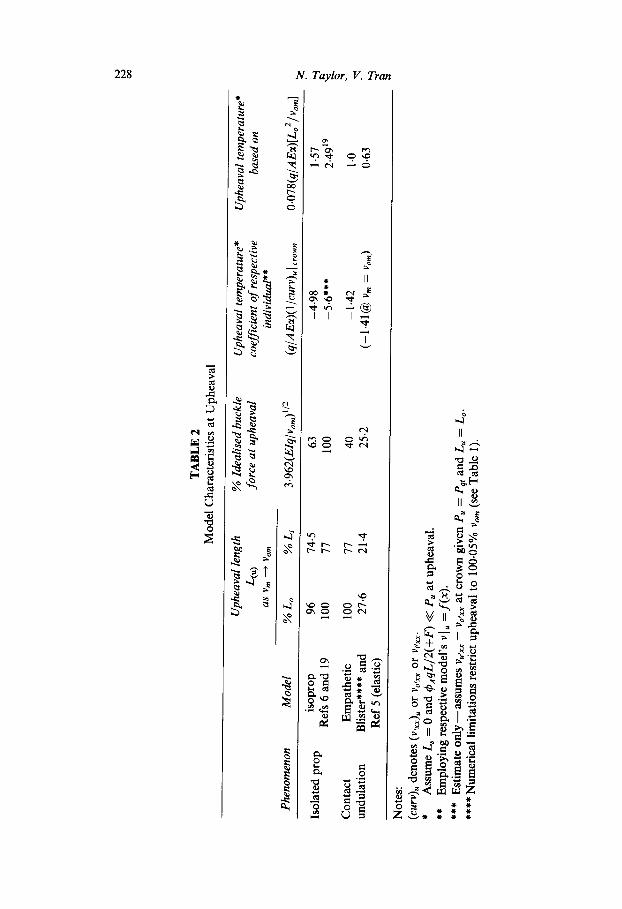
Parameter Symbol Value Unit
External diameter D 9.53* mm Wall thickness t 1.6* mm Direct modulus E 195000 N/mm 2 Effi~ctive inertial self-weight** q 0.00341 N/mm Limiting linear stress Cry 113 N/mm 2 Thermal coefficient ~ 11 X 10 -6* /°C Axial friction coefficient ~b~ 0.2
Poisson's ratio*** p 0.3
NB * From RJB Stainless, Birmingham. ** For dry environment experimental purposes involving lock-off post-flow initiation, q is full weight plus water contents. *** # employed for the evaluation of pressure component as required. Laboratory restrictions; vmlm~ = 50 mm; Lfap = 5-68 m > Lbuckte.
The resistance-to-upheaval enhancement possessed by the isoprop model due to its allowance of pre-upheaval, flexural energy release, is clearly indicated in Table 2 but is subject to the following consideration. The upheaval temperatures quoted in Table 2 presume zero frictional resistance as indicated by eqn (12). Employing the pipe characteristics given in Table 3 with Yore < 30 m m - - t h e s e values are relevant to the experimental programme discussed shor t ly - - fu l l system numerical analysis affords upheaval temperatures less than 1.5% above those given in Table 2 with respect to the empathetic and blister models whilst for the isoprop model, the variation is in excess of 10% at Vom = 30 mm as upheaval follows frictional slip length development during the pre-uphea- val flexural stage.
It is now proposed to place the foregoing theories within the context of physical testing. Both isoprop and blister type physical configurations are investigated. Economic considerations dictate small-scale testing, with additional recourse to the use of f ixed anchor points 18' 19 being demanded to further restrict length-of-pipe requirements (see later). In prototype practice, resistance to upheaval buckling is enhanced by burial, contin- uous or discrete, and/or the use of fixed anchors. The vertical mode buckling methods herein presented essentially relate to a trenched lie obviating lateral or inclined modes. 18 Continuous burial has a smaller effect al though inertial loading 'q' must then incorporate the vertical resistance provided by the overburden. 6's Incorporat ion of discrete dumping18,19 (in the presence of trenching) or continuous burial requires
230 N. Taylor, V. Tran
q /unit length
v,,xxo:- v-vi ~ gFAP
f ' ~ ~ ~ Peel point
11 / I I / I I I I l l / / I l l / I f I I I l l l l / I / I / l l / l l l l l l l / l l I l l / I l l / I l l / l / / / f i l l
-~x J OAqL/2~ (~Aq ~ Fap Lil2 ~ ~ ~
F_ _L (Lfap -L) '2 .I a) Topology
.I I~AqL/2 L
~Aq (Lfap - L )/2 T !
b) Axial Force Distribution
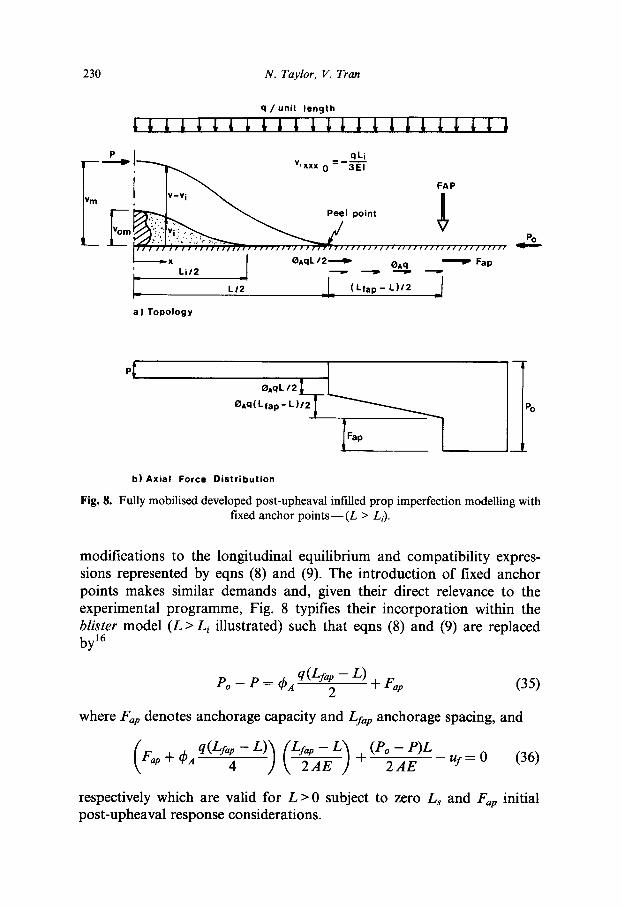
Fig. 8. Fully mobilised developed post-upheaval infilled prop imperfection modelling with fixed anchor points--(L > Li).
modifications to the longitudinal equilibrium and compatibility expres- sions represented by eqns (8) and (9). The introduction of fixed anchor points makes similar demands and, given their direct relevance to the experimental programme, Fig. 8 typifies their incorporation within the blister model (L > Li illustrated) such that eqns (8) and (9) are replaced by 16
Po - P = ~A q (Lfap -- L) 2 '~ Fap (35)
where Fap denotes anchorage capacity and Lfa p anchorage spacing, and
(Fapq_~)Aq(ZfaP_4-Z).)lZfap-Z ~ ( e o - e ) z - \ T A E ] -~ 2 A E uf -~- 0 (36)
respectively which are valid for L > 0 subject to zero Ls and Fap initial post-upheaval response considerations.
Subsea pipeline buckling 231
EXPERIMENTAL PROGRAMME
General
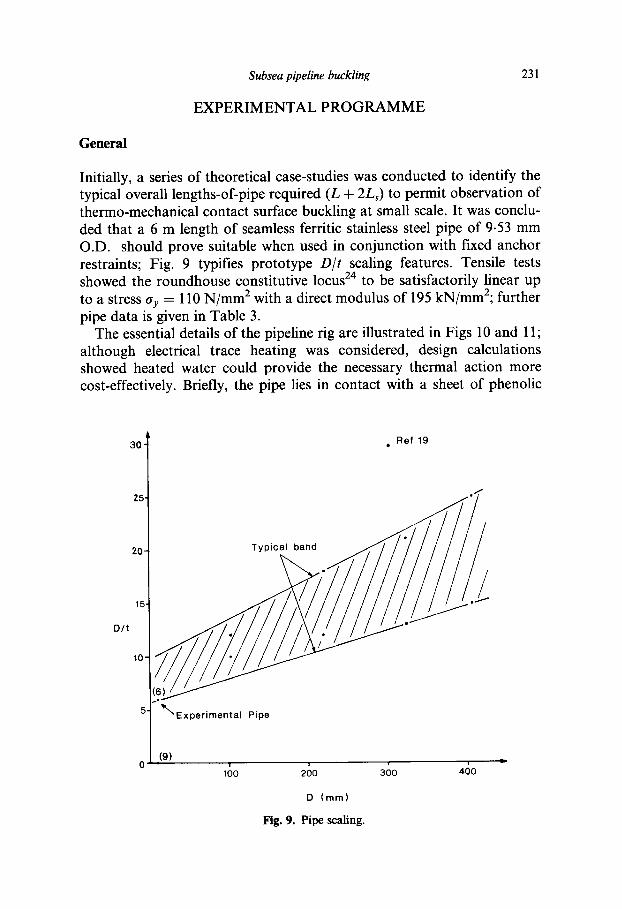
Initially, a series of theoretical case-studies was conducted to identify the typical overall lengths-of-pipe required (L + 2Ls) to permit observation of thermo-.mechanical contact surface buckling at small scale. It was conclu- ded that a 6 m length of seamless ferritic stainless steel pipe of 9.53 mm O.D. should prove suitable when used in conjunction with fixed anchor restraints; Fig. 9 typifies prototype D/t scaling features. Tensile tests showed the roundhouse constitutive l ocus 24 t o be satisfactorily linear up to a stress O-y = 110 N/mm 2 with a direct modulus of 195 kN/mm2; further pipe data is given in Table 3.
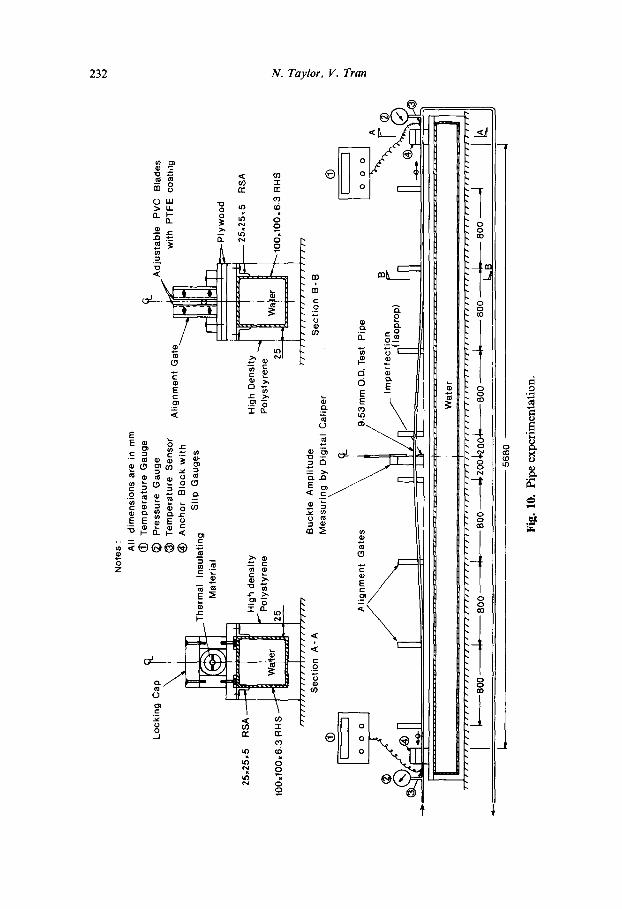
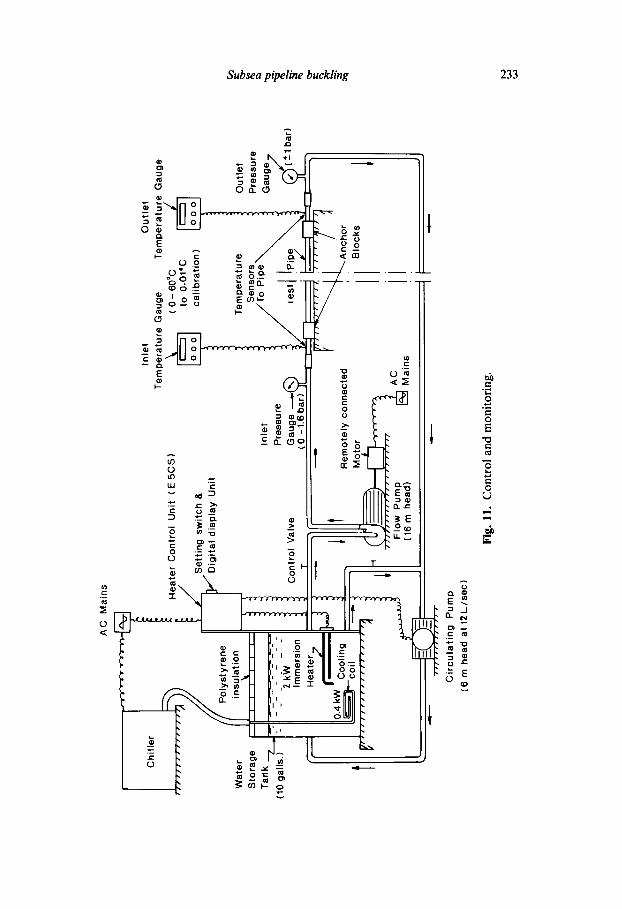
The essential details of the pipeline rig are illustrated in Figs l0 and 1 l; although electrical trace heating was considered, design calculations showed heated water could provide the necessary thermal action more cost-effectively. Briefly, the pipe lies in contact with a sheet of phenolic
3° l 25'
20-
15
Oft
10-
Ref 19
~"~ Experimental Pipe
,(9) 1C)0 200 300 4()0
D (mm)
Fig. 9. Pipe scaling.
Not
es
: A
ll di
men
sion
s ar
e in
m
m
@
Tem
pera
ture
G
auge
0 P
ress
ure
Gau
ge
Adj
usta
ble
PV
C
Bla
des
0 T
empe
ratu
re
Sen
sor
Alig
nmen
t G
at
with
P
TF
E
coat
i,lg
@
Anc
hor
Blo
ck
with
The
rmal
In
sula
ting
Slip
G
auge
s
25.2
5.5
RS
A
100~
100~
6.3
RI-I
S
Buc
kle
Am
plitu
de
Dig
ital
Cal
iper
25.2
5.5
RS
A
100.
100x
6.3
RH
S
.53
mm
O.D
. T
est
Pip
e
C
I 56
60
.I
Fig
. 10
. Pi
pe e
xper
imen
tatio
n.
AC
M
ains
Chi
ller
Wat
er
Sto
rage
Ta
nk -
'Z
(10
galls
.)
Pol
ysty
rene
in
sula
tion
Z-Z
- -z
--
'.?mer~
i°n I
;~
Hea
ter_
II
. .
Coo
ling
coil
Inle
t O
utle
t Te
mpe
ratu
re G
au
ge
Te
mpe
ratu
re
Gau
ge
Hea
ter
Con
trol
Uni
t (E
5C
S)
~--~
(O-6
0°Cto
0.01°C
~--~
S
ettin
g sw
itch
&
calib
ratio
n)
-~'D
igit
a/
disp
lay
Uni
t
Tem
pera
ture
S
enso
rs
Inle
t /r
o
Pip
e~
Pre
ssur
e /
i [
ipe
~
Con
trol
Val
ve
Gau
ge ~
(~
• /
iest
P
T
(0 -
1.6
bar)
~[]
" ~
l~
Rem
otel
y co
nnec
ted
~A
nc
r
It oo
r .oc
l
¢l
ll
ll
tl
l
it1
i
i
' F
low
Pum
p A
C
(16
m h
ead)
M
ains
Out
let
Pre
ssur
e Ga
u_g2
Cir
cula
ting
Pum
p (6
m h
ead
at 1
2L/s
ec)
Fig.
11.
Con
trol
and
mon
itor
ing.
bar)
234 N. Taylor, V. Tran
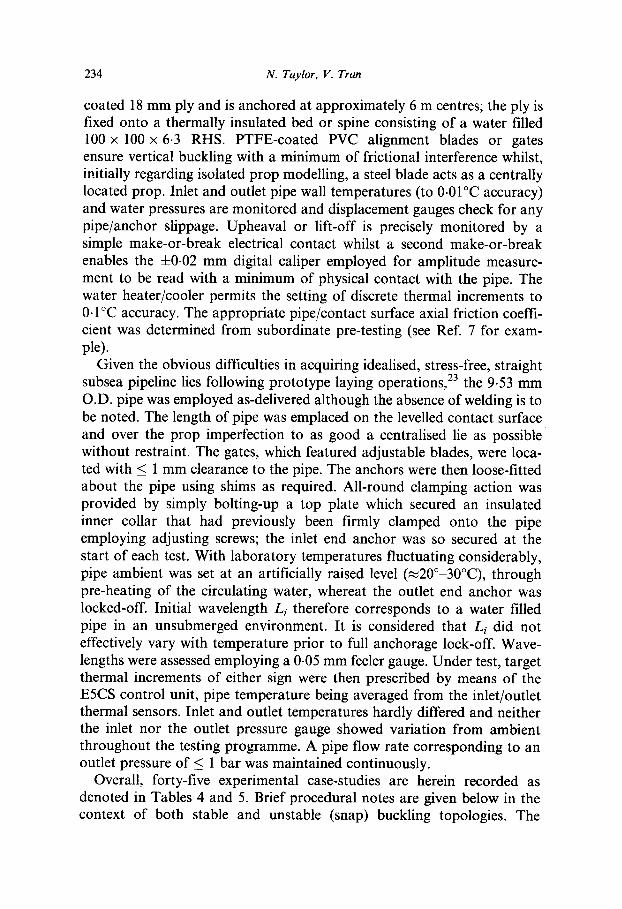
coated 18 mm ply and is anchored at approximately 6 m centres; the ply is fixed onto a thermally insulated bed or spine consisting of a water filled 100 x 100 x 6.3 RHS. PTFE-coated PVC alignment blades or gates ensure vertical buckling with a minimum of frictional interference whilst, initially regarding isolated prop modelling, a steel blade acts as a centrally located prop. Inlet and outlet pipe wall temperatures (to 0-01°C accuracy) and water pressures are monitored and displacement gauges check for any pipe/anchor slippage. Upheaval or lift-off is precisely monitored by a simple make-or-break electrical contact whilst a second make-or-break enables the +0-02 mm digital caliper employed for amplitude measure- ment to be read with a minimum of physical contact with the pipe. The water heater/cooler permits the setting of discrete thermal increments to 0-1 °C accuracy. The appropriate pipe/contact surface axial friction coeffi- cient was determined from subordinate pre-testing (see Ref. 7 for exam- ple).
Given the obvious difficulties in acquiring idealised, stress-free, straight subsea pipeline lies following prototype laying operations, 23 the 9.53 mm O.D. pipe was employed as-delivered although the absence of welding is to be noted. The length of pipe was emplaced on the levelled contact surface and over the prop imperfection to as good a centralised lie as possible without restraint. The gates, which featured adjustable blades, were loca- ted with < 1 mm clearance to the pipe. The anchors were then loose-fitted about the pipe using shims as required. All-round clamping action was provided by simply bolting-up a top plate which secured an insulated inner collar that had previously been firmly clamped onto the pipe employing adjusting screws; the inlet end anchor was so secured at the start of each test. With laboratory temperatures fluctuating considerably, pipe ambient was set at an artificially raised level (~20°-30°C), through pre-heating of the circulating water, whereat the outlet end anchor was locked-off. Initial wavelength L i therefore corresponds to a water filled pipe in an unsubmerged environment. It is considered that Li did not effectively vary with temperature prior to full anchorage lock-off. Wave- lengths were assessed employing a 0-05 mm feeler gauge. Under test, target thermal increments of either sign were then prescribed by means of the E5CS control unit, pipe temperature being averaged from the inlet/outlet thermal sensors. Inlet and outlet temperatures hardly differed and neither the inlet nor the outlet pressure gauge showed variation from ambient throughout the testing programme. A pipe flow rate corresponding to an outlet pressure of < 1 bar was maintained continuously.
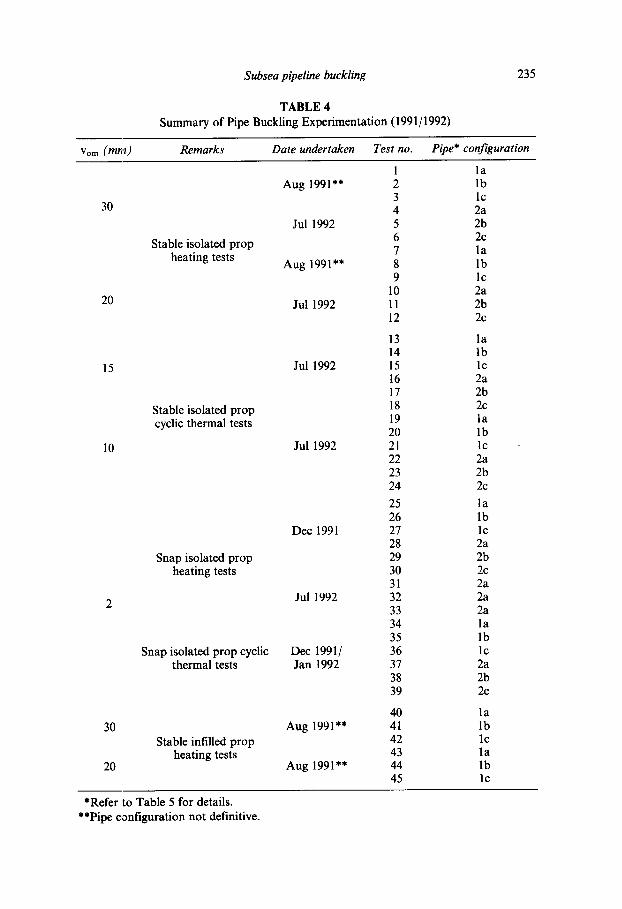
Overall, forty-five experimental case-studies are herein recorded as denoted in Tables 4 and 5. Brief procedural notes are given below in the context of both stable and unstable (snap) buckling topologies. The
Subsea pipeline buckling 235
TABLE 4 Summary of Pipe Buckling Experimentation (1991/1992)
Vom (mm) Remarks Date undertaken Test no. Pipe* configuration
1 la Aug 1991"* 2 lb
3 lc 30 4 2a
Jul 1992 5 2b 6 2c
Stable isolated prop 7 la heating tests
Aug 1991"* 8 lb 9 lc
l0 2a 20 Jul 1992 11 2b
12 2c
13 la 14 lb
15 Jul 1992 15 lc 16 2a 17 2b 18 2c Stable isolated prop
cyclic thermal tests 19 I a 20 lb
10 Jul 1992 21 lc 22 2a 23 2b 24 2c
25 la 26 lb
Dec 1991 27 lc 28 2a
Snap isolated prop 29 2b heating tests 30 2c
31 2a 2 Jul 1992 32 2a
33 2a 34 la 35 lb
Snap isolated prop cyclic Dec 1991/ 36 lc thermal tests Jan 1992 37 2a
38 2b 39 2c
40 la 30 Aug 1991"* 41 lb
Stable infilled prop 42 lc heating tests 43 la
20 Aug 1991"* 44 lb 45 lc
*Refer to Table 5 for details. **Pipe configuration not definitive.
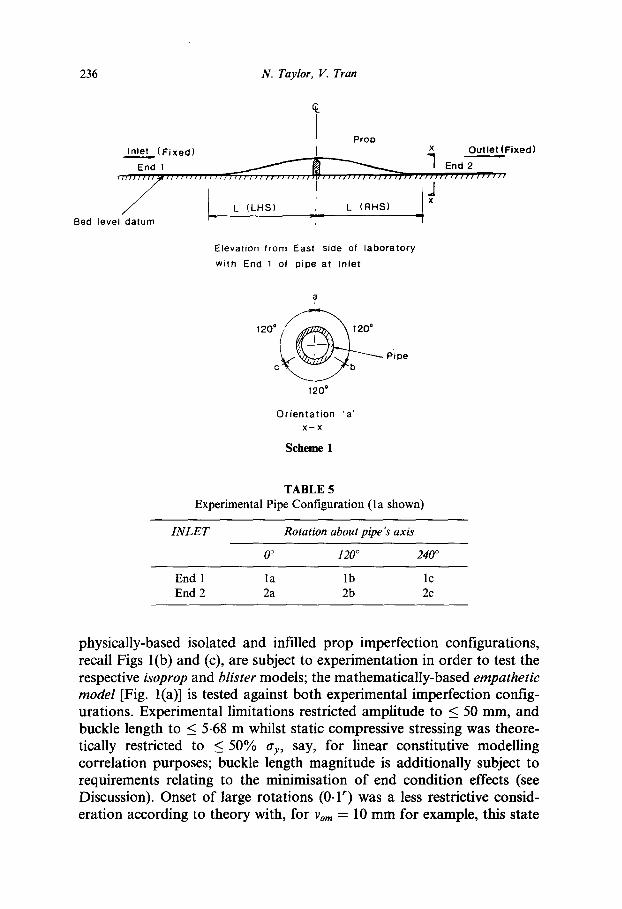
236 N . Taylor, V. Tran
ProD I n le t ( F'i xed) x Out let (Fixed)
7 " End 1 ~ ~ End 2 l l z J J t l l J l l t t t t / l / l l I l J l l l / I / / ~ l • I I I I I I f l l l l l l ; ~ l , I I
Bed level datum -i I
Elevation from East side of laboratory with End 1 of pipe at Inlet
a
1 2 0 0 / ~ 2 0 * ~ ' ~ Pipe
120"
Orientation 'a' X--X
Scheme 1
TABLE 5 Experimental Pipe Configuration (la shown)
I N L E T Rota t ion about p ipe ' s ax i s
0 ° 120 ° 240 °
End 1 la lb lc End 2 2a 2b 2c
physically-based isolated and in filled prop imperfection configurations, recall Figs l(b) and (c), are subject to experimentation in order to test the respective isoprop and blister models; the mathematically-based empathetic model [Fig. l(a)] is tested against both experimental imperfection config- urations. Experimental limitations restricted amplitude to < 50 mm, and buckle length to < 5-68 m whilst static compressive stressing was theore- tically restricted to < 50% try, say, for linear constitutive modelling correlation purposes; buckle length magnitude is additionally subject to requirements relating to the minimisation of end condition effects (see Discussion). Onset of large rotations (0-1 r) was a less restrictive consid- eration according to theory with, for yore = 10 mm for example, this state
Subsea pipeline buckling 237
corresponding to Vm --~ 170 mm and L -~ 5.9 mm for all three models. A comprelhensive listing of all key experimental data relating to the forty-five tests is available in a recent PhD thesis 16.
Stable lmckling isolated prop tests
With the single blade providing the prop imperfection, temperature rise, buckle amplitude and wavelength data were recorded for imperfections of 30 mm > Vom > 10 mm, these values theoretically producing fully stable post-upheaval buckling paths. The larger the prop amplitude, the less effectiwz any as-delivered pipe imperfections were considered to become. For each case of yore = 30 mm and 20 mm, six heating up tests were conduc~ted, the pipe being rotated sectionally through 120 ° and rotated end-to-end about the prop centreline for individual tests. Test execution time was approximately 1.5 hours. For each of the smaller imperfection cases involving Vom --- 15 mm and 10 mm, six full heating up/cooling down thermal cycle tests were undertaken, the cooling phase being incrementally monitored through to effective recovery of the ambient state. Each cyclic test took approximately 2-5 hours to execute.
Snap buckling isolated prop tests
Smaller imperfections produce snap buckling and the isoprop model predicts that an initial amplitude of Vo,, = 2 mm would produce a moder- ate snap. As-delivered imperfection effects become proportionately more significant, however, and fifteen tests were conducted at this imperfection amplitude to produce a relatively larger set of upheaval temperature values. Six tests involved full thermal cyclic action. Throughout, dynamic effects associated with snap buckling caused difficulty in securing precise buckle length values in the vicinity of upheaval and its equivalent upon cooling.
Stable buckling inf'tlled prop tests
Six infilled prop buckling tests were conducted relating to imperfection amplitudes of 30 mm and 20 mm; blister model data for these magnitudes of imperfection indicated stable buckling characteristics. Otherwise similar to the foregoing isolated prop tests at the same amplitudes, herein the prop-attendant voids were initially infilled with a sand coated balsa framework, a time-consuming process. The variation in the axial friction coefficient along the infilled imperfection lie with respect to that estab- lished previously was checked by further subordinate friction testing and
238 N. Taylor, V. Tran
found not to be of major significance, typically affecting theoretical upheaval temperature values by < 0.5%. The metal prop remained as an integral part of the imperfection, facilitating lift-off identification as previously. Test execution time lengthened to two hours due to buckle length values being difficult to obtain with the feeler gauge for L < Li (i.e. with respect to the curved, sand-coated imperfection surface). It was necessary to establish a 'contour map' of vertical pipe displacement (i.e. = vi or # vi) at numerous locations for L < L / in order to determine the respective buckle length values.
TEST RESULTS
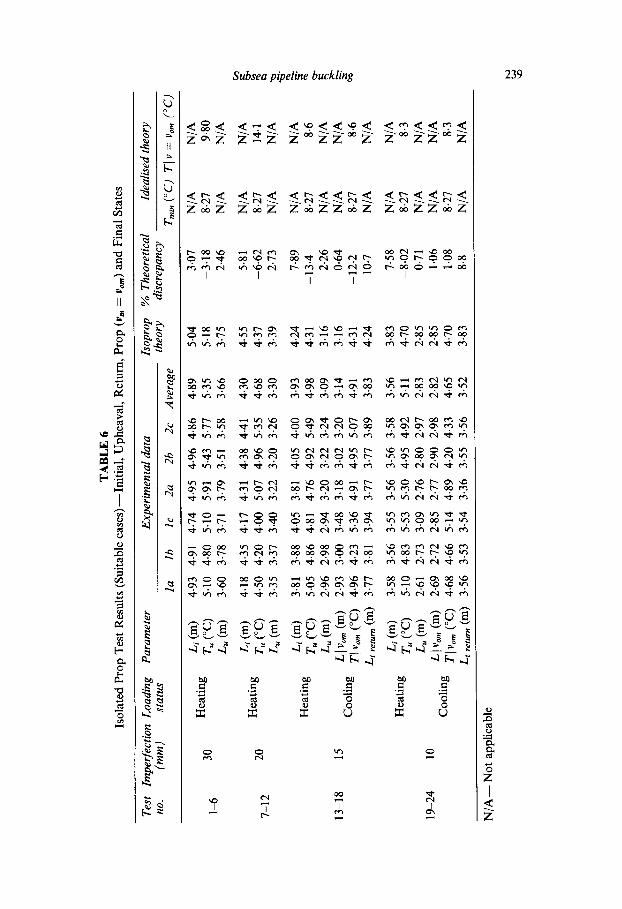
Stable isolated prop configurations
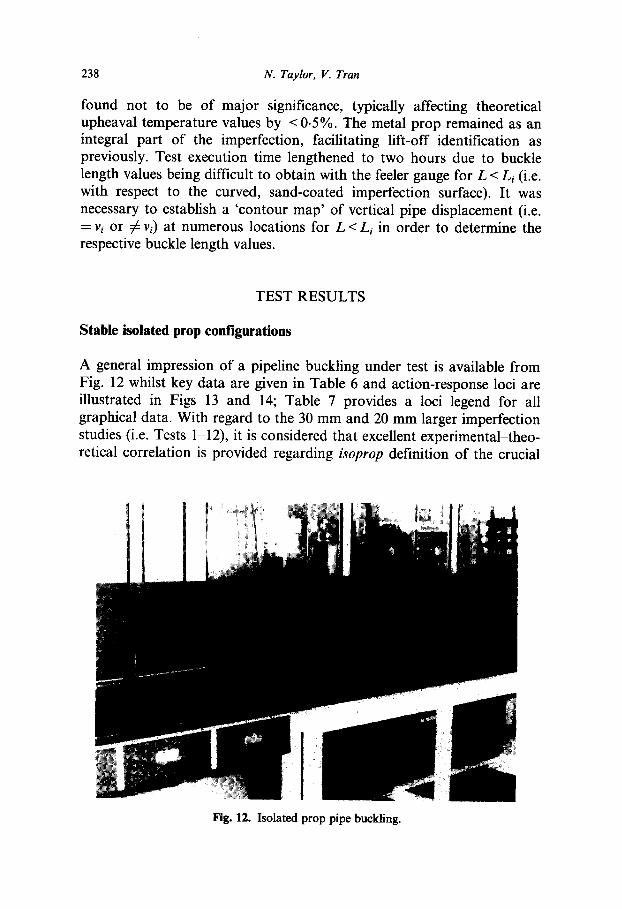
A general impression of a pipeline buckling under test is available from Fig. 12 whilst key data are given in Table 6 and action-response loci are illustrated in Figs 13 and 14; Table 7 provides a loci legend for all graphical data. With regard to the 30 mm and 20 mm larger imperfection studies (i.e. Tests 1-12), it is considered that excellent experimental-theo- retical correlation is provided regarding i s o p r o p definition of the crucial
Fig. 12. Isolated prop pipe buckling.
TA
BL
E 6
Is
olat
ed P
rop
Tes
t R
esul
ts (
Sui
tabl
e ca
ses)
--In
itia
l, U
phea
val,
Ret
urn,
Pro
p (v
m =
yor
e) a
nd F
inal
Sta
tes
Test
Im
perf
ecti
on
Load
ing
Par
amet
er
no.
(mm
) st
atus
E
xper
imen
tal
data
la
lb
lc
2a
2b
2c
Ave
rage
Isop
rop
% T
heor
etic
al
theo
ry
disc
repa
ncy
Idea
lise
d th
eory
Trai
n (°
C)
TI v
= v
om (
°C)
1-6
7-12
30
20
13-1
8 15
19-2
4 10
Li
(m)
Hea
ting
T
u (°
C)
L~
(m)
Li (
m)
Hea
ting
T
u (°
C)
L~
(m)
Li (
m)
Hea
ting
Tu
(°C
)
Lu (
m)
Coo
ling
Hea
ting
Coo
ling
4-93
4
.91
4.
74
4-9
5 4
-96
4.8
6 5.
10
4.80
5
.10
5
.91
5
.43
5.7
7 3.
60
3.7
8
3.7
1
3.79
3
.51
3-5
8
4.18
4.
35
4-1
7 4
-31
4
-38
4.4
1 4.
50
4.20
4.
00
5.0
7 4
.96
5-35
3-
35
3.3
7
3.40
3.
22
3.20
3.
26
3.81
3
-88
4.0
5 3
.81
4
-05
4.0
0 5.
05
4-8
6 4
.81
4.
76
4-9
2 5
.49
2.96
2.
98
2.94
3.
20
3.22
3-
24
Llv
om(m
) 2
.93
3.0
0 3
.48
3
.18
3.
02
3.20
Tl
vom
(°C
) 4
-96
4.2
3 5.
36
4.9
1
4.95
5.
07
Lire
turn
(m )
3'77
3
-81
3
-94
3'7
7 3
-77
3'8
9
Li(
m)
3-58
3.
56
3.55
3.
56
3-5
6 3
-58
Tu(
°C)
5.10
4.
83
5.5
3
5.30
4
-95
4.9
2 L
u(m
) 2-
61
2.73
3
.09
2.
76
2.80
2.
97
L lv
om (m
) 2.
69
2-7
2 2
.85
2.77
2.
90
2.98
Tl
vo,.(
°C)
4.68
4
-66
5
-14
4.8
9 4.
20
4.33
Zi
ret
urn (
m)
3.56
3
.53
3.
54
3-3
6 3
-55
3.5
6
4.89
5.
04
3-07
N
/A
N/A
5-
35
5.18
-3
-18
8.
27
9-80
3.
66
3.75
2.
46
N/A
N
/A
4.30
4.
55
5-81
N
/A
N/A
4.
68
4.37
-6
.62
8.
27
14.1
3-
30
3.39
2.
73
N/A
N
/A
3.93
4.
24
7.89
N
/A
N/A
4.
98
4.31
-1
3.4
8.
27
8.6
3.09
3.
16
2.26
N
/A
N/A
3.
14
3-16
0.
64
N/A
N
/A
4.91
4.
31
-12
.2
8.27
8-
6 3.
83
4.24
10
.7
N/A
N
/A
3.56
3.
83
7.58
N
/A
N/A
5.
11
4-70
-8
.02
8.
27
8.3
2.83
2.
85
0.71
N
/A
N/A
2.
82
2-85
1.
06
N/A
N
/A
4.65
4.
70
1.08
8.
27
8.3
3.52
3.
83
8-8
N/A
N
/A
g~
N/A
-- N
ot
appl
icab
le
to
240 N. Taylor, V. Tran
25-
A ~ 2 0 "
I..--
® .°2- 15- n.-
~10" O. E f -
5"
0 2 0 2~
I s o p r o p / / / / /
I / . / "~
Ideal ised .~ 1 ~ ~ S
., ... i - Empathetic
i i
30 35 40 45
Buckle Amplitude Vm (-ram)
5O
25-
A
=o20- v
o~ .°2- 15" rr
~10. e~
E ®
I.-.
" , \
\ \
\ \
Idealised
./
/ /
~ / I s o p r o p
i
/
J l / / // I I;
/ / / ~ / I / / / / /_- Empathet ic
~ ~ ~ . ~ ~ Li = 5.038 m
, , / / . ' ; 4 5 '
Buckle Length L (m)
Fig. 13. Stable isolated prop with fixed anchor points thermal action characteristics for test no. 4.
Subsea pipeline buckling 241
30"
1-
2O == n -
==
0 ' "--
0 50
f " °o r ° °
Idealised . . ~ .
10 20 30 40
Buckle A m p l i t u d e Vm (mm)
30,
Isoprop J / / • ii/I
/ l~ f '~ '~ E m pathetic
', @
~ - / Li = 3 . 8 2 8 m -, ' :~+ o /
0 i 2 3 4 5
Buck le Length L ( m )
I -
2C
P
® O.
E 1C I--
Idealised
Fig. 14. Stable isolated prop with fixed anchor points thermal action characteristics for test no. 19.
242 N. Taylor, 1I. Tran
TABLE 7 Loci Legend For Figs 13, 14, 16 and 17
Experimental (By-eye fit) Idealised theory Empathetic theory Isoprop theory Blister theory
upheaval state; Table 6 further shows that theoretical isoprop upheaval temperatures Tu are conservative and within 7% of the respective average experimental values whilst upheaval wavelengths Lu lie within 3% of their average experimental counterparts. The reduction in wavelength from Z i
(initial) to Lu is clearly displayed, Although experimental-theoretical correlation remains equally good for
the upheaval wavelengths corresponding to the smaller 15 mm and 10 mm imperfection studies (i.e. Tests 13-24), upheaval temperature correlation numerically suffers as the as-delivered imperfections become proportio- nately more effective--recall all three theoretical models assume a stress- free-when-deformed datum. Fortunately, however, the isoprop model data do become increasingly conservative in these studies and the overall aver- age experimental-theoretical upheaval temperature discrepancy for the twenty-four stable isolated prop tests is less than 8%. Still better correla- tion would have been obtained were it not for five (of 24) notably higher experimental upheaval temperatures, three of which occur in the same pipe configuration (2c). The four theoretical initial wavelength (Li) values were also within 8% of their four averaged experimental equivalents; here, the key reason for the discrepancy is considered to lie with the visually obvious, as-delivered, lack of pipe-straightness.
Regarding recovery characteristics in these latter twelve tests, Table 4 indicates that the temperature required to achieve initial return to the prop is generally--9 tests-- lower than that at upheaval (i.e. T[ Vo,, < Tu). Average values for the corresponding buckling lengths (LI Vom and Lu) vary by less than 1.6%, similarly excellent wavelength recovery being exhibited upon return to ambient (Li).
Typical graphical features regarding the twelve larger imperfection amplitude tests are displayed in Fig. 13 with the experimental tempera- ture/amplitude data decaying relative to the isoprop locus with increasing amplitude whilst the temperature/buckle length characteristics are more consistent with isoprop's theoretical predictions. Idealised and empathetic loci are added for comparative purposes; experimental loci are 'by-eye' fits. For the twelve tests overall, whilst buckle length data are clustered
Subsea pipeline buckling 243
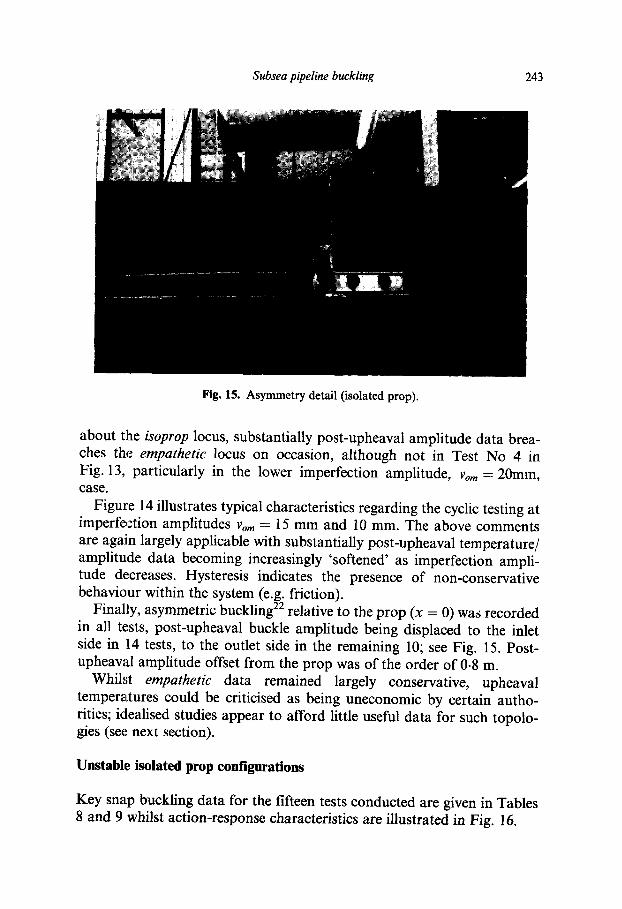
Fig. 15. Asymmetry detail (isolated prop).
about the &oprop locus, substantially post-upheaval amplitude data brea- ches the empathetic locus on occasion, although not in Test No 4 in Fig. 13, particularly in the lower imperfection amplitude, Vom = 20mm, case.
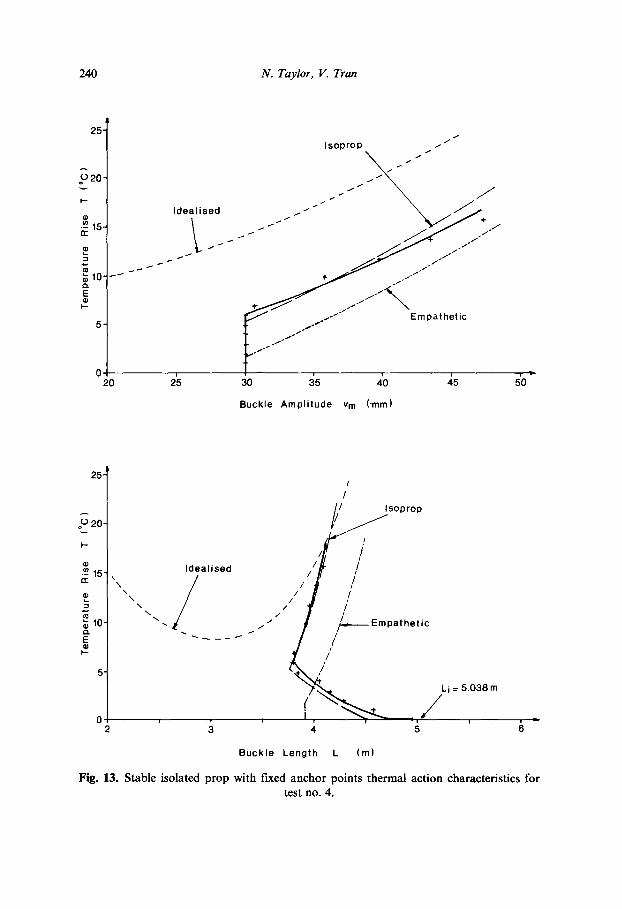
Figure 14 illustrates typical characteristics regarding the cyclic testing at imperfection amplitudes vom = 15 mm and 10 mm. The above comments are again largely applicable with substantially post-upheaval temperature/ amplitude data becoming increasingly 'softened' as imperfection ampli- tude decreases. Hysteresis indicates the presence of non-conservative behaviour within the system (e.g. friction).
Finally, asymmetric buckling 22 relative to the prop (x = 0) was recorded in all tests, post-upheaval buckle amplitude being displaced to the inlet side in 14 tests, to the outlet side in the remaining 10; see Fig. 15. Post- upheawd amplitude offset from the prop was of the order of 0.8 m.
Whilst empathetic data remained largely conservative, upheaval temperatures could be criticised as being uneconomic by certain autho- rities; idealised studies appear to afford little useful data for such topolo- gies (see next section).
Unstable isolated prop configurations
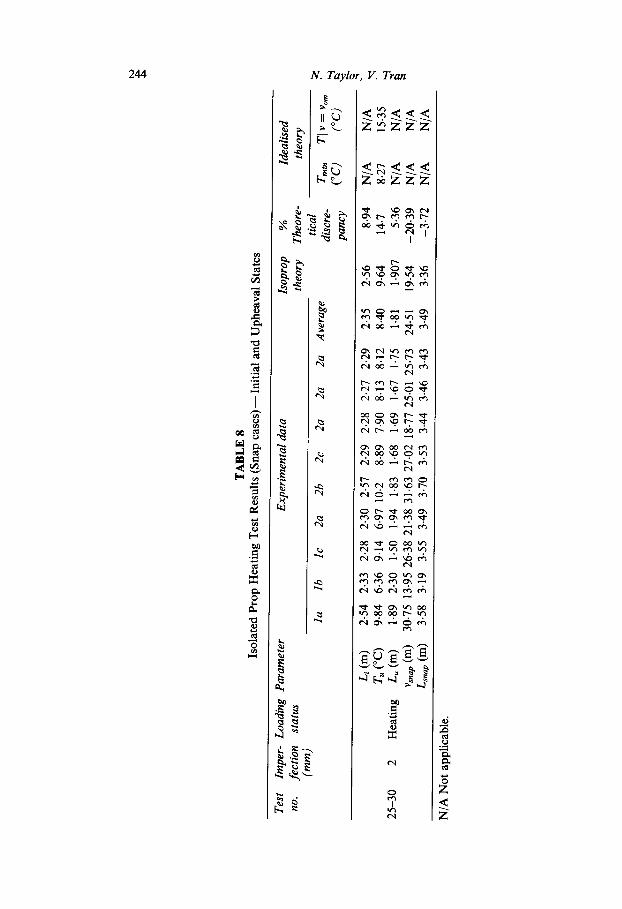
Key snap buckling data for the fifteen tests conducted are given in Tables 8 and 9 whilst action-response characteristics are illustrated in Fig. 16.
to
TA
BL
E 8
Is
olat
ed P
rop
Hea
ting
Tes
t R
esul
ts (
Sna
p ca
ses)
--In
itia
l an
d U
phea
val
Stat
es
Tes
t Im
per-
L
oadi
ng
Par
amet
er
Exp
erim
enta
l da
ta
lsop
rop
%
no.
fect
ion
stat
us
theo
ry
The
ore-
(r
am)
tica
l la
lb
lc
2a
2b
2c
2a
2a
2a
A
vera
ge
disc
re-
panc
y
Idea
lise
d th
eory
Trai
n T
Iv =
Yor
e (°
c)
(°c)
25-3
0 2
Li(
m)
2.54
2
.33
2.2
8 2
-30
2.5
7 2
.29
2.2
8 2
-27
2.2
9
2.3
5
2.56
8.
94
N/A
T
u(°C
) 9.
84
6.3
6 9
.14
6-9
7 1
0-2
8
.89
7.9
0 8
.13
8.1
2 8.
40
9-64
14
.7
8.27
H
eatin
g L
u(m
) 1.
89
2-3
0
1.5
0
1.9
4
1.8
3
1-6
8 1
.69
1
.67
1.
75
1.8
1
1.9
07
5.
36
N/A
Vs
nap (
m)
30-7
5 13
-95
26.3
8 21
.38
31.6
3 27
.02
18.7
7 25
.01
25
.73
2
4-5
1
19
.54
-2
0.39
N
/A
Ls~
ap(m
) 3
.58
3-1
9 3
.55
3.4
9 3
.70
3.5
3
3.4
4 3
.46
3.4
3 3.
49
3.36
-3
.72
N
/A
N/A
15
.35
N/A
N
/A
N/A
N/A
Not
app
licab
le.
TA
BL
E 9
Is
olat
ed P
rop
Cyc
lic T
herm
al T
est
Res
ults
(S
nap
case
s)--
Init
ial,
Uph
eava
l, R
etur
n to
Pro
p (v
m =
v~
) an
d F
inal
Sta
tes
Test
Im
perf
ectio
n Lo
adin
g P
aram
eter
no
. (r
am)
stat
us
Exp
erim
enta
l da
ta
la
lb
lc
2a
2b
2c
Ave
rage
Isop
rop
% T
heor
etic
al
Idea
lised
the
ory
theo
ry
disc
repa
ncy
Train
T
I v
=
Vom
(o
c)
(oc)
34--
39
2
Hea
ting
Li
(m)
Tu (°
C)
Lu (
m)
v~ap
(m)
Lsn
ap (m
) T
u r,t
urn
(m)
2"56
2
"33
2
"31
2
"29
2
"55
2"3
0 2"
39
9"73
7
"60
9
"07
7
-07
8
"82
9-4
0 8"
61
1"89
2
"33
1
"49
2
"07
2
"01
1"
67
1"91
28
"96
22"3
3 24
"37
19"8
t 26
"48
28"3
0 25
"04
3"57
3
-33
3'
55
3"2
3
3"4
1
3"66
3-
46
5"89
5
"69
6
"30
5
"95
5
"09
6"1
3 5-
84
Co
oli
ng
•sn
apre
turn(
nlnl)
22.4
1 17
.63
15.9
7 10
.84
14.2
2 2
2-1
4
17.2
0 Lu
pre.
s,,ap
(m)
3.26
3
.18
3
.05
2.
80
3.2
3
3.49
3.
17
Lu p
ost-s
nap (
m)
t-72
2
-33
1
.53
2
.08
2
.03
1-
69
1.90
Li
ret
urn (
m)
2.5
5
2-3
3
2.30
2.
29
2.5
5
2.37
2.
40
2.56
7.
11
N/A
N
/A
9.64
11
.96
8-2
7
15
.35
1-
907
-0.1
6
N/A
N
/A
19.5
4 -2
1.9
N
/A
N/A
3.
36
-2.8
9
N/A
N
/A
7.67
31
.3
8.2
7
15
.35
8-
76
-49.
1 N
/A
N/A
2-
66
-16.
1 N
/A
N/A
1.
95
2.63
N
/A
N/A
2.
56
6-67
N
/A
N/A
~r
N/A
Not
app
licab
le,
to
4~
246 N. Taylor, V. Tran
I-.
2C o~ ¢/J
n-
o~
o~
o . E 10
I--
3o~
IsoproPX /.~..2~..,i
I . Idealised ~-~//H"
. . . . . . . . . . . o Empathetic
0 ~ ~ i i i
0 10 20 3'0 4'0 SO ~ B u c k l e A m p l i t u d e v m ( r n m )
30
o ,, _ / / ~- \ Isoprop
-I f ¢
.~ 20 Idealised ~ / / t r ~\ \
,, /.7/
- : Y ~ - . . . . ~ - ~ " athetic
4--
i 2~Li=2.~m i •
Buckle Length L (m)
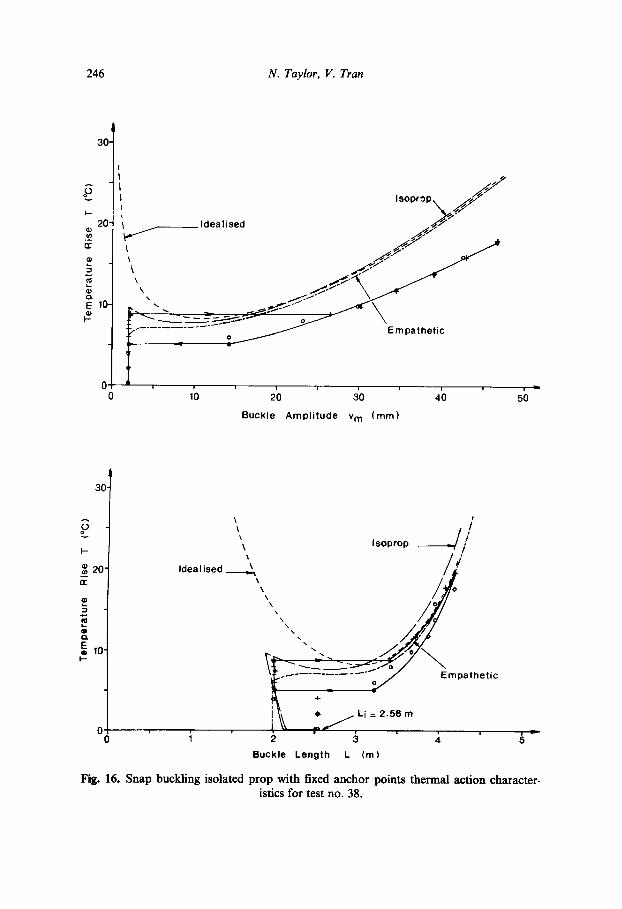
Fig. 16. Snap buckling isolated prop with fixed anchor points thermal action character- istics for test no. 38.
Subsea pipeline buckling 247
The reduction of amplitude from the order of 3D (Vom = 30 mm) to D/5 is unsurprisingly accompanied by an increased experimental/theoretical discrepancy regarding isoprop's predicted upheaval temperature which is herein non-conservative by some 13-6% with respect to the overall experimental average. The empathetic model, however, provides a conser- vative upheaval temperature throughout (6-11 °C). The four experimental values which are particularly low occupy configurations lb and 2a and Tests 31-33, see Table 4, represent an attempt to investigate this factor by concentrating on the latter configuration. The latter three tests gave more consistent results although these clearly remain susceptible to the as-laid residual stressing levels discussed previously.
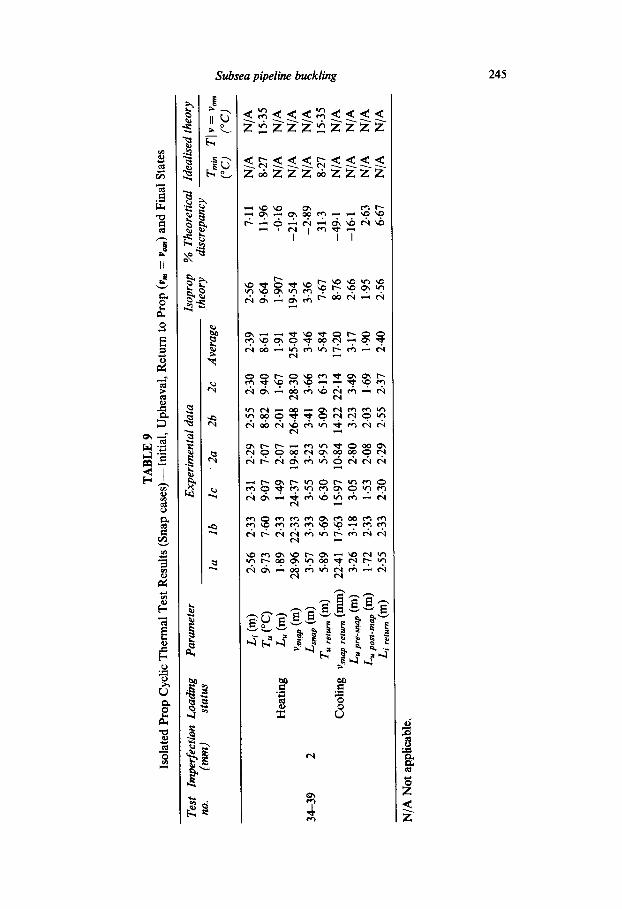
As in the former tests, the isoprop upheaval length prediction correlates excellently with experimental observation, being within 3.15% of the overall experimental average. Similar accuracy is reflected in the first post- snap buckling length data (i.e. Lsnap in Tables 8 and 9) which is considered particularly notable given the substantial dynamic snap and damping activity attending these tests although post-snap amplitude experimental/ theoretical data correlation is not so robust. Despite the double snap that occurs in the six cyclic tests, experimental upheaval and initial buckle/ wavelengths Lu and L; display remarkable recovery characteristics (97% and 99-6% respectively).
As illustrated by Fig. 16, recovery (i.e. cooling) values for upheaval temperature and pre-return-snap amplitude and buckle length are not comparable with their heating-up counterparts by definition. Actual measurement of these geometric variables under test incurs particular difficulties discussed later. The general features of the loci illustrated in Fig. 16 are fairly typical of the tests concerned with the enforced heating up/cooling down snap divergence clearly displayed and following upon any system hysteresis. Experimental amplitude data decay prominently beyond even the empathetic locus although buckle length data are more in line with the empathetic model's predictions.
Asyrnmetry 22 was again present through the tests. Indeed, the substan- tial dynamic snap activity involved resulted in the interchanging of post- upheawd buckle length bias in four tests. Tests 31-33 which involved consecutive retesting of the same configuration--the pipe was not detached from the test rig between tests--generated a common post- upheawd bias for the three tests.
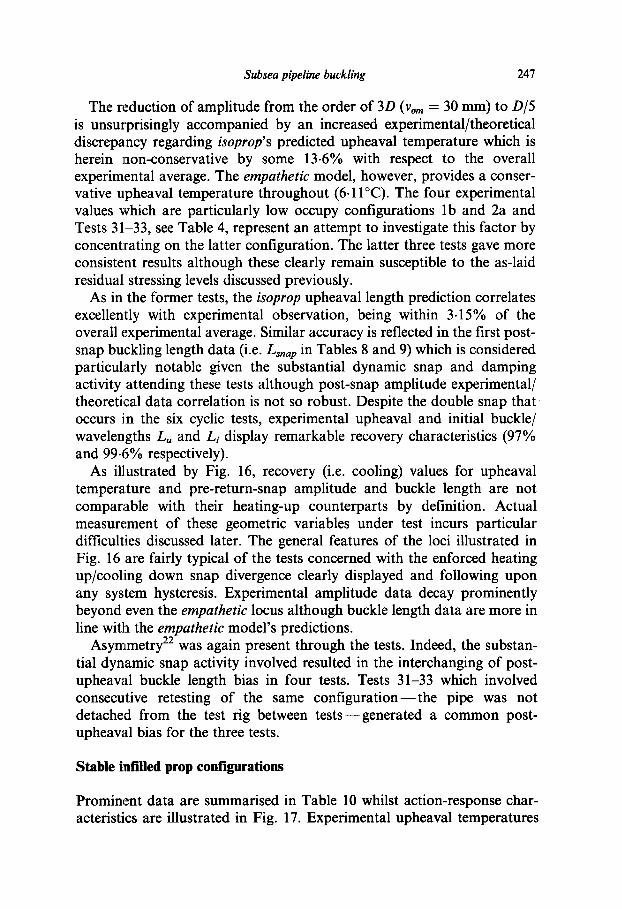
Stable infiHed prop configurations
Prominent data are summarised in Table 10 whilst action-response char- acteristics are illustrated in Fig. 17. Experimental upheaval temperatures
bo
4
~
oo
TA
BL
E 1
0 In
fill
ed P
rop
Tes
t R
esul
ts (
Sta
ble
case
s)--
Init
ial
and
Uph
eava
l S
tate
s
Test
n
o.
Impe
rfec
tion
(mm
) Lo
adin
g st
atus
P
aram
eter
E
xper
imen
tal
data
B
liste
r th
eory
**
la
lb
lc
Ave
rage
% T
heor
etic
al
Idea
lised
the
ory
disc
repa
ncy
Trai
n T
l v
=
Vo~
(°
c)
(°c)
40--
42
30
43-4
5 20
Hea
ting
Hea
ting
L,. (
m)
4.62
4-
84
4-76
4.
74
5.04
T~
(°C
) 2.
30
2-60
2.
50
2.47
1.
0 ~
2.02
Lu
(m
) 2.
50*
2.30
* 2.
40*
2.40
* 1.
0 ~
2.28
L
/(m
) 4.
18
4.39
4.
12
4.23
4-
55
Tu
(°C
) 2.
70
2.60
2.
90
2.73
1.
22 ~
2.
37
Lu
(m)
2.40
* 2-
10"
2.20
* 2-
23*
0.97
~
2.22
6.33
N
/A
N/A
-5
9.5
--~
-18-
2 8.
27
14-1
-5
5-0
~ -5
.0
N/A
N
/A
7-56
N
/A
N/A
.~
-5
5.3-
--,
13.2
8.
27
9.80
-5
6.5
~ -0
.4
N/A
N
/A
N/A
Not
app
lica
ble.
*
Ear
lies
t po
ssib
le v
isib
le/p
hysi
cal m
easu
rem
ents
. **
Fir
st n
umbe
r at
uph
eava
l is
val
ue a
t 10
0-5%
Vom
, sec
ond
at 1
05%
Vom
--se
e T
able
2.
Subsea pipeline buckling 249
6 p-
n "
$ ¢L E I.-
30-
20
10
\
i t 3 Tests
\
/ / Blister "
/ / ~ , , / j / - / i / "
Idealised
I ~" . / / / -
7 , ; - " L o J ~ \ ; , ~ .~ . . , . r Empathet ic
1'o 20 ao ' ,~o ' 5'0" Buckle Ampl i tude v m ( ram)
30~
=~ tdeal ised ~ Bl ister -J / ,.- ~ 7 / / ® 20 ' , , , , , ////'//,, ._= nr"
/ ' \ , / / ' / .t
=~ lO 3 Tests , . . ,/,,'+ o /
. ~ j ~ ,~ Empathet ic
o o .... ~ ~ ~ ,~ ~, .... g - -
Theoretical Lu=O.975m Buckle Length L (m) ( 100.05% Yore - see Table 2 )
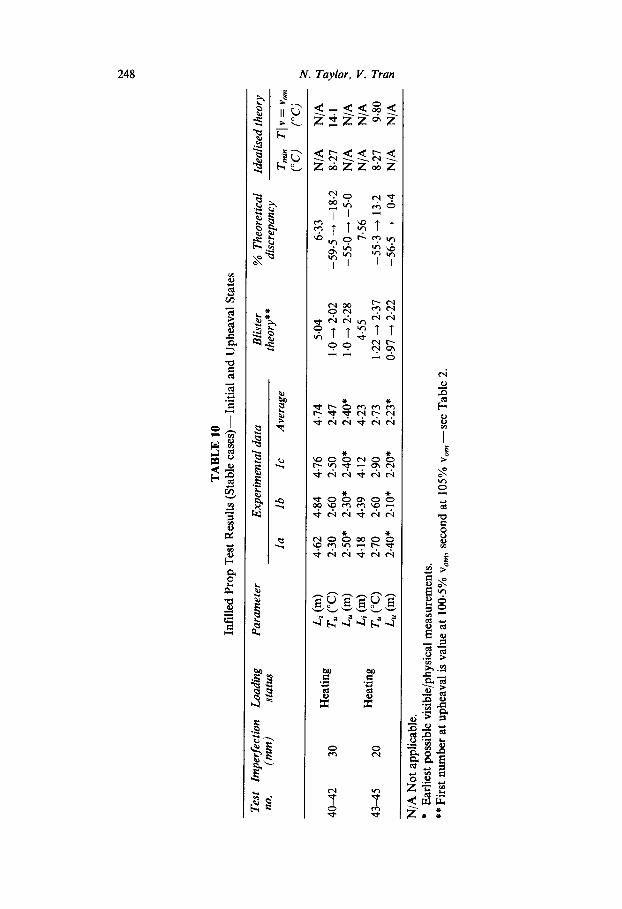
Fig. 17. Stable infilled prop with fixed anchor points thermal action characteristics for test nos 43, 44 and 45.
250 N. Taylor, II. Tran
and buckle lengths are consistent but before further theoretical compar- isons are drawn, both the blister model's numerical sensitivity and the experimental system's limitations in the vicinity of the upheaval state must be considered.
The upper and lower theoretical upheaval temperatures and wave- lengths given in Table 10 for each imperfection case correspond to numerically terminating the search for upheaval as Vm tends to Vom at Ym = 100.05% Vom - - recall Table 2 - - a n d F m = 105% Vom respectively. As in the previous isolated prop cases, whilst the corresponding experimental upheaval temperatures are precisely acquired from the make-and-break system discussed previously, the experimental upheaval wavelengths are subject to a discrete delay in acquisition. Temperatures discussed herein are as monitored from the pipe wall whilst the applied or controlled temperature of the water is subject to discrete incremental increase. With upheaval generally occurring mid-increment, the necesary delay in recording the corresponding wavelength with particular regard to the infilled prop is to be noted given the previously discussed difficulty in acquiring the buckle length and the sensitivity of the measurement itself (i.e. wavelength is increasing rapidly from zero through the thermal increment). This sensitivity is reflected in the blister data; Table 10 indi- cates that as Vm increases by less than 5% post-upheaval, corresponding temperature rise and buckle length data effectively double in magnitude. Accordingly, the acceptable correlation between experimental upheaval data and theoretical values corresponding to Vm = 105% Vom is considered to provide adequate assessment. Theoretical upheaval temperatures are again conservative (up to 20%) and initial buckle length values are within approximately 5% of their respective experimental averages. Initial wave- length values, both experimental (which are herein affected by imperfec- tion 'construction') and theoretical (blister), are of similar form to their isoprop equivalents denoted in Table 10.
The graphical path data illustrated in Fig. 17 and relating to all three Vo m z 20 mm tests exhibits good experimental consistency. Decay of the experimental data from the respective theoretical loci is similar to that previously noted in the isoprop studies.
Asymmetric buckling 22 invariably occurred with the post-upheaval amplitude displaced typically up to 200 mm towards the inlet in four of the six tests. The construction of an adequate infilled prop imperfection is clearly far more difficult than that of a simple prop and buckle length monitoring was tedious. (It was considered more productive to undertake cyclic and snap testing employing the former, isolated prop configura- tion).
Empathet ic model upheaval temperature data was conservative
Subsea pipeline buckling 251
throughout, note the discussions accompanying eqns (33) and (34) here, whilst idealised modelling again appears to have little to offer regarding this form of imperfection with Vom > D.
DISCUSSION
Notwithstanding the experimental considerations given below, particu- larly with regard to the matter of scaling effects, it is considered that highly satisfactory experimental/theoretical correlation has been estab- lished with respect to the crucial upheaval state. Predicted pre-upheaval flexure associated with the isolated prop topology has been observed and the approximately 50% reduction in upheaval temperatures caused by infilling of the attendant voids has been confirmed by experiment. Offshore designers need to prevent infilling wherever possible. Snap or stable responses were correctly identified by the isoprop and blister models. The inverse relationship between upheaval temperature and imperfection amplitude recorded in Table 2 has also been confirmed although there is a consideration to be made, see below, as isolated prop upheawd temperatures, in the presence of fixed anchor points, rise with increasing imperfection amplitude for Yore = 15, 20 and 30 mm (note Tables 45, 8 and 9).
With the thermal data of Table 2 dependent upon zero pre-upheaval friction force activation, and therefore zero corresponding axial move- ment, the foregoing relationship is suitably unaffected by the inclusion of fixed anchor points with respect to the blister and empathetic models. However, the previously discussed limitation upon the inclusion of isoprop's thermal upheaval expression within Table 2 is further supported by the implication that the associated pre-upheaval axial movement may typically include activation of any (additional) fixed anchor points with repercussions for upheaval response being further dependent on variables such as anchor spacing and capacity. Accordingly, a numerical investiga- tion was conducted employing isoprop with the experimental pipe data; this shows that the inverse temperature/imperfection amplitude relation- ship is valid for 0-5 < D/vom < 10 with upheaval temperature mutually increasing with initial imperfection for 0-3 <D/vom < 0-5. At upheaval, isoprop model data suggests 0-93 N < Fap < 229 N as 2 mm < Yore < 30 mm.
Given the previously noted status of residual or as-laid stress treatment within the isoprop and blister models, upheaval temperature data experi- mental/theoretical correlation varies inversely with imperfection ampli- tude a,i anticipated. Tables 8 and 9 suggest that the as-laid, more particularly as-delivered, imperfections become significant for the case of
252 N. Taylor, II. Tran
1)ore = 2 mm although the concomitant snap action at this amplitude additionally results in increased modelling difficulty. It is considered that this observation supports the stress-free-when-deformed assumption made with regard to the synthetic (i.e. amplitude Vom) imperfections; eqn (20), for example, would suggest an invariant upheaval experimental/theore- tical correlation 6' 18,21 with respect to Vom, although the small scale and relatively low static stressing levels are to be noted.
Isolated prop experimentation was more readily constructed to an acceptable standard and upheaval state experimental/theoretical correla- tion was correspondingly superior to that exhibited in the equivalent (Yore) infilled prop studies. Experimental path data display consistency although experimental/theoretical (isoprop and blister) correlation decays with increasing post-buckling deformation. Post-upheaval temperature/wave- length characteristics are superior to their temperature/amplitude equiva- lents in accordance with eqn (5) in this respect. Indeed, the cyclic tests displayed high degrees of system recoverability in terms of pipe return to initial wavelength despite the presence of hysteresis perceived to be influ- enced by friction force action. Further, this friction force activity, when coupled with the snap-related dynamic response in the vo,, = 2 mm case, will surely adversely affect the corresponding experimental data.
Note should be made regarding the robust performance of the empa- thetic model which generated conservative upheaval temperatures throughout the forty-five tests. The post-upheaval behavioural loci were also largely conservative, particularly regarding the larger imperfection amplitude tests. Idealised modelling appears to offer little regarding upheaval state definition although it is capable of providing a conservative T, ni,, in cases where T,, > T,,,i,, (i.e. some cases of low imperfection ampli- tude snap buckling as typified by Fig. 16). Furthermore, whilst idealised behavioural loci act as envelopes to respective empathetic model loci, isoprop and blister loci can intersect the associated idealised envelope as shown in Figs 14, 16 and 17. This would appear to contradict the concept of imperfection loci converging towards idealised systems as post-buckling develops due to the proportionately diminishing effect of the initial imperfection and is worthy of consideration. Whilst all three models display idealised convergence behaviour with regard to buckling force/ wavelength characteristics, typified by Table 1, only the empathetic model insists upon employing the idealised vm/L 4 relationship of eqn (5) throughout. It thereby provides an accurate mathematical interpretation of the contact surface half-space upon which the corresponding idealised modelling is based 'upto' and including the upheaval state--i .e, v,,, ---, vo,, as L ~ Lo such that Vom/Lo 4 ~- vm/L 4.
Importantly, the isoprop and blister models do not provide the same Vr,,/
Subsea pipeline buckling 253
L 4 relationship; at upheaval, isoprop generates Vom/Lu = Vom/(O'96Lo) for a common imperfection amplitude Vom such that Vom/Lu 4 : l'17Vom/Lo 4. These ratios are incompatible with the idealised relationship and suggest that isoprop solutions for amplitude and wavelength will invariably breach the corresponding idealised envelopes. Additionally, although the isoprop upheawd amplitude/wavelength ratio is within 4% of the idealised value, this is achieved with a crown curvature approximately 50% in excess of the empathetic/idealised equivalent as shown by eqns (11) and (21); note Table 2 also. Conversely, whilst the blister upheaval amplitude/wavelength ratio is clearly and similarly at odds with its idealised equivalent, be it infinite if based upon a theoretical wavelength L,, = 0, or equal to Vo,,,/ (1.29Lo) if rather more nominally based upon the initial infilled prop topology wavelength Li as illustrated in Fig. 6, the upheaval curvature of eqn (171) is identical with the empathetic/idealised equivalent of eqn (11) as previously noted. Summarising, only the empathetic model provides for idealised vm/L 4- compatible characteristics although both the isoprop and blister models display either amplitude/wavelength or crown curvature characteristics in keeping with their shared physical roots. The underlying physics of these models are, however, neither mutually identical with, nor totally sympathetic to, the perceived idealised equivalent. As discussed previously, the blister model relates to a non-empathetic curved half-space for L < Li whilst the isoprop model provides for flexural action to occur in the absence of upheaval buckling with cusp upheaval occurring upon reversal of wavelength characteristics. The blister model generates idea- lised loci intersections more readily than the isoprop model, that is they occur at lower temperatures for a common initial amplitude, with, again noting eqn (5), temperature/wavelength loci in turn intersecting more readily than their temperature/amplitude counterparts. Indeed, isoprop does afford temperature/amplitude loci of a substantially convergent (i.e. to the respective idealised locus) nature, numerical studies to-date employing prototype parameters suffering loci intersection only beyond the elastic range. ~8
The key factors involved in subsea pipeline buckling, inertial loading and pipe stiffness opposing thermal action in the presence of an imper- fection 'trigger', are not amenable to consistent scaling and it is important to maintain the principal action-response characteristics of the prototype. Figure 9 depicts appropriate data appertaining to D/t ratios. Further, whilst some of the lower D/vom ratios employed in the experiments appear excessively so (e.g. 1/3), taking the D/vom ratio corresponding to the interface between snap and stable response as an indicator shows that the experimental system affords a value of 1.58 against prototype values of l'35/Vom >_ 1.15 relating to pipes in the range 101 mm _< D<_ 406 mm.
254 N. Taylor, 1I. Tran
The above ratios involve the use of fixed anchor points employed at a spacing in accordance with L f a p / D "~ 600 (i.e. 60-240 m regarding the prototype pipe diameters indicated). It is contended that the foregoing ratios are in accord with acceptable practice. Initial imperfections clearly affect both the experimental and prototype systems although claims for direct equivalence cannot be made. Recourse to an imperfection magni- tude Vom = 2 mm, necessary to produce a moderate degree of snap according to the isoprop model, involved an amplitude of only the same order of magnitude of as-laid (on the rigid test bed) undulations elsewhere in the pipe. Attempts to minimise as-laid imperfection effects by increasing the 'synthetic' imperfection whilst maintaining snap response by incor- porating, say, constant force springs to represent burial in addition to trenching, were not implemented as snap could not theoretically be produced at yore = 10 mm even when employing springs which increased the self-weight q by a factor of 150.
Undulations, both vertical and lateral, existed in the respective slip lengths throughout the testing programme and are considered to influence the recorded asymmetric behaviour and system hysteresis. The number of trench-simulating gates employed in the tests was minimised for each imperfection amplitude as interference due to lateral as-laid undulations would result in further adverse effects upon asymmeteric buckling and system hysteresis. Overall, the buckle amplitude tended to be displaced towards the pipe inlet in 27 of the 45 tests, including the common config- uration tests 31-33, and towards the outlet in 15, the remaining 3 tests, all for vom--2 mm, involving significant post-upheaval amplitude bias 'switching'. Indeed, including pre-upheaval data and one isolated data item from Test 27, bias switching occurred in no fewer than 33 of the 45 tests. Pipe wall inlet and outlet temperatures invariably agreed, however, and the above noted proportions of cases regarding amplitude/prop asymmetry surely allay fears of test rig bias per se. Confidence is suppor- ted by the typical nature of Fig. 18, displaying no sign of post-buckling lateral deviance. The declining degree of experimental/theoretical (i.e. isoprop and blister) correlation as buckle length and amplitude increase could conceivably be due to ill-defined residual stress effects causing inelastic softening. However, cyclic recovery factors are good and the possibility of adverse 'end effects' must be considered.
End conditions are always important in testing and it was thought ttiat the experimental L f a p / O "~ 600 ratio appeared very useful in this respect. Furthermore, actual clamping at the prescribed ambient or lock-off temperature involved only transverse pressure, as noted previously, in an attempt to minimise induced distortion of the pipe-specimen (e.g. due to twisting, bending, extension or contraction upon clamping). In the context
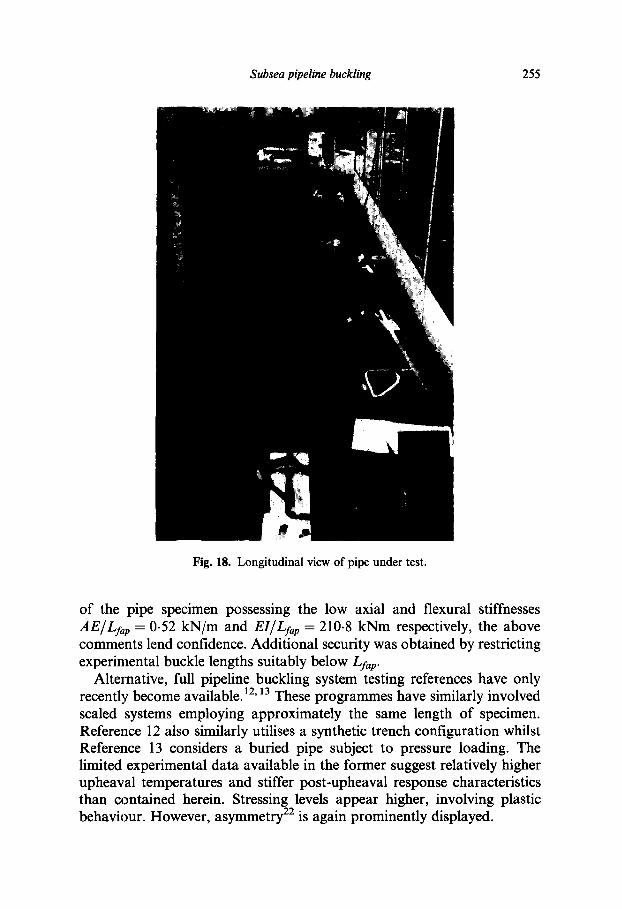
Subsea pipeline buckling 255
Fig. 18. Longitudinal view of pipe under test.
of the pipe specimen possessing the low axial and flexural stiffnesses AE/Lfap = 0-52 kN/m and EI/Lfap = 210.8 kNm respectively, the above comments lend confidence. Additional security was obtained by restricting experimental buckle lengths suitably below Zfa p.
Alternative, full pipeline buckling system testing references have only recently become available. 12' 13 These programmes have similarly involved scaled systems employing approximately the same length of specimen. Reference 12 also similarly utilises a synthetic trench configuration whilst Reference 13 considers a buried pipe subject to pressure loading. The limited experimental data available in the former suggest relatively higher upheaval temperatures and stiffer post-upheaval response characteristics than contained herein. Stressing levels appear higher, involving plastic behaviour. However, asymmetry 22 is again prominently displayed.
256 N. Taylor, II. Tran
Improved experimentation, largely concerned with an increase in scale, would involve substantial financial investment although two specific improvements suggest themselves. Pre-working or flushing of the pipe at high temperatures could reduce residual stress levels in a prototype-like manner whilst the monitoring of wavelength and amplitude, particularly in the vicinity of upheaval require more comprehensive digital logging. The latter point again implies additional cost, particularly with regard to infilled prop testing where the difficulty of providing a valid scaled imperfection proved substantial. Given that the primary objective was to establish upheaval temperatures by experimentation, however, it is considered that highly satisfactory experimental/theoretical correlation has been achieved.
CONCLUSIONS
Both isolated and infilled prop subsea pipeline buckling topologies have been tested. Snap and stable responses have been studied and recovery upon cooling characteristics observed. The three theoretical imperfection models discussed have displayed their own distinct predictive powers within the context of the identified restrictions upon experimentation at small scale. With particular regard to the important upheaval states, the empathetic model is suitably robust whilst the isoprop and blister models afford more economic, but still conservative, data for the larger imper- fection cases wherein the as-delivered residual stress effects were mini- mised. Designers should prevent the infilling of prop-attendant voids wherever possible due to their role in the provision of pre-upheaval flex- ural energy release in the isolated prop case. Further experimental devel- opments in the field will inevitably depend upon the economic factors involved and the degree of risk considered to exist in offshore practice.
REFERENCES
1. Hobbs, R. E., In-service buckling of heated pipes. J. Transportation Engng, ASCE, 110 (1984) 175-188.
2. Taylor, N. & Gan, A. B., Regarding the buckling of pipelines subject to axial loading. J. Constructional Steel Research, 4 (1984) 45-50.
3. Taylor, N. & Gan, A. B., Submarine pipeline buckling-imperfection studies. Thin-Walled Structures, 4 (1986) 295-323.
4. Guijt, J., Upheaval buckling of offshore pipelines; overview and introduction. Proc. 22nd OTC, Houston, Texas, 4 May 1990 pp. 573-578.
5. Pedersen, P. T. & Jensen, J. J., Upheaval creep of buried heated pipeline with initial imperfections. Marine Structures, 1 (1988) 11-22.
Subsea pipeline buckling 257
6. Boer, S. et al., Buckling considerations in the design of the gravel cover for a high temperature oil line. Proc. 18th OTC, Houston, Texas, May 1986.
7. Taylor, N., Richardson, D. & Gan, A. B., On submarine pipeline frictional characteristics in the presence of buckling. Proc. 4th International Symposium on Offshore Mechanics and Arctic Engineering, ASME, Dallas, Texas, February 1985.
8. Taylor, N., Tran, V. C. & Richardson, D., Interface modelling for upheaval subsea pipeline buckling. Proc. 4th International Conference on Computational Methods and Experimental Measurements, Capri, Italy, May 1989, 269-282.
9. Schaminee, P. E. L., Zrn, N. F. & Schotman, G. J. M., Soil response for pipeline upheaval buckling analyses: full-scale laboratory tests and modelling. Proc. 22nd OTC, Houston, Texas, 4, May 19990, 563-572.
10. Nielsen, N. J. R., Lyngberg, B. & Pedersen, P. T., Upheaval buckling failures of insulated burial pipelines--a case story. Proc. 22nd 0 TC, Houston, Texas, 4, May 1990, 581-600.
11. Palmer, A. C., Ellinas, C. P., Richards, D. M. & Guijt, J. Design of submar- ine pipelines against upheaval buckling. Proc. 22nd OTC, Houston, Texas, 4, May 1990, 540-550.
12. Raoof, M. & Maschner, E., Thermal buckling of subsea pipelines. Proc. OMAE, Glasgow, UK, V, June 1993, 21-29.
13. Maltby, M., Upheaval of buried pipelines in a model soil. PhD thesis, Cambridge University, December 1992.
14. Popper, K. R., Objective Knowledge, Revised Edition. Oxford University Press, Oxford, 1989, pp. 14, 121,126.
15. Palmer, A. C. & Baldry, J. A. S., Lateral buckling of axially constrained pipelines. J. Petroleum Technology, 26 (1974) 1283-1284.
16. Tran, V. C., Imperfect upheaval subsea pipeline buckling. PhD thesis, Shef- field Hallam University, May 1994.
17. Taylor, N. & Gan, A. B., Refined modelling for the vertical buckling of submarine pipelines. J. Constructional Steel Research, 7 (1987) 55-74.
18. Taylor, N. & Tran, V. C., Prop-Imperfection subsea pipeline buckling. Marine Structures, 6 (1993) 325-358.
19. Hobbs, R. E. & Liang, F., Thermal buckling of pipelines close to restraints. Proc. OMAE, The Hague, Paper OMAE-89-812 (1989).
20. Kerr, A. D., On the stability of the railroad track in the vertical plane. Rail International, 2 (1974) 131-142.
21. Ju, G. T. & Kyriakides, S., Thermal buckling of offshore pipelines. OMAE, 110 (1988) 355-364.
22. Ballet, J. P. & Hobbs, R. E., Asymmetric effects of prop imperfections on the upheaval buckling of pipelines. Thin-Walled Structures, 13 (1992) 355-373.
23. Pahner, A. C., Hutchinson, G. & Ellis, J. W., Configuration of submarine pipelines during laying operations. J. Engngfor Industry, 96 (1974) 1112- 1118.
24. Taylor, N. & Hirst, P., Strut behaviour: sub-buckling cyclic excursion effects and risk assessment. Res. Mechanica, 28 (1989) 139-189.