Embed Size (px)
Citation preview
Global Humanitarian Assistance
Uganda
Resources for crisis response,
vulnerability and poverty eradication
Kerry Smith
November 2012
Contents Overview ................................................................................................................................................. 1
Crisis ........................................................................................................................................................ 3
Natural disasters ................................................................................................................................. 3
Refugees and internally displaced people .......................................................................................... 4
Poverty .................................................................................................................................................... 5
Human Development Index (HDI) ....................................................................................................... 6
Multidimensional Poverty Index (MPI) ............................................................................................... 6
International response ............................................................................................................................ 8
Official development assistance (ODA) .............................................................................................. 8
Sector spending .................................................................................................................................. 9
Humanitarian aid .............................................................................................................................. 11
Transition .............................................................................................................................................. 13
The role of the government .................................................................................................................. 14
Gross domestic product .................................................................................................................... 14
Government revenues ...................................................................................................................... 15
Government expenditure ................................................................................................................. 16
Domestic responses to address vulnerability and respond to crises ................................................ 17
Other resource flows ............................................................................................................................ 19
Remittances ...................................................................................................................................... 19
Foreign direct investment ................................................................................................................. 19
Ways forward ........................................................................................................................................ 21
Annex 1: ................................................................................................................................................ 23
About us ................................................................................................................................................ 24
Uganda | 1
Uganda
Overview Uganda was formerly a major recipient of humanitarian aid, but more recently has been emerging
from decades of conflict between the Government of Uganda (GoU) and the Lord’s Resistance Army
(LRA) in the north of the country. It is entering a new phase of recovery and reconstruction with an
increased emphasis on domestic investments in anticipating and preparing for disasters.
The LRA were active throughout the 1990s and early 2000s and the conflict forced hundreds of
thousands to flee their homes. During protracted internationally-backed peace negotiations, the LRA
moved out of Uganda and into the Democratic Republic of Congo (DRC) and later the Central African
Republic (CAR) between 2006 and 2008. Although both the GoU and the LRA agreed to end
hostilities in August 2006, negotiations broke down and no peace agreement was ultimately signed.
Whilst the LRA is no longer operationally present in Uganda, they continue aggressive operations in
Eastern DRC and CAR.
The exit of the LRA from Northern Uganda has dramatically improved security and economic
prospects in that part of the country and in 2010 the Government and humanitarian actors
concluded that the humanitarian crisis in Uganda was over and symbolically no longer warranted a
Consolidated Appeals Process (CAP) appeal in 2011. By March 2011 the United Nations Office for the
Coordination of Humanitarian Affairs (OCHA) had closed its office in Gulu district.
Official development assistance (ODA) has been an important resource for both meeting
humanitarian needs and enabling poverty reduction in Uganda. ODA has increased from US$1.1
billion in 2000 and has remained stable in volume terms at US$1.7 billion in 2010 (based on constant
2010 prices).
The politics of development in Uganda have changed significantly in recent years, moving away from
a donor-driven poverty agenda towards a focus on growth and structural transformation. Uganda
has moved from being one of the poorest countries in the world to having a fast growing economy.
Between 2000 and 2011 its gross domestic product (GDP) grew at an average rate of around 7.9%.
Revenues from natural resources potentially offer good prospects for economic growth with the
discovery of oil in the Lake Albertine region in 2007. Related to this increased fiscal space, the
relative importance and indeed the absolute volumes of domestic government revenues (in terms of
taxes) have grown rapidly, from US$6 million in 1998 to US$3.5 billion in 2010.
Uganda has made impressive progress in terms of poverty reduction, despite having a rapidly
growing population (which has nearly doubled between the early 1990s and 2010). Less than a
quarter of the population now lives below the national poverty line, down from just under a third in
2006 and the country is on track to meet the Millennium Development Goals on hunger, gender

Global Humanitarian Assistance
equality, HIV/AIDS treatment and access to safe water (although recent evidence suggests that HIV
infections are on the rise again).
However, not everyone has benefited from Uganda’s development. Over seven and a half million
people still live in absolute poverty and poverty levels in the North are twice that of the rest of the
country. Life expectancy at birth is only 54.1 years (just below the sub-Saharan average of 54.4
years) and the under-5 mortality rate is 128 out of 1000 live births (the second lowest in the region
after Burundi). Since the beginning of 2011 Uganda has experienced severe price increases for food
crops, fuel and most consumer goods.1 Inflation has been extremely unstable in recent years; in
October 2011 it reached 30.5%, the highest rate for 20 years.2 As of September 2012 it has fallen to
5.4%.3 The government now faces a number of challenges in addressing regional disparities in basic
services and economic development in the North as well as dealing with economic volatility and
increasing frequency of natural disasters.
This briefing paper analyses a variety of resource flows to and within Uganda – which include
humanitarian and other types of aid, domestic government resources, foreign direct investment and
remittances. The analysis is situated within the context of Uganda’s challenges in addressing
humanitarian crises, vulnerability and poverty.
1 Uganda Humanitarian Profile, Reliefweb,
http://reliefweb.int/sites/reliefweb.int/files/resources/uganda_humanitarian_profile__2012.pdf 2 “World Bank forecasts tight 2012/13 budget”, Daily Monitor http://www.monitor.co.ug/Business/Prosper/-/688616/1369246/-
/bomkpc/-/index.html 3 UBOS: http://www.ubos.org/onlinefiles/uploads/ubos/cpi/cpiSeptember2012/FINAL_CPI_release_Sep.pdf
Uganda | 3
Crisis
Natural disasters
Uganda is emerging from decades of conflict in the North and continues to be vulnerable to disasters
including floods and droughts. As a largely agricultural society, the impact of natural hazards
increases its vulnerability.
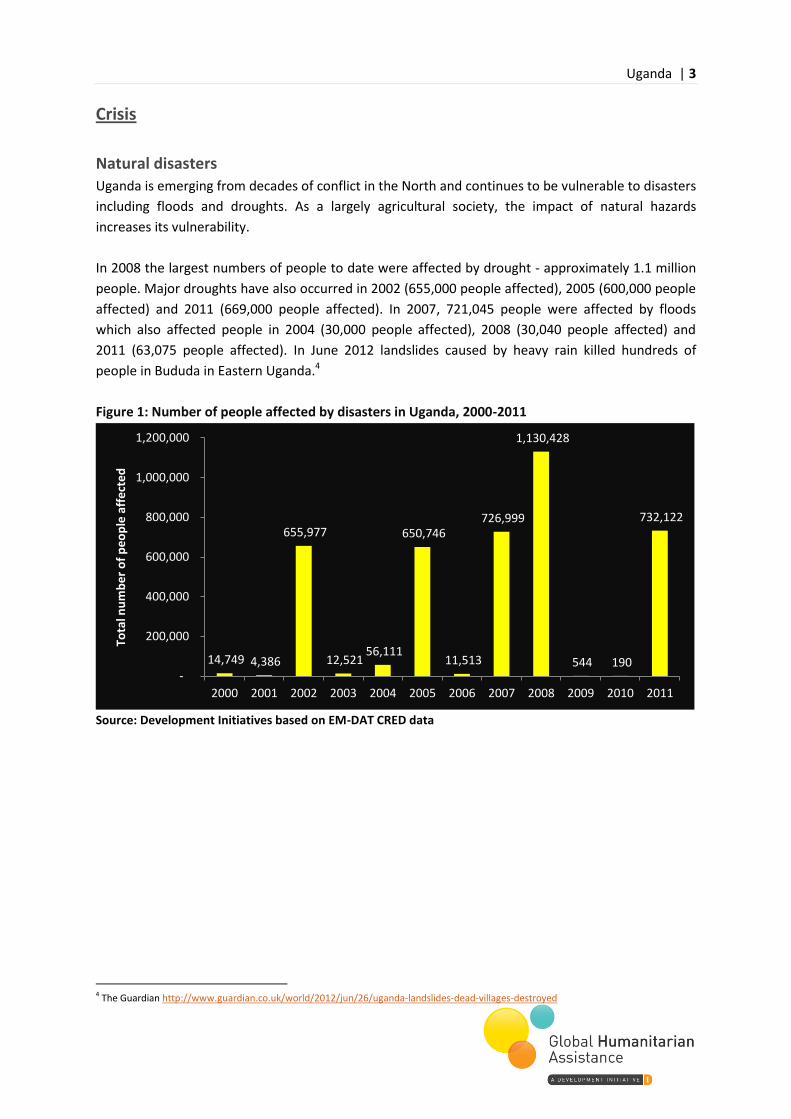
In 2008 the largest numbers of people to date were affected by drought - approximately 1.1 million
people. Major droughts have also occurred in 2002 (655,000 people affected), 2005 (600,000 people
affected) and 2011 (669,000 people affected). In 2007, 721,045 people were affected by floods
which also affected people in 2004 (30,000 people affected), 2008 (30,040 people affected) and
2011 (63,075 people affected). In June 2012 landslides caused by heavy rain killed hundreds of
people in Bududa in Eastern Uganda.4
Figure 1: Number of people affected by disasters in Uganda, 2000-2011
Source: Development Initiatives based on EM-DAT CRED data
4 The Guardian http://www.guardian.co.uk/world/2012/jun/26/uganda-landslides-dead-villages-destroyed
14,749 4,386
655,977
12,521 56,111
650,746
11,513
726,999
1,130,428
544 190
732,122
-
200,000
400,000
600,000
800,000
1,000,000
1,200,000
2000 2001 2002 2003 2004 2005 2006 2007 2008 2009 2010 2011
Tota
l nu
mb
er
of
pe
op
le a
ffe
cte
d

Global Humanitarian Assistance
Refugees and internally displaced people Since 2006 the number of refugees hosted by Uganda has nearly halved from 271,007 to 135,801 in
2010. The number of refugees originating from Uganda has also declined.
Figure 2: Number of refugees hosted in and originating from Uganda, 2004-2010
Source: Development Initiatives based on UNHCR data
Uganda has hosted large refugee populations fleeing conflict in neighbouring countries for many
years – hosting the largest number in 2006 (272,007 people), the majority of whom came from
Sudan (approximately 253,000). Recently however, an increasing number of refugees from the
Democratic Republic of Congo (DRC) have begun to arrive in Uganda as the conflict intensifies – in
2009 this was just under 76,500. Uganda also hosts refugees from Somalia and Rwanda.
Internal conflict in the country resulted in a significant proportion of Ugandans being internally
displaced – with the Acholi sub-region being most affected by the LRA’s activities. Whilst the conflict
began in 1988, large-scale displacement did not start until 1996, when the government moved
people in the Acholi region into camps under its “protected villages” policy. By the end of 2005, a
total of 1.8 million people (approximately 6% of the population) across the country had been moved
into Internally Displaced People (IDP) camps (UNHCR, 2012).
In November 2011, the United Nations (UN) Security Council estimated that there were around
80,000 people still living in six camps in Northern Uganda.5 The Internal Displacement Monitoring
Centre (iDMC) now believes there are around 30,000 IDPs still in camps. The majority of those still
confined to camps lack financial resources to move home, are elderly, disabled or unwell, or have no
land to return to. For those who have left the camps and returned to their villages, reintegration is a
fragile process and conditions in the areas to which they return are often worse than in the camps.
5 UN Security Council, Report of the Secretary-General on the Lord’s Resistance Army-affected areas pursuant to Security Council press
statement, 4/11/2011, http://www.un.org/ga/search/view_doc.asp?symbol=S/2011/693&referer=/english/&Lang=E
250,482 257,256 272,007
228,959
162,132
127,345 135,801
35,244 32,038 21,752 21,341
7,548 7,554 6,441
-
50,000
100,000
150,000
200,000
250,000
300,000
2004 2005 2006 2007 2008 2009 2010
Refugees in Uganda Refugees from Uganda

Uganda | 5
Ongoing problems for returnees include inadequate basic services and access to water; fragile food
security; remote health and educational services; insufficient law and order structures in areas of
return; disputes over land and property; limited support to rebuild livelihoods and cattle raids. The
iDMC reports that some IDPs have gone back to camps in order to access basic services.
Poverty Uganda has shown impressive progress in reducing national poverty rates, with the proportion of
the population living in absolute poverty falling from 56.6% in 1992/1993 to 24.5% in 2009/2010. It
is commendable that the number of people in poverty has reduced whilst at the same time
population rates have grown. However, a more detailed analysis of multi-dimensional poverty
(below) shows that poverty rates are still high in Northern Uganda.
Figure 3: Poverty status 1992-2010
Year Total population
(millions)
Population of absolute
poor (millions)
Absolute poor (%)
1992/93 17.5 9.9 56.6%
1999/00 21.9 7.4 33.8%
2002/03 24.1 9.3 38.6%
2005/06 27.4 8.5 31.1%
2009/10 30.7 7.5 24.5%
Source: Development Initiatives based on Poverty Status Report 2012 and World Bank WDIs
Uganda’s Vision 2040 draft paper is an ambitious government strategy outlining plans to “transform
Ugandan society from a peasant to a modern and prosperous country within 30 years”.6 The key
components of Vision 2040 focus are:
a. Independence and sovereignty
b. Democracy and the rule of law
c. Stability and peace
d. Knowledgeable and skilled
e. Able to exploit and use its resources gainfully and sustainably
f. A strong federated East Africa with an effective African Common Market and a strong
African Defence Mechanism.
The Vision’s poverty goals are equally ambitious - the number of people living below the national
poverty line is targeted to fall from 25% in 2010 to 5% by 2040. Other social development targets
include increasing the proportion of the population with access to electricity from 11% to 80% and
increasing the percentage of the population with access to safe piped water from 15% to 80%.
6 Vision 2040 draft http://www.npa.ug/docs/Visionzerodraft.pdf
Global Humanitarian Assistance
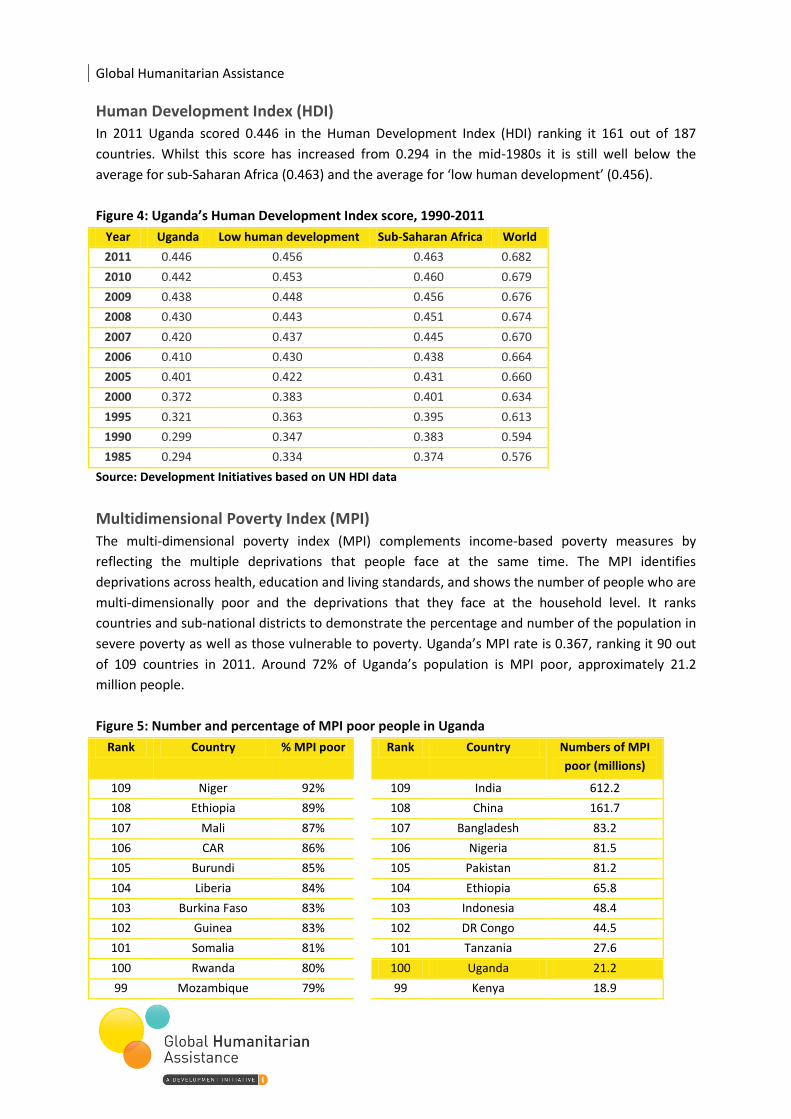
Human Development Index (HDI) In 2011 Uganda scored 0.446 in the Human Development Index (HDI) ranking it 161 out of 187
countries. Whilst this score has increased from 0.294 in the mid-1980s it is still well below the
average for sub-Saharan Africa (0.463) and the average for ‘low human development’ (0.456).
Figure 4: Uganda’s Human Development Index score, 1990-2011
Year Uganda Low human development Sub-Saharan Africa World
2011 0.446 0.456 0.463 0.682
2010 0.442 0.453 0.460 0.679
2009 0.438 0.448 0.456 0.676
2008 0.430 0.443 0.451 0.674
2007 0.420 0.437 0.445 0.670
2006 0.410 0.430 0.438 0.664
2005 0.401 0.422 0.431 0.660
2000 0.372 0.383 0.401 0.634
1995 0.321 0.363 0.395 0.613
1990 0.299 0.347 0.383 0.594
1985 0.294 0.334 0.374 0.576
Source: Development Initiatives based on UN HDI data
Multidimensional Poverty Index (MPI)
The multi-dimensional poverty index (MPI) complements income-based poverty measures by
reflecting the multiple deprivations that people face at the same time. The MPI identifies
deprivations across health, education and living standards, and shows the number of people who are
multi-dimensionally poor and the deprivations that they face at the household level. It ranks
countries and sub-national districts to demonstrate the percentage and number of the population in
severe poverty as well as those vulnerable to poverty. Uganda’s MPI rate is 0.367, ranking it 90 out
of 109 countries in 2011. Around 72% of Uganda’s population is MPI poor, approximately 21.2
million people.
Figure 5: Number and percentage of MPI poor people in Uganda
Rank Country % MPI poor Rank Country Numbers of MPI
poor (millions)
109 Niger 92% 109 India 612.2
108 Ethiopia 89% 108 China 161.7
107 Mali 87% 107 Bangladesh 83.2
106 CAR 86% 106 Nigeria 81.5
105 Burundi 85% 105 Pakistan 81.2
104 Liberia 84% 104 Ethiopia 65.8
103 Burkina Faso 83% 103 Indonesia 48.4
102 Guinea 83% 102 DR Congo 44.5
101 Somalia 81% 101 Tanzania 27.6
100 Rwanda 80% 100 Uganda 21.2
99 Mozambique 79% 99 Kenya 18.9

Uganda | 7
98 Angola 77% 98 Mozambique 18.1
97 Sierra Leone 77% 97 Nepal 18.0
96 Comoros 74% 96 Myanmar 14.3
95 DR Congo 73% 95 Viet Nam 14.2
94 Uganda 72% 94 Madagascar 13.5
93 Malawi 72% 93 Niger 12.4
92 Benin 72% 92 Philippines 12.1
91 Timor-Leste 68% 91 Burkina Faso 12.1
90 Madagascar 67% 90 Mali 11.8
Source: Development Initiatives based on MPI data
Interestingly, when Ugandan district-level MPI data is included, five districts score higher than the
Uganda MPI value of 0.0367 and six districts are equal to or more than the national percentage of
multi-dimensionally poor people, 72%. It is clear that the low MPI rates in Kampala (0.088 or 21%),
which are comparable to Indonesia, bring down the national average of Uganda’s already high MPI
values and percentages. The percentage of MPI poor people in the North (86%) and West Nile (83%)
districts of Uganda is higher than the national percentage for Somalia (81%). The North of Uganda is
still the poorest district in the country and poverty eradication initiatives and social development
programmes will need to prioritise these areas.
Figure 6: Sub-national analysis of MPI rates and proportions in Uganda
Rank Country MPI Rank Country % MPI poor
117 Niger 0.642 117 Niger 92%
116 Ethiopia 0.562 116 Ethiopia 89%
115 Mali 0.558 115 Mali 87%
114 Burkina Faso 0.536 114 CAR 86%
113 Burundi 0.530 113 North 86%
112 Somalia 0.514 112 Burundi 85%
111 CAR 0.512 111 Liberia 84%
110 Mozambique 0.512 110 Burkina Faso 83%
109 Guinea 0.506 109 Guinea 83%
108 Liberia 0.485 108 West Nile 82%
107 North 0.459 107 Somalia 81%
106 Angola 0.452 106 Rwanda 80%
105 Sierra Leone 0.439 105 Western 80%
104 West Nile 0.431 104 Mozambique 79%
103 Rwanda 0.426 103 Southwest 78%
102 Western 0.417 102 Angola 77%
101 Benin 0.412 101 Sierra Leone 77%
100 Comoros 0.408 100 Eastern 76%
99 DR Congo 0.393 99 Comoros 74%
98 Southwest 0.393 98 DR Congo 73%
97 Senegal 0.384 97 East Central 72%
96 Malawi 0.381 96 Malawi 72%
Global Humanitarian Assistance
95 Eastern 0.378 95 Benin 72%
94 Tanzania 0.367 94 Timor-Leste 68%
93 East Central 0.361 93 Madagascar 67%
92 Timor-Leste 0.360 92 Senegal 67%
91 Madagascar 0.357 91 Tanzania 65%
90 Cote d'Ivoire 0.353 90 Nepal 65%
Source: Development Initiatives based on OPHI MPI data. Note: Highlighted yellow areas represent regions
in Uganda
International response
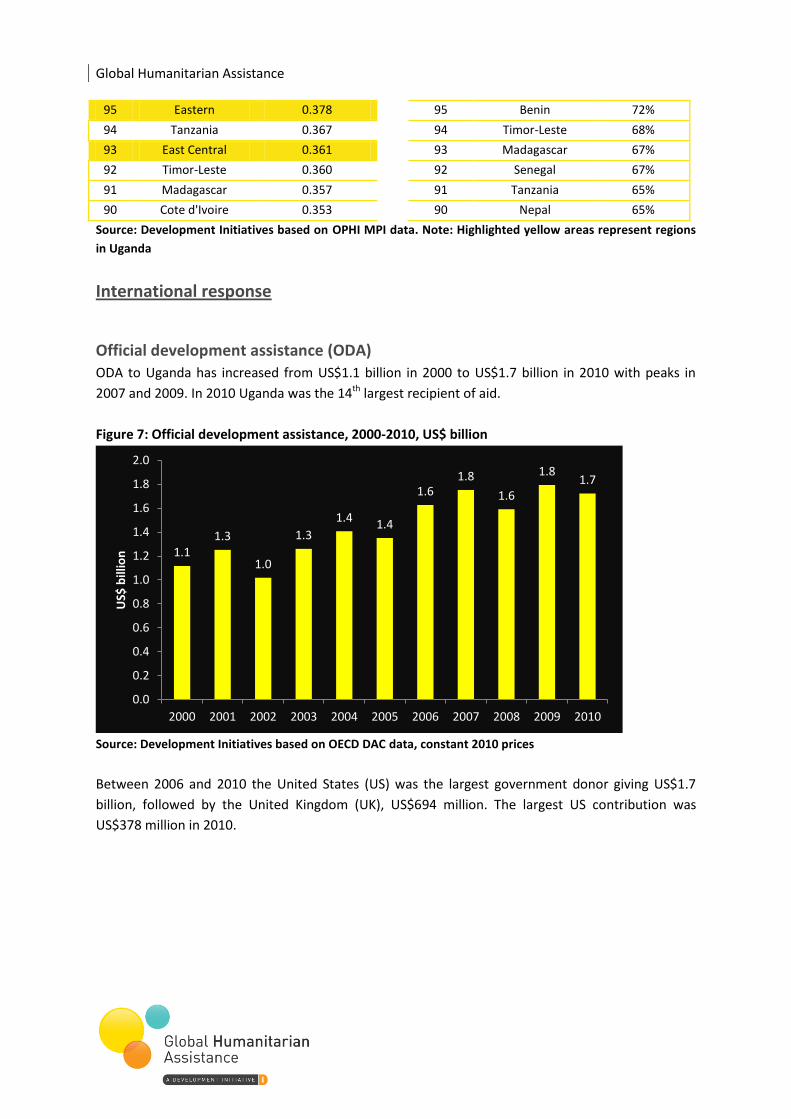
Official development assistance (ODA)
ODA to Uganda has increased from US$1.1 billion in 2000 to US$1.7 billion in 2010 with peaks in
2007 and 2009. In 2010 Uganda was the 14th largest recipient of aid.
Figure 7: Official development assistance, 2000-2010, US$ billion
Source: Development Initiatives based on OECD DAC data, constant 2010 prices
Between 2006 and 2010 the United States (US) was the largest government donor giving US$1.7
billion, followed by the United Kingdom (UK), US$694 million. The largest US contribution was
US$378 million in 2010.
1.1 1.3
1.0
1.3
1.4 1.4
1.6 1.8
1.6
1.8 1.7
0.0
0.2
0.4
0.6
0.8
1.0
1.2
1.4
1.6
1.8
2.0
2000 2001 2002 2003 2004 2005 2006 2007 2008 2009 2010
US$
bill
ion
Uganda | 9
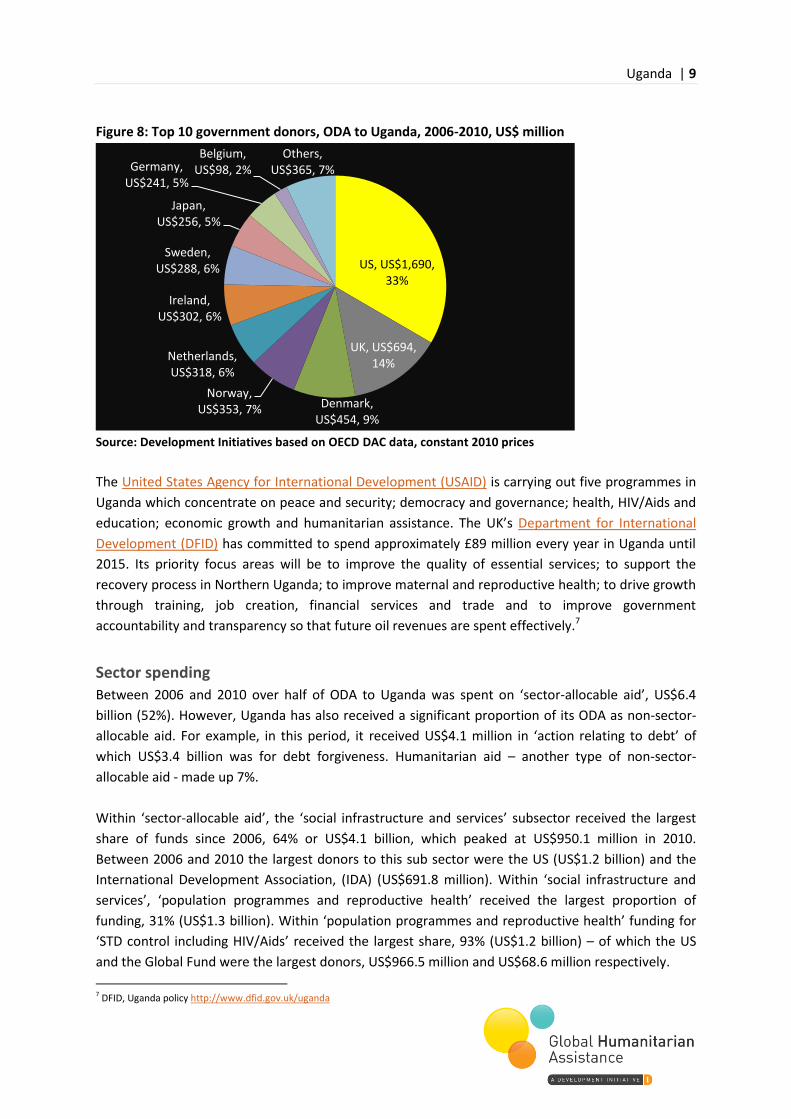
Figure 8: Top 10 government donors, ODA to Uganda, 2006-2010, US$ million
Source: Development Initiatives based on OECD DAC data, constant 2010 prices
The United States Agency for International Development (USAID) is carrying out five programmes in
Uganda which concentrate on peace and security; democracy and governance; health, HIV/Aids and
education; economic growth and humanitarian assistance. The UK’s Department for International
Development (DFID) has committed to spend approximately £89 million every year in Uganda until
2015. Its priority focus areas will be to improve the quality of essential services; to support the
recovery process in Northern Uganda; to improve maternal and reproductive health; to drive growth
through training, job creation, financial services and trade and to improve government
accountability and transparency so that future oil revenues are spent effectively.7
Sector spending
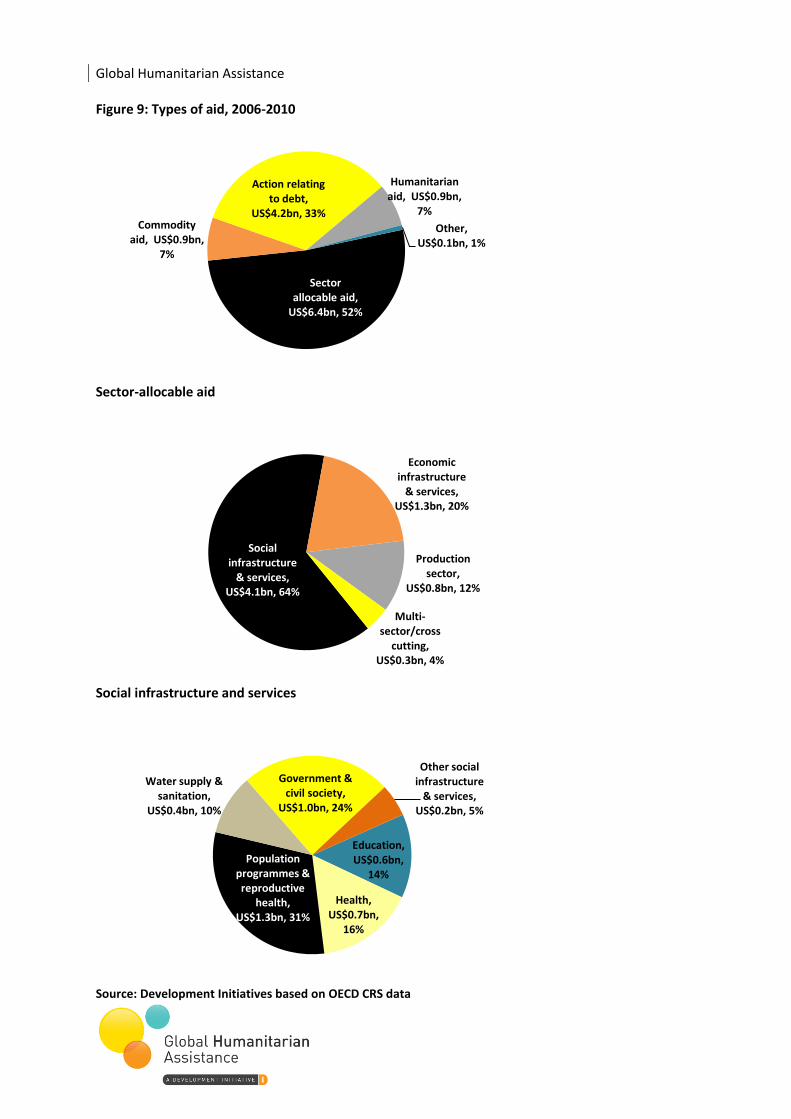
Between 2006 and 2010 over half of ODA to Uganda was spent on ‘sector-allocable aid’, US$6.4
billion (52%). However, Uganda has also received a significant proportion of its ODA as non-sector-
allocable aid. For example, in this period, it received US$4.1 million in ‘action relating to debt’ of
which US$3.4 billion was for debt forgiveness. Humanitarian aid – another type of non-sector-
allocable aid - made up 7%.
Within ‘sector-allocable aid’, the ‘social infrastructure and services’ subsector received the largest
share of funds since 2006, 64% or US$4.1 billion, which peaked at US$950.1 million in 2010.
Between 2006 and 2010 the largest donors to this sub sector were the US (US$1.2 billion) and the
International Development Association, (IDA) (US$691.8 million). Within ‘social infrastructure and
services’, ‘population programmes and reproductive health’ received the largest proportion of
funding, 31% (US$1.3 billion). Within ‘population programmes and reproductive health’ funding for
‘STD control including HIV/Aids’ received the largest share, 93% (US$1.2 billion) – of which the US
and the Global Fund were the largest donors, US$966.5 million and US$68.6 million respectively.
7 DFID, Uganda policy http://www.dfid.gov.uk/uganda
US, US$1,690, 33%
UK, US$694, 14%
Denmark, US$454, 9%
Norway, US$353, 7%
Netherlands, US$318, 6%
Ireland, US$302, 6%
Sweden, US$288, 6%
Japan, US$256, 5%
Germany, US$241, 5%
Belgium, US$98, 2%
Others, US$365, 7%
Global Humanitarian Assistance
Figure 9: Types of aid, 2006-2010
Sector-allocable aid
Social infrastructure and services
Source: Development Initiatives based on OECD CRS data
Sector allocable aid,
US$6.4bn, 52%
Commodity aid, US$0.9bn,
7%
Action relating to debt,
US$4.2bn, 33%
Humanitarian aid, US$0.9bn,
7%
Other, US$0.1bn, 1%
Social infrastructure
& services, US$4.1bn, 64%
Economic infrastructure
& services, US$1.3bn, 20%
Production sector,
US$0.8bn, 12%
Multi-sector/cross
cutting, US$0.3bn, 4%
Education, US$0.6bn,
14%
Health, US$0.7bn,
16%
Population programmes & reproductive
health, US$1.3bn, 31%
Water supply & sanitation,
US$0.4bn, 10%
Government & civil society,
US$1.0bn, 24%
Other social infrastructure
& services, US$0.2bn, 5%
Uganda | 11
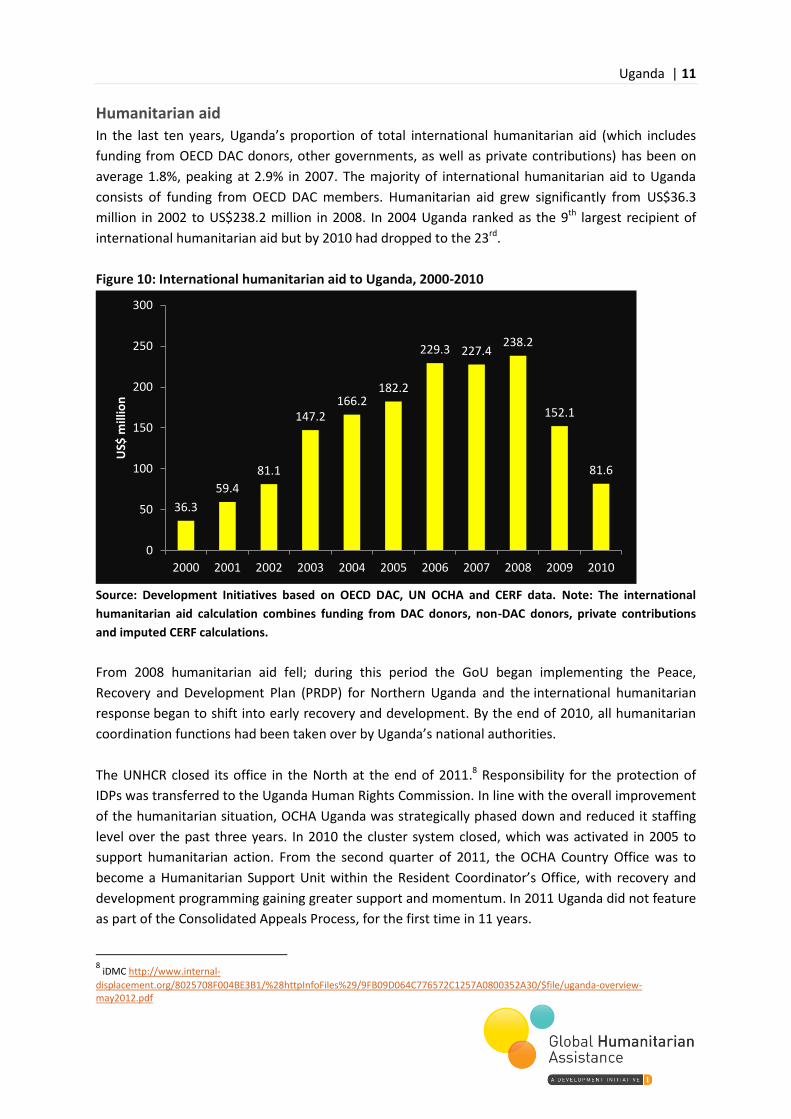
Humanitarian aid In the last ten years, Uganda’s proportion of total international humanitarian aid (which includes
funding from OECD DAC donors, other governments, as well as private contributions) has been on
average 1.8%, peaking at 2.9% in 2007. The majority of international humanitarian aid to Uganda
consists of funding from OECD DAC members. Humanitarian aid grew significantly from US$36.3
million in 2002 to US$238.2 million in 2008. In 2004 Uganda ranked as the 9th largest recipient of
international humanitarian aid but by 2010 had dropped to the 23rd.
Figure 10: International humanitarian aid to Uganda, 2000-2010
Source: Development Initiatives based on OECD DAC, UN OCHA and CERF data. Note: The international
humanitarian aid calculation combines funding from DAC donors, non-DAC donors, private contributions
and imputed CERF calculations.
From 2008 humanitarian aid fell; during this period the GoU began implementing the Peace,
Recovery and Development Plan (PRDP) for Northern Uganda and the international humanitarian
response began to shift into early recovery and development. By the end of 2010, all humanitarian
coordination functions had been taken over by Uganda’s national authorities.
The UNHCR closed its office in the North at the end of 2011.8 Responsibility for the protection of
IDPs was transferred to the Uganda Human Rights Commission. In line with the overall improvement
of the humanitarian situation, OCHA Uganda was strategically phased down and reduced it staffing
level over the past three years. In 2010 the cluster system closed, which was activated in 2005 to
support humanitarian action. From the second quarter of 2011, the OCHA Country Office was to
become a Humanitarian Support Unit within the Resident Coordinator’s Office, with recovery and
development programming gaining greater support and momentum. In 2011 Uganda did not feature
as part of the Consolidated Appeals Process, for the first time in 11 years.
8 iDMC http://www.internal-
displacement.org/8025708F004BE3B1/%28httpInfoFiles%29/9FB09D064C776572C1257A0800352A30/$file/uganda-overview-may2012.pdf
36.3
59.4
81.1
147.2 166.2
182.2
229.3 227.4 238.2
152.1
81.6
0
50
100
150
200
250
300
2000 2001 2002 2003 2004 2005 2006 2007 2008 2009 2010
US$
mill
ion

Global Humanitarian Assistance
Since 2006 the US has been the largest humanitarian aid donor to Uganda, and EU institutions have
collectively been the second largest, giving a total of US$231.5 million and US$178.2 million
respectively. Since 2008 there has been a significant drop in humanitarian contributions from donors
as their priorities focus on post-conflict transition programmes, such as infrastructure development
and cash for work, especially in the North.
Figure 11: Top ten donors of humanitarian aid to Uganda, 2006-2010, US$ million
Rank 2006 US$m 2007 US$m 2008 US$m 2009 US$m 2010 US$m
1 US 59.0 US 66.9 EU 53.8 EU 34.8 EU 23.1
2 UK 50.2 EU 38.0 US 58.8 US 27.5 US 19.3
3 EU 28.5 UK 22.6 UK 36.2 UK 25.6 Germany 9.0
4 Netherlands 23.5 Sweden 18.1 Sweden 15.4 Sweden 13.5 Japan 7.1
5 Sweden 16.1 Norway 17.4 Spain 13.9 Spain 12.7 Spain 6.3
6 Germany 13.3 Netherlands 16.7 Germany 15.6 Germany 10.9 Sweden 6.1
7 Canada 9.9 Germany 14.4 Netherlands 21.7 Netherlands 10.4 France 4.6
8 Norway 9.1 Canada 10.6 Canada 7.0 Canada 8.6 UK 4.5
9 France 7.1 Denmark 9.8 Norway 11.9 Norway 8.1 Italy 3.9
10 Ireland 7.0 Italy 8.3 France 10.0 France 7.1 Belgium 3.9
Source: Development Initiatives based on OECD DAC and UN OCHA FTS
The largest proportions of both humanitarian aid and ODA are channelled through multilateral
organisations. However, a higher proportion of ODA is channelled through the public sector (27%)
and more humanitarian aid is channelled through NGOs and civil society (24%).
Figure 12: Channel of delivery: official development assistance and humanitarian aid, 2006-2010
Source: Development Initiatives based on OECD DAC CRS data
10%
24%
0%
52%
3%
11% 27%
8%
0%
33%
5%
27%
Public Sector
NGOs & Civil Society
Public-Private Partnerships (PPP)
Multilateral Organisations
Other
To be defined
ODA
Humanitarian aid
Uganda | 13
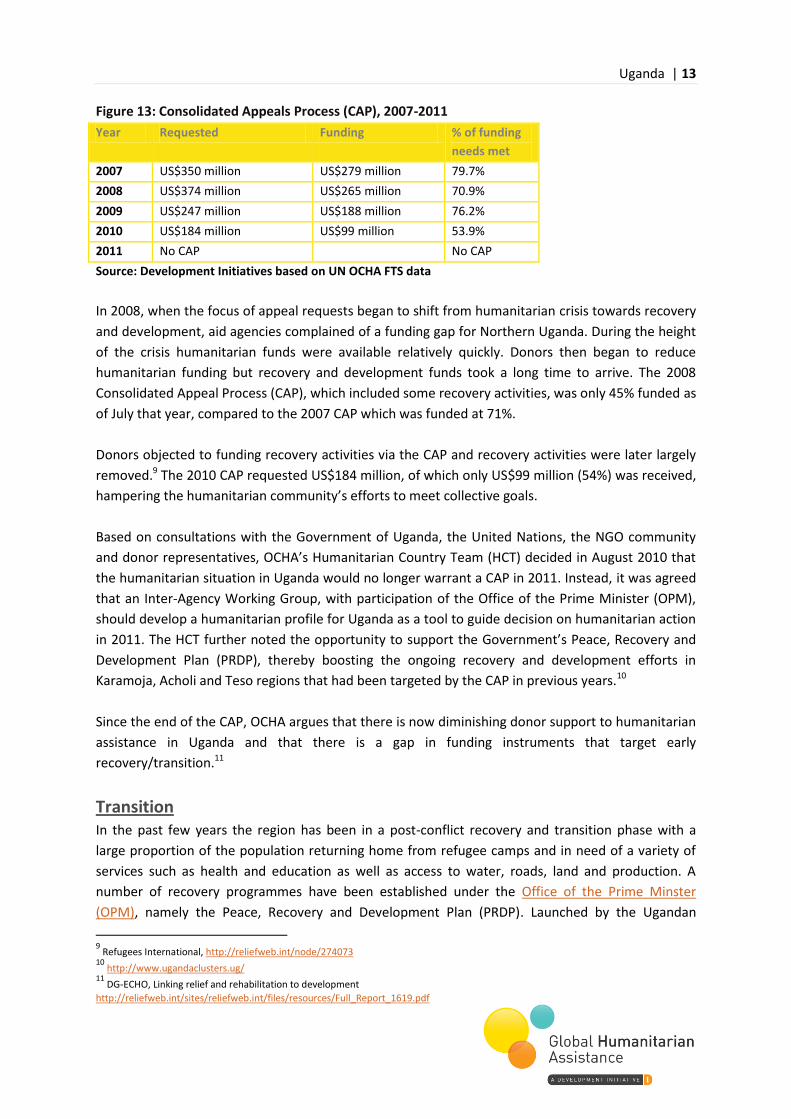
Figure 13: Consolidated Appeals Process (CAP), 2007-2011
Year Requested Funding % of funding
needs met
2007 US$350 million US$279 million 79.7%
2008 US$374 million US$265 million 70.9%
2009 US$247 million US$188 million 76.2%
2010 US$184 million US$99 million 53.9%
2011 No CAP No CAP
Source: Development Initiatives based on UN OCHA FTS data
In 2008, when the focus of appeal requests began to shift from humanitarian crisis towards recovery
and development, aid agencies complained of a funding gap for Northern Uganda. During the height
of the crisis humanitarian funds were available relatively quickly. Donors then began to reduce
humanitarian funding but recovery and development funds took a long time to arrive. The 2008
Consolidated Appeal Process (CAP), which included some recovery activities, was only 45% funded as
of July that year, compared to the 2007 CAP which was funded at 71%.
Donors objected to funding recovery activities via the CAP and recovery activities were later largely
removed.9 The 2010 CAP requested US$184 million, of which only US$99 million (54%) was received,
hampering the humanitarian community’s efforts to meet collective goals.
Based on consultations with the Government of Uganda, the United Nations, the NGO community
and donor representatives, OCHA’s Humanitarian Country Team (HCT) decided in August 2010 that
the humanitarian situation in Uganda would no longer warrant a CAP in 2011. Instead, it was agreed
that an Inter-Agency Working Group, with participation of the Office of the Prime Minister (OPM),
should develop a humanitarian profile for Uganda as a tool to guide decision on humanitarian action
in 2011. The HCT further noted the opportunity to support the Government’s Peace, Recovery and
Development Plan (PRDP), thereby boosting the ongoing recovery and development efforts in
Karamoja, Acholi and Teso regions that had been targeted by the CAP in previous years.10
Since the end of the CAP, OCHA argues that there is now diminishing donor support to humanitarian
assistance in Uganda and that there is a gap in funding instruments that target early
recovery/transition.11
Transition In the past few years the region has been in a post-conflict recovery and transition phase with a
large proportion of the population returning home from refugee camps and in need of a variety of
services such as health and education as well as access to water, roads, land and production. A
number of recovery programmes have been established under the Office of the Prime Minster
(OPM), namely the Peace, Recovery and Development Plan (PRDP). Launched by the Ugandan
9 Refugees International, http://reliefweb.int/node/274073
10 http://www.ugandaclusters.ug/
11 DG-ECHO, Linking relief and rehabilitation to development
http://reliefweb.int/sites/reliefweb.int/files/resources/Full_Report_1619.pdf
Global Humanitarian Assistance
Government in 2007 and implemented in 2009, PRDP’s budget consisted of US$600 million for
Northern Uganda. It had four strategic objectives: consolidation of state authority; rebuilding and
empowering communities; revitalising the economy and peace-building and reconciliation. The first
phase is coming to a close (2009-2012) and the second phase commenced in July 2012 for the period
2012-2015.
Other programmes under PRDP include Agricultural Livelihood Recovery Project for Northern
Uganda (ALREP), Northern Uganda Social Action Fund (NUSAF), Northern Uganda Rehabilitation
Programme (NUREP), Karamoja Livelihoods Programme (KALIP) and Northern Uganda Transition
Initiative (NUTI). All development actors including government and non-government agencies are
expected to align their interventions in Northern Uganda against the PRDP framework.
In June 2009 the UN launched a three-year Peacebuilding and Recovery Programme (UNPRAP) to
align UN interventions with the PRDP and other government frameworks for Northern Uganda.
According to UNHCR, important development initiatives, such as the Recovery and Development
Initiative for Northern Uganda, have focused primarily on commercial agriculture and
manufacturing.
The role of the government Uganda has seen impressive economic growth in recent years which has led to increased fiscal space
for government spending on development. At the same time, the government has developed a
number of important commitments and policies to address poverty, regional under-development
and disaster risk reduction.
Gross domestic product
Uganda’s gross domestic product (GDP) has grown from US$423.1 million in 1996 to US$16.8 billion
in 2011 – however there have been dips in growth in 1980 (down 71.9% or US$894 million) and 1989
(down 23.4% or US$1.2 billion). More recently, between 2010 and 2011 GDP volumes fell by just
under US$400 million from US$17.2 billion to US$16.8 billion, marking a 2.3% fall. The African
Economic Outlook (AEO) correlates the 2011 slowdown to political protests in the lead up to
elections, a rise in inflation, exchange rate depreciation and an increased trade deficit.
In 2011 GDP per capita was down to US$487 (from US$515 in 2010) ranking it the 11th lowest GDP
per capita rate globally, just higher than Central African Republic (US$483) and just below Guinea
(US$502). However GDP per capita is up from US$256 in 2002.

Uganda | 15
Figure 14: Uganda’s gross domestic product (GDP), volume and percentage change
Source: Development Initiatives based on World Bank, World Development Indicators data
Government revenues Uganda’s tax body forms an integral part of domestic revenues and include taxes levied by the state
and grants that are received by government units from foreign governments or organisations. Taxes
have grown substantially from US$0.6 billion in 1998 to US$3.5 billion in 2010, marking an increasing
amount of government revenues to address poverty within the country.
Figure 15: Government revenues 1998-2010
Source: Development Initiatives based on IMF Government Financial Statistics, Uganda
In early 2012 approximately 2.5 billion barrels of oil had been confirmed along the Albertine rift in
western Uganda and the Government has plans to build the country's first oil refinery, which will be
a key element of their strategy to maximise revenue. Oil is expected to generate more than US$2
-80%
-60%
-40%
-20%
0%
20%
40%
60%
-
2
4
6
8
10
12
14
16
18
20
19
60
19
62
19
64
19
66
19
68
19
70
19
72
19
74
19
76
19
78
19
80
19
82
19
84
19
86
19
88
19
90
19
92
19
94
19
96
19
98
20
00
20
02
20
04
20
06
20
08
20
10
US$
bill
ion
GDP volume % change
0.3 0.3 0.5 1.2 1.0 1.0 0.9 0.9 0.7 0.6 0.6 0.7 0.9
0.6 0.8 0.8
0.9 1.0 1.1 1.3 1.5 1.9 2.2 2.6
3.1
3.5
0.0
0.5
1.0
1.5
2.0
2.5
3.0
3.5
4.0
4.5
5.0
1998 1999 2000 2001 2002 2003 2004 2005 2006 2007 2008 2009 2010
US$
bill
ion
Total Taxes
Total Grants
Global Humanitarian Assistance
billion per year (10-15% of current GDP) once commercial production begins in three to five years’
time.12
Government expenditure
The politics of development in Uganda have changed significantly in recent years, moving away from
a donor-driven poverty agenda towards a focus on growth and structural transformation. The
underlying drivers of this shift include:
Uganda’s declining reliance on traditional sources of aid
the return of multi-party politics
the discovery of oil reserves.
These have significantly altered the relational basis of development policy-making in Uganda
between government and donors, and also between the finance ministry and civil society. The
National Development Plan (NDP) reflects and captures these shifts and exhibits significant
differences to the earlier PEAP, in terms of both content and process. In essence, the NDP can be
seen as a form of preparation for the expected arrival of serious levels of oil exploitation from 2015
onwards, the aim being to prepare the infrastructural and human resource capacities required to
ensure that the oil reserves are fully exploited.13
Uganda’s national budget has grown from US$1.2 billion (UGX1.8 trillion) in 1999/2000 to over
US$3.8 billion (UGX9.6 trillion) in 2011/2012. This increase in national budgets is marked by growth
in domestic revenues as well as aid flows. Government expenditures are divided into two main
categories: development expenditure (domestic and donor financed development) and recurrent
expenditure (which includes wage and non-wage). Recurrent expenditures make up a larger
percentage of budgeted resources than development. Donor resources captured in this analysis are
multilateral and bilateral expenditures channelled through government units.14
12
“Fresh calls for transparency on Ugandan oil”, the Guardian, March 2012, http://www.guardian.co.uk/global-development/2012/mar/21/transparency-compensation-uganda-oil-sector 13
Beyond the poverty agenda Insights from the new politics of development in Uganda, Chronic Povery Research Centre, http://www.dfid.gov.uk/r4d/PDF/Outputs/ChronicPoverty_RC/WP221-Hickey.pdf 14
There are other donor funds spent outside the normal budget cycle such as expenditures through government special programs, non-government channels and humanitarian assistance. Such funds not registered in the main budgeting system have not been captured in this analysis.
Uganda | 17
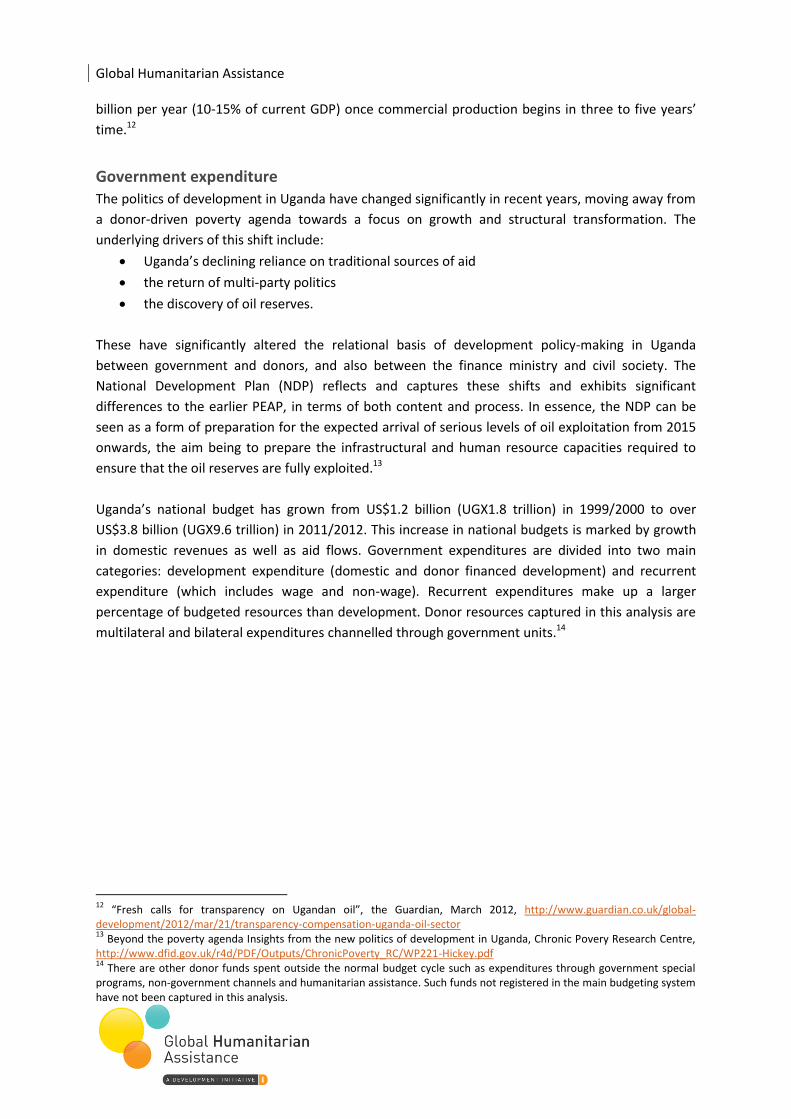
Figure 16: Budget disaggregation and donor contribution
Source: Development Initiatives based on MFPED approved estimates of revenue and expenditures
From 1999 to 2012 the government has increased spending on domestic development activities
from US$194 million to over US$ 1.2 billion. Donors have also increased development spending from
US$359 million to US$743 million in the same period. However, the percentage of donor
contributions has reduced from 34% in 2000/2001 to 19% in 2011/12.
Domestic responses to address vulnerability and respond to crises
Domestic government budgetary allocations towards disaster preparedness and response are
reflected in the Office for the Prime Minister (OPM) budget for Disaster Preparedness, Management
and Refugees.
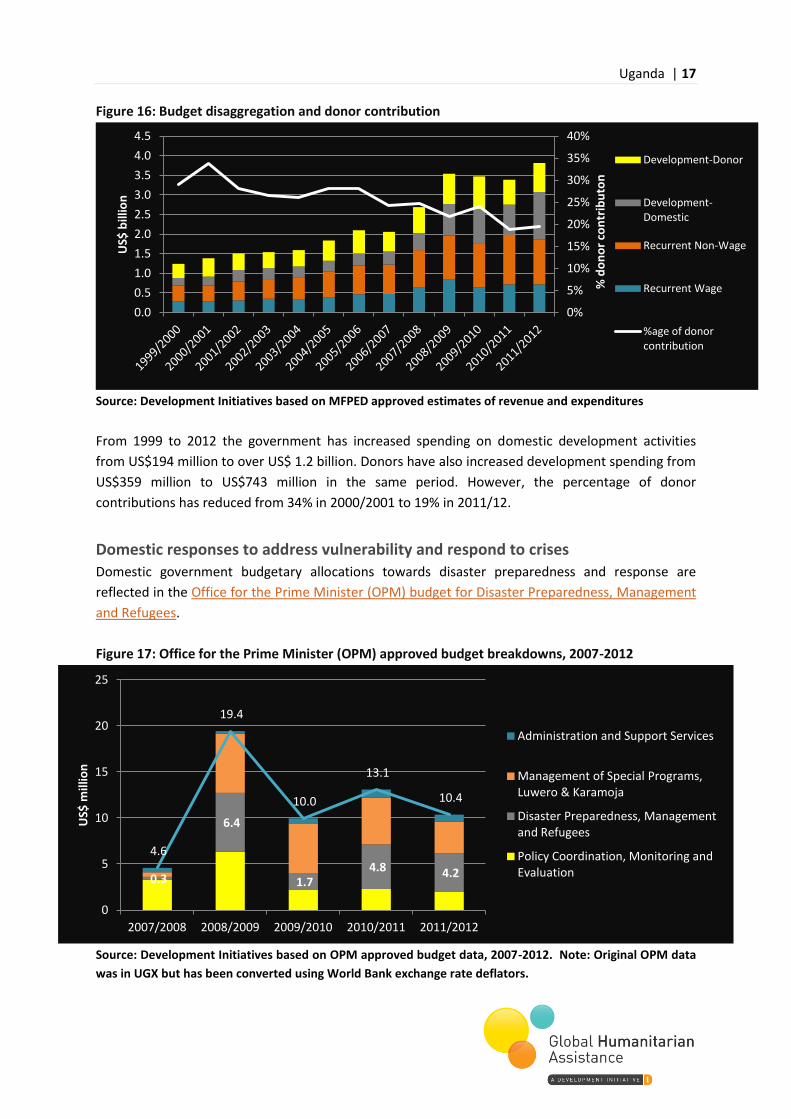
Figure 17: Office for the Prime Minister (OPM) approved budget breakdowns, 2007-2012
Source: Development Initiatives based on OPM approved budget data, 2007-2012. Note: Original OPM data
was in UGX but has been converted using World Bank exchange rate deflators.
0%
5%
10%
15%
20%
25%
30%
35%
40%
0.0
0.5
1.0
1.5
2.0
2.5
3.0
3.5
4.0
4.5
% d
on
or
con
trib
uto
n
US$
bill
ion
Development-Donor
Development- Domestic
Recurrent Non-Wage
Recurrent Wage
%age of donor contribution
0.3
6.4
1.7 4.8 4.2
4.6
19.4
10.0
13.1
10.4
0
5
10
15
20
25
2007/2008 2008/2009 2009/2010 2010/2011 2011/2012
US$
mill
ion
Administration and Support Services
Management of Special Programs, Luwero & Karamoja
Disaster Preparedness, Management and Refugees
Policy Coordination, Monitoring and Evaluation

Global Humanitarian Assistance
Funding to OPM increased significantly between 2007/2008 and 2008/2009 from US$4.6 million to
US$19.4 million (or UGX7.9 billion to UGX33.4 billion). Funding specifically for Disaster Preparedness,
Management and Refugees reached US$6.4 million in 2008/2009 (UGX11.0 billion), falling to US$1.7
million in 2009/2010 (UGX3.5 billion). Up until 2010/2011 there was only one programme under
OPM’s Disaster Preparedness, Management and Refugees function – called Disaster Management
and Refugees. In 2011/2012 this was split into Disaster Preparedness and Management and Refugee
Management – of which Disaster Preparedness and Management received the largest proportion
(see annex 1 for more disaggregated information).
The OPM, supported by OCHA and other agencies, assisted all districts in Karamoja and Acholi
regions in the development of district-specific contingency plans based on scenarios for identified
major natural hazards.15 The process and methodology for contingency planning in Karamoja are
being replicated by partners in other parts of Uganda, and it is thought this may signify the start of a
common framework for contingency planning across the country.
The OPM currently relies on supplementary emergency releases from the Ministry of Finance for
emergency funding, which must be authorised by a Cabinet sitting during an emergency. This
process significantly delays the release of funds. There are calls for a bill to allow for a humanitarian
response contingency fund that would provide for annual allocation of a minimum of 1.5% of the
annual approved budget to the National Disaster Preparedness and Management Fund.16
Source: iDMC and Uganda Humanitarian Profile, Reliefweb
15
Uganda humanitarian profile 2011, OCHA,
http://ochadms.unog.ch/quickplace/cap/main.nsf/h_Index/2011_Uganda_HP/$FILE/2011_Uganda_HP_SCREEN.pdf?openElement 16
Uganda Humanitarian Profile, Reliefweb,
http://reliefweb.int/sites/reliefweb.int/files/resources/uganda_humanitarian_profile__2012.pdf
Disaster risk reduction
Uganda has made a series of significant commitments towards disaster risk reduction and contingency planning for
disasters.
In January 2010 it became the first state to ratify the African Union Convention for the Protection and
Assistance of IDPs in Africa (the Kampala Convention).
In August 2010, the OPM convened a Joint Emergency Preparedness and Response Planning Workshop
facilitated by various UN agencies that agreed on a number of recommendations to be implemented over the
coming year in order to significantly enhance the preparedness and response capacity of the Government.
In May 2011 the State adopted a National Policy for Disaster Preparedness and Management, underscoring the
need to tackle disasters in a holistic manner with more emphasis on disaster risk reduction.1 With the
implementation of the new policy ministries are expected to plan and budget for DRR activities within their
respective ministerial mandates, and districts to integrate disaster preparedness and management into their
development plans and budgets. The policy reflects a shift of focus from disaster response to disaster
reduction.
On 17 August 2011 The Uganda Parliamentarians Forum on Disaster Risk Reduction was launched [to] increase
legislators’ knowledge of disaster risk reduction in the process of building national- and community-level
resilience.
Uganda | 19
Other resource flows
Remittances
Remittances represent an important, and growing, private capital flow in Uganda, more than tripling
from US$238 million in 2000 to US$773 million in 2010. In 2010 remittances were approximately
4.5% of Uganda’s GDP.
Figure 18: Remittances inflows, Uganda, 2000-2010, US$ million
2000 2001 2002 2003 2004 2005 2006 2007 2008 2009 2010
238 349 423 299 311 322 411 452 724 694 773
Source: Development Initiatives based on World Bank data
Foreign direct investment
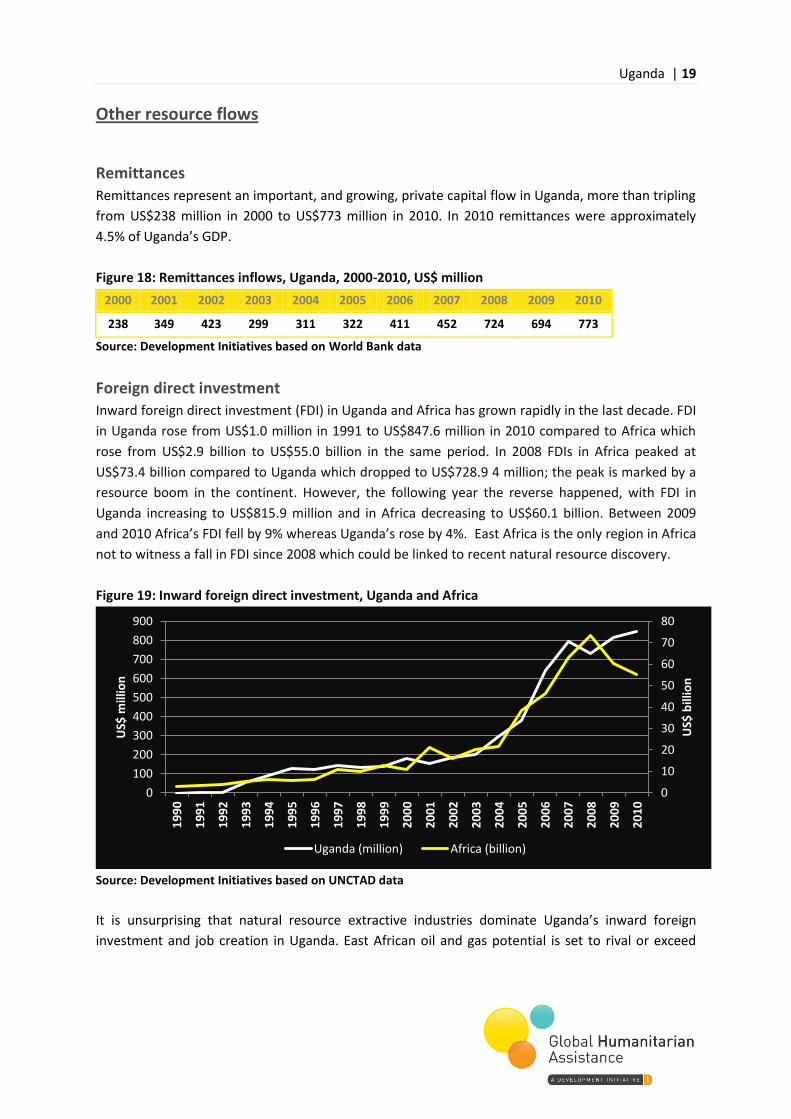
Inward foreign direct investment (FDI) in Uganda and Africa has grown rapidly in the last decade. FDI
in Uganda rose from US$1.0 million in 1991 to US$847.6 million in 2010 compared to Africa which
rose from US$2.9 billion to US$55.0 billion in the same period. In 2008 FDIs in Africa peaked at
US$73.4 billion compared to Uganda which dropped to US$728.9 4 million; the peak is marked by a
resource boom in the continent. However, the following year the reverse happened, with FDI in
Uganda increasing to US$815.9 million and in Africa decreasing to US$60.1 billion. Between 2009
and 2010 Africa’s FDI fell by 9% whereas Uganda’s rose by 4%. East Africa is the only region in Africa
not to witness a fall in FDI since 2008 which could be linked to recent natural resource discovery.
Figure 19: Inward foreign direct investment, Uganda and Africa
Source: Development Initiatives based on UNCTAD data
It is unsurprising that natural resource extractive industries dominate Uganda’s inward foreign
investment and job creation in Uganda. East African oil and gas potential is set to rival or exceed
0
10
20
30
40
50
60
70
80
0
100
200
300
400
500
600
700
800
900
19
90
19
91
19
92
19
93
19
94
19
95
19
96
19
97
19
98
19
99
20
00
20
01
20
02
20
03
20
04
20
05
20
06
20
07
20
08
20
09
20
10
US$
bill
ion
US$
mill
ion
Uganda (million) Africa (billion)
Global Humanitarian Assistance
reserves in West Africa and the Middle East.17 In September 2012 The Daily Monitor reported that
an additional US$1 billion of oil had been discovered in Uganda, making viable deposits close to 3.5
billion barrels.18
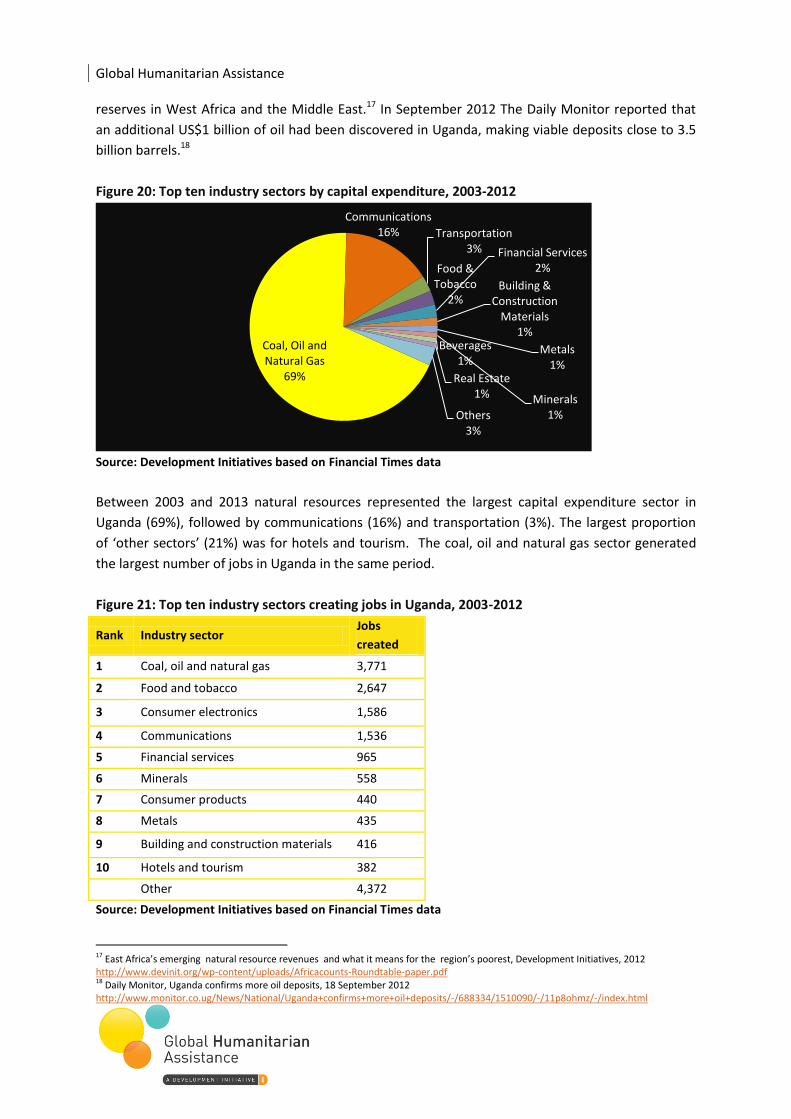
Figure 20: Top ten industry sectors by capital expenditure, 2003-2012
Source: Development Initiatives based on Financial Times data
Between 2003 and 2013 natural resources represented the largest capital expenditure sector in
Uganda (69%), followed by communications (16%) and transportation (3%). The largest proportion
of ‘other sectors’ (21%) was for hotels and tourism. The coal, oil and natural gas sector generated
the largest number of jobs in Uganda in the same period.
Figure 21: Top ten industry sectors creating jobs in Uganda, 2003-2012
Rank Industry sector Jobs
created
1 Coal, oil and natural gas 3,771
2 Food and tobacco 2,647
3 Consumer electronics 1,586
4 Communications 1,536
5 Financial services 965
6 Minerals 558
7 Consumer products 440
8 Metals 435
9 Building and construction materials 416
10 Hotels and tourism 382
Other 4,372
Source: Development Initiatives based on Financial Times data
17 East Africa’s emerging natural resource revenues and what it means for the region’s poorest, Development Initiatives, 2012 http://www.devinit.org/wp-content/uploads/Africacounts-Roundtable-paper.pdf 18 Daily Monitor, Uganda confirms more oil deposits, 18 September 2012 http://www.monitor.co.ug/News/National/Uganda+confirms+more+oil+deposits/-/688334/1510090/-/11p8ohmz/-/index.html
Coal, Oil and Natural Gas
69%
Communications 16% Transportation
3%
Food & Tobacco
2%
Financial Services 2%
Building & Construction
Materials 1%
Metals 1%
Minerals 1%
Beverages 1%
Real Estate 1%
Others 3%

Uganda | 21
However, despite the coal, oil and natural gas sector generating the largest number of jobs and
highest capital expenditure it generates a relatively low number of jobs per dollar invested. For
example, figure 22 shows that between 2003 and 2012, the coal, oil and gas sector had the most
amount invested in it per job (US$3,290.9) compared to the food and tobacco sector which was just
US$161.2 invested per job. This demonstrates that the natural resource sector requires high capital
investment for fewer jobs when compared with other industries.
Figure 22: Amount invested per top ten capital expenditure sectors, 2003-2012, US$ million
Top ten CAPEX sectors Amounted invested per job
Coal, oil and natural gas 3,290.9
Communications 1,816.1
Transportation 1,408.8
Food and tobacco 161.2
Financial services 422.1
Building & construction materials 623.8
Metals 472.4
Minerals 285.1
Beverages 493.4
Real Estate 2,666.7
Source: Development Initiatives based on Financial Times data
Ways forward
Uganda has shown impressive progress in terms of economic growth and poverty reduction
strategies. In less than two decades, from the early 1990s, the proportion of people living below the
national poverty line nearly halved from 57% in 1992 to 25% in 2010. At the same time tax revenues
have grown from US$600 million in 1993 to US$3.5 billion in 2010 and oil has been discovered that
has the potential to generate significant quantities of both resources and revenue (estimated at
US$2 billion per year), if managed properly.
The country has emerged from decades of conflict in the North which forced thousands of Ugandans
into refugee camps both internally and across the borders. Uganda is now in a phase of relative
peace and stability – but poverty rates in the North still remain high and access for some to basic
services is still limited. Aid has remained consistent at around US$1.8 billion per year – ranking
Uganda the 13th largest aid recipient in 2010. On the other hand, humanitarian aid financing and
programmes are winding down and there is greater emphasis on recovery and development – with
the government taking more responsibility and ownership for these types of programmes.
Whilst Uganda’s progress is to be commended, government resources and revenues are not always
prioritising and targeting the poorest. GDP per capita is still low, and ranked the 11th lowest in the
world in 2011 (US$487), just higher than Central African Republic. The amount of resources available
per person is not sufficient.
Global Humanitarian Assistance
A recent paper by Development Initiatives on resource flows in and to Uganda highlights that, while
some social development indicators have shown progress in recent years, spending on education,
health and agriculture by the government is becoming a decreasing share of total budget
expenditures. It also states that the Ugandan Government has failed to fulfil its commitments to the
Maputo Declaration, 2003 (that 10% of all government resources will be spent on agriculture) and
the Abuja Declaration, 2001 (that 15% of all government resources will be spent on health).
If Uganda is to reach its ambitious target of reducing the percentage of people living below the
poverty line to 5% by 2040, it will need to ensure that more resources (both donor and government)
are targeted at reducing poverty in the North, increase the proportion of budget expenditure that is
allocated to health, education and agricultural programmes and make sure that revenues from oil
and natural resources are invested in social development programmes. Finally, it is imperative that
all financial flows, both public and private, are transparent, enabling more effective targeting of
resources and making key players accountable to commitments and investments they have made.

Uganda | 23
Annex 1: OPM budget breakdown, UGX
Source: Development Initiatives based on OPM approved budget data, 2007-2012, Ugandan Shillings (UGX)
VOTE FUNCTION PROGRAM 2007/2008
Approved
Budget
UGX
2008/2009
Approved
Budget
UGX
2009/2010
Approved
Budget
UGX
2010/2011
Approved
Budget
UGX
2011/2012
Approved
Budget
UGX
VF 1301: Policy
Coordination,
Monitoring and
Evaluation
Program-01 Executive Office 1.4 2.1 1.5 0.8 0.8
Program-03 Coordination and Monitoring 0.5 0.6 0.5 1.5 -
Program-16 Monitoring and evaluation - - - - 1.4
Program-17 Policy implementation and coordination - - - - 0.2
Program-08 General Duties 1.4 0.2 0.1 0.1 0.1
Program-09 Government Chief Whip 0.2 0.3 0.2 0.2 0.2
Program-14 Information and National Guidance 2.3 7.8 2.3 2.4 2.4
VF 1302: Disaster
Preparedness,
Management and
Refugees
Program-05 Disaster Management Refugee 0.6 11.0 3.5 10.5 -
Program-18 Disaster Preparedness and Management - - - - 9.4
Program-19 Refugee Management - - - - 1.1
VF 1303: Management
of Special Programs,
Luwero & Karamoja
Program-04 Northern Uganda Rehabilitation 0.5 0.6 0.4 0.5 0.4
Program-06 Luwero-Rwenzori triangle 0.2 9.9 10.2 10.2 8.0
Program-07 Karamoja HQs 0.2 0.5 0.4 0.4 0.4
VF 1349: Administration
and Support Services
Program-02 Finance and Administration 0.8 0.5 1.0 1.7 1.7
Program-15 Internal Audit - - 0.2 0.2 0.2
Total 7.9 33.4 20.2 28.5 26.1
Global Humanitarian Assistance
About us Global Humanitarian Assistance is a Development Initiatives programme that works to improve the
efficiency, effectiveness and coherence of humanitarian response by further increasing access to
reliable, transparent and understandable data on humanitarian assistance.
In addition to the role we play in collating, analysing and communicating ‘humanitarian’ flows
reported in the official aid statistics reported to the Development Assistance Committee (DAC) and
UN OCHA Financial Tracking Service (FTS), our work allows us to provide insight and assistance on
aid architecture and financing mechanisms; fragile states, human security and vulnerability;
transparency and accountability.
Development Initiatives is an independent organisation that sees improving aid effectiveness as part
of its commitment to the elimination of absolute poverty by 2025.

Development Initiatives
North Quay House, Quay Side, Temple Back, Bristol, BS1 6FL, UK
W: globalhumanitarianassistance.org
Twitter: GHA_org