Embed Size (px)
Citation preview

Global Exhibition Barometer 11th edition (July 2013)
A UFI report based on the results of a survey
conducted in June 2013 among UFI*,
SISO**, AFIDA*** & EXSA**** Members
(*) Global (**) USA (***) Central & South
America (****) Southern Africa
Global Exhibition
Barometer
Table of contents
INTRODUCTION page 3
DETAILED RESULTS
1. Gross Turnover page 4
2. Operating Profit page 7
3. Perception of the economic crisis page 10
4. Most important business issues page 13
CONCLUSION page 15
APPENDIX: answers per country/region page 16
2 11th Global Exhibition Barometer

Global Exhibition
Barometer
Introduction
Since 2009, UFI has regularly assessed the impact of the economic downturn by developing a “Crisis Barometer” based
on the perceptions of UFI members in 84 countries and including, for the USA, an identical survey conducted by SISO
(Society of Independent Show Organizers). The scope of the survey has since been broadened to include members of
AFIDA (Asociacion International de Ferias de America) in Central and South America and of EXSA (Exhibition and
Events Association of Southern Africa).
Results of this survey were initially published in February, May & August 2009. This report has evolved as the “Global
Exhibition Barometer”, with two surveys per year. The current document presents the results of the 11th survey
conducted in June 2013. Where possible it identifies trends drawing on the results of the previous surveys.
It should be noted that the number of replies to the current survey (217 from 56 countries) provides representative
results. However, the consolidated regional results may not reflect the situation of specific countries in that region.
Detailed replies to the first two questions related to gross turnover and operating profits are indicated for major national
markets where a large number of answers was obtained (China, Germany, Italy, Netherlands, Russia, South Africa and
USA).
Questions related to this survey should be addressed to Christian Druart at [email protected].
3 11th Global Exhibition Barometer (July 2013)

Global Exhibition
Barometer
1. Gross Turnover
4
The 11th Barometer surveyed the evolution of participants’ turnover expectations for the 2 halves of 2013 and the first half
of 2014 as compared to their expectations during the same period the year before (regardless of possible biennial effects).
The charts presented on the next two pages combine these results with those of previous surveys for the 2008-2012
period.
The first chart presents the percentage of companies declaring an increase in their turnover. The charts on the following
page detail these results, adding the percentage of companies declaring decreases in their turnover and the percentage of
“unknown” answers.
Survey results indicate:
• The outlook since 2011 is positive with a majority of companies in all regions declaring turnover increases. Projections
indicate that this is expected to continue in the coming year. The first half of 2014 appears as the first period
since 2008 in which 3 companies out of 4 in all regions expect a turnover increase.
• The detailed figures available for several major national markets (China, Germany, Italy, Netherlands, Russia, South
Africa and USA) show a rather similar pattern where, on average, between 56% and 71% of the companies anticipate
a turnover increase in the coming year.
• Whereas this “+/- 75%” proportion of companies expecting a turnover increase has been rather stable in Asia/Pacific
since 2010 and - with the exception of year 2012 – in the Americas, it was only reached in the second half of 2012 for
Middle East & Africa and it is not expected to be reached until the beginning of 2014 for Europe.
11th Global Exhibition Barometer (July 2013)

Global Exhibition
Barometer
0%
25%
50%
75%
100%
bef.31
Dec.2008
H12009
H22009
H12010
H22010
H12011
H22011
H12012
H22012
H12013
H22013
H12014
5
% of companies declaring an increase in turnover
when compared to their projections for the same period the year
before (regardless of possible biennial effects)
As declared in previous surveys As declared
in June 2013
Americas
Europe
Asia & Pacific
Middle East
& Africa
11th Global Exhibition Barometer (July 2013)

Global Exhibition
Barometer
30% 24%33%
7% 5% 5%16% 10% 6% 6% 10% 11%
42% 55% 40%
24%16% 16%
5%32% 38%
13% 10% 4%
28%21% 27%
69%79% 79% 79%
58% 56%
78% 77%75%
3% 3%10%
As declared
in June 2013
6
How do you expect your turnover to change when compared to
the same period the year before (regardless of possible biennial effects)?
AMERICAS
Decrease: 10% or more Increase Decrease: less than 10% I don’t know
As declared in previous surveys
Bef.31
Dec.08
H1 H2
2009
ASIA/PACIFIC MIDDLE EAST/AFRICA
11th Global Exhibition Barometer (July 2013)
H1 H2
2010
H1 H2
2011
H1 H2
2012
H1 H2
2013
H1
2014
As declared
in June 2013
As declared in previous surveys
Bef.31
Dec.08
H1 H2
2009
H1 H2
2010
H1 H2
2011
H1 H2
2012
H1 H2
2013
H1
2014
48% 42%27%
6% 8% 6% 3% 3% 10% 13%2%
21% 28%
35%
20%8% 14% 15% 18%
15% 10%14%
6%
31% 30%38%
74%84% 80% 82% 79% 75% 75%
72%
74%
2%12%
20%
36% 39%48%
21% 20% 13% 11% 16% 14% 15% 14%4%
27%
41%37%
34% 31%
23% 23%23% 32% 29% 30%
11%
37%20% 15%
45% 49%64% 66% 61% 55% 56% 52%
70%
4%15%
29% 28%14% 18% 15% 14%
5% 10% 7% 10% 3%
29%
29% 18%36%
23% 29%32%
14% 17% 18%
6%
71%
43%57% 64% 64% 62% 57% 63%
76% 76% 69%
72%
3%19%
As declared
in June 2013
As declared in previous surveys
Bef.31
Dec.08
H1 H2
2009
H1 H2
2010
H1 H2
2011
H1 H2
2012
H1 H2
2013
H1
2014
As declared
in June 2013
As declared in previous surveys
Bef.31
Dec.08
H1 H2
2009
H1 H2
2010
H1 H2
2011
H1 H2
2012
H1 H2
2013
H1
2014
EUROPE

Global Exhibition
Barometer
7
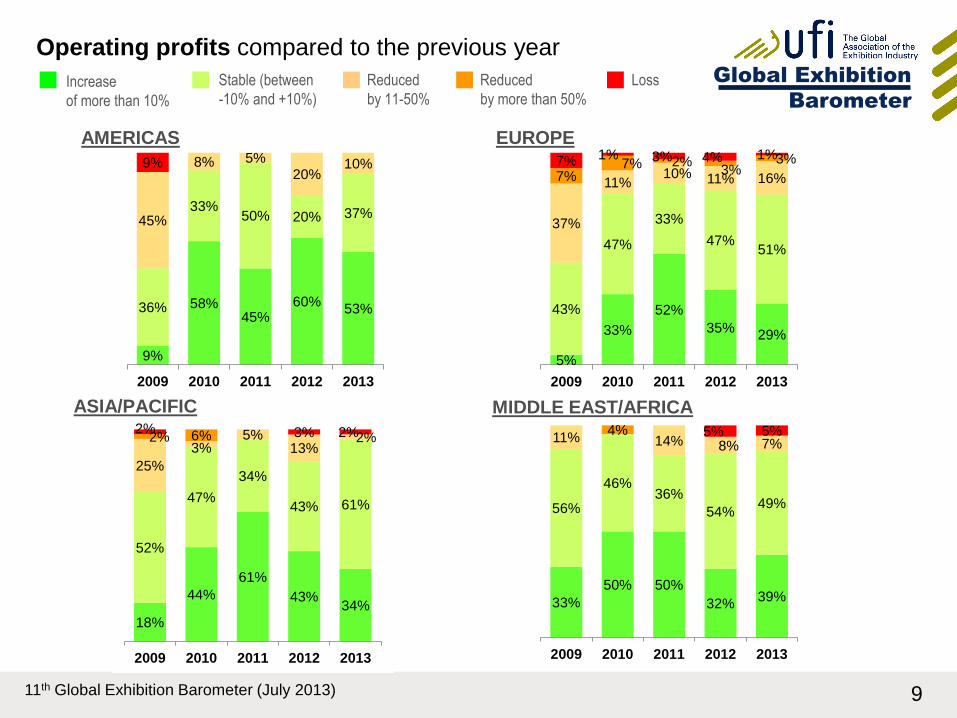
2. Operating Profits
The 11th Global Barometer survey questioned the evolution of operating profits for 2012 and 2013 as compared to the
previous year.
The charts presented in the next two pages combine these results with those of previous surveys which provided the
evolution of operating profits for 2009, 2010 and 2011. The first chart combines the results of companies declaring an
increase of more than 10% and those declaring a stable result (between -10% and +10%) and the next chart identifies
those with reductions in profits or losses.
The results show that:
• More than 1 company out of 2 in the Americas, and between 3 and 4 companies out of 10 in the other regions,
expect an increase of more than 10% in annual profits for 2013. These proportions are rather stable when related to
those of year 2012.
• Important differences are noted for several key national markets: the proportion of companies expecting an increase
of more than 10% in their annual profits for 2013 reaches 20% in China and Germany, between 25 and 30% in Italy
and the Netherlands, between 50 and 60% in Russia and South Africa and more than 70% in the USA.
11th Global Exhibition Barometer (July 2013)

Global Exhibition
Barometer
0%
20%
40%
60%
80%
100%
2009 2010 2011 2012 2013
8
Operating profits compared to the previous year
11th Global Exhibition Barometer (July 2013)
Americas Europe Asia & Pacific Middle East & Africa
% of companies declaring stable
profits (between -10% and +10%)
or increases of more than 10%
% of companies declaring profit
increases of more than 10%
Global Exhibition
Barometer
33%
50% 50%
32%39%
56%
46%36%
54%49%
11% 14% 8% 7%4% 5% 5%
2009 2010 2011 2012 2013
5%
33%
52%
35%29%
43%
47%
33%
47%51%
37%
11%10% 11% 16%7%
7% 2%3%
3%7% 1% 3% 4% 1%
2009 2010 2011 2012 2013
18%
44%
61%
43%34%
52%
47%
34%
43% 61%
25%
3%5%
13%2%2% 6%
2% 3% 2%
2009 2010 2011 2012 2013
9%
58%45%
60%53%36%
33%50% 20% 37%
45%
8% 5%20%
10%9%
2009 2010 2011 2012 2013
9
Loss Increase
of more than 10%
Reduced
by 11-50%
ASIA/PACIFIC MIDDLE EAST/AFRICA
11th Global Exhibition Barometer (July 2013)
Operating profits compared to the previous year
Stable (between
-10% and +10%)
Reduced
by more than 50%
EUROPE AMERICAS

Global Exhibition
Barometer
10
3. Perception of the economic crisis
Companies were asked their views on whether the impact of the “economic crisis” on their business was over or not.
The chart on the next page presents the replies together with those declared in the surveys of the last 3 years.
As in the survey conducted 6 months ago, the Americas is the only region where a majority of respondents declared that
the impact of the “economic crisis” on their exhibition business is now over. This is now the belief of 2 companies out of
3 in that region. In all other regions a rather stable proportion of 3 companies out of 4 consider that their business is still
affected by the “economic crisis”.
The following page shows that the year when it is expected that the economic crisis will be over has shifted when
compared with the results of the surveys conducted in June 2011 and 2012. The number of companies who now believe
that the crisis will end in 2013 has dropped from 44% a year ago to 10% today. 37% now believe that the impact of the
economic crisis will only end in 2014, 42% that this will occur in 2015, and 12% that it will be later than that.
11th Global Exhibition Barometer (July 2013)

Global Exhibition
Barometer
0%
25%
50%
75%
100%
June2010
Dec.2010
June2011
Dec.2011
June2012
Dec.2012
June2013
11
% of companies declaring – over the last 7 Barometer
surveys – that the impact of the “economic crisis”
on their exhibition business is now over
11th Global Exhibition Barometer (July 2013)
Americas
Europe
Asia & Pacific
Middle East & Africa

Global Exhibition
Barometer
14%
63%
15%
9%
0%
10%
44%
30%
15%
2%10%
37%42%
12%
2011 2012 2013 2014 2015 after 2015
June 2011
June 2012
June 2013
12
Anticipated end of the “economic crisis” as declared
in the last 3 years by those who consider that it is not yet over
11th Global Exhibition Barometer (July 2013)

Global Exhibition
Barometer
13
4. Most important business issues
As in the earlier Global Barometer Surveys, companies were asked to identify the three most important issues for their
business in the coming year from a proposed list of seven issues.
The results are stable in all surveys, with around 80% of all answers relating to the following 4 issues:
- “State of the national/regional economy” (26% in the current survey)
- “Global economic uncertainty” (19% in the current survey)
- “Local/national competition from the exhibition industry” (19% in the current survey)
- “Internal management challenges” (17% in the current survey).
“Environmental challenges (customer expectations, regulations, etc.)” and “Other media” issues - “Competition from
other media (ex. internet, virtual trade shows, social media)” or “Integration with other media” (ex. internet, virtual trade
shows, social media) - are currently considered as less critical.
The next slide shows the three most important issues selected.
11th Global Exhibition Barometer (July 2013)

Global Exhibition
Barometer
14
Top 3 issues
11th Global Exhibition Barometer (July 2013)
26%
19%19%
17%
9%
6%
3% 2%
State of thenational/regional
economy
Global economicuncertainty
Local/nationalcompetition from
within theexhibitionindustry
Internalmanagement
challenges (ex.finance, humanresources, staff,
training)
Environmentalchallenges(customer
expectations,regulations, etc.)
Competition withother media (ex.internet, virtualtrade shows,social media)
Integration withother media (ex.internet, virtualtrade shows,social media)
Other

Global Exhibition
Barometer
15
Conclusion The 11th Global Barometer survey, conducted in June 2013, was answered by 217 companies from 56 countries. Its
results, combined with those of the previous surveys, provide an insight into the impact of the economic crisis on the
exhibition industry since the end of 2008.
The general outlook is positive with a majority of companies in all regions still declaring turnover increases. The first half
of 2014 even appears as the first period in the last 5 years when all regions reach a strong rate of around 3 companies
out of 4 expecting a turnover increase. Whereas this rate has occurred since 2010 in Asia/Pacific and in the Americas -
with the exception of year 2012–, it was only reached in the second half of 2012 for Middle East & Africa and it won’t be
reached until the beginning of 2014 for Europe.
This turnover growth does not however directly translate into operating profit, at least in 2012 and 2013, as less than
one company out of 2 on average in all regions except the Americas project an increase of more than 10% when
compared to 2012.
In the Americas and for both 2012 and 2013, a slight majority of companies have declared an increase of more than
10% of their annual profit. The Americas also remain the only region to have a majority of respondents declaring that the
impact of the “economic crisis” on their exhibition business is now over.
For those companies who consider that it is not yet over, almost 10% believe that it will end in 2013, around 40% in
2014, another 40% in 2015 and the remaining after 2015.
In fact, the “global economic uncertainty” and “the state of the national/regional economy” remain the top issues for a
majority of companies.
THE NEXT GLOBAL BAROMETER SURVEY WILL BE RUN IN DECEMBER 2013 – PLEASE PARTICIPATE!
11th Global Exhibition Barometer (July 2013)

Global Exhibition
Barometer
Americas 36 Asia/Pacific 46 Europe 87 Middle East/Africa 48
Argentina 4 Australia 3 Belgium 4 Egypt 1
Brazil 3 Azerbaijan 1 Croatia 1 Iran 2
Canada 2 Hong Kong 5 France 3 Iraq 1
Colombia 3 India 5 Georgia 1 Jordan 2
Honduras 1 Japan 1 Germany 11 Kuwait 1
Mexico 3 Macao 1 Greece 4 Lebanon 1
Peru 1 Mainland China 12 Hungary 1 Libya 2
USA 17 Pakistan 2 Italy 9 Oman 1
Philippines 1 Kazakhstan 1 Saudi Arabia 1
Singapore 6 Kosovo 1 South Africa (*) 31
South Korea 3 Luxembourg 1 Syria 1
Taipei 1 Netherlands 9 United Arab Emirates 2
Thailand 4 Norway 1 Zimbabwe 1
Poland 4
Portugal 1
Romania 1
Russian Federation 10
Slovenia 2
Spain 3
Sweden 2
Switzerland 1
Turkey 6
Ukraine 5
United Kingdom 5
16
Number of survey replies per country/region Total = 217 (in 56 countries/regions) N.B.: 4 answers were provided for a region as a whole by large companies who operate in several countries in these regions
(*) a ratio was applied when necessary
to the answers from South Africa in
order not to produce biased
consolidated regional results
11th Global Exhibition Barometer (July 2013)

Headquarters
17, rue Louise Michel
F-92300 Levallois-Perret France
Tel: (33) 1 46 39 75 00
Fax: (33) 1 46 39 75 01
E-mail: [email protected]
Asia/Pacific Office
1101 Wilson House
19-27 Wyndham Street
Central, Hong Kong China
Tel: (852) 2525 6129
Fax: (852) 2525 6171
E-mail: [email protected]
Middle East/Africa Office
International Fairs Ground
6th Ring Road
Mishref, Kuwait
Tel: (965) 2538 2542
Fax: (965) 2539 6316
E-mail: [email protected]


![Untitled-1 [ ] · PDF file2015 2014 2013 2012 Total Space ... The Global Association of the Exhibition Industry (UFI) ... Provide comprehensive services exhibition such as market research](https://img.pdfslide.us/doc/110x75/5ab6caec7f8b9a1a048e315d/untitled-1-2014-2013-2012-total-space-the-global-association-of-the-exhibition.jpg)


