Embed Size (px)
Citation preview

i
UDOT RESEARCH & DEVELOPMENT REPORT ABSTRACT
1. Report No. UT-XX.XX
2. Government Accession No.
3. Recipient's Catalog No.
4. Title and Subtitle Evaluation of Rapid Construction and Settlement of Embankment Systems on Soft Foundation Soils
5. Report Date December 2007 6. Performing Organization Code
7. Author(s) Clifton B. Farnsworth, Steven F. Bartlett
8. Performing Organization Report No.
9. Performing Organization Name and Address Department of Civil and Environmental Engineering University of Utah 122 South Central Campus Drive, 104 CME Salt Lake City, Utah 84112-0561
10. Work Unit No. 11. Contract No.
12. Sponsoring Agency Name and Address Utah Department of Transportation Research Division 4501 South 2700 West Salt Lake City, Utah 84114-8410
13. Type of Report and Period Covered Research from 1999 - 2006 14. Sponsoring Agency Code
15. Supplementary Notes 16. Abstract
The I-15 Reconstruction Project in Salt Lake City, Utah required rapid embankment construction in an urban environment atop soft lacustrine soils. These soils are thick, highly compressible, have low shear strength and require significant time to complete primary consolidation settlement. Because of this, innovative embankment systems and foundation treatments were employed to complete construction within the approved budget and demanding schedule constraints. This report evaluates and compares the construction time, cost, and performance of three embankment/foundation systems used on this project: (1) one-stage MSE wall over lime cement column treated foundation, (2) expanded polystyrene (geofoam) embankment with tilt-up panel fascia walls, and (3) two-stage MSE wall with PV drain installation and surcharging. The first two technologies were primarily used at locations where large damaging consolidation settlements could effect adjacent structures or utilities. Of the technologies evaluated, the geofoam embankment had the best performance based on settlement and rapid construction time considerations; but is more costly to construct than a two-stage MSE wall with PV drain foundation treatment. The one-stage MSE wall with lime cement treated soil was the most costly and did not perform as well as expected; thus, it had only limited use on the project. The two-stage MSE wall was the baseline technology for which to compare the other two. Although it was the cheapest to construct, it was also accompanied by large magnitude, lengthy consolidation settlements. This report provides a case history for which other projects may benefit in selecting the appropriate technology to use for soft soil sites.
17. Key Words embankment settlement, lime cement columns, mse walls, PV drains, expanded polystyrene, geofoam
18. Distribution Statement Available: UDOT Research Division Box 148410 Salt Lake City, UT 84114-8410 www.udot.utah.gov/
19. Security Classification (of this report) N/A
20. Security Classification (of this page) N/A
21. No. of Pages
22. Price

ii
Page Left Blank Intentionally

iii
CONTENTS
CONTENTS ............................................................................... iii
LIST OF FIGURES ...................................................................... v
LIST OF TABLES ...................................................................... vii
1 Introduction ................................................................... 1-1 1.1 Overview ....................................................................................... 1-1 1.2 Project Background ....................................................................... 1-2
2 Geotechnologies ............................................................. 2-1 2.1 One-Stage MSE Wall and Embankment Supported by Lime Cement Columns ................................................................................................ 2-1 2.2 Expanded Polystyrene (Geofoam) Embankment............................ 2-5 2.3 Two-Stage MSE Wall and Embankment with PV Drains and Surcharging........................................................................................... 2-9
3 Comparison of Construction Costs .................................. 3-1
4 Comparison of Construction Schedule ............................ 4-1
5 Settlement Criteria and Performance Monitoring ............ 5-1 5.1 Instrumentation ............................................................................ 5-3 5.2 Settlement Performance of LCC Treated Soil ................................. 5-5 5.3 Settlement Performance of Geofoam Walls/Embankment ........... 5-10 5.4 Settlement Performance of Two-Stage MSE Walls with PV Drains and Surcharging......................................................................................... 5-13 5.5 Comparison of Post-Construction Settlement Performance ......... 5-17
6 Conclusions .................................................................... 6-1 6.1 Implementation ............................................................................ 6-4
7 References ...................................................................... 7-1
8 Appendix A ..................................................................... 8-1

iv
Page Left Blank Intentionally
v
LIST OF FIGURES
Figure 1-1. Typical cone penetrometer (CPT) log and soil descriptions for downtown segment of I-15 Reconstruction Project, Salt Lake City, Utah. ........................... 1-3
Figure 1-2. Typical settlement record from the 1960s construction of I-15 in the downtown area of Salt Lake City, Utah. .......................................................... 1-4
Figure 2-1. Comparative cross-sections for various geotechnologies including a) one-stage MSE wall with LCC stabilized soil, b) geofoam wall/embankment, and c) two-stage MSE wall with PV drains. ...................................................................... 2-2
Figure 2-2. Lime cement column installation on the I-15 Reconstruction Project including inset of mixing tool. ....................................................................... 2-3
Figure 2-3. General lime cement column layout used on the I-15 Reconstruction Project showing 0.8 m diameter intersecting columns and 0.6 m diameter individual columns. .................................................................................................... 2-4
Figure 2-4. One-stage MSE wall construction over lime cement column treated foundation. ................................................................................................ 2-5
Figure 2-5. Geofoam block placement. ........................................................... 2-6
Figure 2-6. Load distribution slab being constructed over geofoam blocks. .......... 2-7
Figure 2-7. Placement of geofoam tilt-up panel wall with fill over load distribution slab prior to construction of pavement. .......................................................... 2-7
Figure 2-8. Typical two-stage MSE wall construction including geofabric and welded wire face from first stage and panel placement with threaded couplers in second stage. ...................................................................................................... 2-10
Figure 2-9. PV drain installation. .................................................................. 2-11
Figure 3-1. Lime cement column with one-stage MSE wall cross section including summary costs for major construction components. ......................................... 3-2
Figure 3-2. Geofoam embankment cross section including summary costs for major construction components. ............................................................................ 3-3
Figure 3-3. Two-stage MSE wall with PV drains cross section including summary costs for major construction components. ............................................................... 3-4
Figure 5-1. Project goals included protecting existing structures adjacent to new construction from potentially damaging settlements. ........................................ 5-2
Figure 5-2. Typical instrumentation setup for construction and long-term settlement monitoring of a wall. .................................................................................... 5-4

vi
Figure 5-3. Commercial building adjacent to the one-stage MSE wall at the LCC stabilized foundation site. ............................................................................. 5-6
Figure 5-4. Instrumentation layout at the LCC stabilized foundation site. ............ 5-7
Figure 5-5. Construction and post construction settlement profile for the lime cement column area. .............................................................................................. 5-8
Figure 5-6. 100 South Geofoam Embankment with Magnet Extensometer. ......... 5-10
Figure 5-7. Compressive strain for magnet extensometers within the geofoam embankment at 100 South. ......................................................................... 5-11
Figure 5-8. Foundation settlement versus time for the 3300 South geofoam embankment. ............................................................................................ 5-12
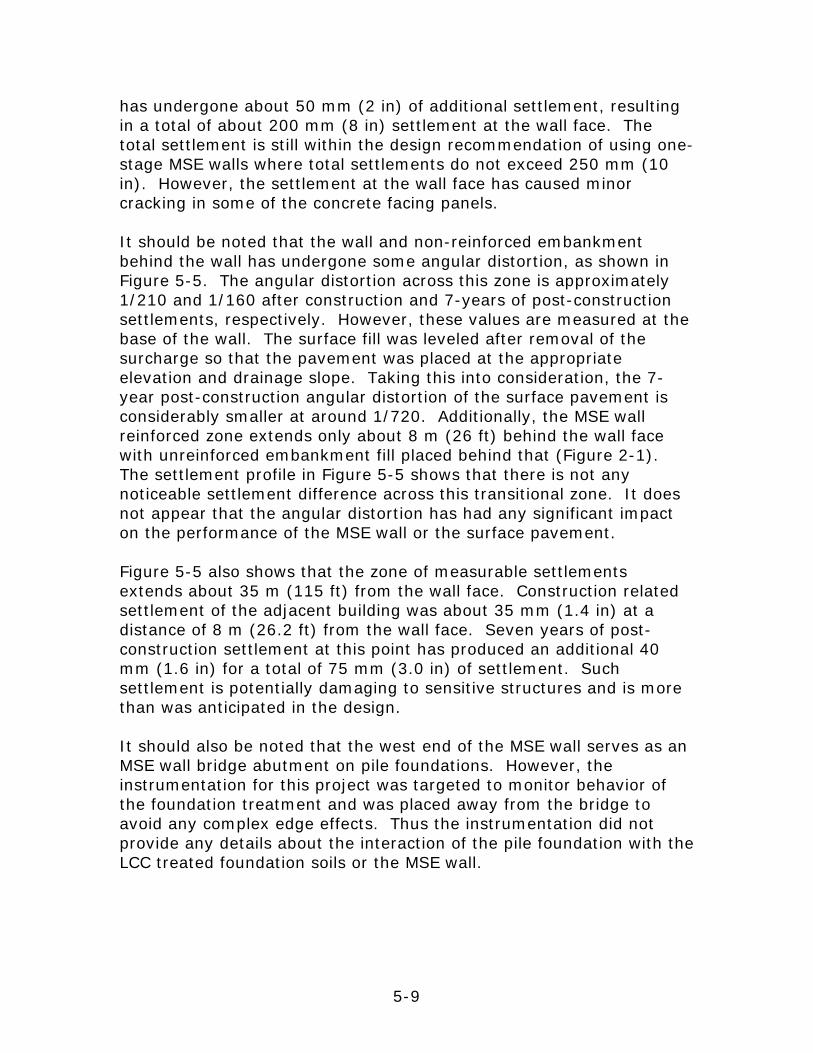
Figure 5-9. Profile for 3300 South geofoam embankment, including the addition of a 1.5 m toe berm. ........................................................................................ 5-13
Figure 5-10. 200 South MSE wall and PV Drain profile. .................................... 5-14
Figure 5-11. Residential structure adjacent to the 200 South MSE wall. ............. 5-14
Figure 5-12. Instrumentation layout at the 200 South MSE wall. ....................... 5-15
Figure 5-13. Construction and post construction settlement profile for the 200 South MSE wall site. ............................................................................................ 5-16
Figure 5-14. 2400 South construction settlement record with back extrapolation of post-construction settlements. ..................................................................... 5-18
Figure 5-15. Rate of foundation creep extrapolated to 10 years post-construction (dashed lines) compared to the design criteria of 76 mm of post-construction settlement over 10 years for lime cement columns, geofoam fill, two-stage MSE wall at wall face, and large earth embankments with PV drains at full height. ............ 5-19
Figure 6-1. Summary of cost, time of construction, and construction and post-construction settlements for three different geotechnologies utilized for the I-15 Reconstruction Project, Salt Lake City, Utah. ................................................... 6-1
Figure 6-2. Generalized flowchart for selection of geotechnology type based on settlement, time, and cost. ........................................................................... 6-4

vii
LIST OF TABLES
Table 3-1. Relative cost comparison for the three different geotechnologies used on the I-15 Reconstruction Project. .................................................................... 3-1
Table 3-2. Lime cement column with one-stage MSE wall cost and time of construction for 10 meters of wall/embankment length using typical cross-section (Figure 3-1). .............................................................................................. 3-2
Table 3-3. Geofoam embankment cost and time of construction for 10 meters of wall/embankment length using typical cross-section (Figure 3-2). ...................... 3-3
Table 3-4. Two-stage MSE wall cost and time of construction for 10 meters of wall/embankment length using typical cross-section (Figure 3-3). ...................... 3-4
Table 4-1. Relative time of construction comparison for the three different geotechnologies used on the I-15 Reconstruction Project. ................................. 4-1

viii
Page Left Blank Intentionally

1-1
1 Introduction
1.1 Overview Constructing large walls and embankments over soft-soil sites can be challenging in an urban setting, as special care must be taken to ensure that primary consolidation and post-construction secondary settlements will not damage adjacent structures and utilities. In many instances this means that methods to minimize the amount of settlement must be employed. This can be accomplished either by using a smaller loading condition or by altering the foundation conditions to withstand the required load. In either case the net goal is to reduce the potential settlements to an acceptable magnitude. Furthermore, contracting and construction methods that speed up the construction process are also often sought after, thus reducing the total construction time placed on the facility. This report summarizes several different aspects of some non-typical embankment systems over compressible soil, using the I-15 Reconstruction Project in Salt Lake City, Utah as a case history. Furthermore, this report demonstrates how the non-typical embankment systems are used to address the challenges of constructing over soft-soil sites in an urban setting. The I-15 Reconstruction Project utilized three basic approaches for dealing with the anticipated magnitude of settlement from the soft compressible soils that were prevalent beneath much of the project. The first and most widely utilized approach was to use surcharging with mechanically stabilized earth (MSE) walls or earthen embankments over prefabricated vertical (PV) drain treated foundation soils and allow the primary consolidation settlements to take place. The second approach was to essentially eliminate any potential foundation settlement by using geofoam as a light-weight fill embankment and thus greatly minimize the loading condition imposed on the foundation soils. The third approach involved strengthening the foundation soils by installing lime cement columns prior to placing an MSE wall, thus reducing the magnitude of settlement within the stiffened foundation soils. Near the beginning of the I-15 reconstruction Project, and in conjunction with the I-15 Research Testbed, a research project was initiated to monitor and evaluate the construction and post-construction performance of these non-typical embankment systems. This report provides an overview and analysis of these different geotechnologies as they were utilized on the I-15 Reconstruction Project. First, a comparison of the

1-2
construction costs and schedule for the geotechnologies is performed. The performance of the embankments with respect to the construction and long-term settlements is then discussed. Finally, conclusions are drawn with respect to the use of each geotechnology.
1.2 Project Background The I-15 Project was a fast-paced reconstruction project that began during the spring of 1998 and ended in the fall of 2001, just prior to the 2002 Winter Olympic Games in Salt Lake City, Utah. At that time, it was the largest public highway construction project to be accomplished using a design-build project delivery system. During this 3.5-year period, the design-build consortium demolished and rebuilt 26 km (16.2 miles) of urban interstate, widening the roadway from 6 up to 12 lanes at a total cost of about $1.4 billion. A large part of this cost was spent erecting 144 overpass bridge structures, constructing 160 mechanically stabilized earth (MSE) retaining walls and placing 3.8 million m3 (134 million ft3) of new embankment. The design-build contract featured a 50-year design life and an optional 10-year corrective maintenance agreement. The strict project completion date presented unique challenges to the design-build team. Perhaps the most demanding was developing strategies to address the impacts of consolidation settlement in the northern segment of the project near the downtown area. Here, compressible, fine-grained lacustrine sediments deposited by Pleistocene-age Lake Bonneville underlie about 5 m (16.4 ft) of Holocene alluvium (Figure 1.1). The lacustrine sediments are approximately 15 m (49.2 ft) thick, consist of inter-bedded silty clay and clayey silt (CL, ML), plastic clays and silts (CH, MH), and fine clayey and silty sands (SC, SM) and are lightly overconsolidated (OCR 1.5). Interbedded, subaqueous silts, fine sands and low plasticity clays are found in the middle of the Lake Bonneville sediments and separate the upper and lower Lake Bonneville clays (Figure 1.1). These upper and lower clay units are compressible [compression ratio (Cc/(1+eo)) from 0.1 to 0.35], have relatively low undrained shear strength [25 to 50 kPa (0.5 to 1.0 ksf)] and require substantial time to complete primary consolidation. Settlement records from the 1960s construction of I-15 show that a typical 8 to 10-m (26 to 33 ft) high embankment underwent 1 to 1.5 m (3 to 5 ft) of primary consolidation settlement over a period of 2 to 3 years. Figure 1-2 shows an actual settlement record from the 1960s construction, for an embankment constructed over the typical soil conditions represented in Figure 1-1. The record shown in Figure 1-2 is typical of those recorded during the 1960s construction for this type of soil condition. This figure

1-3
shows that fill placement was performed in multiple stages to reach the peak loading condition and then the primary settlement allowed to take place prior to removal of the surcharge. These large magnitudes of settlement and long consolidation settlement durations can be attributed directly to the soft thick compressible Lake Bonneville clay layers. In the 1960s, the bridge foundations, bridge, approaches and pavement were not placed until such settlement was essentially finished.
Figure 1-1. Typical cone penetrometer (CPT) log and soil descriptions for downtown segment of I-15 Reconstruction Project, Salt Lake City, Utah. The fast-paced reconstruction from 1998 through 2001 could not accommodate these rather lengthy settlement durations. The contract required that 2 lanes of traffic in each direction be maintained throughout construction. This essentially meant that each direction of the interstate had to be rebuilt in a two-year period, making the reconstruction essentially a two-phased project, with each phase lasting about two years. Thus, innovative technologies and construction methods were
0
5
10
15
20
25
30
35
40
0 8
USCS
CH,FatClay
MH,ElasticSilt
CL,SandyLeanClayML,Silt
SC,ClayeySand
SM,SiltySand
0
5
10
15
20
25
30
35
40
0 250 500
fs (kPa)
0
5
10
15
20
25
30
35
40
0 500 1000
u (kPa)
0
5
10
15
20
25
30
35
40
0 10 20 30 40
qc (MPa)
Dep
th (
m)
Recent Alluvium
Upper Bonneville Clay
Interbeds
Lower Bonneville Clay
Deeper Alluvium
Deeper Clay

1-4
needed to either minimize settlement (i.e. maintain stresses within the recompression range) or induce primary settlements to occur within a pre-load period of 6 to 12 months, so that bridge construction and paving operations could proceed on schedule. Owing to its innovative use of geotechnologies and successful implementation of a design-build project delivery system, the I-15 reconstruction project received the ASCE Outstanding Civil Engineering Achievement Award for 2002.
Figure 1-2. Typical settlement record from the 1960s construction of I-15 in the downtown area of Salt Lake City, Utah.

2-1
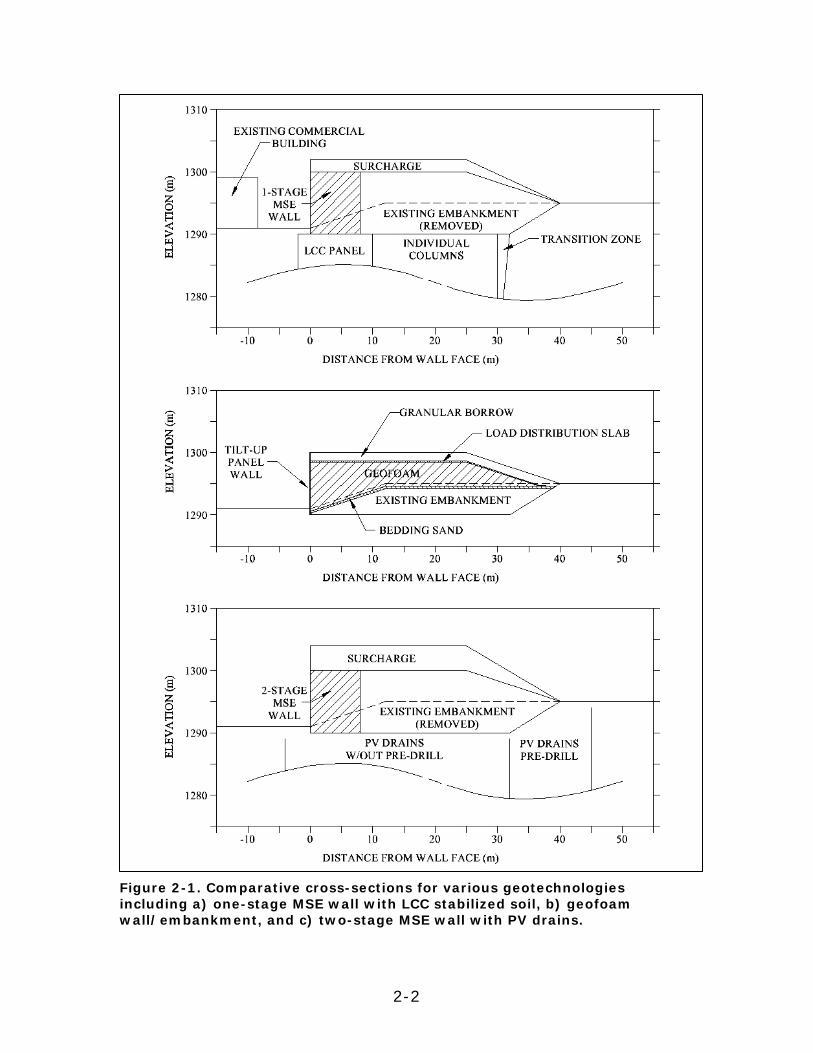
2 Geotechnologies The design-build team employed fairly innovative and less common methods to successfully complete the I-15 Reconstruction Project on time and within the initially approved budget. This report focuses on the construction and long-term settlement performance of three embankment systems utilized during the I-15 Reconstruction: (1) a one-stage MSE wall supported by lime cement columns, (2) a geofoam embankment with a tilt-up panel wall on strip footing, and (3) a two-stage MSE wall on foundation soils with PV drain installation. Details of these three embankment construction alternatives are shown in Figure 2.1. The implementation of these technologies is further discussed in Bartlett et al. (2000) and Saye et al. (2001a, 2001b). The I-15 project settlement goals and the anticipated performance and estimated construction time for each geotechnology were critical factors in the selection process. The two-stage MSE wall on foundation soils with PV drain installation was the most widely used on the I-15 project and is a baseline technology against which the performance of the other two technologies is compared. The construction cost, time, and settlement performance of the first two technologies are being highlighted because of their relatively new introduction into U.S. practice, as well as their initial use within the state of Utah.
2.1 One-Stage MSE Wall and Embankment Supported by Lime Cement Columns Lime cement column (LCC) installation is a soil mixing technique used for soft foundation improvement. Lime and cement are mechanically mixed in-situ with the foundation soils to create stiffer columns of treated soil. According to the Federal Highway Administration (1999), the basic concept of stabilizing foundation soils by mixing lime in-situ was first introduced in Scandinavia in 1975. In the 1990s, Sweden began making extensive use of mixing both lime and cement in-situ for stabilization of soft soils, “mainly for the reduction of settlements and improvement of stability for the construction of new roads and railroads.” The first lime column system to be used in the United States occurred in 1992 “as part of a research effort by the Florida Institute of Phosphate Research.” The use of lime and cement soil mixing on the I-15 Reconstruction Project was one of the first applications within the United States.
2-2
Figure 2-1. Comparative cross-sections for various geotechnologies including a) one-stage MSE wall with LCC stabilized soil, b) geofoam wall/embankment, and c) two-stage MSE wall with PV drains.

2-3
The lime cement columns used on the I-15 Reconstruction Project were constructed with a reagent admixture of 15 percent lime / 85 percent cement and injected at a mass concentration of 125 kg/m3 (7.8 lbs/ft3) of untreated soil. The columns were constructed by inserting a mixing tool to the target depth (Figure 2-2), and while withdrawing the tool, injecting the dry lime and cement within the soil to be mixed in-situ. For this project, the columns were installed to a depth of 20 m (65.6 ft) and were either 0.8-m (2.6 ft) or 0.6-m (2.0 ft) in diameter. The overall spacing pattern of the columns was quite complex as shown in Figure 2-3. In general the LCC spacing consisted of either 0.8-m (2.6 ft) diameter intersecting columns that created panels of reinforced soil with panels spaced 2 m (6.6 ft) apart or individual 0.6-m (2.0 ft) diameter columns spaced approximately between 1 to 2 m (3.3 to 6.6 ft) apart in either a triangular or rectangular pattern. This spacing pattern is further described in Bartlett and Farnsworth, 2002.
Figure 2-2. Lime cement column installation on the I-15 Reconstruction Project including inset of mixing tool.

2-4
Figure 2-3. General lime cement column layout used on the I-15 Reconstruction Project showing 0.8 m diameter intersecting columns and 0.6 m diameter individual columns.
One-stage mechanically stabilized earth (MSE) wall systems, on the other hand, have been commonly used throughout many countries (including the United States) since the 1970s. The use of the one-stage MSE wall is not unique to this project, other than being placed atop an uncommon foundation treatment. Figure 2-4 shows the typical construction of a one-stage MSE wall. A one-stage MSE wall consists of attaching the horizontal reinforcement directly to the concrete facing panels in one phase of construction. This process involves several different steps. The first row of facing panels is erected and then backfill is placed and compacted to the first layer of reinforcement. The first layer of horizontal reinforcement is then placed over the backfill and connected to the facing panels (shown in Figure 2-4). Another layer of backfill is placed and compacted, with subsequent facing panels, reinforcement and backfill being placed as the wall is constructed. Because the facing panels can be damaged by excessive differential settlement, this type of wall was only used where total primary consolidation settlement was expected to be less than 250 mm (10 in). The one-stage MSE walls on the I-15 Reconstruction Project were constructed with galvanized welded wire metallic horizontal reinforcing grids and 1 m x 1.5 m (3.3 ft x 4.9 ft) rectangular precast concrete facing panels.

2-5
Figure 2-4. One-stage MSE wall construction over lime cement column treated foundation.
Lime cement column (LCC) treated foundation soil was used at one location on the I-15 Reconstruction Project to reduce consolidation settlement and improve the shear strength of the Lake Bonneville clays (Figure 2.1). A 200 m (650 ft) long, 10 m (33 ft) high one-stage MSE wall was needed to form the bridge approach for a pile-supported overpass structure at the I-80 intersection with I-15. Surcharge was also placed atop the LCC treated MSE wall to overconsolidate the foundation soils and reduce the amount of post construction settlements (Figure 2.1). Saye et al. (2001a) and Bartlett and Farnsworth (2002) further discuss the design and construction of the LCC treated area.
2.2 Expanded Polystyrene (Geofoam) Embankment EPS block geofoam has been used as a lightweight embankment fill since at least 1972, where it was used for a roadway project in Norway (National Cooperative Highway Research Program, 2004a). Subsequently, use continued throughout Scandinavia and began to spread to the rest of Europe and Japan. In Japan, the first lightweight

2-6
fill project using geofoam occurred in about 1985, but after ten years, Japan’s use comprised approximately fifty percent of worldwide usage. Some of the earliest documented applications of geofoam being used for settlement mitigation within the United States include construction of the Carousel Mall in Syracuse, New York in 1990 (Negussey and Sun, 1996) and for an emergency truck ramp at the Kaneohe Interchange in Oahu, Hawaii in 1995 (Mimura and Kimura, 1995). The use of geofoam on the I-15 Reconstruction Project was the largest settlement related application to date within the United States. Geofoam embankment design and performance from the I-15 Reconstruction Project are further discussed in Bartlett et al. (2000), Bartlett et al. (2001b), Negussey et al. (2001), Negussey and Stuedlein (2003), and Stuedlein (2003). General design and construction considerations for geofoam embankments are also found in National Cooperative Highway Research Program (2004a, 2004b). Constructing with geofoam blocks as lightweight fill embankment is a fairly straightforward process. The site is first leveled and a layer of bedding sand is placed. Geofoam blocks are then stacked (Figure 2-5) with additional bedding sand filling the gap between the geofoam and the backslope. A load distribution slab consisting of reinforced concrete is constructed atop the geofoam (Figure 2-6), followed by a small layer of fill and finally the pavement section. A tiltup panel wall is placed to cover and protect the exposed face (Figure 2-7).
Figure 2-5. Geofoam block placement.

2-7
Figure 2-6. Load distribution slab being constructed over geofoam blocks.
Figure 2-7. Placement of geofoam tilt-up panel wall with fill over load distribution slab prior to construction of pavement.

2-8
EPS geofoam with a nominal density of 20 kg/m3
(1.25 lb/ft3) was used for the lightweight embankment construction on the I-15 Reconstruction Project. The contract specifications did not require trimming of the geofoam block by the manufacturer. As necessary, individual geofoam blocks were cut on site to desired shapes and sizes. The average unconfined compressive strength at 10% strain of standard 50-mm (2.0 in) cube samples was 110 kPa (2.3 ksf). A working stress of 40% of the average strength at 10% strain was allowed for the overlying fill, pavement pressure and transient loading. Approximately 100,000 m3 (3.5 million ft3) of geofoam embankment was placed on the I-15 project at several locales. The primary use of geofoam on the I-15 Project was as lightweight embankment over existing buried utilities to minimize settlements. At many locations, buried water, sewer, gas and communication lines either traversed or paralleled the roadway alignment where the embankment was to be widened, or where the roadway grade needed to be raised. However, if conventional embankment were placed atop these utilities, they would be damaged from the primary consolidation settlement of the underlying Lake Bonneville sediments. Thus, these utilities could either be relocated, which was costly and time consuming, or other methods had to be employed to protect them in situ. Ultimately the design team selected geofoam embankment for buried utility corridors, due to its extremely light unit weight, 20 kg/m3 (1.25 lb/ft3) The use of geofoam enabled construction of 8 to 10-m (26 to 33 ft) high embankments over existing utilities without causing a significant increase in vertical stress in the foundation soils; hence damaging primary consolidation settlement did not develop. An increase in vertical stress could have been completely avoided by subexcavating and removing the same weight of foundation soil required to compensate for the combined weight of the geofoam, load distribution slab, granular borrow, roadbase and concrete pavement placed atop the geofoam. For the I-15 project this required about 2 m (6.6 ft) of subexcavation; however only 1 m (3.3 ft) of subexcavation was done in most areas due to shallow groundwater. Thus, the vertical stress was slightly increased in the foundations soils, such that all settlement was in recompression and was acceptably small, partly on account of slight overconsolidation of the foundation soils due to prior aging and desiccation effects. Geofoam embankment was also used to expedite the construction in a few critical locations where the project schedule did not allow for

2-9
conventional embankment construction and the requisite 6 to 12 months waiting period for accelerated primary consolidation settlement with PV drains. The use of geofoam at these locations completely eliminated the settlement time associated with placement of conventional embankment.
2.3 Two-Stage MSE Wall and Embankment with PV Drains and Surcharging The use of two-stage MSE walls is quite common in geotechnical practice today. However, two-stage walls are generally used for applications where large magnitudes of settlement are anticipated. For the I-15 Reconstruction Project, two-stage MSE walls were prescribed for locations where total settlements were expected to be larger than 250 mm (10 in). This was the case for much of the northern portion of the I-15 Reconstruction Project. The first stage of a two-stage MSE wall is constructed much like the one-stage MSE wall previously described. However, in the one-stage MSE wall where the reinforcing straps are attached directly to the pre-cast concrete facing panel, in the two-stage MSE wall a galvanized welded wire metallic grid and geofabric backing are used as the wall face (See Figure 2-8). The wall is constructed, including any surcharge, and then the majority of the primary consolidation settlement is allowed to occur. The second stage then consists of removal of the surcharge and attaching pre-cast concrete facing panels to the welded wire face via threaded couplers (Figure 2-8). The welded wire wall face used in the first stage can withstand much more deformation from the primary consolidation settlement than if the pre-cast concrete facing panels had been used. The two-stage MSE walls on the I-15 Reconstruction Project were also constructed with galvanized welded wire metallic horizontal reinforcing grids and 1 m x 1.5 m (3.3 ft x 4.9 ft) rectangular pre-cast concrete facing panels. Prefabricated vertical (PV) drains, in their present form, have been used worldwide (including the United States) since the 1970’s (Federal Highway Administration, 1999). PV drains are installed (Figure 2-9) through thick soft soil layers to expedite settlement by providing a shorter horizontal drainage path for which the excess pore water pressures can dissipate. This greatly decreases the settlement time of the soft foundation soils, which in turn also accelerates the rate of strength gain of the foundation soils.

2-10
Figure 2-8. Typical two-stage MSE wall construction including geofabric and welded wire face from first stage and panel placement with threaded couplers in second stage.
Where the construction schedule allowed and buried utilities were not present, the I-15 Reconstruction Project made extensive use of two-stage MSE walls and staged embankment construction (Saye et al., 2001b). Prior to constructing the MSE walls, most of the existing embankment was removed and PV drains were installed in the foundation soils at 1.5 to 1.75-m (4.9 to 5.7 ft) triangular spacing to accelerate the duration of primary consolidation to about 90 days per each embankment stage. In addition, surcharging was used atop the MSE wall and adjoining embankment to reduce the amount of secondary settlement using the technique of Stewart et al. (1994) and site-specific testing of the Lake Bonneville clays by Ng (1998).

2-11
Approximately 3 to 4 m (10 to 13 ft) of surcharge was added for typical 8 to 10-m (26 to 33 ft) high embankments. The surcharging was designed to reduce secondary settlements to about 76-mm (3 in) in a 10-year post-construction period.
Figure 2-9. PV drain installation.

2-12
Page Left Blank Intentionally

3-1
3 Comparison of Construction Costs Construction cost was an important factor leading to the selection and implementation of each geotechnology. Table 3-1 provides a relative cost comparison using typical I-15 unit costs (year 2000 values) for a 10-m (32.8 ft) length of embankment/wall and the typical cross-sections shown in Figures 3-1 through 3-3 (taken from Figure 2-1). (It should be noted that these cross-sections are based on typical construction and layout details for a half-width or one direction cross-section of I-15.) Tables 3-2 through 3-4, show a further breakdown of the cost estimate based on the major construction components for each geotechnology. The time of construction is also shown in these tables, but will not be discussed until the next section. A summary figure (Figures 3-1 through 3-3) is also included for each technology, that shows the cross section, the major construction components, and the associated relative costs. The specific cost analysis details for each geotechnology are provided in Appendix A. The LCC treated cross-section (Figure 3-1) is an actual cross-section from the project. Based on this section, comparative cost estimates for the other two technologies were developed using similar geometries (Figures 3-2 and 3-3). The costs and time of the road base and concrete pavement construction were the same for each alternative and have not been included in the results. Table 3-1. Relative cost comparison for the three different geotechnologies used on the I-15 Reconstruction Project.
Geotechnology Total Cost / 10m width Lime Cement Columns $160,000 Geofoam Embankment $120,000 Two-Stage MSE Wall $100,000
Table 3-2 shows the breakdown of the cost for the lime cement column treated foundation with a one-stage MSE wall constructed above. The total cost of the LCC treated soil and one-stage MSE wall was about $160,000 per 10-m (32.8 ft) length of wall/embankment. The unit costs of the major construction components are shown in Table 3-2. Prior to the LCC treatment, the existing embankment was removed. The column installation pattern was somewhat complex and included 20-m (65.6 ft) long columns of two diameters [0.8-m and 0.6-m (2.6 ft and 2.0 ft]. The columns in the panel and individual column zones were installed to a depth of 20 meters (65.6 ft) and to shallower depths in the transition zone (Figure 3.1). Based on the actual

3-2
installation pattern (Bartlett and Farnsworth, 2002), a total of 2,580 and 3,260 linear meters (8,465 and 10,696 linear ft) of 0.8-m and 0.6-m (2.6 ft and 2.0 ft) columns, respectively, were installed for 10-m (32.8 ft) length of wall/embankment. A 2-m (6.6 ft) surcharge fill was also placed atop the one-stage MSE wall and later removed before constructing the pavement section. Table 3-2. Lime cement column with one-stage MSE wall cost and time of construction for 10 meters of wall/embankment length using typical cross-section (Figure 3-1).
Various Construction Activities (With Typical Unit Cost)
Associated Costs (Year 2000)
Time (months)
Existing Embankment Removal ($6/m3) $9,500 0.25
Lime Cement Column Installation (0.8 m column - $17.5/m, 0.6 m column - $16/m)
$97,000 2
One-Stage MSE Wall/Embankment Construction ($200/m2 wall face)
$43,500 1
1-stage Embankment Construction, Surcharging, Settlement, and Removal (Placement - $9/m3, Removal $6/m3)
$10,000 8.75
Total = . $160,000 12
Figure 3-1. Lime cement column with one-stage MSE wall cross section including summary costs for major construction components.
If geofoam embankment had been used at this location, the total cost of the embankment/wall would have been about $120,000 per 10-m
TOTAL COST /10m = $160 K
~~22//33 TToottaall CCoosstt && DDoouubbllee WWaallll CCoosstt
$$99..55 KK
$$1100 KK
$$4433..55 KK
$$9977 KK

3-3
(32.8 ft) length of wall. Table 3-3 shows the breakdown of this cost, along with the associated unit costs. Site preparation for geofoam installation included subexcavation and placement of approximately 0.3 meters (1 ft) of bedding sand as a leveling surface for block placement. A 0.15-m (6 in) reinforced load distribution slab was poured atop the geofoam and a tilt-up panel wall on strip footing was erected to protect the vertical face (Figure 3-2). Also, up to 1 m (3.3 ft) of granular borrow and/or scoria was typically placed atop the load distribution slab to establish the final subgrade elevation. Table 3-3. Geofoam embankment cost and time of construction for 10 meters of wall/embankment length using typical cross-section (Figure 3-2).
Various Construction Activities (With Typical Unit Cost)
Associated Costs (Year 2000)
Time (months)
Existing Embankment Removal ($6/m3) $1,500 0.25
Bedding Sand ($7/ton, with 1 crew 1 week) $5,500 0.25
Geofoam Embankment ($45/m3) $65,000 2
Tilt-up Panel Wall ($200/m2 wall face) $20,000 0.75
Load Distribution Slab ($60/m2 surface area) $23,000 0.5
Embankment Above Geofoam ($9/m3) $5,000 0.25
Total = . $120,000 4
Figure 3-2. Geofoam embankment cross section including summary costs for major construction components.
If a two-stage MSE wall with PV drain treatment had been used at this site, the cost would have been about $100,000 per 10-m (32.8 ft) length of wall. Table 3-4 shows the breakdown of this cost, along with
$$2233 KK
$$55 KK
$$2200 KK
$$6655 KK
$$11..55 KK
$$55..55 KK
TOTAL COST /10m = $120 K

3-4
the associated unit costs. Foundation preparation for this system included removal of much of the existing embankment to allow for PV drain installation and construction of the MSE wall. In addition, pre-drilling of pilot holes for the PV drain installation was required in some areas where the embankment was not removed. A 0.3-m (1 ft) sand layer was placed to serve as a drainage layer for the PV drains. Also, 4 m (13.1 ft) of surcharge placement and removal has been included in this cost estimate. Table 3-4. Two-stage MSE wall cost and time of construction for 10 meters of wall/embankment length using typical cross-section (Figure 3-3).
Various Construction Activities (With Typical Unit Cost)
Associated Costs (Year 2000)
Time (months)
Existing Embankment Removal ($6/m3) $9,500 0.5
Bedding Sand ($7/ton, 1 crew 2 days) $2,500
PV Drain Installation (1.5 m triangular spacing) ($1.5/m without pre-drilling, $3/m with pre-drilling)
$14,000 1.5
Wall/Embankment Construction and Settlement Time ($300/m2 wall face, $9/m3 embankment)
$54,000 2
3-stage Embankment Construction, Surcharging , Settlement Time, and Removal (Placement - $9/m3, Removal - $6/m3)
$20,000 10
Total = . $100,000 14
Figure 3-3. Two-stage MSE wall with PV drains cross section including summary costs for major construction components.
$$2200 KK
$$5544 KK
$$99..55 KK
$$1166..55 KK
TTOOTTAALL CCOOSSTT //1100mm == $$110000 KK
3-5
When comparing the relative costs for each geotechnology, the one-stage MSE wall with LCC treated foundation soil costs around 60% more than conventional construction (i.e., the two-stage MSE wall with PV drains) and 30% more than the geofoam embankment system. Much of that cost (approximately 60%) is from the LCC foundation treatment alone. The one-stage wall itself is actually cheaper to construct than a two-stage MSE wall. Furthermore, the LCC foundation treatment costs alone are nearly identical to the total cost of constructing a two-stage MSE wall with PV drains. The geofoam system costs are about 20% higher than those of conventional construction, but the unit price of geofoam block has significantly risen in the last few years due to increases in petroleum prices. Geofoam embankments were often utilized in locations where utilities would have otherwise needed to be relocated. Utility relocation costs have not been included in this cost analysis. It is recognized that that the cost analysis presented above also neglects the costs associated with the time of construction. If costs associated with utility relocations can be avoided, or if rapid construction is required, the geofoam system may be cost competitive with conventional construction. It should be noted that the relative costs provided in this cost analysis are from this specific case study, and that they are intended only to provide a relative comparison of the cost for each geotechnology system. They were put together with the unit costs that were specific to this project. Additionally, some of the costs are dependent upon the site conditions. For example, the cost of the LCC foundation treatment was dependent upon the exact amount of columns that were required at this location.

3-6
Page Left Blank Intentionally

4-1
4 Comparison of Construction Schedule The time required to construct each geotechnology was a very important selection criterion. Table 4-1 shows representative construction times for a typical reach of wall/embankment from the I-15 Reconstruction Project. These times represent the construction time associated with each geotechnology in preparation for pavement placement. The time associated with pavement placement would be the same for all three technologies, and is therefore not included in the analysis. A further breakdown of the relative construction time for each of the major construction components can be seen in Tables 3-2 through 3-4. Although these durations are for a major project, where several walls and embankments were being constructed simultaneously, the relative construction time for each geotechnology may be similar for smaller projects. Table 4-5. Relative time of construction comparison for the three different geotechnologies used on the I-15 Reconstruction Project.
Geotechnology Total Time to Pavement Placement
Lime Cement Columns 12 Months Geofoam Embankment 4 Months Two-Stage MSE Wall 14 Months
The following conclusion can be made regarding typical construction times; geofoam embankments can be constructed much more rapidly (around 3 to 3.5 times faster) than the other two technologies. MSE walls with LCC or PV drain treated soils require much longer construction times as a consequence of the time lost waiting for completion of consolidation settlement. To minimize this impact, two-stage walls with PV drains were constructed during the spring and summer months, so that consolidation settlement could take place during the fall and winter; thus allowing for pavement to be placed during the next construction season. Unexpectedly, the LCC treated soil required about 8 to 9 months to complete consolidation settlement (Table 3-2). A more rapid deformation of the treated soils was anticipated but the LCC columns appear to have induced consolidation settlement in the deeper clays below the 20-m (65.6 ft) deep treated zone (Figure 3-1). The design-build contractor did not use LCC treatment at other project locations due to equipment problems, installation rates and treatment costs that were not as favorable as originally anticipated.

4-2
Page Left Blank Intentionally

5-1
5 Settlement Criteria and Performance Monitoring Project requirements and settlement performance goals played a vital role in selecting, designing and constructing each geotechnology. The settlement criteria and performance observations for each method of embankment construction are presented below. A team of UDOT and design-build personnel established the performance goals and design criteria. In regards to settlement performance of earthen embankments and MSE walls these were:
(1) potentially damaging settlement to adjacent structures and facilities should not extend beyond the UDOT right-of-way
(2) existing utilities located within zones of significant settlement should either be relocated or protected in place
(3) the total post-construction settlement of the embankments, MSE walls and bridge approaches should be limited to a maximum 76 mm (3 in) during a 10-year post-construction period.
For the I-15 project, the post-construction period started once the concrete pavement was placed. The bridge foundations were designed for 25 mm (1 in) of post-construction settlement and the 50 mm (2 in) of differential settlement was to be accommodated by a 15-m (49.2 ft) long bridge approach slab. The first criterion was established to protect adjacent structures and facilities beyond the project limits, but in a few cases where settlements became excessive, adjacent properties were purchased, repaired, or the owner was compensated. Figure 5-1 shows an extreme case where an MSE wall was constructed very near an existing building. In most instances, the adjacent facilities were not located near this close to new construction. However, the exact extent of settlement influence beyond the wall face was not readily understood for the soft Lake Bonneville soil deposits (Figure 1-1). The design-build contractor proposed the third criterion to UDOT as an achievable goal based on the accelerated construction schedule, cost of surcharging embankments and the anticipated performance of the foundation soils. UDOT via the design build contracting mechanism encouraged innovative construction techniques and practices to meet these performance goals and criteria.

5-2
Figure 5-1. Project goals included protecting existing structures adjacent to new construction from potentially damaging settlements.
Under the loading criterion established for EPS geofoam, end of construction settlements of up to 1% strain in the geofoam and post-construction settlements of up to 2% strain after a period of 50 years in the geofoam were anticipated. Deformations measured by magnet extensometers placed in the geofoam fill included elastic compression of the geofoam, gap closure between geofoam block layers and seating of extensometer plates. These deformations resulted primarily from placement of the overlying load distribution slab, subbase and base materials, and pavement.

5-3
5.1 Instrumentation Two instrumentation and monitoring programs were implemented for the I-15 Reconstruction Project. The first was developed by the design-build contractor and expedited embankment construction by assessing foundation/embankment stability and monitoring the progression of primary consolidation (Bartlett et al. 2001a; Saye and Ladd, 2004). It was also used to ensure that the surcharged fill was left in place for sufficient duration so as to meet the 76 mm (3 in) in 10 years post-construction settlement criterion for embankments. A second program was implemented by UDOT, in conjunction with the I-15 Testbed Program, to monitor and evaluate the construction and post-construction performance of innovative embankment/MSE wall construction at 12 array sites for a 10-year post-construction period. The UDOT instrumentation monitoring program, including specific details for all 12 array locations, is discussed in great detail in the “Monitoring and Modeling of Innovative Foundation Treatment and Embankment Construction Used on the I-15 Reconstruction Project, Project Management Plan and Instrument Installation Report” by Bartlett and Farnsworth, 2004. Additional details and results from the UDOT evaluations can be found in Bartlett and Alcorn (2004), Bartlett and Farnsworth (2002), Bartlett et al. (2001b), Farnsworth and Bartlett (2005), Flint and Bartlett (2005), Negussey et al. (2001), Negussey and Stuedlein (2003), and Stuedlein (2003). The UDOT instrumentation and monitoring project initially started out within the UDOT Research and Development Division, but the work was later contracted over to the Civil and Environmental Engineering Department at the University of Utah. This report serves as an interim report for the long-term post-construction monitoring project and discusses results for some of the arrays for an approximate 5 to 7-year post construction monitoring period. The UDOT monitoring program utilized three basic types of instrumentation technologies for measuring settlement:
(1) monuments with high-precision surveying (2) horizontal inclinometers (3) magnet extensometers
Figure 5-2 shows a typical instrumentation array for a wall. A typical wall array included settlement points placed within the footing and in the adjacent ground away from the base of the wall, and survey plugs placed in the pavement atop the wall. Where possible, horizontal

5-4
inclinometers were installed at the base of the wall to provide information on foundation movement. Finally, magnet extensometers were placed in either the foundation or within the embankment to monitor relative compressive movement.
Figure 5-2. Typical instrumentation setup for construction and long-term settlement monitoring of a wall.
The intent of the settlement points was to provide in conjunction with a horizontal inclinometer a complete settlement profile cross-section through the embankment and away from the wall. The settlement points placed in the ground were 900-mm (3 ft) long and partially cased with an oversized pipe to prevent movement from frost heave. All settlement points and monuments were surveyed with a self-reading digital level with sub millimeter precision. The survey circuits were closed on stable off-site benchmarks and adjusted so as to have accuracy of about 1 mm (0.04 in), or less. Additionally, the ends of the extensometer and inclinometer casing were surveyed and the data were adjusted for their movements. Magnet extensometers were installed within the foundation soils in embankment areas, inside and outside of the lime cement column foundation treated area, and within the geofoam embankments. Plate magnets and/or spider magnets were placed at strategic levels within the foundation soils or the embankment. The locations of the magnets were targeted for

5-5
boundary conditions (top and bottom of embankment and bottom of instrument) and changes within the subsurface stratigraphy such as the interface between clay and granular layers thus bracketing the soft compressible clay layers. The positions of the magnets are periodically measured with a probe to record the relative compression between the detector magnets. The position of each magnet can be read with an accuracy of about 3 mm (0.1 in). Additionally, horizontal inclinometers were placed at the top of the foundation soils and within the geofoam embankment to provide a continuous settlement profile through the embankment. The horizontal inclinometer has a system accuracy of about 6 mm (0.2 in) per 25-m (82 ft) of length. Vibrating-wire total pressure cell plates were installed at many arrays, but these data will not be discussed herein. All instrumentation was placed at full height embankment areas away from transition zones (i.e. geofoam/MSE wall transitions or bridges) to avoid complex edge effects and at locations that provided accessibility, long-term protection of the instrumentation, and safety of those gathering the data. Further information about the installation techniques and reading of the instrumentation can be found in Bartlett and Farnsworth, 2004. Additional settlement reference points and magnet extensometers were also installed within relatively large earthen embankments (2400 South, 900 West and 400 South Streets) to monitor post-construction settlements. These embankments were generally 8 to 10 m (26 to 33 ft) high after surcharge removal and were constructed with 2H:1V side slopes on PV drain treated foundation soils. In addition, these embankments were constructed in areas of new alignment or where a significant amount of pre-existing embankment had not preloaded the foundation soils. The cross section and foundation conditions of these embankments are more like the original construction of I-15 in the 1960s rather than the reconstruction cases for which alternative technologies were used. Long-term settlement observations for these embankments have also been included within this report for reference and comparison.
5.2 Settlement Performance of LCC Treated Soil The lime cement column stabilized one-stage MSE wall was the first area that UDOT instrumented and was selected because of the wall proximity to a commercial building (Figure 5-3). The nearness of the new wall to the adjacent building is one of the primary reasons that LCC stabilization was selected by the design-build Contractor for this

5-6
location. The installation of the columns caused the nearest side of the building to heave about 25 mm (1 in), which resulted in minor cracking in some of the building interior walls (Saye at al. 2001a; Bartlett and Farnsworth, 2002). At its closest point, this building is located about 8 m (26 ft) from the wall face and 6 m (20 ft) from the edge of the LCC treated zone.
Figure 5-3. Commercial building adjacent to the one-stage MSE wall at the LCC stabilized foundation site.
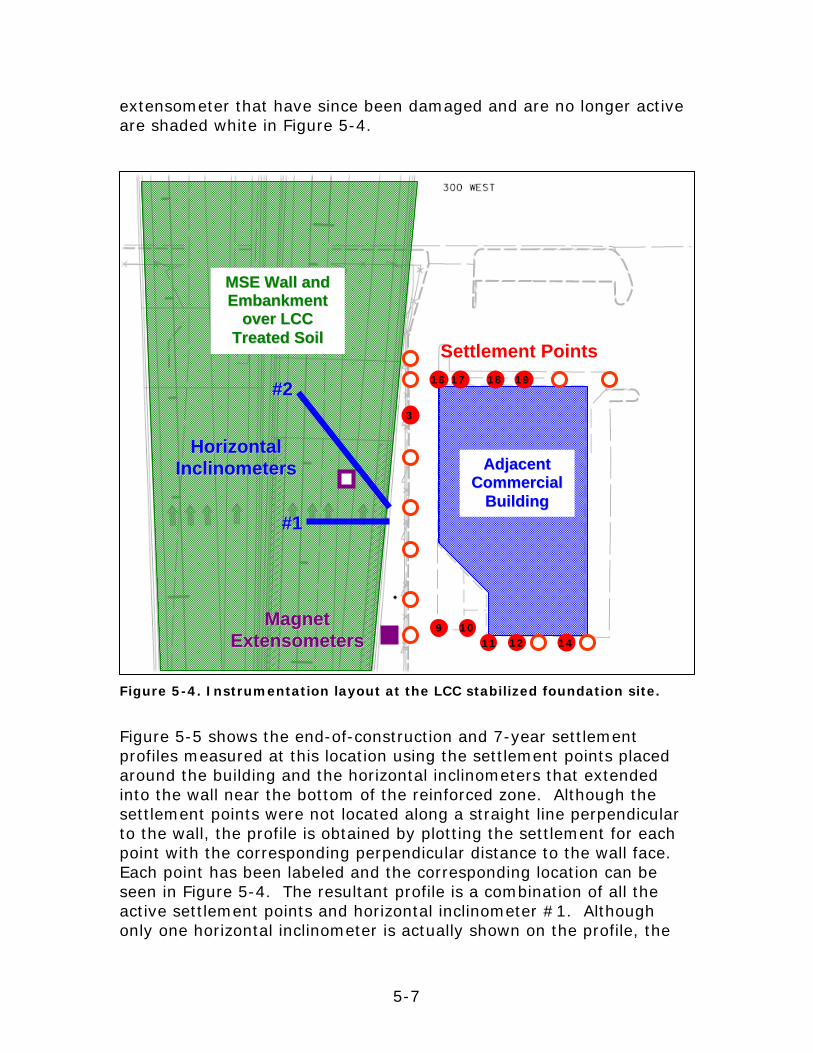
The instrumentation at the lime cement column site was installed after column installation but before MSE wall/embankment construction. Figure 5-4 shows the instrumentation that was placed at this site. Two horizontal inclinometers were placed at the base of the MSE wall during construction. The initial magnet extensometer placed within the wall was lost during construction, and so a subsequent magnet extensometer was placed outside of the wall. Settlement points were placed around the adjacent commercial building, both parallel and perpendicular to the wall face. The settlement points and magnet
5-7
extensometer that have since been damaged and are no longer active are shaded white in Figure 5-4.
Figure 5-4. Instrumentation layout at the LCC stabilized foundation site.
Figure 5-5 shows the end-of-construction and 7-year settlement profiles measured at this location using the settlement points placed around the building and the horizontal inclinometers that extended into the wall near the bottom of the reinforced zone. Although the settlement points were not located along a straight line perpendicular to the wall, the profile is obtained by plotting the settlement for each point with the corresponding perpendicular distance to the wall face. Each point has been labeled and the corresponding location can be seen in Figure 5-4. The resultant profile is a combination of all the active settlement points and horizontal inclinometer #1. Although only one horizontal inclinometer is actually shown on the profile, the
AAddjjaacceenntt CCoommmmeerrcciiaall
BBuuiillddiinngg
MMSSEE WWaallll aanndd EEmmbbaannkkmmeenntt
oovveerr LLCCCC TTrreeaatteedd SSooiill
MMaaggnneett EExxtteennssoommeetteerrss
Settlement Points
3
16 17 18 19
9 10 11 12 14
HHoorriizzoonnttaall IInncclliinnoommeetteerrss
##11
##22

5-8
settlement profile within the wall was nearly identical for both. The largest settlement occurred at the MSE wall face, which was about 150 mm (6 in) at the end of the construction period. The amount of settlement measured by the horizontal inclinometer decreased with increasing distance into the wall. This occurred because the pre-existing I-15 embankment preloaded the foundation soils in this zone.
Figure 5-5. Construction and post construction settlement profile for the lime cement column area.
Settlement measurements from the adjacent magnet extensometer placed in the MSE reinforced zone showed that approximately 50 percent of the construction settlement occurred from compression of the LCC treated zone and the remaining 50 percent occurred in the soils beneath the columns (Bartlett and Farnsworth, 2002). This extensometer was destroyed during paving operations and an additional extensometer with spider magnets was placed at the toe of the wall into the foundation soils. This second magnet extensometer confirmed that about 50 percent of the post-construction settlement is occurring beneath the LCC treated zone. In a 7-year post-construction period, settlement points at the wall face show that the MSE footing
0
25
50
75
100
125
150
175
200
225
-40 -30 -20 -10 0 10 20
Distance From MSE Wall Face (m)
Set
tlem
ent
(mm
)
End of Construction Settlement (8/17/99)
Post Construction Settlement (5/31/06)
Face of MSE Wall
Adjacent Building
Lime Cement ColumnTreated Zone
14
12 19 11
18 10
17 9
16
3
Wall Face
Incl. #1
5-9
has undergone about 50 mm (2 in) of additional settlement, resulting in a total of about 200 mm (8 in) settlement at the wall face. The total settlement is still within the design recommendation of using one-stage MSE walls where total settlements do not exceed 250 mm (10 in). However, the settlement at the wall face has caused minor cracking in some of the concrete facing panels. It should be noted that the wall and non-reinforced embankment behind the wall has undergone some angular distortion, as shown in Figure 5-5. The angular distortion across this zone is approximately 1/210 and 1/160 after construction and 7-years of post-construction settlements, respectively. However, these values are measured at the base of the wall. The surface fill was leveled after removal of the surcharge so that the pavement was placed at the appropriate elevation and drainage slope. Taking this into consideration, the 7-year post-construction angular distortion of the surface pavement is considerably smaller at around 1/720. Additionally, the MSE wall reinforced zone extends only about 8 m (26 ft) behind the wall face with unreinforced embankment fill placed behind that (Figure 2-1). The settlement profile in Figure 5-5 shows that there is not any noticeable settlement difference across this transitional zone. It does not appear that the angular distortion has had any significant impact on the performance of the MSE wall or the surface pavement. Figure 5-5 also shows that the zone of measurable settlements extends about 35 m (115 ft) from the wall face. Construction related settlement of the adjacent building was about 35 mm (1.4 in) at a distance of 8 m (26.2 ft) from the wall face. Seven years of post-construction settlement at this point has produced an additional 40 mm (1.6 in) for a total of 75 mm (3.0 in) of settlement. Such settlement is potentially damaging to sensitive structures and is more than was anticipated in the design. It should also be noted that the west end of the MSE wall serves as an MSE wall bridge abutment on pile foundations. However, the instrumentation for this project was targeted to monitor behavior of the foundation treatment and was placed away from the bridge to avoid any complex edge effects. Thus the instrumentation did not provide any details about the interaction of the pile foundation with the LCC treated foundation soils or the MSE wall.

5-10
5.3 Settlement Performance of Geofoam Walls/Embankment Settlement arrays were installed at two large geofoam embankment/walls located at 3300 South and 100 South Streets in Salt Lake City. The first location is a large approach fill for an interstate bridge that crosses a railroad line and the second location is a buried utility corridor that crosses perpendicular to I-15. At 3300 South Street, the design-build contractor selected geofoam embankment to expedite construction. By working a day and a night shift at this location, the geofoam embankment construction, including placement of pavement, was completed within about 3 months. At 100 South Street, the geofoam embankment was selected to minimize settlements of existing buried utilities across the I-15 alignment. The geofoam embankments at both locations were about 7.5 m (24.6 ft) in height but more material was placed above the load distribution slab at 100 South Street. At this location the subbase material over the load distribution slab consisted of scoria and at 3300 South Street the subbase material consisted of conventional fill. In all cases, the design required that the bearing pressures on the geofoam from the load distribution slab, subbase, base, and pavement section be below the 40% working stress criterion. This loading caused approximately 70 and 80 mm (2.8 and 3.1 in) compression of the geofoam fill during construction, at 3300 and 100 South Streets, respectively, as measured by magnet extensometers located about 2.4 m (7.9 ft) from the vertical wall face (Figure 5-6). The corresponding construction induced strain is approximately 1% (Figure 5-7).
Figure 5-6. 100 South Geofoam Embankment with Magnet Extensometer.

5-11
Figure 5-7. Compressive strain for magnet extensometers within the geofoam embankment at 100 South.
A minimal amount of foundation settlement was expected at the geofoam embankment locations because the weight of the lightweight fill did not induce stresses at depth that exceeded the preconsolidation stress of the Lake Bonneville Clays. In addition, to further reduce the net loading, about 1 m (3.3 ft) of the subgrade was excavated and replaced with geofoam. Figure 5-8 shows that about 15 mm (0.6 in) of foundation settlement occurred from placement of the roadway materials and pavement atop the geofoam at 3300 South Street. The foundation settlement was measured at this location by surveying the top of the magnet extensometer casing. Although measured at the surface, this represents the actual foundation movement because the bottom of the magnet extensometer is located at the base of the embankment fill and the extensometer casing is not free to compress. At about 300 days after completion of the pavement structure at 3300 South Street, the design-build contractor placed a 1.5-m (5 ft) high toe berm at the base of the geofoam wall (Figure 5-9). This new load produced an
0.0
0.5
1.0
1.5
2.0
2.5
1 10 100 1,000 10,000 100,000
Elapsed Time (days) from Completion of Geofoam Placement
Co
mp
ress
ive
Str
ain
(%
)
South Extensometer
North Extensometer
End of Construction 10 Years 50 Years
50 Year Strain Limit
ConstructionStrain Limit
~ 30 mm Equivalent Post-Constr.

5-12
additional 25 mm (1.0 in) of post-construction foundation settlement (Figure 5-8). With this additional loading at the toe, the total foundation settlement (construction and 10-year post-construction) is expected to be about 45 mm (1.8 in). However, if the toe berm had not been placed, the expected foundation settlement would have been about 20 mm (0.8 in) for the same period (Figure 5-8). Nonetheless, this additional settlement was not consequential at this location because there were no nearby utilities. The construction of large toe berms such as this was not typical for other I-15 geofoam walls.
Figure 5-8. Foundation settlement versus time for the 3300 South geofoam embankment.
The post-construction cumulative compression of the geofoam embankment itself at 3300 South Street array is about 25 mm (1 in) to date and is projected to reach about 30 mm (1.2 in) after a 10-year post-construction period. When this geofoam compression is combined with the post-construction foundation settlement and influence of the toe berm previously described, the total 10-year post-construction settlement of the roadway surface is estimated to be about 60 mm (2.4 in), which is less than the 76mm (3.0 in) 10-year criterion.
0
20
40
60
80
100
1 10 100 1,000 10,000Elapsed Time (days) from Beginning of Fill Placement
Fo
un
dat
ion
Set
tlem
ent
(mm
) Foundation Settlement
Toe BermPlacement
10 Year Post-Construction
Geofoam EmbankmentPlacement
Pavement Placement
5-13
Figure 5-9. Profile for 3300 South geofoam embankment, including the addition of a 1.5 m toe berm.
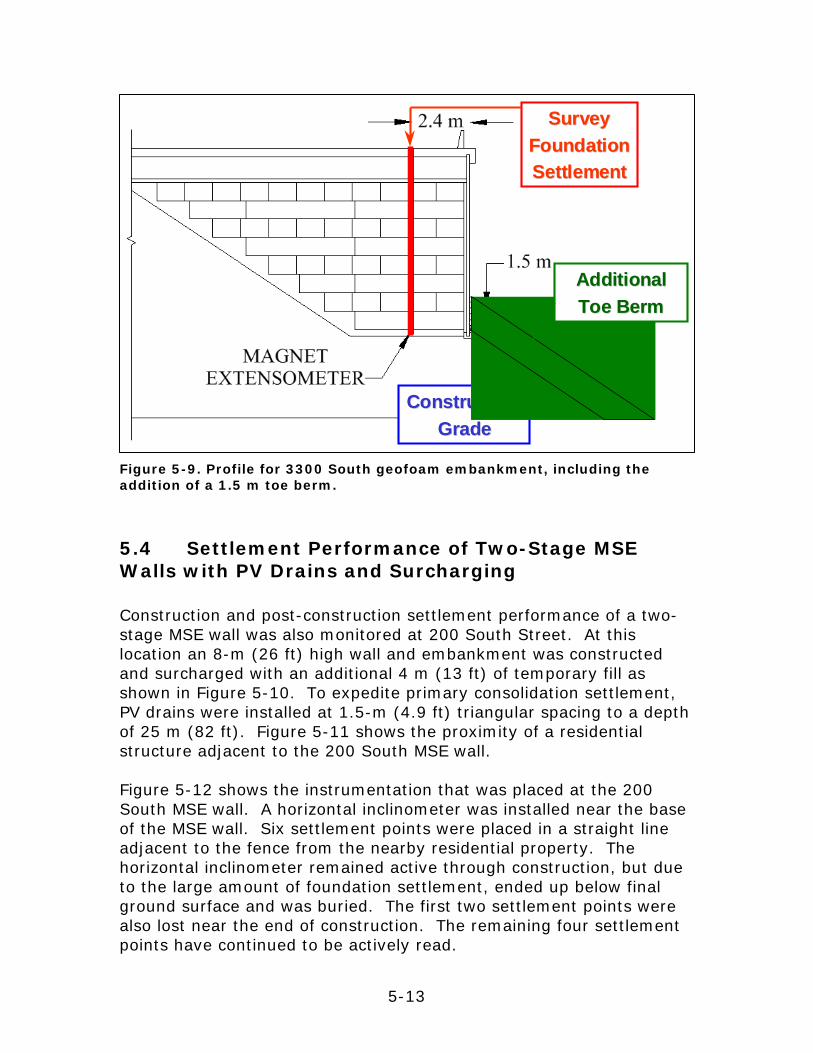
5.4 Settlement Performance of Two-Stage MSE Walls with PV Drains and Surcharging Construction and post-construction settlement performance of a two-stage MSE wall was also monitored at 200 South Street. At this location an 8-m (26 ft) high wall and embankment was constructed and surcharged with an additional 4 m (13 ft) of temporary fill as shown in Figure 5-10. To expedite primary consolidation settlement, PV drains were installed at 1.5-m (4.9 ft) triangular spacing to a depth of 25 m (82 ft). Figure 5-11 shows the proximity of a residential structure adjacent to the 200 South MSE wall. Figure 5-12 shows the instrumentation that was placed at the 200 South MSE wall. A horizontal inclinometer was installed near the base of the MSE wall. Six settlement points were placed in a straight line adjacent to the fence from the nearby residential property. The horizontal inclinometer remained active through construction, but due to the large amount of foundation settlement, ended up below final ground surface and was buried. The first two settlement points were also lost near the end of construction. The remaining four settlement points have continued to be actively read.
SurveySurvey
FoundationFoundation
SettlementSettlement
ConstructionConstruction
GradeGrade
AdditionalAdditional
Toe BermToe Berm

5-14
Figure 5-10. 200 South MSE wall and PV Drain profile.
Figure 5-11. Residential structure adjacent to the 200 South MSE wall.
The two-stage MSE wall and surcharge fill at 200 South Street, shown in Figure 5-10, induced 1,100 mm (43.3 in) of consolidation settlement at the wall face over the construction period. The amount of consolidation settlement that this wall underwent was typical of what the two-stage MSE walls over PV drain treated soil throughout much of the project experienced during the I-15 Reconstruction Project. Furthermore, these values echo the settlement values of 1 to
PV DrainsPV Drains
MSE WallMSE Wall
SurchargeSurcharge
AdjacentAdjacent
HouseHouse

5-15
1.5 m (3.3 to 4.9 ft) that were typical of embankment construction during the original I-15 Construction in the 1960s. The large magnitudes of settlement can be directly attributed to building large embankments over the soft thick Lake Bonneville clay layers. Furthermore, it should be noted that by using the PV drains, the settlement time was shortened considerably, from around 2 to 3 years to about 8 months to construct the embankment/wall and allow for the majority of the consolidation settlement occur.
Figure 5-12. Instrumentation layout at the 200 South MSE wall.
The settlement profile for the 200 South Street MSE wall is shown in Figure 5-13. The instrumentation and corresponding settlement values have been plotted at the nearest perpendicular distance to the wall face. This figure shows that the amount of the consolidation settlement decreased with increasing distance into the wall, due to the influence of the existing embankment, similar to the LCC array (Figure 5-5). As with the one-stage MSE wall at the lime cement column
HHoorriizzoonnttaall IInncclliinnoommeetteerr
SettlementPoints
6
5
4
3
2
1

5-16
location, this wall also experienced some angular distortion due to the pre-existing embankment. The angular distortion across this zone is approximately 1/50 and 1/40 after construction and 6-years of post-construction settlements, respectively. Again, these values are measured at the base of the wall. The surface fill was leveled after removal of the surcharge so that the pavement was placed at the appropriate elevation and drainage slope. Taking this into consideration, the 6-year post-construction angular distortion of the surface pavement is considerably smaller at around 1/260. Furthermore, the pre-cast facing panels were placed in the second construction stage following consolidation settlement. Therefore, the welded wire wall facing would be effected by the full angular distortion. According to the Federal Highway Administration (2001), walls with welded wire facings should have limiting differential settlements of 1/50. The construction settlements essentially reach this target value, with the post-construction settlements exceeding it. At this time, there are not any visible signs that the behavior of the wall is being negatively effected by this angular distortion.
Figure 5-13. Construction and post construction settlement profile for the 200 South MSE wall site.
0
200
400
600
800
1,000
1,200
-35 -30 -25 -20 -15 -10 -5 0 5 10 15
Distance from Wall Face (m)
Set
tlem
ent
(mm
)
End of Construction Settlement (6/22/00)
Post Construction Settlement (5/31/06)
Face of MSE Wall
Adjacent Building
6 5 4 3
2
1
Wall Face
Hor. Incl.

5-17
The zone of measurable settlement extended about 30 m (98 ft) beyond the wall face toward an adjacent house. The nearest edge of the house is at about 15.5 meters (51 ft) from the wall face. A concrete driveway located between 5 and 10 meters (16 and 33 ft) from the wall face experienced more that 100 mm (3.9 in) of differential settlement, cracked and was replaced. In addition, during 6 years of post-construction monitoring, the wall face and nearest edge of the house have undergone approximately 70 and 20 mm (2.8 and 0.8 in) of additional settlement, respectively. UDOT has compensated the home owner for settlement induced damages. The large settlement magnitudes that resulted from the conventional construction of two-stage MSE walls with PV drains illustrates why the other geotechnologies (LCC foundation treatment and geofoam embankment) were employed in locations where settlements of that magnitude could not be facilitated. Settlement magnitudes for the other two geotechnologies were substantially smaller, on the order of 15% and 2% of the two-stage MSE wall with PV drains total settlement value for the one-stage MSE wall over LCC treated foundation and geofoam embankments, respectively. Although these values are specific to these three locations, they do show the relative potential reduction in overall settlement magnitude.
5.5 Comparison of Post-Construction Settlement Performance For most of the monitoring arrays the instrumentation was placed during construction and end of construction was defined as clearance of the embankment for pavement placement. For example, the end of construction was defined for the two-stage MSE wall when the surcharge was removed. However, for the long-term instrumentation installed at the large earth embankments there was a gap in time between the release of the surcharge and the installation of the instrumentation. Since creep settlements are plotted on a log scale, the early part of the record is critical to the total magnitude. To account for this time gap, construction settlement records were used in conjunction with the secondary data to achieve an estimate of the magnitude of creep settlement that was missed. The construction settlement record was first plotted on a semi-log scale. The creep data was then plotted at the corresponding elapsed time with relative settlement magnitudes. Because creep settlements are approximately linear on a semi-log scale, the creep data was simply lined up vertically to where the back extrapolation of the trend line intersected

5-18
the end of construction point. In this way, the magnitude of settlement not recorded between the end of the settlement record and the installation of the post-construction instrumentation was estimated. Figure 5-14 shows how this was accomplished for the 2400 South site. The key to this entire process is ensuring that the post-construction data is plotted relative to the date of the first day of construction monitoring, or day 1 in elapsed time. The construction settlement platform was obtained from the design-build Contractor. The secondary settlement data was obtained from the long-term monitoring instrumentation installed by UDOT. The data from construction settlement platform SP23-7-8 and long-term monitoring settlement point E3 were used to establish the secondary settlement curve for the 2400 South site (also identified as the Merger Array in Bartlett and Farnsworth, 2004). The data from construction settlement platform SP32-9-1 and long-term monitoring settlement point E5 were used to establish the secondary settlement curve for the 400 South site. The data from construction settlement platform SP9W-2-1 and long-term monitoring settlement point S7 were used to establish the secondary settlement curve for the 900 West site.
Figure 5-14. 2400 South construction settlement record with back extrapolation of post-construction settlements.
0
200
400
600
800
1000
1200
1400
1600
1 10 100 1000 10000
Elapsed Time (days)
Se
ttle
me
nt
(mm
)
Construction Settlement
Post-Construction Settlement

5-19
Figure 5-15 presents a summary of post construction settlements at the various embankment locations and for the alternative geotechnologies. To ensure that the rates are shown appropriately, the creep settlement plots are shown with the settlement plotted against the elapsed time (in days) from the beginning of the fill placement. All technologies are compared within this section with the general 76 mm (3.0 in) over a 10 year post-construction settlement goal.
Figure 5-15. Rate of foundation creep extrapolated to 10 years post-construction (dashed lines) compared to the design criteria of 76 mm of post-construction settlement over 10 years for lime cement columns, geofoam fill, two-stage MSE wall at wall face, and large earth embankments with PV drains at full height.
The rate of secondary settlement for the LCC array is shown at two locations in Figure 5-15: one set of data shows the rate of settlement at the wall face and the other shows the rate occurring 13.5 meters (44 ft) inside the wall using the horizontal inclinometer observations. These data show that the LCC treated soil technology will likely meet the 10-year post-construction settlement goal.
0
25
50
75
100
125
150
175
200
100 1,000 10,000
Elapsed Time (days) from Beginning of Fill Placement
Set
tlem
ent
(mm
)
Embankment w/ PV Drains (900 W. St.)Embankment w/ PV Drains (400 S. St.)Embankment w/ PV Drains (2400 S. St.)MSE Wall w/ PV Drains (200 S. St.)LCC at 13.5 m within wall LCC at wall faceGeofoam w/ toe berm (3300 S. St.)Geofoam w/out toe berm (3300 S. St.)

5-20
The post construction settlement for the geofoam embankment is projected to meet the 10-year post construction settlement goal. The post construction settlement of the geofoam embankment is comprised of both foundation settlement and geofoam creep. Figure 5-15 shows the rate of post-construction movement at 3300 South Street with the placement of the 1.5 m (5 ft) toe berm and a projected rate had the toe berm not been placed. The post construction settlement of geofoam is highly dependent upon the loading placed at the base and the top of the geofoam wall The two-stage MSE wall with PV drains at 200 South Street is projected to slightly exceed the 10-year post construction settlement goal at the wall face, where the most pronounced settlement is occurring. Unfortunately, the horizontal inclinometer within the wall was damaged at the end of construction, thus post-construction settlements within the wall footprint are not available. However, the end-of-construction profile (Figure 5-13) shows that settlement was diminishing with increasing distance into the wall. Assuming this trend continued, much of the profile within the wall will likely meet the 10-year post construction settlement criterion. Post-construction settlement performance trends at 2400 South, 900 West and 400 South Streets suggest these large earthen embankments have already exceeded the 76-mm (3.0 in) in 10-year post-construction settlement goal (Figure 5-15). These embankments were primarily constructed in areas of new alignment or where pre-existing embankment had not significantly preloaded the foundation soils. Therefore, locations over pre-existing embankment may not see post-construction settlement rates of this magnitude.

6-1
6 Conclusions The I-15 Reconstruction Project provides a good case history illustrating the challenges of constructing large embankments and MSE walls over soft soil sites in an urban setting. The construction method utilized throughout much of the project for soft soil locations consisted of constructing two-stage MSE walls over PV drain treated soils. However, due to the large primary consolidation settlements [often greater than 1 m (3.3 ft)] induced in the underlying Lake Bonneville clay deposits by such construction; other technologies were used at locations where utilities and/or adjacent structures could not tolerate such large settlements. These consisted of LCC foundation treatment and lightweight geofoam embankment which were designed to reduce both primary and secondary consolidation settlement. This paper has highlighted the settlement performance, cost and time of construction of these technologies as applied to the I-15 Reconstruction Project. A brief summary of the results is shown in Figure 6-1.
Figure 6-1. Summary of cost, time of construction, and construction and post-construction settlements for three different geotechnologies utilized for the I-15 Reconstruction Project, Salt Lake City, Utah.
CostCostMSE
Geofoam
LCC
$$$
1.2 x
1.6 x
Time ofConstruction
MSE
Geofoam
LCC
14 mo.
4 mo.
12 mo.
SettlementSettlementTolerancesTolerances
MSE
Geofoam
LCC
1.1 m
15 mm
150 mm
100 mm
45 mm
50 mm
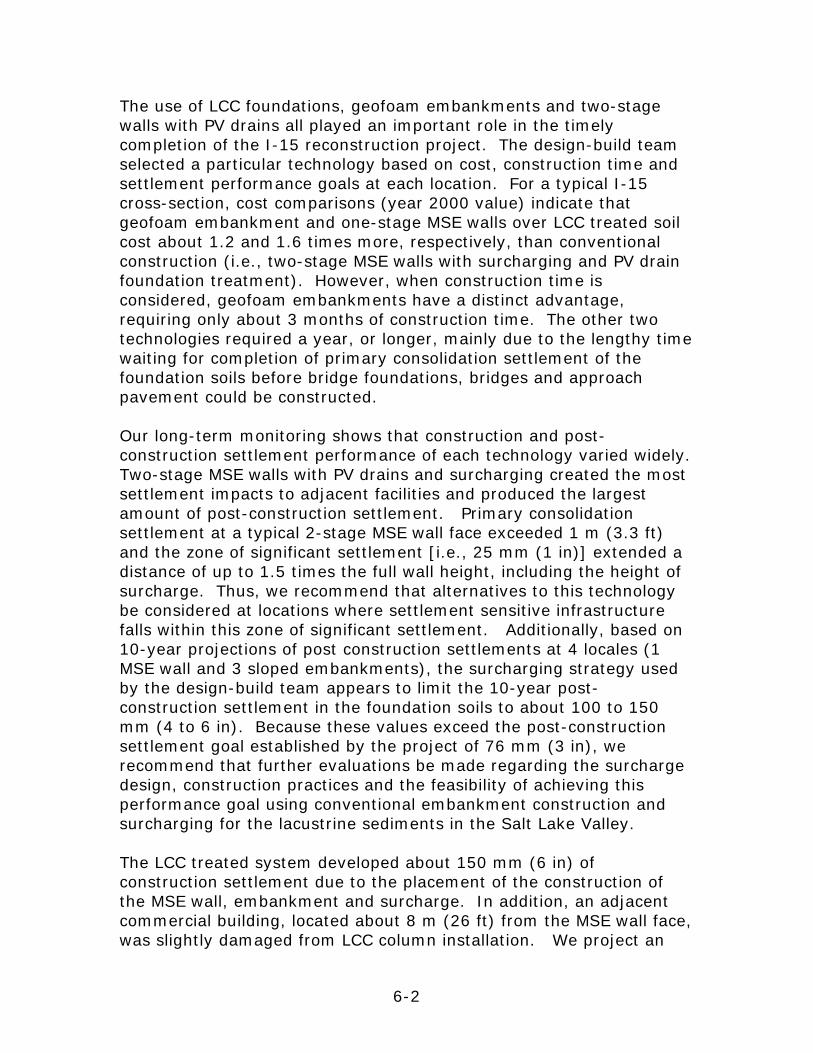
6-2
The use of LCC foundations, geofoam embankments and two-stage walls with PV drains all played an important role in the timely completion of the I-15 reconstruction project. The design-build team selected a particular technology based on cost, construction time and settlement performance goals at each location. For a typical I-15 cross-section, cost comparisons (year 2000 value) indicate that geofoam embankment and one-stage MSE walls over LCC treated soil cost about 1.2 and 1.6 times more, respectively, than conventional construction (i.e., two-stage MSE walls with surcharging and PV drain foundation treatment). However, when construction time is considered, geofoam embankments have a distinct advantage, requiring only about 3 months of construction time. The other two technologies required a year, or longer, mainly due to the lengthy time waiting for completion of primary consolidation settlement of the foundation soils before bridge foundations, bridges and approach pavement could be constructed. Our long-term monitoring shows that construction and post-construction settlement performance of each technology varied widely. Two-stage MSE walls with PV drains and surcharging created the most settlement impacts to adjacent facilities and produced the largest amount of post-construction settlement. Primary consolidation settlement at a typical 2-stage MSE wall face exceeded 1 m (3.3 ft) and the zone of significant settlement [i.e., 25 mm (1 in)] extended a distance of up to 1.5 times the full wall height, including the height of surcharge. Thus, we recommend that alternatives to this technology be considered at locations where settlement sensitive infrastructure falls within this zone of significant settlement. Additionally, based on 10-year projections of post construction settlements at 4 locales (1 MSE wall and 3 sloped embankments), the surcharging strategy used by the design-build team appears to limit the 10-year post-construction settlement in the foundation soils to about 100 to 150 mm (4 to 6 in). Because these values exceed the post-construction settlement goal established by the project of 76 mm (3 in), we recommend that further evaluations be made regarding the surcharge design, construction practices and the feasibility of achieving this performance goal using conventional embankment construction and surcharging for the lacustrine sediments in the Salt Lake Valley. The LCC treated system developed about 150 mm (6 in) of construction settlement due to the placement of the construction of the MSE wall, embankment and surcharge. In addition, an adjacent commercial building, located about 8 m (26 ft) from the MSE wall face, was slightly damaged from LCC column installation. We project an

6-3
additional 50 mm (2 in) of post-construction settlement at the face over a 10-year post construction period. Our monitoring shows that the south side of this building, which is located nearest to the MSE wall face, has undergone about 75 mm (3 in) of construction and post-construction settlement in 7 years resulting from the placement of the adjacent MSE wall. Survey points around this building show that the zone of significant settlement [i.e., 25 mm (1 in)] extends about 20 m (66 ft) from the wall face, or about 1.7 times the full height of the wall, including surcharge. Thus, the LCC treatment has effectively reduced primary consolidation settlement near the wall face, but a significant zone beyond the wall face has been exposed to potentially damaging settlements. This zone is broader than what is typical for a non-treated site and may be a result of consolidation in deeper clays layers caused by a partial stress transfer from the overlying columns. Geofoam embankments had the best overall settlement performance of the technologies monitored. Gap closure and deformation of the geofoam embankment due to placement of the load distribution slab and overlying roadway materials was about 1 percent of the embankment height, or about 80 mm (3.1 in) at our array locations. In addition, the foundation soil settled about 15 mm (0.6 in) due to the placement of the embankment and overlying loads and the face of the embankment settled an additional 25 mm (1.0 in) in a 5-year period due to the placement of a 1.5-m (5 ft) toe berm at the toe of the fascia wall. Total post-construction settlement (foundation settlement and geofoam creep) is expected to be about 60 mm (2.4 in) at the wall face for a 10-year post-construction period. The trend of post construction settlements suggest that geofoam embankments will most likely meet the 50-year post construction deformation limit of 1% axial strain. The use of LCC foundations, geofoam embankments and two-stage walls with surcharging and PV drains has been successfully employed on the I-15 Reconstruction Project. The decision to use these geotechnologies varied from location to location. However, the primary contributing factors included cost, construction time and settlement tolerances of adjacent facilities as each location. This paper serves as a case history providing a relative comparison of these associated factors, which in turn can be used by others to explore the use of these geotechnologies for future projects.
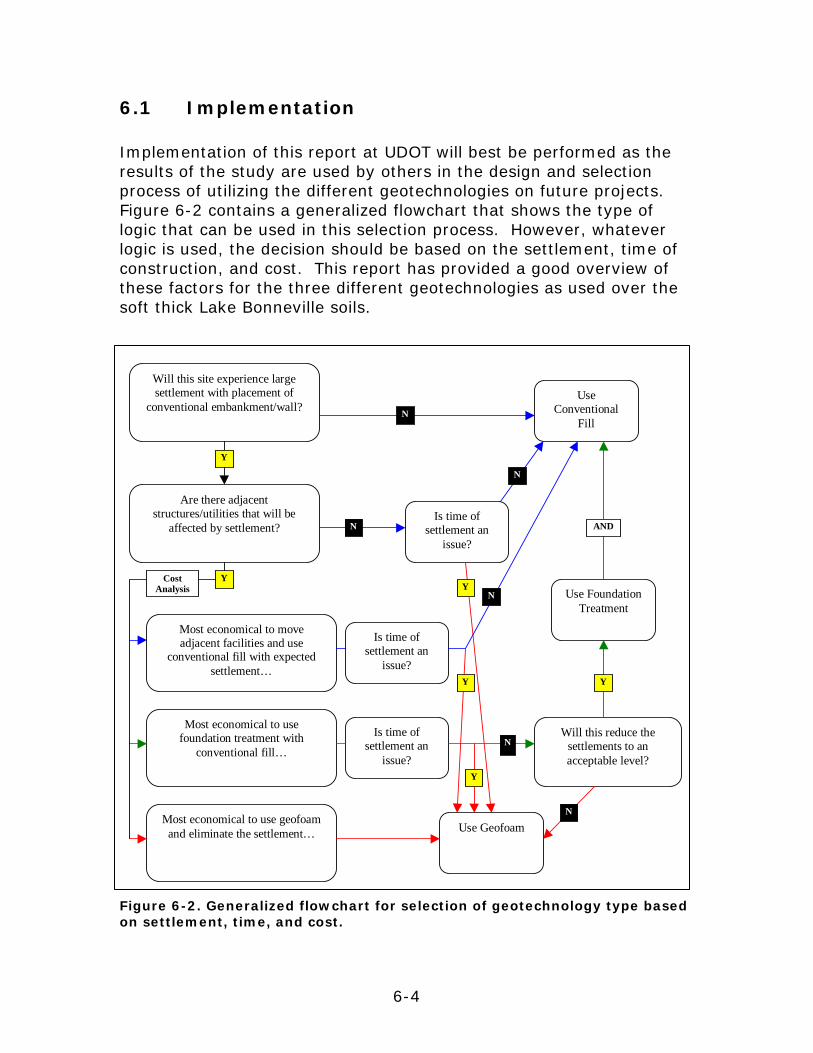
6-4
6.1 Implementation Implementation of this report at UDOT will best be performed as the results of the study are used by others in the design and selection process of utilizing the different geotechnologies on future projects. Figure 6-2 contains a generalized flowchart that shows the type of logic that can be used in this selection process. However, whatever logic is used, the decision should be based on the settlement, time of construction, and cost. This report has provided a good overview of these factors for the three different geotechnologies as used over the soft thick Lake Bonneville soils.
Figure 6-2. Generalized flowchart for selection of geotechnology type based on settlement, time, and cost.
Will this site experience largesettlement with placement of
conventional embankment/wall?
Are there adjacentstructures/utilities that will be
affected by settlement?Is time of
settlement anissue?
UseConventional
Fill
Use FoundationTreatment
Is time ofsettlement an
issue?
Is time ofsettlement an
issue?
Most economical to moveadjacent facilities and use
conventional fill with expectedsettlement…
Most economical to usefoundation treatment with
conventional fill…
Most economical to use geofoamand eliminate the settlement… Use Geofoam
Will this reduce thesettlements to anacceptable level?
N
Y
YY
Y
YY
N
N
N
N
N
AND
CostAnalysis

7-1
7 References Bartlett, S. F. and Alcorn, D. P. (2004). “Estimation of Preconsolidation Stress and Compression Ratio from Field and Laboratory Measurements from the I-15 Reconstruction Project, Salt Lake City, Utah.” Research Report No. UT-03.20, Utah Department of Transportation, Salt Lake City, Utah. Bartlett, S. F. and Farnsworth, C. B. (2002). “Performance of Lime Cement Stabilized Soils for the I-15 Reconstruction Project, Salt Lake City, Utah.” Soil Mechanics 2002, Transportation Research Record 1808, 58-66. Bartlett, S. F. and Farnsworth, C. B. (2004). “Monitoring and Modeling of Innovative Foundation Treatment and Embankment Construction Used on the I-15 Reconstruction Project, Project Management Plan and Instrument Installation Report.” Research Report No. UT-04.19, Utah Department of Transportation, Salt Lake City, Utah. Bartlett, S. F., Farnsworth, C. B., Negussey, D. and Stuedlein, A. W. (2001b). “Instrumentation and Long-Term Monitoring of Geofoam Embankments, I-15 Reconstruction Project, Salt Lake City, Utah.” Proceedings of the 3rd International EPS Geofoam Conference, Salt Lake City, Utah, December. Bartlett, S. F., Monley, G. C., Soderborg, A. and Palmer A. (2001a). “Instrumentation and Construction Performance Monitoring for I-15 Reconstruction in Salt Lake City, Utah.” Soil Mechanics 2001, Transportation Research Record 1772, 40-47. Bartlett, S. F., Negussey, D., Kimball, M. (2000). “Design and Use of Geofoam on the I-15 Reconstruction Project.” Proceedings of the Transportation Research Board Annual Meetings, Washington D.C., January. Farnsworth, C. B., and Bartlett, S. F. (2005). “Long-Term Instrumentation Program to Monitor Various Geotechnologies Used on I-15 Reconstruction Project, Salt Lake City, Utah.” Proceedings of the Transportation Research Board Annual Meetings, Washington D.C., January.

7-2
Federal Highway Administration (1999). “Ground Improvement Technical Summaries.” FHWA, Demonstration Project 116, Publication No. FHWA-SA-98-086, Washington D.C. Federal Highway Administration (2001). “Mechanically Stabilized Earth Walls and Reinforced Soil Slopes Design & Construction Guidelines.” FHWA, NHI Course, No. 132042 Manual, Publication No. FHWA-NHI-00-043, Washington D.C. Flint, M. D., and Bartlett, S. F. (2005). “Numerical Modeling of Settlement Behavior of Treated and Untreated Soils Underlying MSE Walls for the I-15 Reconstruction Project, Salt Lake City, Utah.” Research Report No. UT-04.18, Utah Department of Transportation, Salt Lake City, Utah. Mimura, C.S. and Kimura, S.A. (1995). “A Light-Weight Solution.” Geosynthetics ’95 Conference Proceedings, Volume 1, Nashville, Tennessee, 39-51. National Cooperative Highway Research Program (2004a). “Geofoam Applications in the Design and Construction of Highway Embankments.” NCHRP, Web Document 65, Transportation Research Board, Washington D.C. National Cooperative Highway Research Program (2004b). “Guideline and Recommended Standard for Geofoam Applications in Highway Embankments.” NCHRP, Report 529, Transportation Research Board, Washington D.C. Negussey, D. and Stuedlein, A. W. (2003). “Geofoam Fill Performance Monitoring.” Research Report No. UT-03.17, Utah Department of Transportation, Salt Lake City, Utah. Negussey, D., Stuedlein, A. W., Bartlett, S. F. and Farnsworth, C. B. (2001). “Performance of a Geofoam Embankment at 100 South, I-15 Reconstruction Project, Salt Lake City, Utah.” Proceedings of the 3rd International EPS Geofoam Conference, Salt Lake City, Utah, December. Negussey, D. and Sun M. (1996). “Reducing Lateral Pressure by Geofoam (EPS) Substitution.” EPS Tokyo ’96, Proceedings of the International Symposium on EPS Construction Method, Tokyo, Japan.

7-3
Ng, N. S. Y. (1998). “Characterization of Consolidation and Creep Properties of the Salt Lake City Clays.” Master of Science Thesis, Department of Civil and Environmental Engineering, MIT, Cambridge, MA. Saye, S. R., Esrig, M. I., Williams, J. L., Pilz J., Bartlett S. F. (2001a). “Lime Cement Columns for the Reconstruction of Interstate 15 in Salt Lake City, Utah.” Foundations and Ground Improvement, ASCE Geotechnical Special Publication No. 113, Virginia Tech, 827-841. Saye, S. R. and Ladd, C. C. (2004). “Analysis of Geotechnical Instrumentation to Assess Foundation Performance of I-15.” Geotechnical Engineering for Transportation Projects, ASCE Geotechnical Special Publication No. 126, 2103-2114. Saye, S. R., Ladd C. C., Gerhart, P. C., Pilz, J. and Volk, J. C. (2001b). “Embankment Construction in an Urban Environment: the Interstate 15 Experience.” Foundations and Ground Improvement, ASCE Geotechnical Special Publication No. 113, Virginia Tech, 842-857. Stewart, J. P., Lacy H. S. and Ladd C. C. (1994). “Settlement of large mat on deep compressible soil.” Vertical and Horizontal Deformations of Foundations and Embankments, ASCE Geotechnical Special Publication No. 40, 842-859. Stuedlein, A. W. (2003). “Instrumentation, Performance and Numerical Modeling of Large Geofoam Embankment Structures.” Master of Science Thesis, Department of Civil and Environmental Engineering, Syracuse University, Syracuse, NY.

7-4
Page Left Blank Intentionally

8-1
8 Appendix A

8-2
The following tables were used to complete the cost estimation analysis for the three innovative geotechnologies used on the I-15 Reconstruction Project including a one-stage MSE wall over lime cement column stabilized foundation, geofoam embankment, and a two-stage MSE wall with PV drains and surcharge. The cost estimate breakdown is separated into the major construction components of each geotechnology. Lime Cement Columns
Embankment Removal
Length (m) = 10 Cross-sectional area of embankment removal (sq m) = 156
Volume of embankment (cu m) = 1,560 Cost of embankment removal (per cu m) = $6.00 Total Cost of Embankment Removal = $9,360
Lime Cement Column Installation
Length of LCC face (m) = 10 Width of LCC placement (m) = 37
Footprint of LCC installation (sq m) = 370 Number of 0.8 m columns = 129 Number of 0.6 m columns = 153
Length of columns (m) = 20 Number of 0.6 m columns in transition zone = 20
Average Length of columns in transition zone (m) = 10 Total Length of 0.8 m columns (l m) = 2,580 Total Length of 0.6 m columns (l m) = 3,260
Cost of 0.8 m columns (per l m) = $17.50 Cost of 0.6 m columns (per l m) = $16.00
Cost of 0.8 m columns = $45,150 Cost of 0.6 m columns = $52,160
Total Cost of LCC Installation = $97,310 One-Stage MSE Wall Construction (~ 8 m strap length)
Length of wall face (m) = 10 Height of wall (m) = 10
Area of wall face (sq m)= 100 Cost of wall (per sq m) = $200
Total Cost of wall = $20,000
Embankment Construction Length (m) = 10
Cross-sectional area of embankment placement (sq m) = 262.25 Volume of embankment (cu m) = 2,622.5
Cost of embankment construction (per cu m) = $9.00 Total Cost of Embankment Construction = $23,603

8-3
Surcharge Height of surcharge (m) = 2
Length of surcharge face (m) = 10 Cross-sectional area of surcharge (sq m) = 65
Volume of surcharge (cu m) = 650 Cost of surcharge placement (per cu m) = $9.00
Total cost of surcharge placement = $5,850 Cost of surcharge removal (per cu m) = $6.00
Total cost of surcharge removal = $3,900 Total Cost of Surcharge = $9,750
Total Unit Cost of LCC Wall (per 10 m width) = $160,023
Geofoam Embankment Existing Embankment Removal and Grading
Length of wall face (m) = 10 Depth of removal (m) = 0.75
Cross-sectional area of removal (sq m) = 29.55 Volume of embankment removal (cu m) = 221.63
Cost of embankment removal (per cu m) = $6.00 Total Embankment Removal Cost = $1,330
Bedding Sand
Length of embankment face (m) = 10 Height of sand (m) = 0.3
Cross-sectional area of sand (sq m) = 13.38 Volume of bedding sand (cu m) = 133.8
Unit Weight of sand (pcf) = 125 Weight of sand (ton) = 295.3
Cost of sand (per ton) = $7.00 Total cost of materials = $2,067
Time for placement (days) = 5 Unit cost of crew (per day) = $700
Total cost of placement = $3,500 Total Cost of Bedding Sand = $5,567
Geofoam Embankment
Cross-sectional area of geofoam embankment (sq m) = 144.62 Length of wall face (m) = 10
Volume of geofoam (cu m) = 1,446.2 Cost of geofoam (per cu m) = $45
Total Cost of geofoam embankment = $65,079

8-4
Tilt-up Panel Wall Length of wall face (m) = 10
Height of wall (m) = 10 Area of wall (sq m) = 100
Cost of tilt-up panel wall (per sq m) = $200 Total Cost of Tilt-up Panel Wall = $20,000
Load Distribution Slab
Length of wall face (m) = 10 Cross-sectional width of load distribution slab (m) = 38.33
Area of load distribution slab (sq m) = 383.30 Cost of load distribution slab (per sq m) = $60 Total Cost of Load Distribution Slab = $22,998
Embankment Above Geofoam
Length of wall face (m) = 10 Depth (m) = 1.35
Cross-sectional area of embankment (sq m) = 52.4 Volume of embankment (cu m) = 524
Cost of embankment construction (per cu m) = $9.00 Total Cost of Embankment = $4,716
Total Unit Cost of Geofoam Wall (per 10 m width) = $119,690
Two-Stage MSE Wall with PV Drains Existing Embankment Removal and Grading
Width (m) = 10 Cross-sectional area of embankment removal (sq m) = 156
Volume of embankment (cu m) = 1,560 Cost of embankment removal (per cu m) = $6.00 Total Cost of Embankment Removal = $9,360
Bedding Sand
Length of wall face (m) = 10 Width of footprint (m) = 8
Height of sand (m) = 0.3 Volume of bedding sand (cu m) = 24
Unit Weight of sand (pcf) = 125 Weight of sand (ton) = 52.972
Cost of sand (per ton) = $7.00 Total cost of materials = $371
Time for placement (days) = 2 Unit cost of crew (per day) = $700
Total cost of placement = $1,400 Total Cost of Bedding Sand = $1,771

8-5
Wick Drain Installation Length of wick drain zone (m) = 10
Width of wick drain zone (w/out pre-drilling) (m) = 36 Area of wick drain zone (w/out pre-drilling) (sq m) = 360
Spacing of wick drains (m) = 1.5 Area of individual wick drain coverage (Triangular Spacing) (sq m) = 1.6875
Width of pre-drilling area (m) = 13 Area for pre-drilling (sq m) = 130
Number of wick drains with pre-drilling = 77 Number of wick drains w/out pre-drilling = 213
Length of wick drain (m) = 25 Total length of drains with pre-drilling (l m) = 1,926
Total length of drains w/out pre-drilling (l m) = 5,333 Cost of wick drain installation with pre-drilling (per l m) = $3.00
Cost of wick drain installation w/out pre-drilling (per l m) = $1.50 Total cost of wick drain installation with pre-drilling = $5,778
Total cost of wick drain installation w/out pre-drilling = $8,000 Total Cost of Wick Drain Installation = $13,778
Two-Stage MSE Wall Construction (~ 8 m strap length)
Width of wall face (m) = 10 Height of wall (m) = 10
Area of wall face (sq m) = 100 Cost of wall (per sq m) = $300
Total Cost of Wall = $30,000 Embankment Construction
Length (m) = 10 Cross-sectional area of embankment placement (sq m) = 262.5
Volume of emankment placement (cu m) = 2625 Cost of embankment construction (per cu m) = $9.00 Total Cost of Embankment Construction = $23,625
Surcharge Height of surcharge (m) = 4
Length of surcharge face (m) = 10 Cross-sectional area of surcharge (sq m) = 130
Volume of surcharge (cu m) = 1,300 Cost of surcharge placement (per cu m) = $9.00
Total cost of surcharge placement = $11,700 Cost of surcharge removal (per cu m) = $6.00
Total cost of surcharge removal = $7,800 Total Cost of Surcharge = $19,500
Total Unit Cost of MSE Wall (per 10 m width) = $98,034

8-6
Page Left Blank Intentionally