Embed Size (px)
Citation preview
UCRL-JC-128004PREPRINT
Improved Gas-filled Hohlraum Performance on Nova withBeam Smoothing
R. L. Kauffman, L. V. Powers, S. N. Dixit, S. G. Glendinning,S. H. Glenzer, R. K. Kirkwood, O. L. Landen, B. J. MacGowan,J. D. Moody, T. J. Orzechowski, D. M. Pemington, G. F. Stone,
L. J. Suter, R. E. Turner, T. L. Weiland, A. L. Richard, M. A. Blain
This paper was prepared for submittal to the39th Annual Meeting of the American Physical Society
Division of Plasma PhysicsPittsburgh, PA
November 17-21,1997
December 2,1997
I \
DISCLAIMER
This document was prepared as an account of work sponsored by an agency ofthe United States Government. Neither the United States Government nor theUniversity of California nor any of their employees, makes any warranty, expressor implied, or assumes any legal liability or responsibility for the accuracy,completeness, or usefulness of any information, apparatus, product, or processdisclosed, or represents that its use would not infringe privately owned rights.Reference herein to any specific commercial product, process, or service by tradename, trademark, manufacturer, or otherwise, does not necessarily constitute orimply its endorsement, recommendation, or favoring by the United StatesGovernment or the University of California. The views and opinions of authorsexpressed herein do not necessarily state or reflect those of the United StatesGovernment or the University of California, and shall not be used for advertisingor product endorsement purposes.
Improved Gas-filled Hohlraurn Performance on Nova with BeamSmoothing*
Robert L. Kauffman, L. V. Powers, S. N. Dixit, S. G. Glendinning, S. H.
Glenzer, R. K. Kirkwood, O. L. L~den, B. J. MacGowan, J. D. Moody, T.
J. Orzechowski, D. M. Permington, G. F. Stone, L. J. Suter, R. E. Turner,
and T. L. Weiland
Lawrence Livermore National Laboratory, University of California,
Livermore, CA 94551
A. L. Richard and M. A. Blain
Commissariats ii l’Energie Atomique, Centre d’l!tudes de Limeil-
Valenton, B.F’. n. 27, 94190, Villeneuve-Saint-Georges,
Abstract
FR
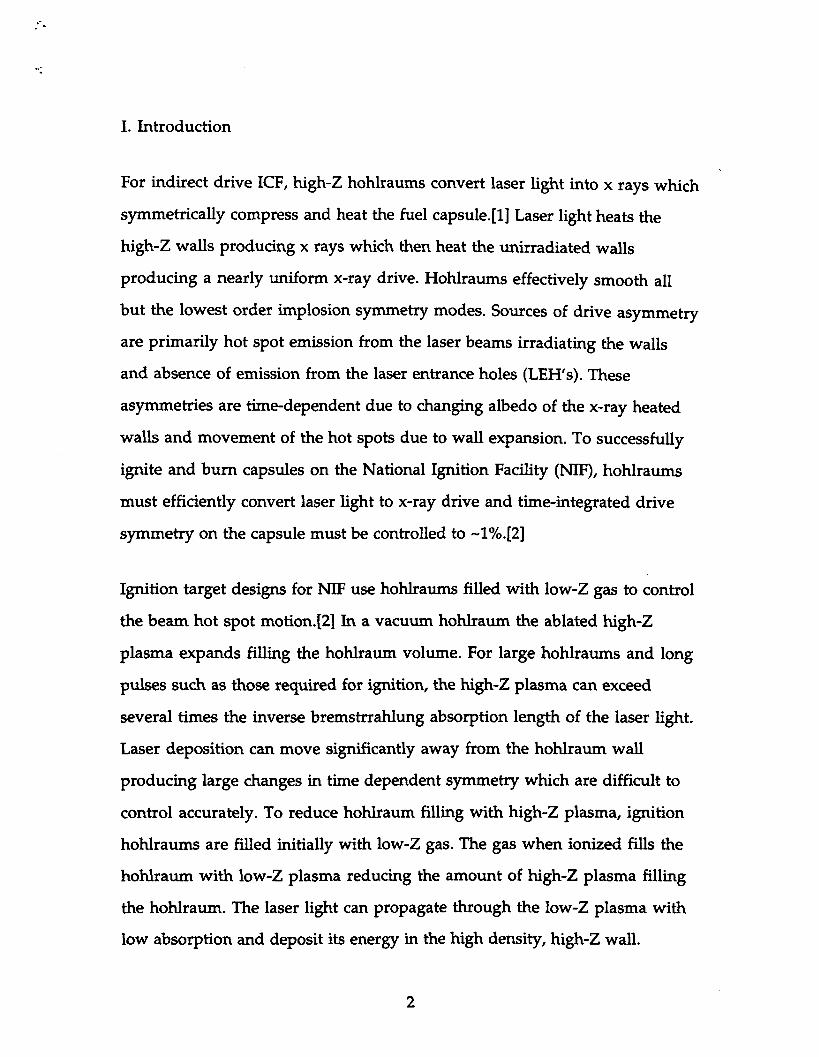
Gas-filled hohlraums are presently the base line ignition target design
for the National Ignition Facility. Initial Nova experiments on gas-
filled hohlraums showed that radiation temperature was reduced due
to SBS and SRS scattering losses and that implosion symmetry had
shifted compared with vacuum hohlraums and calculations.
Subsequent single beam experiments imaging thermal x-ray emission
showed the shift is due to laser-plasma heating dynamics and
filarnentation in a flowing plasma. Experiments using a single beam
have shown that scattering losses and effects of filamentation are
reduced when the beam is smoothed with an random phase plate
(RPP) or kinoform phase plate (KPP). Scattering is further reduced
less than 5% of the incident laser energy when SSD is added.
to
1
..-.
..:
L Introduction
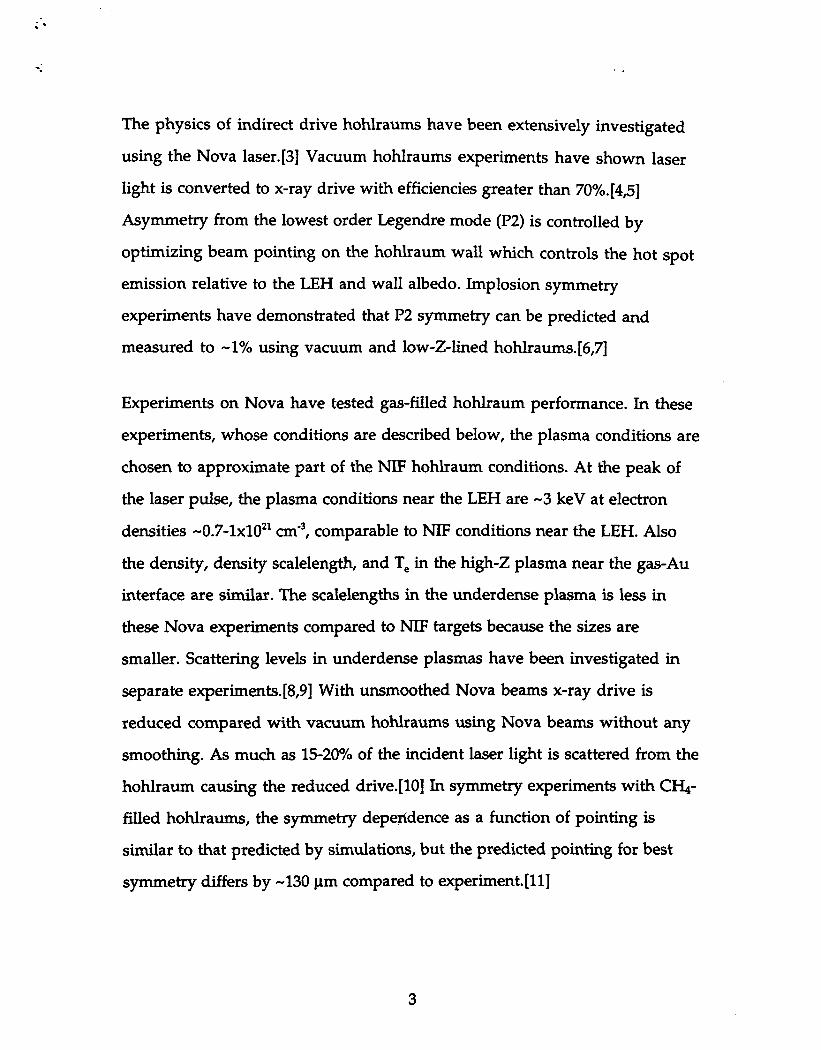
For indirect drive ICF, high-Z hohlraums convert laser light into x rays which
symmetrically compress and heat the fuel capsule. [1] Laser light heats the
high-Z walls producing x rays which then heat the unirradiated walls
producing a nearly uniform x-ray drive. Hohlraums effectively smooth all
but the lowest order implosion symmetry modes. Sources of drive asymme~
are primarily hot spot emission from the laser beams irradiating the walls
and absence of emission from the laser entrance holes (LEH’s). These
asymmetries are time-dependent due to changing albedo of the x-ray heated
walls and movement of the hot spots due to wall expansion. To successfully
ignite and burn capsules on the National Ignition Facility (NIF), hohlraums
must efficiently convert laser light to x-ray drive and time-integrated drive
symmetry on the capsule must be controlled to -1!!4.[2]
Ignition target designs for NIF use hohlraurns filled with low-Z gas to control
the beam hot spot motion.[2] In a vacuum hohlraum the ablated high-Z
plasma expands filling the hohlraurn volume. For large hohlraums and long
pulses such as those required for ignition, the high-Z plasma can exceed
several times the inverse bremstrrahlung absorption length of the laser light.
Laser deposition can move significantly away from the hohlraum wall
producing large changes in time dependent symmetry which are difficult to
control accurately. To reduce hohlraurn filling with high-Z plasma, ignition
hohlraums are filled initially with low-Z gas. The gas when ionized fills the
hohlraum with low-Z plasma reducing the amount of high-Z plasma filling
the hohlraum. The laser light can propagate through the low-Z plasma with
low absorption and deposit its energy in the high density, high-Z wall.
2
;’
-.
The physics of indirect drive hohlraums have been extensively investigated
using the Nova laser. [3] Vacuum hohlraums experiments have shown laser
light is converted to x-ray drive with efficiencies greater than 70%.[4,5]
Asymmetry from the lowest order Legendre mode (P2) is controlled by
optimizing beam pointing on the hohlraum wall which controls the hot spot
emission relative to the LEH and wall albedo. Implosion symmetry
experiments have demonstrated that P2 symmetry can be predicted and
measured to -1’XOusing vacuum and low-Z-lined hohlraums.[6,7]
Experiments on Nova have tested gas-filled hohlraum performance. In these
experiments, whose conditions are described below, the plasma conditions are
chosen to approximate part of the NW hohlraum conditions. At the peak of
the laser pulse, the plasma conditions near the LEH are -3 keV at electron
densities -0.7-1x10²* cm-3,comparable to NIP conditions near the LEH. Also
the density, density scalelength, and T, in the high-Z plasma near the gas-Au
interface are similar. The scalelengths in the underdense plasma is less in
these Nova experiments compared to NIP targets because the sizes are
smaller. Scattering levels in underdense plasmas have been investigated in
separate experiments. [8,9] With unsoothed Nova beams x-ray drive is
reduced compared with vacuum hohlraums using Nova beams without any
smoothing. As much as 15-20% of the incident laser light is scattered from the
hohlraum causing the reduced drive.[10] Jn symmetry experiments with C~-
filled hohlraums, the symmetry dependence as a function of pointing is
similar to that predicted by simulations, but the predicted pointing for best
symmetry differs by -130 pm compared to experiment.[11]
These experiments, as well as some of the imaging experiments described
below, have allowed a physical model to be developed for gas-filled
hohlraums. The light scattering from stimulated Brillouin scattering (SBS)
and stimulated Raman scattering (SBS) occur in two distinct regions. From
the SBS spectrum and correlations with simulations, SBS appears to be
produced at densities of -0.1 n, or greater. These densities are in the AU
plasma near the gas-Au interface. From the SRS spectrum, SRS is occurring
in the underdense plasma at densities less than 0.1 nC.The spectrum extends
to much shorter wavelengths corresponding to much lower densities
consistent with SRS being produced in filaments in the low density plasma.
The shift in implosion symmetry is also consistent with filamentation near
the LEH where the beam propagates transversely through the sonic point.
When filamentation occurs in a plasma with transverse flow, the density
depression associated with the filament is carried downstream and refracts
the beam in the direction of the flow.[12] Simulations show that this effect can
cause significant deflection of hot spots for the calculated plasma parameters
in these gas-filled hohlraums where the flow perpendicular to the beam is
approximately equal to the sound speed.[13] Calculations indicate that spatial
and temporal beam smoothing can improve energy coupling and reduce
beam deflection.
‘I’M paper summarizes the results from smoothed beam experiments on gas-
filled hohlraums performed on the Nova laser. The experiment is briefly
described in Section II. In Section III, results of the thermal x-ray imaging
experiments are presented. These results corroborate the model of beam
deflection due to filamentation in a plasma with transverse flow. In
Section IV, drive experiments with ten smoothed beams are presented. These
4
. ..
.
-.
show that the drive is increased by -15 eV with beam smoothing approaching
levels measured in vacuum hohlraurns. The increase in drive is correlated
with increased absorption. In symmetry experiments reported elsewhere, the
shift in measured pointing for best symmetry is much closer to the predicted
pointing of best syrnmetry.[14] The results are summarized in Section V.
II. Experiment
We use the Nova laser to irradiate CH@lled and vacuum Au hohlraums
(typically, 1600 pm diameter x 2550 pm long). Drive experiments are done in
a geometry similar to that in ref. 4. For these experiments only the x-ray diode
(XRD) measurements of the reradiated flux are made.[15] The CFI.@lled
hohlraums had the laser entrance holes and viewing hole for the XRDS
covered with 0.35 pm polyirnide to retain the gas. The vacuum hohlraurns
also had 0.35 y.rnpolyimide covering the XRD diagnostic hole for comparing
with the Cl&-filled hohlraums. Control experiments showed that the
polyimide had negligible effect on the XRD signals. All of the CH@lled
hohlraums were filled to 1 atm. which was monitored until just before the
shot.
The laser pulse was 2.2 ns long with about a 1 ns foot at -0.6-1 TW per beam,
followed by a 1 ns high power section which peaks at about 1.7 TW per beam.
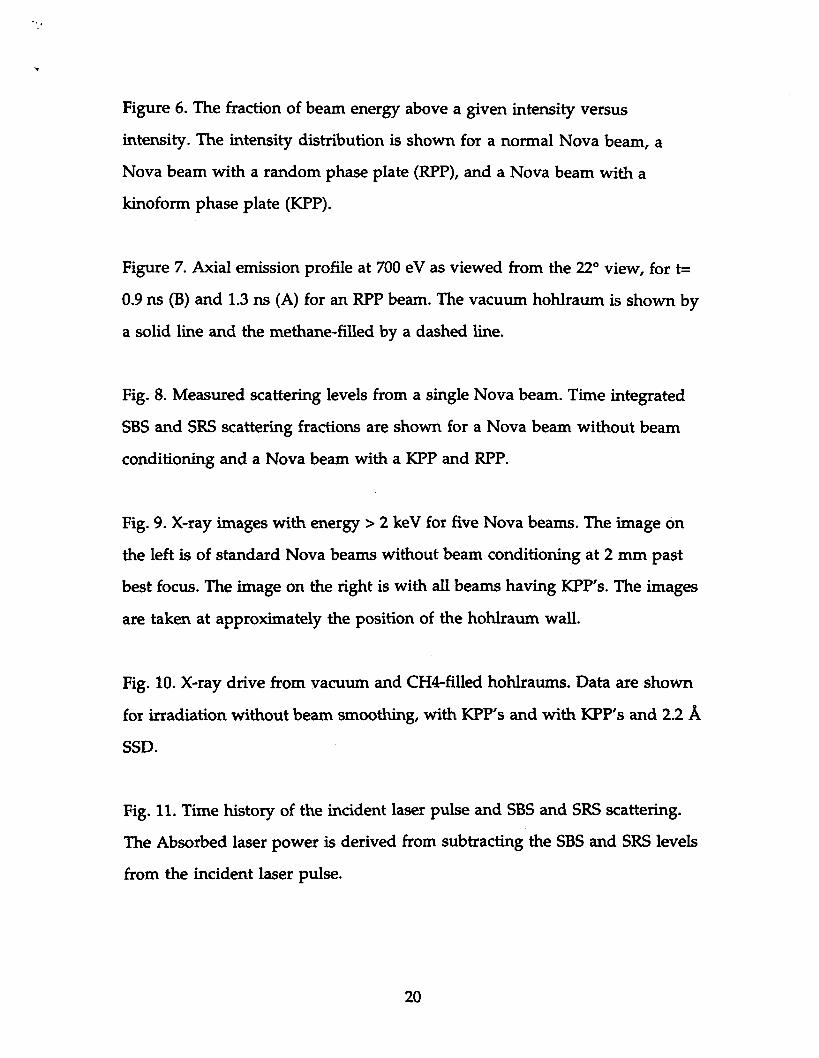
A typical laser pulse is shown in Fig. 1. For the drive experiments all ten
Nova beams were used for a peak irradiation intensity of 17 TW. For the hot
spot imaging experiments, only eight or nine of Nova’s ten beams were used
to avoid hitting the viewing slot. No measurable effect in the spot position
was observed for a variation in total power of *11’ZOrms.
5
:.
‘.
Scattering losses from stimulated Brillouin scattering (SBS)
Raman scattering (SRS) were measured on one (BL7) of the
and stimulated
Nova beams. The
scattered power and time-resolved spectra from both SBS and SRS scattered
into the lens was measured using the full aperture backscatter station
(FABS).[8] Scattering in the near back direction up to angles of 22° was
measured using the near backscatter irnager (NBI).[16]
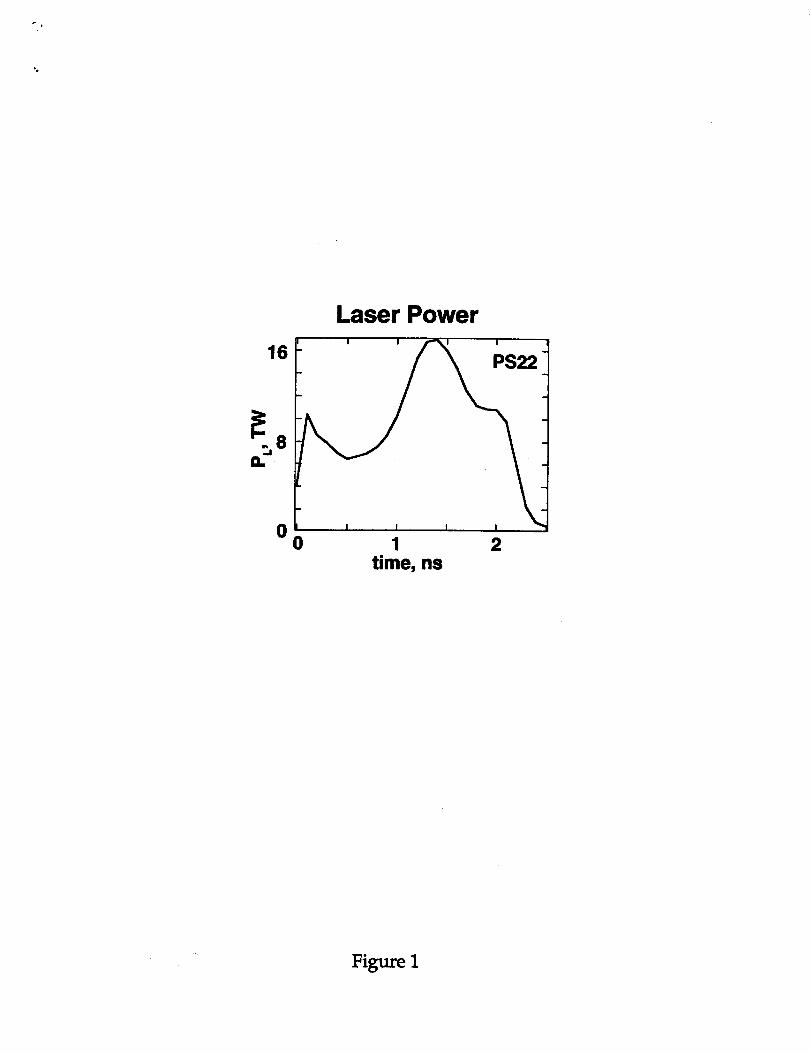
The geometry for the hot spot imaging experiments is shown in Fig. 2. A slot
(typically 600 ~ high x 1900 w long) is cut along the length of the
hohlraum in order to image the thermal x-ray emission from heated Au
walls. All hohlraums had 0.35 ~m polyimide windows covering the slot. The
CH@led hohlraums also had 0.35 pm polyimide across the laser entrance
holes and were pressurized to 1 atm. The slot had a fiducial wire extending
about 100 ~m above its lower edge for absolute spatial position.
X rays were imaged through the slot using two gated pinhole cameras
(SXRFC) with 100 ps temporal and 30 pm spatial resolution.[17] For each shot,
the SXRFC recorded four images separated in time by -0.5 ns for three energy
bands at -280 eV, at -700 eV, and >2 keV. One SXRFC viewed normal to the
hohlraurn axis (0°) and one viewed at 22° to the normal. Diagnostic views
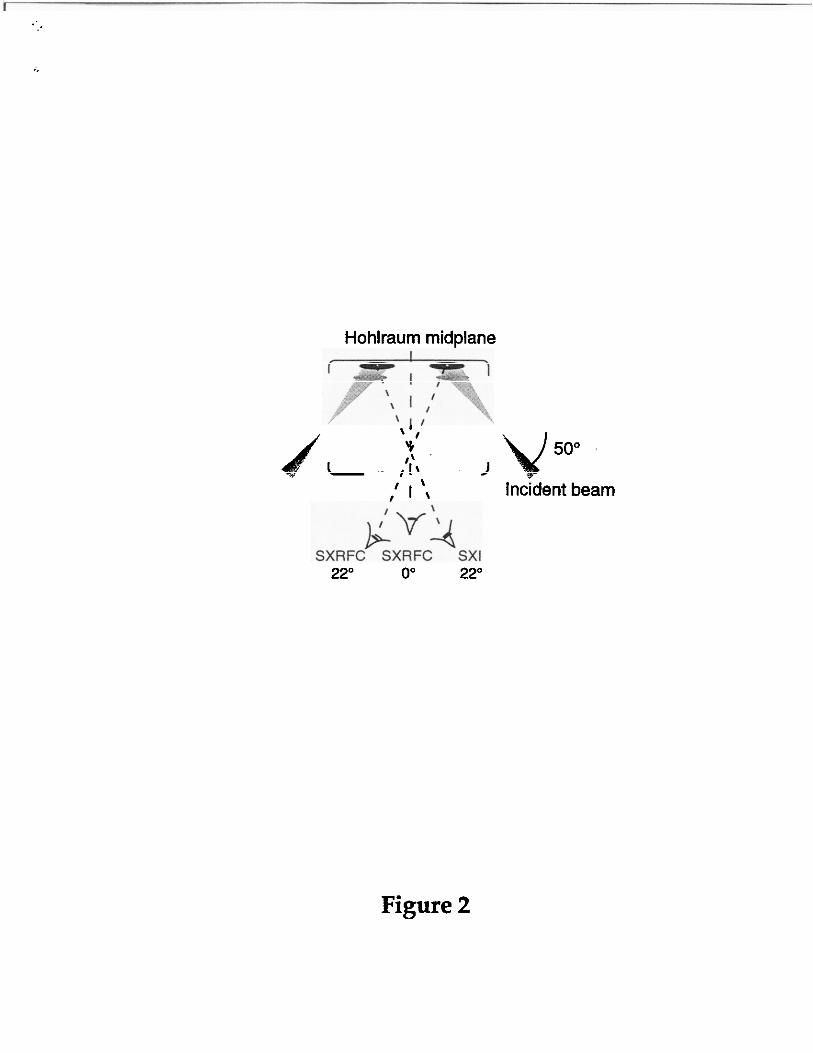
and a typical pair of images at Oand 22° are shown in Fig. 3. Axial emission
profiles are obtained by averaging across a 100 pm wide strip near the middle
of the slot (but away from the shadow of the fiducial wire). Continuous time-
resolved one-dimensional images at -750 eV were recorded using a soft x-ray
irnager (SXI)[18] viewing from a 22” line of sight.
.“
-.
III. Thermal x-ray imaging
The geometry shown in Fig. 2 is used to measure x-ray emission profiles from
the hohlraum wall. Previous experiments imaging x-ray emission profiles in
vacuum hohlraums have shown that hot spot motion is consistent with
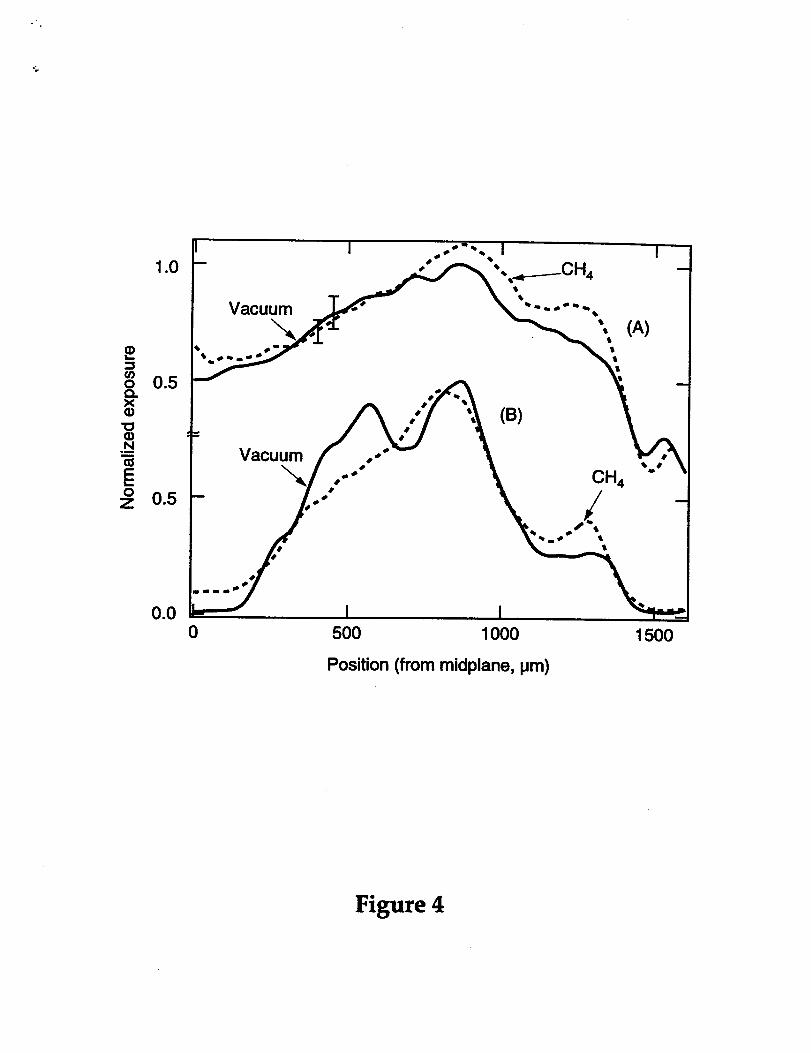
modeling.[19, 20 ,21] Emission profiles from the 22° view at 700 eV in the foot
of the pulse (B) and near the peak of the pulse (A), are shown in Fig. 4 for
CH4-filled and vacuum hohlraums. The emission profiles are averaged over
at least two shots in all cases and as many as five shots for some of the data.
The relative intensity profiles typically repeated to 10% after normalizing to
the total intensity of the profile. The spatial profiles are fit with a Gaussian
curve and a linear background to determine the center of gravity for hot spot
emission. Although the spot may have significant structure, especially early
in time as seen from Fig 4, this provides a convenient characterization of the
emission distribution. The drive symmetry is determined by the entire
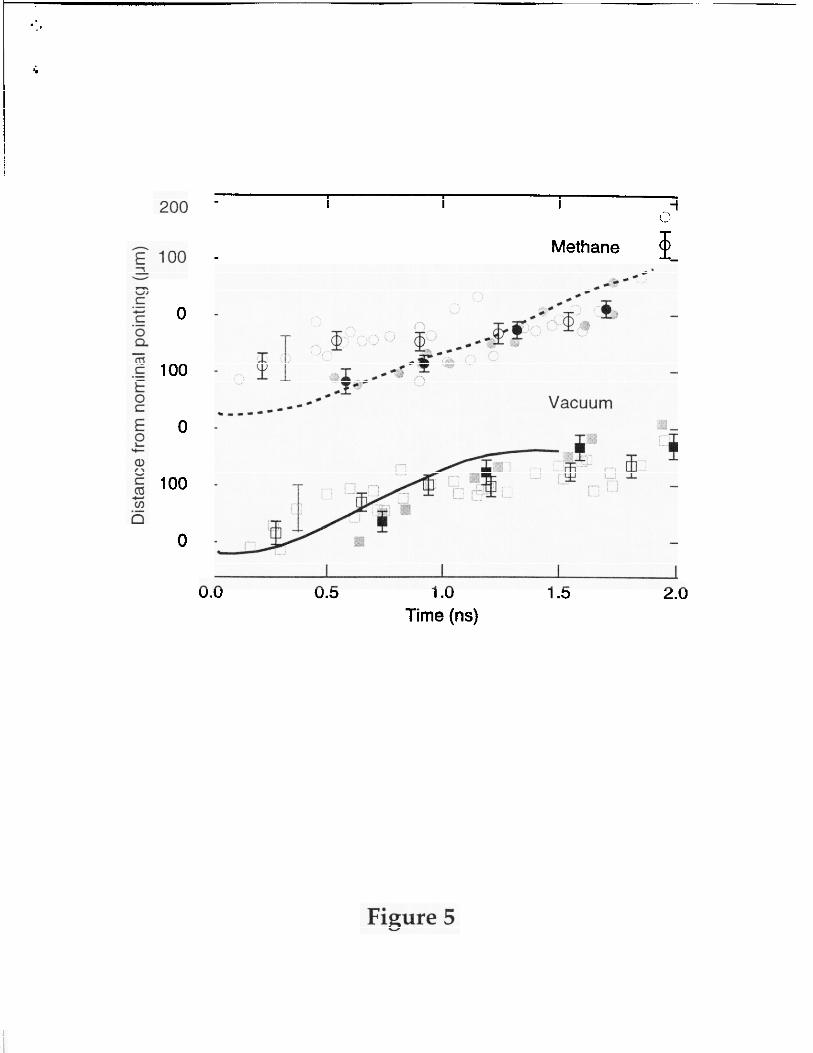
emission profile. The resulting spot positions for each shot before averaging
the profiles are shown in Fig. 5 for vacuum (open square) and C&-filled
(open circle) hohlraums for the 0° view. The uncertainty in absolute position
is about +40 pm under nominally the same conditions. The average of
several images within +150 ps is shown in bold and the error bars, typically
HO ~m, represent the error of the mean.
The experiments are modeled using 2-d Lasnex.[22,23] The Nova beams are
modeled as a cylindrically symmetric ring of laser light with approximately
the same spatial extent of each Nova beam along the hohlraum axis. The
incident power is the total laser power corrected for SBS and SRS scattering
losses measured on a single beam.[24] Results of the modeling are post-
processed to produce emission profiles similar to the experiments. Positions
of the hot spot as a function of time are extracted from the simulations and
are also plotted in Fig. 5. The uncertainty in the calculated spot positions is
about *4O pm. The calculations do not predict a significant difference in the
thermal emission distribution or hot spot position between CH4-filled and
vacuum hohlraums. This is consistent with the predictions of time-
integrated symmetry where little difference was predicted between the
pointing for best symmetry between CH@illed and vacuum hohlraums.
While the presence of gas modifies the evolution of the low-density plasma
ablated by the laser, it is not predicted to significantly alter the position of x-
ray emission for these experimental parameters.
At early times ( <500 ps), the measured hot spot center of gravity is displaced
60&25 pm outward toward the LEH from the predicted position for CH#illed
hohlraums. The origin of this displacement can be seen in Fig. 4B by
comparing the Iineouts from CHA-filled and vacuum hohlraums since
calculationally they are similar. For the vacuum hohlraum, the hot spot
emission shows two distinct lobes with a hole in the center due to the
structure in the Nova beam.[25] For the CH4-filled hohlraum, the intensity of
the inner portion of the beam is depleted compared to the outer portion of
the beam. The hole in the beam enhances the effect. In contrast, the intensity
of the inner and outer portion of the beam is more nearly the same for the
vacuum hohlraum. The inner ray of the beam has about twice the path
length from the LEH to the wall compared to the outer ray, resulting in
increased absorption of the inner portion of the beam in the underdense
plasma. This effect leads to a small change in the hot spot center of gravity at
early time in simulations of gas-filled hohlraums as shown in Fig. 5. The
8
-.
quantitative difference between the measured and calculated spot position at
early time may be due to larger parametric losses along the longer path of the
inner portion of the beam, or to increased absorption if the underdense
plasma temperature is lower than predicted by modeling.
At later times (> 1 ns), the hot spot center of gravity is similar for CHA-filled
and vacuum hohlraums and agrees with calculations as shown in Fig. 5. The
beam structure is not observed in Fig. 4A because of thermal smoothing in
the plasma. The complete emission profile outside of the hot spot, however,
differs for CHa-filled hohlraums compared with vacuum hohlraums which
significantly affects symmetry. The emission intensity outside of the spot
from the “thermally” heated plasma is increased by -1Z6% near the LEH. As
discussed later, the increased intensity near the LEH is consistent with
filamentation in a transverse flow. [12,13] The intensity near the midplane is
less for a CI-@lled hohlraum due to larger scattering losses for CHA-filled
hohlraurns which reduces the drive.
We use a three-dimensional view factor code to estimate the effective shift in
pointing of best symmetry due to changes in emission profiles in CH,-filled
hohlraurns. The changes are equivalent to a -100 pm outward pointing shift.
This is slightly less than the 130pm outward shift reported in Ref. 11 but
within the errors of the experiments and calculations. This correlation
between the x-ray emission pattern and the shift in symmetry confirms that
the capsules in CH@led hohlraurns are driven by x rays and not by other
non-thermal sources.
9
.—
The effects of beam smoothing on the thermal emission profile are tested by
placing an RPP in one of the Nova beams. The RPP produces an Airy pattern
in the far field intensity distribution envelope with - 83% of the intensity ~
the central spot.[26] The central maximum for the Nova RPP is -700 Lm x
37o ~m in the far field which is placed in the LEH.[271 This produces a nearly
circular spot of -7OO~m dia. on the hohlraum wall. Within this envelope,
the RPP produces a speckle pattern of hot spots with transverse size, ~x-~l+j.
where k is the laser wavelength, fis the f-number of the lens. For Nova ~ -4.3
and 2.=0.35 pm, so 6x- 4 pm. In contrast, a typical Nova beam has a
significantly higher fraction of its power at higher intensity in phase-
aberration-produced hot spots of larger scale.
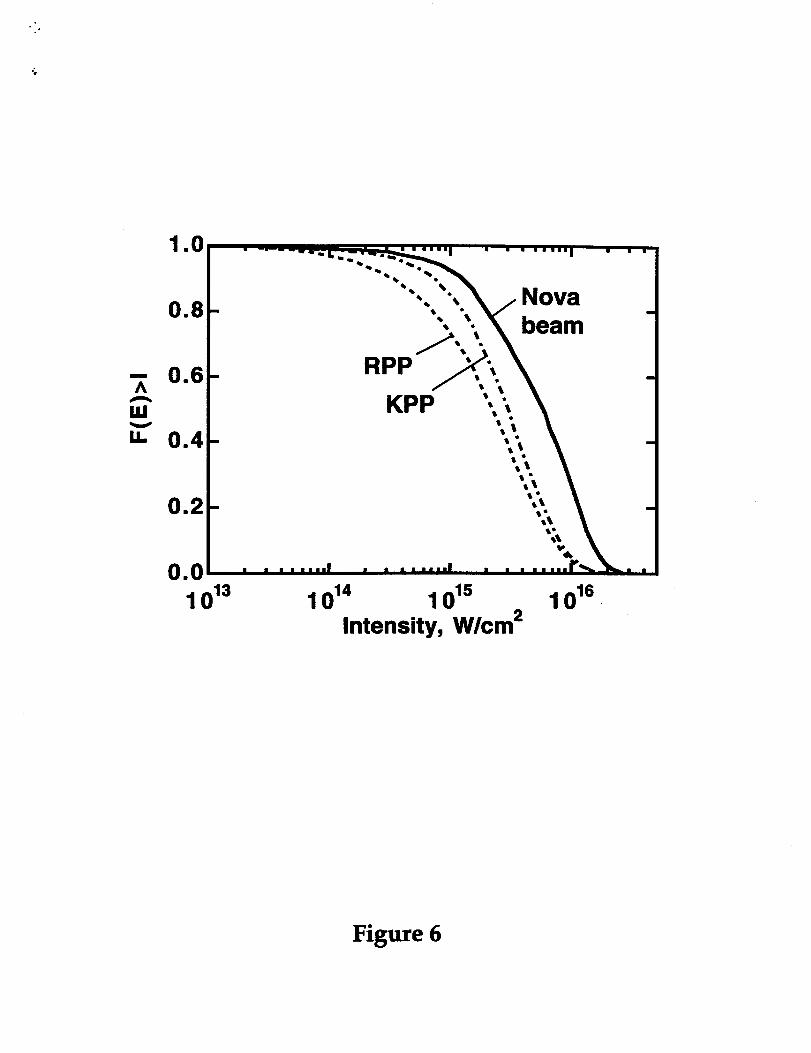
The RPP should reduce effects of filamentation compared to an unsoothed
Nova beam. A comparison of the intensity distribution of a typical Nova
beam and an IU?Pbeam at the plane of the LEH is shown in Fig. 6. Plotted is
the fraction of the beam above a given intensity for a beam with 2 TW of
power. These estimates are derived from the Nova beam model developed in
ref. 25 and modification by the RPP developed in ref. 27. For plasma
conditions calculated at the LEH, filamentation thresholds are estimated to be
-6x10¹⁵ W/cm2. For a typical Nova beam -50Y0 of the intensity is greater than
6X10*5 W/cm* while less than 20% of an RPP beam is greater than that
intensity. In addition, the RPP increases the length over which the beam
maintains the far field distribution so that the beam is still nearly in the far
field when it reaches the hohlraum wall.
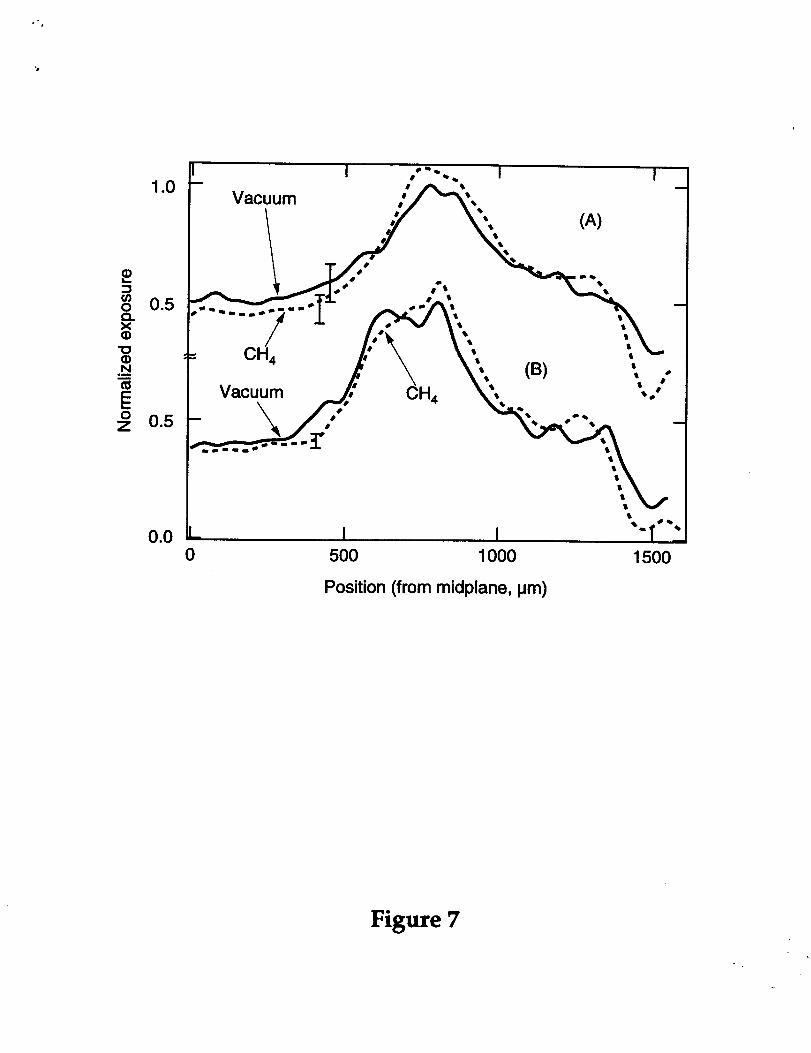
Lineouts from the RPP beam are shown at t-O.9 I’LSand near the peak of the
pulse (t-1.3 ns) in Fig. 7B and 7A, respectively, for CH@led and vacuum
10
...
hohlraums. The center of gravity of the hot spots extracted from the Iineouts
are shown in Fig. 5. No significant difference in the spot position is observed
with and without an RPP for vacuum hohlraums. However, the addition of
an RPP significantly changes the hot spot position for CH4-filled hohlraums.
The difference between experiments and calculations of the hot spot center of
gravity is eliminated for t20.5 ns (we have no data before that time). In
addition, at the peak of the pulse the enhanced emission near the LEH is
eliminated.
At early times, changes in the RPP intensity distribution envelope contribute
significantly to the reduction in the observed shift. The RPP produces a single
spot on the wall since it is still approximately in the far field instead of an
annulus which produces two lobes when imaged through the center. The
path length difference between the inner ray and outer ray is much less for
the RPP compared to a regular Nova beam reducing effects of differential
absorption across the beam spot. The lower intensity distribution for the RPP
helps to suppress any possible stimulated processes which might also be
contributing to the larger losses in the inner portion of a regular Nova beam.
Near peak intensity the RPP suppresses the enhanced thermal emission near
the LEH for CHA-filled hohlraums. This is consistent with the interpretation
that the enhanced emission results from beam deflection in a plasma with a
transverse flow gradient. The calculated deflection of the beam for a hot spot
with an intensity of about 6X10¹⁵W/cm* is -9°.[13] This angle is consistent
with enhanced emission toward the LEH observed in the experiment for
unsoothed beams since they have significantly more structure at higher
intensities than an RPP beam. Simulations show that reducing the intensity
11
of the hot spot reduces the deflection, consistent with the observation that an
RPP reduces the excess emission near the LEH.
Spatial beam smoothing also reduces levels of SBS and SRS. In single beam
experiments, an RPP and a Icinoform phase plate (Wp) are used in BL7 which
has the backscatter diagnostic.[28] A KPP is similar to an RPP in that it reduces
the fraction of the beam energy at high intensity as shown in Fig. 6. The
advantage of a KPP is that it can produce a more uniform average intensity in
the central spot. The present KPP produces an elliptical far field spot
approximately 220 #m by 340 ~m containing -93Y0 of the incident laser
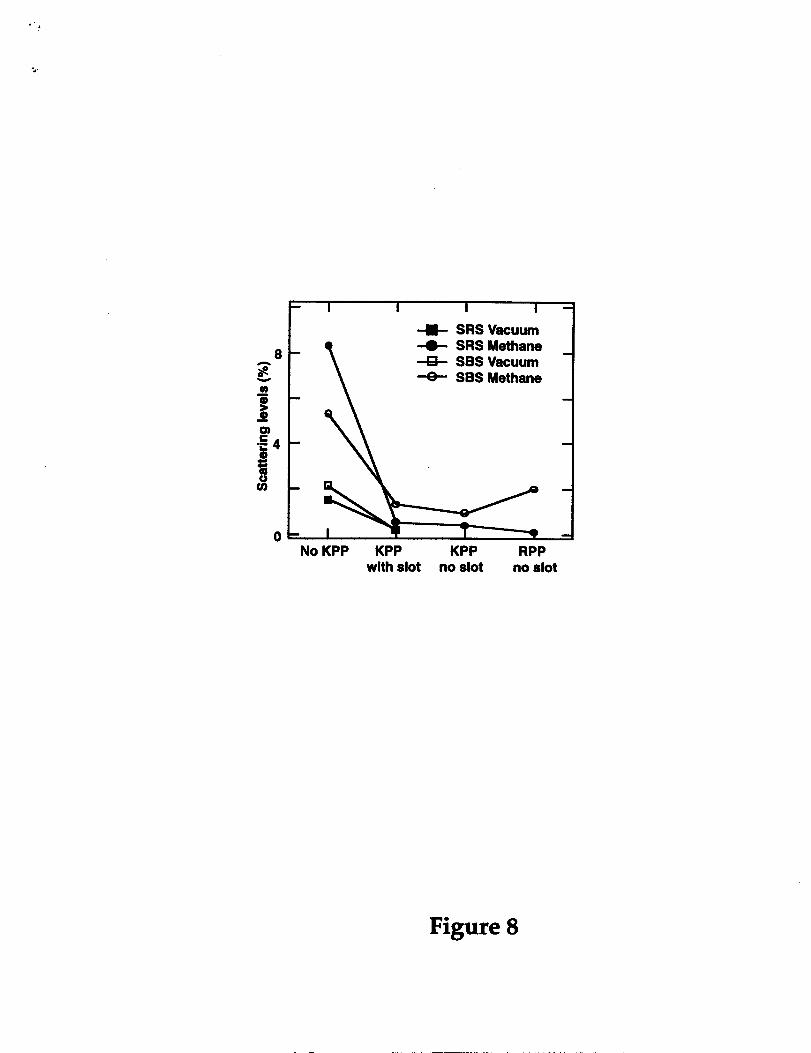
energy. Time integrated SBS and SRS scattering into the lens is shown in Fig.
8. The figure compares scattering levels with and without a KPP in a single
beam. The RPP and KPP reduces the total scattering to less than 3°/0compared
to nearly 15% without a KPP.
IV. Ten smoothed beam results
The encouraging results from single beam experiments provided impetus to
field beam smoothing on all ten of Nova’s beams to perform integrated
experiments on x-ray drive and symmetry. Ten KPP’s were fabricated with
each producing an elliptical spot at best focus that is 220 pm by 340 pm. The
elliptical design was chosen to produce an approximately circular spot in the
plane of the laser entrance hole with 2.2 ~ of SSD. The average intensity in
the beam for a 2 TW beam is -3x10*S W/cm2 at best focus which is slightly
higher than the average intensity of a NIP beam at the LEH which is
-2x10H W/cm2.
12
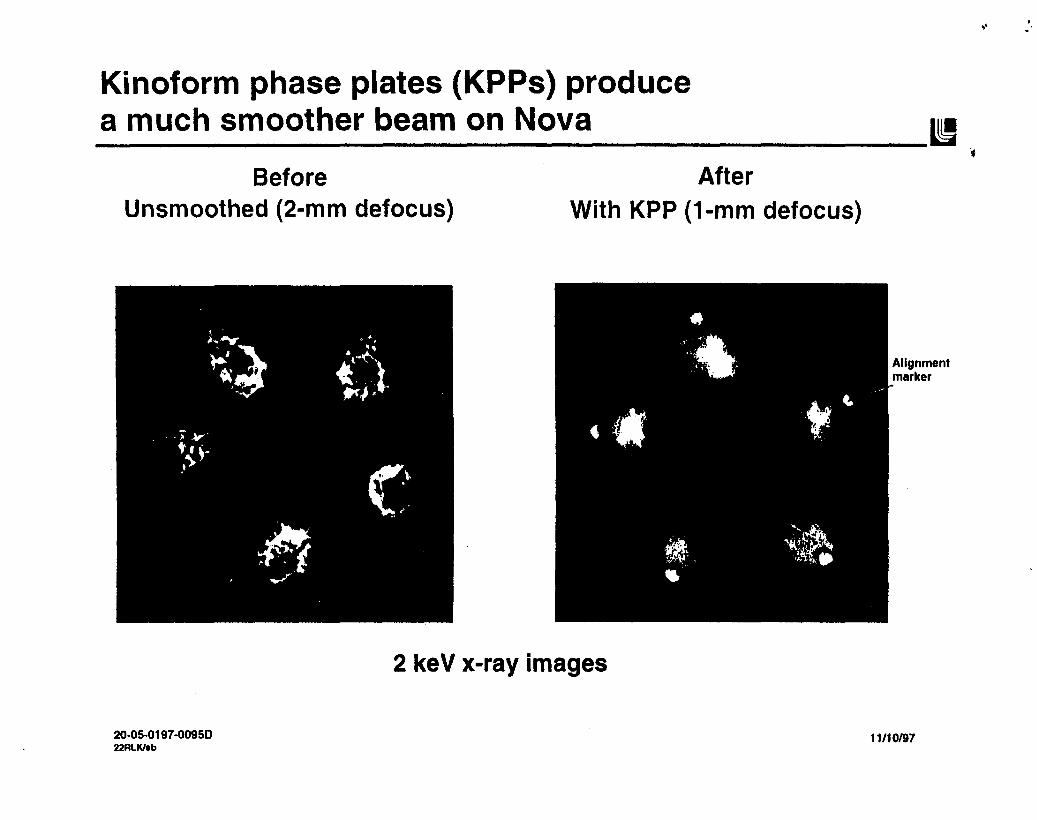
X-ray images of five of the Nova beams are shown in Fig. 9 for beams with
and without a KPP. The beams did not have SSD on them for these
experiments. The unsoothed Nova beams have been defocused by 1 mm
corresponding to the focal conditions at the plane of the laser entrance hole.
For the beams without KPP’s there is considerable structure due to phase
aberrations from the amplifiers, the split in the disk of the 46 cm dia.
amplifiers, and from the support structure of the I(DP array. [25]. The hole in
the center of the beam is due to the center 20 cm beam block in the Nova
beam so that unconverted light will not hit the target and that internal ghost
foci in the final focus lens are reduced. The KPP beams show much less
structure although they are not perfectly uniform because of residual beam
phase front aberrations. The KPP beam has the small scale speckle pattern
characteristic of the f/# of the lens. Beam statistics for a KI?P is compared in
Fig. 6 with a normal Nova beam and an RPP beam. The KPP beam has
slightly more energy at higher intensity than an RPP beam primarily because
a KPP beam has a more uniform distribution and more energy in the central
maximum.
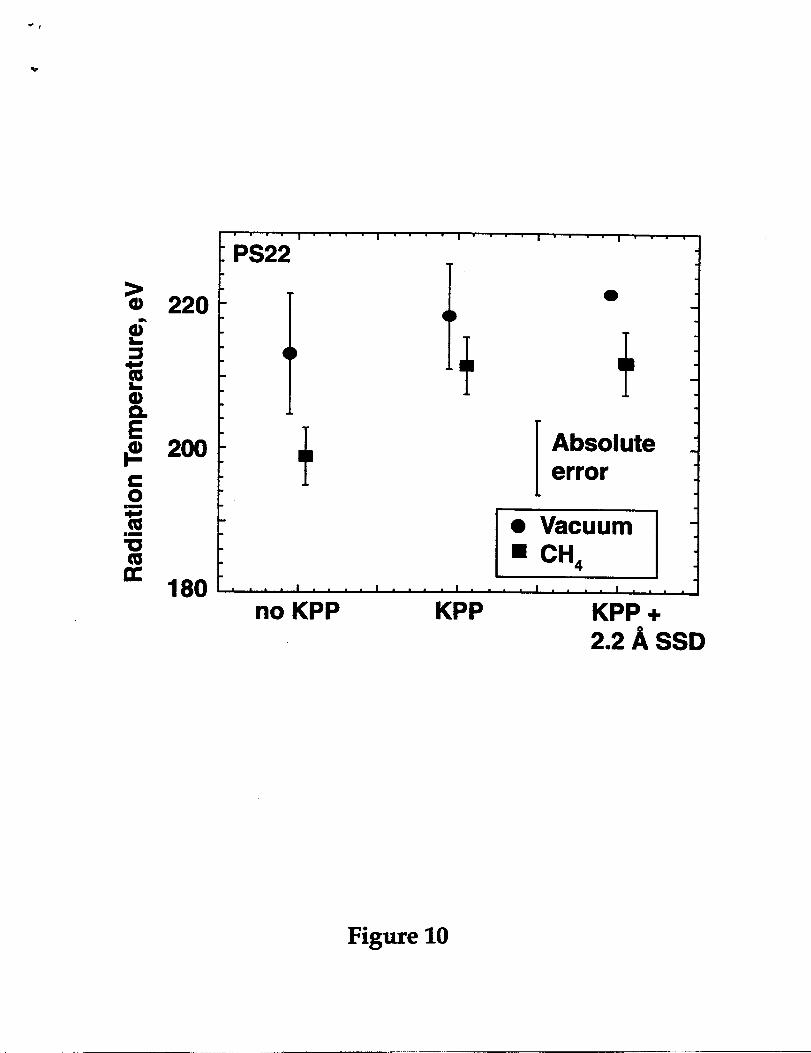
The x-ray drive in CIl@led hohlraurns with ten ICPP beams increased
significantly compared to the drive from C&filled hohlraums heated with
unsoothed Nova beams. A comparison of drive temperature is shown in
Fig. 10 for both vacuum and CH4-filled hohlraums without beam smoothing,
with KIT’s alone, and with KPP’s plus 2.2 ~ of SSD. The data are the
measured Dante wall temperature at 1.8 ns near the peak of the drive pulse
corrected by 11 eV for the wall albedo.[4] For CH4-filled hohlraums the drive
increases by -15 eV with the addition of KIT’s and KPP’s+SSD to
temperatures above 210 eV. The drive from vacuum hohlraums also
13
increases with KPF’s due to reduced scattering losses. In other experiments
using a pulse with peak intensity of -25 TW, peak drive temperatures of
230 eV have been obtained in CHd-filled hohlraums.
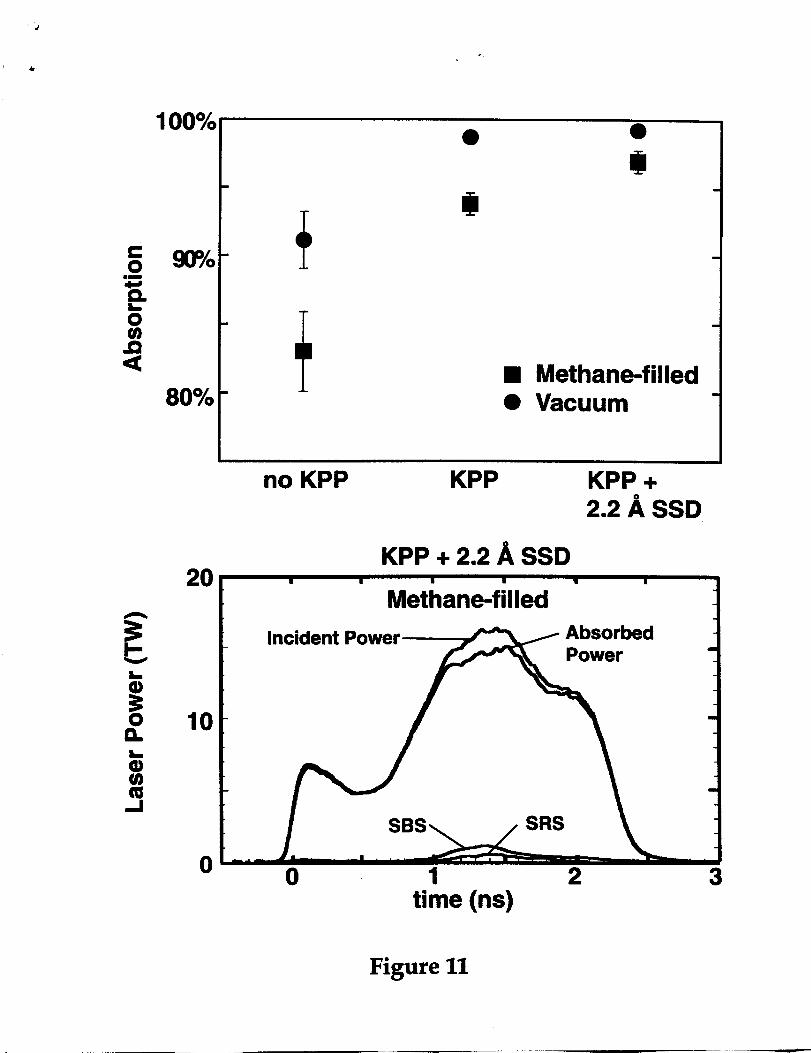
The increased drive temperature is due mostly to increased laser coupling to
&e target. Fig. 11 shows the absorption fraction for the different beam
configurations. For targets with unsoothed Nova beams, absorption is 80-
85% of the incident laser energy. SBS is 9-12% and SRS is 6-8’Yo.When K.PP’s
are added, absorption is greater than 90°%with the SRS being reduced to less
than 2% and the SBS to -5°/0.With 2.2 ~ SSD, absorption is greater than 95%
and the SBS and SRS is approximately halved compared to KPP’s only. The
time history of the incident laser power and the scattering losses is shown in
Fig. 11 for KIT’s + SSD. The scattering occurs around the peak of the pulse,
but the peak absorbed power is still more than 90% of the incident peak
power.
The KIT’s reduce the fraction of energy above 6X10HW/cmz, the
filamentation threshold for conditions near the laser entrance hole,
compared to a Nova beam. This improves target performance in two
important ways. First, it reduces the levels of SRS from the underdense
plasma. The SRS spectrum from an unsoothed beam is quite broad and
shifted to shorter wavelengths. This infers that much of the SRS is occurring
in the density depression produced by the filament. Most of the SRS from low
densities is eliminated with IU?P’S accounting for the reduction in SRS levels.
The second improvement is the reduction in beam deflection since beam
deflection occurs from filamentation in a transverse flow near the expanding
14
-,
.
plasma sonic point. In symmetry experiments reported elsewhere, the shift in
symmetry for gas-filled hohlraums is significantly reduced with KIT’s on all
ten bearns.[14] Further evidence can be seen from the angular distribution of
SBS. SBS is produced in the plasma -0.1 nCnear the hohlraum wall. If the
incident beam is deflected traversing the sonic point in the underdense
plasma before reaching the wall, SBS at the wall would be shifted from direct
backscatter by the deflection angle. For unsoothed Nova beams the SBS is
shifted by about 9° from direct backscatter consistent with beam deflection.
Over 50% of the SBS light is scattered outside of the lens. With a KPP beam,
the SBS is nearly collimated and only -20Y0 of the SBS light is scattered
outside of the lens.
V. Summary
In summary, both single beam and ten beam experiments have shown that
beam smoothing significantly improves gas-filled hohlraurn target
performance. With unsoothed Nova beams, total scattering levels from
SBS and SRS are 15-20% and the pointing of beast symmetry is shifted by
-130 ~ compared to Lasnex modeling predictions. Single beam experiments
show that much of the pointing shift is due to enhanced heating near the
endcap of the hohlraurn. Some of the effect is due to early time beam
propagation through the low Z gas. The heating of the endcap is consistent
with filamentation of the beam in a transverse flow. Both effects can be
reduced using spatial beam smoothing. In addition spatial beam smoothing
reduced the scattering levels from SBS and SRS. Experiments with smoothing
on all ten beams confirm the single beam results. Drive measurements with
KIT’s and KPP’s+SSD showed that drive increased by -15 eV in gas-filled
15
hohlraums compared to drive in gas-filled hohlraums heated with
unsoothed beams. Peak drive temperatures are measured to be 210 eV for
17 TW peak power pulses and 230 eV for pulses with peak power of 25 TW.
Scattered light measurements show that absorption is over 95% for gas-filled
hohlraums using KPP’s with 2.2 ~ of SSD. In symmetry experiments,
reported elsewhere, the shift in pointing of best symmetry is reduced to 35 ~m
from the best symmetry position predicted by Lasnex which is nearly the
pointing and alignment accuracy of Nova.[14] These results using beam
smoothing being planned for NIP provide confidence in target performance
predictions for NIP.
We would like to thank the support of the Nova personnel for operations of
Nova and to LANL technical staff for support of the gated x-ray irnagers. We
also acknowledge contributions of Norm Delamater and other LANL
scientists for sharing the results of the time integrated symmetry experiments
prior to publication. This work supported under the auspices of the U.S.
Department of Energy by the Lawrence Livermore National Laboratory under
Contract No. W-7405-ENG48.
1. J. Lindl, Phys. Plasmas 2,3933 (1995).
2. S. W. Haan et al., Phys. Plasmas 2,2480 (1995).
3. E. M. Campbell, et al., Rev. Sci. Instrurn. 57,2101 (1986).
4 R. L. Kauffman, et al., Phys. Rev. Lett. 73,2320 (1994).
5. L. J. Suter, et al., Phys. Plasmas 3,2057 (1996).
6. L. J. Suter, et al., Phys. Rev. Lett. 73,2328 (1994).
16
7. A. A. Hauer, et al., Phys. Plasmas 2,2488 (1995).
8. B. J. MacGowan et al., P. Plasmas 3,2029 (1996)
9. J. D. Femandez, et al., Phys. Rev. Lett., 77,2702 (1996).
10. T. J. Orzechowski, private communication
11. N. D. Delamater, et al., Phys. Plasmas 3,2022 (1996).
12. H. Rose, Phys. Plasmas 3,1709 (1996).
13. D. Hinkel, E. A. Williams, and C. H. Still, Phys. Rev. Lett. 77, 1298
(1996).
14 N. D. Delamater, to be published.
15 H. N. Komblum, R. L. Kauffman
2179 (1986).
and J. A. Smith, Rev. Sci. Instrurn. 57,
16 R. K. Kirkwood et al., Rev. Sci. Instrurn. 68,636 (1997)
17. F. Ze et al., Rev. Sci. Intsrurn. 63,5124 (1992).
18. R. Sigel et al., Phys. Rev. A 45,3987 (1992); also, J. Porter, private
communication (1994).
19. F. Ze, private communication.
20. D. B. Ress, et al., Bull. Am. Phys. Sot. 38,1885 (1993).
21. L. V. Powers, et al., Defense Research Review 6-10, (1994).
22. G. Zimmerman and W. L. Kruer, Comments plasma phys. Controlled
Fusion 2,51 (1975).
23. L. V. Powers, et al., submitted to Phys. Plasmas.
24. B. J. MacGowan, et al., Phys. Plasmas 3,2029 (1996).
17
25. P. Wegner, Report No. UCRL-ID-11048O, Vol. 2, 1992.
26. S. Skupsky, et al., J. Appl. Phys. 66,3456 (1989)
27. S. N. Dixit et al., Applied Optics 32,2543 (1993).
28. S. N. D&it et al., Optics Lett. 21,1715, (1996).
18
-.
... $
Figure captions.
Figure 1. Time dependence of laser power is shown as a function of time.
Most data are taken with peak powers of 17-20 TW and pulses having
contrasts of 3:1 to 2:1.
Figure 2. Geometry of the diagnostic view of the x-ray spot. As the gold
plasma moves away from the wall, the position of the peak emission changes.
Figure 3. X-ray images, superposed on the target photographs, of laser-plasma
spots inside the methane-filled hohlraums, from 22° (top, 700 eV channel)
and 0° (bottom, >2
of the laser pulse.
keV channel). The images are 1.3 and 0.5 ns after the start
Figure 4. Axial emission profile at 700 eV as viewed from the 22o view, fort=
0.9 ns (B) and 1.3 ns (A) for a typical Nova beam. The vacuum hohlraum is
shown by a solid line and the methane-filled by a dashed line. The emission
decreases at 1500 pm from the midplane due to the laser entrance hole.
and without an RPP, viewedFigure 5. Spot position vs. time for a beam with
from OO.The calculated positions are the lines and the SXRFC data are the
markers. The data without an RPP are shown as open circles (methane-filled
hohlraums) and open squares (vacuum hohlraums), and the data with an
RPP are filled circles (methane) and squares (vacuum). The bold markers are
the data averaged over 150 ps intervals.
19
-.,
,.
Figure 6. The fraction of beam energy above a given intensity versus
intensity. The intensity distribution is shown for a normal Nova beam, a
Nova beam with a random phase plate (RPP), and a Nova beam with a
kinoform phase plate (KPP).
Figure 7. Axial emission profile at 700 eV as viewed from the 22° view, for t=
0.9 ns (B) and 1.3 ns (A) for an RPP beam. The vacuum hohlraum is shown by
a solid line and the methane-filled by a dashed line.
Fig. 8. Measured scattering levels from a single Nova beam. Time integrated
SBS and SRS scattering fractions are shown for a Nova beam without beam
conditioning and a Nova beam with a KPP and RPP.
Fig. 9. X-ray images with energy >2 keV for five Nova beams. The image on
the left is of standard Nova beams without beam conditioning at 2 mm past
best focus. The image on the right is with all beams having KPP’s. The images
are taken at approximately the position of the hohlraum wall.
Fig. 10. X-ray drive from vacuum and CH4filled hohlraums. Data are shown
for irradiation without beam smoothing, with KIT’s and with KIT’s and 2.2 ~
SSD.
Fig. 11. Time history of the incident laser pulse and SBS and SRS scattering.
The Absorbed laser power is derived from subtracting the SBS and SRS levels
from the incident laser pulse.
20
16
o
Laser Power
o 1 2time, ns
Figure 1
..
...
Hohlraum midplane
4!’~’1”v v 50°
~ ,’;, J,’ I ‘\ Incidentbeam
22” 0° 22”
Figure 2
.. ,
..
Figure 3
I *-*●* ● I
●
Vacuum
\●“b
4
Vacuum
‘x
4●.--+
---u 500 1000 1500
Position (from midplane, pm)
.:,
<
I
0
100
0
100
0
I I I +~...
Methane i —
V.u U.a I .U 1.3 Z.uTime (ns)
●●
☞
0.8 - ● “%$
% “%** “%
/
0.6- /RPP “;*,
‘, ;KPP s.*,
● “0.4 “
,t**,t8“,t8“●\
0.2 -S*●8●*s%*“%%
‘&0.0 ■ s nan■ mm
10’3 10’4 10’5 10’6Intensity, W/cm*
Figure6
1.0
0.5
0.5
0.0
Vacuum w+.r \“’.
-/’CH4 ●
●
\\
“8s* (B)
Vacuum8# CH. ‘
\
##
. --- 7“
(A)
8898
9
B ,-
**
888s888
I I f----
0 500 1000 1500
Position (from midplane, pm)
Figure7
0
h
+ SRS Vacuum--- SRS Methane+ S8S Vacuum+ SBS Methane
ii- \ -i
No KPP KPP KPP RPPwith siot no siot no siot
Figure8
,’,
,.’
Kinoform phase plates (KPPs) producea much smoother beam on Nova IIID
BeforeUnsoothed (2-mm defocus)
After
With KPP (1-mm defocus)
An
alignmentlarkar
2 keV x-ray images
20.05-0197-0095D22RLKhb
11/10197
L
220 ;
200 - Absoluteerror
[
18011...I1,..I,...I,.EJm j
no KPP KPP KPP +2.2 ~ SSD
Figure10
J
k
1 00%●
w??
-b
80%’0
20
10
0
■ Methane-filled● Vacuum
I
no KPP KPP KPP +2.2 A SSD
KPP + 2.2 ~ SSD
Methane-filled
Incident Power
o 1 2 3time (ns)
Figure11
–—
Technical Inform
ation Departm
ent • Lawrence Liverm
ore National Laboratory
University of C
alifornia • Livermore, C
alifornia 94551