Embed Size (px)
Citation preview
Physical and Electrochemical Parameter Measurements on Commercial Lithium-Ion Cells
KEVIN WESTHOFF, TREVOR VERNON, EVERETT JACKSON, DR. AMY PRIETO, DR. TODD BANDHAUER
DEPARTMENT OF MECHANICAL ENGINEERING
COLORADO STATE UNIVERSITY, FORT COLLINS, CO
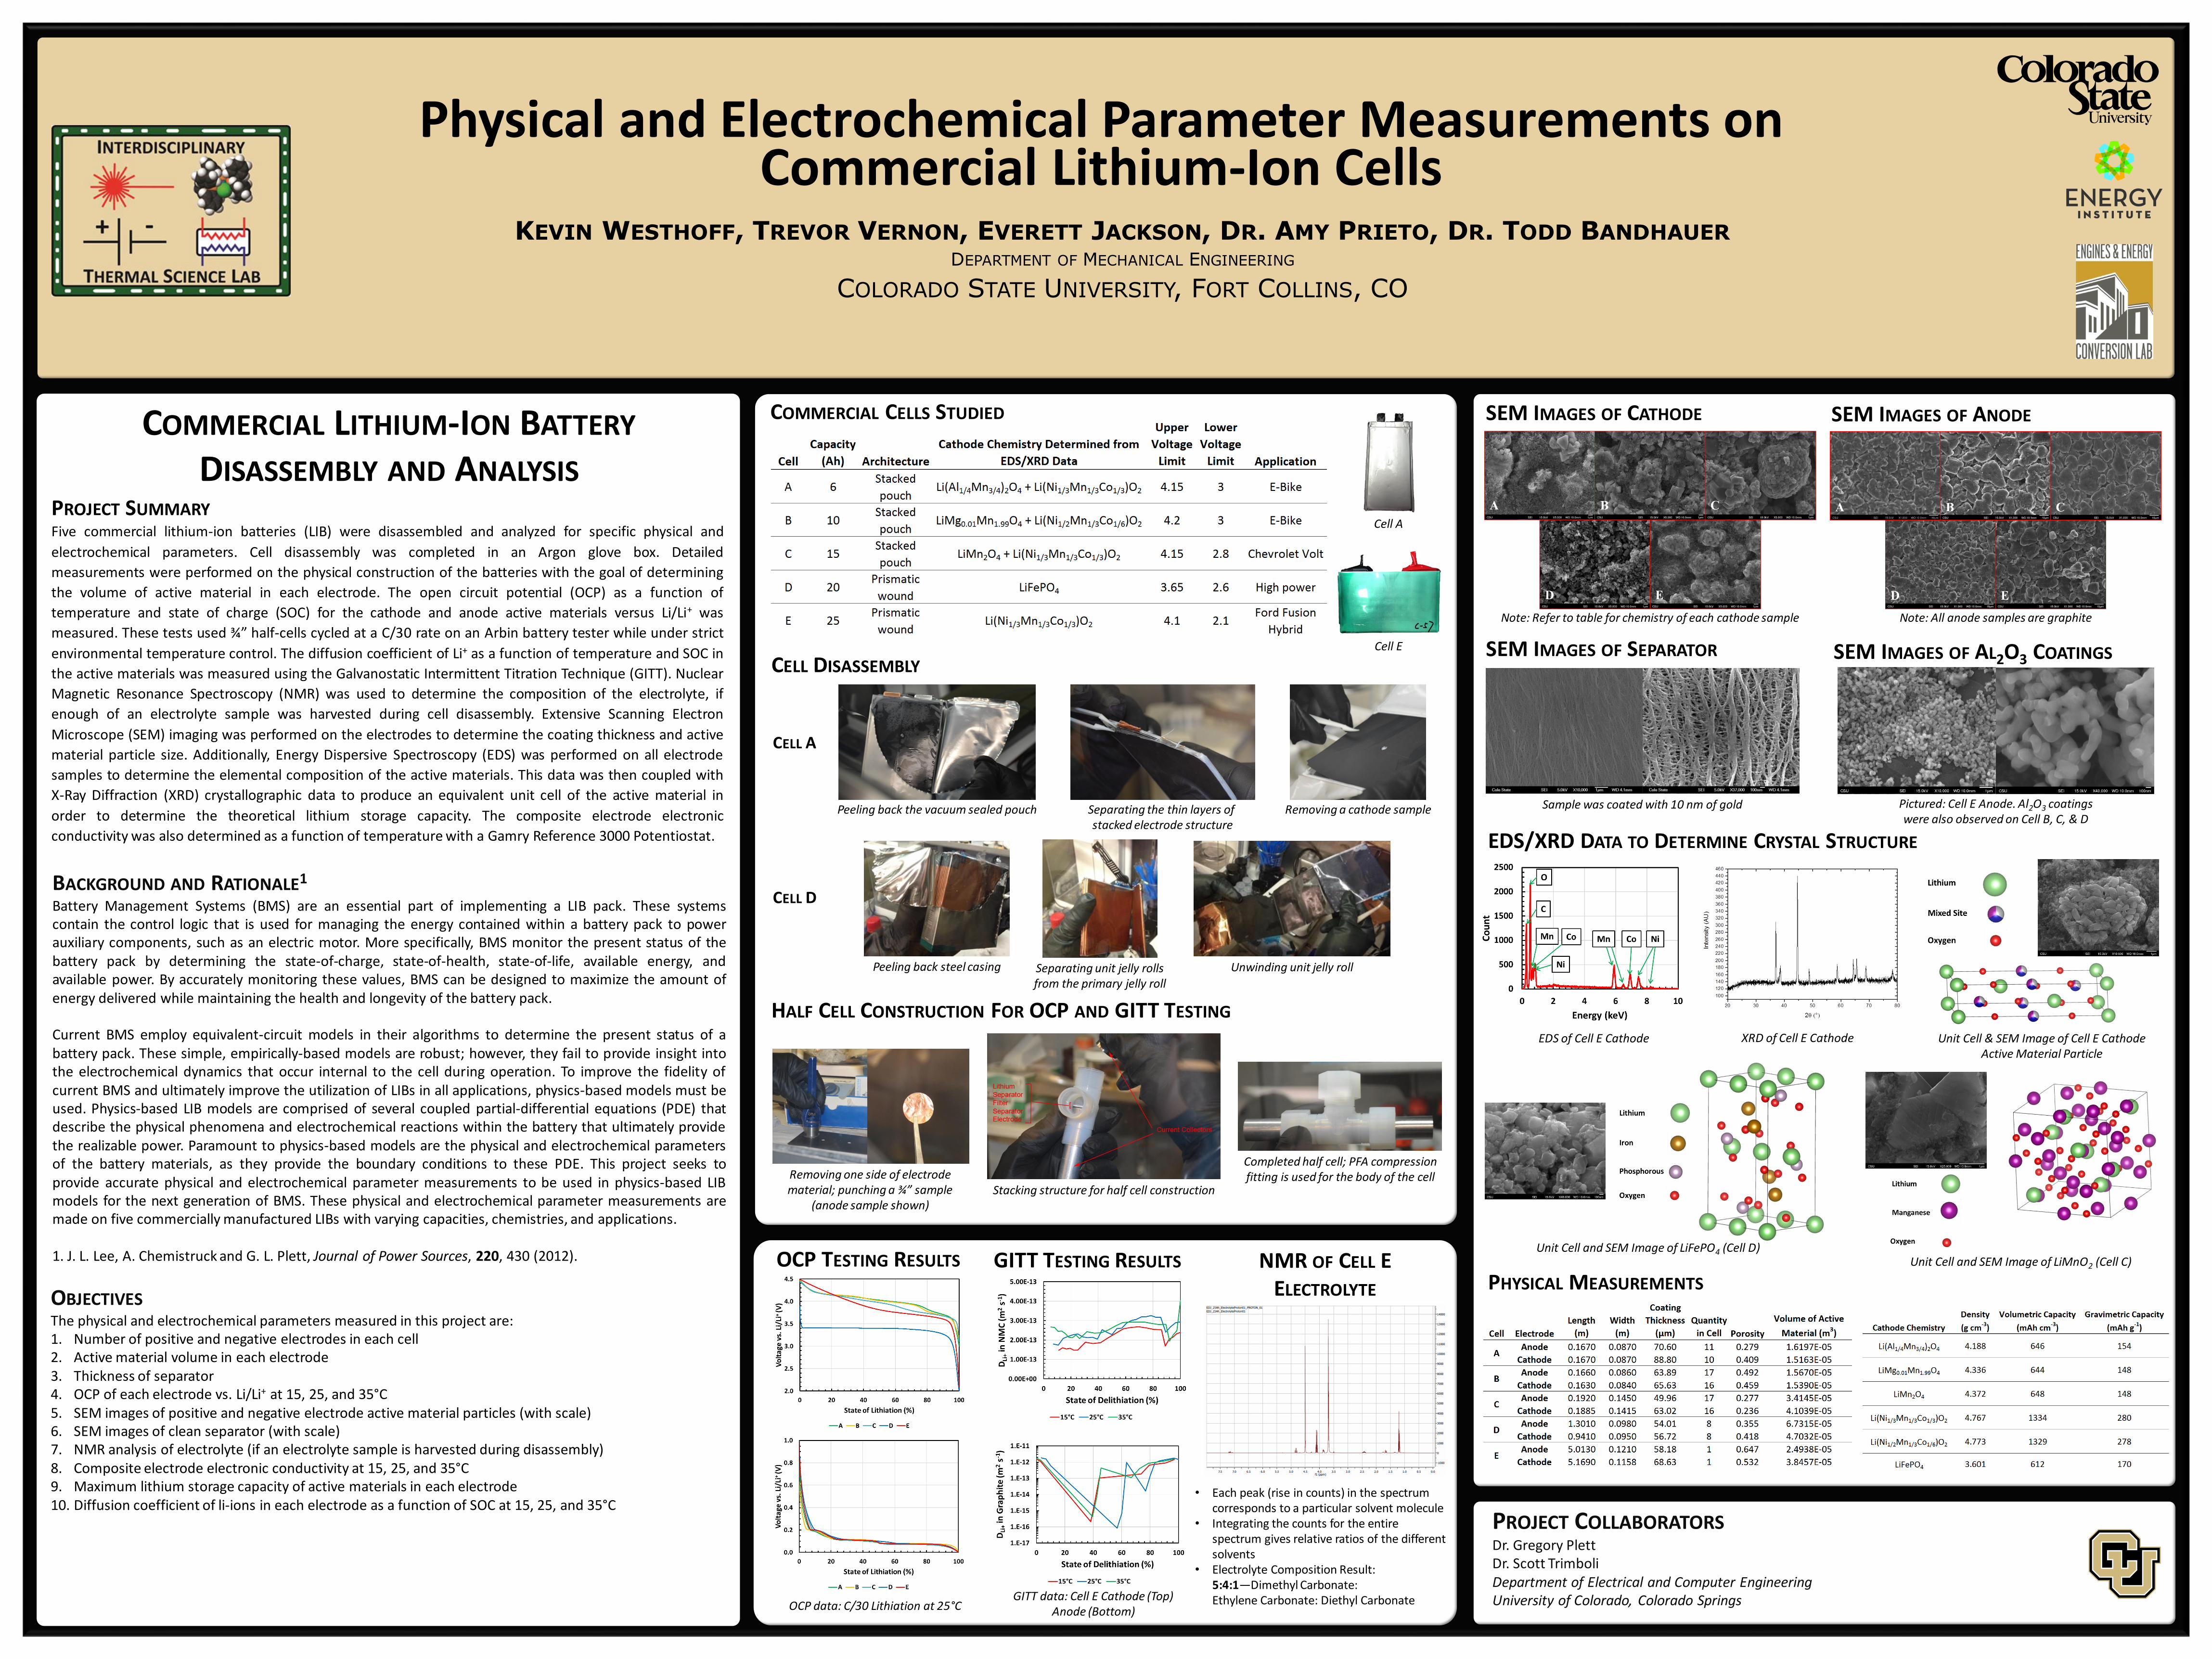
PROJECT SUMMARY Five commercial lithium-ion batteries (LIB) were disassembled and analyzed for specific physical and
electrochemical parameters. Cell disassembly was completed in an Argon glove box. Detailed
measurements were performed on the physical construction of the batteries with the goal of determining
the volume of active material in each electrode. The open circuit potential (OCP) as a function of
temperature and state of charge (SOC) for the cathode and anode active materials versus Li/Li+ was
measured. These tests used ¾” half-cells cycled at a C/30 rate on an Arbin battery tester while under strict
environmental temperature control. The diffusion coefficient of Li+ as a function of temperature and SOC in
the active materials was measured using the Galvanostatic Intermittent Titration Technique (GITT). Nuclear
Magnetic Resonance Spectroscopy (NMR) was used to determine the composition of the electrolyte, if
enough of an electrolyte sample was harvested during cell disassembly. Extensive Scanning Electron
Microscope (SEM) imaging was performed on the electrodes to determine the coating thickness and active
material particle size. Additionally, Energy Dispersive Spectroscopy (EDS) was performed on all electrode
samples to determine the elemental composition of the active materials. This data was then coupled with
X-Ray Diffraction (XRD) crystallographic data to produce an equivalent unit cell of the active material in
order to determine the theoretical lithium storage capacity. The composite electrode electronic
conductivity was also determined as a function of temperature with a Gamry Reference 3000 Potentiostat.
BACKGROUND AND RATIONALE1
Battery Management Systems (BMS) are an essential part of implementing a LIB pack. These systems contain the control logic that is used for managing the energy contained within a battery pack to power auxiliary components, such as an electric motor. More specifically, BMS monitor the present status of the battery pack by determining the state-of-charge, state-of-health, state-of-life, available energy, and available power. By accurately monitoring these values, BMS can be designed to maximize the amount of energy delivered while maintaining the health and longevity of the battery pack. Current BMS employ equivalent-circuit models in their algorithms to determine the present status of a battery pack. These simple, empirically-based models are robust; however, they fail to provide insight into the electrochemical dynamics that occur internal to the cell during operation. To improve the fidelity of current BMS and ultimately improve the utilization of LIBs in all applications, physics-based models must be used. Physics-based LIB models are comprised of several coupled partial-differential equations (PDE) that describe the physical phenomena and electrochemical reactions within the battery that ultimately provide the realizable power. Paramount to physics-based models are the physical and electrochemical parameters of the battery materials, as they provide the boundary conditions to these PDE. This project seeks to provide accurate physical and electrochemical parameter measurements to be used in physics-based LIB models for the next generation of BMS. These physical and electrochemical parameter measurements are made on five commercially manufactured LIBs with varying capacities, chemistries, and applications. 1. J. L. Lee, A. Chemistruck and G. L. Plett, Journal of Power Sources, 220, 430 (2012). OBJECTIVES The physical and electrochemical parameters measured in this project are: 1. Number of positive and negative electrodes in each cell 2. Active material volume in each electrode 3. Thickness of separator 4. OCP of each electrode vs. Li/Li+ at 15, 25, and 35°C 5. SEM images of positive and negative electrode active material particles (with scale) 6. SEM images of clean separator (with scale) 7. NMR analysis of electrolyte (if an electrolyte sample is harvested during disassembly) 8. Composite electrode electronic conductivity at 15, 25, and 35°C 9. Maximum lithium storage capacity of active materials in each electrode 10. Diffusion coefficient of li-ions in each electrode as a function of SOC at 15, 25, and 35°C
COMMERCIAL CELLS STUDIED COMMERCIAL LITHIUM-ION BATTERY DISASSEMBLY AND ANALYSIS
PROJECT COLLABORATORS Dr. Gregory Plett Dr. Scott Trimboli Department of Electrical and Computer Engineering University of Colorado, Colorado Springs
CELL DISASSEMBLY
CELL A
CELL D
Peeling back the vacuum sealed pouch Separating the thin layers of stacked electrode structure
Removing a cathode sample
Peeling back steel casing Separating unit jelly rolls from the primary jelly roll
Unwinding unit jelly roll
HALF CELL CONSTRUCTION FOR OCP AND GITT TESTING
Removing one side of electrode material; punching a ¾” sample
(anode sample shown) Stacking structure for half cell construction
Completed half cell; PFA compression fitting is used for the body of the cell
SEM IMAGES OF CATHODE SEM IMAGES OF ANODE
Note: All anode samples are graphite Note: Refer to table for chemistry of each cathode sample
PHYSICAL MEASUREMENTS
SEM IMAGES OF SEPARATOR Cell E
Cell A
OCP TESTING RESULTS
OCP data: C/30 Lithiation at 25°C
GITT TESTING RESULTS
GITT data: Cell E Cathode (Top) Anode (Bottom)
EDS of Cell E Cathode XRD of Cell E Cathode Unit Cell & SEM Image of Cell E Cathode Active Material Particle
EDS/XRD DATA TO DETERMINE CRYSTAL STRUCTURE
NMR OF CELL E ELECTROLYTE
• Each peak (rise in counts) in the spectrum corresponds to a particular solvent molecule
• Integrating the counts for the entire spectrum gives relative ratios of the different solvents
• Electrolyte Composition Result: 5:4:1—Dimethyl Carbonate: Ethylene Carbonate: Diethyl Carbonate
SEM IMAGES OF AL2O3 COATINGS
Pictured: Cell E Anode. Al2O3 coatings were also observed on Cell B, C, & D
Sample was coated with 10 nm of gold
Unit Cell and SEM Image of LiFePO4 (Cell D) Unit Cell and SEM Image of LiMnO2 (Cell C)