Embed Size (px)
Citation preview
UCB Inspired by patients.Driven by science.
2018 Half-Year Report
Brussels, 26 July 2018
2018 HY reportDisclaimer and safe harbor 2
Forward-looking statementsThis presentation contains forward-looking statements, including, without limitation, statements containing the words “believes”, “anticipates”, “expects”, “intends”,“plans”, “seeks”, “estimates”, “may”, “will”, and “continue” and similar expressions. These forward-looking statements are based on current plans, estimates andbeliefs of management. By their nature, such forward-looking statements are not guarantees of future performance and are subject to known and unknown risks,uncertainties, and assumptions which might cause the actual results, financial condition, performance or achievements of UCB, or industry results, to be materiallydifferent from any future results, performance, or achievements expressed or implied by such forward-looking statements contained in this presentation.
Important factors that could result in such differences include but are not limited to: changes in general economic, business and competitive conditions, the inability toobtain necessary regulatory approvals or to obtain them on acceptable terms, costs associated with research and development, changes in the prospects forproducts in the pipeline or under development by UCB, effects of future judicial decisions or governmental investigations, product liability claims, challenges to patentprotection for products or product candidates, changes in laws or regulations, exchange rate fluctuations, changes or uncertainties in tax laws or the administration ofsuch laws and hiring and retention of its employees. There is no guarantee that new product candidates in the pipeline will progress to product approval or that newindications for existing products will be developed and approved. Products or potential products which are the subject of partnerships, joint ventures or licensingcollaborations may be subject to differences between the partners. Also, UCB or others could discover safety, side effects or manufacturing problems with itsproducts after they are marketed. Moreover, sales may be impacted by international and domestic trends toward managed care and health care cost containmentand the reimbursement policies imposed by third-party payers as well as legislation affecting biopharmaceutical pricing and reimbursement.
Given these uncertainties, the public is cautioned not to place any undue reliance on such forward-looking statements. These forward-looking statements are madeonly as of the date of this presentation. UCB expressly disclaims any obligation to update any such forward-looking statements in this presentation to reflect anychange in its expectations with regard thereto or any change in events, conditions, for circumstances on which any such statement is based, unless such statement isrequired pursuant to applicable laws and regulations.
In the event of any differences between this Presentation and the Annual or Half Year Report, the information included in the Report shall prevail.

UCB continues its growth path
26 July 2018Jean-Christophe Tellier, CEO

2018 HY report 4UCB HY 2018 information flow
ן UCB continues its growth path• Jean-Christophe Tellier, CEO
ן Increasing value of UCB's pipeline• Dhavalkumar Patel, CSO
ן Foundation for our financial 2018 outlook and to accelerate investments• Detlef Thielgen, CFO
ן Conclusion• Jean-Christophe Tellier, CEO
ן Q&A
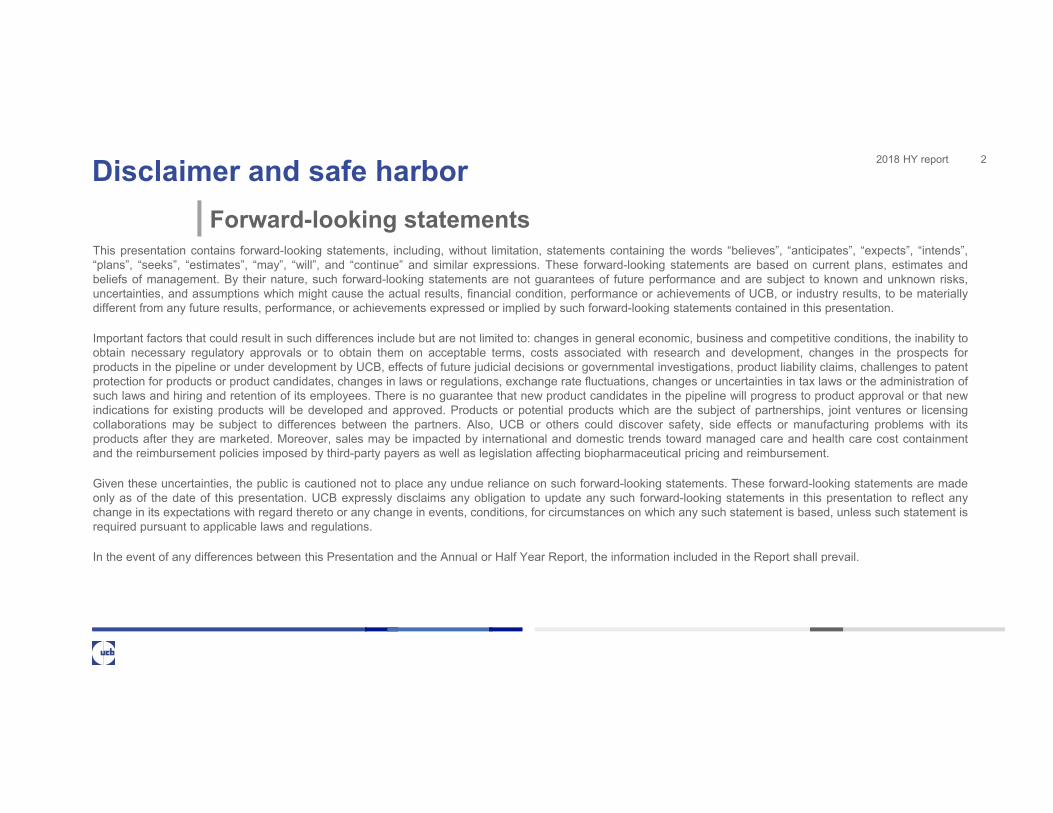
2018 HY reportDriving value for patients 5
Progress towards higher patient value
From Patient to ScienceCimzia® women of child bearing age & non-radiographic axial spondyloarthritis
UCB0107 (anti-Tau antibody) first in human
From Science to SolutionRozanolixizumab discovery driven by patient experiences with
outpatient treatment, now in Phase 2a clinical development
From Solution to PatientFaster access for pediatric epilepsy patients thanks to innovative extrapolation for Briviact®
Acquisition of midazolam nasal spray in the treatment of acute repetitive seizures (ARS) in patients with epilepsyPartnership with Sciences 37 to bring clinical studies directly into a patient’s home
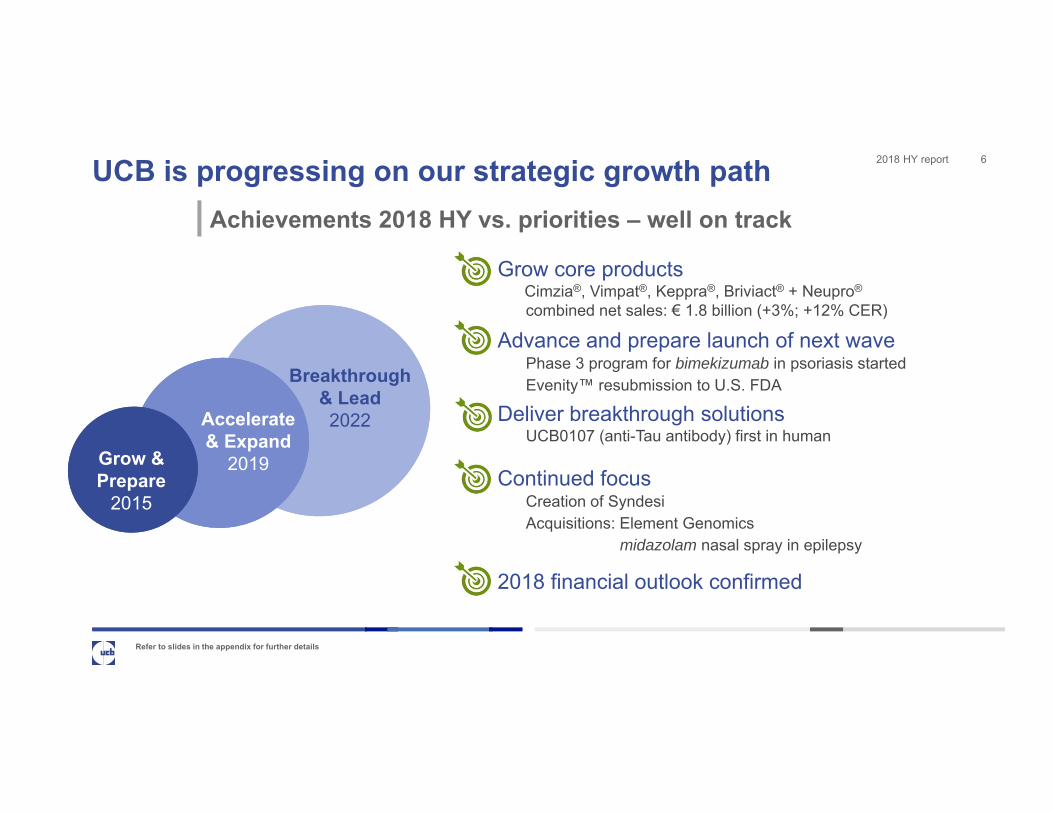
2018 HY reportUCB is progressing on our strategic growth path 6
Refer to slides in the appendix for further details
Grow core productsCimzia®, Vimpat®, Keppra®, Briviact® + Neupro®
combined net sales: € 1.8 billion (+3%; +12% CER)
Advance and prepare launch of next wavePhase 3 program for bimekizumab in psoriasis startedEvenity™ resubmission to U.S. FDA
Deliver breakthrough solutionsUCB0107 (anti-Tau antibody) first in human
Continued focusCreation of SyndesiAcquisitions: Element Genomics
midazolam nasal spray in epilepsy
Grow & Prepare
2015
Accelerate & Expand
2019
Breakthrough & Lead2022
2018 financial outlook confirmed
Achievements 2018 HY vs. priorities – well on track
Increasing value of UCB's pipeline
Dhavalkumar Patel, MD, PhDCSO
7

2018 HY reportIncreasing value of UCB's early and late-stage pipeline 8
Driven by strong UCB science and technology platforms
dapirolizumabpegol
systemic lupus erythematosus
padsevonilepilepsy
rozanolixizumabmyasthenia gravis
immune thrombocytopenia
UCB7858
UCB6673
UCB0599
Phase 2b / Phase 3
Phase 1
UCB0159
Phase 2a
UCB0107
Seletalisib in Sjogren's Syndrome and APDS (phase 2a and phase 1b) deprioritized UCB4144/VR942 available for license
radiprodilinfantile spasm
Submission
romosozumabosteoporosis
midazolamnasal spray - acute repetitive seizures
neurology
immunologybone
bimekizumabpsoriasis, psoriatic arthritis
ankylosing spondylitis

2018 HY report
Now first in human: UCB0107, an anti-Tau antibody forProgressive Supranuclear Palsy & Alzheimer’s disease
9
Source: UCB internal data AD: Alzheimer’s diseasePSP: Progressive Supranuclear Palsy
•Tau misfolding and aggregation leads to neuronal death and disease spread
•PSP is a rare, rapidly progressing tauopathy with debilitating cognitive & motor symptoms
•Alzheimer’s Disease is also a tauopathy, with high prevalence and economic impact
UCB0107 blocks tau uptake and aggregation
UCB0107 blocks tau uptake and aggregation
Key facts Key insights
Tau seeds spread from dying cells to
infect other neurons
UCB0107 was generated to block spreading of tau
seeds from patient materials
AD
PSP
Tau seed
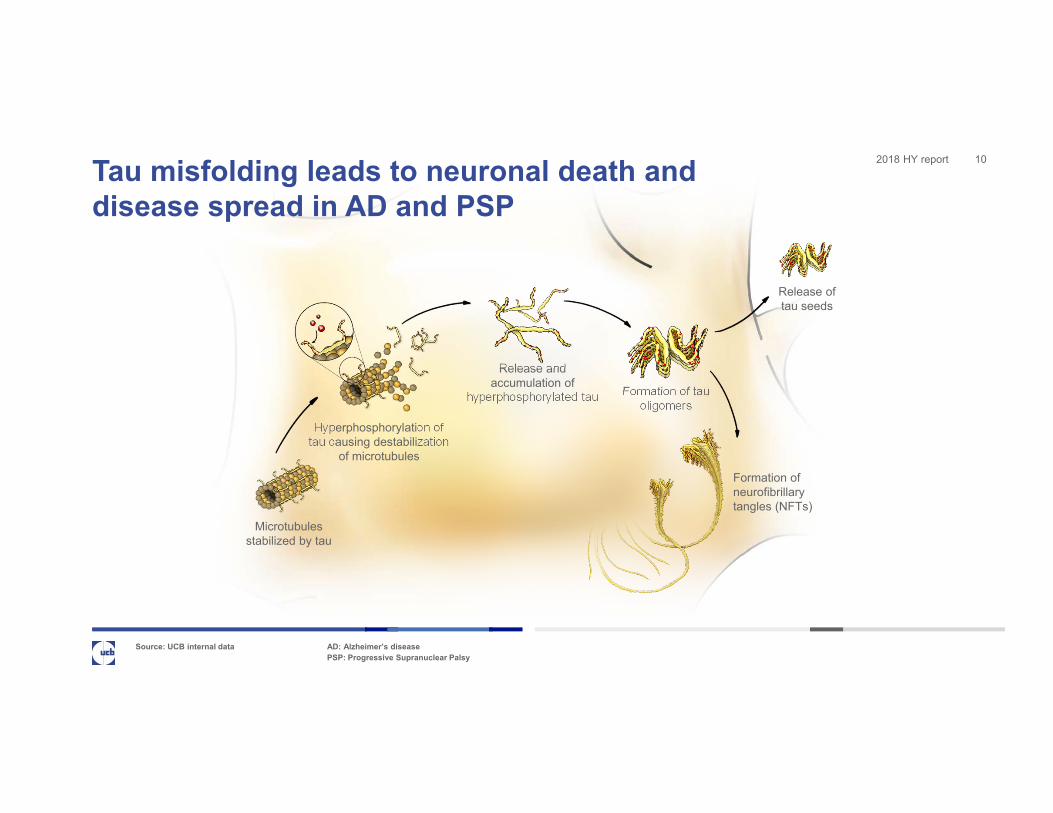
2018 HY reportTau misfolding leads to neuronal death and disease spread in AD and PSP
10
Microtubules stabilized by tau
Hyperphosphorylation of tau causing destabilization
of microtubules
Release and accumulation of
hyperphosphorylated tau
Release of tau seeds
Formation of tau oligomers
Formation of neurofibrillary tangles (NFTs)
Source: UCB internal data AD: Alzheimer’s diseasePSP: Progressive Supranuclear Palsy

2018 HY reportTargeting tau spreading in early disease can delay or stop progression in AD and PSP
11
2018 HY report
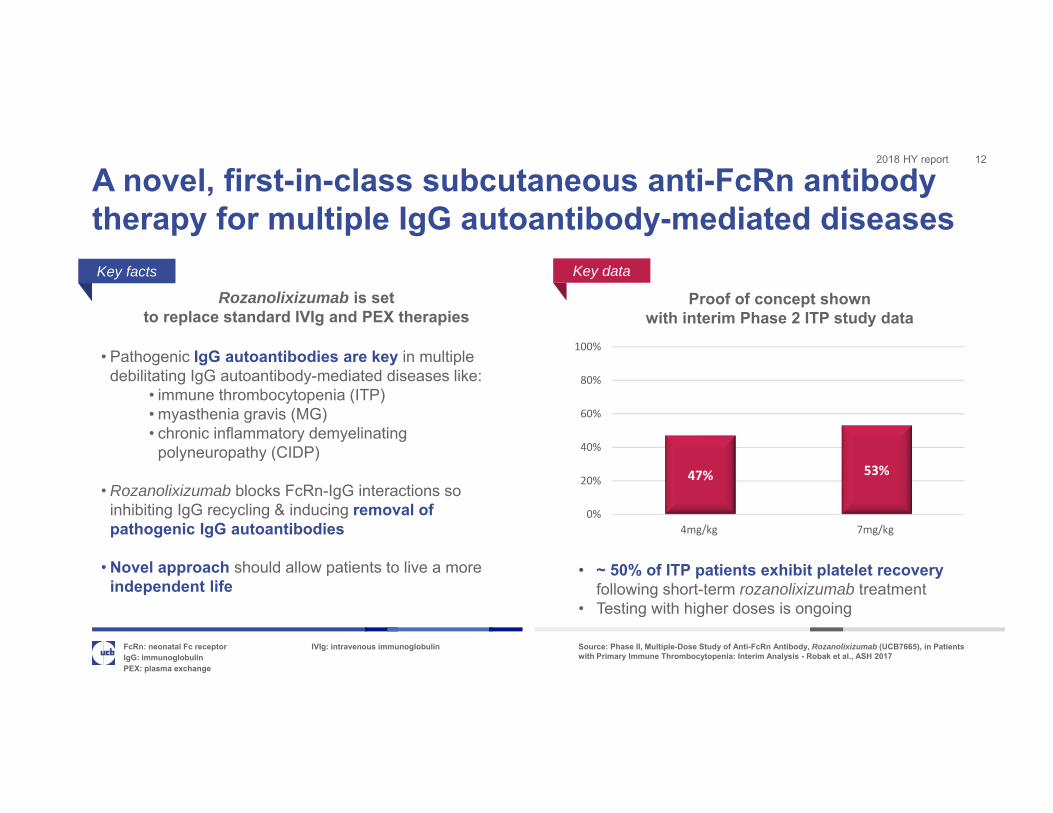
A novel, first-in-class subcutaneous anti-FcRn antibody therapy for multiple IgG autoantibody-mediated diseases
12
FcRn: neonatal Fc receptor IVIg: intravenous immunoglobulinIgG: immunoglobulin PEX: plasma exchange
Key facts
• Pathogenic IgG autoantibodies are key in multiple debilitating IgG autoantibody-mediated diseases like:
• immune thrombocytopenia (ITP)• myasthenia gravis (MG) • chronic inflammatory demyelinating
polyneuropathy (CIDP)
• Rozanolixizumab blocks FcRn-IgG interactions so inhibiting IgG recycling & inducing removal of pathogenic IgG autoantibodies
• Novel approach should allow patients to live a more independent life
Rozanolixizumab is set to replace standard IVIg and PEX therapies
Rozanolixizumab is set to replace standard IVIg and PEX therapies
Proof of concept shown with interim Phase 2 ITP study data
Proof of concept shown with interim Phase 2 ITP study data
47% 53%
0%
20%
40%
60%
80%
100%
4mg/kg 7mg/kg
• ~ 50% of ITP patients exhibit platelet recovery following short-term rozanolixizumab treatment
• Testing with higher doses is ongoing
Key data
Source: Phase II, Multiple-Dose Study of Anti-FcRn Antibody, Rozanolixizumab (UCB7665), in Patients with Primary Immune Thrombocytopenia: Interim Analysis - Robak et al., ASH 2017
2018 HY report
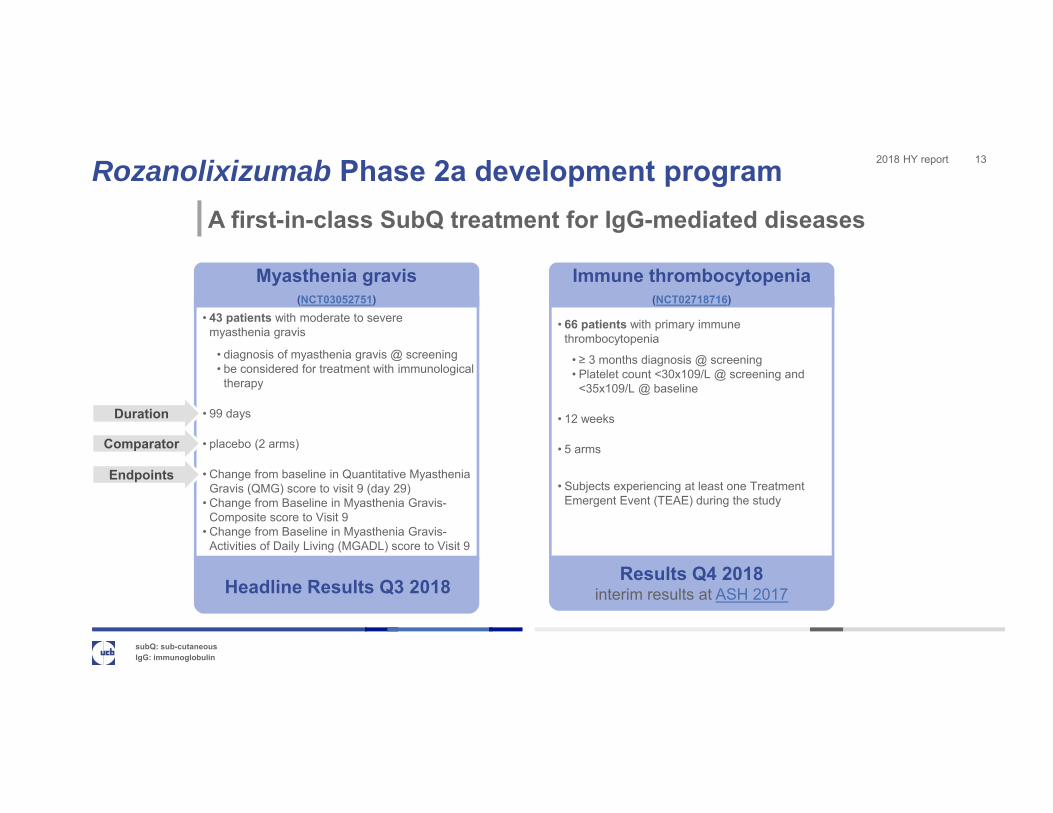
• 43 patients with moderate to severe myasthenia gravis
• diagnosis of myasthenia gravis @ screening• be considered for treatment with immunological
therapy
• 99 days
• placebo (2 arms)
• Change from baseline in Quantitative Myasthenia Gravis (QMG) score to visit 9 (day 29)
• Change from Baseline in Myasthenia Gravis-Composite score to Visit 9
• Change from Baseline in Myasthenia Gravis-Activities of Daily Living (MGADL) score to Visit 9
Rozanolixizumab Phase 2a development programA first-in-class SubQ treatment for IgG-mediated diseases
subQ: sub-cutaneousIgG: immunoglobulin
Headline Results Q3 2018
• 66 patients with primary immune thrombocytopenia
• ≥ 3 months diagnosis @ screening• Platelet count <30x109/L @ screening and
<35x109/L @ baseline
• 12 weeks
• 5 arms
• Subjects experiencing at least one Treatment Emergent Event (TEAE) during the study
Comparator
Endpoints
Immune thrombocytopenia(NCT02718716)
Myasthenia gravis (NCT03052751)
Results Q4 2018interim results at ASH 2017
Duration
13
2018 HY report
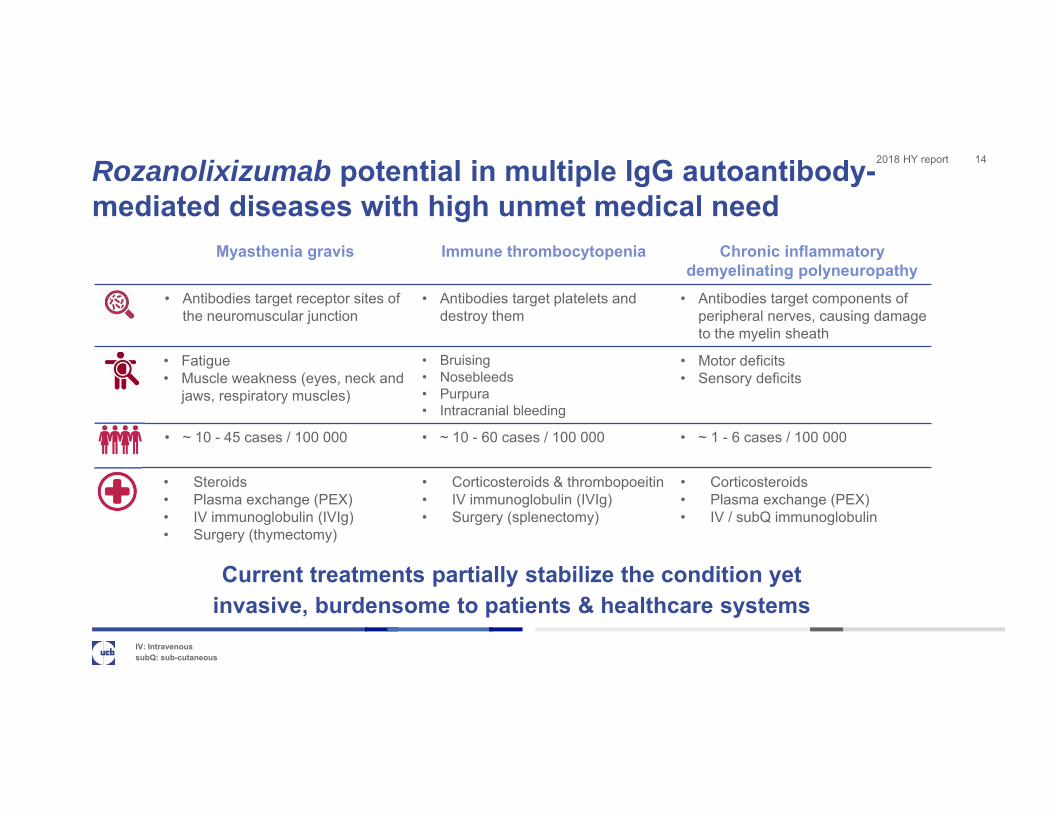
Myasthenia gravis Immune thrombocytopenia Chronic inflammatory demyelinating polyneuropathy
• Antibodies target receptor sites of the neuromuscular junction
• Antibodies target platelets and destroy them
• Antibodies target components of peripheral nerves, causing damage to the myelin sheath
• Fatigue• Muscle weakness (eyes, neck and
jaws, respiratory muscles)
• Bruising• Nosebleeds• Purpura• Intracranial bleeding
• Motor deficits• Sensory deficits
• ~ 10 - 45 cases / 100 000 • ~ 10 - 60 cases / 100 000 • ~ 1 - 6 cases / 100 000
• Steroids• Plasma exchange (PEX)• IV immunoglobulin (IVIg)• Surgery (thymectomy)
• Corticosteroids & thrombopoeitin• IV immunoglobulin (IVIg)• Surgery (splenectomy)
• Corticosteroids• Plasma exchange (PEX)• IV / subQ immunoglobulin
Rozanolixizumab potential in multiple IgG autoantibody-mediated diseases with high unmet medical need
14
IV: IntravenoussubQ: sub-cutaneous
Current treatments partially stabilize the condition yet invasive, burdensome to patients & healthcare systems
15
Foundation for our financial 2018 outlook and to accelerate investments
Detlef Thielgen, CFO
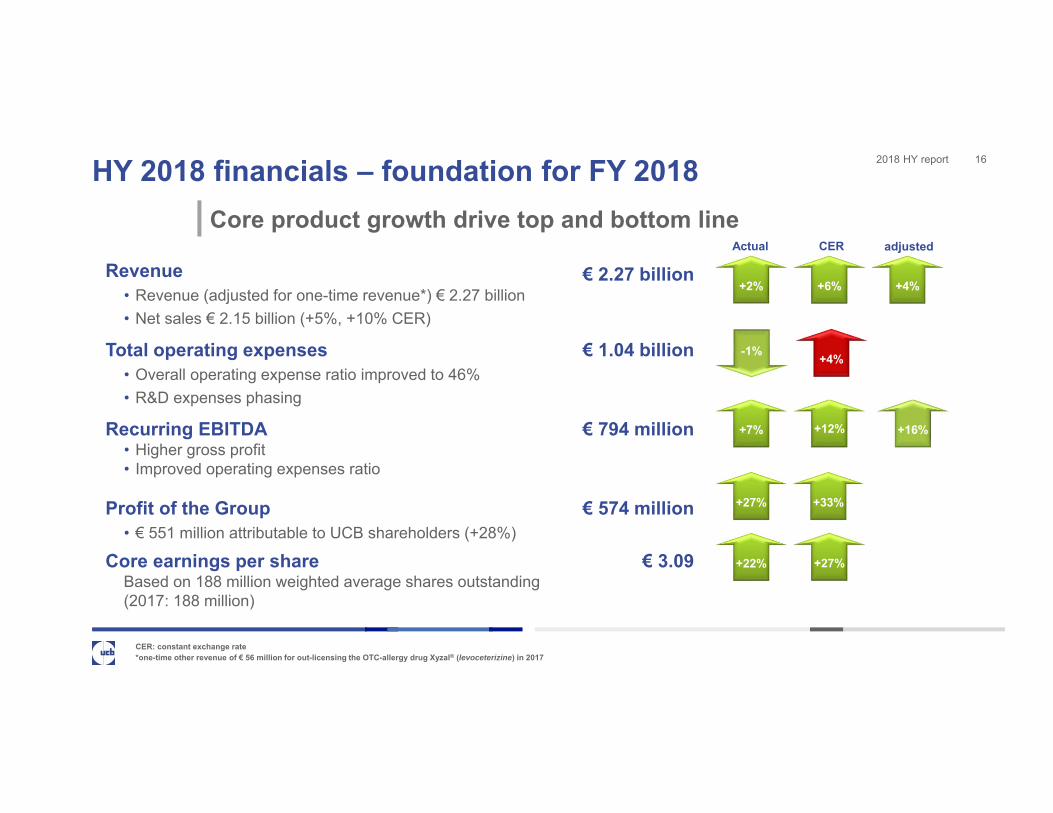
2018 HY reportHY 2018 financials – foundation for FY 2018 16
Core product growth drive top and bottom line
CER: constant exchange rate*one-time other revenue of € 56 million for out-licensing the OTC-allergy drug Xyzal® (levoceterizine) in 2017
CER
+6%
+12%+7%
Actual
Revenue• Revenue (adjusted for one-time revenue*) € 2.27 billion• Net sales € 2.15 billion (+5%, +10% CER)
€ 2.27 billion
Total operating expenses • Overall operating expense ratio improved to 46%• R&D expenses phasing
€ 1.04 billion
Recurring EBITDA • Higher gross profit • Improved operating expenses ratio
€ 794 million
Profit of the Group• € 551 million attributable to UCB shareholders (+28%)
€ 574 million
Core earnings per share Based on 188 million weighted average shares outstanding (2017: 188 million)
€ 3.09
+2%
+27%
+22% +27%
-1% +4%
+4%
adjusted
+33%
+16%
2018 HY reportContinued focus 17
Complement & share
Acquisitions Spin offs
midazolamnasal spray in epilepsy
StrideBio, Inc.
Ventures

2018 HY report2018 and mid-term guidance confirmed 18
Maximize (new) growth drivers and strengthen sustainability
rEBITDA: recurring Earnings Before Interest, Taxes, Depreciation and Amortization charge* ~188 million shares weighted average outstanding
2018 financial targets Mid-term guidance
Revenue € 4.5 - 4.6 billion• Continued strong core product growth
• FX impact
rEBITDA / revenue ratio of 31% in 2021UCB investing into the pipeline complemented with inorganic growth opportunities
rEBITDA € 1.3 – 1.4 billion• R&D expense ratio of ~26% (+/-1% point)
• Launch preparation
Peak sales• 'CVN' combined > € 3.1 billion by 2020
• Briviact® > € 600 million in 2026
Core EPS* € 4.30 – 4.70• Expected underlying tax ratio
in the "low twenties"

Conclusion
Jean-Christophe Tellier, CEO
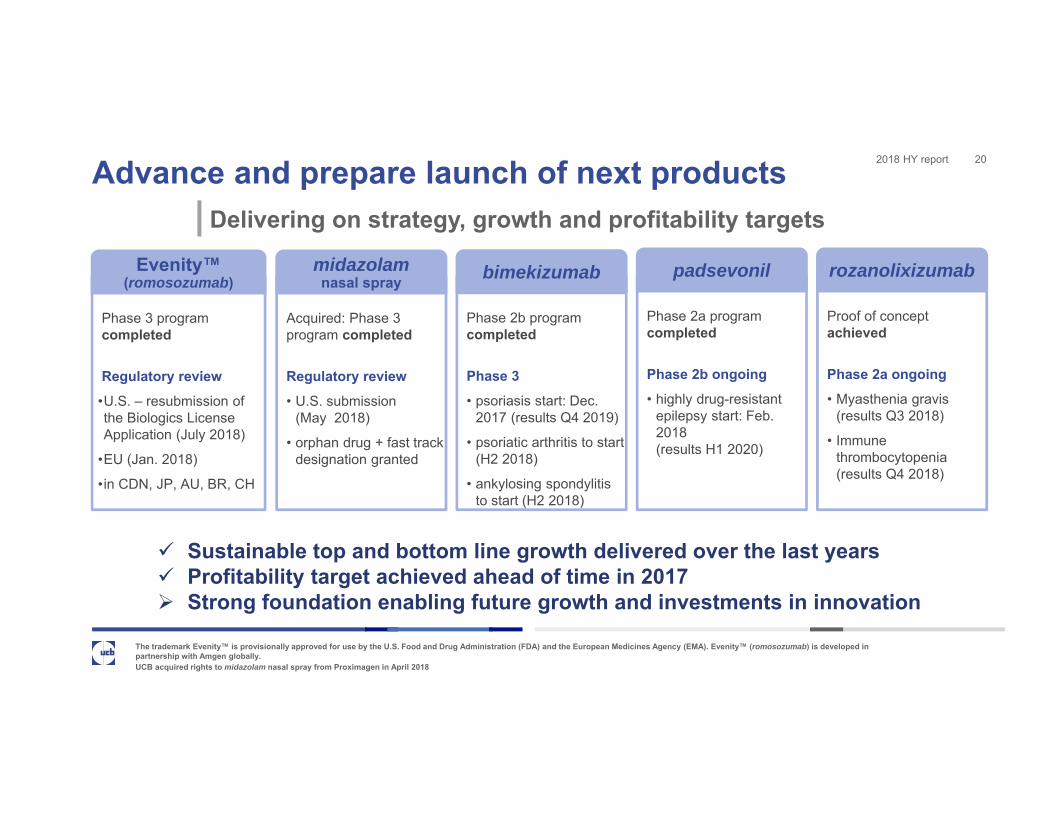
2018 HY reportAdvance and prepare launch of next products 20
Delivering on strategy, growth and profitability targets
The trademark Evenity™ is provisionally approved for use by the U.S. Food and Drug Administration (FDA) and the European Medicines Agency (EMA). Evenity™ (romosozumab) is developed in partnership with Amgen globally.UCB acquired rights to midazolam nasal spray from Proximagen in April 2018
Phase 3 program completed
Regulatory review•U.S. – resubmission of the Biologics License Application (July 2018)
•EU (Jan. 2018)
•in CDN, JP, AU, BR, CH
Evenity™(romosozumab)
Phase 2b program completed
Phase 3 • psoriasis start: Dec.
2017 (results Q4 2019)
• psoriatic arthritis to start (H2 2018)
• ankylosing spondylitis to start (H2 2018)
bimekizumab
Phase 2a program completed
Phase 2b ongoing• highly drug-resistant
epilepsy start: Feb. 2018 (results H1 2020)
padsevonil
Acquired: Phase 3 program completed
Regulatory review• U.S. submission
(May 2018)
• orphan drug + fast track designation granted
midazolamnasal spray
Proof of concept achieved
Phase 2a ongoing• Myasthenia gravis
(results Q3 2018)
• Immune thrombocytopenia (results Q4 2018)
rozanolixizumab
Sustainable top and bottom line growth delivered over the last years Profitability target achieved ahead of time in 2017 Strong foundation enabling future growth and investments in innovation

2018 HY reportUCB's patient value strategy 21
Our ambition is to be the patient preferred biotech leader,
creating patient value for specific populations through unique outcomes, the best experience and improving as
many of these lives as possible.
This will lead to sustainable growthfor UCB and its shareholders.
Value for patients
Mariana, living with epilepsy
Value for shareholders

Further factsand figures
22
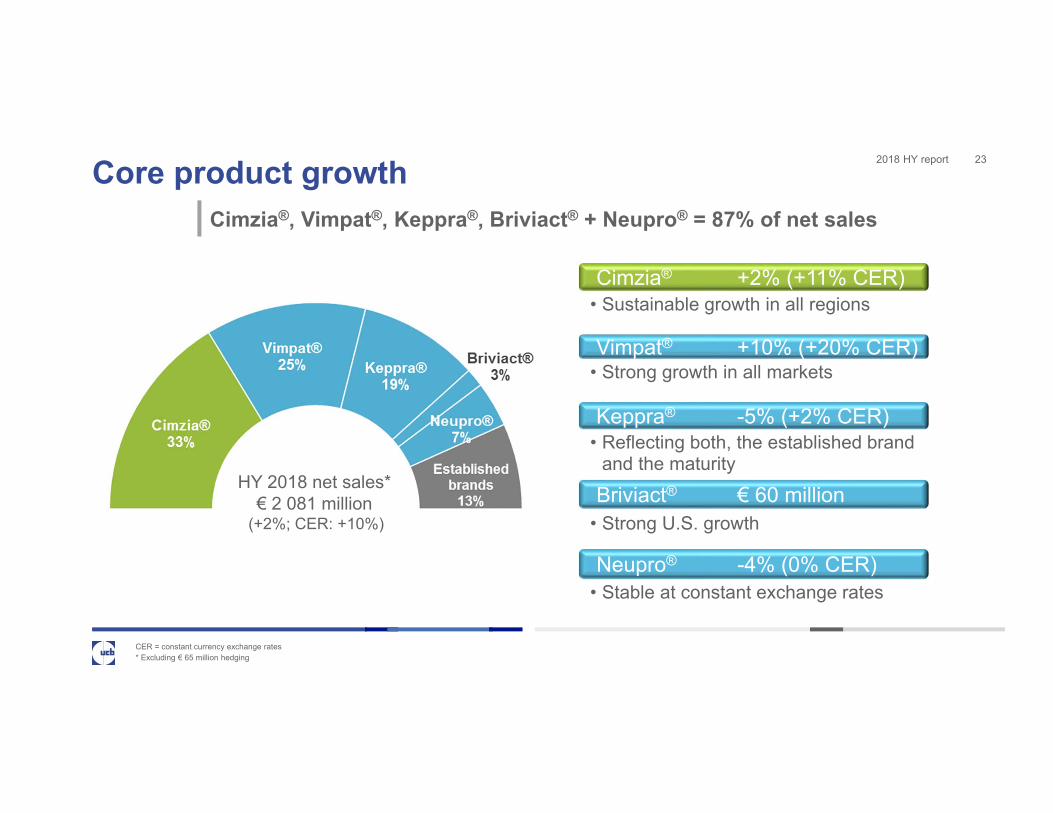
2018 HY reportCore product growth 23
Cimzia®, Vimpat®, Keppra®, Briviact® + Neupro® = 87% of net sales
CER = constant currency exchange rates* Excluding € 65 million hedging
Cimzia® +2% (+11% CER)• Sustainable growth in all regions
Vimpat® +10% (+20% CER)• Strong growth in all markets
Keppra® -5% (+2% CER)• Reflecting both, the established brand
and the maturity
Briviact® € 60 million• Strong U.S. growth
Neupro® -4% (0% CER)• Stable at constant exchange rates
HY 2018 net sales*€ 2 081 million
(+2%; CER: +10%)
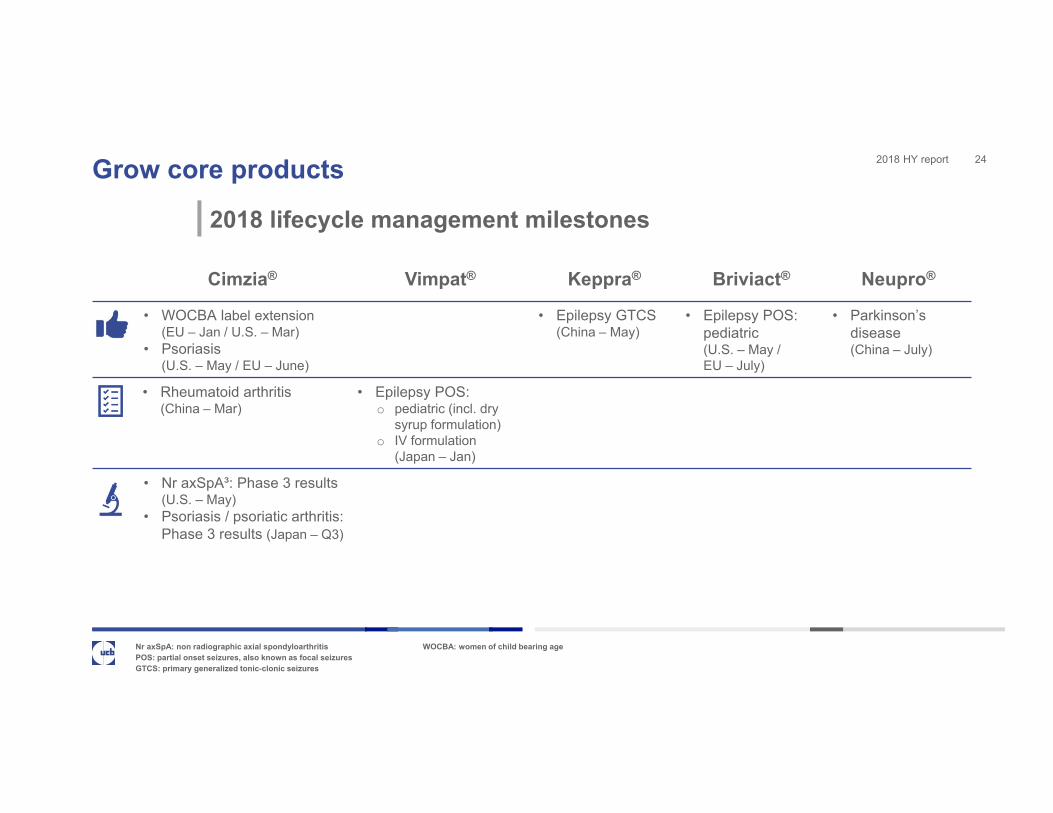
2018 HY reportGrow core products 24
2018 lifecycle management milestones
Nr axSpA: non radiographic axial spondyloarthritis WOCBA: women of child bearing agePOS: partial onset seizures, also known as focal seizuresGTCS: primary generalized tonic-clonic seizures
Cimzia® Vimpat® Keppra® Briviact® Neupro®
• WOCBA label extension (EU – Jan / U.S. – Mar)
• Psoriasis (U.S. – May / EU – June)
• Epilepsy GTCS (China – May)
• Epilepsy POS: pediatric (U.S. – May / EU – July)
• Parkinson’s disease (China – July)
• Rheumatoid arthritis (China – Mar)
• Epilepsy POS: o pediatric (incl. dry
syrup formulation) o IV formulation
(Japan – Jan)
• Nr axSpA³: Phase 3 results (U.S. – May)
• Psoriasis / psoriatic arthritis: Phase 3 results (Japan – Q3)

2018 HY reportCimzia® performance 25
Sustainable growth in all regions
1 Numbers may not add due to rounding 2 nr axSpA: non-radiographic axial spondyloarthritisCER: constant exchange rates
Label extension to include WOCBA (EU) Psoriasis: approval (U.S. & EU) nr axial spondyloarthritis²:
Phase 3 results (U.S.)• nr axial spondyloarthritis²: submission• Psoriasis / psoriatic arthritis:
Phase 3 results (Japan)
• Loss of exclusivity (U.S. & EU)
• Loss of exclusivity(Japan)
2018 2024 2026
For patients living with• Rheumatoid arthritis• Psoriatic arthritis• Psoriasis• Ankylosing spondylitis /
axial spondyloarthritis• Crohn’s disease
Net sales1
€ million 2018 HY 2017 HY Act CER
U.S. 416 420 -1% 11%
Europe 192 176 9% 10%
International markets 71 66 8% 19%
Total Cimzia® 679 663 2% 11%
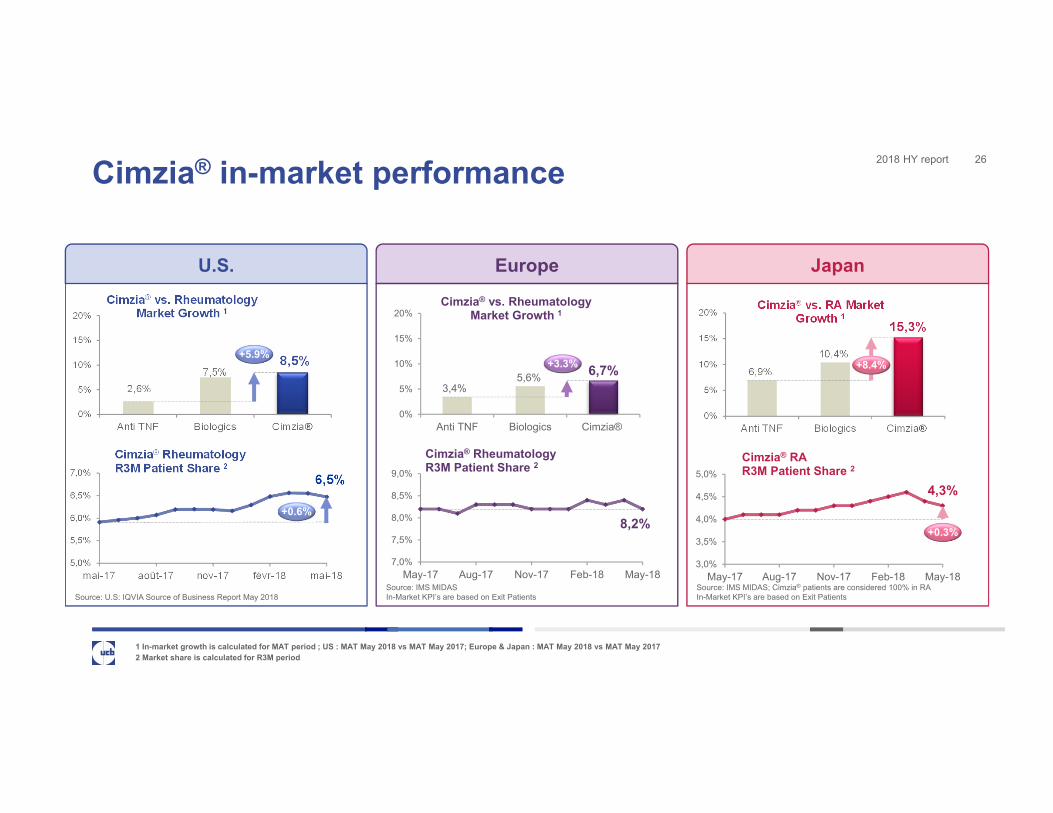
2018 HY reportCimzia® in-market performance 26
1 In-market growth is calculated for MAT period ; US : MAT May 2018 vs MAT May 2017; Europe & Japan : MAT May 2018 vs MAT May 20172 Market share is calculated for R3M period
6,5%
5,0%
5,5%
6,0%
6,5%
7,0%
mai-17 août-17 nov-17 févr-18 mai-18
Cimzia® RheumatologyR3M Patient Share 2
2,6%7,5%
8,5%
0%
5%
10%
15%
20%
Anti TNF Biologics Cimzia®
Cimzia® vs. Rheumatology Market Growth 1
U.S.
+5.9%
+0.6%
Source: U.S: IQVIA Source of Business Report May 2018
6,9%10,4%
15,3%
0%
5%
10%
15%
20%
Anti TNF Biologics Cimzia®
Cimzia® vs. RA Market Growth 1
3,4%5,6% 6,7%
0%
5%
10%
15%
20%
Anti TNF Biologics Cimzia®
Cimzia® vs. RheumatologyMarket Growth 1
Europe Japan
8,2%
7,0%
7,5%
8,0%
8,5%
9,0%
May-17 Aug-17 Nov-17 Feb-18 May-18
Cimzia® RheumatologyR3M Patient Share 2
Source: IMS MIDASIn-Market KPI’s are based on Exit Patients
+8.4%
4,3%
3,0%
3,5%
4,0%
4,5%
5,0%
May-17 Aug-17 Nov-17 Feb-18 May-18
Cimzia® RA R3M Patient Share 2
+0.3%
Source: IMS MIDAS; Cimzia® patients are considered 100% in RAIn-Market KPI’s are based on Exit Patients
+3.3%
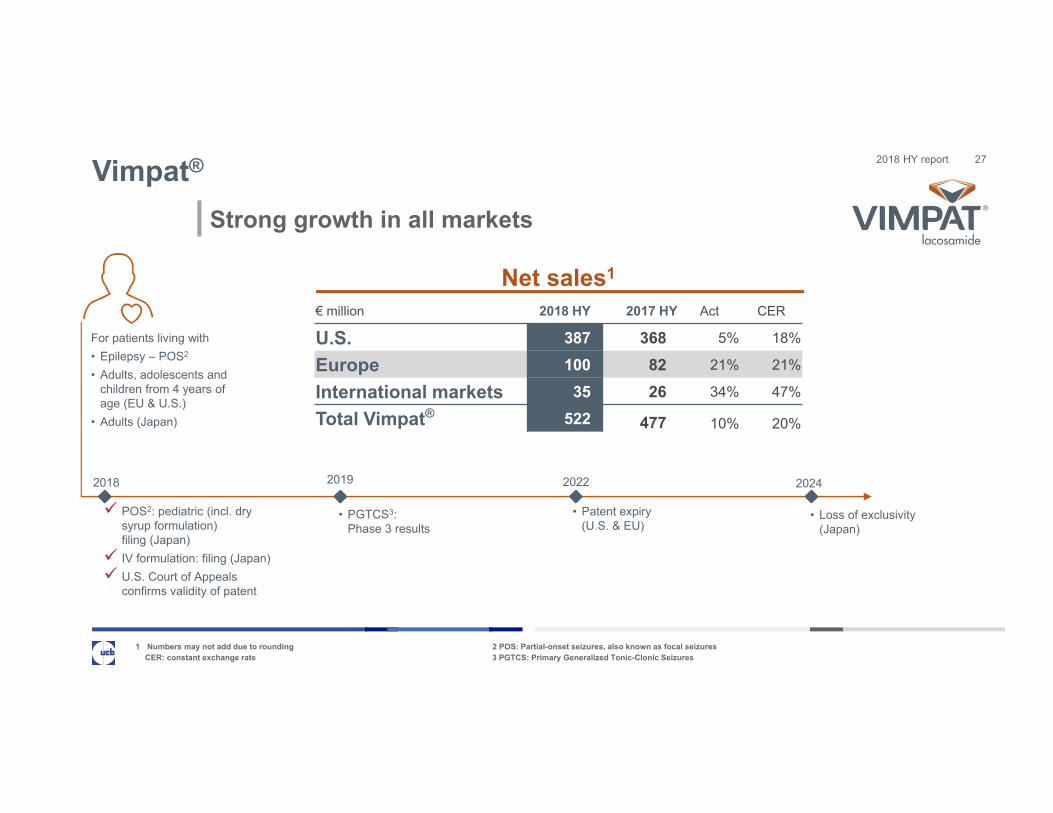
2018 HY reportVimpat® 27
Strong growth in all markets
1 Numbers may not add due to rounding 2 POS: Partial-onset seizures, also known as focal seizuresCER: constant exchange rate 3 PGTCS: Primary Generalized Tonic-Clonic Seizures
• PGTCS3: Phase 3 results
• Patent expiry (U.S. & EU)
• Loss of exclusivity(Japan)
2019 20242022
For patients living with• Epilepsy – POS2
• Adults, adolescents and children from 4 years of age (EU & U.S.)
• Adults (Japan)
Net sales1
€ million 2018 HY 2017 HY Act CER
U.S. 387 368 5% 18%
Europe 100 82 21% 21%
International markets 35 26 34% 47%
Total Vimpat® 522 477 10% 20%
2018
POS2: pediatric (incl. dry syrup formulation)filing (Japan)
IV formulation: filing (Japan) U.S. Court of Appeals
confirms validity of patent

2018 HY report
3,9%
3,0%
3,2%
3,4%
3,6%
3,8%
4,0%
May-17 Aug-17 Nov-17 Feb-18 May-18
Vimpat® – R3M TDx Share
4,3%
3,8%
4,0%
4,2%
4,4%
4,6%
4,8%
May-17 Aug-17 Nov-17 Feb-18 May-18
Vimpat® – R3M TRx Share
1,0%
8,0%
0%
5%
10%
15%
20%
AED Market Vimpat®
Vimpat® vs. AED Market Growth (TRx)
5,0%
0%
5%
10%
15%
20%
AED Market Vimpat®
Vimpat® vs. AED Market Growth (TDx)
-0,7%
18,2%
-5%
0%
5%
10%
15%
20%
AED Market Vimpat®
Vimpat® vs. AED Market Growth (TDx)
Vimpat® in-market performance 28
AED market: All molecules in ATC3= N3A + Phenobarbital in N5B. In Europe and Japan, the TDx of all these molecules are factored for epilepsy usage. In the U.S., the TRx of 26 of these molecules are factored for epilepsy usage.
U.S.
+7.0%
+0.2%
Europe Japan
Source data U.S.: U.S. IMS NPA - In-Market KPIs are based on TRx
+18.9%
+0.8%
Source data EU: IMS MIDAS - In-Market KPI’s are based on TDx
Numbers to be populated when sufficient data is
available
1,8%
0,0%
0,5%
1,0%
1,5%
2,0%
May-17 Jul-17 Sep-17 Nov-17 Jan-18 Mar-18 May-18
Vimpat® – R3M TDx Share
Source data JP: IMS MIDAS - In-market KPI’s are based on TDx
+1.4%
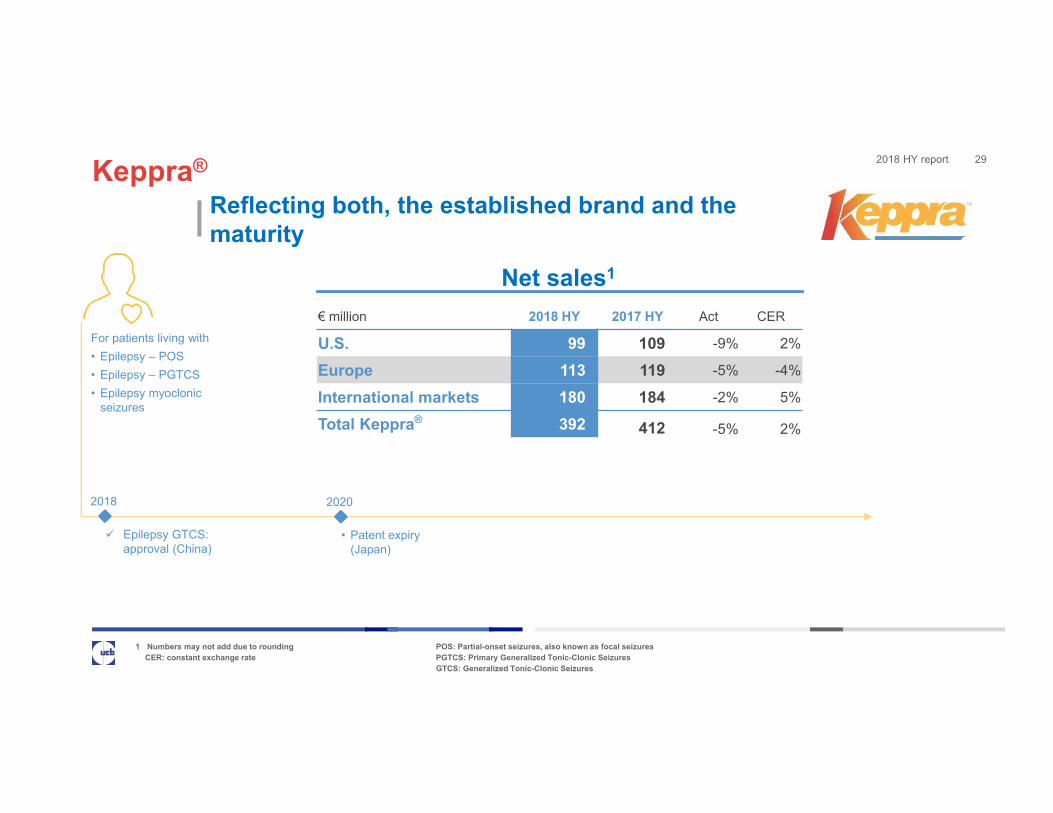
2018 HY reportKeppra® 29
Reflecting both, the established brand and the maturity
1 Numbers may not add due to rounding POS: Partial-onset seizures, also known as focal seizuresCER: constant exchange rate PGTCS: Primary Generalized Tonic-Clonic Seizures
GTCS: Generalized Tonic-Clonic Seizures
• Patent expiry(Japan)
2020
For patients living with• Epilepsy – POS• Epilepsy – PGTCS• Epilepsy myoclonic
seizures
Net sales1
€ million 2018 HY 2017 HY Act CER
U.S. 99 109 -9% 2%
Europe 113 119 -5% -4%
International markets 180 184 -2% 5%
Total Keppra® 392 412 -5% 2%
Epilepsy GTCS: approval (China)
2018
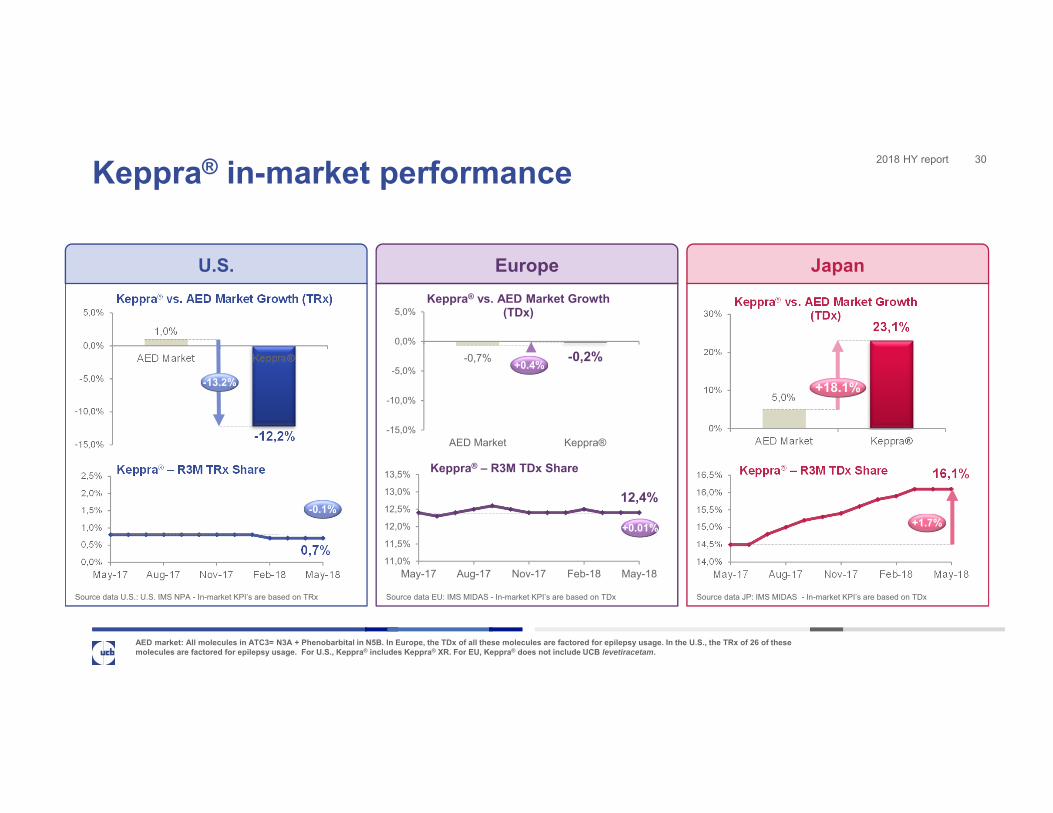
2018 HY report
0,7%0,0%
0,5%
1,0%
1,5%
2,0%
2,5%
May-17 Aug-17 Nov-17 Feb-18 May-18
Keppra® – R3M TRx Share
12,4%
11,0%
11,5%
12,0%
12,5%
13,0%
13,5%
May-17 Aug-17 Nov-17 Feb-18 May-18
Keppra® – R3M TDx Share
5,0%
23,1%
0%
10%
20%
30%
AED Market Keppra®
Keppra® vs. AED Market Growth (TDx)
-0,7% -0,2%
-15,0%
-10,0%
-5,0%
0,0%
5,0%
AED Market Keppra®
Keppra® vs. AED Market Growth (TDx)
1,0%
-12,2%-15,0%
-10,0%
-5,0%
0,0%
5,0%
AED Market Keppra®
Keppra® vs. AED Market Growth (TRx)
16,1%
14,0%
14,5%
15,0%
15,5%
16,0%
16,5%
May-17 Aug-17 Nov-17 Feb-18 May-18
Keppra® – R3M TDx Share
Keppra® in-market performance 30
AED market: All molecules in ATC3= N3A + Phenobarbital in N5B. In Europe, the TDx of all these molecules are factored for epilepsy usage. In the U.S., the TRx of 26 of these molecules are factored for epilepsy usage. For U.S., Keppra® includes Keppra® XR. For EU, Keppra® does not include UCB levetiracetam.
U.S.
-13.2%
-0.1%
Europe Japan
Source data U.S.: U.S. IMS NPA - In-market KPI’s are based on TRx
+0.4%
+0.01%
Source data EU: IMS MIDAS - In-market KPI’s are based on TDx
+18.1%
Source data JP: IMS MIDAS - In-market KPI’s are based on TDx
+1.7%
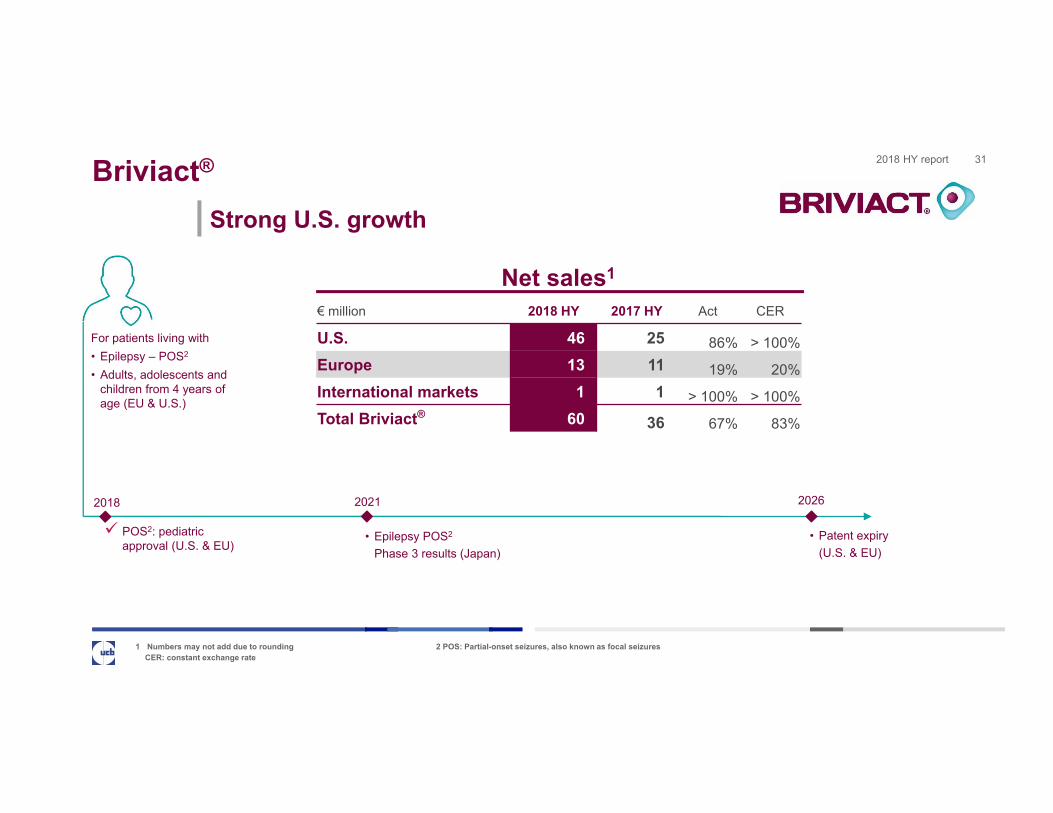
2018 HY reportBriviact® 31
Strong U.S. growth
1 Numbers may not add due to rounding 2 POS: Partial-onset seizures, also known as focal seizuresCER: constant exchange rate
• Epilepsy POS2
Phase 3 results (Japan)
2021
For patients living with• Epilepsy – POS2
• Adults, adolescents and children from 4 years of age (EU & U.S.)
Net sales1
• Patent expiry (U.S. & EU)
€ million 2018 HY 2017 HY Act CER
U.S. 46 25 86% > 100%Europe 13 11 19% 20%International markets 1 1 > 100% > 100%Total Briviact® 60 36 67% 83%
20262018
POS2: pediatric approval (U.S. & EU)
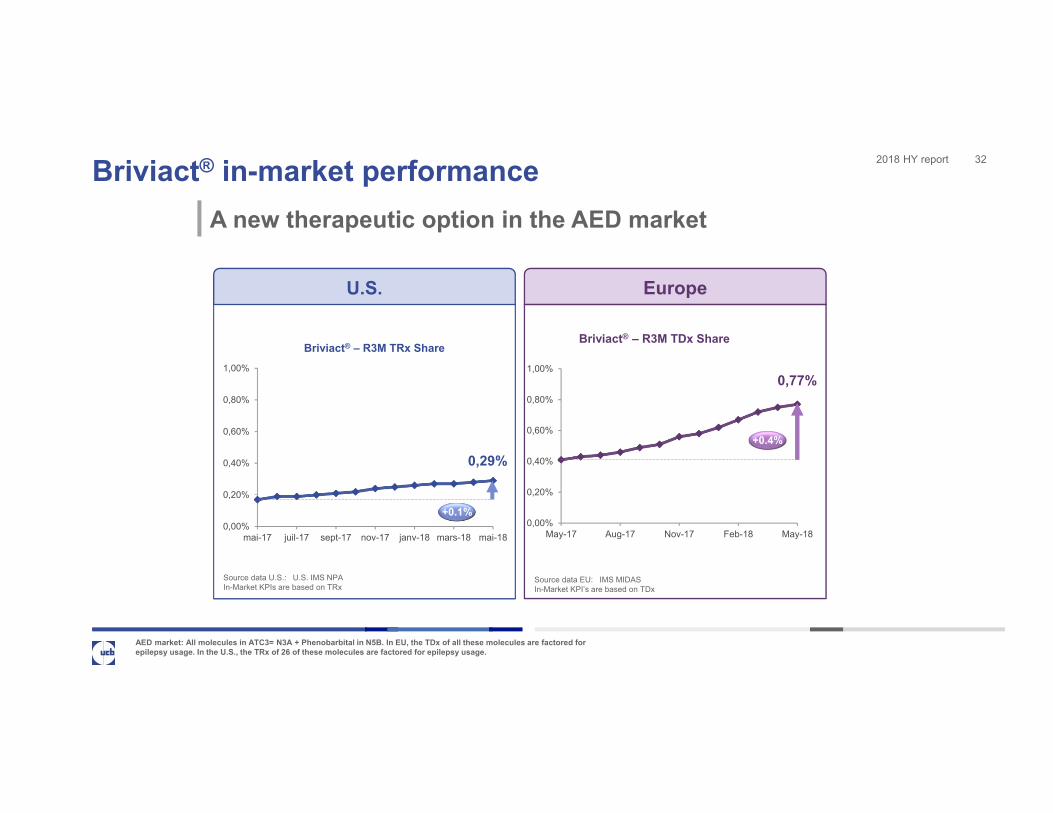
2018 HY reportBriviact® in-market performance 32
A new therapeutic option in the AED market
AED market: All molecules in ATC3= N3A + Phenobarbital in N5B. In EU, the TDx of all these molecules are factored for epilepsy usage. In the U.S., the TRx of 26 of these molecules are factored for epilepsy usage.
U.S. Europe
Source data U.S.: U.S. IMS NPAIn-Market KPIs are based on TRx
Source data EU: IMS MIDASIn-Market KPI’s are based on TDx
0,29%
0,00%
0,20%
0,40%
0,60%
0,80%
1,00%
mai-17 juil-17 sept-17 nov-17 janv-18 mars-18 mai-18
Briviact® – R3M TRx Share
0,77%
0,00%
0,20%
0,40%
0,60%
0,80%
1,00%
May-17 Aug-17 Nov-17 Feb-18 May-18
Briviact® – R3M TDx Share
+0.1%
+0.4%
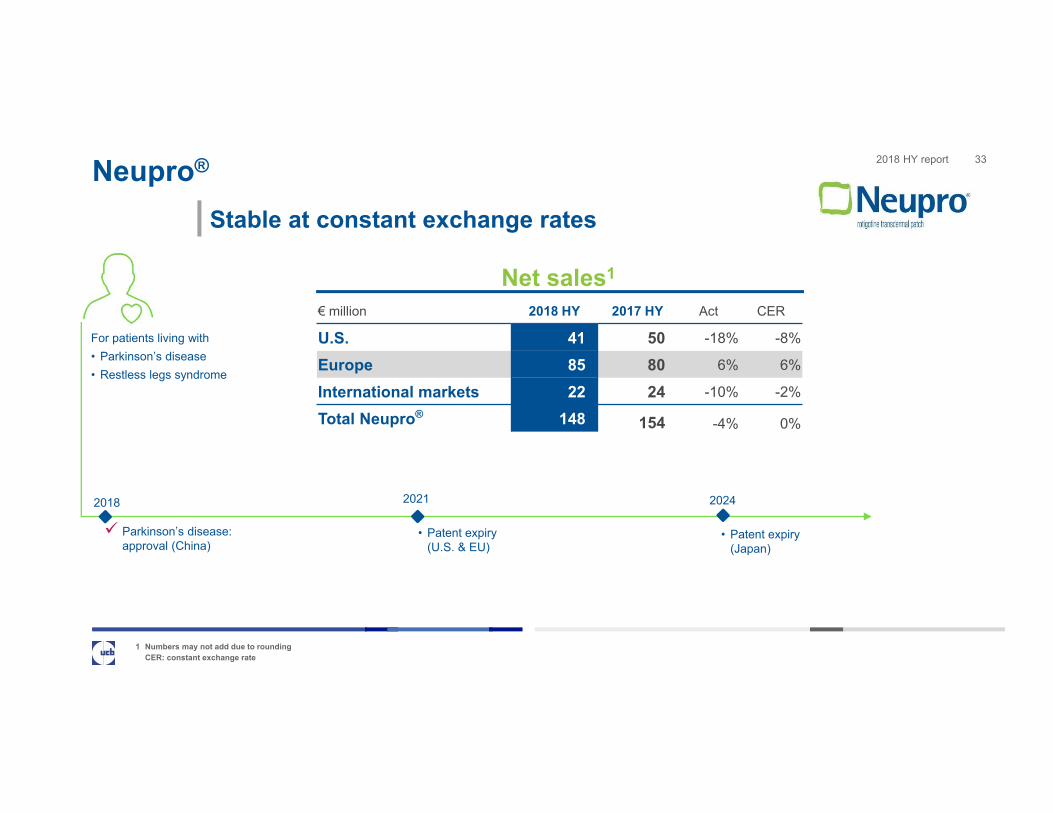
2018 HY reportNeupro® 33
Stable at constant exchange rates
1 Numbers may not add due to rounding CER: constant exchange rate
For patients living with• Parkinson’s disease• Restless legs syndrome
Net sales1
• Patent expiry (Japan)
2024
€ million 2018 HY 2017 HY Act CER
U.S. 41 50 -18% -8%
Europe 85 80 6% 6%
International markets 22 24 -10% -2%
Total Neupro® 148 154 -4% 0%
• Patent expiry (U.S. & EU)
20212018
Parkinson’s disease: approval (China)
2018 HY report
-0,9% -0,9% -2,2%
-5,0%
0,0%
5,0%
10,0%
15,0%
PD Market PD KeyCompetitors
Neupro®
Neupro® PD vs. PD (KC) Market Growth (TRx)
33,3%
25%
27%
29%
31%
33%
35%
May-17 Aug-17 Nov-17 Feb-18 May-18
Neupro® PD – R3M TDx Share
6,2%
6,0%
6,2%
6,4%
6,6%
6,8%
7,0%
May-17 Sep-17 Jan-18 May-18
Neupro® PD – R3M TRx Share
6,1% 9,2%5,3%
-5%
0%
5%
10%
15%
PD Market PD KeyCompetitors
Neupro®
Neupro® PD vs. PD (KC) Market Growth (TDx)
15,8%
15,0%
15,2%
15,4%
15,6%
15,8%
16,0%
May-17 Aug-17 Nov-17 Feb-18 May-18
Neupro® PD – R3M TDx Share
0,4% -2,2%
13,5%
-5%
0%
5%
10%
15%
PD Market PD KeyCompetitors
Neupro®
Neupro® PD vs. PD (KC) Market Growth (TDx)
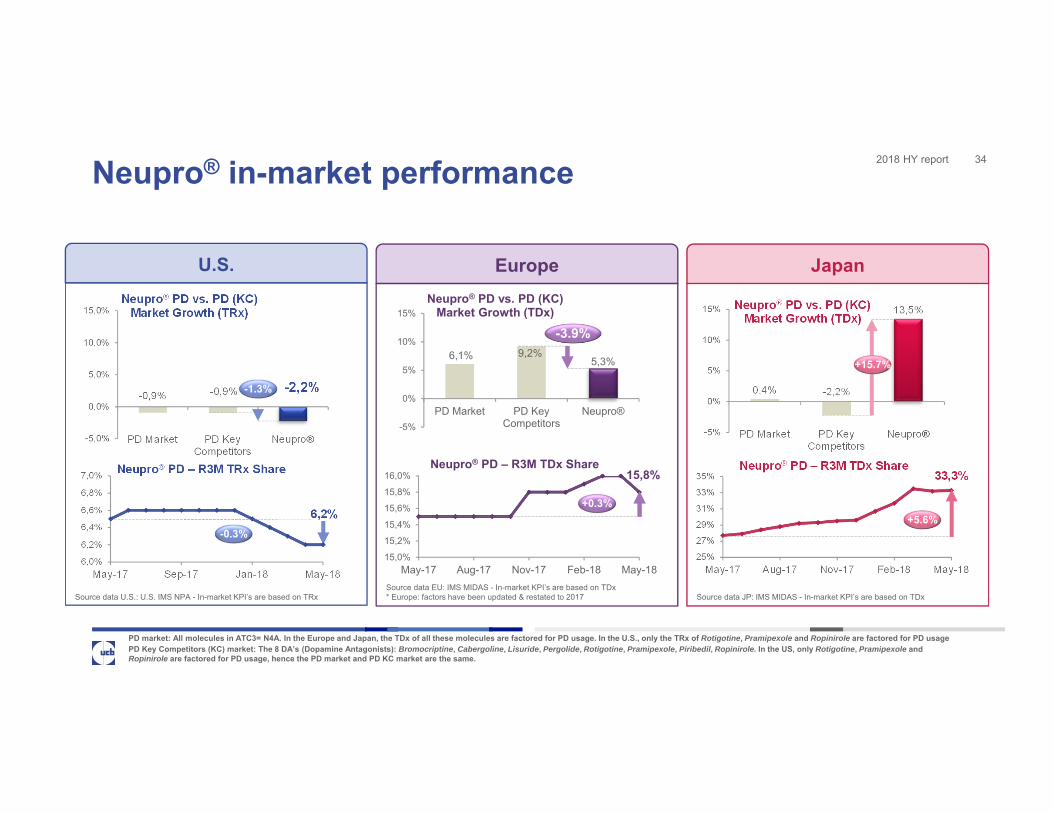
Neupro® in-market performance 34
PD market: All molecules in ATC3= N4A. In the Europe and Japan, the TDx of all these molecules are factored for PD usage. In the U.S., only the TRx of Rotigotine, Pramipexole and Ropinirole are factored for PD usagePD Key Competitors (KC) market: The 8 DA’s (Dopamine Antagonists): Bromocriptine, Cabergoline, Lisuride, Pergolide, Rotigotine, Pramipexole, Piribedil, Ropinirole. In the US, only Rotigotine, Pramipexole and Ropinirole are factored for PD usage, hence the PD market and PD KC market are the same.
U.S.
-1.3%
-0.3%
Europe Japan
Source data U.S.: U.S. IMS NPA - In-market KPI’s are based on TRx
-3.9%
+0.3%
Source data EU: IMS MIDAS - In-market KPI’s are based on TDx* Europe: factors have been updated & restated to 2017
+15.7%
+5.6%
Source data JP: IMS MIDAS - In-market KPI’s are based on TDx

2018 HY report
Translating scientific hypotheses into clinical development35
Evenity™ (romosozumab)osteoporosis
midazolam nasal spray acute repetitive seizures
bimekizumab (IL17A/F)psoriasispsoriatic arthritisankylosing spondylitis
Phase 3 program results: Q4 2019Phase 3 to start: H2 2018Phase 3 to start: H2 2018
dapirolizumab pegol (CD40L antibody)systemic lupus erythematosus Phase 2b results: Q4 2018 (Partner: Biogen)
padsevonil (PPSI)highly drug-resistant epilepsy Phase 2b results: H1 2020
rozanolixizumab (FcRn)myasthenia gravisimmune thrombocytopenia
Phase 2a results: Q3 2018Phase 2a results: Q4 2018
UCB6673 UCB7858 UCB0159
UCB0599 UCB0107 radiprodil (UCB3491)
FilingPhase 3Phase 2Phase 1
Bone
Immunology
Neurology
Evenity™ is the trade name of romosozumab which has been provisionally approved bythe U.S. Food & Drug Administration (FDA) and the European Medicines Agency (EMA).
Changes since February 2018:• Midazolam acquired & submitted ● UCB4144/VR942 available for license• Seletalisib in Sjögren's Syndrome and APDS deprioritized ● UCB0107 first in human

2018 HY report
2018 2019 2020
R&D milestones
SLE: Systemic Lupus ErythematosusITP: Immune thrombocytopenia
36
dapirolizumab pegolSLE
Phase 2b results
rozanolixizumabmyasthenia gravisPhase 2a results
padsevonilhigh drug resistant
epilepsyPhase 2b start
bimekizumab psoriasis
Phase 3 results
padsevonilhigh drug resistant
epilepsyPhase 2b results
seletalisib
romosozumabosteoporosis in
post-menopausal women
filing (EU)
bimekizumab psoriatic athritisPhase 3 start
bimekizumab ankylosing spondylitis
Phase 3 start
neurology
immunologybone
UCB0107Phase 1 start
rozanolixizumabITP
Phase 2a results
romosozumabresubmission
(U.S.)
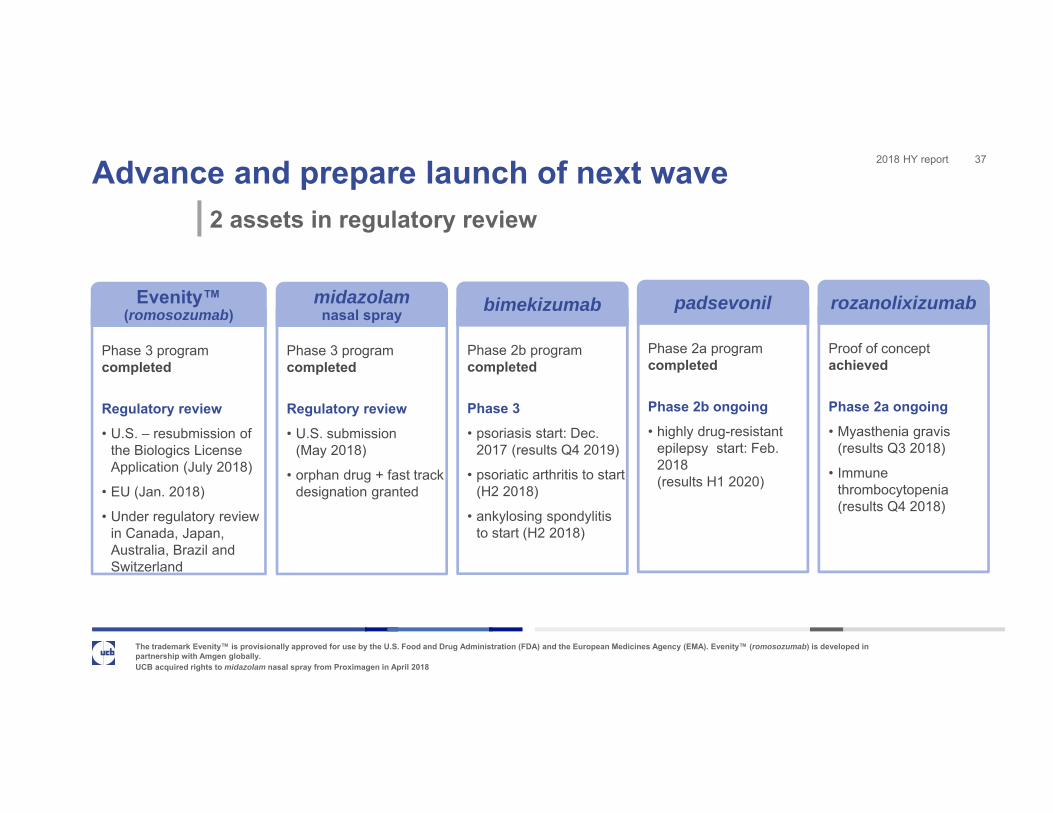
2018 HY reportAdvance and prepare launch of next wave 37
2 assets in regulatory review
The trademark Evenity™ is provisionally approved for use by the U.S. Food and Drug Administration (FDA) and the European Medicines Agency (EMA). Evenity™ (romosozumab) is developed in partnership with Amgen globally.UCB acquired rights to midazolam nasal spray from Proximagen in April 2018
Phase 3 program completed
Regulatory review• U.S. – resubmission of
the Biologics License Application (July 2018)
• EU (Jan. 2018)
• Under regulatory review in Canada, Japan, Australia, Brazil and Switzerland
Evenity™(romosozumab)
Phase 2b program completed
Phase 3 • psoriasis start: Dec.
2017 (results Q4 2019)
• psoriatic arthritis to start (H2 2018)
• ankylosing spondylitis to start (H2 2018)
bimekizumab
Phase 2a program completed
Phase 2b ongoing• highly drug-resistant
epilepsy start: Feb. 2018 (results H1 2020)
padsevonil
Phase 3 program completed
Regulatory review• U.S. submission
(May 2018)
• orphan drug + fast track designation granted
midazolamnasal spray
Proof of concept achieved
Phase 2a ongoing• Myasthenia gravis
(results Q3 2018)
• Immune thrombocytopenia (results Q4 2018)
rozanolixizumab
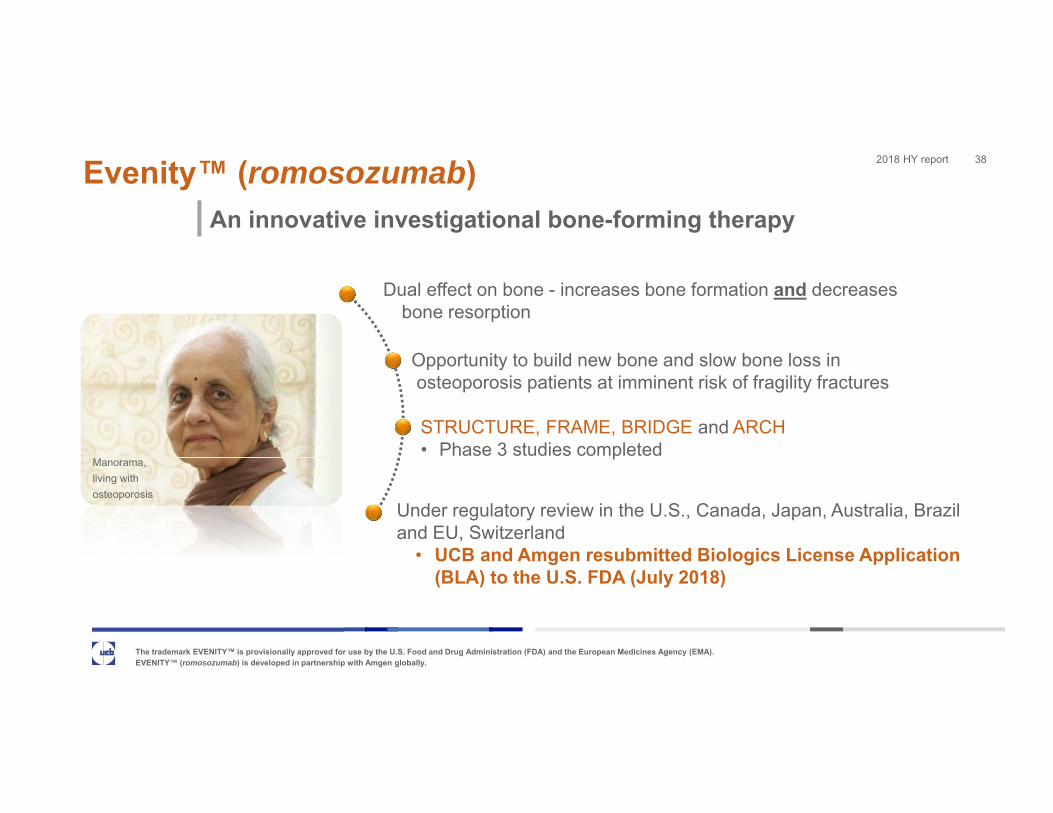
2018 HY reportEvenity™ (romosozumab) 38
An innovative investigational bone-forming therapy
STRUCTURE, FRAME, BRIDGE and ARCH• Phase 3 studies completed
Opportunity to build new bone and slow bone loss in osteoporosis patients at imminent risk of fragility fractures
Dual effect on bone - increases bone formation and decreases bone resorption
Under regulatory review in the U.S., Canada, Japan, Australia, Braziland EU, Switzerland
• UCB and Amgen resubmitted Biologics License Application (BLA) to the U.S. FDA (July 2018)
Manorama, living with osteoporosis
The trademark EVENITY™ is provisionally approved for use by the U.S. Food and Drug Administration (FDA) and the European Medicines Agency (EMA).EVENITY™ (romosozumab) is developed in partnership with Amgen globally.

2018 HY report
Translating scientific hypotheses into clinical differentiation39
Dual blockade of IL-17F and IL-17A by bimekizumab
Dual blockade of IL-17F on top of IL-17A
will improve therapeutic efficacy versus targeting IL-17A alone
IL-17F
IL-17RAIL-17RC
IL-17A
Bimekizumab specifically and completely blocks IL-17F and IL-17A
IL-17F and IL-17A are twin cytokines
driving joint and skin inflammation
2018 HY report
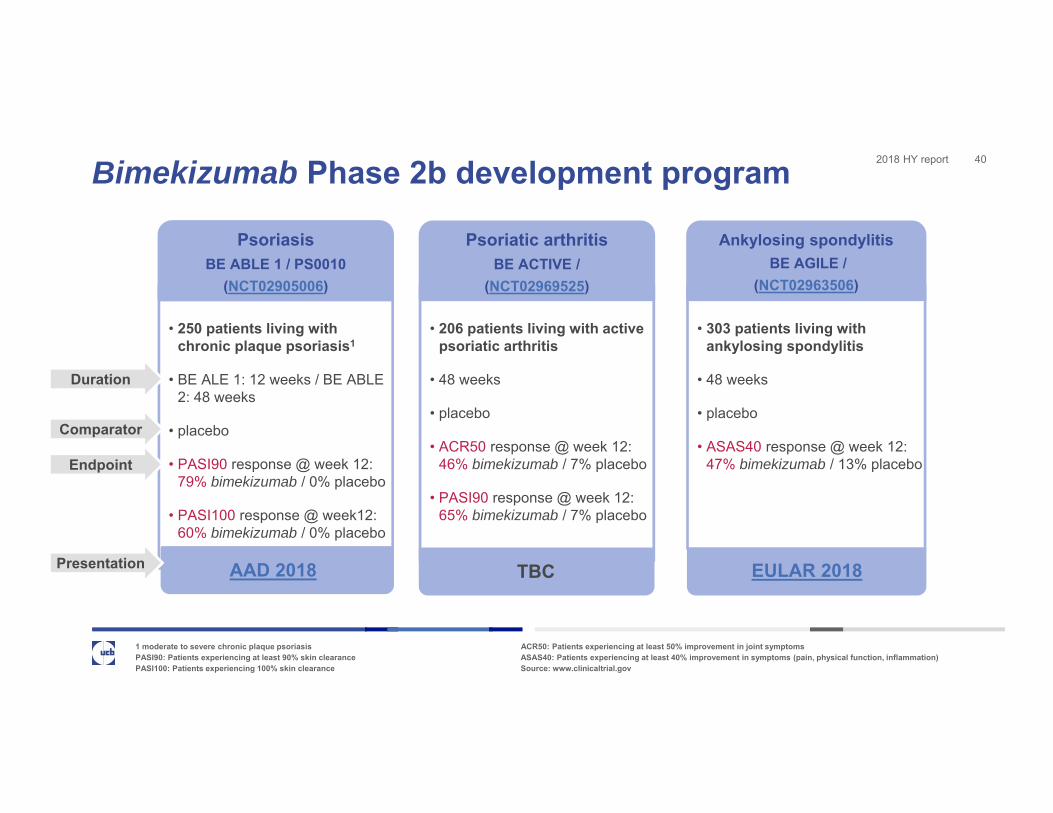
• 250 patients living with chronic plaque psoriasis1
• BE ALE 1: 12 weeks / BE ABLE 2: 48 weeks
• placebo
• PASI90 response @ week 12: 79% bimekizumab / 0% placebo
• PASI100 response @ week12: 60% bimekizumab / 0% placebo
PsoriasisBE ABLE 1 / PS0010
(NCT02905006)
AAD 2018
Bimekizumab Phase 2b development program 40
1 moderate to severe chronic plaque psoriasis ACR50: Patients experiencing at least 50% improvement in joint symptomsPASI90: Patients experiencing at least 90% skin clearance ASAS40: Patients experiencing at least 40% improvement in symptoms (pain, physical function, inflammation)PASI100: Patients experiencing 100% skin clearance Source: www.clinicaltrial.gov
• 206 patients living with active psoriatic arthritis
• 48 weeks
• placebo
• ACR50 response @ week 12: 46% bimekizumab / 7% placebo
• PASI90 response @ week 12: 65% bimekizumab / 7% placebo
Psoriatic arthritisBE ACTIVE /
(NCT02969525)
TBC
Duration
Comparator
Endpoint
• 303 patients living with ankylosing spondylitis
• 48 weeks
• placebo
• ASAS40 response @ week 12: 47% bimekizumab / 13% placebo
Ankylosing spondylitisBE AGILE /
(NCT02963506)
EULAR 2018Presentation
2018 HY report
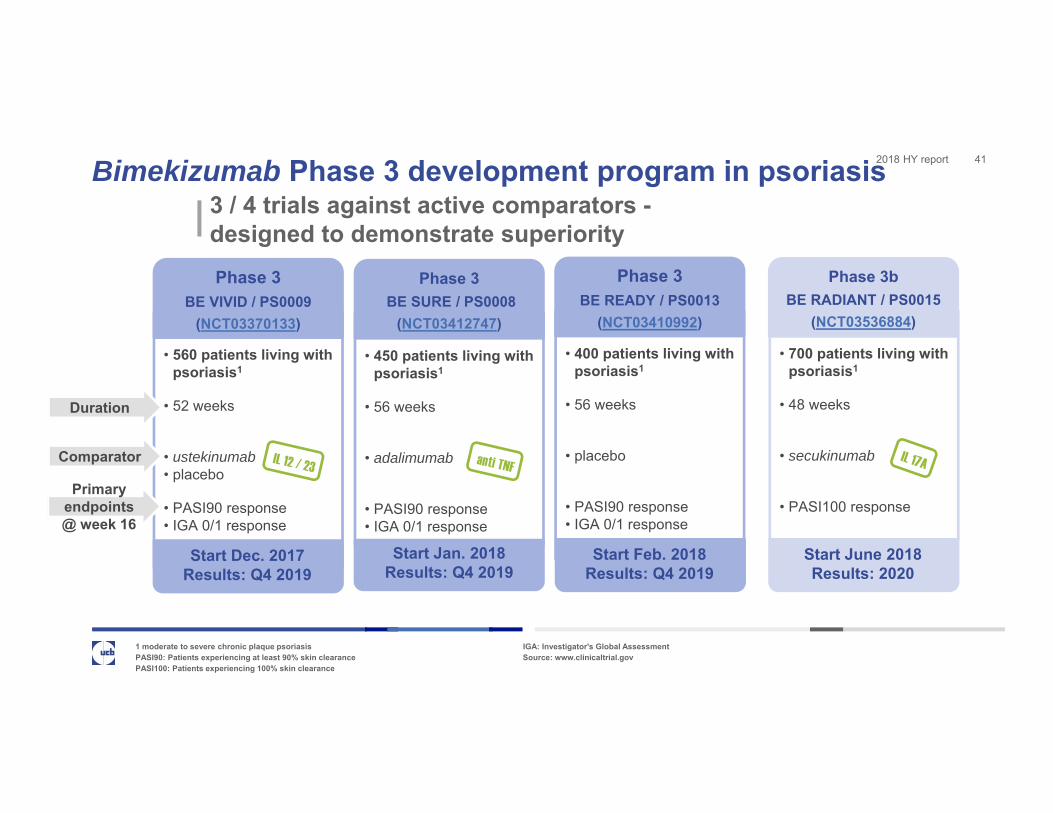
• 560 patients living with psoriasis1
• 52 weeks
• ustekinumab• placebo
• PASI90 response• IGA 0/1 response
Phase 3BE VIVID / PS0009
(NCT03370133)
Start Dec. 2017Results: Q4 2019
Bimekizumab Phase 3 development program in psoriasis 41
3 / 4 trials against active comparators -designed to demonstrate superiority
1 moderate to severe chronic plaque psoriasis IGA: Investigator's Global AssessmentPASI90: Patients experiencing at least 90% skin clearance Source: www.clinicaltrial.govPASI100: Patients experiencing 100% skin clearance
• 400 patients living with psoriasis1
• 56 weeks
• placebo
• PASI90 response• IGA 0/1 response
Phase 3BE READY / PS0013
(NCT03410992)
Start Feb. 2018Results: Q4 2019
Duration
Comparator
Primary endpoints@ week 16
• 700 patients living with psoriasis1
• 48 weeks
• secukinumab
• PASI100 response
Phase 3bBE RADIANT / PS0015
(NCT03536884)
Start June 2018Results: 2020
• 450 patients living with psoriasis1
• 56 weeks
• adalimumab
• PASI90 response• IGA 0/1 response
Phase 3BE SURE / PS0008
(NCT03412747)
Start Jan. 2018Results: Q4 2019
2018 HY report
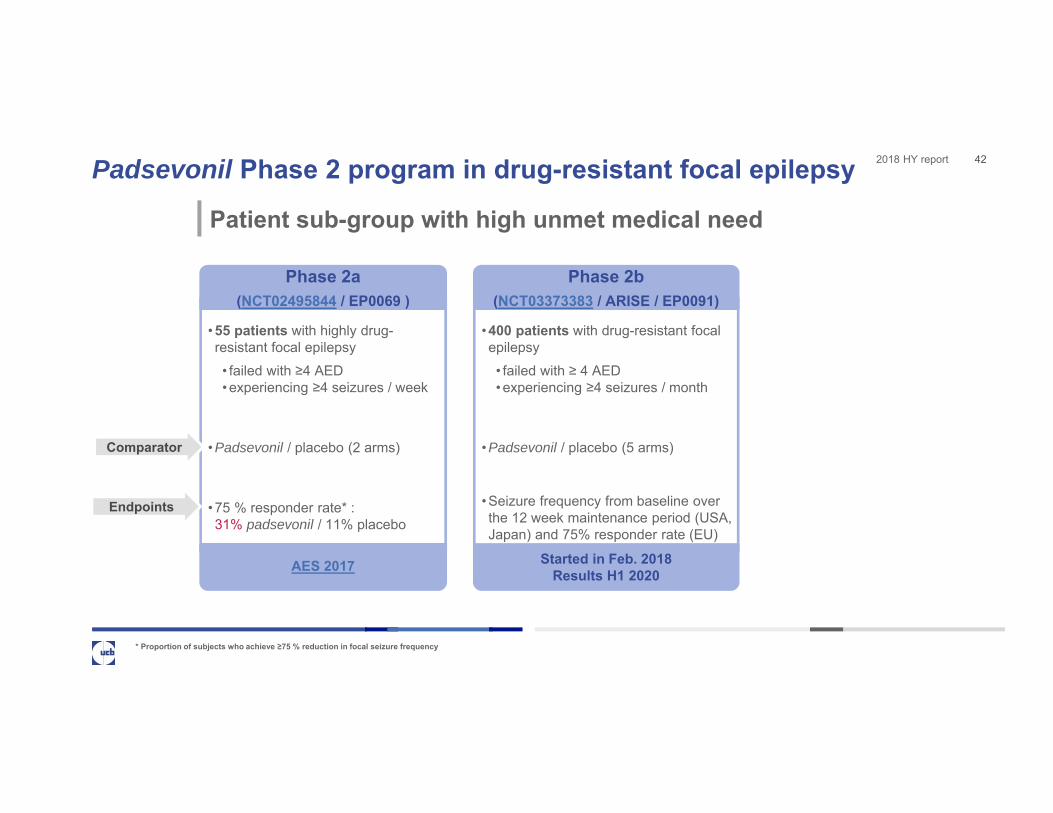
• 400 patients with drug-resistant focal epilepsy• failed with ≥ 4 AED• experiencing ≥4 seizures / month
• Padsevonil / placebo (5 arms)
• Seizure frequency from baseline over the 12 week maintenance period (USA, Japan) and 75% responder rate (EU)
• 55 patients with highly drug-resistant focal epilepsy• failed with ≥4 AED• experiencing ≥4 seizures / week
• Padsevonil / placebo (2 arms)
• 75 % responder rate* :31% padsevonil / 11% placebo
Padsevonil Phase 2 program in drug-resistant focal epilepsy 42
Patient sub-group with high unmet medical need
* Proportion of subjects who achieve ≥75 % reduction in focal seizure frequency
Comparator
Endpoints
Phase 2a(NCT02495844 / EP0069 )
Phase 2b (NCT03373383 / ARISE / EP0091)
Started in Feb. 2018Results H1 2020AES 2017
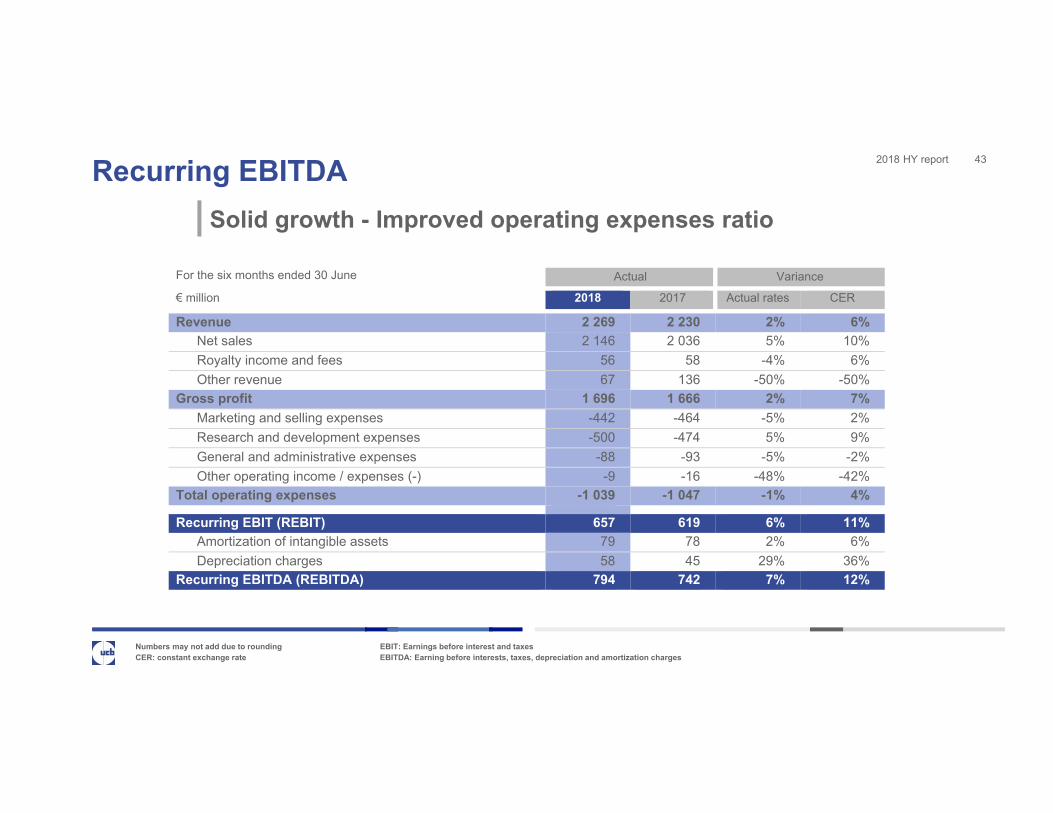
2018 HY reportRecurring EBITDA 43
Solid growth - Improved operating expenses ratio
Numbers may not add due to rounding EBIT: Earnings before interest and taxesCER: constant exchange rate EBITDA: Earning before interests, taxes, depreciation and amortization charges
For the six months ended 30 June Actual Variance
€ million 2018 2017 Actual rates CER
Revenue 2 269 2 230 2% 6% Net sales 2 146 2 036 5% 10% Royalty income and fees 56 58 -4% 6% Other revenue 67 136 -50% -50%
Gross profit 1 696 1 666 2% 7% Marketing and selling expenses -442 -464 -5% 2% Research and development expenses -500 -474 5% 9% General and administrative expenses -88 -93 -5% -2% Other operating income / expenses (-) -9 -16 -48% -42%
Total operating expenses -1 039 -1 047 -1% 4%
Recurring EBIT (REBIT) 657 619 6% 11% Amortization of intangible assets 79 78 2% 6% Depreciation charges 58 45 29% 36%
Recurring EBITDA (REBITDA) 794 742 7% 12%

2018 HY report2018 HY profit 44
Numbers may not add due to roundingCER: constant exchange rateEBIT: Earnings before interest and taxes
For the six months ended 30 June Actual Variance
€ million 2018 2017 Actual rates CER
Recurring EBIT 657 619 6% 11% Impairment charges 0 4 -100% -100% Restructuring expenses -4 -7 -41% -39% Gain on disposals 0 0 N/A N/A Other non-recurring income / expenses (-) 23 3 > 100% > 100%
Total non-recurring income / expenses (-) 19 1 > 100% > 100%
EBIT (operating profit) 676 619 9% 14% Net financial expenses (-) -46 -55 -17% -16% Result from associates -1 0 N/A N/A
Profit before income taxes 629 564 12% 17% Income tax expense (-) / credit -56 -114 -51% -49%
Profit from continuing operations 573 450 27% 33% Profit / loss (-) from discontinued operations 1 1 -44% -62%
Profit 574 451 27% 33% Attributable to UCB shareholders 551 431 28% 33% Attributable to non-controlling interests 23 20 15% 29%
Profit attributable to UCB shareholders 551 431 28% 33%
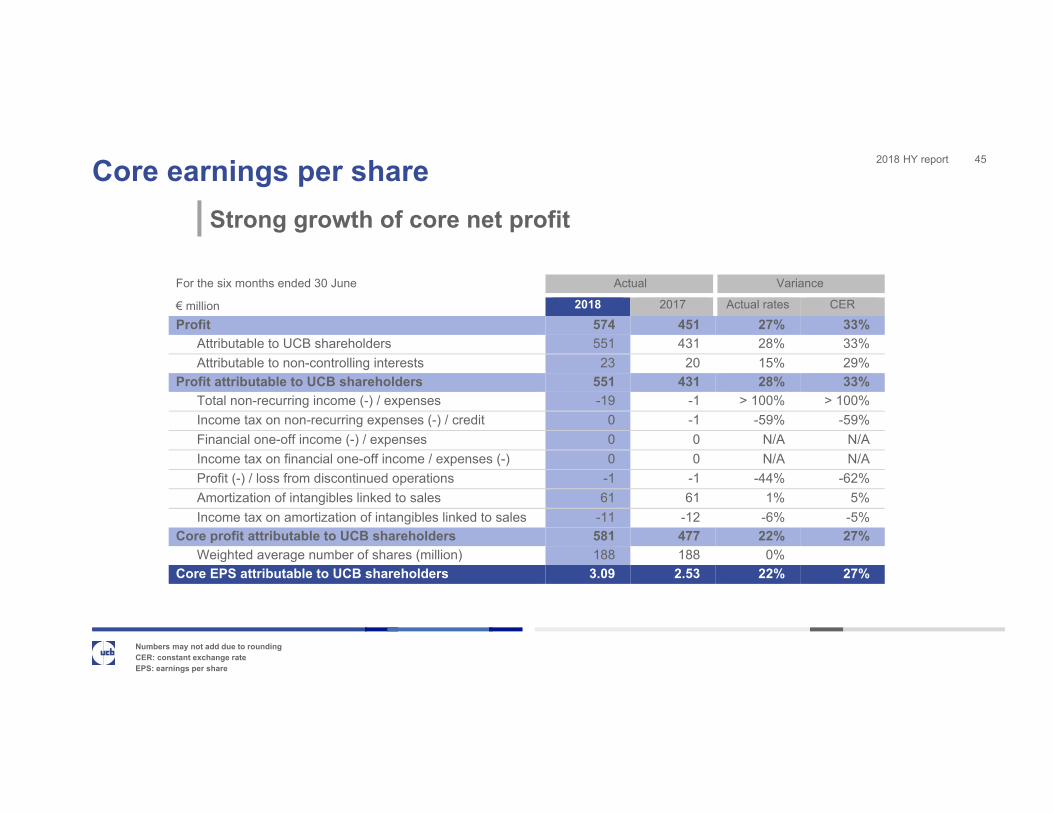
2018 HY reportCore earnings per share 45
Strong growth of core net profit
Numbers may not add due to roundingCER: constant exchange rateEPS: earnings per share
For the six months ended 30 June Actual Variance
€ million 2018 2017 Actual rates CER
Profit 574 451 27% 33% Attributable to UCB shareholders 551 431 28% 33% Attributable to non-controlling interests 23 20 15% 29%
Profit attributable to UCB shareholders 551 431 28% 33% Total non-recurring income (-) / expenses -19 -1 > 100% > 100% Income tax on non-recurring expenses (-) / credit 0 -1 -59% -59% Financial one-off income (-) / expenses 0 0 N/A N/A Income tax on financial one-off income / expenses (-) 0 0 N/A N/A Profit (-) / loss from discontinued operations -1 -1 -44% -62% Amortization of intangibles linked to sales 61 61 1% 5% Income tax on amortization of intangibles linked to sales -11 -12 -6% -5%
Core profit attributable to UCB shareholders 581 477 22% 27% Weighted average number of shares (million) 188 188 0%
Core EPS attributable to UCB shareholders 3.09 2.53 22% 27%

2018 HY report
Numbers may not add due to roundingCER: constant exchange rate
2018 HY key product net sales performance 46
For the six months ended 30 June Actual Variance
€ million 2018 2017 Actual rates CER
Core products 1 801 1 741 3% 12% Immunology / Cimzia P
® 679 663 2% 11% Neurology
VimpatP
® 522 477 10% 20% KeppraP
®P (including KeppraP
®P XR + E KeppraP
®P) 392 412 -5% 2%
NeuproP
® 148 154 -4% 0% BriviactP
® 60 36 67% 83% Established brands 280 302 -7% -3%
ZyrtecP
®P (including Zyrtec-DP
®P / CirrusP
®P) 58 61 -6% -3%
Xyzal P
® 51 54 -6% 0% Other products 171 186 -8% -5%
Net sales before hedging 2 081 2 043 2% 10% Designated hedges reclassified to net sales 65 -8 > -100% Total net sales 2 146 2 036 5% 10%

2018 HY reportOne UCB today: A global player 47
Presence in 38 countries complemented by a robust network of partners
Situation at 30 June 2018
7 480employees
globally

2018 HY report 48Stable shareholder base with free-float of 62%Weighted average shares outstanding in 2018: 188 million
“Free float” investors by region
Source: Notifications, FactSet and UCB underlying ownership analysis, July 2018
2018 HY report 49
ן Antje Witte, Vice President Investor Relations• Phone: +32 2 559 9414• E-mail: [email protected]
ן Isabelle Ghellynck, Director Investor Relations• Phone: +32 2 559 9588• E-mail: [email protected]
ן Nathalie Deldime, Investor Relations Manager• Phone: +32 2 559 9291• E-mail: [email protected]
ן Check out our new IR App – stay tuned wherever you go
Your UCB Investor Relations team