Embed Size (px)
Citation preview

Presented by
© Copyright 2013 OSIsoft, LLC.
Applications of Multivariate Data Analysis
Petter Möree & Jonas Elfving
© Copyright 2013 OSIsoft, LLC.
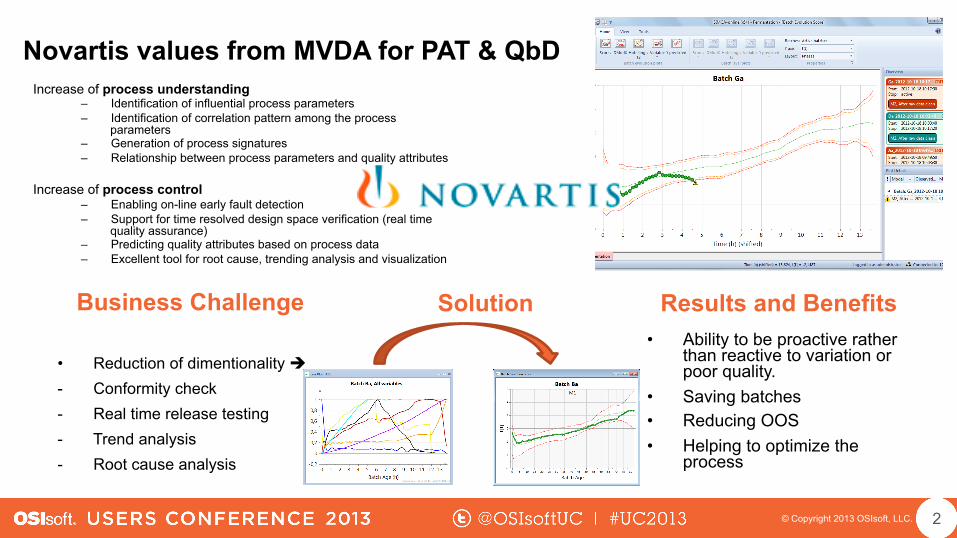
• Ability to be proactive rather than reactive to variation or poor quality.
• Saving batches • Reducing OOS • Helping to optimize the
process
Solution Results and Benefits
Novartis values from MVDA for PAT & QbD
Business Challenge
• Reduction of dimentionality è - Conformity check - Real time release testing - Trend analysis - Root cause analysis
Increase of process understanding – Identification of influential process parameters – Identification of correlation pattern among the process
parameters – Generation of process signatures – Relationship between process parameters and quality attributes
Increase of process control
– Enabling on-line early fault detection – Support for time resolved design space verification (real time
quality assurance) – Predicting quality attributes based on process data – Excellent tool for root cause, trending analysis and visualization
2

© Copyright 2013 OSIsoft, LLC.
Topics • Introduction: MVDA in the context of pharmaceutical production • Case studies for MVDA I
– Process monitoring of a granulation process in pharmaceutical production • Case studies for MVDA II
– Statistical Process Control Biopharmaceutical Production for optimization • Short real-time demonstration
Using PI Server, PI Batch and PI Event Frame & PI Interface for SIMCA-online
3

© Copyright 2013 OSIsoft, LLC.
Umetrics • Part of ~1Billion conglomerate • The market leader in software for multivariate analysis
(MVDA) & Design of Experiments (DOE)
• 25+ years in the market
• Off line analysis tools • On-Line process monitoring and fault detection • 700+ companies, 7,000+ users
• Pharmaceutical, Biotech, Chemical, Food, Semiconductors and more
• Worldwide Presence with MKS • Close collaboration with universities in USA, Sweden,
UK and Canada
4

© Copyright 2013 OSIsoft, LLC. 5

© Copyright 2013 OSIsoft, LLC.
Building a capable process
DOE
MVDA
QFD Quality Function Deployment
QRA: Quality Risk Assessment
DOE Analysis Design Space
Control Plan
MVPC Multivariate Process Control
• DOE is a knowledge building tool for process development • MVDA is used both for process understanding and process monitoring
6

© Copyright 2013 OSIsoft, LLC.
Our Customers’ Goals in Pharma • The goal in Pharma production is to help take advantage of data
present in the development labs, and the production environments all the way from API to the final product. = ROI
7

© Copyright 2013 OSIsoft, LLC.
The Need for Multivariate I
The information is found in the correlation pattern - not in the individual variables!
8

© Copyright 2013 OSIsoft, LLC.
The Need for Multivariate I
Multivariate Control Limits
9

© Copyright 2013 OSIsoft, LLC.
The Need for Multivariate II • Data explosion, more process measurements
than ever before, reduce false alarms
• Spectrometers – NIR, FTIR, RAMAN, UV, LLSD – MS, GC, HPLC
• Process Sensors – Acoustic, Video – P, T, Flow, pH – pO2 pCO2
• Require MVDA methods to visualise and extract reliable information from raw data
• MVDA handles noise, missing data, correlation and visualize in graphs
10

© Copyright 2013 OSIsoft, LLC.
This control chart is familiar to you ?
SMI= x1*Novartis + x2*Roche + x3*Merck + x3*FB....
11

© Copyright 2013 OSIsoft, LLC.
So this control chart is easy to understand....
-3
-2
-1
0
1
2
3
4
0 10 20 30 40 50 60 70 80 90 100 110 120 130
tPS[
1]
$Time (normalized)
PO_WST3433_EXJADE_Drying_V01.M3:3Predicted Scores [comp. 1]
+3 Std.Devt[1] (Avg)-3 Std.DevtPS[1] (Batch S0058_A_854826)
SIMCA-P+ 11 - 01.08.2009 14:42:24
t1= x1*Temperature + x2*Pressure + x3*Agitation speed ....
12

© Copyright 2013 OSIsoft, LLC.
MSPC Observation Level • Example of a drying step
-3
-2
-1
0
1
2
3
4
0 10 20 30 40 50 60 70 80 90 100 110 120 130
tPS[
1]
$Time (normalized)
PO_WST3433_EXJADE_Drying_V01.M3:3Predicted Scores [comp. 1]
+3 Std.Devt[1] (Avg)-3 Std.DevtPS[1] (Batch S0058_A_854826)
SIMCA-P+ 11 - 01.08.2009 14:42:24
Control limits
Average (signature) of all batches
New batch assessed by the model
13

© Copyright 2013 OSIsoft, LLC.
Statistical Process Control BATCH CONTROL CHART
-9
-8
-7
-6
-5
-4
-3
-2
-1
0
1
2
-100 0 100 200 300 400 500 600 700 800 900 1000 1100 1200 1300 1400 1500 1600 1700 1800 1900 2000 2100 2200 2300 2400 2500 2600 2700
t[1]
$Time (smoothed)
Model Data Ciclo - Oct 2010 v5.M2:16Scores [comp. 1] (Aligned)
+3 Std.Devt[1] (Avg)-3 Std.Devt[1] (Aligned): 635
SIMCA-P+ 11 - 14.03.2011 17:53:19
0.0
0.1
0.2
0.3
0.4
0.5
0.6
0.7
0.8
0.9
1.0
8400 8500 8600 8700 8800 8900 9000 9100 9200 9300 9400 9500 9600 9700 9800 9900 10000 10100
Num
Variable, Batch: 617, Phase: 16-15.4122 * 543071TT--607 - 15.4122-2.84936 * 543071TT--600 - 2.849360.00281207 * 543071PT--644 + 0.00767695-1.10938 * 543071TT--602 - 1.109380.00826856 * 543071-Acetone_43x10e13
SIMCA-P+ 11 - 09.03.2011 19:17:38
Batch Process
Signature
average of all batches control limits (± 3σ from avg.)
-20
-10
0
10
20
-80 -70 -60 -50 -40 -30 -20 -10 0 10 20 30 40 50 60 70 80
t[2]
t[1]
Model Data Ciclo - Oct 2010 v5 - batch level (scores).M2 (PCA-X)t[Comp. 1]/t[Comp. 2]
R2X[1] = 0.873728 R2X[2] = 0.0564179 Ellipse: Hotelling T2 (0.95)
612
614 615
616
617
618
619
620
621
622
623
624625
626 627
628
633
634
630
631
632
636637
638
635
639
641
SIMCA-P+ 11 - 10.03.2011 19:27:42
14

© Copyright 2013 OSIsoft, LLC. 15

© Copyright 2013 OSIsoft, LLC.
Work and Data flow For Method Development
All Process Parameters
Observation Level
Batch Level
Final Model
Individual Probes
Individual Probes …
Reduction of Dimensionality
0
1
2
3
4
5
6
7
8
9
10
11
12
13
14
320 330 340 350 360 370 380 390 400 410 420
Num
Recorded Process Parameter during granulationObsID(Obs ID ($PhaseID))Mixer Power rate of change precss variable0.01 * Mixer torqute process variable0.1 * Mixer speed process variable0.1 * Product temperature process variableMixer power process variavle (electrical)
Aims: - Creation of batch signature - Identify correlation patterns
16

© Copyright 2013 OSIsoft, LLC.
Work and Data flow For Routine Use in Production
Identification of responsible Parameter(s)
Observation Level
Batch Level
SIMCA-online
Investigation on process data …
Aims: - Conformity check - Real time release testing - Trend analysis - Root cause analysis -2
-1
0
1
2
Flo
w li
quid
feed
Mix
er
Pow
er
Rate
Mix
er
pow
er
Mix
Pow
er
(calc
ula
ted)
Mix
er
Torq
ue
Liq
uid
feed p
um
p s
peed
Bow
l Pre
ssure
Mix
er
Speed
Chopper
Speed
Pro
duct T
em
pera
ture
Bow
l Tem
pera
ture
Tota
l Liq
uid
Added
Score
Contr
ibP
S(S
0007_B
_854825:1
5.7
895 -
Avg:1
5.7
895),
Weig
ht=
p1
Var ID (Primary)
PO_WST10332_EXJADE_GRAN_Steintraining.M2:7, PS-ComplementoryScore Contrib PS(S0007_B_854825:15.7895 - Avg:15.7895), Weight=p[1]
Mis
sin
g
SIMCA-P+ 11 - 08.02.2009 17:17:00
-40
-20
0
20
40
60
80
100
120
0 10 20 30 40 50
$Time (normalized)
PO_WST10332_EXJADE_GRAN_Steintraining.M2:7Predicted Liquid feed pump speed
+3 Std.DevXVar(Liquid feed pump speed) (Aligned) (Avg)-3 Std.DevXVarPS(Liquid feed pump speed) (Batch S0007_B_854825)
SIMCA-P+ 11 - 08.02.2009 17:17:46
-180
-160
-140
-120
-100
-80
-60
-40
-20
0
20
40
-20 -10 0 10 20 30 40 50 60 70 80 90 100 110 120
tPS
[2]
tPS[1]
PO_WST10332_EXJADE_GRAN_Steintraining - batch level (scores).M1 (PCA-X), All Batches, PS-ComplementorytPS[Comp. 1]/tPS[Comp. 2]
R2X[1] = 0.402627 R2X[2] = 0.341738 Ellipse: Hotelling T2PS (0.95)
S0006_A_85S0007_A_85S0007_B_85
S0006_A_85S0006_B_85
S0007_A_85S0007_B_85S0008_A_85
S0008-B_85S0009_A_85S0009_B_85
S0010_A_85S0010_B_85S0011_A_85S0011_B_85
S0012_A_85S0012_B_85S0014_A_85S0014_B_85S0018_A_85S0018_B_85S0019_A_85S0019_B_85S0021_A_85S0021-B_85
S0022_A_85S0022_B_85S0023-A_85S0023-B_85S0024-A_85S0006_B_85S0025_A_85S0025_B_85S0026_A_85S0026_B_85S0027_A_85S0027_B_85S0028_A_85
S0028-B_85
S0029-A_85S0029-B_85S0030-A_85S0030_TEILS0031_A_85S0031_B_85S0032_A_85S0032_B_85S0033_A_85S0033-B_85S0034_A_85S0034_B_85S0035_A_85S0035_B_85S0037_A_85S0037_B_85S0039_A_85S0039_B_85
S0040_A_85S0040_B_85S0041_A_85S0041_B_85S0042_A_85S0042_B_85S0043_A_85
S0044_A_85S0044_B_85S0045_A_85S0045_B_85S0046_A_85S0046_B_85S0047_A_85S0047_B_85S0048_A_85S0048_B_85
SIMCA-P+ 11 - 08.02.2009 17:15:01
Increase of level of detail 17

© Copyright 2013 OSIsoft, LLC.
MVDA applied to granulation Example for a qualitative model used for MSPC
• High Shear Granulation (Production Scale) • Four phases
– Dry Mixing – Wet mixing – Water addition – Granulation
• Variables – Power consumption and torque – Product temperatures – Granulator and chopper speed – Pump properties and flow parameters
18

© Copyright 2013 OSIsoft, LLC.
Key consideration for method development • Which observations should be included ?
– Sufficient number of batches to cover natural variability – DoE Data for special cause variations – Exclusion of anomalous, unsteady, discontinuous data (spikes)
• Which variables should be included ? – Exclusion of variables with no impact and low reliability – Weighting and transforming of variables – How many scores should be considered
• Data alignment and synchronization – Definition of start/stop conditions and phases – Merger of variables with different acquisition rates – Normalization of time based maturity variables vs. absolute time
19

© Copyright 2013 OSIsoft, LLC.
Granulation Process Data Setup
Granulation process Variable initial conditions : • Amount of granulation liquid • Granulation time time
1. Power consumption 2. Power consumption rate 3. Torque 4. Product Temperature 5. Mixer Speed 6. Chopper Speed 7. Water addition rate 8. Flow Liquid Speed 9. Liquid Speed Pump
IPC results: • LOD • PSD
Input: Initial conditions
Output: Quality Attributes
X0
X(t)
Y
Dry Mixing Water Addition Kneading
20

© Copyright 2013 OSIsoft, LLC.
Example Granulation Results of DoE investigation
§ Different phases during granulation are monitored § Process variability are reflected by the red lines § Clustering of DoE batches can be visualised § Common cause vs. special cause variation
-6
-4
-2
0
2
4
6
-12 -11 -10 -9 -8 -7 -6 -5 -4 -3 -2 -1 0 1 2 3 4 5 6 7 8 9 10 11 12
t[2]
t[1]
R2X[1] = 0.494965 R2X[2] = 0.151559 Ellipse: Hotelling T2 (0.95)
S0010-B
S0011-AS0011-B
S0012-AS0012-B
S0013-AS0013_BS0014_A
S0014_B
S0015-A
S0015_B
S0016-AS0016-B
S0009A_
S0009B_S0010A_
SIMCA-P+ 11 - 03.08.2008 17:12:10
21

© Copyright 2013 OSIsoft, LLC. 22
Loadings Identification of process parameters contributing to process variability
-0.5
-0.4
-0.3
-0.2
-0.1
-0.0
0.1
0.2
0.3
0.4
0.5
-0.1 0.0 0.1 0.2 0.3 0.4 0.5 0.6
p[2]
p[1]
Loadings of Granulation Models
R2X[1] = 0.401621 R2X[2] = 0.318985
Flow Liquid Feed
Mixer Power Rate
Mixer Power
Mixer Power (calculaMixer Torque
Liquid Pump Speed
Bowl Pressure
Mixer SpeedChopper Speed
Product TemperatureBowl Temperature
Liquid Added
SIMCA-P+ 11 - 04.01.2010 18:07:36
§ Which parameters are most influential? § How do the variables correlate to each other?

© Copyright 2013 OSIsoft, LLC.
First experience in production Preventive maintenance
-10
0
10
20
30
-20 -10 0 10 20
t[2]
t[1]
PO_WST10332_EXJADE_GRAN_V1 - Batch Level scores: t[1]/t[2]
Ellipse: TCrit (95%) = x²/19.9118² + y²/17.1288² = 1
S0075_B_854826
S0064_A_854826
S0075_A_854826S0075_B_854826
S0063_B_854826
S0068_B_854826
S0072_A_854826S0069_B_854826S0072_B_854826
S0080_A_854826
S0073_A_854826
S0083_B_854826
S0067_B_854826
S0066_B_854826
S0065_A_854826
S0073_B_854826
S0063_B_854826
S0071_B_854826
S0071_A_854826
S0064_B_854826S0066_A_854826
S0074_A_854826S0068_A_854826
S0084_A_854826
S0067_A_854826
SIMCA-Batch On-Line View 2.2 - 01.08.2009 16:58:57
Last campaign This campaign Last batch after liquid feed tube change
23

© Copyright 2013 OSIsoft, LLC.
Root cause analysis Liquid feed pump speed trajectory during the latest 2 campaigns
24

© Copyright 2013 OSIsoft, LLC.
Root Cause: Worn out liquid feed tube
25
By replacing the tube # batches were saved. $ XXXXXXX saved

© Copyright 2013 OSIsoft, LLC.
Cell cultivation process • Motivation: established process, not fully characterized,
most of process understanding based on experience • Modeling: > 80 DS batches, fully meeting release
specifications but some variability in main fermentation yield is observed
• Defined reference (golden) batches, i.e. batches which provided the highest total amount of antibody during cell culture
26

© Copyright 2013 OSIsoft, LLC.
-12
-10
-8
-6
-4
-2
0
2
4
6
0 1 2 3 4 5 6 7 8 9 10 11 12 13 14 15 16 17 18 19 20 21 22 23 24 25 26 27 28 29 30 31 32 33 34 35 36 37 38 39 40 41 42 43 44 45tP
S[1]
DaySIMCA-P+ 12.0.1 - 2011-03-18 12:30:07 (UTC+1)
REFERENCE (i.e. avg of golden batches)
±3 sd from ref.
Statistical Process Control for cell cultivation process
0.0
0.1
0.2
0.3
0.4
0.5
0.6
0.7
0.8
0.9
1.0
0 1 2 3 4 5 6 7 8 9 10 11 12 13 14 15 16 17 18 19 20 21 22 23 24 25 26 27 28 29 30 31 32 33 34 35 36 37 38 39 40 41 42 43 44
YVar(Day) (smoothed and shifted)
Batch: 41m, Phase: main
-0.025 * XVar(VCD (cells/mL)) - 0.025 -0.38843 * XVar(Glucose (mg/L)) - 0.38843-0.233716 * XVar(Lactate (mg/L)) - 0.233716 -0.0251397 * XVar(Titer (mg/L)) - 0.0251397-0.0526316 * XVar(Luft (U/L)) - 0.0526316 -0.150825 * XVar(Spec Feed (mL/cells)) - 0.150825
SIMCA-P+ 12.0.1 - 2010-04-09 09:13:16 (UTC+1)
Perfusion Start
All the variables for each batch are summarized
into one quantity (carrier of the information) –
process signature
-10
-5
0
5
10
-20 -15 -10 -5 0 5 10 15 20
t[2]
t[1]
R2X[1] = 0.430057 R2X[2] = 0.145144 Ellipse: Hotelling T2 (0.95) SIMCA-P+ 12.0.1 - 2011-05-21 15:42:07 (UTC+1)
27

© Copyright 2013 OSIsoft, LLC.
Improve Process Understanding Compared the other batches (“non-golden“) against the “golden” to establish which are the variables responsible for the observed differences
-12
-10
-8
-6
-4
-2
0
2
4
6
0 1 2 3 4 5 6 7 8 9 10 11 12 13 14 15 16 17 18 19 20 21 22 23 24 25 26 27 28 29 30 31 32 33 34 35 36 37 38 39 40 41 42 43 44 45
tPS[
1]
DaySIMCA-P+ 12.0.1 - 2011-03-18 12:22:40 (UTC+1)
-2.0-1.5-1.0-0.50.00.51.01.52.0
VCD
(1E5
cells
/mL)
Viab
ility (
%)
Med
ium
Fee
ding
Rat
e (K
g/24
h)
Wei
ght (
kg)
D M
ediu
m F
eed
Exch
ange
rate
(1/2
4h)
Gluc
ose
Con
c (m
g/L)
Lacta
te C
onc (
mg/
L)
NH4+
Con
c (m
g/L)
LDH
Conc
(U/L
)
pH
Scor
e Co
ntrib
utio
n
Var ID (Primary)SIMCA-P+ 12.0.1 - 2011-04-29 18:06:16 (UTC+1)
3 sd from ref.
28

© Copyright 2013 OSIsoft, LLC.
MVDA learning • Generated useful process knowledge
– Enhanced process understanding supported by data – Improved process consistency
• Established key parameters for cell cultivation – medium feeding rate – inoculation cell density – cells aeration
• No correlation between cell behavior and DS quality attributes
-10
-5
0
5
10
-20 -15 -10 -5 0 5 10 15 20
tPS[2]
tPS[1]
R2X[1] = 0.430057 R2X[2] = 0.145144 Ellipse: Hotelling T2 (0.95)
golden non-golden
SIMCA-P+ 12.0.1 - 2011-05-21 15:45:20 (UTC+1)
29

© Copyright 2013 OSIsoft, LLC.
Petter Moree [email protected] Director, Global Product Manager Umetrics
30

Brought to you by
© Copyright 2013 OSIsoft, LLC.