Embed Size (px)
Citation preview
ab
UBS Investment ResearchEconomic Insights – By George The Credit Cycle and Liquidity: Have we arrived at a Minsky Moment? Credit is a system whereby a person who cannot pay gets another person who cannot pay to guarantee that he can pay. (Charles Dickens) March 2007
George Magnus, Senior Economic [email protected] Tel. +44-20-7568 3322
This report has been prepared by UBS Limited ANALYST CERTIFICATION AND REQUIRED DISCLOSURES BEGIN ON PAGE 20 UBS does and seeks to do business with companies covered in its research reports. As a result, investors should be aware that the firm may have a conflict of interest that could affect the objectivity of this report. Investors should consider this report as only a single factor in making their investment decision.

Economic Insights 6 March 2007
UBS 2
Contents Contents 2 The Credit Cycle and Liquidity: Have we arrived at a Minsky Moment? 3 Credit demand, credit supply – good times, bad times 3 Some perspectives on liquidity and stability 5 A Minsky moment 6 Been there before but now? 8 Liquidity matters and measures 9 Excess money view is opaque 10 Credit, including financial, is more important 11 Global liquidity – still a reliable indicator 15
Economic Insights 6 March 2007
UBS 3
The credit cycle and liquidity: Have we reached a ‘Minsky moment’? It’s not possible to discuss the global economy and investment strategy without the obligatory references to liquidity. With this come insights or conventional wisdoms about leverage, volatility and risk premiums, and the recent tremors in markets associated with a combination of concerns about US housing finance and recession risks and China’s stock market have made the discussion all the more poignant. Although the links to market and balance sheet liquidity are important, this paper is mainly about liquidity in the macro sense and in the context of a very mature credit cycle. The key question is whether we have arrived at the point where fundamental instability is setting in, triggering demands for lower interest rates in due course. We can call this a ‘Minsky moment’ (after the economist Hyman Minsky) and for those unfamiliar with him and his work, all will be revealed below.
Credit difficulties in the US sub prime real estate market are the topic du jour along with concerns that they will spill over into the broader economy and even go cross-border. According to the Urban Institute, sub prime originations reached a record USD625bn in 2005, equivalent to 20% of the total, up from less than 10% in 2001 and 5% ten years ago. Although they are said to account for about 7% of the total mortgage stock, definitional issues can easily raise this proportion to nearer 11-12%. In the last 3-4 months, the price of buying credit default swap protection in the riskiest tranche of sub prime assets has soared sixfold, about 21 sub prime originators (so far) have closed and one major bank participant has been forced to announce large redundancies. The impact of the re-set of adjustable rate mortgages in this sector in the wake of the 4.25% rise in short rates since June 2004 has clearly been as bad as, if not worse than, the housing bears thought it might be. There’s little question that an already cautious banking sector is going to continue to reduce the supply of mortgage credit for the foreseeable future. What does this mean for general credit production and credit protection systems, and does this mean that the US now faces the end of a long-running credit cycle with contagion risks into the rest of the economy and into other countries and asset markets?
Credit demand, credit supply – good times, bad times Credit ‘moments’ like this tend to come as a bolt out of the blue and sometimes at the best of economic times, not the worst. Recall, for example, that the Long-Term Capital Management and Russia crises occurred against a background of buoyant GDP growth – over 4% in the US and 3% in the wider OECD area. Sometimes the LTCM and Russian crises are cited as the dogs that didn’t bite, for there was no economic contraction until 2001, and then for quite different reasons. The credit controls crisis of 1980-81 and the Savings and Loan (S&L) crisis of the late 1980s are cited as the ones that did. Credit controls were in place for less than 4 months in 1980 but produced a sharp recession, and the prelude to the S&L crisis comprised funding and maturity mismatches that were the result of restrictive monetary policy and then still-regulated mortgage
Liquidity focus has many angles: this one is mainly on macro and on whether we are close to a major ‘credit event’
US sub prime credit difficulties have been the catalyst
Credit events are rare and can happen as easily in good times as bad
Economic Insights 6 March 2007
UBS 4
lending. In both cases – and unlike the 1998 examples – the decisive issue seems to have been credit supply restraint. And, apropos, the deflationary scare of 2002-03 was the product of an investment bust, following the collapse of the return on capital and in profits. But here too, Fed tightening and unwarranted restraints over credit supply were key factors.
Credit demand has rarely been the instigator of or catalyst for economic contraction. Mostly, causality works the other way. There may be many reasons why the demand for credit tends to be relatively inelastic with respect to interest rates, except in extreme circumstances. Meantime, who could argue that credit supply has received an almost perpetual boost for the last 25 years as a result of financial innovation, deregulation and the broadening of lender-of-last resort functions of the Federal Reserve and other central banks? Past developments in the US sub prime housing market and those still at work in the private equity and merger and leveraged-buyout funding sectors certainly represent just the latest examples of structures that have sought, via leverage, to expand credit supply.
So here’s the bottom line. The chances of a sudden and damaging contraction in credit demand would seem to be rather low in the absence of much tighter monetary policy. In the US, at least, this isn’t expected at all. And even if and as credit demand slows down, this wouldn’t normally signify economic contraction. Of course, in every recession, credit demand has fallen but credit demand ebbs and flows without recessions most of the time. The more significant concern is credit supply. Before the 1980s, domestic financial institutions were restrained and regulated. After WWII, this sector’s liabilities accounted for rarely more than 2-3% of GDP, and by the early 1980s they were still only 20%. This was followed by the 25-year surge that raised the sector’s liabilities to 103% of GDP by the end of 2006. Undoubtedly this has contributed at times to more prolonged periods of financial stability. But equally, it has to be feared that it has occasionally been – and currently might be – the source of exactly the opposite.
US economic growth has slowed already to a little above a 2% rate, and most forecasters think the weakness will persist or deteriorate further. Curiously, the latest data reveal that the freefall in residential capital spending has been joined by non-residential investment weakness, but disposable income and consumer spending growth, so far at least, have been resilient. For a long time the US economy has defied the credit cycle bears. Rapidly rising debt as a share of GDP and personal income has proceeded apace without incurring the ‘inevitable’ consumer and economic stall or contraction. One imagines that for the most part this has been because of rare concerns over credit supply. But the mirror image of this may now be more conceivable, namely that credit restraints that spurred economic weakness or a recession would give rise to an aggravation of credit risk, a downturn in the credit cycle and a negative feedback loop with the economy.
With deteriorating credit quality here and there, higher or still-rising interest rates and central banks worrying about the accumulation of credit and leverage
But credit supply is the main issue, i.e. it’s more volatile than demand, has received a sustained boost for 20 years and might also be our Achilles’ heel
And the share of financial sector debt in GDP has risen 5-fold since 1982
The consensus view on the US economy raises the prospect of negative feedback loops between credit quality, risk and growth
Economic Insights 6 March 2007
UBS 5
in places that they can’t or don’t control, we can wonder if the time for a ‘credit moment’ has come.
In terms of a conclusion – if ‘conclusion’ is the right word – then it is first that the risk of credit or liquidity events is not only high in the obvious places but is liable to rise elsewhere too, though, interestingly, it hasn’t yet in the company sector as a whole (see for example, UBS Global Credit Strategy, 28 February 2007 by George Bory, Tommy Leung and Matthew Gelb). In the US, as elsewhere, this sector still enjoys, by and large, solid balance sheets, excess cash and more or less full funding. Leverage is starting to rise, but in and of itself this is not a negative. Rather, the macro risks would seem to lie in the household and financial sectors, and the market risks, as ever, in the mis-pricing of credit, especially in structures with high leverage, transparent or otherwise.
And secondly, it is that the risk of wider macroeconomic fallout would depend on three things. First, on whether credit events encourage financial institutions to become ultra-conservative in their lending behaviour. Secondly, on whether and how the Fed and other central banks might act to lower interest rates and provide monetary liquidity if market liquidity conditions become more turbulent and/or dry up. Thirdly, on the durability of global monetary arrangements. These are characterised by an abundance, not shortage, of liquidity, and by the willingness of the participants to recycle smoothly savings excesses and deficiencies (savings and debt simply being opposite sides of the same coin). While judgement as regards the first of these factors is highly subjective and difficult, the second gives us some cause to trust that the credit cycle has further to run. But, strong as global reserves growth has been, it’s possible we are within sight of ‘Peak Reserves’, as will be explained below.
Some perspectives on liquidity and stability An endgame in which credit expansion stalls or contracts, perhaps violently and with or without rising interest rates, is no fantasy. Current concerns over mortgage financing, China and US growth may come and go in the next several weeks but they constitute a marker in the broader context of the credit and liquidity cycle. There are at least three major reasons to care:
First, historically, it is of great interest because of examples in our economic and financial history when low or inadequate pricing for risk was overwhelmed by extraordinary and not always unexpected events. Professor Niall Ferguson of Harvard has written extensively on this subject, including a very recent historical-cum-contemporary perspective, When a Black Swan Lands on Lake Liquidity: The Lessons of 1914 Revisited (Niall Ferguson, published in Drobny Global Monitor, 17 January 2007).
Secondly, generally, because leverage and liquidity phenomena can all be measured today in terms of extremes, they matter to all asset markets and investment strategies. A useful, if slightly dated, analysis looking at the empirical evidence of the impact of global liquidity on asset prices and via cross-border spillover effects is an IMF working paper, Global Liquidity and Asset Prices: Measurement, Implications and Spillovers (Klaas Baks and Charles Kramer, IMF, WP/99/168, December 1999). Most major central banks
Companies are in good shape, so the major risks lie in the household and financial sectors
Any macro fallout would depend on credit events, Fed reactions and the durability of global monetary arrangements, but we may be close to ‘Peak Reserves’ in terms of growth
History says don’t be complacent
Extreme measures of liquidity and leverage say be careful
Economic Insights 6 March 2007
UBS 6
and the BIS, as is well known, have expressed concerns about excess liquidity and the implications for asset prices and financial stability.
And thirdly, currently, developments in the US real estate market have served up a chilling reminder about just how bad things can get. While many analysts and commentators are drawing attention to a multitude of the ‘explosive’ characteristics of the mortgage and derivative markets, a well researched backdrop to current housing issues can be found in a paper, Mortgage Payment Reset: The Rumour and The Reality (Christopher L. Cagan, First American Real Estate Solutions, 8 February 2006) – even though it doesn’t tell us of course how events can be expected to unfold.
Notwithstanding these insights and the wisdom of those who, over time, have opined about the interplay between economies and financial systems – Irving Fisher, Keynes, John Kenneth Galbraith to name but three – cast your mind back less than 2 years to the words of one Alan Greenspan, who, referring to the fall in term premiums, said:
“…risk takers have been encouraged by a perceived increase in economic stability to reach out to more distant time horizons. These actions have been accompanied by significant declines in measures of expected volatility in equity and credit markets inferred from prices of stock and bond options and narrow credit risk premiums. History cautions that long periods of relative stability often engender unrealistic expectations of its permanence and, at times, may lead to financial excess and economic stress.” (Testimony before the Committee on Financial Services, US House of Representatives, 20 July 2005)
If these words struck a chord in 2005, they should probably do so with gusto in 2007. Greenspan didn’t specifically refer to Hyman Minsky but he could have done. From the Medicis to date, we have experienced periods of financial instability traced to debt accumulation, and Minsky was particularly intrigued by the recurring fragility of financial structures: economic stability begets speculation, which begets a rift between asset prices and output prices, which begets economic volatility, credit contraction and the need for central bank intervention. So, before we move on, what is a ‘Minsky moment’?
A Minsky moment Hyman Minsky was an American economist in the Keynesian tradition, who died in 1996, aged 77. For the last 6 years of his life, he was Distinguished Scholar at the Jerome Levy Economics Institute. His research specialty was the relationship between debt and the economy. He was no hair-shirt economist, believing in the sanctity of budget surpluses and clean balance sheets. On the contrary, he believed that, to a degree, the creation and acquisition of debt were essential. The value he brought to our understanding of the world was how the existence of economic stability itself encourages and nurtures excessive credit creation, leading to, first, financial instability and speculative euphoria, then credit restraint and contraction and, finally, economic contraction and volatility. Minsky argued these swings are an integral part of the business cycle and, in the circumstances of his time, forewarned that the great financial deregulation of the
And sub prime shows how bad things can get, and how fast
Plenty of scribes have warned about financial excesses
…including our contemporary, Alan Greenspan
But Minsky was the man….
The origins of financial instability
Economic Insights 6 March 2007
UBS 7
1980s (presumably he’d have said the same about initiatives after his time) would eventually encourage greater financial instability.
Minsky described how, in his lifetime, more prolonged periods of stability were becoming normal, notwithstanding the historical evidence that such periods come and go. In the US, there were 8 recessions from 1947 to 1982, the last being the worst of them, both in the US and in the world as a whole. Since then, there have been 2, both of them short-lived and relatively minor. In fact, economic stability has become an accepted mantra. According to the US Bureau of Economic Analysis, economic volatility, measured as the standard deviation of quarterly annualised GDP growth rates, fell from about 4 from 1959-1989 to 2.2 from 1990 to date. The volatility of consumption, representing over 70% of GDP, fell from about 3 to 1.9. The essential characteristic of economic stability from Minsky’s point of view is that debt becomes increasingly easy to validate. In other words, it encourages leverage and, sooner or later, new and more ambitious debt structures.
Minsky called these financial structures hedge, speculative and Ponzi (so-called after Carlo Ponzi who created and was ruined by a pyramid finance scheme in Boston in 1920). The more the economy moves from hedge finance towards Ponzi finance, the greater the susceptibility to instability.
Hedge financial structures have debt that is typically a small proportion of liabilities and readily renewable because of the adequacy of cash flows in relation to contractual payments.
Speculative structures (including perfectly sound firms and banks) may have cash flows that aren’t large enough to meet payment commitments, even though the present value of expected cash receipts is greater than that of payment commitments. They may have to keep issuing new debt to finance maturing debt commitments.
Ponzi structures have to raise ever greater amounts of debt to finance all commitments and may not be able to repay principal or even debt service without so doing. The more inflationary an economy is, the greater the risk that rising interest rates will turn speculative structures into Ponzi structures, that these structures will ‘evaporate’ and that asset values will collapse with serious deflationary consequences and damaging implications for the economy.
So, for the purposes of this discussion, a Minsky moment would normally follow a prolonged period of rapid acceleration in debt in which more traditional and benign debt structures have increasingly turned into Ponzi-type structures. The ‘moment’, so to speak, occurs when lenders become increasingly cautious or restrictive, and when it isn’t only over-leveraged structures that encounter financing difficulties. At this juncture, the risks of systemic economic contraction and asset depreciation become all too vivid. Arguably, we were not a million miles away from such a moment in the summer of 1998 and again from the middle of 2001 and into 2002.
Prolonged economic stability – and we’ve had a lot of that – just encourages leverage that goes from benign to dangerous
Hedge structures
Speculative structures
Ponzi structures
Economic Insights 6 March 2007
UBS 8
Been there before, but now? But, almost by definition, these Minsky moments are rare and, as he himself sought to emphasise, they are the raison d’être for activist fiscal and monetary policies designed to restore stability. Looking back to the S&L crisis and 1998 and 2002, for example, we can certainly see this in the actions and the rhetoric of the Federal Reserve and other central banks and, in the case of the S&L problems, the US Congress.
At the same time, there are some very committed and widely read credit cycle bears and Minsky-moment enthusiasts who have been peddling the meltdown hypothesis for a decade or two – and not just at poignant moments but continuously, as though a Minsky moment was ever imminent. Why, despite being economically literate, have they been like the boy who cried ‘wolf’? And, do they have a point, here and now in 2007, in insisting that a liquidity blow-off is at hand?
In a very recent UBS Global Strategy Research paper, Is it all about liquidity? (Weekly Weight Watcher, 23 February 2007 by Larry Hatheway, Jenny Delaney, Ken Liew, Jeff Palmer) the authors take issue with the idea that excess liquidity is the main driver of asset prices. Their focus is specifically on asset prices today, not the global economy, the cumulative build-up of debt and the liquidity-creating properties of newer debt structures. And they ask whether current asset valuations can be explained adequately by looking beyond liquidity. They conclude that the absence of widespread mis-pricing is the best evidence that fundamentals, valuations and investor risk-return preferences remain in pole position as asset drivers.
But this is not to deny that powerful liquidity trends have been and remain at work, nor that conventional measures of macroeconomic liquidity are inadequate. So here’s the acid test. It’s not so much about valuations, per se. Rather, it’s about whether a credit or debt super-cycle, as some call it, can co-exist with moving but stable equilibria, in contrast to Minsky. After all, it is true that over the past several years, we have created not only ever larger volumes of debt and ever more complex debt structures, but greater economic stability as well – as pointed out above.
From a microeconomic and institutional standpoint, the proliferation of non-bank financial institutions, the disintermediation of traditional banks and new transactions and structures, like securitisation, have seemingly strengthened the financial system’s ability to create, absorb and sustain debt. Against this, numerous observers have focused attention on the growth in and leverage of private equity partnerships, collateralised debt and loan obligations, and leveraged and high-yield loans. Are these complex structures much more than variants of Ponzi finance? You could have a field day – but a frustrating one – tracking and tracing the structures and their relationships with conventional asset classes. Some observers simply say the contrast between low real yields and high profitability, or the divergence between the cost of and return to capital, are as much testament as you need to an abundance of liquidity.
Credit bears have been crying ‘wolf’ for ages. Could they be right now?
So can we have perpetual debt expansion along with moving but stable equilibria?
Financial innovation and the proliferation of new products and new end-owners seem to have changed debt sustainability
Economic Insights 6 March 2007
UBS 9
At the macroeconomic level, we manage enormous and seemingly perverse capital flows to counter global payments imbalances – whether via some Bretton Woods II arrangement or some variant – and these patently affect the determination of liquidity flows as well as longer-term interest rates, yield curve shapes and other asset behaviour. Similarly, in true Minsky fashion, the expansion in liquidity engineered by the Federal Reserve and other central banks after 2001 certainly imparted stability to the financial system and put the credit cycle bears on the back foot. But we can’t be sure that the very actions that brought stability in those years didn’t contain the seeds of current and future instability. It’s quite likely they have contributed to free rider or moral hazard problems now evident in some sectors in credit and currency markets.
So, is the long-run credit cycle and debt accumulation process a problem, and is it now at or any closer to an end, perhaps with the US sub prime mortgage sector as a catalyst and with potentially systemic economic consequences? Could liquidity in all its forms – macro, balance sheet and market – start to dry up, exposing not only leverage but inducing negative reactions in complex financial asset structures and prices? Do we face another Minsky moment and if so, is it localised or general and, if the latter, can we be specific about when and how we get there?
Liquidity matters and measures Excess liquidity that grows out of the credit cycle is complex and carries great weight for investors and policymakers. A technical paper, What is Global Excess Liquidity And Does It Matter? (Rasmus Rueffer and Livio Stracca, ECB Working Paper No:696, November 2006) considers both the concept of excess liquidity and the ways in which this spreads across borders, and how it affects output and prices in the global economy. But for our purposes there are two major areas that are problematic.
The first is that of measurement, which is complicated in the modern global economy. Traditional central bank high-powered money accounts for a small fraction of the main monetary and credit aggregates, and the standard broad-money-less-nominal-GDP concept fails to account for the liquidity-creating effects of modern financial innovations and credit structures. Banks play a crucial role in creating liquidity by funding illiquid loans with liquid deposits. They also create it on balance sheet by transforming assets with relatively low liquidity into liabilities with greater liquidity, and off balance sheet via loan commitments, guarantees and derivatives. One study reveals that US banks created over USD1.5 trillion in liquidity in 2003, equivalent to 22% of bank gross total assets (The Measurement of Bank Liquidity Creation and the Effect of Capital, Allen N. Berger and Christa H.S. Bouwman, available at SSRN: http://ssrn.com/abstract=672784 , September 2006). Put another way, it’s $2.50 of liquidity for every $1 of capital.
The second is that of nomenclature, for it is important to distinguish between three forms of liquidity that are often confused and used wrongly as synonyms.
How to measure liquidity
And how to define it
Economic Insights 6 March 2007
UBS 10
■ Market liquidity is simply about depth and breadth of particular markets or transactions, and about the ability to conduct normal volumes without affecting price or bid-offer spreads.
■ Balance sheet liquidity is about the relationship of cash to debt and equity. This relationship changes quite normally and predictably with the business cycle.
■ Macroeconomic or monetary liquidity is about different forms of money supply and credit that drive transactions and capital flows. Broadly speaking, this form of liquidity comprises short- to medium-term bank liabilities, which can fund trading and underwriting in securities markets.
Here, we will be concerned mainly with macro liquidity and, to a degree, with balance sheet liquidity only.
Excess money view is opaque As regards the current liquidity cycle, it might be as well to assert something straight off. Macro liquidity cycles don’t just die for no reason. They have to be brought to an end. Absurd or excessive valuations might be one reason, but the normal perpetrator is the tightening of monetary policy in response to the threat or the fact of rising inflation. So while events in the sub prime, mortgage backed and CDO markets, for example, have implications for participants, financial institutions’ and household balance sheets, they don’t necessarily stipulate the macroeconomic outcomes that could be of more concern to assets and investors generally.
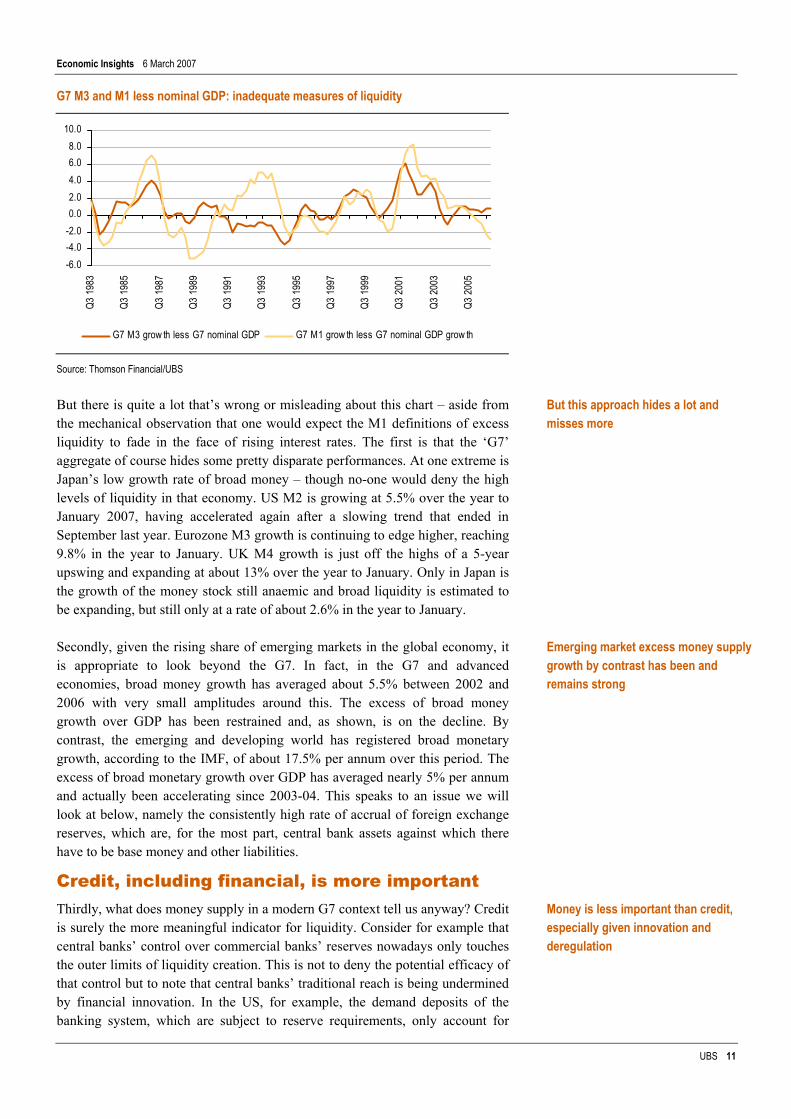
In a very traditional sense, the standard accounting for excess liquidity isn’t that persuasive. Look at both narrow and broad monetary growth rates relative to nominal GDP, for example, in the G7 economies. The underlying reasoning here is just the Quantity Theory of Money (MV=PT). Money growth times velocity has to equal nominal spending or output growth. If monetary growth and nominal GDP are out of balance in the short run, the reason is often to be found in unstable velocity. But the industry tends to look at the M’s less GDP growth as one indicator of excess liquidity or the reverse. The data, especially recently, hardly suggest an orgy of liquidity creation.
Standard practice is to look at the M’s in relation to GDP
Economic Insights 6 March 2007
UBS 11
G7 M3 and M1 less nominal GDP: inadequate measures of liquidity
-6.0-4.0-2.00.02.04.06.08.0
10.0
Q3 1
983
Q3 1
985
Q3 1
987
Q3 1
989
Q3 1
991
Q3 1
993
Q3 1
995
Q3 1
997
Q3 1
999
Q3 2
001
Q3 2
003
Q3 2
005
G7 M3 grow th less G7 nominal GDP G7 M1 grow th less G7 nominal GDP grow th
Source: Thomson Financial/UBS
But there is quite a lot that’s wrong or misleading about this chart – aside from the mechanical observation that one would expect the M1 definitions of excess liquidity to fade in the face of rising interest rates. The first is that the ‘G7’ aggregate of course hides some pretty disparate performances. At one extreme is Japan’s low growth rate of broad money – though no-one would deny the high levels of liquidity in that economy. US M2 is growing at 5.5% over the year to January 2007, having accelerated again after a slowing trend that ended in September last year. Eurozone M3 growth is continuing to edge higher, reaching 9.8% in the year to January. UK M4 growth is just off the highs of a 5-year upswing and expanding at about 13% over the year to January. Only in Japan is the growth of the money stock still anaemic and broad liquidity is estimated to be expanding, but still only at a rate of about 2.6% in the year to January.
Secondly, given the rising share of emerging markets in the global economy, it is appropriate to look beyond the G7. In fact, in the G7 and advanced economies, broad money growth has averaged about 5.5% between 2002 and 2006 with very small amplitudes around this. The excess of broad money growth over GDP has been restrained and, as shown, is on the decline. By contrast, the emerging and developing world has registered broad monetary growth, according to the IMF, of about 17.5% per annum over this period. The excess of broad monetary growth over GDP has averaged nearly 5% per annum and actually been accelerating since 2003-04. This speaks to an issue we will look at below, namely the consistently high rate of accrual of foreign exchange reserves, which are, for the most part, central bank assets against which there have to be base money and other liabilities.
Credit, including financial, is more important Thirdly, what does money supply in a modern G7 context tell us anyway? Credit is surely the more meaningful indicator for liquidity. Consider for example that central banks’ control over commercial banks’ reserves nowadays only touches the outer limits of liquidity creation. This is not to deny the potential efficacy of that control but to note that central banks’ traditional reach is being undermined by financial innovation. In the US, for example, the demand deposits of the banking system, which are subject to reserve requirements, only account for
But this approach hides a lot and misses more
Emerging market excess money supply growth by contrast has been and remains strong
Money is less important than credit, especially given innovation and deregulation
Economic Insights 6 March 2007
UBS 12
about a tenth of the total deposits of the banking system. It is essential, therefore, to take note of the growth in the significance of the non-bank financial sector.
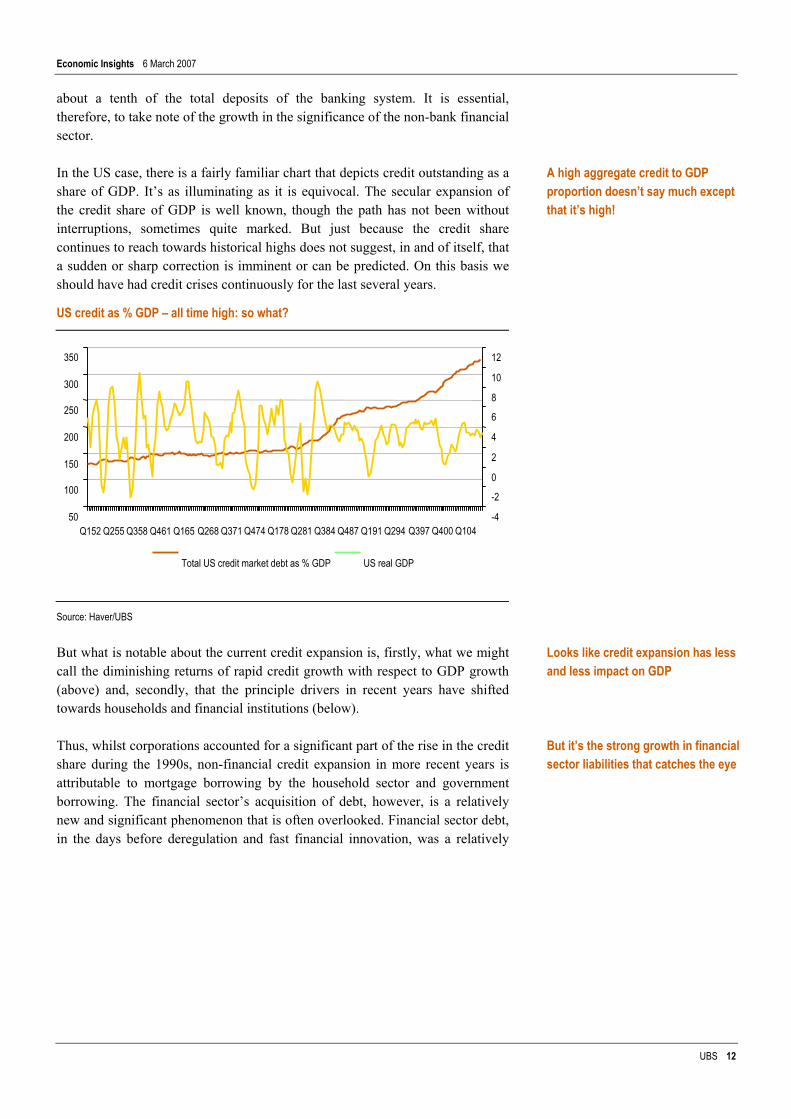
In the US case, there is a fairly familiar chart that depicts credit outstanding as a share of GDP. It’s as illuminating as it is equivocal. The secular expansion of the credit share of GDP is well known, though the path has not been without interruptions, sometimes quite marked. But just because the credit share continues to reach towards historical highs does not suggest, in and of itself, that a sudden or sharp correction is imminent or can be predicted. On this basis we should have had credit crises continuously for the last several years.
US credit as % GDP – all time high: so what?
Source: Haver/UBS
But what is notable about the current credit expansion is, firstly, what we might call the diminishing returns of rapid credit growth with respect to GDP growth (above) and, secondly, that the principle drivers in recent years have shifted towards households and financial institutions (below).
Thus, whilst corporations accounted for a significant part of the rise in the credit share during the 1990s, non-financial credit expansion in more recent years is attributable to mortgage borrowing by the household sector and government borrowing. The financial sector’s acquisition of debt, however, is a relatively new and significant phenomenon that is often overlooked. Financial sector debt, in the days before deregulation and fast financial innovation, was a relatively
A high aggregate credit to GDP proportion doesn’t say much except that it’s high!
Looks like credit expansion has less and less impact on GDP
But it’s the strong growth in financial sector liabilities that catches the eye
50
100
150
200
250
300
350
Q152 Q255 Q358 Q461 Q165 Q268 Q371 Q474 Q178 Q281 Q384 Q487 Q191 Q294 Q397 Q400 Q104-4
-2
0
2
4
6
8
10
12
Total US credit market debt as % GDP US real GDP
Economic Insights 6 March 2007
UBS 13
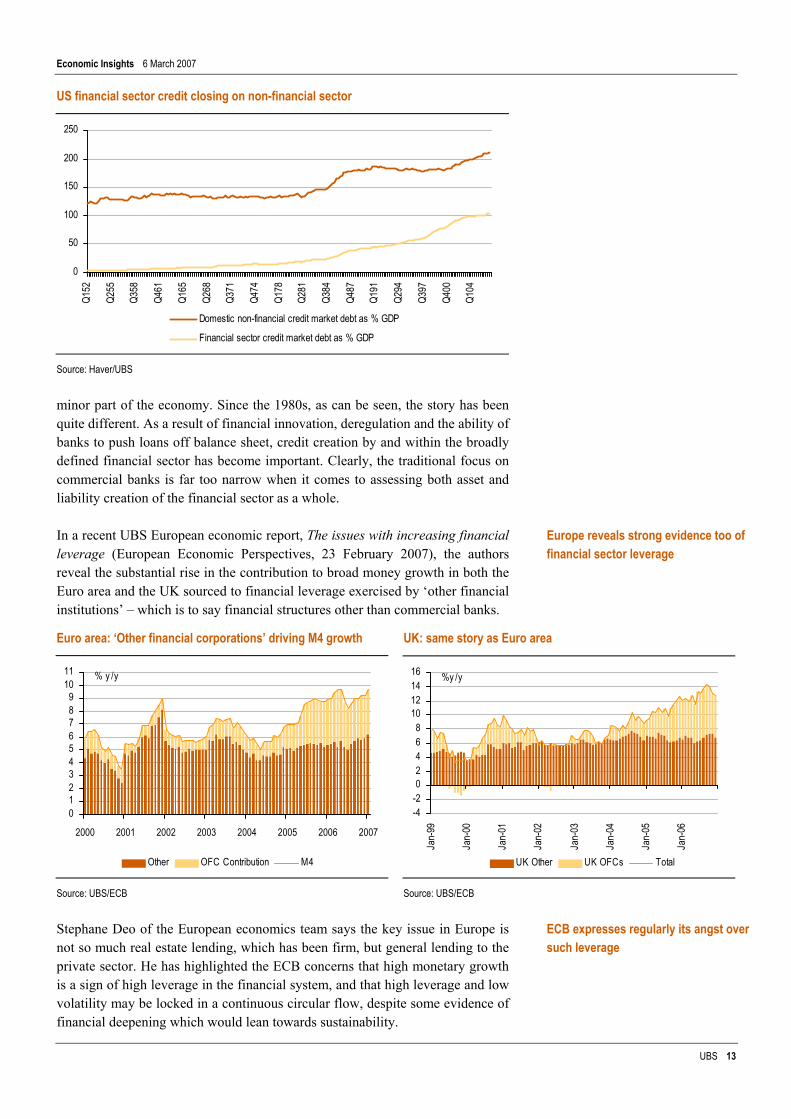
US financial sector credit closing on non-financial sector
0
50
100
150
200
250
Q152
Q255
Q358
Q461
Q165
Q268
Q371
Q474
Q178
Q281
Q384
Q487
Q191
Q294
Q397
Q400
Q104
Domestic non-financial credit market debt as % GDP
Financial sector credit market debt as % GDP
Source: Haver/UBS
minor part of the economy. Since the 1980s, as can be seen, the story has been quite different. As a result of financial innovation, deregulation and the ability of banks to push loans off balance sheet, credit creation by and within the broadly defined financial sector has become important. Clearly, the traditional focus on commercial banks is far too narrow when it comes to assessing both asset and liability creation of the financial sector as a whole.
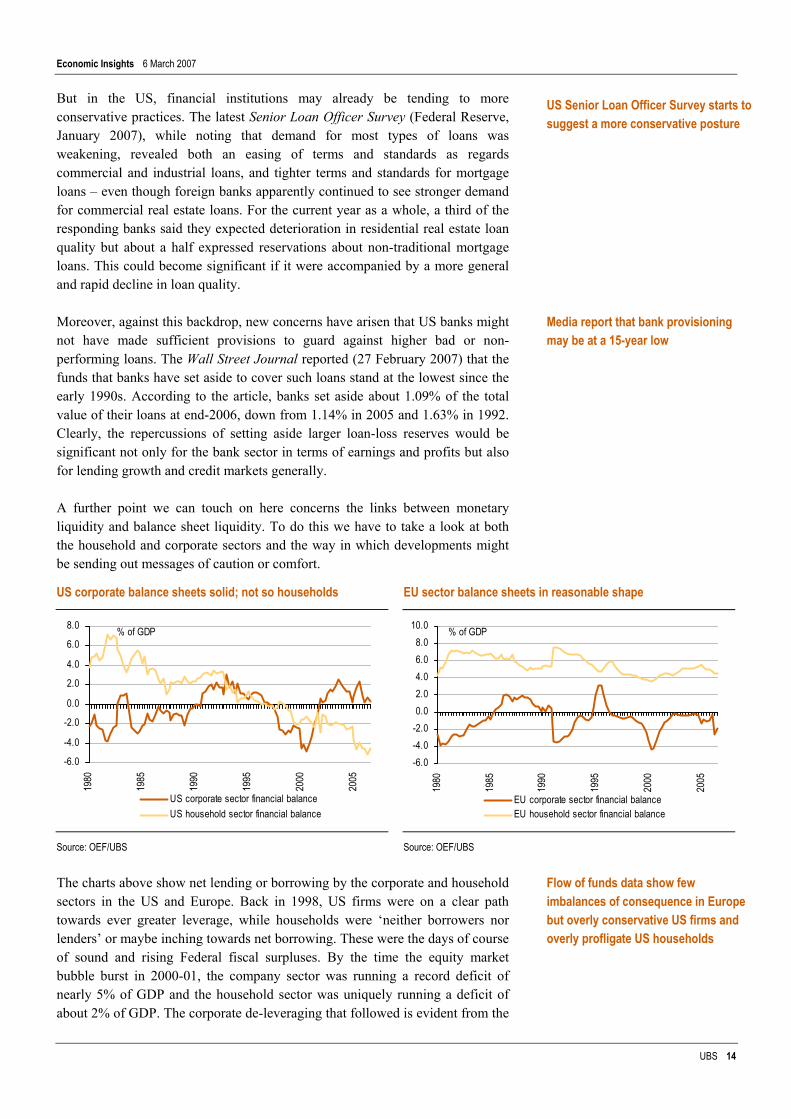
In a recent UBS European economic report, The issues with increasing financial leverage (European Economic Perspectives, 23 February 2007), the authors reveal the substantial rise in the contribution to broad money growth in both the Euro area and the UK sourced to financial leverage exercised by ‘other financial institutions’ – which is to say financial structures other than commercial banks.
Euro area: ‘Other financial corporations’ driving M4 growth UK: same story as Euro area
0123456789
1011
2000 2001 2002 2003 2004 2005 2006 2007
Other OFC Contribution M4
% y /y
-4-202468
10121416
Jan-
99
Jan-
00
Jan-
01
Jan-
02
Jan-
03
Jan-
04
Jan-
05
Jan-
06
UK Other UK OFCs Total
%y /y
Source: UBS/ECB Source: UBS/ECB
Stephane Deo of the European economics team says the key issue in Europe is not so much real estate lending, which has been firm, but general lending to the private sector. He has highlighted the ECB concerns that high monetary growth is a sign of high leverage in the financial system, and that high leverage and low volatility may be locked in a continuous circular flow, despite some evidence of financial deepening which would lean towards sustainability.
Europe reveals strong evidence too of financial sector leverage
ECB expresses regularly its angst over such leverage
Economic Insights 6 March 2007
UBS 14
But in the US, financial institutions may already be tending to more conservative practices. The latest Senior Loan Officer Survey (Federal Reserve, January 2007), while noting that demand for most types of loans was weakening, revealed both an easing of terms and standards as regards commercial and industrial loans, and tighter terms and standards for mortgage loans – even though foreign banks apparently continued to see stronger demand for commercial real estate loans. For the current year as a whole, a third of the responding banks said they expected deterioration in residential real estate loan quality but about a half expressed reservations about non-traditional mortgage loans. This could become significant if it were accompanied by a more general and rapid decline in loan quality.
Moreover, against this backdrop, new concerns have arisen that US banks might not have made sufficient provisions to guard against higher bad or non-performing loans. The Wall Street Journal reported (27 February 2007) that the funds that banks have set aside to cover such loans stand at the lowest since the early 1990s. According to the article, banks set aside about 1.09% of the total value of their loans at end-2006, down from 1.14% in 2005 and 1.63% in 1992. Clearly, the repercussions of setting aside larger loan-loss reserves would be significant not only for the bank sector in terms of earnings and profits but also for lending growth and credit markets generally.
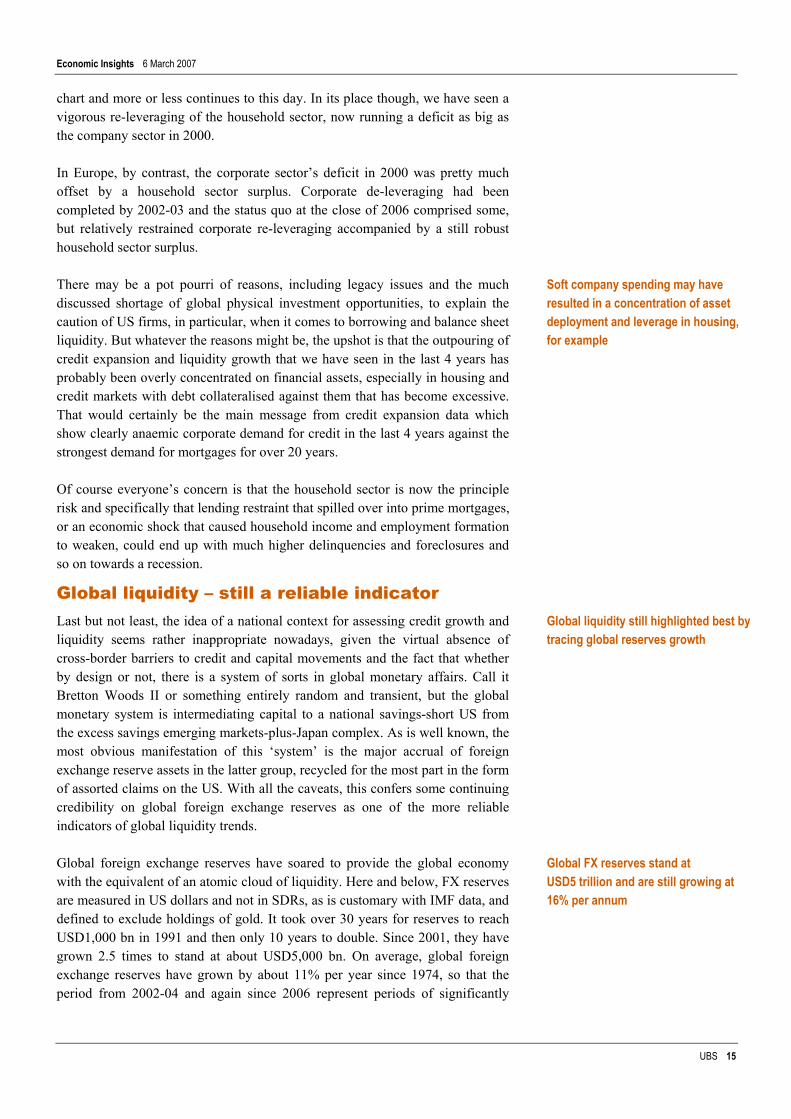
A further point we can touch on here concerns the links between monetary liquidity and balance sheet liquidity. To do this we have to take a look at both the household and corporate sectors and the way in which developments might be sending out messages of caution or comfort.
US corporate balance sheets solid; not so households EU sector balance sheets in reasonable shape
-6.0
-4.0
-2.0
0.0
2.0
4.0
6.0
8.0
1980
1985
1990
1995
2000
2005
US corporate sector financial balance US household sector financial balance
% of GDP
-6.0-4.0-2.00.02.04.06.08.0
10.0
1980
1985
1990
1995
2000
2005
EU corporate sector financial balance EU household sector financial balance
% of GDP
Source: OEF/UBS Source: OEF/UBS
The charts above show net lending or borrowing by the corporate and household sectors in the US and Europe. Back in 1998, US firms were on a clear path towards ever greater leverage, while households were ‘neither borrowers nor lenders’ or maybe inching towards net borrowing. These were the days of course of sound and rising Federal fiscal surpluses. By the time the equity market bubble burst in 2000-01, the company sector was running a record deficit of nearly 5% of GDP and the household sector was uniquely running a deficit of about 2% of GDP. The corporate de-leveraging that followed is evident from the
US Senior Loan Officer Survey starts to suggest a more conservative posture
Media report that bank provisioning may be at a 15-year low
Flow of funds data show few imbalances of consequence in Europe but overly conservative US firms and overly profligate US households
Economic Insights 6 March 2007
UBS 15
chart and more or less continues to this day. In its place though, we have seen a vigorous re-leveraging of the household sector, now running a deficit as big as the company sector in 2000.
In Europe, by contrast, the corporate sector’s deficit in 2000 was pretty much offset by a household sector surplus. Corporate de-leveraging had been completed by 2002-03 and the status quo at the close of 2006 comprised some, but relatively restrained corporate re-leveraging accompanied by a still robust household sector surplus.
There may be a pot pourri of reasons, including legacy issues and the much discussed shortage of global physical investment opportunities, to explain the caution of US firms, in particular, when it comes to borrowing and balance sheet liquidity. But whatever the reasons might be, the upshot is that the outpouring of credit expansion and liquidity growth that we have seen in the last 4 years has probably been overly concentrated on financial assets, especially in housing and credit markets with debt collateralised against them that has become excessive. That would certainly be the main message from credit expansion data which show clearly anaemic corporate demand for credit in the last 4 years against the strongest demand for mortgages for over 20 years.
Of course everyone’s concern is that the household sector is now the principle risk and specifically that lending restraint that spilled over into prime mortgages, or an economic shock that caused household income and employment formation to weaken, could end up with much higher delinquencies and foreclosures and so on towards a recession.
Global liquidity – still a reliable indicator Last but not least, the idea of a national context for assessing credit growth and liquidity seems rather inappropriate nowadays, given the virtual absence of cross-border barriers to credit and capital movements and the fact that whether by design or not, there is a system of sorts in global monetary affairs. Call it Bretton Woods II or something entirely random and transient, but the global monetary system is intermediating capital to a national savings-short US from the excess savings emerging markets-plus-Japan complex. As is well known, the most obvious manifestation of this ‘system’ is the major accrual of foreign exchange reserve assets in the latter group, recycled for the most part in the form of assorted claims on the US. With all the caveats, this confers some continuing credibility on global foreign exchange reserves as one of the more reliable indicators of global liquidity trends.
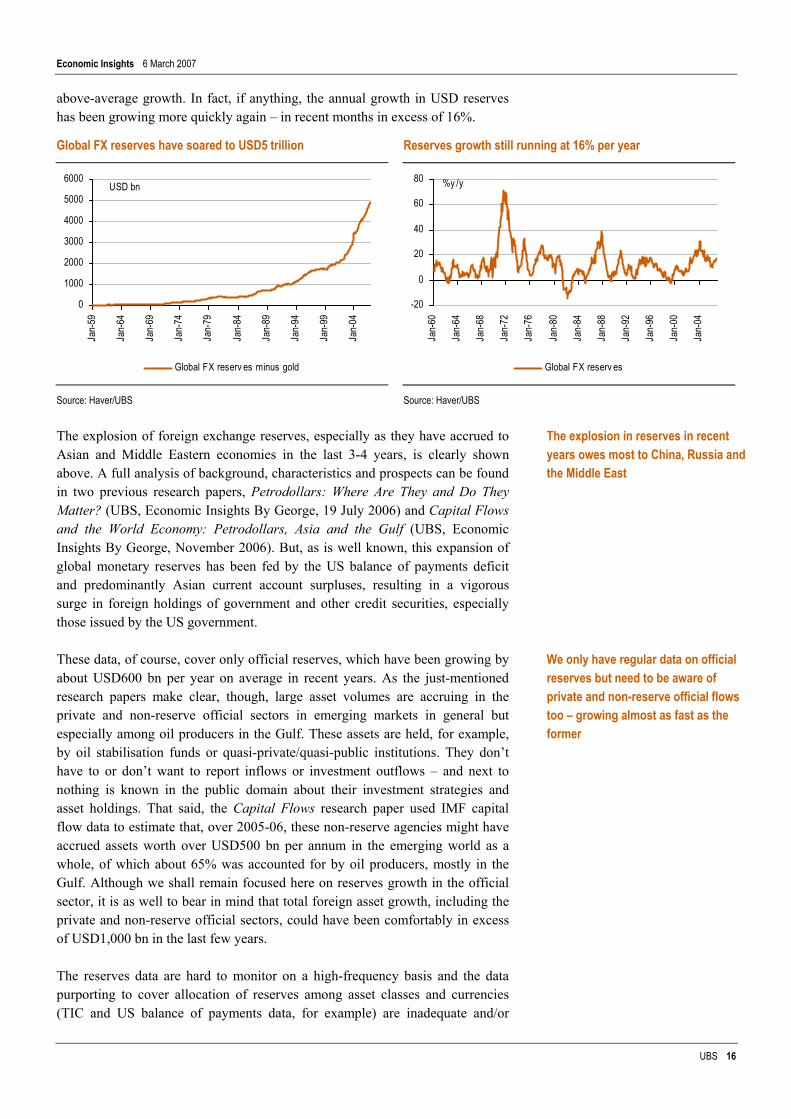
Global foreign exchange reserves have soared to provide the global economy with the equivalent of an atomic cloud of liquidity. Here and below, FX reserves are measured in US dollars and not in SDRs, as is customary with IMF data, and defined to exclude holdings of gold. It took over 30 years for reserves to reach USD1,000 bn in 1991 and then only 10 years to double. Since 2001, they have grown 2.5 times to stand at about USD5,000 bn. On average, global foreign exchange reserves have grown by about 11% per year since 1974, so that the period from 2002-04 and again since 2006 represent periods of significantly
Soft company spending may have resulted in a concentration of asset deployment and leverage in housing, for example
Global liquidity still highlighted best by tracing global reserves growth
Global FX reserves stand at USD5 trillion and are still growing at 16% per annum
Economic Insights 6 March 2007
UBS 16
above-average growth. In fact, if anything, the annual growth in USD reserves has been growing more quickly again – in recent months in excess of 16%.
Global FX reserves have soared to USD5 trillion Reserves growth still running at 16% per year
0
1000
2000
3000
4000
5000
6000
Jan-
59
Jan-
64
Jan-
69
Jan-
74
Jan-
79
Jan-
84
Jan-
89
Jan-
94
Jan-
99
Jan-
04Global FX reserv es minus gold
USD bn
-20
0
20
40
60
80
Jan-
60
Jan-
64
Jan-
68
Jan-
72
Jan-
76
Jan-
80
Jan-
84
Jan-
88
Jan-
92
Jan-
96
Jan-
00
Jan-
04
Global FX reserv es
%y /y
Source: Haver/UBS Source: Haver/UBS
The explosion of foreign exchange reserves, especially as they have accrued to Asian and Middle Eastern economies in the last 3-4 years, is clearly shown above. A full analysis of background, characteristics and prospects can be found in two previous research papers, Petrodollars: Where Are They and Do They Matter? (UBS, Economic Insights By George, 19 July 2006) and Capital Flows and the World Economy: Petrodollars, Asia and the Gulf (UBS, Economic Insights By George, November 2006). But, as is well known, this expansion of global monetary reserves has been fed by the US balance of payments deficit and predominantly Asian current account surpluses, resulting in a vigorous surge in foreign holdings of government and other credit securities, especially those issued by the US government.
These data, of course, cover only official reserves, which have been growing by about USD600 bn per year on average in recent years. As the just-mentioned research papers make clear, though, large asset volumes are accruing in the private and non-reserve official sectors in emerging markets in general but especially among oil producers in the Gulf. These assets are held, for example, by oil stabilisation funds or quasi-private/quasi-public institutions. They don’t have to or don’t want to report inflows or investment outflows – and next to nothing is known in the public domain about their investment strategies and asset holdings. That said, the Capital Flows research paper used IMF capital flow data to estimate that, over 2005-06, these non-reserve agencies might have accrued assets worth over USD500 bn per annum in the emerging world as a whole, of which about 65% was accounted for by oil producers, mostly in the Gulf. Although we shall remain focused here on reserves growth in the official sector, it is as well to bear in mind that total foreign asset growth, including the private and non-reserve official sectors, could have been comfortably in excess of USD1,000 bn in the last few years.
The reserves data are hard to monitor on a high-frequency basis and the data purporting to cover allocation of reserves among asset classes and currencies (TIC and US balance of payments data, for example) are inadequate and/or
The explosion in reserves in recent years owes most to China, Russia and the Middle East
We only have regular data on official reserves but need to be aware of private and non-reserve official flows too – growing almost as fast as the former
Economic Insights 6 March 2007
UBS 17
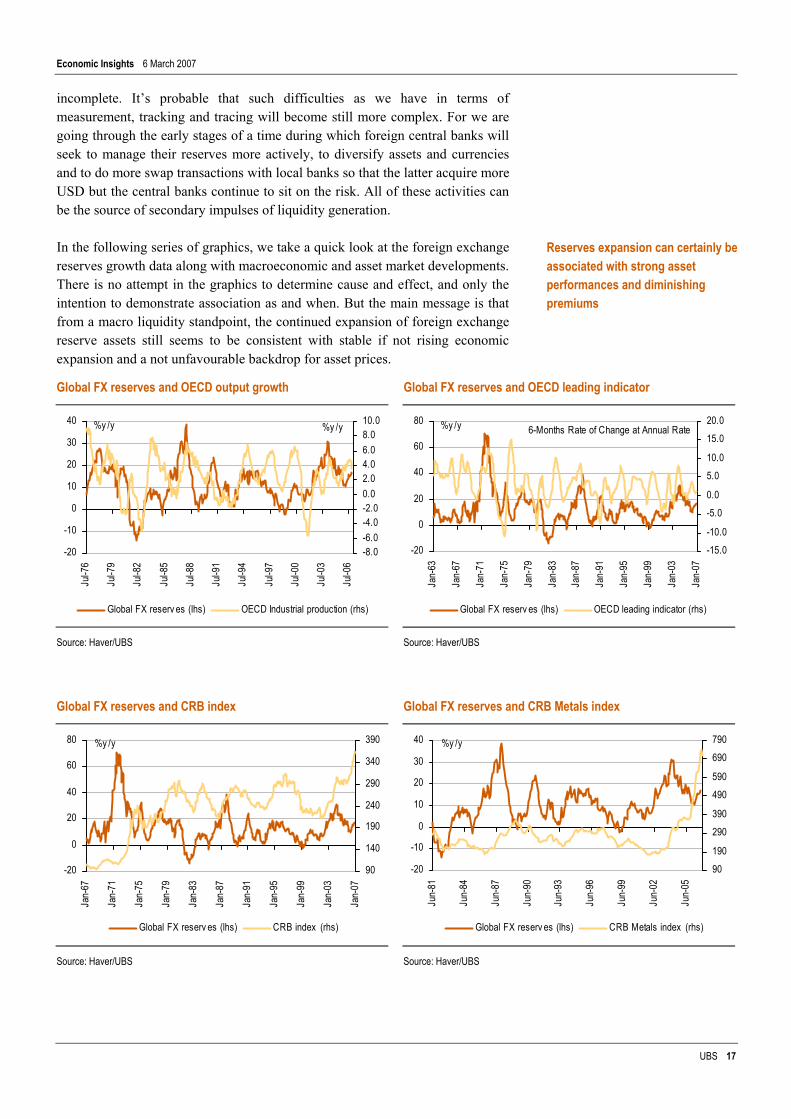
incomplete. It’s probable that such difficulties as we have in terms of measurement, tracking and tracing will become still more complex. For we are going through the early stages of a time during which foreign central banks will seek to manage their reserves more actively, to diversify assets and currencies and to do more swap transactions with local banks so that the latter acquire more USD but the central banks continue to sit on the risk. All of these activities can be the source of secondary impulses of liquidity generation.
In the following series of graphics, we take a quick look at the foreign exchange reserves growth data along with macroeconomic and asset market developments. There is no attempt in the graphics to determine cause and effect, and only the intention to demonstrate association as and when. But the main message is that from a macro liquidity standpoint, the continued expansion of foreign exchange reserve assets still seems to be consistent with stable if not rising economic expansion and a not unfavourable backdrop for asset prices.
Global FX reserves and OECD output growth Global FX reserves and OECD leading indicator
-20
-10
0
10
20
30
40
Jul-7
6
Jul-7
9
Jul-8
2
Jul-8
5
Jul-8
8
Jul-9
1
Jul-9
4
Jul-9
7
Jul-0
0
Jul-0
3
Jul-0
6
-8.0-6.0-4.0-2.00.02.04.06.08.010.0
Global FX reserv es (lhs) OECD Industrial production (rhs)
%y /y %y /y
-20
0
20
40
60
80Ja
n-63
Jan-
67
Jan-
71
Jan-
75
Jan-
79
Jan-
83
Jan-
87
Jan-
91
Jan-
95
Jan-
99
Jan-
03
Jan-
07
-15.0-10.0
-5.00.0
5.010.0
15.020.0
Global FX reserv es (lhs) OECD leading indicator (rhs)
%y /y 6-Months Rate of Change at Annual Rate
Source: Haver/UBS Source: Haver/UBS
Global FX reserves and CRB index Global FX reserves and CRB Metals index
-20
0
20
40
60
80
Jan-
67
Jan-
71
Jan-
75
Jan-
79
Jan-
83
Jan-
87
Jan-
91
Jan-
95
Jan-
99
Jan-
03
Jan-
07
90
140
190
240
290
340
390
Global FX reserv es (lhs) CRB index (rhs)
%y /y
-20
-10
0
10
20
30
40
Jun-
81
Jun-
84
Jun-
87
Jun-
90
Jun-
93
Jun-
96
Jun-
99
Jun-
02
Jun-
05
90190
290390
490590
690790
Global FX reserv es (lhs) CRB Metals index (rhs)
%y /y
Source: Haver/UBS Source: Haver/UBS
Reserves expansion can certainly be associated with strong asset performances and diminishing premiums
Economic Insights 6 March 2007
UBS 18
Global FX reserves and EMBI spread Global FX reserves and MSCI Asia
-505
101520253035
Jan-
98
Jan-
99
Jan-
00
Jan-
01
Jan-
02
Jan-
03
Jan-
04
Jan-
05
Jan-
06
Jan-
07
90
290
490
690
890
1090
Global FX reserv es (lhs) EMBI (rhs,inv )
%y /y
-5
5
15
25
35
45
Jan-
88
Jan-
90
Jan-
92
Jan-
94
Jan-
96
Jan-
98
Jan-
00
Jan-
02
Jan-
04
Jan-
06
0
100
200
300
400
500
Global FX reserv es (lhs) MSCI Asia (rhs)
%y /y
Source: Haver/UBS Source: Haver/UBS
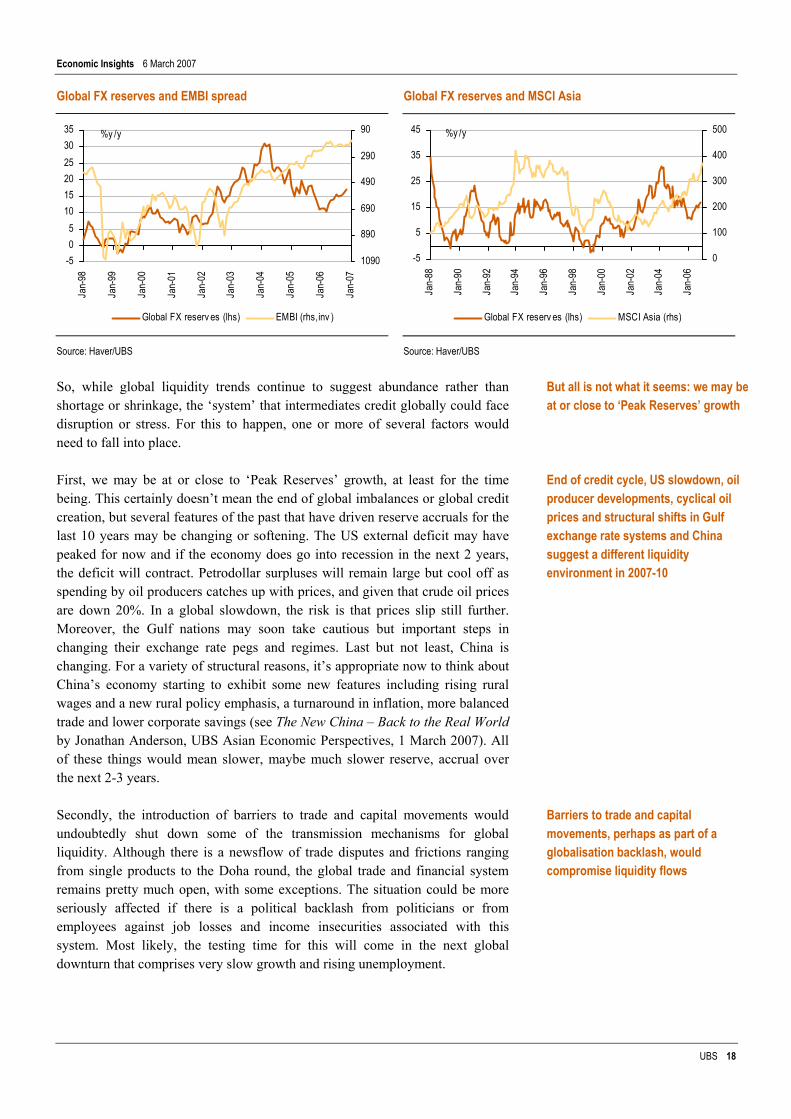
So, while global liquidity trends continue to suggest abundance rather than shortage or shrinkage, the ‘system’ that intermediates credit globally could face disruption or stress. For this to happen, one or more of several factors would need to fall into place.
First, we may be at or close to ‘Peak Reserves’ growth, at least for the time being. This certainly doesn’t mean the end of global imbalances or global credit creation, but several features of the past that have driven reserve accruals for the last 10 years may be changing or softening. The US external deficit may have peaked for now and if the economy does go into recession in the next 2 years, the deficit will contract. Petrodollar surpluses will remain large but cool off as spending by oil producers catches up with prices, and given that crude oil prices are down 20%. In a global slowdown, the risk is that prices slip still further. Moreover, the Gulf nations may soon take cautious but important steps in changing their exchange rate pegs and regimes. Last but not least, China is changing. For a variety of structural reasons, it’s appropriate now to think about China’s economy starting to exhibit some new features including rising rural wages and a new rural policy emphasis, a turnaround in inflation, more balanced trade and lower corporate savings (see The New China – Back to the Real World by Jonathan Anderson, UBS Asian Economic Perspectives, 1 March 2007). All of these things would mean slower, maybe much slower reserve, accrual over the next 2-3 years.
Secondly, the introduction of barriers to trade and capital movements would undoubtedly shut down some of the transmission mechanisms for global liquidity. Although there is a newsflow of trade disputes and frictions ranging from single products to the Doha round, the global trade and financial system remains pretty much open, with some exceptions. The situation could be more seriously affected if there is a political backlash from politicians or from employees against job losses and income insecurities associated with this system. Most likely, the testing time for this will come in the next global downturn that comprises very slow growth and rising unemployment.
But all is not what it seems: we may be at or close to ‘Peak Reserves’ growth
End of credit cycle, US slowdown, oil producer developments, cyclical oil prices and structural shifts in Gulf exchange rate systems and China suggest a different liquidity environment in 2007-10
Barriers to trade and capital movements, perhaps as part of a globalisation backlash, would compromise liquidity flows
Economic Insights 6 March 2007
UBS 19
Thirdly, and most immediately, widespread actions by financial institutions to withhold or shut down credit flows indiscriminately could have profound cross-border effects on the global economy. Asset markets certainly got the jitters in the last week for a variety of reasons emanating in both China and the US. And an endogenous US recession and/or credit crunch would doubtless unsettle asset markets in comparable ways, alter the pattern of surpluses and deficits, and shift around the deployment of foreign assets by lender and by asset class.
That said, the risks – especially the last set – while no greater this week than they might have been judged a month ago, are that much clearer. For the time being, then, the most plausible conclusion is that liquidity growth in the macro sense may be peaking out, and that the credit cycle may have a little more life left in it. But notice looks to have been served now that it’s quite late in the day for this cycle, and that the downturn in even global liquidity may be akin to a clock without hands. We can’t tell the time but, as sure as eggs is eggs, we know the clock’s ticking.
Credit supply disruptions and/or an endogenous US recession at some point will change the pattern of surpluses and deficits, asset deployment and economic activity
On balance, there may be more life in the credit cycle, but liquidity looks to be peaking out; and the cycle now resembles a clock without hands…
Economic Insights 6 March 2007
UBS 20
■ Analyst Certification
Each research analyst primarily responsible for the content of this research report, in whole or in part, certifies that with respect to each security or issuer that the analyst covered in this report: (1) all of the views expressed accurately reflect his or her personal views about those securities or issuers; and (2) no part of his or her compensation was, is, or will be, directly or indirectly, related to the specific recommendations or views expressed by that research analyst in the research report.

Economic Insights 6 March 2007
UBS 21
Required Disclosures
This report has been prepared by UBS Limited, an affiliate of UBS AG (UBS).
For information on the ways in which UBS manages conflicts and maintains independence of its research product; historical performance information; and certain additional disclosures concerning UBS research recommendations, please visit www.ubs.com/disclosures.

This report has been prepared by UBS Limited, an affiliate of UBS AG (UBS). In certain countries UBS AG is referred to as UBS SA. This report is for distribution only under such circumstances as may be permitted by applicable law. It has no regard to the specific investment objectives, financial situation or particular needs of any specific recipient. It is published solely for informational purposes and is not to be construed as a solicitation or an offer to buy or sell any securities or related financial instruments. No representation or warranty, either express or implied, is provided in relation to the accuracy, completeness or reliability of the information contained herein, except with respect to information concerning UBS AG, its subsidiaries and affiliates, nor is it intended to be a complete statement or summary of the securities, markets or developments referred to in the report. The report should not be regarded by recipients as a substitute for the exercise of their own judgement. Any opinions expressed in this report are subject to change without notice and may differ or be contrary to opinions expressed by other business areas or groups of UBS as a result of using different assumptions and criteria. The analysis contained herein is based on numerous assumptions. Different assumptions could result in materially different results. The analyst(s) responsible for the preparation of this report may interact with trading desk personnel, sales personnel and other constituencies for the purpose of gathering, synthesizing and interpreting market information. UBS is under no obligation to update or keep current the information contained herein. UBS relies on information barriers to control the flow of information contained in one or more areas within UBS, into other areas, units, groups or affiliates of UBS. The compensation of the analyst who prepared this report is determined exclusively by research management and senior management (not including investment banking). Analyst compensation is not based on investment banking revenues, however, compensation may relate to the revenues of UBS Investment Bank as a whole, of which investment banking, sales and trading are a part. The securities described herein may not be eligible for sale in all jurisdictions or to certain categories of investors. Options, derivative products and futures are not suitable for all investors, and trading in these instruments is considered risky. Mortgage and asset-backed securities may involve a high degree of risk and may be highly volatile in response to fluctuations in interest rates and other market conditions. Past performance is not necessarily indicative of future results. Foreign currency rates of exchange may adversely affect the value, price or income of any security or related instrument mentioned in this report. For investment advice, trade execution or other enquiries, clients should contact their local sales representative. Neither UBS nor any of its affiliates, nor any of UBS' or any of its affiliates, directors, employees or agents accepts any liability for any loss or damage arising out of the use of all or any part of this report. Additional information will be made available upon request. For financial instruments admitted to trading on an EU regulated market: UBS AG, its affiliates or subsidiaries (excluding UBS Securities LLC and/or UBS Capital Markets LP) acts as a market maker or liquidity provider (in accordance with the interpretation of these terms in the UK) in the financial instruments of the issuer save that where the activity of liquidity provider is carried out in accordance with the definition given to it by the laws and regulations of any other EU jurisdictions, such information is separately disclosed in this research report. United Kingdom and the rest of Europe: Except as otherwise specified herein, this material is communicated by UBS Limited, a subsidiary of UBS AG, to persons who are market counterparties or intermediate customers (as detailed in the FSA Rules) and is only available to such persons. The information contained herein does not apply to, and should not be relied upon by, private customers. UBS Limited is regulated by the FSA. France: Prepared by UBS Limited and distributed by UBS Limited and UBS Securities France SA. UBS Securities France S.A. is regulated by the the Autorité des Marchés Financiers (AMF). Where an analyst of UBS Securities France S.A. has contributed to this report, the report is also deemed to have been prepared by UBS Securities France S.A. Germany: Prepared by UBS Limited and distributed by UBS Limited and UBS Deutschland AG. UBS Deutschland AG is regulated by the Bundesanstalt fur Finanzdienstleistungsaufsicht (BaFin). Spain: Prepared by UBS Limited and distributed by UBS Limited and UBS Securities España SV, SA. UBS Securities España SV, SA is regulated by the Comisión Nacional del Mercado de Valores (CNMV). . Russia: Prepared and distributed by the Moscow Representative Office of UBS Cyprus Moscow Limited. Switzerland: Distributed by UBS AG to persons who are institutional investors only. Italy: Prepared by UBS Limited and distributed by UBS Limited and UBS Italia Sim S.p.A.. UBS Italia Sim S.p.A. is regulated by the Bank of Italy and by the Commissione Nazionale per le Società e la Borsa (CONSOB). Where an analyst of UBS Italia Sim S.p.A. has contributed to this report, the report is also deemed to have been prepared by UBS Italia Sim S.p.A.. South Africa: UBS South Africa (Pty) Limited (Registration No. 1995/011140/07) is a member of the JSE Limited, the South African Futures Exchange and the Bond Exchange of South Africa. UBS South Africa (Pty) Limited is an authorised Financial Services Provider. United States: Distributed to US persons by either UBS Securities LLC or by UBS Financial Services Inc., subsidiaries of UBS AG; or by a group, subsidiary or affiliate of UBS AG that is not registered as a US broker-dealer (a “non-US affiliate”), to major US institutional investors only. UBS Securities LLC or UBS Financial Services Inc. accepts responsibility for the content of a report prepared by another non-US affiliate when distributed to US persons by UBS Securities LLC or UBS Financial Services Inc. All transactions by a US person in the securities mentioned in this report must be effected through UBS Securities LLC or UBS Financial Services Inc., and not through a non-US affiliate. Canada: Distributed by UBS Securities Canada Inc., a subsidiary of UBS AG and a member of the principal Canadian stock exchanges & CIPF. A statement of its financial condition and a list of its directors and senior officers will be provided upon request. Hong Kong: Distributed by UBS Securities Asia Limited. Singapore: Distributed by UBS Securities Pte. Ltd or UBS AG, Singapore Branch. Japan: Distributed by UBS Securities Japan Ltd to institutional investors only. Australia: Distributed by UBS AG (Holder of Australian Financial Services Licence No. 231087) and UBS Securities Australia Ltd (Holder of Australian Financial Services Licence No. 231098) only to “Wholesale” clients as defined by s761G of the Corporations Act 2001. New Zealand: Distributed by UBS New Zealand Ltd. © 2007 UBS. All rights reserved. This report may not be reproduced or redistributed, in whole or in part, without the written permission of UBS and UBS accepts no liability whatsoever for the actions of third parties in this respect.
ab
UBS 1 Finsbury Avenue London EC2M 2PP United Kingdom Tel: +44-20-7567 8000 Fax: +44-20-7568 4800
www.ubs.com/investmentbank