Embed Size (px)
Citation preview
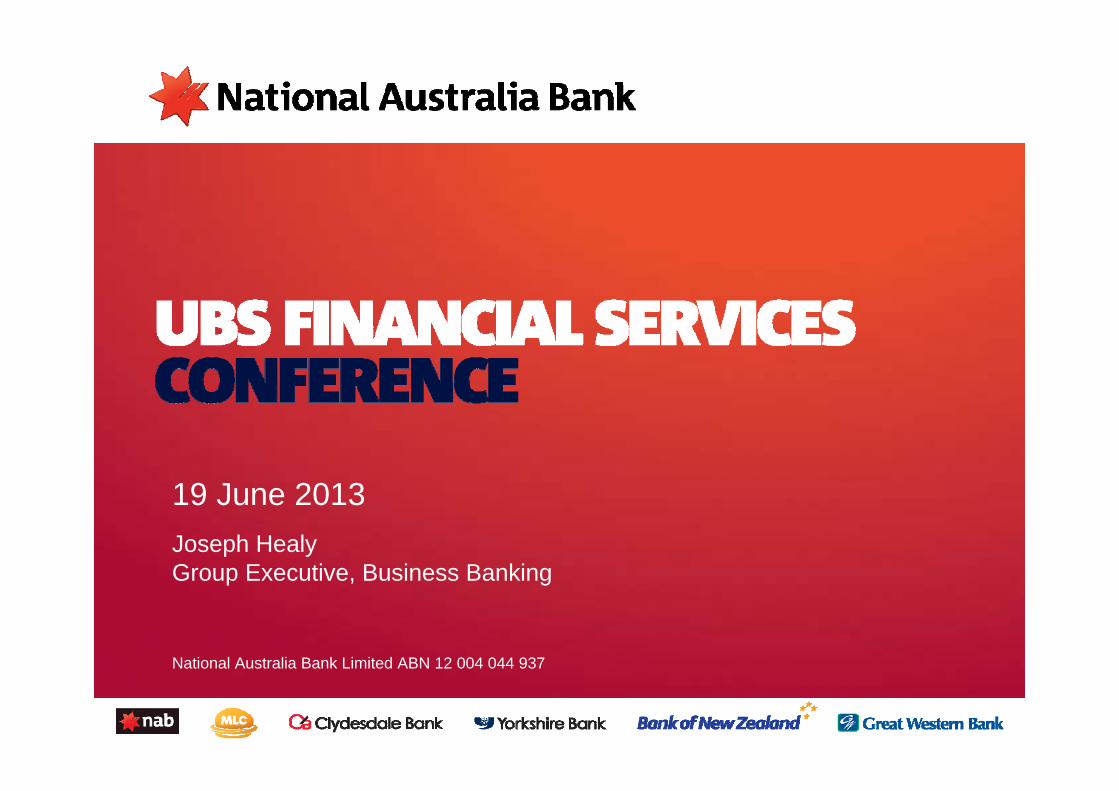
19 June 2013
National Australia Bank Limited ABN 12 004 044 937
Joseph HealyGroup Executive, Business Banking

2
This document is a visual aid accompanying a presentation to analysts by Joseph Healy, Group Executive business Banking, on June 19 2013. It is not intended to be read as a stand-alone document. It contains select information, in abbreviated or summary form, and does not purport to be complete. It is intended to be read by a sophisticated investor audience familiar with National Australia Bank Limited and its March 2013 Half Year Results, and to be accompanied by the verbal presentation. This document should not be read without first reading the National Australia Bank Limited March 2013 Half Year Results, which has been lodged with the Australian Securities Exchange and is available at www.nab.com.au.
The verbal presentation places emphasis on cash earnings measures of the Business Banking Division’s performance. NAB uses cash earnings for its internal management reporting purposes and considers it a better reflection of the Group’s underlying performance. Accordingly, information in this document is presented on a cash earnings basis unless otherwise stated.
Cash earnings is calculated by excluding some items which are included within the statutory net profit attributable to owners of the Company. It is not a statutory financial measure and is not presented in accordance with Australian Accounting Standards nor audited or reviewed in accordance with Australian Auditing Standards. The definition of cash earnings, a discussion of non-cash earnings items and a full reconciliation of the cash earnings to statutory net profit attributable to owners of the company is set out on pages 2-8 of the National Australia Bank Limited March 2013 Half Year Results.
The Group’s financial statements, prepared in accordance with the Corporations Act 2001 (Cth) and Australian Accounting Standards, and reviewed by the auditors in accordance with Australian Auditing Standards, are included in Section 5 of the 2013 Half Year Results Announcement.
Note:
•The inclusion of percentage changes in brackets in this document indicates an unfavourable movement on a prior comparative period.•This document is not intended to be relied upon as advice to investors or potential investors and does not take into account theinvestment objectives, financial situation or needs of any particular investor. These should be considered, with or without professional advice, when deciding if an investment is appropriate.•This document contains certain "forward-looking statements". The words "anticipate", "believe", "expect", "project", "forecast", "estimate", “outlook”, "likely", "intend", "should", "could", "may", "target", "plan" and other similar expressions are intended to identify forward-looking statements. Indications of, and guidance on, future earnings and financial position and performance are also forward-looking statements. Such forward-looking statements are not guarantees of future performance and involve known and unknown risks, uncertainties and other factors, many of which are beyond the control of the Group, which may cause actual results to differ materially from those expressed or implied in such statements. There can be no assurance that actual outcomes will not differ materially from these statements.
Important note on these presentation slides, including the use of non-IFRS financial information

3
Experienced and Diverse Team Joseph Healy, Group Executive Business Banking
6 years with NAB 30 years domestic and international banking experience Univ. of London & London Business School, MSc & MBA
and member of Chartered Institute of Bankers (Scotland)
Previously: Lloyds Bank, Citibank, CIBC World Markets, ANZ
David Hornery, Executive General ManagerCorporate, Institutional & Specialised Banking
~4 years with NAB 27 years domestic and international banking
experience Bachelor of Economics, Sydney University Previously: ANZ as Global Head of Capital Markets
then Head of ANZ Asia, Australian Capital Equity as Investment Director and Director Financial Markets at Macquarie Bank
Christine Yates, Executive General Manager,FIG & International Daryl Johnson, Executive General Manager,
nabbusiness 4 years with NAB 33 years domestic and international banking experience MBA Murdoch University Perth, B.Bus (Financial
Management and Economics) Curtin University Perth, WA Previously: ANZ for 29 years in Senior Executive roles
within Business, Corporate and Retail Banking
Angela Mentis, Executive General Manager, Private Wealth
7 years with NAB 26 years experience in Banking, Investment Banking
and Wealth Management. Bachelor of Business (Finance/Economics), Advanced
Standing with the Financial Planning Association of Australia, AFMA Accredited Dealer, Graduate Diploma in Applied Finance and Investment, FINSIA, Graduate of AICD, Fellow of FINSIA
Previously: Macquarie, Citibank and Westpac.
Christine Stasi, General Manager, People Business Banking
Joined NAB in August 2012 20 years experience within human resources
across telecommunications, legal and accounting, both domestic and international
Harvard Business School Strategic HR Management, Master of Industrial Relations University of Sydney
Previously: PriceWaterhouseCoopers, Law Society of Upper Canada, Optus Communications
Vimpi Juneja, General Manager, Business Banking Strategy
~4 years with NAB 16 years domestic and international experience in
strategy and corporate development MBA (Harvard Business School, USA), Master of Arts
in Asian Studies, BComm Hons. Previously: AMP Capital Investors, Insurance
Australia Group, Lion Nathan, Virgin Group (Asia), Archer Private Equity and LEK Consulting
Spiro Pappas, Executive General Manager, Asia
Mark Adams, Executive General Manager, Sales Specialists
12 years with NAB 20+ years experience in Banking and Finance Honours degree in Chemical Engineering and speaks
fluent French Previously: 10 years working in the United Kingdom at
Natwest Markets in the Hedge Fund Sales team and on the European Corporate desk specialising in French Corporates
Sally Bruce, Chief Financial Officer,Personal & Business Banking
~3 years with NAB 25 years experience in Banking and Finance Degree in Commerce, Masters of Applied Finance Previously: Macquarie Group (Wealth and Corporate &
Personal Banking). NAB: Acting EGM for Consumer Product Solutions and GM Mortgages
Joanna White, General Manager, Business Management
~6 years at NAB B.Comm University of Alberta, MBA Harvard Business
School, GAICD Previously: NAB: State GM nabbusiness SA/NT and Chair
of State Council; Founded The Australian Charities Fund, Consultant at Bain & Co
Director Opportunity International, Member Review Panel and Policy Council for Business and Finance Oath
4 years with NAB 23 years of international and domestic banking
experience Bachelor of Commerce (Finance Merit), University of
New South Wales Previously: 13 years working in London and New
York at ABN AMRO and Deutsche Bank
Peter Coad, Chief Risk Officer,Business Banking Caroline Ralphsmith, General Manager,
Business Marketing 3 years with NAB ~20+ years experience in Financial Services strategy,
operations and marketing in Australia and US Bachelor Economics and Commerce Melbourne
University; MBA University of Bath Previously: Head of Marketing, IAG; Founder & CEO
Bizmarket; Associate Principal at McKinsey & Co (Australia and New York); Senior roles at Mitchell Madison group (New York) and J. Walter Thompson
8 years with NAB 25+ years experience in international capital and
finance markets across a broad range of markets and products
Previously: Regional and Global management roles with CBA, the former Chase Manhattan Bank in New York and Hong Kong, the former Chemical Bank in Hong Kong and Tokyo and Manufacturers Hanover and NM Rothschild in Australia. NAB: CRO Wholesale Banking, Deputy Group Executive Wholesale Banking, EGM Global Capital Markets
3 years with NAB 20+ years experience in debt markets for
Institutional and Wholesale banking, including project & acquisition finance, debt advisory, syndicated loans, corporate bond origination and relationship management
Bachelor of Economics, Sydney University; professional member of FINSIA and AICD
Previously: Citigroup and ANZ

4
Our core beliefs
Continued importance of ‘AND’ – Growth + Economics + Risk
Relationship banking is source of sustainable competitive advantage
Leadership, talent & diversity are future differentiators
Operational transformation is a key enabler for future success
Customer-led Innovation Strategy is the principal driver of growth

5
Sustained, strong financial performance underpinned by ‘AND’
Business Banking FY091 FY12 1H132 FY09‐FY12CAGR %
FY09‐FY12
Grow Revenue
Revenue ($bn) 5.22 6.06 3.05 0.84 5.1Underlying Profit ($bn) 3.58 4.32 2.16 0.74 6.5Cash Earnings ($bn) 1.60 2.41 1.24 0.82 14.6
Total Customer Return (TCR) (%)3 3.15 3.28 3.24 13 bps
Grow Margin Net Interest Margin (%) 2.35 2.53 2.53 18 bps
Improve ReturnsReturn on RWA (%) 1.18 1.69 1.75 51 bpsROA (%) 0.88 1.22 1.25 34 bps
Manage Risk B&DD charge/CRWA (%) 0.98 0.65 0.59 33 bps
Grow Market Share
Total Lending ($bn) (spot) 184.8 199.9 200.0 15.1 2.7Total Customer Deposits ($bn) (spot)4
79.8 105.5 106.9 25.7 9.8
Lending Market Share (%)5 21.6 24.6 24.4 300Deposit Market Share (%)5 23.5 23.9 24.2 40
Enhance productivity
FTEs (spot) 5,055 5,076 4,715 21Cash earnings per average FTE ($’000)
317 466 516 149
Cost to income ratio (%) 31.5 28.7 29.2 280 bps
‘AND’
‘AND’
‘AND’
‘AND’
‘AND’
(1) FY09 cannot be restated for Asia and cost centre movements. In 1H13 Asia added $4m to cash earnings and $30m to revenue (2) 1H13 includes Asia and transfer of support unit FTE into Corporate Functions(3) TCR is an internal management tool used to measure banker cross sell effectiveness. From March 2013 the calculation of TCR has been changed to
reflect refinements to funding costs (improving comparability across periods), and the inclusion of Asia. TCR for FY09 based on 1H10 data(4) FY09 deposits were disclosed as “Retail Deposits” which for FY12 were disclosed as “Customer Deposits” and include retail and corporate deposits(5) Lending market share is based on APRA Banking System data, Deposits market share is based on APRA Non-Financial Corporations data. FY09 and
FY12 data is as of September, 1H13 data is as of April. Data includes restatements as at April 2013
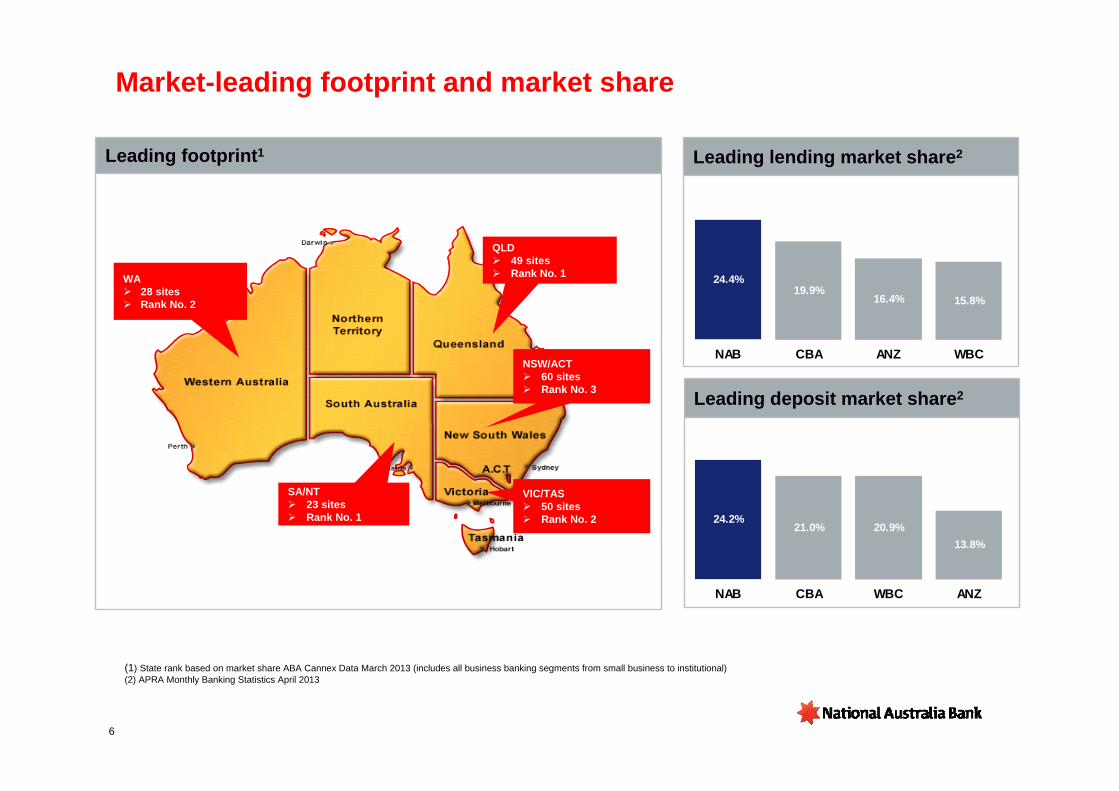
Leading footprint1
Market-leading footprint and market share
6
(1) State rank based on market share ABA Cannex Data March 2013 (includes all business banking segments from small business to institutional)(2) APRA Monthly Banking Statistics April 2013
WA 28 sites Rank No. 2
QLD 49 sites Rank No. 1
NSW/ACT 60 sites Rank No. 3
VIC/TAS 50 sites Rank No. 2
SA/NT 23 sites Rank No. 1
24.4%19.9%
16.4% 15.8%
NAB CBA ANZ WBC
24.2%21.0% 20.9%
13.8%
NAB CBA WBC ANZ
Leading lending market share2
Leading deposit market share2

7
Leading Relationship Bank to Australian business
Superior customer coverage
Leading share of customer wallet
Superior customer impact
93%
82%78%
81%
NAB Peer 1 Peer 2 Peer 3
Strong customer relationships
76%
62%65%
61%
NAB Peer 1 Peer 2 Peer 3
26%
18% 17% 17%
NAB Peer 1 Peer 2 Peer 3
(% of MFI customers with Relationship Manager) (% impact of Relationship Manager on MFI customer satisfaction1)
(% customers self-nominating bank as MFI) (% share of banking wallet2)
67%
52%57% 56%
NAB Peer 1 Peer 2 Peer 3
Source: DBM Business Financial Services Monitor – Small and Medium Business (Turnover $1-<$40m). April 2013 12-month rolling data (1) Uplift to customer satisfaction for MFI customers with relationship manager /business banker(2) Share of Wallet=Footings held by customer at bank/Total footings held by customer at any financial institution
8
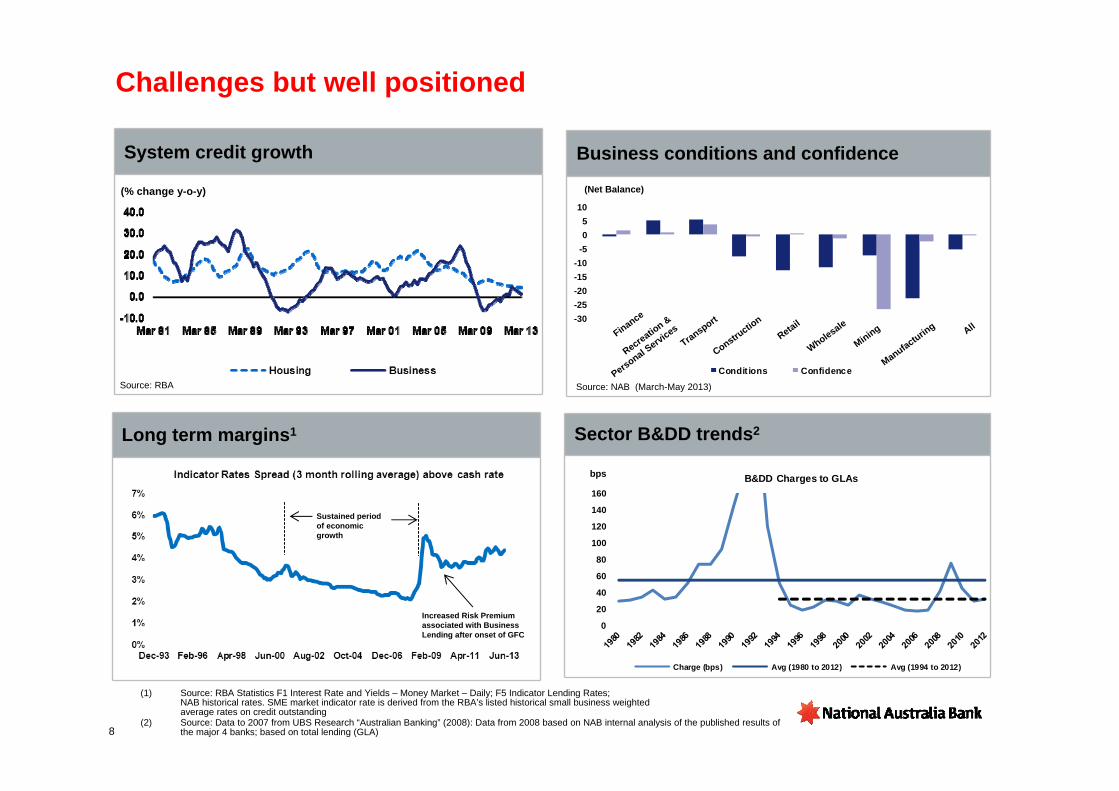
Challenges but well positioned
(Net Balance)
Source: RBA
-30-25-20-15-10
-505
10
Condit ions Confidence
Finance
Recreation &
Personal Services
Transport
Constructio
nRetail
Wholesale
Mining
Manufacturing All
Source: NAB (March-May 2013)
(1) Source: RBA Statistics F1 Interest Rate and Yields – Money Market – Daily; F5 Indicator Lending Rates; NAB historical rates. SME market indicator rate is derived from the RBA’s listed historical small business weighted average rates on credit outstanding
(2) Source: Data to 2007 from UBS Research “Australian Banking” (2008): Data from 2008 based on NAB internal analysis of the published results of the major 4 banks; based on total lending (GLA)
(% change y-o-y)
0
20
40
60
80
100
120
140
160B&DD Charges to GLAs
Charge (bps) Avg (1980 to 2012) Avg (1994 to 2012)
Long term margins1
Business conditions and confidenceSystem credit growth
Sector B&DD trends2
Sustained period of economic growth
Increased Risk Premium associated with Business Lending after onset of GFC
bps

Actively managing returns
9
Identify which portfolios are performing well and those which need attention
Note: all names are for illustrative purposes only
illustrative data only

10
Capitalising on opportunities in a changing landscape
Superannuation and ageing opportunity2
Digitisation and simplification
Customer management1
(Revenue per relationship ($000s), SME)
Australia in Asia3
21%
40%
2012 Target
Business Banking % of time in front of customers
(NAB share of wallet by product (%), SME)
SME Corporate Institutional
% customers Asia Active 23% 44% 47%
% customers rating NAB as MFI for Asia 80% 65% 38%
(1) 12 months to March 2013. Non credit relationship uses one or more transactional banking, wealth, cards or payments products. Credit relationship uses lending only. Partial relationship uses up to 4 products including one lending product. Full relationship uses 5 or more products including lending
(2) Source: NAB Customer Research (2010). Businesses with turnover between $1m - $50m(3) Source: NAB Customer Research (2011)
83% 76% 66%55%
19% 13%
BusinessLending
BusinessDeposits
PersonalMortgages
PersonalDeposits
Life Ins Super
Full Relationship
Partial Relationship
Non-credit relationship
AverageCredit-only relationship
2.2 1.1 2.7 8.1 5.2Averageproducts per relationship

11
Key Messages
Pre-eminent Business Banking franchise in
Australia
Experienced and diverse leadership team
Sustained, strong financial performance
Leading market share and footprint
Sustainable competitive advantages
Strong relationship management focus
Substantial customer base
Leading share of customer wallet
Capability to actively manage returns
Capitalising on opportunities in
changing landscape
Customer management
Superannuation and ageing
Australia in Asia
Digitisation and simplification
Appendix
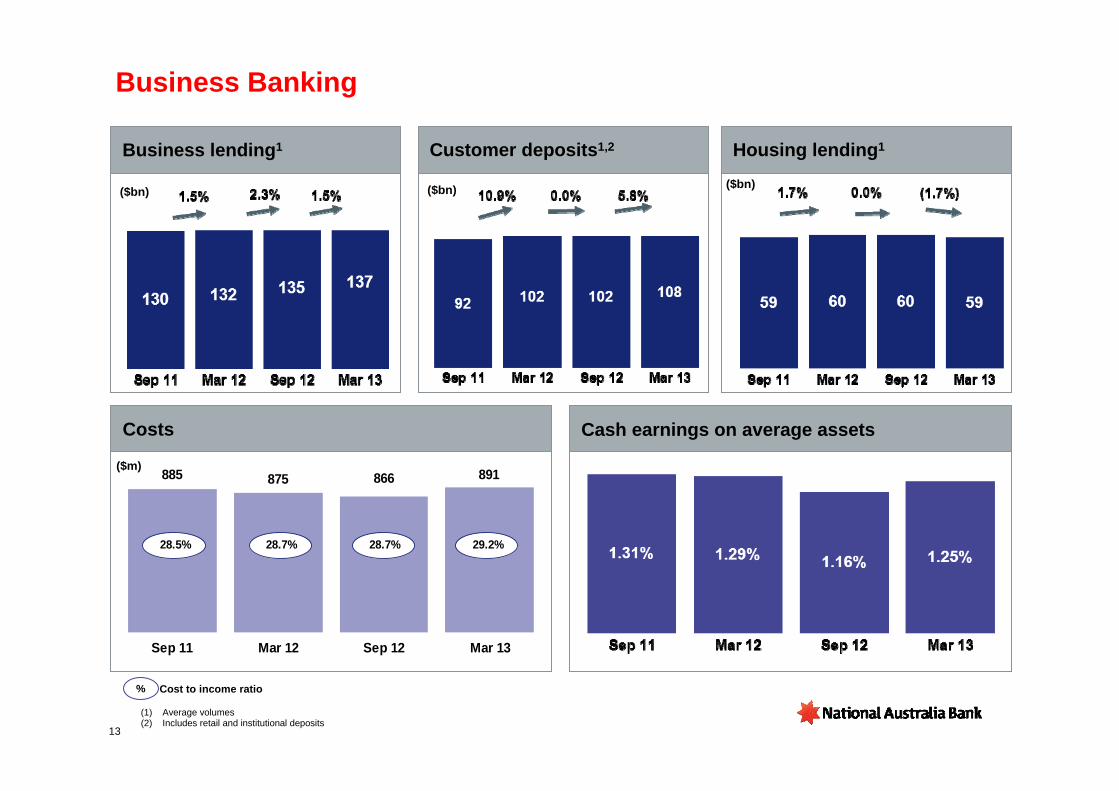
Business Banking
Business lending1
Costs
($bn) ($bn) ($bn)
885 891875 866
Sep 11 Mar 12 Sep 12 Mar 13
28.5% 28.7% 28.7% 29.2%
Customer deposits1,2 Housing lending1
Cash earnings on average assets
Cost to income ratio%
(1) Average volumes (2) Includes retail and institutional deposits
13
($m)
(1) Corporate, Institutional and Specialised Banking (2) Asia transferred from Corporate Functions(3) SME business data reflects the nabbusiness segment of Business Banking which supports business customers with lending typically up to $25m,
excluding the Specialised Businesses
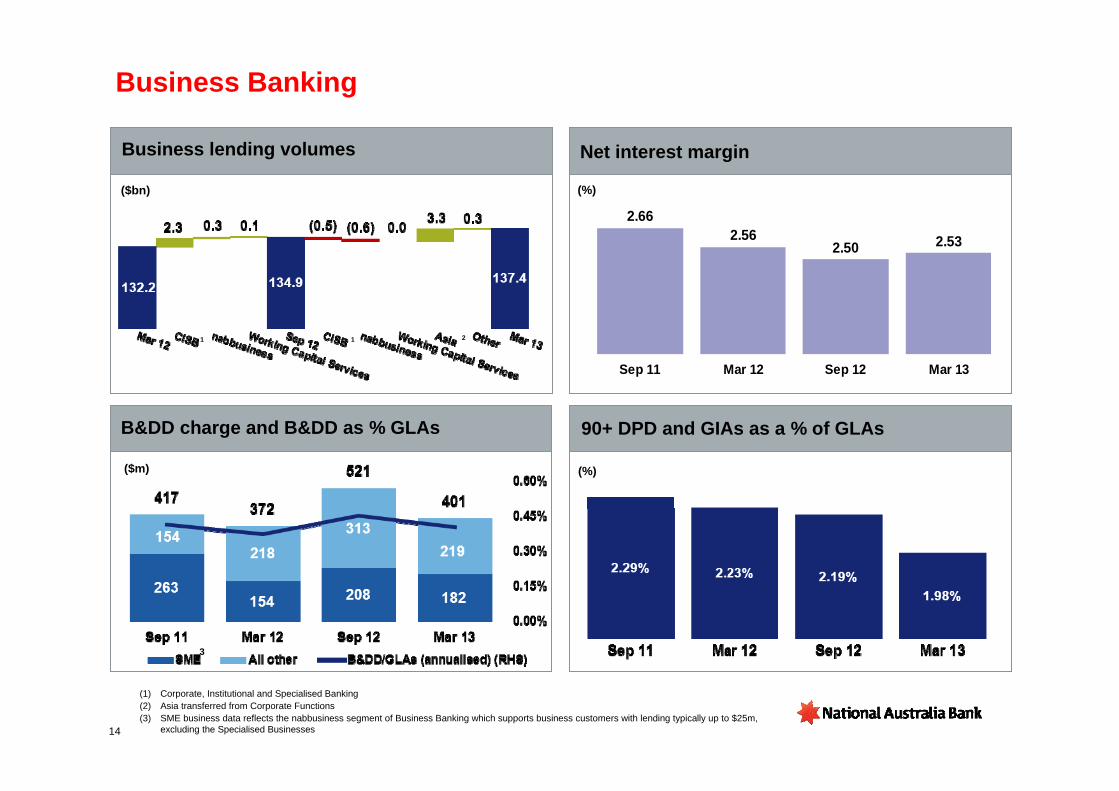
Business Banking
(%)
($m)
2.662.56
2.50 2.53
Sep 11 Mar 12 Sep 12 Mar 13
Business lending volumes
B&DD charge and B&DD as % GLAs
Net interest margin
90+ DPD and GIAs as a % of GLAs
(%)
14
3
($bn)
1 1 2

15
Well secured – business products3 B&DD charge and B&DD as % GLAs
Business Banking Asset Quality
(1) Based on product split(2) Portfolio quality on a probability of default basis (3) Based upon security categories in internal ratings systems
0.00%
0.15%
0.30%
0.45%
0.60%
0.75%
0
200
400
600
Sep 11 Mar 12 Sep 12 Mar 13B&DD charge B&DD/GLAs (annualised) (RHS)
($m)
57% 55% 53% 53%
43% 45% 47% 47%
Sep 11 Mar 12 Sep 12 Mar 13
Investment grade equivalent Sub-Investment grade equivalent
61% 61% 62% 63%
25% 25% 25% 24%
13%14% 14% 13%
Sep 11 Mar 12 Sep 12 Mar 13Fully Secured Partially Secured Unsecured
Portfolio quality2Diverse assets1
16
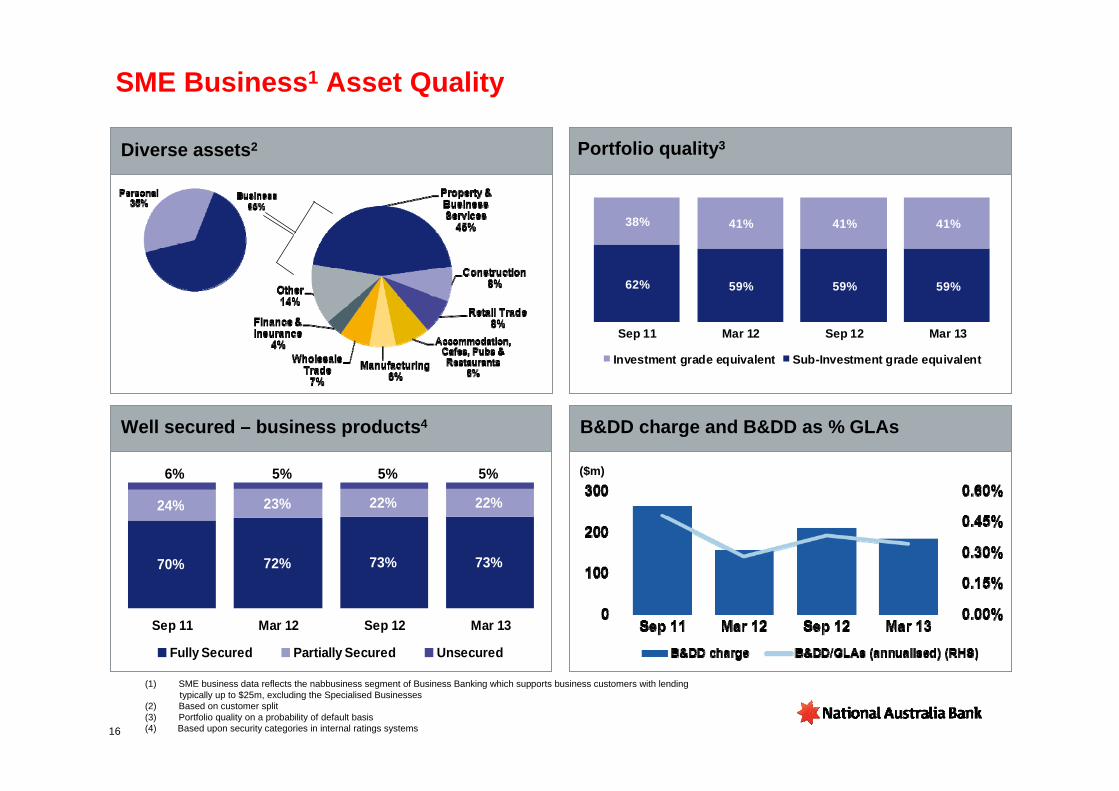
SME Business1 Asset Quality
(1) SME business data reflects the nabbusiness segment of Business Banking which supports business customers with lending typically up to $25m, excluding the Specialised Businesses
(2) Based on customer split(3) Portfolio quality on a probability of default basis(4) Based upon security categories in internal ratings systems
($m)
62% 59% 59% 59%
38% 41% 41% 41%
Sep 11 Mar 12 Sep 12 Mar 13
Investment grade equivalent Sub-Investment grade equivalent
70% 72% 73% 73%
24% 23% 22% 22%
5%5%5%6%
Sep 11 Mar 12 Sep 12 Mar 13
Fully Secured Partially Secured Unsecured
Well secured – business products4 B&DD charge and B&DD as % GLAs
Diverse assets2 Portfolio quality3
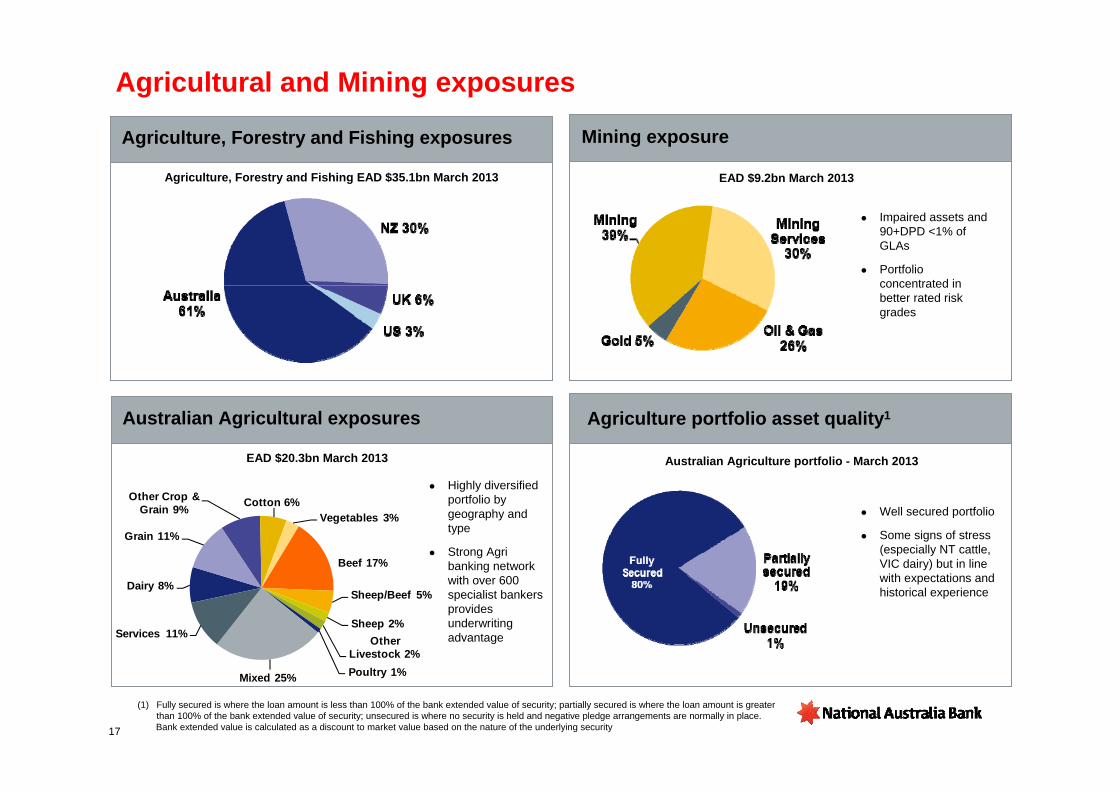
Agricultural and Mining exposures
Agriculture, Forestry and Fishing exposures Mining exposure
Agriculture portfolio asset quality1
Impaired assets and 90+DPD <1% of GLAs
Portfolio concentrated in better rated risk grades
Agriculture, Forestry and Fishing EAD $35.1bn March 2013
Australian Agricultural exposures
EAD $20.3bn March 2013
Well secured portfolio
Some signs of stress (especially NT cattle, VIC dairy) but in line with expectations and historical experience
Highly diversified portfolio by geography and type
Strong Agri banking network with over 600 specialist bankers provides underwriting advantage
Australian Agriculture portfolio - March 2013
Dairy 8%
Grain 11%
Other Crop & Grain 9% Cotton 6%
Vegetables 3%
Beef 17%
Sheep/Beef 5%
Sheep 2%Other
Livestock 2%Poultry 1%Mixed 25%
Services 11%
EAD $9.2bn March 2013
(1) Fully secured is where the loan amount is less than 100% of the bank extended value of security; partially secured is where the loan amount is greater than 100% of the bank extended value of security; unsecured is where no security is held and negative pledge arrangements are normally in place. Bank extended value is calculated as a discount to market value based on the nature of the underlying security17

18
NAB’s operational focus in Asia
Hong Kong branch > Institutional and Corporate,
Trade, Markets, Personal Banking and Financial Planning (Calibre)
Tokyo branch & Osaka sub branch> Institutional and Corporate,
Trade, Markets and Personal Banking
Beijing NAB and NAB Wealth representative officesShanghai branch > Institutional and Corporate, Migrant BankingFuzhou/Shanghai 16.8% stake in China Industrial International Trust
Mumbai branch > Institutional and Corporate, Trade, Markets and Personal Banking
Singapore branch> Institutional and
Corporate, Trade, Markets and Personal Banking
Indonesia representative office> Supporting offshore Trade,
Markets and Institutional Banking
Branch or sub-branchRepresentative office(s)
Product Focus
Customer Focus
Geographic Focus
• Trading partners of Japan, China, India and Indonesia
• Liquidity hubs of Singapore and Hong Kong
• Linking the flows of these markets with Australia and New Zealand
• Corporates and Institutions in key industries
• Australian Corporates linked to Asia, and Asian Corporates with interests in Australia
• Wealthy individuals and families with links between NAB’s home markets and Asia
• Local cash rich deposit customers• Personal Banking is in the process of
being rebranded NAB Private Wealth
• Corporate Finance and Trade Finance • FX products, Interest rate and
Commodity Risk Management• Multi-currency mortgages• Institutional and Retail deposits
Investment stake
19
For further information visit www.nabgroup.com or contact:
Ross Brown Brian WalshExecutive General Manager, Investor Relations General Manager, Corporate CommunicationsMobile | +61 (0) 477 302 010 Mobile | +61 (0) 411 227 585
Natalie CoombeSenior Manager, Investor RelationsMobile | +61 (0) 477 327 540
Clare Nickson-HavensSenior Manager, Investor RelationsMobile | +61 (0) 477 320 841