Embed Size (px)
Citation preview

UBS European ConferenceMondi GroupAndrew King
16 November 2016

Group overview
Highlights from H1 2016
Q3 trading update and Business Unit reviews
2

#1 Kraft paper #1 Industrial bags2 #1 Commercial release liner
#2 Virgin containerboard #1 Uncoated fine paper #2 Extrusion coatingsEurope
Mondi at a glance
2015Revenue1
& ROCE
Products
25.5% 13.9% 10.7% 25.6% 30.1%
30%
€2,156m
29%8%
23%
10%
€2,031m €1,469m €1,233m €652m
South Africa
29%
27% 19%
16%
9%
Packaging Paper Fibre Packaging Uncoated Fine PaperConsumer Packaging
Market positions
South Africa#1 BHKP
#1 White-top kraftliner
#1 Uncoated fine paper#1 Containerboard #3 Corrugated packagingEmerging Europe
3
1) Segment revenues, before elimination of inter-segment revenues2) Also #1 industrial bags producer in North America 3) Please see sources and definitions at the end of this document

622 574 699 767 957 529
15.0%13.6%
15.3%17.2%
20.5% 21.2%
0.0%
5.0%
10.0%
15.0%
20.0%
25.0%
2011 2012 2013 2014 2015 2016 H1
ROCE
68.1 69.2 95.0 107.3 133.7 75.0
2011 2012 2013 2014 2015 2016 H1
CAGR2 18.4%
Underlying earnings per share
Consistent strategy delivering industry leading returns
Underlying operating profit and ROCE
€ million Euro cents per share
1
4
1) ROCE for H1 2016 is the 12-month rolling average2) CAGR based on 2011 - 2015

Improving returns despite selling price pressures
5
H1 2011 H2 2011 H1 2012 H2 2012 H1 2013 H2 2013 H1 2014 H2 2014 H1 2015 H2 2015 H1 2016Virgin containerboard Kraft paper Uncoated fine paper
Weighted average selling prices Selling prices indexed to H1 2011
608 622 540 574 668 699 710 767 880 957 996
15.2% 15.0%13.3% 13.6% 14.8% 15.3% 16.0% 17.2%
19.0%20.5% 21.2%
H1 2011 H2 2011 H1 2012 H2 2012 H1 2013 H2 2013 H1 2014 H2 2014 H1 2015 H2 2015 H1 201612-month rolling EBIT 12-month rolling ROCE%
12-month rolling EBIT and ROCE€million

422 549 715 796 1,039 418
2011 H2 2012 2013 2014 2015 2016 H1
Cash flow generation1
Strong cash flow generation through the cycle
€ million
€3 .9 b i l l ion cash gener a ted over the las t 5 y ear s
6
1) Net cash generated before capital expenditure, shareholder distributions, acquisitions and disposals

...with a balance between reinvestment for growth and shareholder distributions
3.9
(2.2)
(0.9)
0.2
Change in net debtSpent on acquisitionsDistributed to shareholders
Invested in asset base
Free cash flow generated
(1.4)
Received from disposals and adjustments
1
€ billion
(0.4)
Cash flow bridge over 5 year period (H2 2011 – H1 2016)
7
1) Excludes dividend in specie of €205 million

Benefiting from an emerging market asset base
2015 Net operating assets by location (%)
20%
29%
51%
Group’s 2015 revenue by destination (%)
38%
22%
40%
€5.2 billion €6.8 billionEmerging EuropeOther emerging marketsMature markets
Asset base and sales by destination
...with a balance in sales between higher growth emerging markets and more stable mature markets
8
Strong track record of acquisitions
€1.6 billion invested in acquisitions since 2008
Packaging Paper Fibre Packaging Consumer Packaging
2008 2010 2011 2012 2014 2015 2016
SIMET(Corrugated Packaging)
Intercell(Industrial Bags)
Kutno facility Poland
(Consumer Packaging)
Swiecie Minorities
(Containerboard)
Tekkote(Release liner)
SKG plants(Industrial Bags)
Kalenobel(Consumer Packaging)
Ascania(Consumer Packaging)
Graphic Packaging plant
(Kraft paper & industrial bags)
2 Duropackplants
(Corrugated)
Nordenia(Consumer Packaging)
Loparex Europe & Asia
(Release liner)
KSP(Consumer Packaging)
Uralplastic(Consumer Packaging)
Beepack(Corrugated)
9

6%19% 20% 21%
23%17%
15% 16% 18% 19%33%
32% 34% 34%36%
41%31% 29% 26% 21%
Consumer packaging Fibre based packaging Packaging paper Uncoated fine paper Other
Development of Capital Employed per business as a % of total
Consistent, clear strategic focus – growing our packaging business
20152014201320122011
10

Underpinned by our strategic value drivers…
While all three strategic drivers are relevant to each business, priorities differ across the value chain
Strategic value driversWe are passionate about performance
driving productivity, efficiency and margin improvement
UpstreamDownstream
We invest in our high-quality, low-cost assetskeeping us competitive and giving us sustainable cost advantages We work with our customers
to find innovative solutionsgrowing our product range and
geographic reach
Mondi Capital Markets Day 2015
11

We have invested in the business through the cycle while reacting to the 2008 / 2009 downturn
€3.9 billion invested in capex since 2008
693
517 394
263 294 405
562 595
214
186%
147%
117%
78% 86%
113%
159% 164%
116%
20122011201020092008 2013 2014 2015
130%
CAPEX as a % of depreciation and amortisation
Average capex as
% D&A
Capital expenditure in € million and as % depreciation and amortisation
2016 H1
12

Und
er c
onsi
dera
tion
App
rove
d
• €310m 300 ktpakraft top white machine at Ružomberok mill
• €41m woodyard and bleaching line at Štĕti
• Centred around our packaging assets in central Europe
€121m
• €60m Frantschach recovery boiler
• €16m Syktyvkar bark boiler
• €13m Stambolijski steam turbine and economiser
• €32m Richards Bay steam turbine
Major project pipeline delivering strongly
€100 million incremental operating profit delivered from major projects in 2014/2015€50 million incremental operating profit benefit expected in 2016
2013 2014 2015 2016
€228m
• €70m Štĕti bleached kraft (155 ktpa)
• €128m Ružomberok recovery boiler
• €30m Syktyvkar pulp dryer (100ktpa)
€296m
• €166m Świecie recovery boiler, turbine and biomass boiler
• €106m Packaging Paper
• €24m Fibre Packaging
€124m
• €94m Świecie phase II, increased softwood pulp (100 ktpa) and lightweight kraftliner (80 ktpa)
• €30m South Africa Division woodyard upgrade
2017+
>€500m
13

2010 2015Packaging
Paper
● Cost reductions driven by○ Capital investment programme
- In excess of €650 million invested over past 5 years in major projects delivering cost and volume benefits
○ Rationalisation of high-cost capacity – 4 mills closed or sold
○ Ongoing focus on operational efficiency- Exceeded target of 2% reduction in cash cost base per
annum, offsetting inflationary pressures
○ Currency benefits in 2010 – 2015 due to emerging market currency weakness mainly in Uncoated Fine Paper and South Africa Division
Continuing to strengthen our cost leadership position by investing in our low-cost, high-quality asset base
2010 2015Uncoated Fine
Paper
2010 2015South Africa
Division
Cost per tonne produced (€/t)
-6% -22% -16%
14

Our cash flow priorities remain unchanged
Free cash flow priorities
As appropriate
Maintain our strong and stable financial position and investment grade credit metrics
Support payment of dividends to our shareholders
Evaluate growth opportunities through M&A and/or increased shareholder distributions
Grow through selective capital investment opportunities
15

Robust financial position
Mondi Capital Markets Day 2015
● Financial policy focused on retaining investment grade ratings
● Provides confidence and ability to invest through the cycle
● Current credit ratings:
o Moody’s Baa2 (stable)
o S&P BBB (stable)
● Flexibility within current ratings
Strong cash flow generation and robust balance sheet provide financial flexibility
1,875 1,619 1,613 1,498 1,491
2.0x
1.5x 1.4x1.1x 1.1x
(0. 5)
-
0.5
1.0
1.5
2.0
2.5
0
200
400
600
800
1,000
1,200
1,400
1,600
1,800
2,000
2012 2013 2014 2015 2016 H1
Net debt Net debt / 12-month trailing EBITDA
Net debt and Net debt / 12-month trailing EBITDA
€ million
16

8.25 8.90 9.55 13.23 14.38 18.81
17.75 19.1026.45
28.7737.62
2.6x2.5x
2.6x 2.6x 2.6x
1.0
1.2
1.4
1.6
1.8
2.0
2.2
2.4
2.6
2.8
0
10
20
30
40
50
60
2011 2012 2013 2014 2015 2016 H1Interim dividend Final dividend Dividend cover
Strong growth in shareholder returns without sacrificing cover
● 2-3x dividend cover policy across the cycle
● Option to return excess capital to shareholders by way of one-off distribution in the absence of attractive M&A / Capex opportunities
Dividends per share and dividend cover
Euro cents per share
17

18
Group overview
Highlights from H1 2016
Q3 trading update and Business Unit reviews

490 467 529
19.0%
20.5%21.2%
17.5%
18.0%
18.5%
19.0%
19.5%
20.0%
20.5%
21.0%
21.5%
H1 2015 H2 2015 H1 2016ROCE
● Continued strong financial performance
○ Underlying operating profit up 8% on H1 2015○ Underlying earnings up 11% on H1 2015○ ROCE of 21.2%
● Capital projects delivering growth
○ €50 million incremental contribution expected to underlying operating profit in 2016
○ Strong capital investment pipeline
● Complemented by acquisitions
○ Acquisitions completed in prior year and current period successfully integrated
○ Two acquisitions completed in July to enhance product offering and geographic footprint in Consumer Packaging
● Interim dividend of 18.81 euro cents per share declared67.8 65.9 75.0
H1 2015 H2 2015 H1 2016
Underlying earnings per share
Highlights H1 2016
Underlying operating profit and ROCE
€ million
Euro cents per share
19

Group overview
Highlights from H1 2016
Business Unit reviews and Q3 trading update
20

● €227 million underlying operating profit for the third quarter of 2016, up 3% on the third quarter of 2015.
● Average selling prices were generally lower and on a like-for-like basis, sales volumes of key paper grades were in line with the third quarter of 2015.
● During the third quarter of 2016, the Group concluded the acquisitions of Kalenobel (Turkey) and Uralplastic(Russia), supporting the growth of the Consumer Packaging business.
● The Group also agreed to acquire Beepack – a corrugated packaging facility in Russia (LLC Beepack) for a consideration of RUB2,825 million (EUR41 million) on a cash and debt free basis, supporting the ongoing development of our Corrugated Packaging business in central and eastern Europe.
● Outlook
“We expect to benefit from stable to higher selling prices in a number of key product segments as we move into 2017 following the downward pressure seen over the course of 2016. Costs remain generally stable, albeit with near-term pressure in certain areas. Our ongoing capital investment programme continues to deliver strong returns. With our clear strategy, robust business model and culture of continuous improvement, we remain confident of continuing to deliver an industry leading performance.”
Trading update – Overview
21
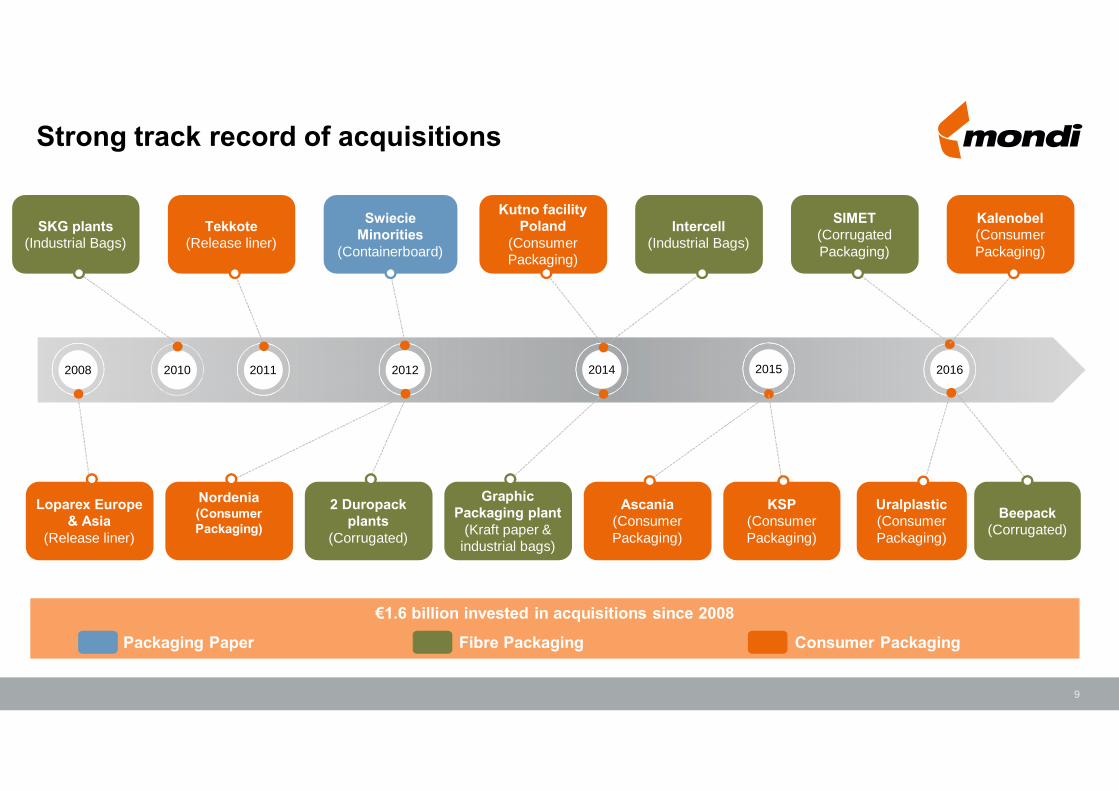
211 180 192
26.6%25.5%
23.5%
18.8%17.4%
18.4%
H1 2015 H2 2015 H1 2016ROCE Underlying operating profit margin
H1 2016
● Lower average selling prices
● Like-for-like sales volumes marginally up on H1 2015
● Underlying operating profit down 9% on H1 2015
● Benefits from currency gains on exports, good cost management and lower energy costs
Q3 2016
● Virgin containerboard prices similar to Q2 2016 but over 7% down on Q3 2015. Kraftliner price increase of €20/tonne implemented in August across Europe excluding southern Europe
● Recycled containerboard prices down by 3% on Q2 2016 and 7% down on Q3 2015
● Kraft paper prices marginally down on Q2 2016 and 8% down on Q3 2015. Announced €60/tonne increase in sack kraftpaper prices for all European markets and 8-12% increase in export markets
Packaging Paper
Underlying operating profit, margin and ROCE
€ million
22

37.13.6 2.0-3.0
● Overall containerboard capacity expected to grow in line with demand over 2016 - 2018
● In VCB grades
○ Announced capacity increase likely to be compensated by grade substitution and/or reduction in net imports○ US kraftliner can be sold domestically at €100-€140/t higher than in Southern Europe
Incremental containerboard supply expected to be absorbed by demand in the medium term
Source: RISI, CEPI Containerboard deliveries and Mondi estimates
2016-2018 demand and capacity growth estimates in Europe (in mt)
+2-3%CAGR +1-2% +2-3%
Containerboard VCB RCB
7.5 0.7 0.2-0.4
Demand growth
Net capacity additions
2015 Capacity
Demand growth
Net capacity additions
2015 Capacity
29.62.9 1.8-2.6
Demand growth
Net capacity additions
2015 Capacity
23

68 52 59
15.2%13.9%
12.6%
6.5%5.3%
6.1%
H1 2015 H2 2015 H1 2016ROCE Underlying operating profit margin
Corrugated Packaging● H1 2016 sales volumes in line with H1 2015
○ Good growth in central Europe ○ Political instability in Turkey impacting sales volume growth○ Russian embargo affecting Polish exports of FF&V1
● Completed acquisition of Simet and agreed Beepackacquisition in Q3 2016
Industrial Bags ● Higher European volumes year-to-date
● Decline in sales volumes in US and CIS region year-to-datedue to challenging market conditions
● Negative currency impacts in H1 2016
● Strong cost management
Fibre Packaging
Underlying operating profit, margin and ROCE
€ million
24
1) Fresh fruit and vegetables

49 59 64
10.9% 10.7%11.6%
6.7%8.0% 8.4%
H1 2015 H2 2015 H1 2016ROCE Underlying operating profit margin
H1 2016
● Underlying operating profit up 31% on H1 2015
● Supported by
○ Strong volume growth in higher value-added segments○ Benefits from commercial excellence initiatives ○ Good contribution from acquisitions in 2015 (Ascania
and KSP)
Q3 2016
● Acquisitions of Kalenobel (Turkey) and Uralplastic (Russia) completed in July 2016
○ Increase exposure to growing markets○ Enhanced product offering○ Small net charge expected in H2 2016 due to
transactions costs and effects of acquisition accounting
Consumer Packaging
Underlying operating profit, margin and ROCE
€ million
25
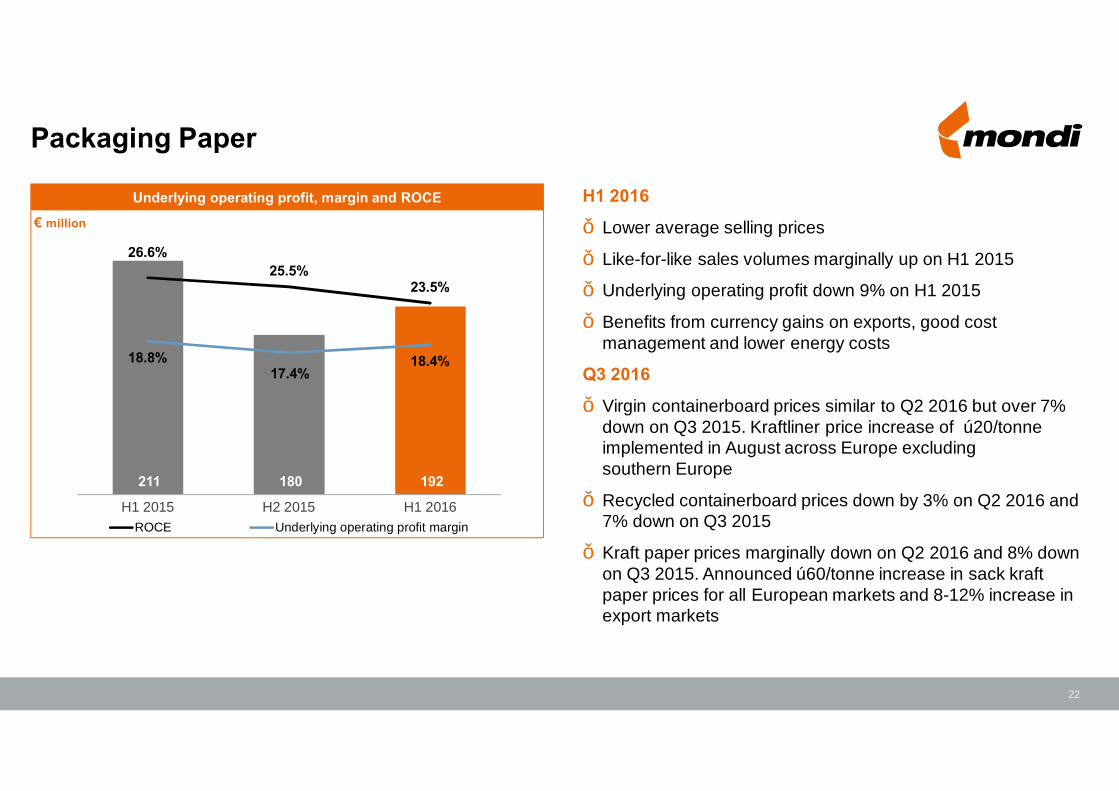
113 99 133
19.4%
25.6%
30.3%
18.1%16.3%
21.3%
H1 2015 H2 2015 H1 2016ROCE Underlying operating profit margin
H1 2016
● Strong performance with 18% increase in underlying operating profit vs H1 2015
● Stable sales volumes compared to H1 2015, despite industry demand contraction
● Benefits from lower input costs
Q3 2016
● UFP prices down 1% on Q2 2016 and marginally down on Q3 2015 on seasonally weak demand and pressure from imports
● Pricing stabilising, order books have strengthened into the seasonally stronger winter months
● Marginally stronger Rouble resulted in translation gain
Uncoated Fine Paper
Underlying operating profit, margin and ROCE
€ million
26

69 92 98
22.9%
30.1%
37.4%
22.0%
27.2%
33.8%
H1 2015 H2 2015 H1 2016ROCE Underlying operating profit margin
H1 2016
● Strong performance, underlying operating profit up 42% on H1 2015
● Higher average domestic selling prices across all grades offset by lower export pulp prices
● Fair value gains on forestry assets
○ €25 million up on H1 2015○ Level of gain not expected to repeat in H2 2016
● Richards Bay shut scheduled for Q4 2016 (Q1 2015)
Q3 2016
● Results impacted by
○ Notable strengthening of the rand ○ Weakness of USD pulp price (down 16% on Q3 2015
and 3% on Q2 2016)
● Forestry gains lower as expected (€8m in Q3 compared to €48m in H1 2016)
South Africa Division
Underlying operating profit, margin and ROCE
€ million
27

Group overview
Highlights from H1 2016
Business Unit reviews and Q3 trading update
Appendix
28

100% 72% 100% 11% 42% 100%
28% 100% 24% 35%
57% 11%
8%12% 12%
Whi
te-to
p kr
aftli
ner
Unb
leac
hed
kraf
tline
r
NS
SC
flut
ing
Rec
ycle
d flu
ting
Unb
leac
hed
sack
kraf
t pap
er UFP
²
BH
KP
(pul
p)³
Low-cost asset base
% capacity in cost quartile across main grades¹
Q4
Q3
Q2
Q1
29
1) Delivered to Frankfurt except where noted2) Includes specialities3) Delivered to Rotterdam Source: RISI and Mondi estimates, Q1 2016. Average Q1 2016 EUR/RUB FX rate of 82.45.

Pulp and paper integration
Note: Consumption represents total consumption by Mondi’s downstream operations, including consumption of externally produced paper. Above figures are for 2015.
Pulp
Recycled containerboard
Virgin containerboard
Kraft paper
Self sufficient
~ 60% integration
~ 20% integration
~ 70% integration
4.0
3.8
0.2
Net positionConsumptionProduction
0.3 1.41.7
Net positionProduction Consumption
0.7
0.50.2
ConsumptionProduction Net position
1.2
0.7 0.5
Net positionConsumptionProduction
million tonnes
million tonnes
million tonnes
million tonnes
30

Market positions sources and definitions
Mondi region definitions:Europe - Europe including Russia and TurkeyEmerging Europe - Albania, Armenia, Azerbaijan, Belarus, Bosnia and Herzegovina, Bulgaria, Croatia, Cyprus, Czech Republic, Estonia, Georgia, Hungary, Latvia, Lithuania, Macedonia, Malta, Moldova, Montenegro, Poland, Romania, Serbia, Slovakia, Slovenia, Turkey, Ukraine
North America: Canada, Mexico, USA
Sources for market position estimates:Virgin containerboard (VCB) Europe and Containerboard emerging Europe based on capacity - Source: RISI European Paper Packaging Capacity Report October 2015 and Mondi estimatesKraft paper Europe based on capacity - Source: RISI European Paper Packaging Capacity Report, RISI Mill Asset Database, Pöyry Smart Terminal Service and Mondi estimates
Industrial bags Europe based on sales volume - Source: Eurosac, Freedonia World Industrial Bags 2011 study (revised in 2013) and Mondi estimatesIndustrial bags North America based on sales volumes - Source: Mondi estimatesCorrugated packaging emerging Europe based on production - Source: Henry Poole Consulting and Mondi estimates
Extrusion coatings Europe based on sales volumes - Source: AWA Extrusion Coated Materials European Market Study version 2015 and Mondi estimatesCommercial release liner Europe based on sales volumes - Source: AWA Global Industrial Release Liner AWAreness report 2015 and Mondi estimatesUncoated Fine Paper (UFP) Europe based on sales volumes, Ilim JV considered separate from IP – Source: Euro-Graph delivery statistics, EMGE Woodfree Forecast , EMGE World Graphic Papers, Pyrabelisk / Eastconsult and Mondi estimatesBleached Hardwood Kraft Pulp (BHKP), White-top Kraftliner (WTKL) and UFP South Africa based on management estimates
31

Forward-looking statements disclaimer
This document includes forward-looking statements. All statements other than statements of historical facts included herein, including, without limitation, those regarding Mondi’s financial position, business strategy, market growth and developments, expectations of growth and profitability and plans and objectives of management for future operations, are forward-looking statements. Forward-looking statements are sometimes identified by the use of forward-looking terminology such as ‘believe’, ‘expects’, ‘may’, ‘will’, ‘could’, ‘should’, ‘shall’, ‘risk’, ‘intends’, ‘estimates’, ‘aims’, ‘plans’, ‘predicts’, ‘continues’, ‘assumes’, ‘positioned’ or ‘anticipates’ or the negative thereof, other variations thereon or comparable terminology. Such forward-looking statements involve known and unknown risks, uncertainties and other factors which may cause the actual results, performance or achievements of Mondi, or industry results, to be materially different from any future results, performance or achievements expressed or implied by such forward-looking statements. Such forward-looking statements and other statements contained in this document regarding matters that are not historical facts involve predictions and are based on numerous assumptions regarding Mondi’s present and future business strategies and the environment in which Mondi will operate in the future. These forward-looking statements speak only as of the date on which they are made.
No assurance can be given that such future results will be achieved; various factors could cause actual future results, performance or events to differ materially from those described in these statements. Such factors include in particular but without any limitation: (1) operating factors, such as continued success of manufacturing activities and the achievement of efficiencies therein, continued success of product development plans and targets, changes in the degree of protection created by Mondi’s patents and other intellectual property rights and the availability of capital on acceptable terms; (2) industry conditions, such as strength of product demand, intensity of competition, prevailing and future global market prices for Mondi’s products and raw materials and the pricing pressures thereto, financial condition of the customers, suppliers and the competitors of Mondi and potential introduction of competing products and technologies by competitors; and (3) general economic conditions, such as rates of economic growth in Mondi’s principal geographical markets or fluctuations of exchange rates and interest rates.
Mondi expressly disclaims
a) any warranty or liability as to accuracy or completeness of the information provided herein; andb) any obligation or undertaking to review or confirm analysts’ expectations or estimates or to update any forward-looking statements to reflect any change in Mondi’s expectations or any events that occur or circumstances that arise after the date of
making any forward-looking statements, unless required to do so by applicable law or any regulatory body applicable to Mondi, including the JSE Limited and the LSE.
32