Embed Size (px)
Citation preview

The Role of Stem Cell Graft Derived Natural Killer Cells in Regulating Patient Outcomes from
Allogeneic Haematopoietic Stem Cell Transplantation
By
LUKE MAGGS
A thesis submitted to
The University of Birmingham
for the degree of
DOCTOR OF PHILOSOPHY
The Institute of Immunology and Immunotherapy College of Medical and Dental Sciences
University of Birmingham Edgbaston
Birmingham B15 2TT
August 2018
University of Birmingham Research Archive
e-theses repository This unpublished thesis/dissertation is copyright of the author and/or third parties. The intellectual property rights of the author or third parties in respect of this work are as defined by The Copyright Designs and Patents Act 1988 or as modified by any successor legislation. Any use made of information contained in this thesis/dissertation must be in accordance with that legislation and must be properly acknowledged. Further distribution or reproduction in any format is prohibited without the permission of the copyright holder.

I
Abstract
Myeloid and lymphoid malignancies are potentially curable through a graft versus
leukaemia (GvL) effect following allogeneic haematopoietic stem cell transplantation.
Whilst donor T cell are thought to be the main mediators of GvL, the effect of donor
NK cells within HLA matched T cell depleted transplant setting is more unclear.
Patient blood samples were analysed during the first month post-transplant, with
higher reconstitution of NK cells at two weeks conferring a relapse protection
association. Donor stem cell graft samples, from which NK cells within the patient at
two weeks are thought to be derived, similarly displayed a strong association
between high NK cell dose and protection from disease relapse. CD56dimDNAM+ NK
cells were found to be the population with the most significant association. The ability
of NK cells to kill AML blasts in a DNAM dependent manner was shown indicating
that direct killing of residual tumour cells may be a valid mechanism of GvL. These
findings suggest that optimising the number of NK cells within stem cell grafts should
be considered as a means to prevent disease relapse.

II
Acknowledgements
Firstly, I would like to thank my lead supervisor Professor Paul Moss for initiating my
interest in haematopoietic stem cell transplantation and continuing to encourage me
throughout my research. Additionally, my co-supervisors Dr Jianmin Zuo and Dr
Francesca Kinsella were instrumental in shaping this project. Their continual support
and advice throughout has made it all possible.
My colleagues in the ‘Moss Group’, specifically Dr Tracey Chan, who conducted the
microarray and showed me in the correct way to assess clinical data; Dr Duncan
Murray for his love of R programming and passing some of that enthusiasm on to
me; Dr Wayne Croft for his assistance with the gene set enrichment analysis; Dr
Suzy Eldershaw who was always there to answer any question I may have; Tanuja
Rai and Mirjana Sirovica who helped with the collection and processing of samples;
and Dr Louise Hosie for her loyal friendship over the years.
Professor Constanze Bonifer and members of her group kindly donated the AML cell
lines used for functionality assays. Mohammad Ashab Uddin and Phil Jenkins from
the NHS Blood and Transplant unit collected data on the absolute counts of cells
within the stem cell grafts. Jane Nunnick was invaluable consenting patients on the
ward and collating all the clinical data. Likewise, the nurses and staff on Ward 625
who preserved the stem cell graft samples and collected the blood samples.
Most importantly I would like to thank the patients for consenting. Their willingness to
assist in this research despite their situation is incredible and will hopefully lead to
improved outcomes for future patients.
Finally, I would like to thank the Medical research council (MRC) and Bloodwise for
their funding which has contributed towards this research.

III
Publication arising from this thesis:
Luke Maggs, Francesca Kinsella, Y. L. Tracey Chan, Suzy Eldershaw, Duncan
Murray, Jane Nunnick, Joanne Bird, Charles Craddock, Jianmin Zuo, Ram
Malladi, and Paul Moss. (2017). The number of CD56dim NK cells in the graft has a
major impact on risk of disease relapse following allo-HSCT. Blood Advances. 1
(19): 1589-1597.
(The full paper is attached as an appendix)

IV
Contents Chapter 1 – Introduction ........................................................................................... 1
Adaptive and innate immunity ............................................................................... 1
Tumour surveillance and immune evasion ........................................................... 5
Natural killer cells ..................................................................................................... 8
NK cell development ............................................................................................. 9
NK cell signalling receptors ................................................................................ 14
NK cell self-tolerance and education .................................................................. 19
Mechanism of NK cell cytotoxic function ............................................................ 21
NK cell repertoire diversity .................................................................................. 24
Haematopoietic stem cell transplantation .............................................................. 27
Donor selection and apheresis ........................................................................... 27
G-CSF mobilised grafts ...................................................................................... 29
Conditioning and T cell depletion ........................................................................ 31
Immune reconstitution following allo-HSCT ........................................................ 32
Graft versus leukaemia and graft versus host disease ....................................... 34
Patient and donor influences on allo-HSCT outcome ......................................... 37
Impact of stem cell graft composition on transplant outcomes ........................... 41
NK cells in HSCT ................................................................................................... 44
NK cell immune reconstitution following allo-HSCT ............................................ 44
NK cell impact on patient outcomes ................................................................... 46
NK cell GvL effect ............................................................................................... 48
NK cell immunotherapy in allo-HSCT ................................................................. 51
Aims and objectives ............................................................................................... 53
Chapter 2 – Materials and Methods ....................................................................... 54
Reagents ................................................................................................................ 54
Media and solutions ............................................................................................ 54
Commercial kits and beads ................................................................................ 54
Patient sample collection ....................................................................................... 55
Peripheral blood sample collection and patient cohort ....................................... 55
Stem cell graft sample collection and patient cohorts ......................................... 58

V
Absolute counts .................................................................................................. 63
PBMC isolation and tissue culture ......................................................................... 65
PBMC isolation from peripheral blood ................................................................ 65
Mononuclear cell isolation from stem cell graft ................................................... 65
Cell counting ....................................................................................................... 66
Cryopreservation and recovery of cells .............................................................. 66
Cell culture .......................................................................................................... 67
Flow cytometry ....................................................................................................... 68
Immunophenotyping ........................................................................................... 68
Flow cytometry .................................................................................................... 69
Gating strategies ................................................................................................. 72
Cellular assays ....................................................................................................... 78
G-CSF assay ...................................................................................................... 78
Justification of NK cell assay .............................................................................. 79
NK cell functional assay ...................................................................................... 81
Molecular Assays ................................................................................................... 86
ULBP06 genotyping and patient cohort .............................................................. 86
Microarray ........................................................................................................... 91
Statistical analysis .................................................................................................. 92
Clinical outcomes ................................................................................................ 92
Clinical outcome statistical analysis .................................................................... 93
General statistical analysis ................................................................................. 94
Chapter 3 - Lymphocyte reconstitution within the first month following allo-HSCT ......................................................................................................................... 96
Results ................................................................................................................... 97
Cellular reconstitution during the first month following allo-HSCT ...................... 97
NK Cell subset reconstitution dynamics ........................................................... 100
T cell subset reconstitution dynamics ............................................................... 100
Patient Outcomes ............................................................................................. 103
Assessment of T and NK cell reconstitution associations with patient outcome .......................................................................................................................... 103
Association of high or low T cell reconstitution with patient outcomes ............. 107
Association of high or low NK cell reconstitution with patient outcome ............ 109

VI
CD56bright and CD56dim NK cell reconstitution associates with protection from relapse .............................................................................................................. 111
Myeloid and lymphoid disease split .................................................................. 113
ULBP06*01 patient genotype is associated with increased survival after allo-HSCT ................................................................................................................ 115
Cell number in the stem cell graft does not determine cell count in the peripheral blood during the first month post allo-HSCT ..................................................... 118
Discussion ............................................................................................................ 121
Summary ........................................................................................................... 121
T cell reconstitution ........................................................................................... 121
NK cell reconstitution ........................................................................................ 122
ULBP06 haplotype effect .................................................................................. 124
Limitations ......................................................................................................... 125
Conclusions ...................................................................................................... 126
Chapter 4 – Comparison of the phenotype and function of NK cells from the stem cell graft and healthy individuals ............................................................... 127
Results ................................................................................................................. 128
Comparison of RNA expression identifies significant downregulation within stem cell graft NK cells .............................................................................................. 128
Characterisation of the lymphocyte repertoire within haemopoietic stem cell grafts ................................................................................................................. 131
NK cells from the stem cell graft display decreased cytotoxic capacity ............ 133
The influence of donor characteristics on the composition of the stem cell graft .......................................................................................................................... 139
G-CSF does not affect the composition of NK cells within the lymphocyte fraction nor the phenotype of unprimed peripheral blood NK cells in vitro .................... 141
The ability of NK cells taken from the stem cell graft to kill HLA-null target cells is reduced compared to those from healthy donors ............................................. 143
The phenotype of NK cells is related to their ability to mediate cytotoxicity of an MHC Class I negative target cell line ................................................................ 144
Discussion ............................................................................................................ 147
Summary ........................................................................................................... 147
Transcriptome differences ................................................................................ 148
Phenotypic differences ..................................................................................... 149
Cytotoxic differences ........................................................................................ 152

VII
Conclusions ...................................................................................................... 153
Chapter 5 – The influence of the composition of the stem cell graft on clinical outcome following allo-HSCT ............................................................................... 155
Results ................................................................................................................. 156
Assessment of cellular heterogeneity within the stem cell graft ....................... 156
Assessment with patient outcomes .................................................................. 158
Patients who receive high numbers of NK cells within the donor graft have a substantial reduction in the rate of disease relapse .......................................... 160
Multivariate analysis confirms that infusion of a stem cell graft with an NK cell dose that is above the median value is a determinant of the risk of relapse .... 165
The number of CD56dim NK cells within the stem cell graft is the predominant determinant of the risk of disease relapse ........................................................ 168
The influence of the NK cell dose on clinical outcome in patients with myeloid or lymphoid disease .............................................................................................. 170
Validation in a secondary cohort trends towards an association between high NK dose in the stem cell graft and protection from relapse .................................... 172
Discussion ............................................................................................................ 173
Summary ........................................................................................................... 173
Impact of NK cell dose on the strength of the GvL effect post-transplant ......... 173
Impact of T cell depletion .................................................................................. 176
Overall survival ................................................................................................. 177
Other influences on the frequency of disease relapse ...................................... 179
Conclusions ...................................................................................................... 181
Chapter 6 - Phenotypic and functional analysis of stem cell graft NK cells ... 182
Results ................................................................................................................. 183
Phenotypic analysis of NK cell markers within the stem cell graft and their association with incidence of relapse within the patient ................................... 183
Association between NK cell phenotype in the stem cell graft and additional clinical outcomes .............................................................................................. 187
Validation that low expression of DNAM and KIR on CD56dim NK cells within the stem cell graft is associated with an increased risk of disease relapse ............ 187
The pattern of co-expression of activatory markers on NK cells in the stem cell graft and clinical outcome ................................................................................. 192

VIII
The influence of donor CMV serostatus on NK cell phenotype within the stem cell graft ............................................................................................................ 193
The pattern of chemokine receptor expression differs on NK cells within stem cell grafts received by patients who go on to relapse ....................................... 195
No difference in NK cell killing between cells received by patients who went on to relapse and those that did not .......................................................................... 198
Assessment of NK cell cytotoxicity against AML target cells in vitro ................ 199
DNAM inhibition significantly reduces NK cell cytotoxicity against AML target cells in vitro ....................................................................................................... 201
Discussion ............................................................................................................ 203
Summary ........................................................................................................... 203
The potential importance of DNAM in relation to the mechanisms of GvL ....... 203
The potential importance of KIR expression on NK cells and risk of relapse ... 205
Chemokine receptor expression and risk of disease relapse ........................... 206
Conclusions ...................................................................................................... 207
Chapter 7 – General Discussion .......................................................................... 209
Summary ......................................................................................................... 209
NK cells and the allogeneic immune response post allo-HSCT ....................... 210
Hypothesis ........................................................................................................ 220
Acquisition of optimal NK cell grafts for patients undergoing allo-HSCT .......... 222
Influence of T cell depletion method on NK cell number and function .............. 224
Impact of post-transplant factors on NK cell function ....................................... 226
Potential clinical applications ............................................................................ 229
Strengths and limitations of this study .............................................................. 238
Overall findings ................................................................................................. 240
Concluding remarks .......................................................................................... 241
References ............................................................................................................. 242
Appendix ................................................................................................................ 273

IX
Figure Contents
Chapter 1 Figure 1.1 – Adaptive and innate immune response ................................................ 3
Figure 1.2 – NK cell maturation .............................................................................. 11
Figure 1.3 – NK cell receptors and ligands ............................................................ 16
Figure 1.4 - Allogeneic haematopoietic stem cell transplantation .......................... 28
Figure 1.5 - Timeline of allo-HSCT ......................................................................... 35
Chapter 2 Figure 2.1 - Samples taken from patients undergoing allo-HSCT .......................... 55
Figure 2.2 – Measurement of T and NK cell populations within the stem cell graft 63
Figure 2.3 – Calculation of lymphocyte number using Trucount™ beads .............. 64
Figure 2.4 – Gating strategy validation .................................................................. 72
Figure 2.5 – Post-transplant reconstitution panel gating strategy .......................... 73
Figure 2.6 – NK signalling receptor panel gating strategy ..................................... 74
Figure 2.7 – NK functionality marker panel gating strategy ................................... 75
Figure 2.8 – NK exhaustion marker panel gating strategy ..................................... 76
Figure 2.9 – NK chemokine receptor panel gating strategy ................................... 77
Figure 2.10 – Optimisation of assays of NK cell function ...................................... 81
Figure 2.11 – NK cell purity following enrichment .................................................. 82
Figure 2.12 – Variation in bead number between samples ................................... 84
Figure 2.13 – NK cell functionality assay ............................................................... 85
Figure 2.14 – ULBP06 genotype associations with patient outcomes ................... 89
Chapter 3 Figure 3.1 – Lymphoid subsets in healthy peripheral blood .................................. 99
Figure 3.2 – Immune reconstitution during first month post allo-HSCT ............... 101
Figure 3.3 – T cell reconstitution dynamics .......................................................... 102
Figure 3.4 – Association of T and NK cell reconstitution with clinical outcome ... 106
Figure 3.5 – The association of early T cell reconstitution with clinical outcome 108
X
Figure 3.6 – The association of early NK cell reconstitution with clinical outcome ............................................................................................................................. 110
Figure 3.7 – NK cell subset reconstitution may be protective from relapse ......... 112
Figure 3.8 – NK cell reconstitution at day 14 post allo-HSCT and association with disease relapse in patients with myeloid or lymphoid disease ............................ 114
Figure 3.9 – The association of ULBP06 genotype with patient outcome ........... 116
Figure 3.10 – Relative expression of NKG2D+ on CD56dim NK cells post-transplant ............................................................................................................ 117
Figure 3.11 – No correlation is observed between the composition of the stem cell graft and the number of cells in peripheral blood within the first month post-transplant ............................................................................................................ 119
Figure 3.12 – No correlation is observed between stem cell graft CD34+ dose and peripheral blood cell count in first month post-transplant .................................... 120
Chapter 4 Figure 4.1 – Microarray data demonstrates differences in RNA expression between NK cells in stem cell graft and those from healthy individual ................. 130
Figure 4.2 – The percentage of T and NK cells is decreased in stem cell grafts 132
Figure 4.3 – Flow plots displaying comparison between NK cells in peripheral blood and stem cell grafts ................................................................................... 134
Figure 4.4 – Phenotypic differences between healthy individual and stem cell graft NK cells ................................................................................................................ 135
Figure 4.5 – Phenotypic differences between CD56dim NK cells from healthy individual and those from the stem cell graft ....................................................... 137
Figure 4.6 – Phenotypic differences between CD56bright NK cells from healthy individuals and from the stem cell graft ............................................................... 138
Figure 4.7 – Donor age does not influence the dose of the NK cells within the stem cell graft ...................................................................................................................... 139
Figure 4.8 – Phenotypic differences between NK cells within stem cell grafts from CMV seronegative and seropositive donors ....................................................... 140
Figure 4.9 – In vitro exposure to G-CSF does not alter the phenotype of unprimed peripheral blood NK cells following culture ......................................................... 142
Figure 4.10 – NK cells from healthy donors and those from stem cell graft grafts exhibit differential capacity for lysis of target cells .............................................. 144
Figure 4.11 – Correlation between expression of markers on CD56dim NK cells and cytotoxic activity ................................................................................................... 146

XI
Figure 4.12 – PD-1 blockade of PD-1+ NK cells taken from the stem cell graft improves killing of 721.221 cells ......................................................................... 154
Chapter 5 Figure 5.1 – The number of T cells and NK cells delivered within the stem cell product differs greatly between patients .............................................................. 157
Figure 5.2 – The dose of NK cells in the stem cell product is protective against disease relapse .................................................................................................... 161
Figure 5.3 – Receiver operating curve of NK cell dose and incidence of relapse 162
Figure 5.4 – The absolute number of NK cells in the stem cell product is protective against disease relapse ....................................................................................... 163
Figure 5.5 – The percentage of NK cells in the stem cell product is protective against disease relapse ....................................................................................... 164
Figure 5.6 – CD56dim NK cells within the stem cell product are the major contributing factor to the association with disease relapse risk ........................... 169
Figure 5.7 – NK cell dose effect in myeloid and lymphoid allo-HSCT patients ... 171
Figure 5.8 – A trend towards a protective effect of a high NK cell dose in the stem cell graft and protection from disease relapse is observed in a second patient cohort .................................................................................................................. 172
Figure 5.9 – The NK cell dose remains protective for patients who received an alemtuzumab-conditioned transplant .................................................................. 175
Figure 5.10 – Expression of CD52 on lymphocytes in stem cell graft samples ... 177
Chapter 6 Figure 6.1 – Phenotypic analysis of NK cells within the stem cell graft in patients who remained in remission and those who relapsed .......................................... 185
Figure 6.2 – Phenotypic analysis of CD56bright and CD56dim NK cells within the stem cell graft in patients who remained in remission and those who relapsed . 186
Figure 6.3 – Association between the phenotype of NK cells within the stem cell graft and overall survival ..................................................................................... 188
Figure 6.4 – Association between the phenotype of NK cells within the stem cell graft and acute GvHD ......................................................................................... 189
Figure 6.5 – Association between the phenotype of NK cells within the stem cell graft and non-relapse mortality ........................................................................... 190
Figure 6.6 – Patients receiving NK cells with high DNAM+ or KIR+ CD56dim expression within stem cell graft demonstrate a reduced incidence of disease relapse ................................................................................................................ 191

XII
Figure 6.7 – The pattern of co-expression of activatory receptors on NK cells within the stem cell graft in relation to clinical outcome of relapse or non-relapse ........ 192
Figure 6.8 – The influence of age and CMV serostatus on NK cell phenotype within the stem cell graft ................................................................................................. 194
Figure 6.9 – Chemokine receptor expression on NK cells within the stem cell graft and association with subsequent outcome ......................................................... 196
Figure 6.10 – Chemokine receptor expression on NK cell subsets within the stem cell graft and association with subsequent risk of relapse .................................. 197
Figure 6.11 – The capacity of NK cells from stem cell grafts to kill MHC class I null target cell line does is not related to subsequent relapse incidence ................... 198
Figure 6.12 – The ability of NK cells to lyse AML cell lines and primary AML cells ............................................................................................................................. 200
Figure 6.13 – NK cells can kill AML cells in a manner that is partially dependent on DNAM-specific lysis ............................................................................................ 202
Chapter 7 Figure 7.1 – The phenotype of NK cells in the stem cell graft is correlated with disease relapse at 1 year .................................................................................... 213
Figure 7.2 – Model of the potential beneficial effects of CD56dim stem cell graft dose and DNAM expression frequency ................................................................ 220
Figure 7.3 – NK cells from the stem cell product may act in either a direct or indirect manner to produce a GvL effect .............................................................. 221

XIII
Table Contents
Chapter 2 Table 2.1 – Post-transplant patient cohort characteristics ..................................... 57
Table 2.2 – Stem cell graft and healthy donor comparison cohort characteristics . 59
Table 2.3 – Stem cell graft composition association with outcomes cohort characteristics ........................................................................................................ 61
Table 2.4 – Characteristics of patients within the secondary cohort ...................... 62
Table 2.5 – Post-transplant reconstitution panel .................................................... 70
Table 2.6 – NK signalling receptor panel ............................................................... 70
Table 2.7 – NK functionality marker panel ............................................................. 71
Table 2.8 – NK exhaustion marker panel ............................................................... 71
Table 2.9 – NK chemokine receptor panel ............................................................. 71
Table 2.10 – Primer sequences used to identify ULBP06 SNPs ........................... 88
Table 2.11 – ULBP06 genotyped patient characteristics ....................................... 90
Chapter 3 Table 3.1 – Post-transplant samples assessed ..................................................... 97
Table 3.2 – Clinical outcomes of patients at two years post-transplant ............... 105
Chapter 5 Table 5.1 – Clinical outcomes within the study cohort ............................................... 159
Table 5.2 – Univariate analysis of patient characteristics and cell doses ............ 166
Table 5.3 – NK cell dose remains an independent predictor of relapse incidence in a multivariate analysis .......................................................................................... 167

1
Chapter 1 – Introduction
This introduction aims to give the reader a background into the scientific areas
investigated in this PhD project. The fundamental basis of immunology, and more
specifically natural killer (NK) cells, are discussed first. The principles and application
of allogeneic haematopoietic stem cell transplantation (allo-HSCT) is then defined,
followed by a summary of the relevant literature concerning NK cell involvement
within this setting.
Adaptive and innate immunity
The development of independent multicellular life some 800 million years ago
brought with it the challenge of recognising self and non-self. The immune system
has evolved with a primary role of protecting the body from infectious challenge and
utilises a wide variety of cell types, tissues and organs that have developed to
achieve this. Through the identification and removal of foreign or transformed cells,
and the maintenance of a memory of past infections, the immune system acts as a
vital regulator of body homeostasis. The reaction of the immune system when
encountering foreign material can broadly be split into the more evolutionarily
conserved innate response, driven by cells which recognise foreign or transformed
molecules, and an adaptive response which develops to specifically eliminate and
create a memory of an infection.
The generation of an adaptive immune response, and subsequent expansion of
antigen-specific cells, can take several days and the immediate innate immune

2
response is therefore important to initiate recognition, restrict the proliferation of an
infected or transformed cell and promote an adaptive immune response (Figure 1.1).
Lymphocytes are nucleated blood cells which act as the main mediators of the
immune system. They form from haematopoietic stem cells within the bone marrow
which can differentiate into many different subsets. For the purposes of this thesis,
the three major lymphocyte cell types derived from the common lymphoid progenitor
(CLP) are referenced. Natural killer cells and antibody producing B cells develop in
the bone marrow. In contrast, CLPs which home to the thymus generate cells of the
T lymphocyte lineage. Lymphocytes migrate out of these primary lymphoid organs
into the bloodstream where they home to tissues and the lymphatic system. Lymph
fluid transports lymphocytes to the secondary lymphatic tissues such as lymph
nodes and the spleen. Lymphocytes are present in varying quantities throughout the
body, within the lymphatic system, peripheral blood and various bodily tissues and
are therefore suitably located to respond to antigenic challenge.
Natural killer (NK) cells are considered to be a component of the innate immune
system due to their ability to identify target cells through a broad repertoire of both
activatory and inhibitory receptors on their cell surface. These receptors detect the
presence or absence of ligands, rather than being ‘specific’ for an individual target
structure as observed for T and B cell recognition (Lanier 2005; Moretta & Moretta
2004b). This allows NK cells to become activated when they recognise targets that
trigger an internal signalling reaction above a critical threshold (Holmes et al. 2011).
The innate system response also includes macrophage, neutrophil and dendritic
cells which mediate a range of functions, and have prominent phagocytic roles,
engulfing dead and foreign molecules that they encounter. Dendritic cells are also
known as antigen presenting cells (APC) and provide the main link between the

3
innate and adaptive responses. An innate response is vitally important upon initial
infection to directly remove foreign material as well as initiating an inflammatory
response and signalling through the release of cytokines to promote migration and
activation of adaptive immune cells (Martinez et al. 2008).
The adaptive immune system produces a specialised response against foreign (non-
self) cells as well as long lasting memory against specific pathogens. This process is
initiated by immature APCs engulfing cells and proteins and presenting peptides on
their surface using major histocompatibility complex (MHC) molecules. Almost all
cells of the body present peptides on their surface through MHC molecules in this
way. During synthesis, the MHC protein incorporates a short peptide onto its surface
Figure 1.1 – Adaptive and innate immune response Infected or transformed cells can be recognised by members of the innate immune system. Natural killer cells may spontaneously eliminate cells if they are deemed “non-self”. Antigen presenting cells can present peptides on the surface which can be recognised by adaptive immune T cells driving expansion of cytotoxic antigen specific CD8+ T cells. B cell response can also be initiated producing antibodies against the target cell, marking them for lysis.

4
which stabilizes its structure and allows it to be displayed on the surface of the cell.
MHC class I molecules are found on most cell types and collect peptides from
proteins made in the cytosol whilst MHC class II molecules are only found on
subsets of cells within the immune system such as APC, and are recognised by
CD4+ T cells (Holling et al. 2004).
Mature APC will migrate to lymphoid tissues and present peptides to cells of the
adaptive immune system (Lim et al. 2012). If a T lymphocyte expressing an antigen
specific T cell receptor (TCR) engages with the MHC-peptide complex with sufficient
affinity it will become activated and undergo proliferation and differentiation. A wide
range of functional T cell subsets are generated in this process including CD8+ T
lymphocytes (CTL) with cytotoxic function, CD4+ T helper cells and regulatory
CD4+FoxP3+ T cells (Treg) which act to control immune responses (Ma et al. 2012;
Murphy et al. 2008). Of note, B lymphocytes can also undergo somatic
hypermutation to derive a surface immunoglobulin with increased affinity for the
antigen. Broadly speaking, the primary role of CTL is to eliminate target cells whilst a
subset of B cells can differentiate into plasma cells and relocate to the bone marrow
where they secrete antibodies into the blood stream (Shulman et al. 2011; Murphy et
al. 2008). The antibodies can then bind to their antigen and renders them susceptible
to elimination through processes such as antibody-dependent cell-mediated
cytotoxicity (ADCC) and complement fixation. Most of the effector cells generated
through a primary adaptive immune response will subsequently undergo apoptosis
but a proportion are retained as memory cells to provide a more rapid response
should re-encounter with the antigen occur (Gray 2002).

5
Tumour surveillance and immune evasion
Cancer arises from the accumulation of somatic mutations and epigenetic
modifications that leads to uncontrolled cellular proliferation. Cancer represents a
significant threat for multicellular organisms and the immune system performs an
important ‘surveillance’ role, monitoring the body for transformed cells and mediating
their elimination.
It is now clear that the rate of tumour development is greatly increased in many
immunodeficient mouse strains (Swann & Smyth 2007). Immunodeficient mice are
also more susceptible to tumours induced by chemical carcinogens (Engel et al.
1997). Similarly, there is a higher risk of tumour development in immunosuppressed
human patients although the range of tumours that is observed is of a more limited
spectrum in comparison to the general population (Penn 1988; Buell et al. 2005).
The development of spontaneous tumours in mice is also associated with
impairment of immune function, such as loss of cytotoxic molecules or cytokine
responses (Smyth et al. 2000; Street et al. 2002). Tumour cells are rejected in
syngeneic transplantation models, indicating that ‘tumour-specific’ antigens are likely
to be present (Burnet 1970).
Both adaptive and innate immune systems are involved in tumour surveillance
(Swann & Smyth 2007). Whilst T cells are considered the primary effector cells in
this, the role of NK cells, which are capable of directly killing tumour cells, is also
important to consider (Marcus et al. 2014). As discussed later, the expression of
‘stress’ ligands can render tumour cells highly immunogenic, primarily for elimination
by NK cells, whilst the generation of ‘neo-antigens’ from somatically mutated cancer
genes is another dominant mechanism resulting in elimination by cytotoxic T cells

6
(Bauer et al. 1999; Diefenbach et al. 2001; Moretta et al. 2001). Despite this, cancer
is highly prevalent in the population and cancers can evolve a range of mechanisms
to evade detection by the immune system.
Such mechanisms of immune evasion include the downregulation of antigens and
cell adhesion molecules from the cell surface (Vinay et al. 2015; Beatty & Gladney
2015). Many malignant cells downregulate MHC class I expression as a way to avoid
T cell recognition (Garrido et al. 2016). Tumour cells can express ligands to
suppress immune responses such as PD-L1, which engage with inhibitory
‘checkpoint’ proteins on T cells and act to limit T cell function (Iwai et al. 2002).
Secretion of immunosuppressive cytokines such as TGF-β, TNF-α and VEGF
(Massagué 2008; Lind et al. 2004; Gabrilovich et al. 1996), recruitment of
immunosuppressive cells such as Tregs, tumour-associated macrophages (TAMs),
and myeloid-derived suppressor cells (MDSCs) and upregulation of phagocytic
inhibition signals such as CD47 are additional mechanisms of immune evasion
(Gajewski et al. 2013; Jaiswal et al. 2009).
These mechanisms of immune evasion are commonly observed in haematological
malignancies (Curran et al. 2017). Constitutive expression of PD-L1 and reduced
expression of MHC class II molecules, caused by chromosomal changes, is seen in
many cases of lymphoma (Green et al. 2010; Steidl et al. 2011). In leukaemia it is
thought that the disseminated nature of the tumour means that danger associated
molecular patterns (DAMPs) released upon immunogenic cancer cell death, which
lead to the maturation of dendritic cells, are not present at a sufficient concentration
to effectively produce a response (Zhang et al. 2013; Curran et al. 2016).
Additionally haematological tumours generally have a lower mutational burden

7
compared to most solid malignancies and as such there may be a more limited
repertoire of neo-antigens for presentation to T cells (Alexandrov et al. 2013).
Understanding the mechanisms that lead to tumour immune evasion is one of the
most important topics within medicine at the current time and may guide
appropriately beneficial approaches for improving the effectiveness of tumour
elimination through immunotherapeutic means (Gotwals et al. 2017).

8
Natural killer cells
Natural killer cells are innate lymphocytes and play an important role in elimination of
cells without prior sensitisation or activation. They are involved primarily in defence
against viral infection and in tumour cell surveillance. Human NK cells are generally
characterised as being CD3 negative (i.e. not T cells) and CD56 positive. CD56 is a
140kDa isoform of neural cell adhesion molecule (NCAM), however the precise
function of the protein on NK cells is not entirely clear. The degree of CD56 cell
surface expression varies, such that NK cells either display high or low amounts.
Generally, CD56bright NK cells are considered to be relatively immature and have a
primary cytokine producing immunoregulatory function, whilst mature CD56dim NK
cells display a cytotoxic effector function (Vivier et al. 2008). Further differentiation of
NK cells using CD16 (FcRgIII), an Fc portion antibody receptor found on the majority
of CD56dim cells, is also often used (Anegón et al. 1988; Cooper et al. 2001).
Humans born with genetic disorders that impair NK cell function display susceptibility
to viral infection and a high rate of premature death (Biron et al. 1989; Orange 2013).
Similarly, in mice the artificial depletion of NK cells, through injection of rabbit
antiserum against a glycosphingolipid present at the cell surface causing membrane
damage and loss of function, results in impaired control of viral infection (Bukowski
et al. 1983).
NK cells represent 5-15% of circulating lymphocytes in human peripheral blood and
they are also found in high numbers in lymphoid organs as well as throughout
various tissues such as skin, gut, liver, lung, uterus, kidney, joints and breast tissue
in normal physiological conditions (Carrega & Ferlazzo 2012). Murine models are
often used to assess NK cell function however it is important to note the differences

9
between murine and human NK cells. NK cells represent only 2–7% of circulating
lymphocytes in mouse peripheral blood and murine NK cells do not express CD56
meaning comparative differentiation studies cannot therefore be done with accuracy.
However, comparisons between CD11blowCD27high and CD11bhighCD27low NK cells
in mice and CD56 subsets in humans are of value (Hayakawa & Smyth 2006). In
contrast to the situation in humans, murine NK cells do not localise to lymph nodes in
the resting state, but this can happen following activation (Martín-Fontecha et al.
2004). Low levels of the cytotoxic proteins granzyme and perforin are found in
resting murine NK cells compared to the constitutively high levels expressed in
humans. Freshly isolated murine NK cells therefore display weaker cytotoxic activity
compared to those isolated from humans (Fehniger et al. 2007; Leong & Fehniger
2011). Whilst these considerations must be taken into account when translating
murine data to that in humans, murine NK cells do share a large amount of ontogeny
and functionality with human cells which has validated their use comparatively.
NK cell development
The origin of NK cells from haemopoietic tissue was first demonstrated with the
observation that severely depleted NK cell numbers were found in mice with an
impaired stem cell niche. Further work demonstrated that CD34+ haematopoietic
stem cells (HSCs) cultured on bone marrow stroma could differentiate into NK cells
in the presence of interleukin 15 (IL-15) and interleukin 2 (IL-2) (Kalland 1986). In
humans, CD34+ NK cell precursors and differentiated NK cells leave the bone
marrow to populate tissues throughout the body (Yu et al. 2013). These CD34+ NK
cells precursors can establish themselves in secondary lymphoid tissues and

10
generate significant numbers of CD56bright NK cells (Freud et al. 2005). The presence
of large numbers of dendritic cells expressing IL-15 in the secondary lymphoid
tissues is thought to encourage this differentiation (Mattei et al. 2001; Mrózek et al.
1996) as well as further maturation to a more cytotoxic CD56dim cell (Anguille et al.
2015). IL-15 is also involved in NK cell homeostasis and survival, and mice devoid of
IL-15 are unable to maintain mature NK cell numbers following adoptive transfer
(Koka et al. 2003).
The linear differentiation of human immature CD56bright into mature CD56dim NK cells
has been proven both in vitro and in vivo through stimulation with fibroblasts or
transfer to immune deficient mice (Chan et al. 2007). Additionally CD56bright cells
have longer telomeres compared to CD56dim cells suggesting their relative
immaturity (Romagnani et al. 2007).
Chemokines are chemoattractant cytokines which act on G-protein coupled
receptors to induce direct chemotaxis in nearby responsive cells. Most CD56bright NK
cells express high levels of the chemokine receptors CXCR3, CXCR4, CCR5 and
CCR7, as well as low levels of CX3CR1, and this maintains their preferential
localisation within secondary lymphoid tissues such as peripheral lymph nodes and
tonsils. CD56dim NK cells express high levels of CXCR1, CX3CR1 and CXCR4, as
well as low levels of CXCR2 and CXCR3. They account for approximately 90% of
NK cells in the circulating peripheral blood and are also present at higher proportions
than CD56bright cells in the bone marrow and spleen. Both mature and immature NK
cell subsets will migrate to sites of inflammation to assist in the innate immune
response (Maghazachi 2010).

11
The maturity and functional status of NK cells can be assessed through the
phenotypic expression of various extracellular and intracellular proteins (Figure 1.2).
Immature cytokine producing NK cells are defined by high expression of the ‘neural
cell adhesion molecule’ CD56 at the surface and are termed CD56bright. In general,
during these immature stages of NK cell development CD161, 2B4 (CD244) and the
activating receptor NKp44 are also expressed along with CD56 at the cell surface.
Figure 1.2 –NK cell maturation Phenotypic differences between immature CD56bright NK cells which possess high proliferative capacity and are primarily involved in cytokine production, and mature CD56dim NK cells which have a primarily cytotoxic function through the release of cytotoxic granules.

12
As CD56bright NK cells mature and develop a more cytotoxic function their expression
of CD56 decreases whilst expression of activatory receptors NKp46, NKp30, NKG2D
and DNAM-1, as well as the inhibitory receptor CD94/NKG2A, are subsequently
acquired (Moretta et al. 2001). CD16 and killer-cell immunoglobulin-like receptors
(KIR) are expressed later on, and production of the cytotoxic molecules perforin and
granzyme increases as cells develop a CD56dim phenotype. The levels of expression
of these receptors determines the balance between stimulatory and inhibitory
signalling that are received by the cell and the ultimate cytotoxic potential. An
intermediate stage between CD56bright and CD56dim cells can be identified with the
marker CD62L (Juelke et al. 2010). These cells possess the cytokine
responsiveness of the CD56bright cells and the receptor mediated activation capacity
of the CD56dim cells. Around half of the CD56dim NK cell population express CD57
and display greater cytotoxic capacity, decreased responsiveness to cytokines and a
reduced ability to proliferate, suggesting that it defines a population of terminally
differentiated cells (Lopez-Vergès et al. 2010).
NK cells proliferate relatively quickly and demonstrate a half-life of around 12 days in
humans (Zhang et al. 2007). Active proliferation of cells can be detected by the
presence of Ki-67, a nuclear protein which is present on the surface of chromosomes
during all active phases of the cell cycle where it can be detected by intracellular
staining (Scholzen & Gerdes 2000). In healthy individuals roughly 5% of peripheral
blood NK cell express Ki-67 to maintain homeostatic conditions, however following
infection or during tumour control NK cell proliferation can be increased to deal with
the threat.

13
The functional state of an NK cell population is also an important consideration. The
expression of activatory markers or the presence of cytotoxic molecules shows that
an NK cell has the potential to be functionally cytotoxic. Expression of CD107 is a
useful marker of recent cytotoxic activity (Alter. et al. 2004). This protein is also
known as lysosomal-associated membrane glycoprotein 1 (LAMP-1) as it commonly
resides on the lysosomal membranes of vesicles containing molecules ready to be
secreted within NK cells. An active NK cell will undergo degranulation to release both
cytokines and cytotoxic enzymes, requiring the lysosomes to fuse with the
extracellular membrane, resulting in an increase in the expression of CD107 at the
cell surface.
Exhaustion of NK cell function has been associated with the clinical states of cancer
and chronic infection (Bi & Tian 2017). Upregulation of the immune suppressor
receptor PD-1 is associated with reduced anti-tumour activity by NK cells (Della
Chiesa et al. 2016) and may be particularly prominent when seen in association with
Tim-3 (Ndhlovu et al. 2012). Low levels of IFN-g production and decreased levels of
activatory receptor and cytotoxic molecule expression are also seen in NK cells from
human intratumoural sites (Bi & Tian 2017). The transcription factors T-bet and
eomesodermin (Eomes) are crucial for NK cell development and maintenance of
maturity as their deletion results in NK cell reversion to an immature phenotype
(Simonetta et al. 2016). Both proteins are involved in the regulation of IFN-g
production whilst T-bet is also thought to be important in regulating cytotoxic activity
through production of perforin and granzyme B (Gordon et al. 2012). Loss of T-bet
and Eomes has been shown to result in poor NK cell mediated tumour control in a
murine model of melanoma, which could be recovered by adoptive transfer of wild
type NK cells (Werneck et al. 2008). However these transferred NK cells are then

14
susceptible to T-bet and Eomes downregulation and rapid exhaustion of cellular
function was shown in a lymphoma murine model (Gill et al. 2012). NK cell
downregulation of T-bet and Eomes following human allo-HSCT has also been
shown at around 8 months post-SCT and correlated with decreased NK function and
increased non-relapse mortality (Simonetta et al. 2015). Collectively these studies
highlight the important role that evasion of NK cell cytotoxic responses plays in the
development of tumours and this may be achieved, at least partly, by differentiation
of NK cells towards a more exhausted state.
NK cell signalling receptors
NK cells interact with their environment through expression of a wide range of
activatory and inhibitory receptors present at the extracellular membrane. NK
receptors are encoded by the germline and do not undergo RAG-mediated
recombination as occurs with T and B lymphocytes (Lanier 1986). The presence or
absence of ligands on the surface of stressed or transformed cells will induce
intracellular signalling responses which, depending on the individual NK cell
thresholds, will dictate its functional response (Lanier 2005) (Figure 1.3). Greater
signalling is required to induce cytokine release compared to degranulation whilst
chemokine induction requires the weakest signalling (Fauriat et al. 2010).
Killer cell immunoglobulin-like receptors (KIR) are one such family of receptors
whose intracellular domains confer inhibitory or activatory cytotoxic function. KIRs
are part of the leukocyte receptor complex (LRC) gene cluster, which includes the
killer lectin-like receptors (KLR), a group also containing both activatory and

15
inhibitory members (Moretta & Moretta 2004a). KIRs possess either two or three Ig-
like extracellular domains (KIR2D or KIR3D) and interact with HLA-Cw or HLA-A and
HLA-B alleles respectively. Activatory KIRs possess a short cytoplasmic domain and
a charged transmembrane region which associates with DAP12, an accessory
signalling protein containing an immunoreceptor tyrosine-based activation motif
(ITAM) (Radaev & Sun 2003). Upon ligand binding this ITAM becomes
phosphorylated, stimulating intracellular signalling pathways. Inhibitory KIRs possess
a long cytoplasmic domain containing an immunoreceptor tyrosine-based inhibition
motif (ITIM). Ligand binding to these receptors causes phosphorylation of a tyrosine
on the ITIM, which can then bind intracellular phosphatases itself. This localisation of
phosphatases near the cell membrane causes inhibition of signalling from other
activatory receptors by preventing stimulation of their ITAMs. Recent improvements
in super high resolution imaging have identified that nanoclusters of KIR receptors
are present at immune synapses between cells and that larger clusters result in
stronger downstream signalling (Oszmiana et al. 2016). When activated through
NKG2D ligands, the KIR nanoclusters reduce in size suggesting that the signalling
threshold to convey inhibition is reduced and is a dynamic process constantly
affected by changes in the environment.
NKG2 proteins form heterodimers with CD94 to create a receptor. Both proteins are
C-type lectins that together detect the presence of several MHC class I variants,
most importantly HLA-E. CD94 is encoded by a single gene and is therefore
invariant, whereas there are five NKG2 proteins (A, C, D, E and F) found in humans.
CD94/NKG2 receptors are thought to promote cell survival, with NKG2A and B
conferring an inhibitory cytotoxic influence and NKG2C, D and E an activatory one

16
(Gunturi et al. 2004). The function of NKG2F is not fully known, but it thought to
associate with DAP12 and activate NK cells (Huang et al. 2010).
NKG2D is an exception to the family as it does not dimerise with CD94 but forms a
complex with adaptor protein DAP10 (Wu et al. 1999). NKG2D also has different
ligands which are encoded from two different gene families, MIC and ULBP. This
includes the MHC class I-like MIC-A and MIC-B proteins and the RAET1 protein
family, three of which are ULBP proteins (Bauer et al. 1999). DAP10 does not
contain an ITAM and therefore the PI3-kinase signalling cascade produced upon
NKG2D ligand stimulation differs from that seen with most activatory receptors
(Raulet et al. 2013).
Figure 1.3 – NK cell receptors and ligands The activation of an NK cell is determined by a balance of signalling received from a repertoire of activatory and inhibitory receptors at the extracellular membrane. Ligands for activatory receptors are often upregulated on stressed or transformed cells.
NKG2D
NKp46
KIR-S
CD16
DNAM
NKp44
NKp30
ULBP, MICA, MICB
KIR-L
CD94/NKG2A
CD122, CD155
IgG
HLA C, B, A
HLA C
HLA E
Viral HA, B7-H6, pp65
NK Cell Target Cell

17
The natural cytotoxicity receptor (NCR) family of activatory proteins, NKp30, NKp44
and NKp46, were first identified in the late 1990s and named according to their
molecular weight (Sivori et al. 1997; Vitale et al. 1998; Pende et al. 1999). The gene
for NKp46 is located on chromosome 19 within the leukocyte receptor complex,
while NKp30 and NKp44 are on chromosome 6. All three have a short cytoplasmic
domain and associate with an ITAM. NKp46 expression is ubiquitous on NK cells,
NKp44 is found only on activated cells and NKp30 on mature NKs (Kruse et al.
2014). All three are capable of detecting viral ligands as well as those derived from
bacterial and parasitic sources, but conclusive identification of cellular ligands is
lacking. Tumour associated ligands have been shown for NKp44 and NKp30, but not
for NKp46. Interestingly NKp46 ligands have been found in insulin granules of
pancreatic β Langerhans cells (Gur et al. 2013). NK cells can kill β Langerhans cells
expressing the ligand and could therefore be involved in the pathogenesis of type 1
diabetes (Gur et al. 2010).
The Fcγ receptor CD16 has an essential activatory signalling role in inducing
antibody dependant cellular cytotoxicity (ADCC) against targets as well as some
antibody independent cytotoxic functionality (Mandelboim et al. 1999). Its stimulation
induces ITAM phosphorylation and can cause cell degranulation in resting NK cells
alone, whereas other activatory receptors require co-activation (Bryceson et al.
2005).
DNAM-1 (CD226) is a DNAX accessory molecule which acts as an adhesion
molecule and has been shown to confer cytotoxic functionality against a variety of
tumour targets (Shibuya et al. 1996). Upon cellular stimulation, DNAM polarises
towards the generating immunological synapse between an effector and target cell

18
and is thought assist lymphocyte function-associated protein 1 (LFA1) in creating
adhesion points around the synapse and stabilising the cytoskeleton (Hou et al.
2014; Martinet, Ferrari De Andrade, et al. 2015). DNAM does not associate with an
ITAM molecule, rather the intracellular domain is directly phosphorylated upon
activation to induce downstream phosphorylation of SLP-76 and Vav1, leading to
cytotoxic granule exocytosis as well as IFN-γ secretion (de Andrade et al. 2014;
Martinet, Ferrari De Andrade, et al. 2015).
The pattern of intracellular signalling that is induced by receptor engagement is
integrated in order to determine the cellular response. If the threshold for cytotoxic
activation is reached, NK cells can then secrete cytotoxic granules containing
granzyme and perforin by exocytosis (Smyth et al. 2005). Perforin proteins can
oligomerise to form membrane spanning pores on the target cell, at a neutral pH and
in the presence of Ca2+ (Voskoboinik et al. 2015). The pores formed by perforin
assist in the diffusion of granzymes into the cell, however the precise mechanism is
not fully understood. Once within the cytosol granzymes can induce target cell
apoptosis through cleavage of target cell proteins and initiation of cell death
pathways.
Alternatively, NK cells can kill a target through death receptor pathways. TNF family
proteins Fas ligand (FasL) and TNF-related apoptosis-inducing ligand (TRAIL)
expressed on NK cells can induce caspase dependent apoptosis when formation of
an immune synapse results in contact with their receptor on the surface of a target
cell (Smyth et al. 2005). Expression of FASL and TRAIL is regulated by IFN-γ, an
important cytokine in NK cell function.

19
CD56bright NK cells play an important immunoregulatory role within the immune
system. They comprise the major NK cell population within the secondary lymphoid
organs and are in contact with APCs and T cells (Caligiuri 2008). Activation of NK
cells by interleukins or activatory receptors results in the production of pro-
inflammatory cytokines such as IFN-γ and TNF-α. IFN-γ can activate APCs to induce
a cytotoxic T cell response providing an important link between the innate and
adaptive immune systems (Mocikat et al. 2003; Kelly et al. 2002).
NK cell self-tolerance and education
NK cells were first identified in mice during the 1970’s due to their ability to
spontaneously kill tumour cells, as shown through antibody-independent in vitro
cytotoxicity assays against lymphoma cell lines (Kiessling, Klein, et al. 1975;
Herberman et al. 1975). The “missing self” hypothesis was proposed as a
mechanism to explain how NK cells could identify target cells due to a lack in
expression of normal “self” markers (Ljunggren & Kärre 1990). This was based upon
the observed rejection of parental MHC homozygous bone marrow grafts and the
elimination of tumour cell lines expressing low amounts of MHC class I molecules
(Kiessling, Petranyi, et al. 1975; Kärre et al. 1986). This hypothesis was backed up
by the identification of inhibitory murine Ly49 receptors and killer immunoglobulin-like
receptors (KIRs) and CD94/NKG2A in humans, at the surface of NK cells which
could bind to MHC class I molecules (Moretta et al. 1996; Braud et al. 1998;
Yokoyama & Seaman 1993).
However, it has also been observed in both mice and humans that not all NK cells
within an individual express an MHC inhibitory receptor (Fernandez et al. 2005;

20
Anfossi et al. 2006). Interestingly these NK cells were still self-tolerant but also less
responsive to tumour cell killing. Similarly, in mice mutated to be MHC Class I null
the NK cell populations are normal in number and self-tolerant but displayed low
efficiency in tumour cell killing (Liao et al. 1991; Dorfman et al. 1997). It has also
been shown that the responsiveness of NK cells is directly proportional to the
number of different self-specific inhibitory receptors they display (Joncker et al.
2009). Therefore, a greater repertoire of receptors on each NK cell gives greater
sensitivity. Whether NK cells are initially highly responsive but become “disarmed”
when minimal interaction with MHC molecules occurs in normal situations, or if the
NK cells are originally poorly responsive but become “armed” through interaction
with MHC molecules, is not clear (Raulet & Vance 2006). Either way NK cells which
have experienced this MHC class I education are often termed ‘licenced’, whilst
those which have not, and are less responsive, are termed ‘unlicensed’.
NK cells also express a wide variety of activatory receptors on the cell surface which
recognise stress ligands that are only expressed or are upregulated on unhealthy
cells (Raulet et al. 2013; Marcus et al. 2014). The presence of these ligands is also
thought to be involved in NK cell education. Mice with mutations in NKG2D and
NKp46 receptors displayed increased killing of certain targets (Zafirova et al. 2009;
Narni-Mancinelli et al. 2012). Additionally, sustained NKG2D or Ly49H ligand
expression in transgenic mice has been shown to produce decreased functionality of
the NK cells in some cases (Oppenheim et al. 2005; Sun & Lanier 2008).
Therefore, the steady state inhibitory and activatory inputs that NK cells receive in
the normal environment are thought to set the ‘responsiveness’ level of the cell.
Interestingly this threshold can change when in a different MHC environment.
Wildtype NK cells transferred to a MHC class I deficient mouse become less

21
responsive after a few days (Joncker et al. 2010). The opposite is also found with
NK cell responsiveness increasing following transfer from MHC class I deficient
mouse into a wildtype host (Elliott et al. 2010). This NK cell “tuning” helps to create
an NK cell population suitably poised to detect any abnormalities in the environments
it encounters (Shifrin et al. 2014).
Mechanism of NK cell cytotoxic function
The primary function of mature CD56dim NK cells is to eliminate cells that are
identified as foreign or transformed, through natural cytotoxicity or antibody-mediated
cytotoxicity. To do this NK cells must receive sufficient stimulus from a target cell
through the expression of stress ligands and the lack of MHC class I molecules.
Apoptosis of the target cell is then induced through the release of cytotoxic granules
or the engagement of death receptors (Smyth et al. 2005).
The release of these cytotoxic granules is complexly regulated by a variety of
proteins which are required for effective lysosome release (Topham & Hewitt 2009;
Bryceson et al. 2011). Upon contact with a target cell, interactions with activatory
and inhibitory receptors determine whether signalling induces LFA-1, a cellular
adhesion molecule, to promote adhesion (Bryceson et al. 2009). The NK cell
reorganises its actin cytoskeleton to form an immunological synapse with the target
(Vyas et al. 2001). Further signalling between ligands and receptors happens with
the resultant signalling cascade determining whether a cytolytic or non-cytolytic
event will occur. In resting NK cells these signal from individual receptors can
separately induce polarisation of cytotoxic granules to the immunological synapse or
their exocytosis, indicating that a combination of receptor activation is required to

22
induce NK cell cytotoxicity (Bryceson et al. 2005). Signalling of several NK cell
activating receptors, including NKG2D and NKp46, which stimulate the ERK2 and
JNK1 pathways are required to induce polarisation of the microtubule-organizing
centre (MTOC) towards the immunological synapse (Chen et al. 2007). Recruitment
of the MTOC is necessary for the cytotoxic granules to polarise as well. At the
extracellular membrane the cytotoxic granules dock, but complete fusion and release
of the contents of the granules requires the formation of a soluble N-ethylmaleimide-
sensitive factor attachment protein receptor (SNARE) complex between the two
membranes (Jahn & Scheller 2006).
Upon their release across the immunological synapse, perforin is thought to assist
the entrance of granzymes into the target cell by punching holes though the
extracellular membrane. Once inside the granzymes help induce apoptosis by
activating several different forms of programmed cell death signalling. Granzyme B
in particular activates caspases within the cell and cleaves proteins of its own to
induce a mitochondrial apoptotic pathway and cause DNA damage (Lieberman
2003).
Following death of the target the NK cell can go on to serially kill multiple target cells
before their levels of perforin and granzyme become significantly reduced (Bhat &
Watzl 2007a). Dependent upon the susceptibility of the target cells and the prowess
of an individual NK cell, serial killing of up to 14 target cells has been observed in
vitro in a 6-hour assay (Choi & Mitchison 2013). In these experiments a genetically
encoded reporter of granzyme B activity was used to assess single cell killing
dynamics. Following the relatively slow identification and subsequent killing of an
initial target cell, NK cells are then able to rapidly kill other cells nearby. It is thought
that this is achieved due to the NK cell making another immunological synapse

23
connection with a new target cell before detaching from the initial one, resulting in
cross over of the signalling instigated by the initial target, priming the NK cell for
further killing (Choi & Mitchison 2013).
After reaching a point of ‘exhaustion’ following serial killing a small fraction of NK
cells will not survive and undergo apoptosis themselves. Most NK cells however will
survive and can recover their stocks of cytotoxic granules and functional ability
following culture with IL-2 (Bhat & Watzl 2007a).
Whilst certain tumour cell lines can be killed by freshly isolated resting human NK
cells, many are resistant to NK cell killing, and those susceptible can be made
resistant through the transfection of HLA molecules (Hasenkamp et al. 2006;
Ciccone et al. 1992). Individual stimulation of natural cytotoxicity receptors, including
NKp46, NKG2D and DNAM, is not sufficient to induce cytotoxic granule polarisation
and release in resting NK cells to produce target cell lysis, but a combination of
coactivatory receptors can be (Bryceson et al. 2006).
The ability of NK cells to kill target cells can, however, be greatly enhanced through
stimulation via cytokines or inflammatory stimuli, most notably IL-2 (Kehrl et al.
1988). These “lymphokine-activated killer cells” are capable of eliminating NK
resistant tumour cell lines (Pisani et al. 1989; Lehmann et al. 2001) and it is thought
that IL-2 stimulation may provide an independent signal to induce cytotoxic granule
exocytosis. Partial restoration of this function can be achieved in NK cells taken from
patients with a loss of function SNARE mutation when cultured in high levels of IL-2
(Bryceson et al. 2007). Similarly “tumour primed” NK cells, those which have been
pre-incubated with certain leukaemia cell lines, are then able to kill NK cell resistant
tumour cells (North et al. 2007; Sabry et al. 2011).

24
A two-step process of NK cell activation occurs where both the priming and
triggering of an NK cell is required, with the initial signalling potentially provided by
appropriate ligands or by cytokine stimulation (North et al. 2007). NK cell susceptible
cell lines induce both the priming and triggering of resting NK cells whereas NK cell-
resistant cell lines often do not induce an initial priming signal, but can become
susceptible when a priming signal is provided from another source.
In patients with established tumours it is clear that the autologous NK cell response
has proven unable to control the transformed cells. Aberrant NK cell function has
been associated with impaired prognosis in many different cancer patients
(Tratkiewicz & Szer 1990; Brenner et al. 2010.; Larsen et al. 2014; Vitale et al.
2014). Interestingly many cancer treatments, such as chemotherapy, radiotherapy or
autologous bone marrow transplant, act to reduce the tumour burden and it is
believed that this may help a induce a protective immune response (Lowdell et al.
2002).
In the setting of allogeneic transplantation, a potential HLA mismatch between the
donor and recipient may allow the development of alloreactive NK cells. Indeed,
these cells are thought to contribute to the curative potential of haematopoietic stem
cell transplantation (Ruggeri et al. 2002) and the use of primed NK cells as an
adoptive immunotherapy has been demonstrated (Ruggeri et al. 2015a).
NK cell repertoire diversity
Recent investigations are revealing a high level of diversity within the NK cell
repertoire. Populations of self-renewing “memory” NK cells have features in common
with adaptive immunity function (O’Leary et al. 2006; Sun et al. 2009). This

25
CD56dimNKG2C+CD57+ population increases with age, although in those infected
with cytomegalovirus (CMV) there is a large increase of NKG2C+ NK cells which
also acquire a CD57 phenotype (Solana et al. 2014). In CMV seropositive children
an initial increase in frequency of such NK cells occurs up to around 12 years but
then plateaus off with an increased proportion of CD56dim cells expressing CD57 and
expansion of NKG2C+ cells (Goodier et al. 2014). Of note, children with
homozygous absence of the NKG2C gene demonstrate elevated anti-HCMV IgG
titres suggesting poorly controlled infection which may be secondary to impaired NK
cell function. These observations reveal that the NK cell repertoire is substantially
dependent upon the history of environmental infectious challenge.
Significant variation in the expression of cell surface receptors between individuals
has been shown using mass cytometry to analyse NK cells from monozygotic twins
as well as unrelated individuals (Horowitz, et al. 2013). Inhibitory receptor expression
was found to be determined primarily by genotype whilst activation receptor
expression was substantially influenced by environmental factors. Over 100,000
different NK cell phenotypes were identified and around 6,000-30,000 of these were
expressed within each individual. The diversity of an individual’s NK cell repertoire
increases both with ageing and previous exposure to viral infections and this may
result in less efficient response to subsequent infections (Strauss-Albee et al. 2015).
Additionally the constantly changing receptor expression at the NK cell surface and
changes in their spatial distribution may produce differential signalling responses
(Pageon et al. 2013).
The diversity of receptors on NK cells within an individual also creates a range of
responsiveness of those NK cells through their NK cell education to the steady state
(Shifrin et al. 2014). As such they are likely to be able to play different roles within
26
innate immune responses. NK cells which do not express MHC class I inhibitory
receptors are considered to have a lower responsiveness to target cells than those
which do. However, within the context of mice experiencing viral infection, and the
cytokine and inflammatory stimuli produced, these NK cells were found to
preferentially expand and provide greater protection than NK cells expressing
inhibitory receptors (Orr et al. 2010). This enhancement is thought to override the
usual NK cell tuning adaption to a new environment, allowing the NK cells to remain
functionally active against the infected cells. NK cells which express MHC inhibitory
receptors and have been educated are considered as ‘licenced’ and highly
responsive. These NK cells are more adept at recognising decreased expression of
MHC class I molecules on unhealthy cells and are therefore thought to be more
beneficial in tumour surveillance. (Kusunoki et al. 2000; Shifrin et al. 2014).
The diversity of the NK cell repertoire, its dynamically responsive capacity and ability
to eliminate tumour cells gives them the potential to be profoundly beneficial for anti-
cancer responses.
27
Haematopoietic stem cell transplantation
Haematological malignancies represent around 10% of all cancers and, despite
recent improvements in immune-chemotherapy, many patients are not cured with
standard treatment. Allogeneic haematopoietic stem cell transplantation (allo-HSCT)
may represent an effective curative treatment in this setting (Figure 1.4). Patients
receive chemotherapy and/or irradiation in an effort to provide space for the donor
cells and also to eliminate residual malignant cells. Following this ‘conditioning’
therapy, haematopoietic stem cells are then collected from a donor and delivered
through intravenous infusion. Engraftment of donor stem cells and establishment of
haemopoiesis usually occurs within two to three weeks post-transplantation.
However, it can take years for full reconstitution of the immune system to occur
(Ogonek et al. 2016). Importantly donor cells may act to eliminate residual tumour
cells within the host, in a process termed a ‘graft versus leukaemia’ (GvL) response,
which can effectively cure the patient (Horowitz et al. 1990). However, this is usually
accompanied by a donor cell response against healthy host tissues, termed ‘graft
versus host disease’ (GvHD), which remains a major post-transplant complication.
Donor selection and apheresis
Most patients and donors are closely matched for major histocompatibility antigens
such as HLA-A, -B, -C, -DR, -DQ and –DP (Nowak 2008; Howard et al. 2015). This
is usually achieved through the use of sibling or matched unrelated donors although
the use of haploidentical transplantation is increasing (Koh & Chao 2008). Close
matching of HLA alleles limits the intensity of the donor-mediated alloreactive
immune response and also ensures that the graft itself is not rejected.

28
The donor cells that are critical to establish donor haemopoiesis are CD34+
haematopoietic stem cells which are found within bone marrow. These cells can be
obtained directly from the donor by bone marrow aspiration from the pelvis. Umbilical
cord blood is another source of stem cells and was initially demonstrated to be
efficacious in a paediatric setting before translation to adults (Kurtzberg et al. 1996;
Laughlin et al. 2001). However low stem cell number and expense are limiting
factors along with slower engraftment and immune reconstitution following infusion
resulting in an increased risk of infection (Brunstein et al. 2010; Ballen 2017).
The most common source of CD34+ haemopoietic stem cells is now from mobilised
peripheral blood. Peripheral administration of a mobilising drug leads to movement of
Figure 1.4 - Allogeneic haematopoietic stem cell transplantation Patients undergoing allogeneic haematopoietic stem cell transplantation receive chemotherapy conditioning to significantly eradicate their tumour and haematopoietic cells. Cells from a HLA matched donor are infused and engraftment of progenitor cells and the reconstitution of the immune environment occurs. The curative nature of this treatment is achieved if donor haematopoietic cells confer a graft versus leukaemia effect and eliminate any residual tumour within the host.

29
CD34+ cells from the bone marrow such that they migrate into the peripheral blood,
where they can be collected by a process of apheresis (Gyger et al. 2000). Stem cell
processing acts to concentrate the leucocyte fraction containing the CD34+ cellular
fraction (Reddy 2005). The graft can be stored for up to a day without greatly
affecting cell viability before being infused into the patient (Sugrue et al. 1998).
G-CSF mobilised grafts
The most common drug used to mobilise the haematopoietic stem cells is
granulocyte-colony stimulating factor (G-CSF). Knock-out of G-CSF in mice results in
severe neutropenia and led to studies that revealed the importance of G-CSF for
stimulation and proliferation of haematopoietic progenitor cells (Lieschke et al. 1994).
The use of G-CSF clinically to improve haemopoietic recovery after chemotherapy is
valuable to reduce infection risk and is associated with minimal long term effects
(Welte 2012). The observation that CD34+ progenitor cell frequency in the peripheral
blood increased significantly unexpectedly indicated the potential use of G-CSF to
mobilise stem cells in healthy adult donors for allo-HSCT, as an alternative to bone
marrow stem cell collection (Lane et al. 1995; Bensinger et al. 1993).
G-CSF mobilisation results in a significantly higher yield of CD34+ progenitor cells
and substantial increase in the frequency of lymphocytes within the apheresis
product in comparison to bone marrow derived grafts (Theilgaard-Mönch et al. 2001;
Körbling & Freireich 2011). Analysis of 3465 patients with acute leukaemia has
shown that the use of peripheral blood derived grafts is associated with an increased
rate of chronic GvHD in comparison to bone marrow, however effects on disease
free survival and overall survival are considered to be relatively similar (Körbling &

30
Freireich 2011; Ringdén et al. 2002). Bone marrow grafts are preferred for patients
with aplastic anaemia as they carry a lower acute GvHD risk (Eapen et al. 2011). As
a beneficial GvL response is not required in these patients the lower frequency of
lymphocytes infused with a bone marrow derived source of stem cells makes it the
safer option for those patients. Peripheral blood derived stem cell grafts generate a
faster post-transplant neutrophil and platelet recovery time compared to grafts
sourced directly from the bone marrow, and are considered safer and cause less
discomfort for donors (Körbling et al. 1995; Bensinger 2012). Therefore G-CSF
mobilised peripheral blood has become the most common source of stem cell grafts
in Europe (Baldomero et al. 2011).
The receptor for G-CSF (CD114/G-CSFR) is expressed on CD34+ haematopoietic
progenitor cells as well as neutrophils, monocytes and endothelial cells. Surprisingly
murine studies have shown that binding of G-CSF to the receptor on progenitor cells
is not required for mobilisation (Liu et al. 2000). It is thought that G-CSF acts by
disrupting the (VLA)-4/VCAM1 and CXCL12/CXCR4 interactions which retain
progenitors in the bone marrow (Bendall & Bradstock 2014). Treating healthy
individuals with G-CSF results in increased numbers of lymphocytes,
polymorphonuclear and CD34+ cells in the peripheral blood (Körbling et al. 1995).
However, the precise number of cells collected from adult donors will vary due to
weight, gender and G-CSF dose scheduling, as well as genetic polymorphisms in the
molecules used to mobilise haematopoietic stem cells, and previous chemotherapy
treatments. Ultimately this means that there is variation in both the number of CD34+
haemopoietic stem cells collected from each donor and in the dose of other lymphoid
effector cells patients will receive in their stem cell graft (Chatta et al. 1994). It is

31
known that such effector cells mount the allogeneic immune responses required for
both GvL and GvHD and the use of in vivo T cell depletion (alemtuzumab and ATG)
has abrogated the clinical manifestations of donor T cell mediated GvHD (Kanda et
al. 2011; Bacigalupo et al. 2001).
Conditioning and T cell depletion
Prior to transplantation patients are given a one to two week course of chemotherapy
in an attempt to eradicate residual tumour and host haemopoietic cells. Full intensity
myeloablative conditioning carries the risk of damaging other major organs in the
body and producing significant side effects which may be especially harmful to older
patients or those with pre-existing conditions and therefore is not always a viable
option. Within the past two decades reduced intensity conditioning (RIC) using
primarily fludarabine and dose reductions of other drugs or total body irradiation
(TBI) has allowed HSCT to be given to a far greater range of patients. The
effectiveness of RIC in producing sustained disease free survival and reducing non-
relapse mortality in AML patients who would otherwise not have been treated has
now been proven (Tauro et al. 2005; Sengsayadeth et al. 2015). Whilst the
comparative effectiveness of RIC over fully myeloablative conditioning is difficult to
ascertain due to their use in different transplant settings, the benefits and broad
application of the reduced treatment has made it the most common form of
conditioning therapy at our institution (Russell et al. 2015).
In the UK most patients will also receive drugs to mediate T cell depletion as a
measure to limit the development of GvHD (Waldmann et al. 1984; Kanda et al.
2011). However this also leads to higher risk of disease relapse in patients (Soiffer et
al. 2011). Commonly at our institution the drug alemtuzumab (Campath-1H), a
32
humanised CD52 monoclonal antibody is used. The physiological role of CD52 is
uncertain but it is expressed at varying levels on T, B and NK lymphocytes as well as
most monocytes, macrophages and a subpopulation of granulocytes (Domagała &
Kurpisz 2001). Alemtuzumab binds to CD52 and can induce lysis of T cells, resulting
in lower GvHD rates although there is inevitably an associated increase in the rate of
relapse (Hale et al. 1998; Kanda et al. 2011). The density of expression of CD52 on
the surface of cells directly correlates with the cytolytic effect of Alemtuzumab in vitro
(Rao et al. 2012). Therefore T cells, which have a relatively high CD52 density, are
more effectively killed than the lower density expressing NK cells. Anti-thymocyte
globulin (ATG) is a polyclonal antibody, which depletes T cell primarily through
complement dependent lysis and activation-associated apoptosis, and is also used
for T cell depletion in some conditioning regimens (Mohty 2007).
Following infusion of the stem cell graft, recipients usually require inpatient hospital
care for approximately two weeks prior to stem cell engraftment and the production
of granulocytes (neutrophils) and platelets. In their immunocompromised state
patients are prone to infection and are therefore carefully monitored and require
blood product support.
Immune reconstitution following allo-HSCT
Successful allo-HSCT will result in engraftment of donor haematopoietic progenitor
cells within the host bone marrow where they will initiate proliferation and
differentiation of an immune repertoire. Cells of the innate immune system
reconstitute rapidly and dictate the duration of inpatient care. Neutrophils and
platelets often reach clinically ‘safe’ levels (1 x 10⁹/L neutrophils and 30 x 109/L

33
platelets) within 2-3 weeks, whilst T and B cell reconstitution can take up to 2 years
to reach normal levels (Keever-Taylor et al. 2001; Fry & Mackall 2005; Storek et al.
2008). T cell recovery occurs through two mechanisms, initial homeostatic
proliferation of donor T cells from the stem cell graft and then more gradually through
de novo generation of T cells from donor derived CD34+ cells and subsequent
maturation in the residual thymus (Roux et al. 2000). The homeostatically expanded
population of T cells is limited in the diversity of its repertoire (Mackall et al. 1996).
Additionally the T cell depletion, which is used to reduce GvHD, decreases the donor
T cell pool and limits T cell proliferation, resulting in a profound restriction of the early
T cell repertoire, that may therefore mount a less effective allogeneic immune
response (Soiffer et al. 2011; van Heijst et al. 2013). Similarly, B cell recovery takes
several months and low B cell numbers post allo-HSCT associate with the presence
of GvHD (Storek et al. 2001; Corre et al. 2010).
NK cell reconstitution is also driven by both homeostatic proliferation and maturation
of CD34+ progenitor cells, but occurs far more rapidly meaning that NK cells
dominate the lymphocyte population within the first month (Ullah et al. 2016). The
differentiation of NK cells from donor haemopoietic stem cells is swift and produces a
large increase in immature CD56bright NK cells by 6-8 weeks post-transplant.
Recovery of a normal NK cell phenotypic repertoire can take 3-6 months with full
cytokine and cytotoxic capabilities achieved after at least 6 months (Björklund et al.
2010; Ullah et al. 2016).

34
Graft versus leukaemia and graft versus host disease
Chemo/radiotherapy treatment is given to patients before transplantation with the
aim of reaching complete remission. Unfortunately, residual tumour cells are likely to
remain and patients may experience disease relapse if these cells are able to
develop. The ability of transplanted lymphocytes to kill tumour cells has been known
for several decades with murine models used to prove the principle in the 1950s
(Barnes et al. 1956) and then clinically in the 1960s (Mathe et al. 1965). Horowitz et
al, showed that graft versus host disease was associated with reduced rates of
disease relapse after transplantation (Horowitz et al. 1990). Marmont et al also
showed that the difference in relapse rates between T cell replete and T cell deplete
transplants was due to a less aggressive GvL and GvHD effect in the T cell depleted
patients (Marmont et al. 1991). It has since been found that in HLA matched
allogeneic transplants T cells confer a GvL effect through identification of
mismatched haematopoietic restricted minor histocompatibility antigens on residual
host cells (Marijt et al. 2003). Killing of these host cells results in the elimination of
any lingering tumour, as long as the leukemic cells express antigen (Bleakley &
Riddell 2004). However, donor T cells will also respond to more broadly expressed
minor histocompatibility antigens in epithelial tissues such as the skin, gut and liver
resulting in GvHD.

35
Transplant
Conditioning
G-CSF mobilisation
Discharge
Week -2 -1 0 +1 +2 +3 +4
Recipient
Donor Apheresis collection
A
AcuteGvHD
ChronicGvHD
DiseaseRelapse
0 +2 +4 +6 +8 +10 +12 Month
ImmuneReconstitution
ClinicalOutcomes
NormalTCellNumber
NormalNKCellNumber
B
Figure 1.5 – Timeline of allo-HSCT Patients undergoing allogeneic haematopoietic stem cell transplantation at the Queen Elizabeth Hospital Birmingham receive pre-transplant conditioning during the two weeks prior to infusion of the transplant (A). Donor G-CSF mobilisation and subsequent stem cell graft collection occurs in the week prior to patient transplantation. Patients are usually discharged by two weeks post stem cell graft infusion. Post-transplant immune reconstitution occurs more rapidly for NK cells than T cells and may impact upon patient GvHD and relapse outcomes during the first 12 months (B).
36
GvHD arising within 100 days of transplant is described as ‘acute’ (aGvHD). It is
characterised by skin, gastrointestinal and liver involvement. Cases are classically
graded according to Glucksberg criteria and can last weeks, months or even years
and may be fatal in the setting of steroid refractory gut GvHD (Glucksberg et al.
1974). The initial conditioning regimen causes tissue damage and therefore an
inflammatory response triggering the release of pro-inflammatory cytokines. This in
turn promotes APC maturation and the presentation of minor antigens which activate
donor CD8+ T cells. Chemokines are produced which recruit CXCR3+ T cells into
patient tissues such as the skin, gut and liver where they damage healthy cells
(Piper et al. 2007). This causes more inflammation and a cycle of cytokine release
continues (Socié & Blazar 2009; Ferrara et al. 2009).
Chronic GvHD is a separate clinical entity which generally develops after day 100
and is a much more diverse clinical syndrome (Jagasia et al. 2015). It can overlap
with acute GvHD or occur independently and is a major cause of long-term morbidity
and mortality following allo-HSCT. The pathophysiology is complicated and current
murine models suggest that a multifaceted network involving T and B lymphocytes is
involved (Socié & Ritz 2014; Croudace et al. 2012).
Risk factors include the level of donor mismatch, age, sex and CMV infection but
GvHD is observed in between 20-80% of patients in most SCT regimens (Weisdorf
et al. 1991). The occurrence of GvHD indicates the presence of an alloreactive
immune response and is usually associated with reduced relapse rates indicating a
more effective GvL response (Weiden et al. 1979). Understanding if separate
mechanisms are behind GvL and GvHD, or if an ideal equilibrium can be achieved
between the two, will greatly help in improving patient outcomes after allo-HSCT.

37
Patient and donor influences on allo-HSCT outcome
Allogeneic haematopoietic stem cell transplantation is a potentially curative
treatment for lymphoid and myeloid malignancies. Chemotherapy depletes the
recipient bone marrow, making ‘space’ for an infusion of stem cell progenitors from
the donor. Engraftment of these cells provide recovery of a competent
haematopoietic system. Additionally, lymphocytes derived from the donor may have
a GvL effect, killing off any residual tumour and effectively curing the patient.
However, disease relapse is now the single major reason for treatment failure and
‘relapse mortality’ is a key cause of death (Barrett & Battiwalla 2010). A relapse rate
of 30% by 12 months post-transplant was reported in reduced intensity-conditioned
allo-HSCT with alemtuzumab T cell depletion (Tauro et al. 2005). Identifying ways to
improve disease free survival in transplant settings is an important research
objective to increase the efficiency of allo-HSCT.
The major ‘transplant related mortality’ (TRM) risks related to allo-HSCT are due to
the effects of drug-related toxicity (van Besien et al. 2003), increased susceptibility to
viral infections (Gratwohl et al. 2005), early risk of sinusoidal obstructive syndrome
(Carreras 2000) as well as acute and chronic GvHD (Jagasia et al. 2012; Wingard et
al. 2011). Therefore greater understanding the mechanisms involved in allo-HSCT in
order to improve patient outcome is important.
Whilst animal models provide an insight into the mechanistic processes involved in
allogeneic transplantation (Boieri et al. 2016) translation of these findings into the
clinical setting is challenging because of the inevitable genetic and immunological
variability present in the human system. Differences in patient gender, age, ethnicity,
co-morbidities and previously acquired viral infections all impact upon an individual’s

38
haematopoietic cell repertoire and therefore upon outcomes. Similarly, donor age,
gender and relationship to the patient have all been found to influence outcome
following allo-HSCT. Additionally, the conditioning regimen used, whether T cell
depletion has been applied and the source of the stem cell product can influence the
effectiveness of the procedure. Although these complicate the process, allo-HSCT
can be delivered to fit patients up to approximately the age of 70 with an acceptable
TRM of less than 20% (Gratwohl 2012).
Allo-HSCT can be given to treat a multitude of malignancies, all of which have
differing ontologies, susceptibility to chemotherapy and immune evasion
mechanisms. Therefore, the overall survival from one disease can differ greatly
compared to another. The potential benefit of the transplantation procedure is also
dependent on the patient remission status at the point of diagnosis (Armand et al.
2012). The risk of transplant-related mortality can often be predicted based upon an
individual patient’s pre-existing comorbidities. The haematopoietic cell
transplantation score comorbidity index (HCT-CI) developed by Sorror et al can be
used to identify patients at high risk of non-relapse related mortality and overall
mortality based upon factors such as obesity, diabetes or heart conditions (Sorror et
al. 2005).
Obtaining a suitable HLA donor is also necessary for the success of the transplant. A
sibling is the obvious first ‘point of call’ when trying to find a HLA matched individual,
but if this is not possible an unrelated donor can be sourced. Receiving cells from a
sibling is also more beneficial in terms of lower graft rejection rates and lower
aGvHD risk due to fewer minor mismatches between patient and donor (Weisdorf et
al. 2002; Alousi et al. 2013). Whilst fully HLA matched individuals are the ideal donor
source, in some instances donors with a single or multiple HLA mismatch can be

39
given. This however is usually associated with higher mortality risk due to
engraftment failure (Lee et al. 2007; Madrigal & Shaw 2008; Nowak 2008).
Additionally, patient age is important. Younger AML patients (<40 years old)
receiving allografts from matched siblings are found to have better overall survival
outcomes compared to older patients (Cornelissen et al. 2007; Suciu et al. 2003).
Similarly transplant-related mortality and complications are thought to be increased
with age, however the use of reduced intensity conditioning and general
improvements in transplant application is reducing this (Frassoni et al. 1996;
Bacigalupo et al. 2004). The age of the stem cell graft donor also plays an important
role. This has been shown in a large cohort of almost 7000 patients, where receiving
unrelated donor cell infusions from younger donors (<30 years old) resulted in
improved five year overall survival, as well as reduced rates of grade III or IV acute
GvHD and chronic GvHD (Kollman et al. 2001). In a smaller primarily HLA matched
sibling cohort the beneficial effect of younger donor age was seen in a lower relapse
risk and overall survival (Mehta et al. 2006). Immune senescence is the
deterioration of immune function as individuals age which is thought to be due to a
combination of defective bone marrow haematopoiesis, immune cell maturation,
migration and functional efficiency (Gruver et al. 2007). As individuals and their
immune systems age they are exposed to more environmental pressures and
antigens, which can modify the immune repertoire making them less tolerant and
responsive (Miller 1996; Strauss-Albee et al. 2015).
A matched sibling donor will usually be chosen if available because of the reduced
rates of graft rejection, and transplant related mortality. However, the difference
between this and a young matched unrelated donor is now almost negligible (Saber
et al. 2012; Robin et al. 2013). Registries primarily use donors that are under 30

40
years of age. Together this means that at Queen Elizabeth Hospital Birmingham
approximately 60% of all allo-HSCT are now from matched unrelated donors.
Chronic cytomegalovirus (CMV) infection may also contribute to immune
senescence as virus-specific T cells comprise a very large proportion of the T cell
repertoire and may explain the association between CMV infection and increased
mortality in older individuals (Hosie et al. 2017; Savva et al. 2013). In the context of
allo-HSCT, CMV can be both beneficial and detrimental and the ‘CMV match’
between patient and donor is one determinant. CMV seronegative patients receiving
a stem cell infusion from a CMV seropositive donor are at high risk of a primary CMV
infection and subsequently higher risk of mortality, potentially due to bacterial and
fungal infection (Nichols et al. 2002). In contrast, CMV mismatch between a
seropositive patient and a seronegative donor has also been associated with
increased mortality in a cohort of matched unrelated donors (Ayuk et al. 2016).
Interestingly however, it has recently become apparent that CMV reactivation in AML
patients following allo-HSCT is associated with reduced relapse risk, suggesting that
residual disease is also identified for elimination in the immune response (Green et
al. 2013). This however did not lead to improvements in overall survival due to an
increase in non-relapse mortality.
Another source of potential mismatch between patient and donor is in terms of
gender. It is thought that male patients receiving stem cells from a female donor
benefit from donor T cells that are specific to minor histocompatibility antigens
encoded by the Y chromosome. This is due to the lower relapse and higher GvHD
incidence seen in female to male transplants, with a beneficial GvL effect seen in
both myeloid and lymphoid malignancies (Randolph et al. 2004). However male

41
recipients in general are more at risk of mortality when undergoing allo-HSCT
compared to females (Kim et al. 2016).
The issue with many of these findings is that what may be significant in one cohort is
often not in another, especially considering the heterogeneity of patients included.
Distinguishing the similarities and differences between the different studies and
pulling out the useful information is complicated. Furthermore, the process of allo-
HSCT is also constantly changing and common practices a decade ago are vastly
different to those now. Importantly though patient outcomes are getting better and
there is potential to improve them even further.
Impact of stem cell graft composition on transplant outcomes
The CD34+ haemopoietic stem cell graft does not consist solely of stem cells but
also contains a substantial number of mature donor immune cells. As donor
lymphocytes are known to provide both a GvHD and a GvL response it is already
appreciated that graft composition can impact upon transplant outcome. Sufficient
CD34+ HSCs are required to prevent graft rejection, and a dose of at least 2-3 x 10⁶
CD34+ cells per kg is considered necessary to achieve this. High CD34 dose (>8
x106 cells/kg) has been implicated in the development of GvHD (Zaucha et al. 2001;
Mielcarek et al. 2004). On the other hand low CD34+ doses (<4 x10⁶ cells/kg), were
also found to associate with higher non-relapse mortality and reduced overall
survival in a study examining the outcomes of over 1000 AML and MDS patients
(Törlén et al. 2014; Mavroudis et al. 1996). An adequate dose of CD34+ cells is
required for neutrophil and platelet engraftment (Keever-Taylor et al. 2001), which
are important to fend off bacterial or fungal infections and provide adequate blood

42
clotting and red blood cells to perfuse tissues. High doses are thought to result in a
quicker and stronger alloreactive T cell response increasing the incidence of GvHD,
however this remains controversial (Baron et al. 2005; Gõmez-Almaguer et al. 2013).
A balance between the two (4-8 x10⁶ cells/kg) is therefore recommended for most
allo-HSCT (Mehta et al. 2009).
Other graft components have also been associated with improvements in transplant
outcome in various settings. High frequency of T, B and dendritic cells within the
graft have been found to correlate with increased acute GVHD in a cohort of AML
patients who received mainly matched unrelated donor grafts (Impola et al. 2016).
However, studies have also suggested no such associations between T cell dose
and acute GvHD or overall survival (Cao et al. 2005). Studies of T cell replete HLA
matched sibling donor transplants have found associations between NK cell number
and patient outcome. Receiving an NK cell dose below 7 x 10⁷ cells/kg was
associated with increased acute GvHD in a small cohort (n=27) of patients receiving
G-CSF mobilised grafts (Yamasaki et al. 2003). Additionally an NK cell dose above 5
x 107 cells/kg has also been associated with reduced non-relapse mortality in a
cohort of 61 patients, thought to be due to greater post-transplant infection control
(D. H. Kim et al. 2005). Also low numbers of both regulatory T cells (Tregs) and
invariant natural killer T cells (iNKT cells) in the stem cell graft have been shown to
correlate with aGvHD incidence (Rezvani et al. 2006; Chaidos et al. 2012; Malard et
al. 2016).
The effect of graft composition upon relapse is somewhat unclear. Reduced relapse
rates have been shown in patients receiving more than 4 x10⁶ CD34+ cells/kg from
unrelated donors (Nakamura et al. 2008). A successful GvL response will be
conducted by effector lymphocyte populations and recently in a RIC T cell replete

43
setting, stem cell graft CD8 T cell dose above 0.72 × 10⁸ cells per kg were found to
associate with lower relapse risk (Reshef et al. 2015). The potential role of donor NK
cells in the stem cell graft is thought to be beneficial by contributing to GvL, but not
necessarily mediating GvHD (Ruggeri et al. 1999; L. Ruggeri et al. 2002; Dickinson
et al. 2017).

44
NK cells in HSCT
NK cells are present in considerable numbers within stem cell grafts received by
patients (Martínez et al. 1996). Along with T cells they can undergo homeostatic
proliferation within the lymphopenic environment of the patient, rapidly producing a
large number of cells (Surh 2000; Prlic et al. 2003). They are the first lymphocyte
population to re-emerge post allo-HSCT and they usually dominate the lymphocyte
population during the first month, particularly so with T cell depleted transplants
(Ogonek et al. 2016). They are thought to provide beneficial effects in terms of GvL,
whilst not contributing towards or even protecting from GvHD.
NK cell immune reconstitution following allo-HSCT
In healthy individuals the lymphocyte population is in continual turnover. Assessment
of normal NK cell kinetics through in vivo labelling with deuterium-labelled glucose in
both young (19-34 years) and elderly (65-85 years) healthy individuals found that
CD3-CD16+ NK cell half-life is around 12 days (Zhang et al. 2007). A production rate
of roughly 15 CD3-CD16+ NK cells per μl blood per day was found in young
individuals however this decreased to 7 cells per μl in elderly individuals. Similar
experiments examining homeostatic T cell kinetics in young healthy individuals
suggest that CD4+ and CD8+ T cells have half-lives of just less than 3 months with a
production rate of 10 CD4+ T cells and 6 CD8+ T cells per μl of peripheral blood per
day (Hellerstein et al. 1999). The CD4 and CD8 subpopulations can further be
broken down into memory and naïve populations which display differing cell
dynamics. Shorter 14 and 26 day doubling times are seen in “memory” T cells
(CD45RO+CD8+ and CD45RO+CD4+ cells respectively), whilst a much longer 4-5

45
month doubling time was found in “naïve” T cells (CD45RA+CD8 and
CD45RA+CD4+) (Macallan et al. 2003).
Furthermore, in healthy individuals mature NK cell proliferation, assessed by Ki67
staining, is found in 5.3% of the whole NK cell population compared to 1.2% in T
cells. Combined with swifter apoptosis, a 3-4 fold greater turnover rate of NK cells
compared to T cells is produced (Lutz et al. 2011). Therefore, within a
lymphodepleted environment following allo-HSCT, NK cells are expected to
reconstitute faster.
Indeed, in murine models of adoptive cell transfer mature NK cell turnover takes 7-10
days with homeostatic proliferation shown to occur in lymphodepleted environments
(Wang et al. 2002; Jamieson et al. 2004; Prlic et al. 2003). Proliferation does not
occur when cells are transferred to a host with an adequate NK cell pool, indicating
that the availability of physiological niches and regulatory cytokines is necessary for
survival of adoptively transferred NK cells. Additionally murine models also suggest
that the NK cells present following allo-HSCT can be long lived and persist for
greater than 6 months without diminished functionality (Sun et al. 2011). Whether
similar dynamics are involved in humans following allo-HSCT is more difficult to
ascertain without being able to label the cells of interest.
Following allo-HSCT in humans NK cell reconstitution is rapid and NK cells dominate
the lymphocyte population within the first month, being capable of reaching normal
numbers during this time irrespective of the donor stem cell graft source (Ullah et al.
2016). However, these NK cells express a far more immature phenotype with a
significantly higher percentage of CD56bright NK cells present in the peripheral blood
of patients compared to healthy individuals (Pical-Izard et al. 2015). This is

46
accompanied by higher expression of NKG2A and lower expression of CD56dim,
CD57 and KIRs. It is therefore suggested that the rapid expansion of NK cells is due
to differentiation of progenitor cells rather than proliferation of mature cells infused
with the stem cell graft. This is supported by the similar reconstitution kinetics
measured post-transplant in patients receiving large differences in NK cell dose.
Although, NK cell reconstitution does occur more rapidly in patients receiving T and
B cell depleted stem cell grafts as opposed to CD34+ selected grafts, indicating that
expansion of the donated NK cell population does play a part (Eissens et al. 2010).
Interestingly the timing of NK cell reconstitution in T cell replete or T cell deplete
transplant settings has been found to be generally similar given the use of
cyclosporine to dampen any T cell reconstitution (Ullah et al. 2016).
The overall immature NK cell phenotype post-transplant gradually returns to
comparable levels with healthy donors by around 4-6 months following infusion.
Functional recovery of the NK cell population takes at least 6 months post-transplant
with the reestablishment of cytokine production and cytotoxicity occurring separately
(Björklund et al. 2010; Foley et al. 2011).
NK cell impact on patient outcomes
The effectiveness of NK cell reconstitution following HLA matched allo-HSCT has
been shown to associate with some clinical outcomes. In a T cell replete setting of
allo-HSCT greater NK cell reconstitution at one-month post-transplant has been
shown to associate with enhanced overall survival due to lower transplant related
mortality and lower infection rates in a cohort of nearly 300 AML, ALL and MDS
patients (Minculescu et al. 2016). No effect on disease relapse was found in this

47
cohort suggesting that beneficial effects NK cells may have in HLA matched
transplant setting are only mediated when T cell depletion is used.
High lymphocyte numbers (predominantly NK cells) at one month following T cell
deplete myeloablative transplants from matched sibling, as well as matched
unrelated donors, associated with improved survival (Savani et al. 2007; Le Blanc et
al. 2009). Savani et al corroborated this by showing in a small cohort (n=54) that NK
cell number at day 30 associated with less relapse, acute GvHD, lower NRM and
greater overall survival for myeloid leukaemia patients receiving donor infusions from
fully HLA matched siblings (Savani et al. 2007b). Interestingly though NK cell
reconstitution did not impact upon ALL patient relapse or survival. This was also
seen in patients receiving reduced intensity conditioning allo-HSCT at day 60 post-
transplant, but not in those with fully myeloablative treatment (Dunbar et al. 2008).
In a cohort of HLA matched RIC patients (n=45) who received ATG T cell depletion
NK cell reconstitution at one month with high TNF-a production associated with less
relapse and greater overall survival (Pical-Izard et al. 2015). Additionally, patients
expressing lower CD107a and CD56dim NK cells showed non-significant trends
towards greater relapse and mortality within a year post-transplant.
Together these findings suggest that any NK cell mediated effects on patient
outcome are established early on in HLA matched allo-HSCT, however small
differences in transplant procedure, conditioning and follow up may have a
significant impact upon this effect.

48
NK cell GvL effect
Given the cytotoxic and cytokine producing functional ability of NK cells it is clear
that they may play a role in GvL by directly killing residual tumour cells or indirectly
affecting the immune environment post allo-HSCT. To do this the donated NK cells
must produce an alloreactive response against the host. This is primarily thought to
be achieved due to the absence of MHC class I ligands for inhibitory KIR receptors
on donor NK cells, but may also be driven by the repertoire of activatory receptors
and the expression of their related ligands within the host (Benjamin et al. 2010).
As described above inhibitory KIRs recognise HLA-A, B and C molecules while HLA-
E is recognised by the CD94/NKG2A receptor. The expression of these receptors
throughout an individual’s NK cell population is stochastic, yet necessary for proper
cell education and the production of mature, self-tolerant yet responsive NK cells that
are able to detect cells expressing MHC class I molecules at low levels or none at
all. As inhibitory KIR and HLA expression varies within the human population
mismatches are likely when performing allo-HSCT which would result in a
subpopulation of donor NK cells that are alloreactive. Additionally, the
proinflammatory environment produced by myeloablative conditioning provides a
source of stimulatory molecules which can increase the responsiveness of
‘unlicensed’ NK cells (S. Kim et al. 2005).
NK cell alloreactivity has been most notably shown through the beneficial effect of
KIR ligand mismatch between donor and recipients of haploidentical transplantation
in providing a protective GvL response (Velardi 2008; Ruggeri et al. 1999). This was
effective for patients with AML but not ALL. The beneficial advantage of alloreactive
NK cells in this context is also associated with reduced GvHD risk, thought to be

49
mediated by the killing of recipient APC (L. Ruggeri et al. 2002). However, in the
context of unrelated allo-HSCT the role of NK cell alloreactivity is more controversial.
KIR ligand mismatch has been found to associate with reduced relapse rates and
greater overall survival in a study of 130 patients receiving T cell depleted unrelated
donor transplants (Giebel et al. 2003). However similar studies in unrelated donors
with and without T cell depletion did not find the same beneficial effect on patient
outcomes (Davies et al. 2002; Bornhäuser et al. 2004). Patients missing a KIR ligand
have been found to associate with lower relapse when being treated for early
myeloid leukaemia in both HLA matched and mismatched allo-HSCT (Miller et al.
2007). Additionally differences in donor KIR haplotypes have been found to impact
on relapse rates for AML patients receiving T cell replete transplants (Cooley et al.
2009). Patients receiving cells from donors with KIR group B haplotype, containing
predominantly activatory KIR receptors, had reduced incidence of relapse and a
significantly higher three year overall survival compared to those with donors
expressing KIR group A haplotype. Specific KIR ligand mismatch between donor and
recipient was identified as the cause of this protective effect as recipients who had
one or two C1- bearing HLA-C allotypes, compared to those with C2 only showed
improved survival when receiving cells from a KIR B haplotype donor (Cooley et al.
2010).
Whilst the “missing self” is adequate to engage an NK cell an activatory signal is also
necessary to elicit cytotoxic functionality. Again differences in receptor and ligand
expression have been shown to impact upon patient outcomes. Patients expressing
the NKG2D ligand ULBP06*02 polymorphism rather than ULBP06*01 showed better
overall survival and relapse free survival in a cohort of 371 patients receiving HLA
matched sibling transplants for both myeloid and lymphoid malignancies (Antoun et

50
al. 2012). Structural transformations in the protein cause changes in the binding
affinity of the ligand with its receptor (Zuo et al. 2017). ULBP06*02 has a higher
affinity for NKG2D potentially causing a lower rate of NKG2D dependent NK killing of
cells expressing *02 compared to *01 by preventing serial binding. ULBP06*01 also
triggers stronger downstream signalling.
Favourable differences in donor NK cells and patient targets help to improve clinical
outcomes following allo-HSCT and therefore suggest that the cytotoxic ability of NK
cells could play a role in GvL. A precise mechanism for NK cell involvement in GvL
however remains unclear. NK cells may eliminate residual tumour cells that express
ligands for detection directly. Sanchez-Correa et al., found that in many cases of
AML, leukemic blasts express ligands that are able to stimulate NK cell activation
(Sanchez-Correa et al. 2011). However, there is also decreased expression of
activating receptors NKp46, NKp30, DNAM-1 and NKG2C on autologous NK cells,
potentially due to ligand overexposure. Therefore, in allogeneic transplantation newly
infused NK cells with full cytotoxicity capabilities may prove more efficient at
eliminating target cells. In vitro experiments have shown that KIR mismatched
alloreactive NK clones can kill myeloid leukaemia cells, however only a minority of
lymphoblastic leukaemia cells had the same response (Ruggeri et al. 1999). This
mechanism is therefore highly dependent upon the disease and susceptibility of
tumour cells to NK cell killing.
Alternatively NK cells may promote the GvL effect of alloreactive T cells, by killing
immune cells and potentially regulating the GvHD response (Olson et al. 2010).
Ghadially et al., found that in a murine model of HSCT the absence of NKp46
expressing NK cells resulted in a much higher prevalence of GvHD (Ghadially et al.
2014)..This was due to ligands on immature dendritic cells activating NKp46

51
expressing NK cells, resulting in their lysis and leading to a reduction in T cell
stimulation. Additionally greater reconstitution of NK cells expressing IL-10 at two
weeks following allo-HSCT associates with protection from aGvHD which may
indicate a mechanism of alloreactive T cell suppression (Chan et al. 2017).
Therefore, if a GvL effect occurs early post-transplant it may be mediated by NK
cells directly from the donated stem cell graft. Interestingly though G-CSF has been
shown to reduce the cytotoxic capacity of NK cells (Miller et al. 1997). Isolated NK
cells from G-CSF treated donors showed significantly poorer killing of the K562
target cell line in vitro, along with a reduced ability for IL-2 induced proliferation. The
reduced cytotoxicity is also exacerbated by the apheresis collection of the stem cell
graft. Using G-CSF mobilisation and aphaeresis is therefore likely to affect the
phenotype and function of NK cells infused with the CD34+ haemopoietic stem cell
product, however their usefulness in allo-HSCT is still clear and has the potential to
be improved.
NK cell immunotherapy in allo-HSCT
The potential of NK cells to promote GvL, whilst suppressing GvHD, makes them
attractive as a cell therapy in allo-HSCT. Initial attempts to increase NK cell
activation in the autologous transplant setting through injections of IL-2 or infusion of
IL-2 activated NK cells however did not yield any clinical benefit for patients (Miller,
et al. 1997; Burns et al. 2003). Allogeneic transfer of enriched haploidentical NK cells
is also feasible and was shown to induce remission in 27% of a small cohort of AML
patients and could be improved with the addition of IL-2 (Miller et al. 2005;
Bachanova & Miller 2014). However, for donor NK cells to persist and expand within
52
the host, lymphodepletion, adequate levels of IL-15 and the infusion of CD34+
haematopoietic progenitor cells are also recommended.
Further studies have continued to show that the adoptive transfer of alloreactive NK
cells is feasible, however significant improvements in long term patient outcomes are
difficult to achieve (Rubnitz et al. 2010; Curti et al. 2011; Stern et al. 2013). Attempts
to make adoptive transfer of NK cells more successful involve identifying the optimal
source, purity and priming of NK cells for use as an immunotherapy. Low NK cell
numbers can be sourced from peripheral or umbilical cord blood. These numbers
can be increased when NK cells are enriched from the apheresis product of a G-CSF
mobilised individual, however these NK cells are functionally less efficient than those
in normal healthy peripheral blood (Miller et al. 1997). Additionally, NK cells can also
be expanded in vitro from human embryonic stem cells, bone marrow CD34+ cells or
umbilical cord blood CD34+ cells with functional cytotoxic killing capacity (Knorr &
Kaufman 2010; Domogala et al. 2017). NK cell lines such as NK-92 and NKL which
show cytotoxicity against malignancies are also considered as viable sources of
immunotherapeutic NK cells (Tonn et al. 2001; Robertson et al. 1996).
Whilst progress is being made in this area understanding the role of NK cells within
the context of current allo-HSCT methodology is important and will help to identify
how alloreactive NK cells can be optimally utilised.

53
Aims and objectives
There are gaps in our current understanding of NK cell involvement within HLA
matched T cell deplete allo-HSCT. The large variability of an individual’s NK cell
repertoire suggests that within the allo-HSCT setting NK cells received from different
donors will ultimately have differing impacts upon patients. A beneficial effect from
donor NK cells within this transplant context has not been definitively proven.
It was hypothesised that the impact of stem cell graft NK cells on HLA matched allo-
HSCT transplant outcome was most likely to be observed early on in patients who
received T cell depleted transplantation. With access to donor stem cell graft
samples and patient peripheral blood in the first month post-transplant we therefore
set out to appraise the following:
• How T and NK cells reconstitute during the first month post allo-HSCT and
how this associates with patient outcomes.
• Whether NK cells in G-CSF mobilised stem cell grafts are phenotypically and
functionally different to NK cells from healthy individual peripheral blood.
• If the cellular composition of the stem cell graft impacts upon clinical outcome
following allo-HSCT.
• If the variability in phenotype and function of NK cells within the stem cell graft
impacts upon clinical outcome following allo-HSCT.
Findings are described in detail with short discussions following each chapter. A
general discussion summarises the project and its impact upon the scientific area.

54
Chapter 2 – Materials and Methods
Reagents Media and solutions
• Freezing media - Foetal bovine serum (Sigma-Aldrich); 10% Dimethyl
sulfoxide (DMSO) (Thermoscientific)
• MACS buffer – 1x PBS (University of Birmingham); 0.5% Bovine serum
albumin (Sigma-Aldrich); 2mM EDTA (Sigma-Aldrich)
• Wash media - RPMI 1640 (Sigma-Aldrich); 1% penicillin-streptomycin
(Thermoscientific); 2mM L-glutamine (Thermoscientific).
• Growth media (GM) - RPMI 1640 (Sigma-Aldrich); 10% Foetal bovine serum
(Sigma-Aldrich); 1% penicillin-streptomycin (Thermoscientific); 2mM L-
glutamine (Thermoscientific).
• TBE buffer – 89nM Tris HCl (Geneflow); 89nM Boric Acid (Geneflow); 3mM
EDTA (Geneflow)
Commercial kits and beads • BD Trucount™ tubes (BD Biosciences - Catalogue Number: 340334)
• BD Biosciences transcription factor intracellular staining kit (BD Biosciences -
Catalogue Number: 565575)
• DNEasy isolation kit (Qiagen – Catalogue number: 69504)
• EasySepTM Human NK enrichment kit (Stem Cell Technologies – Catalogue
number: 19055).
• FlowCheck beads (Beckman Coulter – Catalogue number: A63493)
• FlowSet beads (Beckman Coulter – Catalogue number: A63492)
• VersaComp antibody capture beads (Beckman Coulter – Catalogue number:
B22804)

55
Patient sample collection
Peripheral blood sample collection and patient cohort
Written consent was obtained from patients undergoing allogeneic haematopoietic
stem cell transplantation for the treatment of haematological malignancies at the
Queen Elizabeth Hospital Birmingham (Biological Correlates of Stem Cell
Transplantation (BCOST) study ethics code: 051Q7071175).
Peripheral blood samples were collected from 158 consecutive patients receiving
allo-HSCT at several time points during the transplantation process (Figure 2.1). Up
to 36ml of blood was collected into heparinised vacutainers on the day of
transplantation, prior to infusion of the stem cell graft. Subsequent peripheral blood
samples (36ml) were taken from the patients at one, two, three and four weeks post-
transplant. In total 387 samples were collected and processed within 24 hours.
TransplantDate
Week -2 -1 0 +1 +2 +3 +4
Conditioning
Day7 Day14 Week3 Week4 Day0 +
Post-transplant
Figure 2.1 – Samples taken from patients undergoing allo-HSCT Up to 36ml of peripheral blood was collected from allo-HSCT patients on the day of transplantation, before infusion of the stem cell graft. Further blood samples of 36ml were collected at one, two, three and four weeks post-transplant. The bag containing the stem cell graft was also collected post infusion.

56
The 158 patients from which peripheral blood samples were collected during the first
month post-transplant were primarily male (63%) with a median age of 56 years old
(Table 2.1). There was a variety of malignancies within the patient cohort which
could be classified into two groups. The majority of patients had myeloid (primarily
AML or MDS) (66%) rather than lymphoid disease (primarily ALL). Most patients
received reduced intensity conditioning (85%), whilst only 15% received fully
myeloablative treatment. T cell depletion was given to most patients (89%), usually
in the form of Alemtuzumab (52%) at 10mg per day for 5 days from day -5. Patients
whose conditioning involved anti-thymocyte globulin (ATG) (37%) either received
1mg/kg for 1 day then 2mg/kg for 2 days if combined with FLAMSA and Busulfan
(Bu) or 2.5mg/kg for 2 days if combined with just Fludarabine and Busulfan. The
primary source of stem cell graft infusions for these patients was the apheresis
product collected from G-CSF mobilised donors (91%). Most of these donors were
10/10 HLA matched (HLA-A, -B, -C, -DRB1 and –DRQ1) siblings (30%) or unrelated
donors (60%), with 10% of patients receiving cells from a 9/10 HLA mismatched
unrelated donor.

57
Patients Number Total 158 Median Age (Years; Range) 56 (16-75)
Male 99 63% CMV Seropositive 88 56% Disease
Myeloid 104 66% Lymphoid 53 34% Conditioning
Myeloablative 24 15% Reduced intensity 134 85% T Cell Depletion
Alemtuzumab 82 52% ATG 59 37% None given 17 11% Stem Cell Source
PBMC 144 91% Bone Marrow 10 6% Umbilical Cord 4 3% Transplant Type
HLA Matched Sibling 47 30% HLA Matched Unrelated Donor 95 60% Mismatched Unrelated Donor 16 10%
Table 2.1 – Post-transplant patient cohort characteristics CMV – Cytomegalovirus; ATG – Anti-Thymocyte Globulin; HLA – Human Leukocyte Antigen; PBMC – Peripheral Blood Mononuclear Cells.

58
Stem cell graft sample collection and patient cohorts
Following infusion of the donor apheresis product the bag containing the stem cell
graft is deemed a waste product and was therefore ethically collected for analysis
without further patient consent required. Stem cell grafts received by patients
undergoing allo-HSCT at the Queen Elizabeth Hospital Birmingham between 2012-
2017 were assessed. Following infusion into the patient the bag was placed on ice
for collection and processing within 16 hours.
Initially, residual mononuclear cells from 107 stem cell graft samples were acquired
to assess differences between NK cells collected through the process of G-CSF
mobilisation and apheresis processing compared to those found in the peripheral
blood of healthy individuals (Table 2.2). These stem cell grafts were collected from
primarily male donors (64%) with a median age of 38 years old. Nearly half of donors
were CMV seropositive (47%). All donors received G-CSF mobilisation (10μg/kg for
five days) and then underwent apheresis to collect the stem cell graft. Most donors
were unrelated to the patient with 5% having a major histocompatibility mismatch
with the recipient. The remainder of patients received donations from a matched
sibling (37%). Comparisons were made against PBMC isolated from the peripheral
blood of 15 healthy individuals who had not undergone G-CSF treatment. A similar
proportion of male donors (60%) were used, however the median age of these
individuals was 8 years below that of the stem cell graft donors.
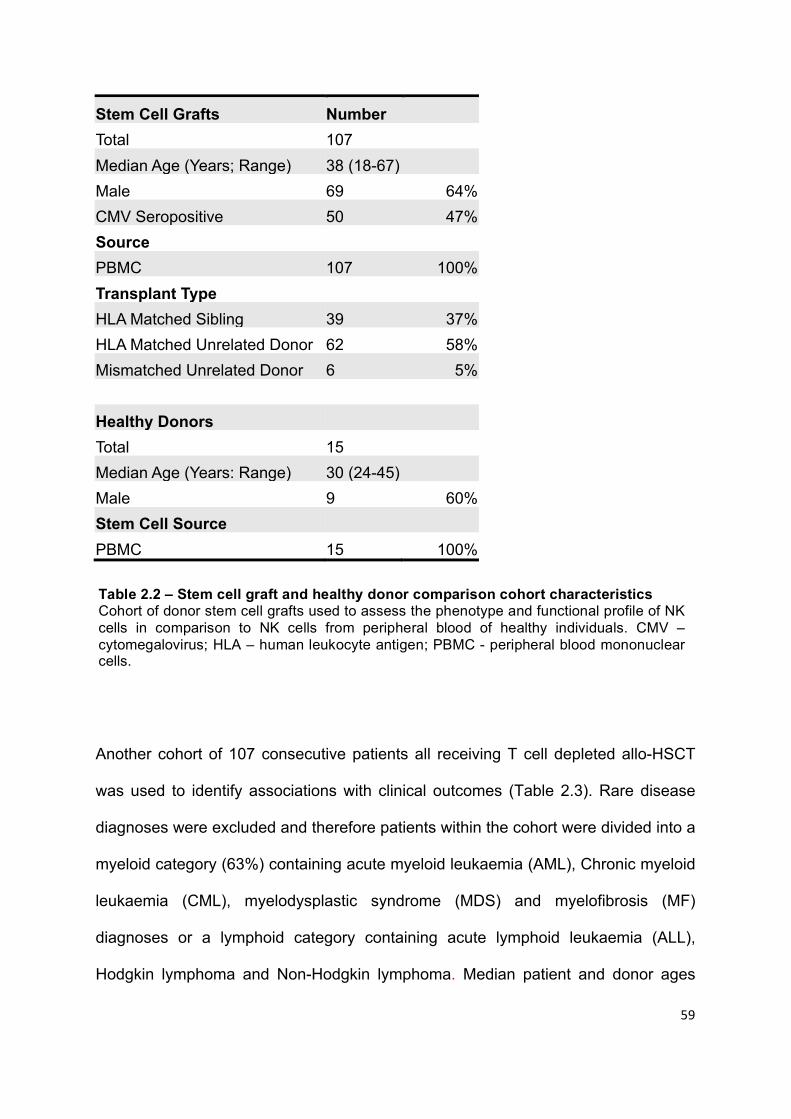
59
Stem Cell Grafts Number Total 107 Median Age (Years; Range) 38 (18-67)
Male 69 64% CMV Seropositive 50 47% Source
PBMC 107 100% Transplant Type
HLA Matched Sibling 39 37% HLA Matched Unrelated Donor 62 58% Mismatched Unrelated Donor 6 5%
Healthy Donors Total 15
Median Age (Years: Range) 30 (24-45) Male 9 60% Stem Cell Source
PBMC 15 100%
Another cohort of 107 consecutive patients all receiving T cell depleted allo-HSCT
was used to identify associations with clinical outcomes (Table 2.3). Rare disease
diagnoses were excluded and therefore patients within the cohort were divided into a
myeloid category (63%) containing acute myeloid leukaemia (AML), Chronic myeloid
leukaemia (CML), myelodysplastic syndrome (MDS) and myelofibrosis (MF)
diagnoses or a lymphoid category containing acute lymphoid leukaemia (ALL),
Hodgkin lymphoma and Non-Hodgkin lymphoma. Median patient and donor ages
Table 2.2 – Stem cell graft and healthy donor comparison cohort characteristics Cohort of donor stem cell grafts used to assess the phenotype and functional profile of NK cells in comparison to NK cells from peripheral blood of healthy individuals. CMV – cytomegalovirus; HLA – human leukocyte antigen; PBMC - peripheral blood mononuclear cells.

60
were 56 years and 48 years respectively. The majority of both patients and donors
were male (64% and 65% respectively) with only 22% of patients receiving a female
graft. If a cytomegalovirus (CMV) seronegative patient received a stem cell graft from
a CMV seropositive donor they were considered ‘at risk’ (36%). A total of 70 patients
(65%) underwent matched unrelated donor transplant with a further 10 patients (9%)
undergoing a single antigen mismatched transplant from an unrelated donor. Only 27
patients (25%) received transplants from matched sibling donors. Of the entire
cohort, 93 patients (87%) received reduced intensity conditioning whereas only 14
patients (13%) underwent full myeloablative conditioning. All patients received in vivo
T cell depletion, with most receiving a five day course of 10mg per day Alemtuzumab
(n=79, 74%). Patients whose conditioning involved anti-thymocyte globulin (ATG)
(n=28, 26%) either received 1mg/kg for 1 day then 2mg/kg for 2 days if combined
with FLAMSA and Busulfan (Bu) or 2.5mg/kg for 2 days if combined with just
Fludarabine and Busulfan.
A smaller validation cohort of 30 patients was also selected comprising of patients
receiving allo-HSCT donor grafts for treatment of myeloid (57%) or lymphoid (43%)
malignancies (Table 2.4). This cohort had a slightly lower median age (54 years) and
a smaller proportion of patients over 60 years (27%). Slightly more male patients
were assessed (53%). Only 3 patients (10%) were at risk of developing a primary
CMV infection. A similar majority of the patients received reduced intensity
conditioning (80%) and 17% received ‘T replete’ grafts. Again, most donors were
fully HLA matched with the patient with only 2 patients (7%) mismatched.

61
Population Characteristics Value Percentage Total Number in Cohort 107 Patient Age, median (range) 56 (19-73) Patient >60 years 44 41% Patient Gender (Male) 69 64% CMV at risk (D+/R-) 39 36% Disease Myeloid (AML; CML; MDS; MF) 67 63% Lymphoid (ALL) 14 13% Non-Hodgkin Lymphoma 19 18% Hodgkin Lymphoma 7 7% Conditioning Regimen Full intensity Cyclo/TBI 14 13% Reduced intensity Flu/Melph 53 50% FLAMSA 14 13% Flu/Bu 12 11% BEAM 11 10% Flu/BEAM 3 3% T Cell Depletion Alemtuzumab 79 74% ATG 28 26% Donor Characteristics Donor Age, median (range) 48 (21-66) Donor Gender (male) 70 65% Female donor to male patient 22 21% Donor Type HLA Matched Sibling (10/10) 27 25% HLA Matched Unrelated Donor (10/10) 70 65% Mismatched unrelated donor (9/10) 10 9%
Table 2.3 – Stem cell graft composition association with outcomes cohort characteristics CMV at risk - CMV seronegative patient receiving stem cell graft from a CMV seropositive donor. Disease: ALL – Acute Lymphoblastic Leukaemia; AML – Acute Myeloid Leukaemia; CML – Chronic Myeloid Leukaemia; MDS - Myelodysplastic Syndrome; MF - Myelofibrosis. Conditioning: Flu – Fludarabine; Melph – Melphalan; FLAMSA - Fludarabine, Ara-C and Amsacrine; Cyclo – Cyclophosphamide; TBI – Total Body Irradiation ; Bu – Busulfan; ATG – Anti-Thymocyte Globulin; BEAM - BCNU Etoposide Ara-C Melphalan. Alemtuzumab dose – 50mg (10mg per day for 5 days). ATG dose - FLAMSA/BU receive 1mg/kg for 1 day then 2mg/kg for 2 days; Flu/Bu receive 2.5mg/kg for 2 days,

62
Population Characteristics Value Percentage Total Number in Cohort 30 Patient Age, median (range) 54 (22-72) Patient >60 years 8 27% Patient Gender (Male) 16 53% CMV at risk (D+/R-) 3 10% Disease Myeloid 17 57% Lymphoid 13 43% Conditioning Regimen Full intensity Cyclo/TBI 6 20% Reduced intensity Flu/Melph 12 40% FLAMSA/Bu 3 10% Flu/Bu 4 13% BEAM 2 7% Flu/Cyclo 3 10% T Cell Depletion Alemtuzumab 15 50% ATG 10 33% None 5 17% Donor Type HLA Matched Sibling (10/10) 10 33% HLA Matched Unrelated Donor (10/10) 18 60% Mismatched unrelated donor (9/10) 2 7%
Table 2.4 – Characteristics of patients within the secondary cohort CMV at risk - CMV seronegative patient receiving stem cell graft from a CMV seropositive donor. Conditioning: Flu – Fludarabine; Melph – Melphalan; Cyclo – Cyclophosphamide; TBI – Total Body Irradiation ; Bu – Busulfan; ATG – Anti-Thymocyte Globulin; BEAM - BCNU Etoposide Ara-C Melphalan.

63
Absolute counts
Absolute counts of mononuclear and CD34+ cells within the stem cell grafts were
obtained from the NHS blood and transplant unit (NHSBT). Further
immunophenotyping measurements of the percentages of cell populations within the
stem cell graft allowed calculations of absolute counts for the individual cellular
components (see flow cytometry section). Viable lymphocytes could be identified
based upon their size and granularity in a flow plot and then taken as a fraction of
the mononuclear cell count to calculate the absolute number of lymphocytes. NK and
T cells were identified by CD56+CD3- and CD56-CD3+ phenotypes respectively
from a “lymphocyte gate” in which non-viable, B cells and monocytes had been
removed (Figure 2.2). The populations were applied as fractions of the lymphocyte
count to calculate absolute numbers of NK and T cells. These values were then
divided by the patient weight in order to determine the ‘cell dose’ per kg for each
patient.
Figure 2.2 – Measurement of T and NK cell populations within the stem cell graft Forward scatter plot (FS height v FS area) was used to gate on single cells and remove doublets or clumped cells. A forward scatter (FS) vs side scatter (SS) plot identified the lymphocyte population. Live cells were identified by negative PI expression. NK cells were identified as CD56+CD3- with CD56
dim and CD56
bright cells distinguished by the intensity of
CD56 expression. T cells were identified as CD56-CD3+.

64
Absolute counts of lymphocytes in patient peripheral blood following allo-HSCT were
calculated using BD Trucount™ tubes (BD Biosciences). At room temperature, 20μl
MACS buffer was reverse pipetted into the tube above the stainless-steel retainer.
Then 50μl anticoagulated whole blood was also added to the tube by reverse pipette
technique. The tube was vortexed and then incubated in the dark at room
temperature for 15 minutes. Following this 450μL 1x BD FACS lysing solution was
added to the tube which was again vortexed and incubated in the dark at room
temperature for 15 minutes. The sample was then analysed on a Gallios flow
cytometer (Beckman Coulter). The lymphocyte population was identified as a bright,
compact cluster with low side scatter. Lymphocyte numbers were negligible in
patients in the very early period after transplant and therefore calculation of exact
numbers was less accurate (Figure 2.3). The number of cells was calculated as:
(Number of cell events / number of bead events) x (Number of beads per test /
volume of sample) = concentration of sample
E.g: Healthy donor: (11460/4798) x (50950/50) = 2.436 cells/ml or 2433 cells/µl
Patient Day 14: (1927/5374) x (50950/50) = 3.655 cells/ml or 365 cells/µl
Healthy Donor Patient – Week 1 Patient – Week 4
Figure 2.3 – Calculation of lymphocyte number using Trucount™ beads Plots showing identification of the lymphocyte populations in whole blood samples from a healthy donor and a patient at week 1 and week 4 following allo-HSCT. The Trucount™ tube beads are gated in the top left of each plot.

65
PBMC isolation and tissue culture
PBMC isolation from peripheral blood
Patient peripheral blood samples were processed under sterile conditions within 24
hours of collection in order to isolate peripheral blood mononuclear cells (PBMCs).
Whole blood, collected in heparinised vacutainers, was diluted at a 1:1 ratio with
wash media. Up to 30ml of diluted peripheral blood was layered over 15ml
Lymphoprep™ density gradient medium (Axis-Shield) in a 50ml conical centrifuge
tube and spun at 400xg for 30 minutes with no brake to separate out the cellular
fractions. The resultant PBMC layer was removed with a Pasteur pipette into another
50ml tube. An additional 30ml wash media was added and the PBMC were
centrifuged again at 300xg for 10 minutes (with brake) as a wash step. The
supernatant was discarded and the re-suspended PBMC pellet was then either used
fresh or cryopreserved.
Mononuclear cell isolation from stem cell graft
Donor stem cell graft mononuclear cells were also collected within 16 hours post
transplantation. The discarded stem cell bag containing residual donor cells was
washed out with 50ml MACS buffer and collected in a 50ml conical centrifuge tube.
The cells were centrifuged at 300xg for 10 minutes, the supernatant discarded and
the cell pellet re-suspended. An additional red blood cell lysis step was performed if
necessary where 15ml Pharm Lyse™ red blood cell lysis buffer (BD Biosciences)
was added and cells incubated at room temperature for 15 minutes. The stem cell
graft mononuclear cells then had 35ml MACS buffer added and the sample was

66
centrifuged again at 300xg for 10 minutes. The supernatant was discarded and the
suspended PBMC were used fresh or cryopreserved.
Cell counting
Cell counting was performed by placing 10µl of the PBMC sample on to a
FastRead102® haemocytometer (Biosigma). An Olympus CK30 microscope with a
CK10 objective lens (Olympus) was used to visualise the cells. Live cells within three
4x4 grids were counted and an average taken. This value was multiplied by 104 to
give the cell count per ml of the original sample.
Cryopreservation and recovery of cells
Cryopreservation was performed by adding freezing media to the samples which
were subsequently aliquoted in 5-10x106 cells per 1ml cryovial. Samples were frozen
to -800C in a ‘Mr. Frosty™’ freezing container holding isopropanol to cool the cells
down at a rate of 10C per minute. Cells were either kept at -800C for short term
storage or moved to liquid nitrogen storage at between -1400C to -1800C if longer
term storage was necessary.
When thawing samples for use, cryovials were placed in a 370C water bath for 1
minute and then transferred to 10ml growth media (GM) at the same temperature.
The PBMC were centrifuged at 300xg for 10 minutes and then washed again in 10ml
GM and centrifuged (300xg for 5 minutes) before use.

67
Cell culture
Two commonly used MHC class I null cell lines were used as target cell lines to
assess NK cell cytotoxic killing. K562 is a erythromyeloblastic leukaemia cell line
derived from a CML patient (Klein et al. 1976). The 721.221 B cell lymphoblastoid
cell line was produced through gamma-ray irradiation-induced mutagenesis (Shimizu
& DeMars 1989). Established AML cell lines, kindly donated by Professor
Constanze Bonifer’s lab, were also used as target cells. Kasumi was derived from
the peripheral blood of a seven year old male AML patient and has a 8;21
chromosome translocation (Asou et al. 1991). PL-21 was derived from the peripheral
blood of a 23 year old male AML patient (Kubonishi et al. 1984).
K562 and 721.221 cell lines were maintained in RPMI 1640 (Sigma-Aldrich)
containing 10% Foetal bovine serum (Sigma-Aldrich); 1% pen-strep
(Thermoscientific); 2mM L-glutamine (Thermoscientific) and incubated at 370C and
5% CO2. K562 cells were maintained at 0.4-0.8 x10⁶ cells/ml and 721.221 cells were
maintained at 0.2 – 1x10⁶ cells/ ml.
Kasumi and PL-21 cell lines were cultured in RPMI 1640 (Sigma-Aldrich) containing;
20% Foetal bovine serum (Sigma-Aldrich); 1% pen-strep (Thermoscientific); 2mM L-
glutamine (Thermoscientific). Kasumi cells were initialled obtained at 2 x10⁶ cells/ml
and maintained at 0.3 – 3 x10⁶ cells/ml. PL-21 cells were initially obtained at 0.5 x10⁶
cells/ml and maintained at 0.5-0.8 x10⁶ cells/ml.
All cell suspensions were maintained in 25 cm2 corning flasks at a volume of 6-8ml
media. Cells were split by partial removal of the cell suspension and addition of 370C
fresh media. If media appeared yellow (acidic) the entire media was replaced. This

68
was accomplished by adding the suspended cells to a 15ml conical tube and
centrifuging at 300xg for 5 min. The supernatant was removed and cells re-
suspended in 370C growth media.
Flow cytometry
Immunophenotyping
Analysis of PBMC from peripheral blood or the stem cell graft was conducted using
flow cytometric immunophenotyping (Full antibody panels – Tables 2.5; 2.6; 2.7; 2.8;
2.9). PBMC were counted and 1 x10⁶ cells were added to a polypropylene FACS
tube. Cells were washed in 5ml MACS buffer and centrifuged at 300xg for 5 minutes.
The supernatant was removed and the cell pellet re-suspended in 100µl MACS
buffer. Extracellular staining was performed by adding an excess of fluorochrome
labelled antibodies which were then incubated on ice in the dark for 30 minutes.
Following this, cells were washed twice with 5ml MACS buffer and centrifugation at
300xg for 5 minutes. The cell pellet was re-suspended in 200µl MACS buffer and 2µl
propidium iodide (PI) viability dye (100µg/ml - Miltenyi) was added to each sample
tube immediately prior to flow cytometric analysis.
Two panels required additional intracellular staining. This process fixes the cells and
permeabilises the cellular membrane allowing subsequent staining with antibodies to
reach intracellular antigens. For PBMC undergoing additional intracellular staining
the initial surface stain was performed as above using LIVE/DEAD® Fixable Red
Dead Cell Stain viability dye (Life Technologies) rather than PI. Following the surface

69
stain the “functionality” panel cells were then washed in 5ml MACS and 100μl 4%
PFA was added to the suspended pellet for 15minutes at room temperature in the
dark. Cells were washed again in 5ml MACS buffer and 100μl 0.5% saponin was
added for 5 minutes at room temperature in the dark. An excess of the intracellular
fluorochrome-labelled antibodies was then added and incubated at room
temperature for 30 minutes in the dark. A final wash step with 5ml MACS buffer was
performed and the cell pellet was resuspended in 200μl MACS buffer to be run on
the flow cytometer.
For the “exhaustion” panel cells were stained using the BD Biosciences transcription
factor intracellular staining kit which enables detection of intranuclear transcription
factors. Staining was conducted by following the suggested BD Biosciences protocol.
1 ml of 1x Fix/Perm buffer was added to the resuspended cell pellet which was
incubated on ice in the dark for 45 minutes. Following this 1ml 1x Perm/Wash buffer
was added and the tube was centrifuged at 300xg for 5 minutes. The supernatant
was discarded and another wash step with 2ml 1x Perm/Wash buffer was performed.
The resuspended cell pellet had a further 100μl Perm/Wash buffer added along with
the intracellular antibodies. The tube was then incubated on ice in the dark for
another 40 minutes. Finally, two wash steps adding 2ml 1x Perm/Wash buffer and
centrifuging at 300xg for 5 minutes were performed. The cell pellet was
resuspended in 200μl MACS buffer to be run on the flow cytometer
Flow cytometry
Data collection was performed on a three laser, ten colour, Gallios flow cytometer
(Beckman Coulter). Unstained cells were run initially to set the voltages and gains on

70
the machine suitable for visualisation of the cellular populations of interest.
Compensation was performed using VersaComp antibody capture beads (Beckman
Coulter) prior to testing samples in order to determine the spectral overlap of the
fluorophores used in each panel. Quality control checks were also completed each
day before samples were run using FlowCheck and FlowSet beads (Beckman
Coulter) to ensure the maintenance of laser position and intensity.
Table 2.5 – Post-transplant reconstitution panel
Table 2.6 – NK signalling receptor panel

71
Table 2.7 – NK functionality marker panel
Table 2.8 – NK exhaustion marker panel
Table 2.9 – NK chemokine receptor panel FITC – Fluorescein isothiocyanate; PE – Phycoerythrin; PI – Propidium iodide; PerCP-Cy5.5 – Peridinin chlorophyll protein; APC – Allophycocyanin; AF700 – Alexa Fluor® 700; PB – Pacific Blue.

72
Gating strategies
Kaluza Analysis Software 1.3/1.5 (Beckman Coulter) was used to analyse the flow
data acquired. When identifying lymphocytes an initial forward scatter plot was used
to gate on single cells and remove doublets or clumped cells passing through. Then,
based on the size and granularity of the cells (forward versus side scatter), the
lymphocyte population could be identified. Expression of PI or LIVE/DEAD® Fixable
Red Dead Cell Stain was used to distinguish viable and non-viable cells.
NK cells were identified as CD56+CD3- and T cells as CD56-CD3+. Populations of
CD56bright and CD56dim cells were easily distinguishable on a flow plot to subgroup
the NK cell population. Individual receptors were identified through flow plots and
their expression was assessed on total NK cells, and on CD56bright or CD56dim
subsets. Gating strategies employed on total NK cells are shown in Figures 2.5, 2.6,
2.7, 2.8 and 2.9. Gating strategies were applied after thorough back gating and
comparison with unstained and healthy controls to set the gates. Each gating
strategy was validated by blind assessment of a healthy donor sample in triplicate
(Figure 2.4).
Figure 2.4 – Gating strategy validation Graph displaying the variation in analysis of a healthy donor sample assessed in triplicate through the same gating strategies.

73
Figure 2.5 – Post-transplant reconstitution panel gating strategy Forward scatter plot (FS height v FS area) was used to gate on single cells and remove doublets or clumped cells. A forward scatter (FS) vs side scatter (SS) plot identified the lymphocyte population. Live cells were identified by negative PI expression (A). NK cells were identified as CD56+CD3- with CD56
dim and CD56
bright
cells distinguished by the intensity of CD56 expression (B). The NK cells were further classified by gating on NKG2D and CD57 on CD56
dim and CD56
bright NK cells
respectively (C). T cells were classified into CD4+, CD8+, or double positive or negative cells (D). All subsets of T cells were then classified by CD45RA and CCR7 expression (E).
A
B C
D E

74
Figure 2.6 – NK signalling receptor panel gating strategy Forward scatter plot (FS height v FS area) was used to gate on single cells and remove doublets or clumped cells. A forward scatter (FS) vs side scatter (SS) plot identified the lymphocyte population. Live cells were identified by negative PI expression (A). NK cells were identified as CD56+CD3- with CD56
dim and CD56
bright cells distinguished by the intensity of
CD56 expression (B). Expression of surface receptors NKp46, NKG2D, DNAM and KIR (CD158a/h, CD158b, CD158e) on total NK cells, CD56
dim and CD56
bright were then assessed
(C).
A
B
C

75
Figure 2.7 – NK functionality marker panel gating strategy Forward scatter plot (FS height v FS area) was used to gate on single cells and remove doublets or clumped cells. A forward scatter (FS) vs side scatter (SS) plot identified the lymphocyte population. Live cells were identified by negative LIVE/DEAD red stain expression (A). NK cells were identified as CD56+CD3- with CD56
dim and CD56
bright cells
distinguished by the intensity of CD56 expression. Further differentiation using a CD56 v CD16 plot could distinguish CD56
dim and CD56
bright CD16 negative or positive NK cells
(B). Expression of markers was assessed on total NK cells, CD56dim
and CD56bright
NK cells (C). Maturity markers CD57 and NKG2C were assessed together, as were the cytotoxic proteins granzyme and perforin as well as activation marker CD107 and proliferation marker Ki-67.
A
B
C

76
Figure 2.8 – NK exhaustion marker panel gating strategy Forward scatter plot (FS height v FS area) was used to gate on single cells and remove doublets or clumped cells. A forward scatter (FS) vs side scatter (SS) plot identified the lymphocyte population. Live cells were identified by negative LIVE/DEAD red stain expression (A). NK cells were identified as CD56+CD3- with CD56
dim and CD56
bright cells
distinguished by the intensity of CD56 expression (B). Expression of markers was assessed on total NK cells, CD56
dim and CD56
bright NK cells (B). Expression of the markers Tim-3 and
PD-1, as well as the transcription factors Eomes and T-bet, were assessed (C).
A
B
C

77
Figure 2.9 – NK chemokine receptor panel gating strategy Forward scatter plot (FS height v FS area) was used to gate on single cells and remove doublets or clumped cells. A forward scatter (FS) vs side scatter (SS) plot identified the lymphocyte population (A). Live NK cells were identified as CD56+CD3-LIVE/DEAD red stain- expression (B). Chemokine receptor markers were assessed on NK cells by comparison with CD56 expression to determine expression on CD56
bright and CD56
dim NK
cells (C).
A
C
B

78
Cellular assays
G-CSF assay
To assess the effect of granulocyte colony stimulating factor (G-CSF) directly on
PBMC, samples were acquired from the peripheral blood of three healthy individuals.
The PBMC were isolated using Lymphoprep™ density gradient medium as
described above. A total of 1x10⁶ cells in 250μl growth media were added to
individual wells of a 48 well plate. The cells were incubated at 370C with 5% CO2 for
five days. At 24 hour intervals, G-CSF (Miltenyi) was added in varying concentrations
(0.1ng/ml, 1ng/ml, 10ng/ml or 100ng/ml). After five days cells were removed via
pipette and placed in a 5ml round bottom FACS tube. Cells were washed in 5ml
MACS buffer, centrifuged at 300xg for 5minutes and the cell pellet re-suspended in
200μl of MACS buffer. Cells were stained with antibodies to CD56 (APC-Cy7 –
Biolegend), CD3 (AF700 – Biolegend), NKG2D (PerCP-Cy5.5 – Biolegend), DNAM
(APC – Biolegend) and NKp46 (PB – Biolegend) for 30 minutes on ice in the dark.
Cells were then washed in 5ml MACS buffer 300xg for 5 minutes and the cell pellet
re-suspended in 200μl of MACS buffer. PI was added at a concentration of 1μg/ml
and cells were run on a Gallios flow cytometer to assess the cell populations
(Beckman Coulter). Analysis of flow cytometric data was conducted using Kaluza
Analysis Software 1.3/1.5 (Beckman Coulter) as per the NK cell signalling receptor
gating strategy (Figure 2.6).

79
Justification of NK cell assay
Assessment of NK cell cytotoxic function in vitro is usually measured by their ability
to kill target cells. Previously the 4 hour chromium release assay with a high E:T ratio
has been considered the gold standard of NK cell cytotoxic assessment. The use of
flow cytometric, rather than a traditional chromium release assays, has now become
well established as a method to detect NK cell cytotoxicity (Hatam et al. 1994;
Jedema et al. 2004; Valiathan et al. 2012). The hazardous nature of handling
radioactive material, high expense, short usage period and disposal complications
make the chromium release assay difficult to perform. Flow cytometry-based
methods provide a simpler and more efficient way of assessing NK cell cytotoxicity,
however they have limitations of their own.
NK cell isolation from a PBMC sample is required to perform such an assay. Often
the residual cells collected from the stem cell graft bag were found to exhibit some
adhesion to one another and were therefore filtered before use. NK cell isolation
from stem cell graft samples was difficult and obtaining over 90% pure NK cells was
rarely possible with the NK cell enrichment kit. Using enrichment and ‘MoFlo’ cell
sorting enabled >98% NK cell purity however use of this technique required staining
of NK cells and the low numbers that were obtained made multiple cytotoxicity
assays unfeasible. Therefore, I elected to use the NK cell enrichment kit for assays,
however the threshold for use with stem cell graft-derived NK cells was lowered to
70%. The NK cell yield from stem cell graft samples was relatively low, usually
around 30,000-75,000 NK cells per sample. Therefore, to perform the experiment in
triplicate for each sample the number of effectors was maintained at 10,000 cells per
well.

80
Our flow cytometry measurement technique necessitated the recording of at least
20,000 target cell events to ensure that measurement of target cell killing would be
accurate. Therefore an initial 2 target cells to 1 NK cell ratio was used (0.5:1 E:T).
However, incubating unstimulated NK cells with the 721.221 target cell line for four
hours and measuring target cell number reduction did not yield sufficiently
measurable target cell killing. Increasing the incubation time of the NK cells to 16
hours did improve the killing of percentage but not to satisfactory levels (Figure
2.10).
Stimulation with IL-2 is known to enhance NK cell cytotoxic activity (Henney et al.
1981; Becknell & Caligiuri 2005). This cytokine is commonly used in assays to
increase the cytotoxic potential of the NK cells, particularly when the cells in question
produce weaker than normal cytotoxicity, such as with stem cell graft NK cells (Miller
et al. 1997). In this assay the killing percentage of 721.221 cells could be increased
to around 80% when NK cells stimulated with 1000iu/ml were incubated with the
target cells for 16 hours (Miller et al 1997) at a 0.5:1 effector to target ratio (Figure
2.10). Using a lower 0.1:1 effector to target cell ratio reduced this killing percentage
to a median of 42% and also improved the accuracy of functional measurement
through the calculation of target cell numbers as 100,000 target cells were used.
Additionally, using more target than effector cells and a long-term incubation allowed
assessment of NK cell ability to kill multiple cell targets (Bhat & Watzl 2007b). This
killing frequency was calculated by dividing the number of target cells killed by the
number of effector cells used to estimate the average number of target cells killed by
each individual NK cell.

81
The combination of these factors led to the development of an assay of NK cell
function that performed consistently and allowed relative assessment between
donors. Importantly, this approach facilitated measurement of the cytotoxic potential
of the low numbers of NK cells that were obtained from the stem cell graft.
NK cell functional assay
A novel in vitro cytotoxicity assay was developed to assess the functional response
of NK cells from the stem cell graft following recognition of target cells lines (Figure
2.13A). Between 5-20 x106 peripheral blood or stem cell graft mononuclear cells
were added to a 5ml polystyrene round bottomed tube, washed in 5ml Robosep™
buffer (Stem Cell Technologies) and centrifuged at 300xg for 5 minutes. The cell
pellet was re-suspended at 5x10⁷ cells/ml Robosep™ buffer. NK cells were
negatively selected for using an EasySepTM Human NK enrichment kit (Stem Cell
Figure 2.10 – Optimisation of assays of NK cell function Healthy peripheral blood NK cells were isolated and combined with 721.221 target cells in a 16 hour incubation. Unstimulated NK cells were incubated with fluorescent-labelled target cells at a 0.5:1 E: T ratio whereas IL-2-primed NK cells (1000iu/ml for 16 hours) were incubated at 0.5:1 and 0.1:1 E:T. Bars display median with interquartile range (n=4 for all bars).

82
Technologies). EasySep™ Human NK Cell Enrichment Cocktail was added at
50μl/ml, mixed and incubated at room temperature for 10 minutes. EasySep™ D
Magnetic Particles were vortexed for 30 seconds, added at 100µl/ml and incubated
at room temperature for 5 minutes. Robosep™ buffer was then added to make up
the sample to 2.5ml with gentle pipette mixing. The tube was placed into an
EasySep™ magnet and incubated for 2.5 minutes at room temperature. The magnet
and tube were tipped in one motion to pour out the unbound cell suspension into a
new 5ml round bottomed tube.
A small amount (50μl) was taken to test purity of the sample. These cells were
added to 150μl MACS buffer and stained with CD3 (AF700 – Biolegend) and
CD56(APC-Cy7 - Biolegend) antibodies for 30 minutes on ice in the dark. The cells
were then washed with 5ml MACS buffer, centrifuged at 300xg for 5 minutes and re-
suspended in 200μl MACS buffer. PI was added at a concentration of 1μg/ml and
cells were run on a Gallios flow cytometer (Beckman Coulter). The percentage of
CD3-CD56+ NK cells as a proportion of the live lymphocyte population was
assessed (Figure 2.11).
Figure 2.11 – NK cell purity following enrichment Cell suspension was assessed for NK cell purity following EasySep
TM Human NK cell
enrichment. A forward scatter (FS) vs side scatter (SS) plot identified the lymphocyte population. Live cells were identified by negative PI expression. NK cells were identified as CD56+CD3- and the percentage of the lymphocyte gate was calculated.

83
The remaining NK cells were counted and then washed in 5ml growth media. Cells
were re-suspended in 500μl growth media and added to a 24 well plate. 1000 iu/ml
IL-2 (Preprotech) was added to the NK cells which were incubated at 370C and 5%
CO2 for 18 hours. The NK cells were then washed in 5ml growth media, re-
suspended at a concentration of 1x10⁵ NK cells/ml (taking purity into account) and
plated into a 96 well U-bottomed well plate with 10,000 NK cells per well (100μl).
Target cells were counted and a suitable number were removed into a 15ml tube,
washed in PBS and centrifuged for 10 minutes at 300xg. The supernatant was
removed and cells re-suspended in 200μl PBS with 1μM Carboxyfluorescein
succinimidyl ester (CSFE) (eBioscience) added to label the cells, which were then
incubated at 370C; 5% CO2 for 10 minutes. The cells were then washed in 10ml
growth media, re-suspended in a volume of 1x10⁶cells/ml and incubated for a further
hour at 370C; 5% CO2. Target cells were added to the 96 well plate in 100µl aliquots
creating a 1:10 effector to target cell ratio (10,000: 100,000). The plate was
incubated at 370C; 5% CO2 for 16 hours.
Cells were removed from the well via pipette and placed in a 5ml polypropylene
round bottomed FACS tube, stained with 1μg/ml PI (Miltenyi) and 25μl CountBright™
beads (Life Technologies) were added for calculating absolute counts.
Samples were run on the Gallios flow cytometer (Beckman Coulter) for 2 minutes at
high flow speed. Validation that the same volume of sample was analysed could be
shown by the minimal variation in the number of bead events measured between
samples (Figure 2.12).
Calculation of the number of viable target cells was performed by gating on the
CSFE+PI- cells and the CountBrightTM beads (Figure 2.13B and C) and using the
equation:

84
(Number of cell events / number of bead events) x (Bead count per 25µl / volume of
sample) = concentration of sample as cells/μl
These values were compared to control wells into which no effector cells were added
to calculate the percentage of target cell killing achieved by the NK cells.
In instances where PD-1 or DNAM inhibition were used an additional step was taken
to block the NK cells 30 minutes prior to the addition of the target cells to the 96 well
plate. Purified anti-PD1 (Biologend [EH12.2H7]) or purified anti-DNAM (Biolegend
[11A8]) was added at a concentration of 20μl/ml.
Exp 1 Exp 2 Exp 30
5000
10000
15000
Num
ber
of B
eads
Figure 2.12 – Variation in bead number between samples Tubes containing 200µl sample and 25µl CountBright beads were run for two minutes at high flow speed on a Gallios flow cytometer. Variation between bead counts within the same experiment were minimal. Bars show mean bead counts from three separate experiments, with standard deviation error bars. Variation in the bead number between experiments are caused by different lot bead concentrations of the CountBright beads used (Exp1 n=23, Exp2 n=15, Exp3 n=14).

85
Control
0.1:1 E:T
A
C
IL-2
Target Cell Line
Add PI and CountBright beads
NK Cells
Incubate (16 hours)
CSFE
Incubate (16 hours)
FACS
B
Figure 2.13 – NK cell functionality assay NK cells were isolated and stimulated with 1000iu/ml IL-2 for 16 hours. Target cells were stained with CSFE and combined with NK cells at a 0.1:1 effector to target ratio. Cells were incubated for 16 hours, harvested and analysed using flow cytometry (A). Target cells and counting beads were gated based upon size using a forward scatter (FS) vs side scatter (SS) plot. True viable target cells were then identified as CSFE+PI-. Plots show a control tube with no NK cell effectors (B) and a tube with NK cells at a 0.1:1 ratio with target cells (C).

86
Molecular Assays
ULBP06 genotyping and patient cohort
Patient DNA was genotyped to identify presence of the ULBP06 allele. Initially the
ULBP alleles of 27 patients were identified in house by assessing the presence of
eight single-nucleotide polymorphisms (SNPs) (737A; 737G; 1232C; 1232T; 5037C;
5037T; 5729A; 5729G). ULBP6 genotyping was performed by polymerase chain
reaction (PCR) amplification of patient DNA and gel electrophoresis.
DNA was extracted from patient PBMC samples using a DNEasy isolation kit
(Qiagen). Roughly 3-5x10⁶ cells per sample were resuspended in 200μl PBS, to
which 20μl proteinase K was added to lyse the cells. A further 200μl of the kit buffer
(AL) was added, the sample was vortexed and incubated at 56oC for 10 minutes.
Then 200μl ethanol was added and the sample vortexed. The sample was spun
through a DNeasy Mini spin column at 6000xg for 1 minute during which the DNA is
selectively bound to the DNeasy membrane, with the flow through discarded. 500μl
of the second kit buffer (AW1) was added to the column which was spun again at
6000xg for 1 minute with the flow through discarded. A final flush through stage with
500μl of kit buffer (AW2) added and the column spun at 20,000xg for 3 minutes was
performed. To elute the DNA 200μl of the kit buffer (AE) was added. The sample
was incubated at room temperature for 1 minute and then spun at 6000xg for 1
minute with the flow through collected.
The concentration of DNA was assessed in triplicate using a NanoDrop-1000
spectrophotometer (Thermo Scientific). Samples were diluted to approximately
50ng/μl DNA per sample for subsequent PCR preparation.

87
Eight primers were used to identify the ULBP haplotype of patients (Table 2.10).
Samples were made up to a total reaction volume of 13μl in RNase-free water with a
master mix containing 67 mM Tris; 16.6 mM ammonium sulphate, 2 mM magnesium
chloride, 0.01% Tween-20, 200 μM of each deoxyribonucleoside triphos-phate
(dNTP), 0.3 μM control primer, and 0.325 units Taq polymerase (Bioline). Primers
were used at 0.75μM.
PCR was performed with a GeneAmp PCR system 9700 (PE Applied BioSysyems),
with thermal cycling conditions as follows: (180s, 950C) x 1 cycle; (25s, 950C; 45s,
700C; 30s, 720C) x 5 cycles; (25s, 950C; 45s, 650C; 30s, 720C) x 21 cycles; (25s,
950C; 60s, 550C; 120s, 720C) x 1 cycle.
A 1.5% agarose gel was prepared by mixing 1.5g of agarose (Bioline) in 100ml 1x
TBE buffer and then heating to boiling point in a microwave to dissolve the agarose.
After the gel had cooled to 55oC, 0.5μg/ml ethidium bromide (Sigma-Aldrich) was
added to the gel solution which was then poured into a tray with an appropriate gel
comb in. After the gel had cooled the comb was removed and the tank filled with 1x
TBE buffer. The amplified samples were loaded into the wells along with a 100 base
pair DNA marker ladder (Invitrogen).
Electrophoresis was performed at 120V for 45 minutes. Images of the gels were
taken under UV light (Spectroline UV Illuminator TVC-312A) with a Kodak
Electrophoresis Documentation and Analysis System (EDAS) 290.

88
Thirteen patients were heterozygous (01/02) and ten homozygous for the 01 and 02
alleles (Four 01; Six 02). A further four patients were unidentifiable either due to poor
quality DNA or inaccuracies in the PCR controls (Figure 2.14).
To validate our polymorphism classifications and increase patient numbers a total of
68 DNA sample were sent for independent genotyping performed by LGC Genomics
Ltd (Hoddesdon, England) (Table 2.11).
These patients were predominantly male (66%), with a median age of 51 years old
and 74% CMV seropositivity. Most patients were receiving allo-HSCT for treatment
of a myeloid (65%) or lymphoid malignancy (32%). Two patients with aplastic
anaemia were also included in the cohort. Only one patient received their stem cell
graft directly from patient bone marrow rather than a G-CSF mobilised individual.
The majority of patients received reduced intensity conditioning (84%) and T cell
Table 2.10 – Primer sequences used to identify ULBP06 SNPs Two forward oligonucleotide primers were used to discriminate the SNPs, in combination with a common reverse primer. The asterisk highlights the base substitution in the primer sequence.
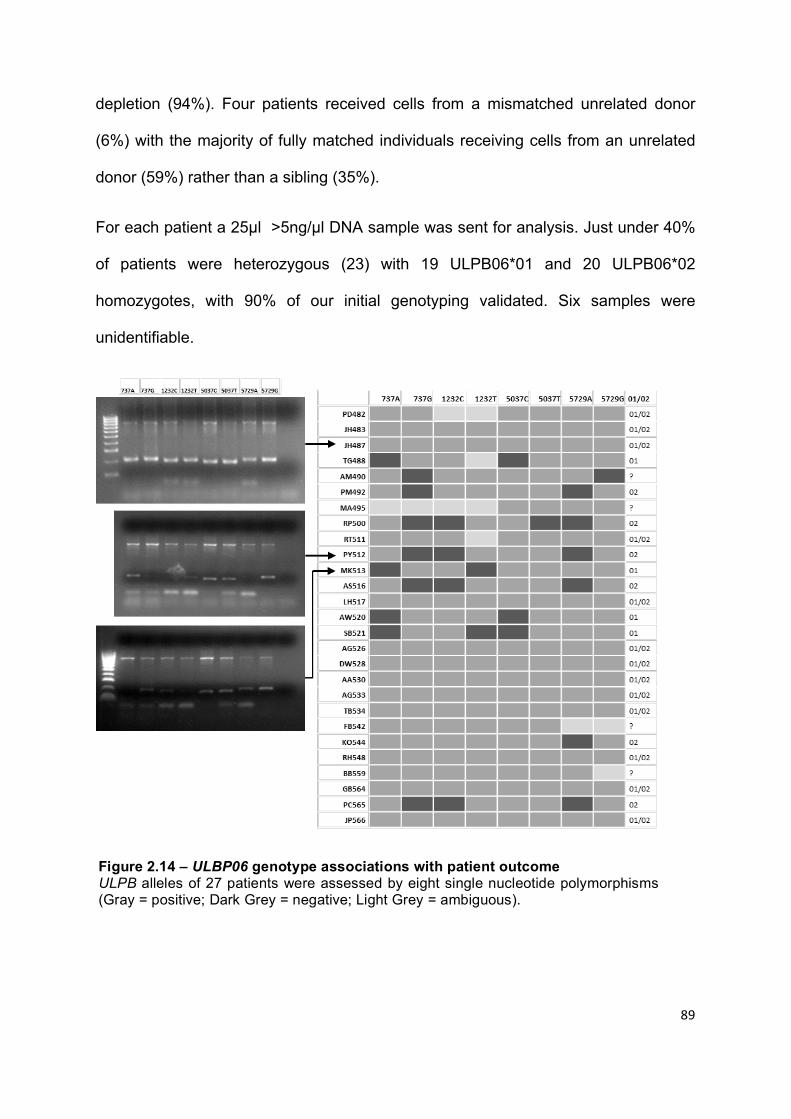
89
depletion (94%). Four patients received cells from a mismatched unrelated donor
(6%) with the majority of fully matched individuals receiving cells from an unrelated
donor (59%) rather than a sibling (35%).
For each patient a 25μl >5ng/μl DNA sample was sent for analysis. Just under 40%
of patients were heterozygous (23) with 19 ULPB06*01 and 20 ULPB06*02
homozygotes, with 90% of our initial genotyping validated. Six samples were
unidentifiable.
Figure 2.14 – ULBP06 genotype associations with patient outcome ULPB alleles of 27 patients were assessed by eight single nucleotide polymorphisms (Gray = positive; Dark Grey = negative; Light Grey = ambiguous).

90
Table 2.11 – ULBP06 genotyped patient characteristics CMV – cytomegalovirus; ATG – Anti-Thymocyte Globulin; PBMC – peripheral blood mononuclear cells.

91
Microarray
Assessment of NK cell RNA transcriptomes were acquired by microarray analysis.
NK cells were negatively isolated from five healthy individual and five stem cell graft
sample PBMCs using an EasySep™ Human NK cell enrichment kit (Stem Cell
Technologies). The EasySep™ Human NK Cell Enrichment Cocktail was added at
50µl/ml to a cell suspension of 5-20 x106 PBMC to label the other cellular
components. After incubation at room temperature for 10 minutes vortexed
EasySep™ D Magnetic Particles were added at 100µl/ml. Following incubation at
room temperature for 5 minutes Robosep™ buffer was added to make the sample
up to 2.5ml. The sample tube was placed into an EasySep™ magnet and incubated
for a further 2.5 minutes at room temperature to mobilise the beads. Finally, the
magnet and tube were tipped in one motion to pour out the unbound cell suspension
into a fresh 5ml round bottomed tube.
The isolated NK cells were stained with anti-CD3 (PE - Biolegend) and anti-CD56
(APC-Cy7 - Biolegend) on ice in the dark for 30 minutes. Cells were washed in
MACS buffer and the CD3- CD56+ live cells were sorted with an Astrios cell sorter
(BD Biosciences) to <99% purity as an added enrichment step. The sorted NK cell
populations were sent to AROS Applied Biotechnology A/S (Aarhus N, Denmark) as
dry cell pellets. Total RNA was extracted, labelled and hybridized to GeneChip®
Human Transcriptome Array 2.0 (Affymetrix, USA). Raw data was processed using
Affymetrix’s Expression Console software with default RNA parameters. Gene set
enrichment analysis was conducted by Dr Wayne Croft using the hallmark and
canonical gene sets from the molecular signatures database (MSigDB database
v6.0).

92
Statistical analysis
Clinical outcomes
Clinical outcomes assessed post allo-HSCT were overall survival (OS), non-relapse
mortality (NRM), relapse incidence (RI) and incidence of acute graft versus host
disease (aGvHD). OS was defined as time to death, of any cause, post
transplantation. NRM was defined as death without prior relapse, with a competing
risk of death following relapse. RI was defined as time to relapse with a competing
risk of death without relapse. Incidence of aGvHD was determined by the diagnosis
of grade 2 or above aGvHD within 100 days post transplantation and a competing
risk of death before 100 days without aGvHD incidence. (Iacobelli & EBMT Statistical
Committee 2013).
Overall survival is a binary outcome, the patient is either alive or deceased at the
end of the follow-up period. The effect of all baseline variables upon OS was
estimated using the Kaplan-Meier method. Statistical analysis of these survival
curves was performed by Log-Rank tests. This test measures the difference between
the expected and observed events at different time points to see if the null
hypothesis, that there is no difference between two populations in terms of the
probability of an event, is correct. To calculate a regression analysis using these
outcomes a Cox proportional hazards model was suitable. This test estimates the
individual effect of several different independent variables on the differences
between two groups.
Relapse incidence, graft versus host incidence and non-relapse mortality are all
patient outcomes which can provide useful information. However with these

93
outcomes there is a possibility that another unrelated event could occur before the
event of interest. For example when investigating relapse incidence following allo-
HSCT there will be patients who reach censorship without relapse, patients who
relapse and additionally a group of patients who will die from non-relapse related
causes, but whom could have relapsed if that had not occurred. Without taking this
competing risk into account any analysis will be skewed as the “died before relapse
could occur” group would be included in the censorship group. The outputs of theses
patient outcomes are therefore not binary.
Gray developed a statistical test to compare the cumulative incidence of an event
whilst taking a competing risk into account (Gray 1988). This can be performed using
the ‘cmprsk’ package in R program for statistical computing. Following on from this
Fine and Gray developed a regression model in order to correctly assess multiple
variables whilst also taking the competing risk into account (Fine & Gray 1999).
Clinical outcome statistical analysis
Associations between cell numbers and patient outcomes were assessed using R
project for statistical computing 3.2.2.
The binary outcome of overall survival was assessed for significance by a log rank
test, with multivariate regression analysis performed using a Cox proportional
hazards model.
Clinical outcomes with a competing risk were assessed with a Gray test using the
‘cmprsk’ package in R program (Gray 1988). Further multivariate regression analysis
was performed using the Fine and Gray model, also available through the ‘cmprsk’
package (Fine & Gray 1999).
94
Baseline variables with a cut-off point of p < 0.2 were included in multivariate
analyses.
R programming code for tests and plots:
Log rank test – survdiff(Surv(time, status)~x, rho=o
Kaplan-Meier – formula >a=survfit(Surv(time, status)~variable)
>plot(a, conf.int=”none”, mark.time=FALSE, col=c(“red”, “black”), xlab=””, ylab=””)
Grey test: > cuminc(time_a, status_a, variable, cencode=0)
>plot(cuminc(time_a, status_a, variable, cencode=0), xlab=, ylab=, col=c(“1”,”2”…), lty=1, lwd=2)
Fine and Grey test: > x=cbind(variable_1, variable_2, variable_3…)
> mod1=crr(time_a, status_a, x)
Comprehensive instructions on performing the analysis have been published by
Scrucca et al (Scrucca et al. 2007; Scrucca et al. 2010).
General statistical analysis
Statistical analyses were performed using GraphPad Prism (7.0), IBM SPSS
Statistics (21) and R (the R project for statistical computing 3.2.2). Appropriate
statistical testing was used, depending upon the data being parametric or non-
parametric, and taking competing risks into account.
For flow cytometric phenotypic analyses data normalcy was assessed via a
D'Agostino-Pearson normality test. The majority of cases data did not follow a
Gaussian distribution and therefore a Mann-Whitney test was performed to compare
the two groups. Statistical significance was determined with a p value lower than
0.05. Where the p value is not stated in the figure, significance is displayed by
95
asterisks where * indicates <0.05, ** indicates <0.01 and *** indicates <0.001. All
significant p values are recorded in the figure legend.
In the instance where multiple significance tests were performed on the same data
set (i.e. comparisons with multiple clinical outcomes) a Bonferroni correction was
used to set a more stringent significance value (0.05/4 = significant p value <0.0125).
Data is primarily presented with bar charts displaying the median value and error
bars demonstrating the interquartile range, but each is specified in the figure
legends.
In instances where correlation between two quantitative variables was assessed a
Pearson coefficient of determination was calculated. This is presented as an R2
value between 0 and 1 and defines the percentage variation in variable g caused by
variable c. An accompanying p value determines whether the correlation coefficient
is significantly different than the null hypothesis that there is no correlation between
the two variables. A p value less 0.05 was used to indicate a significant correlation.
To determine the optimum cell dose thresholds to distinguish between patient
outcomes receiver operating characteristic (ROC) curve analysis was used. The true
positive rate (sensitivity) was plotted against the false positive rate (100-specificity)
to create a graph of which the area under the curve (AUC) is a measure of how well
the variable can separate between the two outcomes. The point with the highest
sensitivity and specificity (i.e. closest to the top left corner of the graph) indicates the
most suitable discriminatory threshold.

96
Chapter 3 - Lymphocyte reconstitution within the first month following allo-HSCT
Allogeneic haematopoietic stem cell transplantation is a potentially curative
treatment for a range of myeloid and lymphoid malignancies. Haematopoietic stem
cells transferred from a donor will hopefully engraft into a lymphodepleted host to
restore a functional immune system as well as contributing towards an allo-immune
response against any residual tumour. Risks of acute GvHD and transplant related
mortality are also present with the effectiveness of the donor derived immune
repertoire reconstitution playing a role in these outcomes.
Whilst full recovery of a functional immune repertoire will take over a year post-
transplant, reconstitution of immune cells begins immediately. Cells directly
transferred with the stem cell graft will populate the host while de novo cells will be
generated following engraftment of the haematopoietic stem cells. NK cells are the
initial population to recover and dominate the immune environment during the first
month post-transplant. They are also associated with producing a GvL response in
certain transplant settings, however at which point this is established is not entirely
clear.
Immune reconstitution during the first month post-transplant has not been
extensively studied due to the difficulties in obtaining samples and the low numbers
of cells available to examine when collected. Here cell populations within peripheral
blood samples of patients undergoing T cell depleted allo-HSCT were assessed
during the first month post-transplant and correlated with subsequent clinical
outcomes.

97
Results
Cellular reconstitution during the first month following allo-HSCT
Absolute counts and cellular phenotypes of 158 patient peripheral blood samples,
collected during the first month following allo-HSCT, were analysed to assess
lymphocyte reconstitution (Table 2.1). Patient samples were pooled for each weekly
time point to assess the average cell composition across all patients (Table 3.1).
Healthy adult peripheral blood contains roughly 2000 lymphocytes per μl with around
three quarters (~1500) compromising of T cells, whilst NK cells represent up to 15%
of the lymphocyte population (~250 NK cells/μl) (Apoil et al. 2017). These values
were calculated form a study looking at 253 healthy individuals aged between 19 and
67 years old. Similarly, within our healthy donor cohort, which represent a younger
demographic aged between 24 to 45 years old, the mean lymphocyte number within
the peripheral blood was 2591 cells/µl (Figure 3.1A). T cells made up roughly 60% of
the lymphocyte population and NK cells a further 15% (Figure 3.1B).
Table 3.1 – Post-transplant samples assessed

98
Within the cohort of patients assessed following full or reduced intensity conditioning
their lymphocyte pool was severely depleted (Figure 3.2A). In the majority of
patients, numbers of T and NK cells were negligible on the day of donor graft
infusion, with median values of less than 1 cell per µl of peripheral blood (Table 3.1;
Figure 3.2B). By two weeks post-transplant both T and NK cell numbers began to
increase. At one-month post-transplant total lymphocyte count was still well below
normal values with T cell reconstitution at a median of 19 cells per µl of blood,
around 75 fold lower than expected in healthy individuals. Contrastingly NK cell
reconstitution was far greater than in T cells with a median of 160 cells per µl of
blood at one month, with some patients almost reaching normal values within this
short time period.

99
A B
C D
Figure 3.1 – Lymphoid subsets in healthy peripheral blood Peripheral blood was collected from healthy individuals and PBMC isolated as described. Lymphocyte count per µl of blood was calculated using the Trucount method (A). T and NK cell populations were identified by flow cytometric immunophenotyping as CD3+CD56- and CD3-CD56+ respectively (B). The subpopulations of CD4+/CD8+ T cells (C) and CD56
bight/dim NK cells (D) were also assessed. Bars display mean and standard deviation. (A
n=8, B n=15, C n=8, D n=15).
100
NK Cell subset reconstitution dynamics
Having demonstrated a predominance of NK cells within the first month, the
composition of this NK compartment was assessed in more detail. Mature and
immature NK cells can be identified on the basis of dim or bright CD56 expression
respectively (Cooper et al. 2001). In healthy individuals the CD56bright population
makes up only 5-10% of the NK cell repertoire of the peripheral blood (Figure 3.1C).
Interestingly the reconstitution of both subsets increased simultaneously over the
first month reaching similar median values within the peripheral blood by day 28
(55.4 CD56dim NK cells/µl; 58.1 CD56bright NK cells//µl) (Figure 3.2C). This is either
indicative of homeostatic proliferation of the NK cell population received in the donor
stem cell graft or indicates the production of de novo NK cells from engrafted donor
CD34+ haematopoietic progenitor cells.
T cell subset reconstitution dynamics
The two major subgroups of T cells are CD4+ T cells and CD8+ T cells which
represent roughly 65% and 25% of the total T cell population in healthy individual
peripheral blood respectively (Apoil et al. 2017) (Figure 3.1C). At the point of
transplantation the T cell depletion received by patients had eliminated both CD4+
and CD8+ T cells to similarly low numbers. No significant difference between the
absolute number of peripheral blood CD4+ T cells (median 3.5 cells per µl) and
CD8+ T cells (median 4.5 cells per µl) was found within the first month following allo-
HSCT (Figure 3.2C).
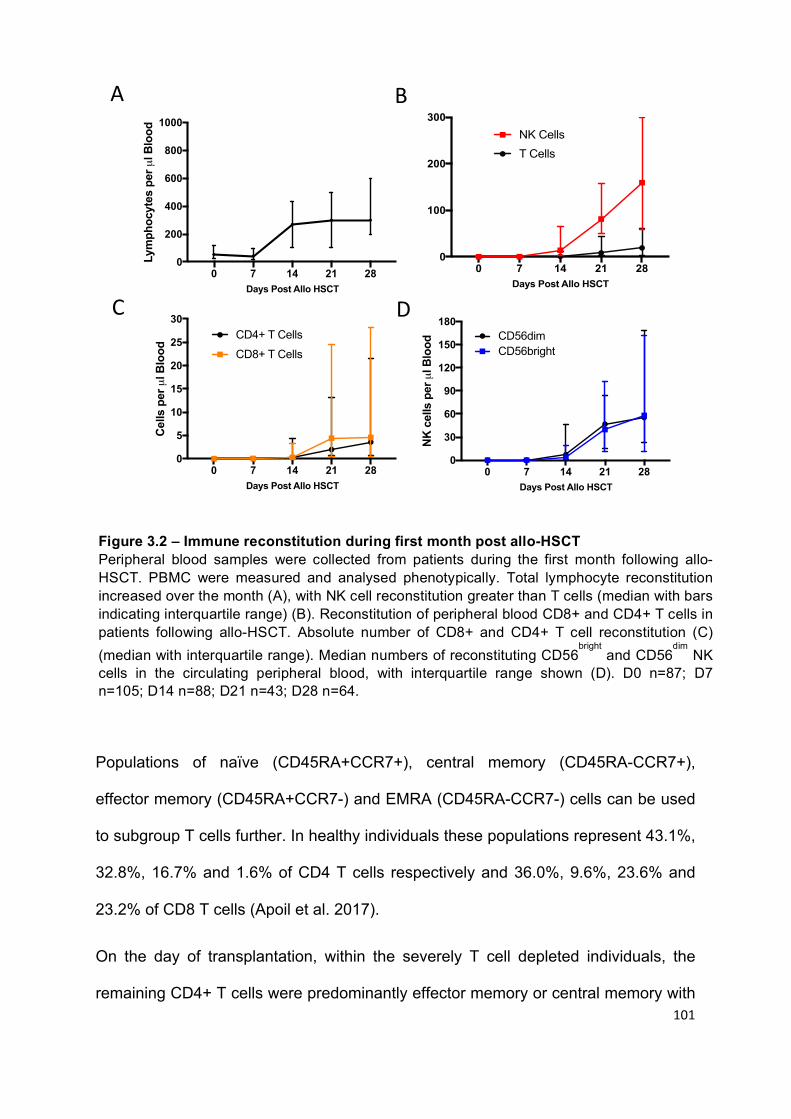
101
Populations of naïve (CD45RA+CCR7+), central memory (CD45RA-CCR7+),
effector memory (CD45RA+CCR7-) and EMRA (CD45RA-CCR7-) cells can be used
to subgroup T cells further. In healthy individuals these populations represent 43.1%,
32.8%, 16.7% and 1.6% of CD4 T cells respectively and 36.0%, 9.6%, 23.6% and
23.2% of CD8 T cells (Apoil et al. 2017).
On the day of transplantation, within the severely T cell depleted individuals, the
remaining CD4+ T cells were predominantly effector memory or central memory with
0 7 14 21 280
100
200
300
Days Post Allo HSCT
Cel
ls p
er µ
l Blo
od T CellsNK Cells
A B
0 7 14 21 280
30
60
90
120
150
180
Days Post Allo HSCT
NK
cel
ls p
er µ
l Blo
od
CD56dim CD56bright
0 7 14 21 280
5
10
15
20
25
30
Days Post Allo HSCT
Cel
ls p
er µ
l Blo
od
CD4+ T Cells
CD8+ T Cells
C D0 7 14 21 28
0
200
400
600
800
1000
Days Post Allo HSCT
Lym
phoc
ytes
per
µl B
lood
Figure 3.2 – Immune reconstitution during first month post allo-HSCT Peripheral blood samples were collected from patients during the first month following allo-HSCT. PBMC were measured and analysed phenotypically. Total lymphocyte reconstitution increased over the month (A), with NK cell reconstitution greater than T cells (median with bars indicating interquartile range) (B). Reconstitution of peripheral blood CD8+ and CD4+ T cells in patients following allo-HSCT. Absolute number of CD8+ and CD4+ T cell reconstitution (C) (median with interquartile range). Median numbers of reconstituting CD56
bright and CD56
dim NK
cells in the circulating peripheral blood, with interquartile range shown (D). D0 n=87; D7 n=105; D14 n=88; D21 n=43; D28 n=64.

102
averages of 7.55% naïve, 29.73% central memory, 59.20% effector memory and
3.52% EMRA (Figure 3.3A). This suggests that naïve and central memory CD4+ T
cells are more selectively killed off during conditioning. Within the CD8+ T cell
subgroup effector memory and EMRA were the main groups remaining (13.03%
naïve, 7.21% central memory, 48.81% effector memory and 30.95% EMRA) (Figure
3.3B). This also suggests an increased drop off in mainly the naïve T cells as well as
the central memory T cells. Over the course of the first month post-transplant these
populations did not significantly change.
Together these data indicates that the infused donor product did not have a major
effect on the host T cell population and that notable production of novel naïve T cells
does not begin to occur within this early time period.
A B
0 7 1 4 2 1 2 80
2 0
4 0
6 0
8 0
1 0 0
D a y s P o s t A llo H S C T
Pe
rce
nta
ge
of
CD
4+
T c
ell
s
CM
EM
EMRA
Naive
0 7 1 4 2 1 2 80
2 0
4 0
6 0
8 0
1 0 0
D a y s P o s t A llo H S C T
Pe
rce
nta
ge
of
CD
4+
T c
ell
s
CM
EM
EMRA
Naive
0 7 1 4 2 1 2 80
2 0
4 0
6 0
8 0
1 0 0
D a y s P o s t A llo H S C T
Pe
rce
nta
ge
of
CD
8+
Tc
ell
s
Days Post Allo-HSCT Days Post Allo-HSCT
Perc
enta
ge o
f CD
4+ T
Cel
ls
Perc
enta
ge o
f CD
8+ T
Cel
ls
Figure 3.3 – T cell reconstitution dynamics Subgroup percentages of peripheral blood CD4+ (A) and CD8+ (B) T cells were assessed over the first month of reconstitution post-transplant. Bars display mean values for each subgroup. Memory subsets are defined as naïve (CD45RA+CCR7+), central memory (CD45RA-CCR7+), effector memory (CD45RA+CCR7-) and EMRA (CD45RA-CCR7-). (D0 n=87; D7 n=105; D14 n=88; D21 n=43; D28 n=64).

103
Patient Outcomes
To identify whether reconstitution of T and NK cells during the first month post allo-
HSCT is predictive of subsequent clinical course the cohort was next assessed in
relation to clinical outcome events (Table 3.2). In total 104 patients in the cohort
were over two years post-transplant and therefore included in the analysis. The
overall survival of these patients at two years was 59%. Relapse incidence by two-
years post-transplant was 30% when the competing risk of death before one year
was taken into account. Acute GvHD incidence within the first 100 days post-
transplant was 40% when the competing risk of death within the first 100 days was
taken into account. Finally, the non-relapse mortality at two years post-transplant
was 32% when the competing risk of death due to disease relapse was taken into
account.
Assessment of T and NK cell reconstitution associations with patient outcome
Initially to assess whether there was any effect between the reconstitution of T and
NK lymphocytes and clinical outcome post allo-HSCT, patients were split based
upon whether an event occurred or not and the pooled cell counts (per ul peripheral
blood) were calculated over the first month (Figure 3.4). Overall T cell reconstitution
was relatively low during the first month post-transplant. Whilst there was some
variation between patients no significant differences in the numbers of T cells
reconstituted were found to associate with patient outcomes (Figure 3.4A; 3.4C;
3.4E; 3.4G). At the two week and one month time points similar numbers of T cells in
the circulating peripheral blood were measured in patients who were alive at one

104
year post transplant and those that were deceased (Day 14: 0.88 – 1.11 cells/μl; p –
0.4907. Day 28: 18.45 – 2.88 cells/μl; p – 0.2761) (Figure 3.4A). Comparable T cell
numbers within the peripheral blood were observed between patients who did not
relapse and those that did (Day 14 0.58 – 1.08 cells/μl; p – 0.9743. Day 28 19.11 –
2.90 cells/μl; p - 0.2534) (Figure 3.4C) as well as patients who developed aGvHD
(Day 14: 1.12 – 0.75 cells/μl; p – 0.9643. Day 28: 10.33 – 21.08 cells/μl; p – 0.6648)
or died from NRM (Day 14: 0.65 – 0.91 cells/μl; p – 0.6463. Day 28: 19.11 – 2.66
cells/μl; p – 0.2927).
There was much greater heterogeneity in patient NK cell reconstitution during the
first month post-transplant, suggesting that there could be a discernible impact on
patient outcome. However, patients who were alive at one year post transplant and
those that were deceased had no significant difference in NK cell reconstitution (Day
14: 14.08 – 13.49 cells/μl; p – 0.8648. Day 28: 99.94 – 159.4 cells/μl; p – 0.5925)
(Figure 3.4B).
A possible trend towards inferior reconstitution of NK cells at two weeks post-
transplant occurred in patients who went on to relapse (Day 14 14.08 – 3.76 cells/μl;
p – 0.1843) (Figure 3.4D). However this trend was not maintained at one month
post-transplant (Day 28 109.0 – 45.52 cells/μl; p - 0.443).
No differences in NK cell reconstitution and the incidence of acute GvHD within the
first 100 days post-transplant were observed (Day 14: 8.27 – 21.03 cells/μl; p –
0.1031. Day 28: 161.9 – 157.3 cells/μl; p – 0.2639) (Figure 3.4F). Similarly no effect
on NRM was found (Day 14: 10.65 – 57.39 cells/μl; p – 0.3133. Day 28: 98.16 –
213.7 cells/μl; p – 0.2927) (Figure 3.4H).
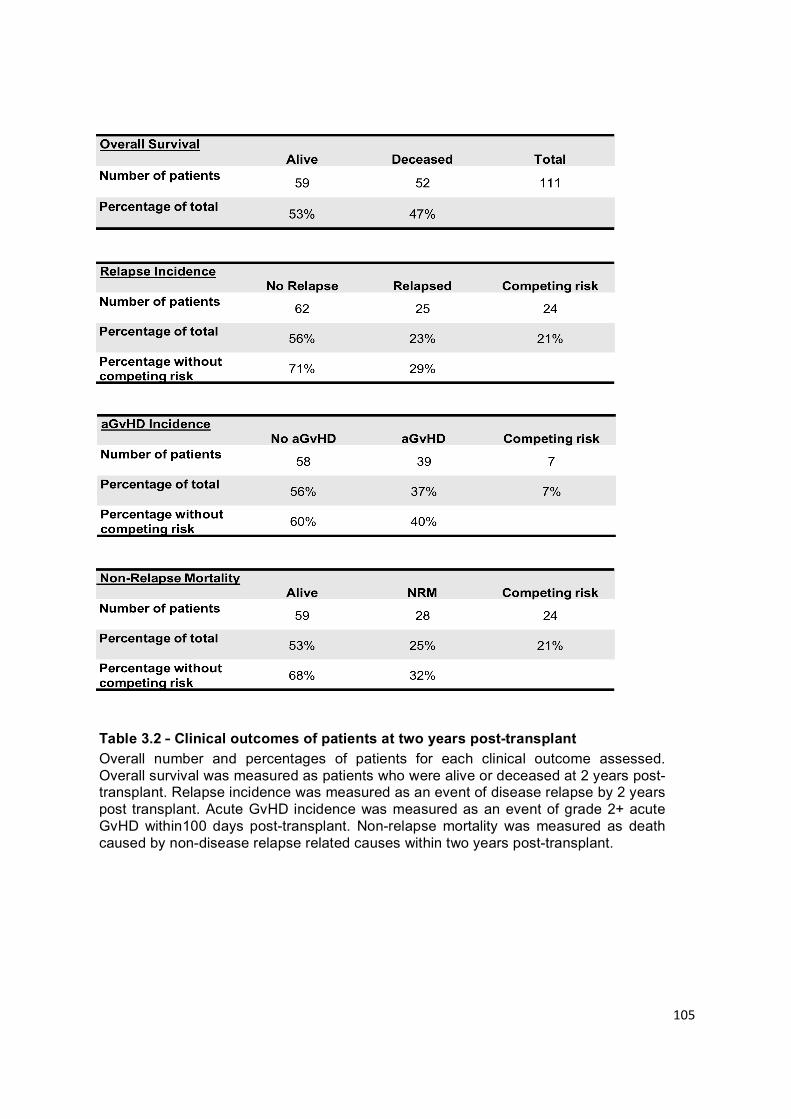
105
Table 3.2 – Clinical outcomes of patients at two years post-transplant Overall number and percentages of patients for each clinical outcome assessed. Overall survival was measured as patients who were alive or deceased at 2 years post-transplant. Relapse incidence was measured as an event of disease relapse by 2 years post transplant. Acute GvHD incidence was measured as an event of grade 2+ acute GvHD within100 days post-transplant. Non-relapse mortality was measured as death caused by non-disease relapse related causes within two years post-transplant.

106
0 7 14 21 280
20
40
60
80
100
Days Post Allo HSCT
Cel
ls p
er µ
l Blo
od
AliveNRM
0 7 14 21 280
20
40
60
80
100
120
140
Days Post Allo HSCT
T ce
lls p
er µ
l Blo
od
No aGvHD
aGvHD
0 7 14 21 280
20
40
60
80
100
Days Post Allo HSCT
T C
ells
per
µl B
lood
Non-relapse
Relapse
0 7 14 21 280
20
40
60
80
100
Days Post Allo HSCT
T ce
lls p
er µ
l Blo
od
Alive
Deceased
A
C
E
0 7 14 21 280
100
200
300
400
Days Post Allo HSCT
NK
cel
ls p
er µ
l Blo
od AliveDeceased
0 7 14 21 280
100
200
300
400
Days Post Allo HSCT
NK
cel
ls p
er µ
l Blo
od No aGvHDaGvHD
0 7 14 21 280
100
200
300
400
Days Post Allo HSCT
NK
cel
ls p
er µ
l Blo
od
Non-relapse
Relapse
0 7 14 21 280
100
200
300
400
Days Post Allo HSCT
Cel
ls p
er µ
l Blo
od AliveNRM
B
D
F
G H
0 7 14 21 280
20
40
60
80
100
Days Post Allo HSCT
T ce
lls p
er µ
l Blo
od
Alive
Deceased
0 7 14 21 280
20
40
60
80
100
Days Post Allo HSCT
T C
ells
per
µl B
lood
Non-relapse
Relapse
0 7 14 21 280
20
40
60
80
100
120
140
Days Post Allo HSCT
T ce
lls p
er µ
l Blo
od
No aGvHD
aGvHD
0 7 14 21 280
20
40
60
80
100
Days Post Allo HSCT
Cel
ls p
er µ
l Blo
od
AliveNRM
OS
RI
aGvHD
NRM
Figure 3.4 – Association of T and NK cell reconstitution with clinical outcome The potential association of T and NK cell reconstitution during the first month post allo-HSCT with patient outcomes was analysed. Patients were split based upon whether they were alive or deceased at two years post transplant (A/B), had relapsed or not at one year post transplant (C/D), had acquired aGvHD or not after 100 days post transplant (E/F) or died from non-relapse related mortality or not at two years post transplant (G/H) (medians with interquartile range). n=OS Deceased/Alive: D0 22/35; D7 27/37; D14 26/34; D21 11/13; D28 14/25. RI Non-relapse/Relapse: D0 39/15; D7 41/16; D14 40/15; D21 17/5; D28 26/7. aGvHD No/Yes, D0 34/43; D7 49/47; D14 37/47; D21 21/18; D28 27/31. NRM Alive/NRM D0 33/11; D7 36/16; D14 33/18; D21 14/7; D28 24/18.

107
Association of high or low T cell reconstitution with patient outcomes
To try to distinguish any differences between patients the cohort was then split
based upon patients who had ‘high’ (> median) and ‘low’ (< median) T cells in the
peripheral blood at two weeks (median – 0.97 cells/μl) and one month post-
transplant (median – 19.1 cells/μl). These groups were compared in relation to
clinical outcome (Figure 3.5). No difference in terms of overall survival was observed
(p – 0.508; p – 0.201) (Figure 3.5A; 3.5B). However, ‘high’ T cell reconstitution at
one month was associated with a trend towards protection from disease relapse (p:
0.0952) (Figure 3.5D). No relapses were observed in 5 patients with very high T cell
reconstitution (> 35 cells/μl) at two weeks post-transplant. This association also
appeared to be maintained at one month post-transplant although there was one
outlier. Reconstituting ‘high’ or ‘low’ T cells within the first month post-transplant did
not significantly associate with acute GvHD incidence or with NRM. Interestingly
higher numbers of T cells by one month post-transplant trended towards higher
aGvHD incidence and may therefore indicate an alloreactive T cell response being
activated.

108
Figure 3.5 – The association of early T cell reconstitution with clinical outcome The potential association of T cell number in the peripheral blood at two and four weeks post allo-HSCT with patient outcomes was analysed. Patients were assessed based upon whether they were alive at two years post-transplant (A/B), had relapsed by two years post-transplant (C/D), had acquired aGvHD by 100 days post-transplant (E/F) or died from non-relapse related mortality at two years post-transplant (G/H). Patients were divided based upon reconstitution of either above (black) or below (red) the median T cell number in the cohort at two or four weeks. Cumulative incidence analysis was tested using the Gray method. Log-Rank tests were used to analyse Kaplan-Meier survival curves. D14 n=64, D28 n=40.

109
Association of high or low NK cell reconstitution with patient outcome
When split based upon patients who had ‘high’ (> median) and ‘low’ (< median) NK
cells in the peripheral blood at two weeks (median – 15.9 cells/μl) and one month
post-transplant (median – 159.4 cells/μl) there was no difference in terms of overall
survival (p – 0.811; p – 0.308) (Figure 3.6A; 3.6B).
However, when split by median values, ‘low’ NK cell reconstitution was associated
with almost 35% relapse probability compared to only 15% in ‘high’ patients by two
weeks post-transplant (p – 0.0777) (Figure 3.6C). By one month post-transplant
however low or high NK cell numbers in the peripheral blood did not associate with
relapse risk (p – 0.5475) (Figure 3.6D). As such, a beneficial effect of ‘high’ NK cell
reconstitution and protection from disease relapse may be established very early on
during the first two weeks post-transplant.
High or low NK cell reconstitution during the first month post-transplant did not
significantly affect aGvHD incidence (p – 0.4098; p – 0.6381) (Figure 3.6E; 3.6F).
Interestingly high NK cell reconstitution trended towards an association with more
non-relapse mortality both at two (p – 0.2593) and four weeks (p – 0.1287) post-
transplant (Figure 3.6G; 3.6H).

110
Figure 3.6 – The association of early NK cell reconstitution with clinical outcome The potential association of NK cell number in the peripheral blood at two and four weeks post allo-HSCT with patient outcomes was analysed. Patients assessed based upon whether they were alive at two years post-transplant (A/B), had relapsed by two years post-transplant (C/D), had acquired aGvHD by 100 days post-transplant (E/F) or died from non-relapse related mortality at two years post-transplant (G/H). Patients were divided based upon reconstitution of either above (black) or below (red) the median NK cell number in the cohort at two or four weeks. Cumulative incidence analysis was tested using the Gray method. Log-Rank tests were used to analyse Kaplan-Meier survival curves. D14 n=64, D28 n=40.

111
CD56bright and CD56dim NK cell reconstitution associates with protection from relapse
As a trend was observed between high NK cell reconstitution at day 14 and low
incidence of disease relapse further examination of the CD56bright and CD56dim NK
cell subsets split by the median values (3.87 and 7.87 cells/μl respectively) was
conducted. High numbers of both immature and mature NK cells were similarly
associated with a protective disease relapse effect at two weeks post-transplant
(CD56bright p: 0.0457; CD56dim p: 0.0529) (Figure 3.7A). Interestingly high numbers of
CD56bright NK cells at one month post-transplant maintained this protective
association (> 58.06 cells/μl; p – 0.0139) whilst CD56dim NK cells did not (55.4
cells/μl; p – 0.4913) (Figure 3.7B). Data suggest that within the first two weeks post-
transplant the function of mature CD56dim NK cells may be important, but following
this the production of new immature cytokine producing CD56bright NK cells is more
relevant in preventing relapse.

112
Figure 3.7 –NK cell subset reconstitution may be protective from relapse Relationship between number of peripheral blood CD56
dim and CD56
bright NK cells in
patients following allo-HSCT and incidence of relapse (RI) by two years post-transplant. The median number of cells was defined and transplants were divided into those where the number of cells in the peripheral blood was either above (black) or below (red) this median value. Values at two weeks post-transplant (A), and one month (B) were assessed. Cumulative incidence analysis was tested using the Gray method. D14 n=64, D28 n=40.

113
Myeloid and lymphoid disease split
The beneficial effects of NK cell reconstitution in relation to protection against
disease relapse in allo-HSCT have been seen predominantly in myeloid disease
(Savani et al 2007; Dunbar et al. 2008). As CD56bright and CD56dim NK cell
reconstitution associated with disease relapse incidence at day 14 post-transplant I
next separated patients according to myeloid or lymphoid disease (Figure 3.8).
In myeloid disease a trend was observed between ‘high’ reconstitution of both
CD56bright and CD56dim NK cells and relative protection from disease relapse
(CD56bright p: 0.1837; CD56dim p: 0.1204) (Figure 3.8A). Within patients with lymphoid
disease high numbers of the immature CD56bright NK cells showed a stronger
association with relapse protection than the mature subset (CD56bright p: 0.1040;
CD56dim p: 0.3775) (Figure 3.8B) but none of these values reached statistical
significance.
The lower number of patients (Myeloid n=37; Lymphoid n=25) analysed within each
cohort would act to reduce the statistical significance of observations but it is still
noteworthy that a trend remained between high NK cell reconstitution at day 14 and
relative protection from disease relapse. Therefore, any GvL effect mediated by NK
cells in this early period post-transplant may not be entirely myeloid-specific.

114
Figure 3.8 - NK cell reconstitution at day 14 post allo-HSCT and association with disease relapse in patients with myeloid or lymphoid disease Relationship between number of peripheral blood CD56
dim and CD56
bright NK cells at day 14
post-transplant in myeloid (A) and lymphoid (B) patients following allo-HSCT and incidence of relapse (RI) by two years post-transplant. The median number of cells was defined, and transplants were divided into those where the number of cells in the peripheral blood was either above (black) or below (red) this median value. Cumulative incidence analysis was tested using the Gray method. (Myeloid n=37, Lymphoid n=25).

115
ULBP06*01 patient genotype is associated with increased survival after allo-HSCT
The ULBPs are a family of ligands for NKG2D, an activating receptor found on T and
NK cells. ULPB06 polymorphisms have been associated with overall and relapse-
free survival following transplant in a cohort of T cell depleted and T cell replete HLA-
matched sibling transplants (Antoun et al. 2012). To assess whether ULBP06
polymorphisms were important in determining outcome in a predominantly T cell
depleted cohort I next correlated the outcomes of 62 patients undergoing allo-HSCT
with their ULBP06 genotype obtained after sending DNA samples to LGC Genomics
Ltd (Hoddesdon, England) (Table 2.11). Just under 40% of patients were
heterozygous (23) with 19 ULPB06*01 and 20 ULPB06*02 homozygotes.
At 1 year post-transplant the overall survival was approximately 82% in all groups,
but by two years post-transplant overall survival rates began to differ with the
ULBP06*01 homozygous patients maintaining a much higher survival rate (79%)
than ULBP06*02 homozygotes (59%; p – 0.210) and ULBP06*01/02 heterozygotes
(33%; p - 0.011) (Figure 3.9A). This suggests that NKG2D ligands might have a role
in determining overall survival beyond the first year post allo-HSCT. Rates of
relapse, aGvHD and non-relapse mortality were not significantly different between
groups (Figure 3.9B; C and D). The heterozygous group did, however, have both the
highest NRM and relapse-related death rates as well as the lowest aGvHD incidence
suggesting, perhaps, both an impaired cell reconstitution and decreased alloreactive
response.
As ULBP06 is a ligand for NKG2D, expression of this activatory receptor on
CD56dim NK during the first month following allo-HSCT was assessed. Expression of
NKG2D did not differ between patients who were deceased within three years post-
transplant or not (Day 14: 60.7 vs 62.4%; p – 0.810. Day 28: 76.7 vs 78.7%; p –
0.743) (Figure 3.10A), relapsed or not (Day 14: 59.4 vs 66.7%; p – 0.363. Day 28:
77.2 vs 78.5%; p – 0.865) (Figure 3.10B) developed acute GvHD or not (Day 14:
63.4 vs 60.1%; p – 0.631. Day 28: 76.7 vs 77.8%; p – 0.853) (Figure 3.10C) or died

116
from non-relapse mortality (Day 14: 65.0 vs 76.73%; p – 0.3840. Day 28: 79.2 vs
90.3%; p – 0.1280) (Figure 3.10D). As such, the relative expression of NKG2D on
NK cells in the early post transplant period does not appear to be a determinant of
clinical outcome.
A large degree of heterogeneity was seen in NKG2D expression, especially at two
weeks post-transplant, with a small proportion of patients having less than 20% of
their NK cell population expressing the receptor. Again, however, this did not seem
to affect patient outcomes and by one month post-transplant NKG2D expression had
recovered to relatively normal levels. Together this suggests that any effect ULBP06
polymorphisms may have on patient outcomes is not mediated by NKG2D+ NK cells
within this early time period.
Figure 3.9 – The association of ULBP06 genotype with patient outcome Analysis with 68 patients compared the presence of ULBP06 alleles with overall survival at three years (A), relapse incidence at two years (B), aGvHD incidence (C) and non-relapse mortality at three years (D)of patients undergoing allo-HSCT. OS Hetero/*01 p – 0.011; Hetero/*02 p – 0.273; *01/*02 p – 0.210. RI Hetero/*01 p – 0.543; Hetero/*02 p – 0.770; *01/*02 p – 0.421. aGvHD Hetero/*01 p – 0.160; Hetero/*02 p – 0.181; *01/*02 p – 0.999. NRM - Hetero/*01 p – 0.249; Hetero/*02 p – 0.616; *01/*02 p – 0.563.

117
Figure 3.10 – Relative expression of NKG2D+ on CD56dim
NK cells post-transplant Expression of NKG2D on CD56
dim NK cells at two and four weeks post allo-HSCT in patients
according to subsequent clinical outcome of survival (A), relapse (B) and aGvHD (C). Y axis indicates percentage of CD56dim NK cells positive for NKG2D expression. Bars charts show median values with interquartile range error bars. All p values calculated using a Mann Whitney u test, however no statistically significant differences were observed. OS Day 14 p – 0.6878; Day 28 p – 0.1660. Relapse Day 14 p – 0.3202. Day 28 p – 0.4868. aGvHD Day 14 p – 0.7039; Day 28 p – 0.4510. NRM Day 14 p – 0.3840; Day 28 p – 0.1280 Day 14 n = 60; Day 28 n = 42.
Day 14 Day 28
Non-relapse Relapse0
20
40
60
80
100
Per
cent
age
of
CD
56di
m N
K C
ells
Alive Deceased0
20
40
60
80
100
Per
cent
age
of
CD
56di
m N
K C
ells
No aGvHD aGvHD0
20
40
60
80
100
Perc
enta
ge o
f C
D56
dim
NK
Cel
ls
No aGvHD aGvHD0
20
40
60
80
100
Non-relapse Relapse0
20
40
60
80
100
Alive Deceased0
20
40
60
80
100
No aGvHD aGvHD0
20
40
60
80
100
Perc
enta
ge o
f C
D56
dim
NK
Cel
ls
Alive NRM Alive NRM
A
B
C
D

118
Cell number in the stem cell graft does not determine cell count in the peripheral blood during the first month post allo-HSCT
A large degree of heterogeneity was observed in the cellular composition between
individual patient peripheral blood following allo-HSCT and as these cells are thought
to be largely derived directly from the donated stem cell graft I next went on to
determine if there was a correlation between the two. Total lymphocyte, T cell and
NK cell number in the stem cell graft were determined and plotted against the cell
counts of the patient at two and four weeks post-transplant (Figure 3.11). Whist there
was a slight positive correlation in all instances, none were significantly associated.
To determine whether the dose and number of CD34+ progenitor cells contributed
towards the heterogeneity of patient peripheral blood composition these values were
also compared (Figure 3.12). As engraftment and production of new cells is unlikely
to occur within two weeks comparisons were made at one month post-transplant.
Again no correlations between CD34+ cell dose or number in the stem cell graft and
lymphocyte, T cell or NK cell number in patient peripheral blood at day 28 was found.
Therefore, cellular numbers in stem cell graft do not correlate with the cell count in
the peripheral blood during the first month post allo-HSCT.

119
0 500 1000 1500 20000
20
40
60
80
Week 4 Lymphocytes per µl Blood
Gra
ft L
ymph
ocyt
es x
109 R2: 0.0343
p: 0.2403
0 200 400 6000.0
0.5
1.0
1.5
2.0
2.5
Week 4 NK cells per µl Blood
Gra
ft N
K c
ells
x10
9
R2: 0.006686p: 0.6304
0 100 200 300 4000
10
20
30
40
50
D14 T Cells per µl Blood
Gra
ft T
Cel
ls x
109
R2: 0.002386p: 0.7309
0 100 200 300 4000
2
4
6
Day 14 NK per µl Blood
Gra
ft N
K x
109
R2: 0.0343p: 0.2403
0 200 400 6000
10
20
30
40
50
Week 4 T cells per µl Blood
Gra
ft T
cel
ls x
109
R2: 0.07899p: 0.0874
A
C
E
B
D
F
0 500 1000 15000
20
40
60
80
Week 4 Lymphocytes per µl Blood
Gra
ft L
ymph
ocyt
es x
109 R2: 0.02999
p: 0.2061
Day 14 Lymphocytes per μl Blood
Figure 3.11 - No correlation is observed between the composition of the stem cell graft and the number of cells in peripheral blood within the first month post-transplant The total number of lymphocytes, T cells and NK cells in the stem cell graft received by patients was calculated and correlated against the values of those same cells in the patient peripheral blood at two and four weeks post-transplant. A: Stem cell graft lymphocyte number vs day 14 lymphocytes per µl peripheral blood. B: Stem cell graft lymphocyte number vs day 28 lymphocytes per µl peripheral blood. C: Stem cell graft lymphocyte number vs day 14 T cells per µl peripheral blood. D: Stem cell graft lymphocyte number vs day 28 T cells per µl peripheral blood. E: Stem cell graft lymphocyte number vs day 14 NK cells per µl peripheral blood. F: Stem cell graft lymphocyte number vs day 28 NK cells per µl peripheral blood. Assessed with Pearson correlation. Week 2 n = 55; Week 4 n= 42.

120
0 200 400 6000
2
4
6
8
10
Week 4 NK cells per µl Blood
CD
34+
Cel
ls x
106
/ kg
R2: 0.01431p: 0.3755
0 500 1000 1500 20000
2
4
6
8
10
Week 4 Lymphocytes per µl Blood
CD
34+
Cel
ls x
106
/ kg
R2: 0.03766p: 0.1340
0 200 400 6000
2
4
6
8
10
Week 4 T cells per µl Blood
CD
34+
Cel
ls x
106
/ kg
R2: 0.03849 p: 0.1436
0 200 400 6000
200
400
600
800
1000
Week 4 NK per µl Blood
Gra
ft C
D34
+ C
ells
x10
6 R2: 0.0054p: 0.6614
0 200 400 6000
200
400
600
800
1000
Week 4 T cells per µl Blood
Gra
ft C
D34
+ C
ells
x10
6 R2: 0.09807p: 0.0556
0 500 1000 1500 20000
200
400
600
800
1000
Week 4 Lymphocytes per µl Blood
Gra
ft C
D34
+ C
ells
x10
6 R2: 0.01931p: 0.3862
A
C
E
B
D
F
Figure 3.12 - No correlation is observed between stem cell graft CD34+ dose and peripheral blood cell count in first month post-transplant The dose of CD34+ cells in the stem cell graft received by patients was calculated and correlated against the values of lymphocytes, T cells and NK cells in the patient peripheral blood at two and four weeks post-transplant. A: Stem cell graft total CD34+ cell number vs day 28 lymphocytes per µl peripheral blood. B: Stem cell graft CD34+ cell dose per kg patient weight vs day 28 lymphocytes per µl peripheral blood. C: Stem cell graft total CD34+ cell number vs day 28 T cells per µl peripheral blood. D: Stem cell graft CD34+ cell dose per kg patient weight vs day 28 T cells per µl peripheral blood. E: Stem cell graft total CD34+ cell number vs day 28 NK cells per µl peripheral blood. F: Stem cell graft CD34+ cell dose per kg patient weight vs day 28 NK cells per µl peripheral blood. Assessed with Pearson correlation. Week 2 n = 55; Week 4 n= 42.
121
Discussion
Summary
Lymphoid reconstitution in the first month post allo-HSCT is a highly dynamic
process with considerable heterogeneity in cell distribution being observed between
different patients. NK cells dominate cell number within peripheral blood for up to
one month post-transplant whilst T cell reconstitution had a minimal contribution. No
statistically significant correlations between T cell number and patient outcomes
were found within the first month. However high numbers of NK cells at two weeks
post-transplant did show a trend towards an association with protection from disease
relapse.
T cell reconstitution
Overall T cell reconstitution within the first month was minimal. As such, inference of
the relevance of T cell reconstitution dynamics with clinical outcome is difficult due to
extremely low cell count number, technical challenges in measurement and the wide
range of distribution. Homeostatic proliferation is the dominant mechanism of T cell
expansion during this time and no difference was observed in CD4+ or CD8+ T cell
reconstitution. Very few naïve T cells were identified within the first month, indicating
that production of these cells does not occur to any significant extent within this early
time period. Indeed some studies show that it can take up to 6 months for naïve T
cells to begin to repopulate the host (Roux et al. 2000). T cell depleting medications
remain at high levels in patients in the early post-transplant period, whilst the use of
cyclosporine as a GvHD prophylaxis also suppresses T cell proliferation.

122
NK cell reconstitution
NK cell reconstitution was much quicker than T cells and showed greater
heterogeneity between patients over the first month. A trend towards higher NK cell
number in the peripheral blood of allo-HSCT patients at two weeks post-transplant
and a lower rate of disease relapse was found. Indeed, this association became
almost significant in relation to the CD56dim NK cell subset and suggests that the
cytotoxic function of these mature NK cells may play an important role during this
early period post-transplant. As the half-life of mature NK cells is between 1-2 weeks
it is likely that these cells are derived directly from the stem cell graft rather than
being generated de novo following donor stem cell engraftment. Indeed, a
comparison of patients receiving CD3/CD19 depleted stem cell grafts as opposed to
CD34+ selected grafts found that at day 14 post-transplant there were significantly
more NK cells in the peripheral blood of patients who received CD3/CD19-depleted
stem cell grafts (Eissens et al. 2010). The NK cell population in patients who
received CD34+ grafts was minimal at this time point but had recovered to similar
levels by one month. This further supports the idea that at two weeks after
transplant, expansion of NK cells from CD34+ progenitor cells has not significantly
taken effect and therefore the majority of NK cells present in the patent during this
early period have come directly from the stem cell graft.
As these day 14 NK cells associate with protection from relapse it suggests that they
are mediating a GvL response, which may be established within the first two weeks.
Bacigalupo et al. showed that patients receiving low dose cyclosporine (1mg/kg) for
20 days following transplant resulted in greater disease free survival compared to a
higher dose (5mg/kg) which lowered aGvHD incidence, but also associated with

123
higher organ toxicity and relapse (Bacigalupo et al. 1991). Serum levels of the drug
were only different between the two groups over the first 10 days post-transplant
indicating that the GvL response may be established during this early time period
and can be affected by the reconstitution of the immune environment within the first
two weeks.
In murine models homeostatic proliferation permits the persistence of adoptively
transferred NK cells for more than 6 months, which actively self-renew and retain
functionality (Sun & Lanier 2011). In humans this is less well characterised however
the establishment of long-lived NK cells following CMV infection is well known as
well as the beneficial disease relapse protection associated with CMV reactivation
following allo-HSCT (Foley et al. 2012). As such, it is possible that the NK cells
contained within the stem cell graft survive for relatively prolonged periods after
infusion into the patient.
Whilst this may account in part for the increased numbers in the CD56dim population
observed in our cohort over 4 weeks, the large increase in immature CD56bright NK
cells suggests that de novo NK cell production from the engrafted donor CD34+
stem cell pool is brisk. Given that high numbers of CD56bright NK cells at both two
and four weeks were also associated with relative protection against disease relapse
it is possible that these cells produce an indirect GvL response through the release
of cytokines and influence on the adaptive T cell response, which is likely to also be
established during this time. Additionally, similar trends were observed when looking
at the myeloid or lymphoid patients separately, suggesting that an NK cell-mediated
GvL effect may be produced in both instances. This suggestion is somewhat against
the current general consensus that NK cells are active against myeloid malignancies

124
but that lymphoid cells are relatively resistant to the effects of NK cell-mediated lysis.
Cells present at this early time period are likely to have been derived directly from
the adoptively transferred stem cell graft. However, no correlation between the
number of cells infused into patients and the number of cells in their peripheral blood
over the first month post-transplant was found. However, assessment of the cells
within the peripheral blood is not an ideal way to infer the total presence of immune
cells within an individual. Lymphocytes in the peripheral blood represent only 2% of
the total lymphocytes in the body, as the majority are located in lymphoid organs or
various tissues, and they do not proportionally represent the same subpopulations
present across the rest of the body.
ULBP06 haplotype effect
ULBP06 is a ligand for the NKG2D receptor, a powerful activatory receptor found on
both NK cells and CD8+ T cells (Bauer et al. 1999). Tumour cells often produce
NKG2D ligands and NKG2D-mediated killing of tumour cell lines has been
demonstrated in vitro (Nausch & Cerwenka 2008). Our group has previously shown
that the ULBP06 genotype within the patient has a substantial impact on patient
outcomes (Antoun et al. 2012), potentially though enhanced NKG2D-mediated killing
of tumour cells or indirect modulation of alloreactive immunity through lysis of host
APC (Zuo et al. 2017). However, in my studies patients expressing the ULBP06*02
allele had impaired two year overall survival. Furthermore, heterozygous patients
had both the highest rate of disease related and non-relapse related death which
may be due to less efficient NKG2D mediated killing of ULPB06 expressing cells. It

125
is important to note however that Antoun et al assessed 8 year post transplant
outcomes in a larger cohort of HLA-matched sibling transplants, half of which did not
receive T cell depletion or reduced intensity conditioning. Within our predominantly T
cell depleted cohort the rates of relapse and aGvHD were not affected by ULBP06
haplotype. Interestingly expression of NKG2D on CD56dim NK cells did not associate
with patient outcome at two or four weeks post-transplant suggesting that any effect
the ULBP06 haplotype may have is not mediated during the first month post-
transplant. NKG2D expression on T cells may be a more important factor as they
begin to reconstitute to normal levels between 1-2 years post-transplant.
Interestingly this is also around the time period when ULBP06 haplotype begins to
associate with differences in overall survival and non-relapse related mortality, which
may indicate a difference in the ability of patients to develop NKG2D-mediated T cell
responses against infection.
Limitations
This cohort had several limitations, most notably the number of missing values. A
potential 790 samples collected from five time points were available, however only
49% were collected either due to patient unavailability through early discharge,
illness or removal of consent. This meant tracking reconstitution in specific patients
over the course of the first month post-transplant was difficult and results were
analysed as pooled populations. In collaboration with the mathematics department a
model to predict the missing values by using random forest analysis is being
assessed. Random forest survival analysis works by combining lots of weak decision
tree models utilising part of the data to predict the rest, which collectively produces a

126
stronger overall model (Ishwaran et al. 2008). This could lead to the development of
a mathematical model of immune reconstitution during the first month post-transplant
which can be correlated with outcomes. Initial results when performed on our data
set confirm the protective effect of NK cell reconstitution at day 14 post-transplant.
This does come with a note of caution due to inputted values and the precise
methodology is still under review. Additionally, the patients consisted of a wide
mixture of disease types and underwent vastly different transplant processing.
Streamlining the cohort would reduce numbers and any statistical power. Likewise
whilst reconstitution during the first month could be assessed for all patients, further
correlations with clinical outcomes, most importantly relapse free survival and overall
survival, could not be made in all cases, limiting the cohort. Reassessment of this
cohort at a later time point may yield more significant results.
Conclusions
Overall these data highlight that assessment of the number of NK cells in the
peripheral blood over the first month post allo-HSCT may predict patient disease
relapse outcome. Most notably a higher number of NK cells at two weeks post-
transplant, thought to be derived directly from NK cells present within the donated
stem cell graft, trended towards an association with lower disease relapse and
suggests that the NK cell population collected from a HLA matched donor has the
potential to influence patient outcomes in this T cell depleted transplant setting.
Therefore, I was next interested to undertake further investigation into the cellular
components, particularly the NK cell repertoire, present within stem cell grafts and
their potential association with patient outcomes.

127
Chapter 4 – Comparison of the phenotype and function of NK cells from the stem cell graft and healthy individuals
G-CSF mobilisation and apheresis collection is the most common method of stem
cell graft donation for allo-HSCT. This process releases large numbers of
haematopoietic stem cells into the peripheral blood of the donor that are collected for
infusion in to the patient. As discussed in the previous chapter, the NK cells present
within this stem cell graft might be able to confer a protective GvL response.
However, the process of stem cell graft collection has been shown to modulate the
phenotype of lymphoid cells within the graft and I therefore went on to investigate the
functional profile of NK cells within the infusion product.
Greater understanding of the potential changes that might occur to NK cells following
this process could be relevant to understanding the mechanisms of NK cell
expansion following transplant as well as for development of potential therapeutic
methods to improve NK function in allo-HSCT. The pattern of RNA expression,
phenotypic markers and in vitro cytotoxic function of the NK cells taken from the
peripheral blood of healthy donors and stem cell graft samples was therefore
performed.

128
Results
Comparison of RNA expression identifies significant downregulation within stem cell graft NK cells
To assess whether stem cell graft and peripheral blood NK cells are ‘programmed’ to
have different functions, RNA expression using a microarray approach was initially
examined. Dr Tracey Chan had previously acquired RNA transcriptome data for NK
cells isolated from five stem cell grafts and four healthy donors. This data was
reanalysed to assess gene level differential expression analysis between the two
groups of samples. In total 1597 individual genes were found to be differentially
expressed between stem cell graft and normal peripheral blood NK cells, using
thresholds of fold change in expression of greater or less than two and an ANOVA p-
value < 0.05 (Figure 4.1A). The majority were coding genes downregulated in the
stem cell graft samples (954). Several genes that encode proteins involved in
signalling pathways were downregulated in stem cell graft NK cells such as JAK -1,
MAP3K and PI3KR. A caveat to this however is that the lowest false discovery rate
was 0.232 and therefore confidence in these individual gene findings cannot be
statistically shown. To further analyse this data a gene set enrichment analysis was
performed by Dr Wayne Croft looking at hallmark and canonical pathways
(Subramanian et al. 2005).
Published gene sets taken from the molecular signatures database (MSigDB) were
compared between the healthy individual and stem cell graft NK cells. Groups within
the hallmark gene sets, which represent well defined biological states and overall
cellular processes, and the canonical pathways gene sets, a collection of known cell
signalling pathways, were assessed. Differences in expression of a group of genes
can collectively identify changes within cellular biochemical pathways with more

129
confidence than individual genes. Only gene sets with significantly different
expression were assessed further.
Several downregulated gene sets were identified in stem cell graft NK cells including
those involved in cell signalling and natural killer cell mediated cytotoxicity (Figure
4.1B). These occurred at a false discovery rate below 0.1 and a p value of below
0.05. The IFN-g response pathway was downregulated, indicating that the functions
of both CD56dim and CD56bright NK cells were potentially diminished. Other gene sets
such as the p53, MAPK and PI3K pathways were also downregulated. Several KIR
genes (KIR2DL1; KIR2DL3; KIR2DL4: KIR2DS1; KIR2DS3; KIR2DS4; KIR3DL1;
KIR3DL2) demonstrated downregulated RNA expression within stem cell graft NK
cells. These findings suggest that there may be considerable functional impairment
of NK cells within the stem cell graft.
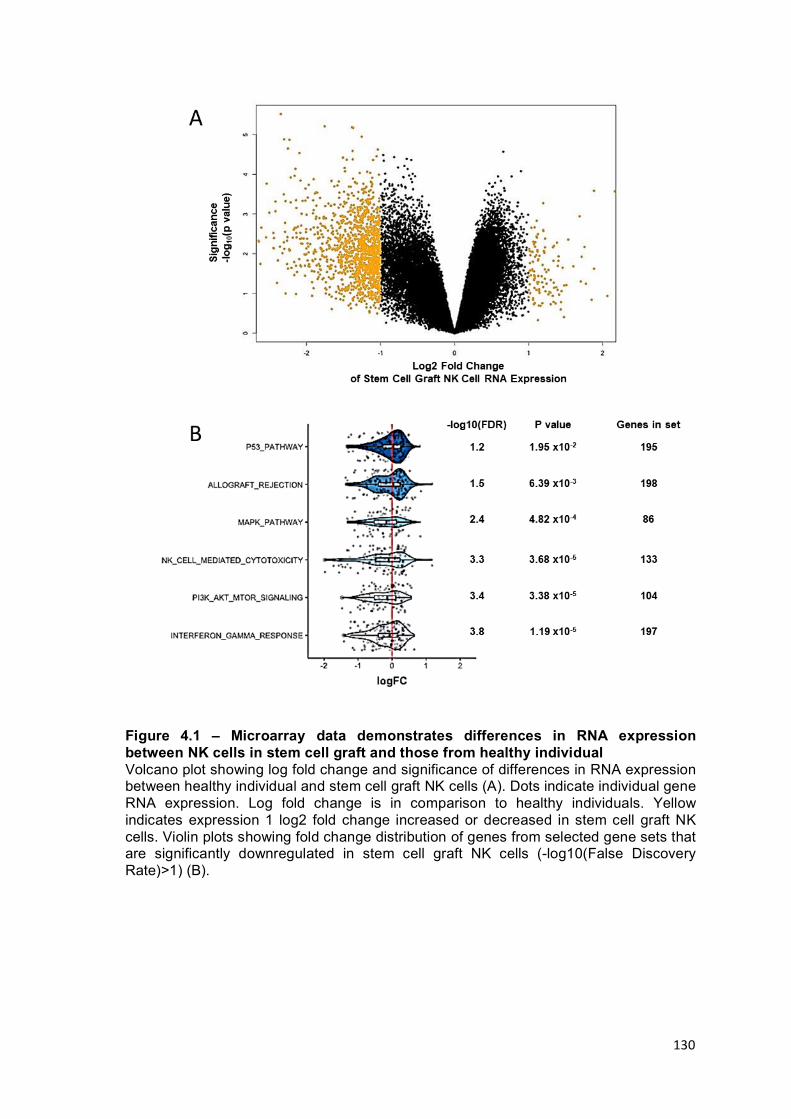
130
Figure 4.1 – Microarray data demonstrates differences in RNA expression between NK cells in stem cell graft and those from healthy individual Volcano plot showing log fold change and significance of differences in RNA expression between healthy individual and stem cell graft NK cells (A). Dots indicate individual gene RNA expression. Log fold change is in comparison to healthy individuals. Yellow indicates expression 1 log2 fold change increased or decreased in stem cell graft NK cells. Violin plots showing fold change distribution of genes from selected gene sets that are significantly downregulated in stem cell graft NK cells (-log10(False Discovery Rate)>1) (B).

131
Characterisation of the lymphocyte repertoire within haemopoietic stem cell grafts
Having established that RNA expression of many important gene sets is
downregulated within NK cells from stem cell grafts I next went on to investigate the
phenotype of NK cells from the apheresis product in comparison to healthy
individuals. Residual cells from 107 stem cell graft samples were obtained (Table
2.2). NK cells (CD56+CD3-) were detected along with T cells (CD3+CD56-) through
a gating strategy which identified a live lymphocyte population from which CD14+
monocyte and CD19+ B cells were excluded (Figure 4.2A).
A significant decrease in the proportion of both NK and T cells as a fraction of the
lymphocyte population was found in stem cell grafts compared to healthy donor
peripheral blood (Figure 4.2B). The interquartile range of the T cell population was
reduced from between 50-70% to 38-53%. A five-fold reduction was found in the NK
population, with an interquartile range of 10-20% in peripheral blood to between 2-
6% in the stem cell graft. This change in cellular proportion demonstrates
considerable differences in overall lymphocyte populations within the stem cell graft
and normal peripheral blood.

132
0 20 40 60 80
Stem Cell Product
Peripheral Blood
Percentage of Lymphocytes
NK Cells---- NK Cells ---- T Cells
Stem Cell Graft
Peripheral BloodA
B
Figure 4.2 – The percentage of T and NK cells is decreased in stem cell grafts PBMC were isolated from healthy individual peripheral blood and allo-HSCT stem cell products and immunophenotyped by flow cytometry to identify NK and T cells (A). A forward scatter plot (FS height v FS area) was used to gate on single cells and remove doublets or clumped cells. A forward scatter (FS) vs side scatter (SS) plot identified the lymphocyte population. Dead, CD14+ or CD19+ cells were excluded. NK cells were identified as CD56+CD3- whilst T cells were identified as CD56-CD3+. Phenotypic analysis found statistically decreased proportions of T and NK cells in the stem cell graft lymphocyte pool compared to healthy individual peripheral blood (B). (T cells – p: 0.0003; NK cells - p: <0.0001). P values calculated with a Mann Whitney test.

133
NK cells from the stem cell graft display decreased cytotoxic capacity
As the NK and T cell lymphoid fractions of healthy individual and stem cell graft
PBMC were different I next went on to investigate whether the G-CSF mobilisation
and apheresis processing act to modulate the phenotype of the NK cell subsets. This
was undertaken by further immunophenotyping of samples from healthy donor
peripheral blood and stem cell grafts (Figure 4.3). Antibodies specific for the
activatory receptors NKp46, NKG2D, DNAM and CD16, along with a group of KIRs,
were used to assess the expression of common signalling receptors at the cell
surface. The functional state of the NK cells was assessed by examination of CD107
and Ki-67 expression along with expression of the cytotoxic granules granzyme and
perforin. Fully mature NK cells were identified by CD57 expression whilst the
exhaustion status of the cells was assessed through PD-1 and Tim-3 expression.
Expression of the transcription factors Eomes and Tbet was also investigated to give
an indication as to the potential regulatory influences on the phenotype and
functional capacity of the NK cells. Populations of total NK cells as well as individual
CD56bright and CD56dim NK cell subpopulations could be assessed through the same
gating strategies.
The percentage of CD56bright NK cells was increased significantly within the stem cell
product in comparison to peripheral blood, almost tripling from a median of 5% to
14% (p – 0.0004) (Figure 4.4A). The reverse was seen in CD56dim cells which fell
from 95% in peripheral blood to 86% in the stem cell graft, indicating a decrease in
the CD56dim to CD56bright ratio. Changes in the profile of cell surface receptor
expression were apparent with significantly decreased presence of the activatory
receptors NKp46 (p – 0.0222), DNAM (p – <0.0001) and CD16 (p – 0.0001) on NK
cells within the stem cell grafts (Figure 4.4B). A decrease in the proportion of NK

134
cells expressing KIRs was also found (48 – 39%; p – 0.0388). The proliferative
capacity of NK cells from stem cell grafts was significantly increased, measured by
an increase in the percentage of NK cells expressing Ki-67 (1.5 – 4.5%; p -<0.0001)
(Figure 4.4C). CD107, a marker of degranulation, was also increased in stem cell
graft NK cells (6 – 15%; p – 0.0005) which correspondingly exhibited a decrease in
both granzyme B (46 – 33%; p – 0.0312) and perforin (68 – 46%; p – 0.0019) (Figure
4.4C). Significant differences were observed with markers of maturity and exhaustion
between stem cell graft and peripheral blood NK cells with a reduction of CD57 (29 –
20%; p - 0.0149), an increase in PD-1 (3.5 – 14%; p – 0.0045) (Figure 4.4D) and a
decrease in Tbet and Eomes dual expression (61 – 45%; p – 0.0496).
SCGPBMC SCGPBMCA
C
B
D
F
E
Figure 4.3 – Flow plots displaying comparison between NK cells in peripheral blood and stem cell grafts Example plots of extracellular and intracellular markers expressed on NK cells identified by immunophenotypic analysis. CD56 / CD16 (A); CD56 / DNAM (B), CD56 / KIR (C), Ki67 / CD107 (D), Granzyme / Perforin (E) and Tim-3 / PD-1 (F).

135
Figure 4.4 – Phenotypic differences between healthy individual and stem cell graft NK cells PBMC isolated from stem cell graft and healthy individual samples were immunophenotyped to compare percentage expression of markers within the NK cell population. Expression of CD56 NK cell subsets (A), activatory and inhibitory receptors (B), functional markers (C) and maturity and exhaustion markers (D) were assessed. Bar charts show median values with error bars displaying the interquartile range. Significant p values: CD56bright – 0.0004; CD56dim – 0.0004; NKp46 – 0.0222; DNAM – <0.0001; CD16 – 0.0001; KIR – 0.0388; CD107 – 0.0005; Granzyme B – 0.0312; Perforin – 0.0019; Ki-67 – <0.0001; CD57 – 0.0149; PD-1 – 0.0045; Eomes/Tbet – 0.0496. (A: PB n= 15; SCG n=107. B: PB n=15; SCG n=107. C: PB n=15; SCG n=78. D: PB n=11; SCG n=74). All p values calculated using a Mann Whitney U test.

136
Sub-analysis of CD56dim and CD56bright populations of NK cells highlighted more
specific differences. The reduced proportion of NKp46 (62 – 43%; p – 0.0174),
DNAM (89 - 81%; p – <0.0001) and CD16 (72 – 27%; p - <0.0001) expressing cells
was maintained within the CD56dim NK cell subset (Figure 4.5A). Interestingly the
significant difference in KIR expression was lost when looking at the CD56dim
population (53 -44%; p – 0.1187). Significant increases in Ki-67 (1.0 – 6.5%; p -
<0.0001) and CD107 expression (3.5 -16%; p - <0.0001), along with decreased
granzyme (65 -51%; p – 0.0028) and perforin (71 – 40%; p – <0.0001), were also
notable (Figure 4.5B). The decrease in NK cell expression of maturity and
exhaustion markers seen when the population was analysed as a whole were
exaggerated when assessed in relation to the CD56dim NK population. Lower
frequencies of CD57 (29 – 18%; p - <0.0001), Tim-3 (39 – 15%; p - 0.0002) and
Eomes and Tbet (55 – 25%; p – 0.0085) expression suggest an NK population with
fewer fully differentiated CD56dim NK cells within the stem cell graft (Figure 4.5C).
The increase in PD-1 expression (4.5 – 25%; p – <0.0001) also highlights the
potentially reduced cytotoxic ability of the CD56dim cells.
In contrast, the stem cell graft CD56bright NK population did not demonstrate as
profound a reduction in markers of cytotoxic potential (Figure 4.6). The activatory
receptors NKp46 (93 – 82%; p – <0.0001), DNAM (91 – 88%; p – 0.0474) and CD16
(21 – 9%; p – 0.0015) did show reduced expression (Figure 4.6A) although,
interestingly, the expression of granzyme was increased in the CD56bright population
(26 – 46%; p – 0.0338) (Figure 4.6B). Proliferation of CD56bright NK cells was
increased, as assessed by Ki-67 expression (3.0 – 10%; p - <0.0001), as was the
expression of CD107 (7.5 – 25%; p – 0.0005) (Figure 4.6B). The percentage of
CD56bright NK cells within the stem cell graft expressing PD-1 significantly increased

137
(6.0 – 29%; p – 0.0014) whilst Tim-3 expression was significantly reduced (30 –
20%; p – 0.0188) (Figure 4.6C).
Figure 4.5 – Phenotypic differences between CD56dim
NK cells from healthy individual and those from the stem cell graft PBMC isolated from stem cell graft and healthy individual samples were immunophenotyped to compare percentage expression of markers within the CD56dim NK cell population. Expression of activatory and inhibitory receptors (A), functional markers (B) and maturity and exhaustion markers (C) were assessed on CD56dim NK cells. Bar charts show median values with error bars displaying the interquartile range. Significant p values: NKp46 – 0.0174; DNAM – <0.0001; CD16 – <0.0001; CD107 – <0.0001; Granzyme B – 0.0028; Perforin – <0.0001; Ki-67 – <0.0001; CD57 - <0.0001; PD-1 – <0.0001; Tim-3 - 0.0002; Eomes/Tbet – 0.0085. (A: PB n=15; SCG n=107. B: PB n=15; SCG n=78. C: PB n=11; SCG n=74). All p values calculated using a Mann Whitney U test.

138
Figure 4.6 – Phenotypic differences between CD56bright
NK cells from healthy individuals and from the stem cell graft PBMC isolated from stem cell graft and healthy individual samples were immunophenotyped to compare percentage expression of markers within the CD56bright NK cell population. Expression of activatory and inhibitory receptors (A), functional markers (B) and maturity and exhaustion markers (C) was assessed on CD56bright NK cells. Bar charts show median values with error bars displaying the interquartile range. Significant p values: NKp46 – <0.0001; DNAM – 0.0474; CD16 – 0.0015; CD107 – 0.0005; Granzyme – 0.0338; Ki-67 – <0.0001; PD-1 – 0.0014; Tim-3 - 0.0188. (A: PB n=15; SCG n=107. B: PB n=15; SCG n=78. C: PB n=11; SCG n=74). All p values calculated using a Mann Whitney U test.

139
The influence of donor characteristics on the composition of the stem cell graft
As donor age and CMV status have been shown to affect the NK cell repertoire of
healthy individuals the cohort of stem cell graft samples was analysed to assess any
effect that these variables might have. Donor age varied from 21-66 years of age
and a trend towards older donors supplying higher doses of NK cells was found
(Figure 4.7A). However, there was no correlation between the percentage of
CD56dim NK cells within the NK repertoire (Figure 4.7B). No correlation was
observed between donor age and the number of cytotoxic NK cells within the graft.
Interestingly comparison between CMV seronegative and seropositive donors did
detect some differences in NK phenotype. CMV seropositive donors had a slightly
higher proportion of CD56dim NK cells in their grafts (p: 0.0304) (Figure 4.8A).
Furthermore a slightly higher proportion of stem cell graft NK cells from CMV
seropositive donors showed expression of DNAM (p - 0.0190) and KIRs (p – 0.0143)
(Figure 4.8B). No other phenotypic markers differed between CMV seropositive and
seronegative donors (Figure 4.8C; 4.8D). Despite these phenotypic differences
there was no significant difference in the total number of CD56dim NK cells within
grafts received from CMV seropositive or seronegative donors (p: 0.394).
B
0 20 40 60 8050
60
70
80
90
100
Donor Age (Years)
CD
56di
m N
K C
ell %
Donor Age v CD56dim
R2: 0.01596p: 0.2437
0 20 40 60 800
20
40
60
80
100
Donor Age (Years)
NK
Cel
ls x
106 /
kg
R2: 0.04406p: 0.0584A
Figure 4.7 – Donor age does not influence the dose of the NK cells within the stem cell graft NK cell dose and CD56
dim NK cell percentage in the stem cell graft was correlated with
donor age (A). p values calculated using an unpaired t test.

140
Figure 4.8 - Phenotypic differences between NK cells within stem cell grafts from CMV seronegative and seropositive donors Stem cell graft NK cells were immunophenotyped and divided based upon whether the donor was CMV seropositive or seronegative. Expression of CD56 on NK cell subsets (A), activatory and inhibitory receptors (B), functional markers (C) and maturity and exhaustion markers (D) were assessed. Significant p values: CD56bright – 0.0270; CD56dim – 0.0304; DNAM – 0.0190; KIR – 0.0143. (A: CMV neg n =56; CMV pos n=49. B CMV neg n =56; CMV pos n=49. C: CMV neg n =39; CMV pos n=37. D CMV neg n =39; CMV pos n=37). All p values calculated using a Mann-Whitney U test. Bar charts show median values with interquartile range.

141
G-CSF does not affect the composition of NK cells within the lymphocyte fraction nor the phenotype of unprimed peripheral blood NK cells in vitro
To determine whether G-CSF has a direct effect on NK cells an in vitro assay adding
pharmacological doses of the drug to PBMC taken from healthy individuals was next
performed. Donors receive 10μg/kg G-CSF for five days and peak serum
concentrations within individuals receiving this dose can vary between 26-85 ng/ml
(Stute et al. 1992). Therefore, to adequately replicate a physiological dose in vitro
1ng, 10ng or 100ng/ml G-CSF was applied for five consecutive days to 1 x10⁶ cells
in a 48 well plate. After five days of culture in growth media at 370C with 5% CO2 the
live T cell percentage had increased slightly (58.2 – 69.4%) and live NK cell
percentage decreased (10.6 – 8.6%) as part of the lymphocyte pool, however there
was no difference between cells exposed to G-CSF or not (Figure 4.9A; 4.9B).
Expression of the activatory receptors NKG2D, NKp46 and DNAM at the surface of
NK cells also remained consistent between cells exposed to G-CSF and those that
were not (Figure 4.9C; 4.9D; 4.9E). This data suggests that exposure to G-CSF does
not affect the composition or activatory receptor phenotype of unstimulated blood-
derived NK cells.

142
Figure 4.9 – In vitro exposure to G-CSF does not alter the phenotype of unprimed peripheral blood NK cells following culture PBMC were isolated from healthy individuals and incubated in growth media at 370C with 5% CO2. 1ng/ml, 10ng/ml or 100ng/ml doses of G-CSF were added every 24 hours over 5 days. Cell were then harvested and immunophenotyped to assess cell populations. No difference was observed in the proportion of T and NK cells (A), NK cell CD56 subsets (B) or NK cell activatory receptors NKG2D (C), NKp46 (D) and DNAM (E) following culture with or without G-CSF. Graphs show median values with interquartile ranges. (n=3).
A
BNone 1ng 10ng 100ng
0
20
40
60
80
100
G-CSF
Per
cent
age
of L
ympo
cyte
s
NK Cells
T Cells
None 1ng 10ng 100ng0
20
40
60
80
100
G-CSF
NK
Cel
l Per
cent
age
CD56dim NK cells
CD56bright NK cells
None 1ng 10ng 100ng0
20
40
60
80
100
G-CSF
NK
Cel
l Per
cent
age
DNAM+ NK Cells
None 1ng 10ng 100ng0
20
40
60
80
100
G-CSF
NK
Cel
l Per
cent
age
NKG2D+ NK Cells
None 1ng 10ng 100ng0
20
40
60
80
100
G-CSF
NK
Cel
l Per
cent
age
NKp46+ NK CellsC D
E

143
The ability of NK cells taken from the stem cell graft to kill HLA-null target cells is reduced compared to those from healthy donors
The phenotypic differences that were observed between NK cells from the stem cell
graft and those from healthy donors suggested that they may have differing
functional capacities. A reduced functional capacity of IL-2 activated stem cell graft
derived NK cells has previously been shown in a 4 hour chromium release assay
against K562 target cells at various E:T ratios (Miller et al. 1997). However, in these
assays the killing of target cells was less than 5% at the lower E:T ratios (<0.75 E:T).
Therefore, in order to achieve an increased efficiency of target cell lysis that was
sufficient to allow comparisons between individual stem cell graft samples the
incubation time with the MHC Class-I negative cell lines K562 and 721.221 was
increased to 16 hours.
Initially, and to compare with the previous literature, NK cells from four stem cell
grafts were stimulated with IL-2 and incubated with K562 cells at an 0.1 E:T ratio for
16 hours. An average of 41% killing was observed by healthy donor-derived NK cells
but only 9% killing was seen from stem cell graft-derived NK cells (p - 0.0095)
(Figure 4.10A).
NK cells were then isolated from 18 stem cell grafts, stimulated with IL-2 and
incubated for 16 hours with MHC Class-I negative 721.221 cell line target cells. NK
cells isolated from healthy donor peripheral blood were able to eliminate an average
of 35% 721.221 target cells when combined in a 1:10 effector to target ratio and
incubated for 16 hours. Under the same conditions NK cells taken from stem cell
grafts achieved a significantly reduced average lysis of 18% target 721.221 cells (p -
0.0004) (Figure 4.10B)

144
The phenotype of NK cells is related to their ability to mediate cytotoxicity of an MHC Class I negative target cell line
A large degree of heterogeneity was observed in the efficiency of lysis by IL-2
activated NK cells from stem cell grafts when tested against 721.221 target cells (1 -
31%). Having shown that these NK cells display reduced cytotoxicity compared to
NK cells from peripheral blood, the phenotypic features of NK cells, assessed prior to
IL-2 activation, were then compared in relation to cytotoxic activity (Figure 4.11).
A positive correlation was observed between the percentage of NK cells from the
stem cell graft that expressed a CD56dim phenotype and the percentage of target
cells that were killed (R2 – 0.051; p – 0.267) (Figure 4.11A). However this did not
reach statistical significance and may reflect the small number of samples in this
experiment. Non-significant positive correlations were found between the killing of
Figure 4.10 – NK cells from healthy donors and those from stem cell graft grafts exhibit differential capacity for lysis of target cells NK cells were isolated from the peripheral blood of healthy individuals and from stem cell grafts, stimulated with IL-2 and incubated overnight with K562 (A) or 721.221 (B) cells in a 0.1:1 E:T ratio. Bar charts show median values of percentage lysis with interquartile range. K562 p – 0.0095; 721.221 p - 0.0004 (K562: peripheral blood n=6; stem cell graft n=4. 721.221: peripheral blood n=6; stem cell graft n=18.). P values calculated using a Mann-Whitney U test.

145
721.221 cells and the expression of activatory receptors NKp46 (R2 – 0.118; p –
0.127) (Figure 4.11C), DNAM (R2 – 0.122; p – 0.121) (Figure 4.11E) and CD16 (R2 -
166; p – 0.074) (Figure 4.11F) on CD56dim NK cells, and significant positive
correlation with the cytotoxic proteins granzyme B (R2 – 0.211; p – 0.042) (Figure
4.11G), perforin (R2 – 0.288; p – 0.015) (Figure 4.11H) and the transcription factor
Eomes (R2 – 0.309; p – 0.014) (Figure 4.11J), but not T-bet (R2 – 0.004; p – 0.802)
(Figure 4.11I) were also observed. The proportions of CD56dim NK cells expressing
NKG2D (R2 – 0.010; p – 0.672) (Figure 4.11D) and KIR (R2 – 0.0512; p – 0.311)
(Figure 4.11B) did not correlate with target cell killing, although this was not
unexpected as 721.221 cells do not express NKG2D ligands or MHC molecules
(Lisovsky et al. 2015). This data suggests that the killing of 721.221 cells is
dependent upon NK cell cytotoxic release of granzyme and perforin, whilst activation
of that cytotoxic function in CD56dim NK cells from the stem cell graft may be due to
expression of the activatory receptor proteins NKp46, DNAM and CD16. Interestingly
an inverse correlation between the expression of PD-1 on stem cell graft NK cells
and target cell killing was also observed (R2 – 0.1852; p – 0.058) (Figure 4.11K). A
similar non-significant inverse association was observed in relation to CD107
expression (R2 – 0.1306; p – 0.117) (Figure 4.11L).
Overall this data fits the known associations between phenotype and function of NK
cells. Indeed, despite differences in the phenotype and function of NK cells from the
stem cell graft compared to those from healthy donors this correlation between
cellular phenotype and cytotoxic function is still observed.

146
0 10 20 30 40 500
20
40
60
80
100DNAM
R2: 0.1221 p: 0.1205
0 10 20 30 40 500
20
40
60
80
100
Perforin
R2: 0.2877p: 0.0148
0 10 20 30 40 500
20
40
60
80
100
KIR
R2: 0.05117p: 0.3114
0 1 0 2 0 3 0 4 0 5 00
2 0
4 0
6 0
8 0
1 0 0
P e rc e n ta g e o f T a rg e t C e lls K ille d
PD
-1+
R 2 : 0 .1 8 5 2p : 0 .0 5 8 2
0 10 20 30 40 500
20
40
60
80
100
CD56dim
R2: 0.05103p: 0.2671
0 10 20 30 40 500
20
40
60
80
100
NKp46
R2: 0.1181p: 0.1272
0 10 20 30 40 500
20
40
60
80
100
NKG2D
R2: 0.009659p: 0.6717
0 10 20 30 40 500
20
40
60
80
100
CD16
R2: 0.1665p: 0.0741
0 10 20 30 40 500
20
40
60
80
100
Granzyme
R2: 0.2109 p: 0.0417
0 10 20 30 40 500
20
40
60
80
100
Percentage of Target Cells Killed
Tbet
R2: 0.003799p: 0.8021
0 10 20 30 40 500
20
40
60
80
100
Percentage of Target Cells Killed
Eom
es
R2: 0.3085p: 0.0136
A C
E
G I
B
D F
H
J K
0 1 0 2 0 3 0 4 0 5 00
1 0
2 0
3 0
4 0
5 0
P e rc e n ta g e o f T a rg e t C e lls K ille d
CD
10
7
R 2 : 0 .1 3 0 6p : 0 .1 1 7 4
L
0 10 20 30 40 500
20
40
60
80
100
Percentage of Target Cells Killed
Eom
es
R2: 0.3085p: 0.0136
0 10 20 30 40 500
20
40
60
80
100
Percentage of Target Cells Killed
Eom
es
R2: 0.3085p: 0.0136
PD-1
CD107 R2: 0.1306
p: 0.1174R2: 0.1652p: 0.0582
Figure 4.11 - Correlation between expression of markers on CD56dim
NK cells and cytotoxic activity NK cells were isolated from the stem cell graft, stimulated with IL-2 and incubated overnight with 721.221 target cells. Phenotypic markers of cytotoxicity measured before stimulation were correlated with target cell lysis. Positive correlations were seen in most cases with significance in granzyme B, perforin and eomes expression (n=18). Pearson correlation was used to measure linear association.

147
Discussion
Summary
NK cells within the stem cell grafts that are used in allo-HSCT display a range of
phenotypic and functional differences compared to NK cells from the blood of healthy
individuals that have not undergone G-CSF mobilisation or apheresis. RNA
expression of gene sets involved in cell signalling and NK mediated cytotoxicity were
downregulated in stem cell graft NK cells. Reduced expression of activatory
receptors NKp46, DNAM and CD16 were also seen. The proportion of immature
CD56bright NK cells was increased in the stem cell graft compared to peripheral blood
and these displayed a heightened state of activation through increased CD107
expression. The mature CD56dim NK cell population also displayed increased CD107
expression in combination with a decrease of intracellular granzyme and perforin
indicating degranulation and a potentially reduced cytotoxic capacity. G-CSF
stimulation of mature NK cells isolated from healthy donors did not affect their
phenotype suggesting that the changes observed between stem cell graft and
peripheral blood-derived NK cells might potentially relate to the development of novel
NK cell phenotypes that are released into the peripheral blood during mobilisation
and apheresis. A decrease in the ability of IL-2 activated NK cells from stem cell
grafts to kill MHC class I null target cells in vitro was also seen, however there was a
large degree of heterogeneity in this functional analysis, which correlated with
cellular phenotypes.
148
Transcriptome differences
Microarray analysis detected considerable differences in the profile of gene
expression between NK cells from the stem cell graft and from healthy donors. Most
notable was the decrease in expression of genes in the ‘NK mediated cytotoxicity’
gene set indicating a likely reduced cytotoxic functional capacity of the stem cell graft
NK cell population. A decrease in expression of signalling pathway genes within NK
cells from stem cell grafts was also seen and may reflect the intracellular response to
G-CSF stimulation. Inhibition of JAK activity leads to impaired NK cell function and a
more immature phenotype (Schonberg et al. 2015). Similarly Pi3K and MAPK-ERK
pathways are involved in target cell lysis, particularly NKG2D-mediated cytotoxicity
(Jiang et al. 2000; Li et al. 2008). Downregulation of these pathways in stem cell
graft NK cells is strongly suggestive of a functionally suppressed phenotype. A
somewhat unexpected finding was down regulation of expression of the p53 gene in
NK cells from stem cell graft. The p53 pathway is involved in cell cycle suppression
and this downregulation may potentially favour a proliferative phenotype in this these
cells (Levine 1997).
It was also interesting to note that the hallmark gene set involved in ‘allograft
rejection’ was downregulated in NK cells from the stem cell graft and this is likely to
reflect their derivation from highly activated alloreactive T cells populations. Indeed,
within the context of allo-HSCT it is possible that this relatively suppressed functional
phenotype of NK cells in the stem cell graft may even have a beneficial role by
limiting the immune response against the alloreactive host. Further bioinformatic
analysis of this dataset will be of value but a major limitation to the microarray data is
the high false discovery rate for individual genes (FDR p value 0.3414). Additionally,
levels of RNA transcription do not necessarily correlate with the level of protein

149
expression and this may explain the lack of a clear correlation between the
transcriptome and cellular phenotype. Despite this, the microarray results do provide
a range of valuable insights into the transcriptional activity of the NK cells from the
stem cell graft.
Phenotypic differences
The phenotype of stem cell graft-derived NK cells was compared to those from
healthy donor PBMC. Whilst the overall number of T and NK cells in donor peripheral
blood increases with G-CSF treatment (Martínez et al. 1996) their frequency within
the ‘lymphocyte gate’ on the flow cytometer decreased. This was due primarily to an
increase in a population of CD3-CD56- cells, potentially reflecting proliferative stem
cell progenitors produced by G-CSF administration (Lane et al. 1995; Holig et al.
2009).
Both mature and immature NK cell subsets in the stem cell graft showed a
significantly increased expression of Ki-67 indicating enhanced proliferation.
However, a slightly larger proportion of the CD56bright (10%) than CD56dim (7%) NK
cells expressed this marker and this might explain their relative increase in number
in the first month. The CD56bright NK cell population also showed high levels of
CD107a expression indicating an activated functional state.
Interestingly the CD56dim NK cell population from the stem cell graft also displayed
higher extracellular CD107 expression indicating increased functional activity.
However, the percentage of many activatory receptors at the surface was
significantly lower, an observation also seen for perforin and granzyme expression
within the cells. CD107 is a marker of both cytokine secretion and cytotoxic

150
functionality in NK cells (Alter, et al. 2004). Therefore this data suggests that NK
cells from the stem cell graft have become activated and undergone degranulation.
Combined with the profile of increased PD-1 expression and reduction in expression
of the transcription factors eomes and T-bet the findings display evidence of an
‘exhausted’ NK cell phenotype (Gill et al. 2012). The phenotypic profile of a reduced
cytotoxic capacity from NK cells from the stem cell graft was proven in vitro by the
comparatively weaker killing of two MHC class I null cell lines. This reduced cytotoxic
functionality of stem cell graft NK cells has been well documented (Miller, et al. 1997;
Su et al. 2012).
Expression of Tim-3 was significantly reduced on both CD56dim and CD56bright NK
cells from the stem cell graft. Whether this receptor has an activatory or inhibitory
function on NK cells has not been totally elucidated, as in different contexts its
effects are seemingly contradictory. Tim-3+ NK cells produce IFN-y in the presence
of the soluble ligand galectin-9 ligand, but this is markedly reduced with removal of
the soluble ligand or blockade on stimulatory AML cells (Gleason et al. 2012). In
other experiments the cross-linking of Tim-3 with antibodies suppressed the killing of
P815 or 721.221 target cells induced though NKG2D and CD16 receptors (Ndhlovu
et al. 2012). This effect could, however, be overcome by culturing the NK cells in IL-2
overnight. Similarly blockade of Tim-3 was found to improve the cytotoxicity of NK
cells from melanoma patients (da Silva et al. 2014). In healthy individuals Tim-3 is
expressed on most CD56dim CD16+ NK cells but only heterogeneously on CD56bright
CD16- NK cells (Ndhlovu et al. 2012). The reduced expression seen in the stem cell
graft samples may represent the more immature NK cell population present and
contribute towards their reduced functionality.

151
Healthy donor PBMC incubated with G-CSF in vitro for five days did not demonstrate
a resultant change in frequency of NK cells within the lymphocyte population, nor a
change in their phenotype. Similar findings have previously been reported (Miller, et
al. 1997). However, phenotypic and functional NK cell changes induced by IL-2 and
IL-15 can be suppressed with the addition of G-CSF in vitro suggesting that an
indirect effect on mature NK cells can be achieved (Schlahsa et al. 2011). The
receptor for G-CSF is CD144 which is expressed on many cells within the bone
marrow, but not on mature lymphocytes, indicating why direct exposure to G-CSF
does not cause an alteration in NK cell phenotype and function. Interestingly, NK
cells taken from G-CSF-treated donors display high GCSF receptor expression
whereas in vitro treated cells do not (Schlahsa et al. 2011). Therefore changes to the
immune environment and cytokine signalling caused by G-CSF mobilisation in vivo
may result in a direct effect on mature NK cell phenotype and functionality.
It cannot be ruled out that the physical process of aphaeresis induces apoptosis and
death in mature CD56dim NK cells and an altered, activated phenotype in immature
CD56bright NK cells within the final stem cell product. Indeed Miller et al. found that
NK cells taken from the peripheral blood of G-CSF mobilised individuals displayed
better cytotoxicity against K562 cells compared to NK cells from the apheresed stem
cell graft, indicating that this process does alter the NK cell population in some way
(Miller et al. 1997). Analysis of the apheresis waste product, along with donor
peripheral blood pre and post aphaeresis, may be needed to address this question.
Annexin-V / 7AAD staining could be used to more accurately describe the apoptotic
cells.

152
Cytotoxic differences
The CD56dim NK cell population from the stem cell graft displayed high CD107a
expression whilst the percentage of activatory receptors at the surface was
significantly lower compared to healthy PBMC-derived NK cells. Along with reduced
perforin and granzyme expression this data provides an explanation as to why stem
cell graft-derived NK cells exhibited a decreased cytotoxic capacity against target
cell lines. These NK cells do retain partial cytotoxic activity which correlated with
various phenotypic markers suggesting that they may have a variable ability to
influence GvL tumour killing in vivo following allo-HSCT.
As the cytotoxicity assay used an excess of target cells the serial killing by each NK
cell could be estimated. An average of 3-4 target cells were killed by each IL-2
activated healthy individual peripheral blood NK cell within a 16 hour incubation,
however only 1-2 target cells were killed by each IL-2 activated NK cell from the
stem cell graft. This supports the work of Bhat et al who used a 16 hour chromium
release assay to show a similar result for healthy NK cells against 721.221 target cell
(Bhat et al. 2007). With the use of cell labelling and microscopy visualization they
also showed that not all NK cells within this context made multiple target cell
contacts, but that some were hyperactive and could kill up to 6 target cells (Bhat et
al. 2007). It was also observed that NK cell contact with a target cell would usually
result in lysis. Therefore, it would be interesting to assess whether the decrease in
stem cell graft NK cell cytotoxicity is due to an inability to make target cell contacts or
whether the contacts are made but lysis is not achieved.
Phenotypic markers on NK cells correlated with their ability to mediate target cell
cytotoxic. Interestingly, expression of PD-1 on stem cell graft-derived NK cells was

153
upregulated compared to those from the blood of healthy donors. Presumably a
consequence of the G-CSF mobilization and apheresis processing, this upregulation
correlated with impaired killing of 721.221 target cells. PD-1 upregulation is also
used by many tumours as an immune evasion mechanism (Benson et al. 2010).
Therefore PD-1 blockade is being tested in several circumstances as an
immunotherapeutic way to restore anti-tumour activity (Ansell et al. 2015; Bryan &
Gordon 2015). To discover if PD-1 blockade of IL-2 activated NK cells from the stem
cell graft could potentially be used to restore NK cell cytotoxicity, three high PD-1-
expressing NK cell samples from stem cell grafts were assessed for lytic activity in
the presence or absence of PD-1 blockade. NK cells were incubated with excess
PD-1 antibody for 30 minutes prior to incubation with 721.221 target cells which
express PD-1 ligands. In each case, PD-1 blockade resulted in increased cytotoxicity
against the target cell line (Figure 4.12). This indicates that NK cell cytotoxicity can
be partially restored by blockade of inhibitory receptors and could be an important
way to increase stem cell graft NK cell activity.
Conclusions
The process of G-CSF mobilization and apheresis processing is associated with
significant alterations in the phenotype and function of NK cells in a stem cell graft,
albeit with a large degree of heterogeneity between donors. Understanding the
mechanisms behind this effect, their importance for clinical outcome, and potential
mechanisms to overcome them, could be of considerable value in improving the
outcome for patients

154
Figure 4.12 - PD-1 blockade of PD-1+ NK cells taken from the stem cell graft improves killing of 721.221 cells NK cells isolated from three stem cell graft samples with high PD-1 expression were stimulated with IL-2 and then incubated with 721.221 target cells at a 0.1 E:T ratio for 16 hours. The percentage of 721.221 target cell lysis was measured (SCG-NK). The assay was also performed with NK cells from the same stem cell graft samples but with PD-1 antibody added 30 minutes prior to incubation with target cells to block the PD-1 receptor (PD-1 Blockade). The percentage of 721.221 target cell lysis was also measured to compare the NK cell cytotoxic function between the two assay conditions. N=3. One tailed Wilcoxon t test: p - 0.1667.
S C G N K P D -1 B lo c k a d e0
1 0
2 0
3 0
4 0
5 0
Pe
rce
nta
ge
of
72
1.2
21
Cel
ls K
illed
155
Chapter 5 – The influence of the composition of the stem cell graft on clinical outcome following allo-HSCT
The composition of the stem cell graft products that are acquired following G-CSF
mobilisation and apheresis can display considerable heterogeneity between donors.
Importantly, an adequate minimum dose of CD34+ haematopoietic stem cells is
necessary to ensure establishment of donor haemopoiesis although too high a dose
has also been associated with the development of GvHD. The CD34+ cell dose is
therefore measured and typically a value of 4-8 x10⁶ cell/kg is required prior to
infusion. However, numbers of lymphoid subsets in the stem cell graft are not
measured and can vary substantially between donors.
The impact that differences in graft composition can have on clinical outcomes has
been investigated previously although with varying conclusions in different studies.
The number of T cells, B cells, dendritic cells, NK cells, Tregs and iNKT cells have all
been associated with relative risk of acute GvHD although these reports have been
undertaken in different transplant settings and highlight the difficulty of making
definitive conclusions (Impola et al. 2016; Chaidos et al. 2012; Malard et al. 2016).
As the GvL effect is mediated by donor lymphocytes, and is believed to be
established very early post-transplant, it is likely that the NK cell and T cell
populations within the stem cell graft may be important determinants of the risk of
disease relapse. Indeed, in a T cell-replete transplant setting a high dose of CD8+ T
cells in the stem cell graft has been associated with lower relapse risk (Reshef et al,
2015). In a T cell-depleted setting it is likely that this effect may be nullified although
it may also be the case that any potential association with the NK cell dose may be
relatively enhanced.
156
Therefore, I next went on to assess the impact of the composition of the stem cell
graft on patient outcomes within a cohort of reduced intensity conditioned and T cell
depleted allo-HSCT patients performed at our institution.
Results
Assessment of cellular heterogeneity within the stem cell graft
A cohort of 107 consecutive patients undergoing T cell depleted allogeneic stem cell
transplant as a treatment for a haematological malignancy was selected (Table 2.3).
The stem cell graft composition received by each patient was examined by collecting
the apheresis bag immediately after infusion. The bag was washed with MACS
buffer and residual cells were collected for immunophenotyping using flow cytometry.
A mononuclear cell and CD34+ cell count was performed as part of the clinical
measurements of the graft before transplantation by NHSBT.
Viable lymphocytes were measured based upon their size and granularity in a flow
plot and were then taken as a fraction of the mononuclear cell count to calculate the
absolute number of lymphocytes. NK and T cells were identified by a CD56+CD3-
and CD56-CD3+ phenotype respectively from the ‘lymphocyte gate’ in which non-
viable cells, B cells and monocytes had been removed (Figure 5.1A). These values
were then used together with the total cell count to determine absolute numbers of
NK and T cells. These values were then divided by the patient weight to determine a
‘cell dose’ per kg for each patient. Within this cohort the number of T cells varied
from 0.04 to 458 million cells/kg (median 87.41; SD 84.07) whereas the comparable
range for NK cells was from 0.03 to 99 million cells/kg with a median of 6.3 million

157
cells/kg (SD 13.57) (Figure 5.1B). Local clinical protocols aim to attain a CD34+ dose
of between 4-8 x10⁶ cells/kg.
A
B
Figure 5.1 – The number of T cells and NK cells delivered within the stem cell product differs greatly between patients Flow plots displaying how T (CD3+CD56-) and NK (CD3-CD56+) cells were identified through sequential gating (A). Box and whisker graph displaying dose range of T (range 0.04 – 458 x10
6/kg; median 87.4 x10
6/kg), NK (range 0.03 – 99 x10
6/kg; median 6.3
x106/kg) and CD34+ (range 1.25 -8.0 x10
6/kg; median 4.7 x10
6/kg) cells in the stem cell
product received by patients in the cohort (B).

158
Assessment with patient outcomes
The overall survival at two years post-transplant within the cohort was 64%, the
relapse incidence within one year post-transplant was 27%, the incidence of aGvHD
grade 2+ by day 100 post-transplant was 18% and non-relapse mortality at two
years post-transplant was 23% (Table 5.1). The number of leucocytes infused within
the stem cell graft was then examined to determine whether this was related to
subsequent clinical outcome. The median doses of CD34+ cells, lymphocytes, T cells
and NK cells within the stem cell graft were 4.7, 186, 87 and 6.3 x 10⁶/kg
respectively. Patients were divided into two groups based on receipt of a donor stem
cell graft infusion containing values above or below the median cell dose for each of
the four cell types. These groups were then assessed against the incidence of
disease relapse or acute GvHD, non-relapse mortality and overall survival to
determine whether they may impact upon these outcomes (Figure 5.2).

159
Table 5.1 – Clinical outcomes within the study cohort Overall number and percentages of patients with each clinical outcome were assessed, with and without competing risks. Overall survival was measured as patients who were alive or deceased at 2 years post-transplant. Relapse incidence was measured within the first year post-transplant. Acute GvHD incidence grade 2+ was measured within the first 100 days post-transplant. Non-relapse mortality was measured within 2 years post-transplant.

160
Patients who receive high numbers of NK cells within the donor graft have a substantial reduction in the rate of disease relapse
A striking positive association was apparent between the number of NK cells infused
and protection from disease relapse (p<0.001) (Figure 5.2A). Specifically, the
relapse rate amongst patients who received an infusion of NK cells above the
median dose of 6.3 x10⁶/kg was only 6% at two years post-transplant compared to
40% in those who received an NK cell infusion below this value. As such, infusion of
the higher number of NK cells was associated with a 6.7 fold decrease in the rate of
disease relapse. Receiver operating characteristic curve analysis did not find an
improved threshold than the median NK cell dose to distinguish relapse incidence
(Figure 5.3).
Patients who received an NK cell dose above the median level had an overall
survival at two years post-transplant days of 70% compared to 58% for those in
whom the graft composition was below the median. This difference, however, did not
reach statistical significance (p: 0.161). Interestingly, no statistically significant
differences were observed in the risk of acute graft versus host disease or non-
relapse mortality in association with the NK cell dose in the stem cell graft.
In addition, no associations were observed between high or low doses of infused
CD34+ cells, lymphocytes or T cells and any of the clinical outcomes (Figure 5.2B; C;
D).

161
Figure 5.2 – The dose of NK cells in the stem cell product is protective against disease relapse Relationship between the dose of four different cell subsets administered within the stem cell infusion and clinical outcome. The median number of CD34+ cells, lymphocytes, T cells and NK cells was defined and transplants were divided into those where the infusion contained a cell dose either above (black) or below (red) this median value. Clinical outcome measures were incidence of relapse (A), aGvHD (B), non-relapse mortality (C) and overall survival (D). This demonstrates that NK cell dose influences disease relapse (p. <0.0001). Cumulative incidence analysis was tested using the Gray method. Log-Rank tests were used to analyse Kaplan-Meier survival curves.
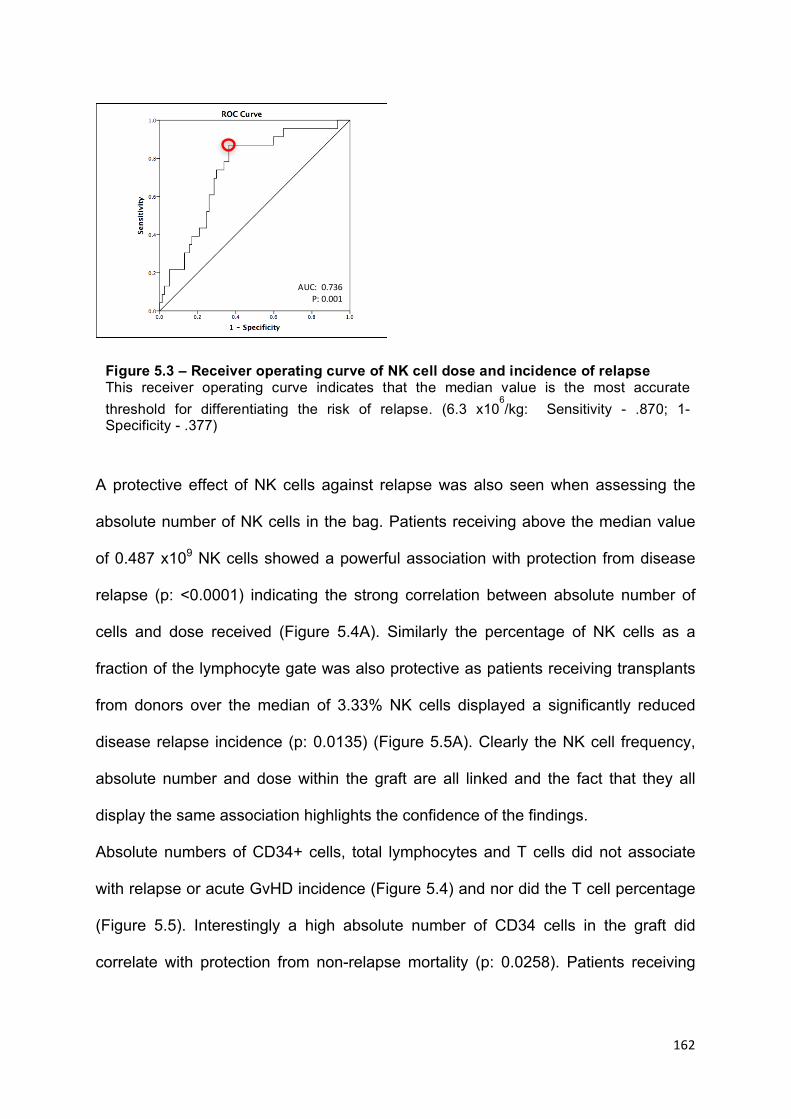
162
AUC:0.736P:0.001
A protective effect of NK cells against relapse was also seen when assessing the
absolute number of NK cells in the bag. Patients receiving above the median value
of 0.487 x10⁹ NK cells showed a powerful association with protection from disease
relapse (p: <0.0001) indicating the strong correlation between absolute number of
cells and dose received (Figure 5.4A). Similarly the percentage of NK cells as a
fraction of the lymphocyte gate was also protective as patients receiving transplants
from donors over the median of 3.33% NK cells displayed a significantly reduced
disease relapse incidence (p: 0.0135) (Figure 5.5A). Clearly the NK cell frequency,
absolute number and dose within the graft are all linked and the fact that they all
display the same association highlights the confidence of the findings.
Absolute numbers of CD34+ cells, total lymphocytes and T cells did not associate
with relapse or acute GvHD incidence (Figure 5.4) and nor did the T cell percentage
(Figure 5.5). Interestingly a high absolute number of CD34 cells in the graft did
correlate with protection from non-relapse mortality (p: 0.0258). Patients receiving
Figure 5.3 – Receiver operating curve of NK cell dose and incidence of relapse This receiver operating curve indicates that the median value is the most accurate threshold for differentiating the risk of relapse. (6.3 x10
6/kg: Sensitivity - .870; 1-
Specificity - .377)

163
Figure 5.4 – The absolute number of NK cells in the stem cell product is protective against disease relapse Relationship between the absolute number of four different cell subsets administered within the stem cell infusion and clinical outcome. The median number of CD34+ cells, lymphocytes, T cells and NK cells was defined and transplants were divided into those where the infusion contained either above (black) or below (red) this median value. Clinical outcome measures were incidence of relapse (A), aGvHD (B), non-relapse mortality (C) and overall survival (D). This demonstrates that total NK cell number influences disease relapse (p. <0.0001). Cumulative incidence analysis was tested using the Gray method. Log-Rank tests were used to analyse Kaplan-Meier survival curves.
lower than 0.39 x10⁹ CD34+ cells had a 38% NRM incidence which was more than
double that found in patients receiving a higher number of cells (Figure 5.4C).
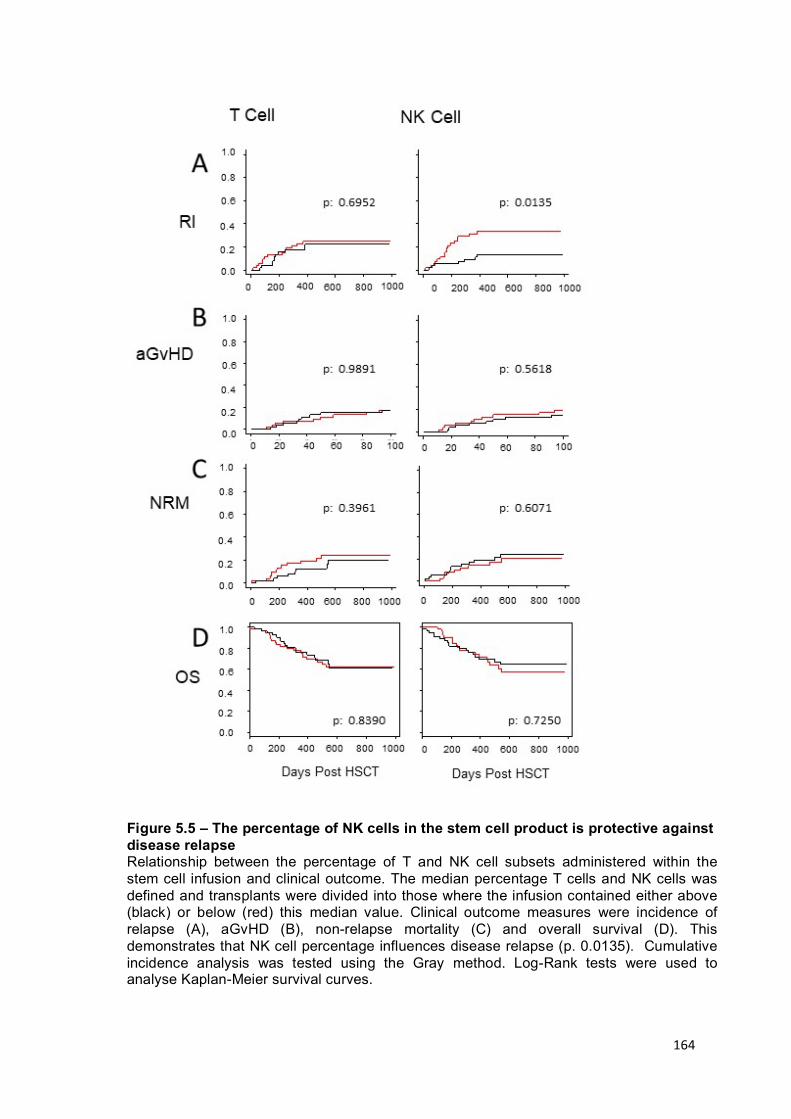
164
Figure 5.5 – The percentage of NK cells in the stem cell product is protective against disease relapse Relationship between the percentage of T and NK cell subsets administered within the stem cell infusion and clinical outcome. The median percentage T cells and NK cells was defined and transplants were divided into those where the infusion contained either above (black) or below (red) this median value. Clinical outcome measures were incidence of relapse (A), aGvHD (B), non-relapse mortality (C) and overall survival (D). This demonstrates that NK cell percentage influences disease relapse (p. 0.0135). Cumulative incidence analysis was tested using the Gray method. Log-Rank tests were used to analyse Kaplan-Meier survival curves.

165
Multivariate analysis confirms that infusion of a stem cell graft with an NK cell dose that is above the median value is a determinant of the risk of relapse
In addition to NK cell dose within the stem cell graft, several additional patient
characteristics were found to be associated with the risk of disease relapse at a
statistical significance of <0.2 on univariate analysis (Table 5.2). These included
patient age, donor type, type of T cell depletion, patient haemopoietic stem cell
transplant comorbidity index (HCT-CI) and total lymphocyte dose. The predictive
power of NK cell dose was assessed within multivariate models that included these
parameters (Table 5.3). Clinical outcomes with competing risks were assessed with
a Fine and Gray model while overall survival was assessed by a Cox proportional
hazards model.
Unrelated donor transplantation, low HCT-CI, the nature of T cell depletion and high
NK cell dose all remained as independent predictors of protection against disease
relapse following multivariate analysis. Importantly, the relative risk of relapse in
patients who received an NK cell infusion greater than 6.3 x 10⁶/kg compared to
those who received less than 6.3 x 10⁶/kg was 0.097, representing a 90% reduction
in relapse risk.
Several variables were associated with risk of developing acute GvHD of grade 2 or
greater but only HLA mismatch and full intensity conditioning remained significant
upon multivariate analysis. HLA mismatch was also the only independent predictor of
non-relapse mortality. Finally, HLA mismatch between patient and donor, HCT-CI,
type of T-cell depletion and NK dose were also found to be significant in univariate
analysis of predictors for OS but only HLA mismatch and HCT-CI remained as
independent predictive risk factors following multivariate analysis.

166
RI aGvHD NRM OS Age <56 30.4 19.6 14.3 66.1
>56 13.7 13.7 25.5 62.7 p. 0.0445 0.4393 0.1431 0.612
Disease Lymphoid 27.0 14.3 22.2 58.7 Myeloid 18.4 23.7 15.8 68.4 p. 0.5602 0.2162 0.2555 0.716
Gender Other 22.4 14.1 17.6 65.9 Female to Male 22.7 27.3 27.3 59.1 p. 0.8915 0.1270 0.2814 0.488
CMV at risk Not at risk 24.2 13.6 16.7 62.1 At risk 19.5 22.0 22.0 68.3 p. 0.5283 0.2805 0.7222 0.865
Conditioning RIC 21.5 12.9 17.2 64.5 Full 28.6 42.9 28.6 64.3 p. 0.4657 0.0081 0.4291 0.503
Mismatch No 21.6 13.4 16.5 68.0 Yes 30.0 50.0 50.0 30.0 p. 0.4531 0.0019 0.0105 0.0561
Donor Type MUD 18.8 20.0 21.3 65.0 Sibling 33.3 7.4 14.8 63.0 p. 0.1818 0.1428 0.4636 0.91
T Cell Depletion
ATG 32.1 0.0 17.9 50 Alemtuzumab 19.0 22.8 19.0 69.6 p. 0.1816 0.0061 0.5245 0.0942
HCT-CI Low 15.0 18.8 16.3 71.2 High 44.4 11.1 25.9 44.4 p. 0.0013 0.3293 0.3459 0.0039
CD34 Dose <median 17.8 22.2 24.4 62.2 >median 20.0 17.8 17.8 68.9 p. 0.7240 0.0754 0.5779 0.746
Lymphocyte Dose
<median 29.4 21.6 17.6 60.8 >median 15.7 11.8 23.5 66.7 p. 0.0984 0.1835 0.4582 0.415
T Cell Dose <median 28.0 22.0 22.0 60.0 >median 18.0 12.0 18.0 68.0 p. 0.2535 0.1753 0.7227 0.419
NK Dose <median 40.0 18.0 14.0 58.0 >median 6.0 16.0 26.0 70.0 p. <0.0001 0.7604 0.2148 0.161
Table 5.2 – Univariate analysis of patient characteristics and cell doses Variables known to have a potential influence on transplant outcomes were assessed via univariate analysis. Variables with a p value <0.2 (in bold) were included in subsequent multivariate analysis.

167
p value Hazard Ratio
CI (2.5%)
CI (97.5%)
RI
> 56 Years Old 0.069 0.477 0.22 1.06 Alemtuzumab T cell Depletion 0.018 0.424 0.21 0.87 Sibling Transplant <0.001 4.588 1.99 10.60 High HCT-CI <0.001 4.097 1.82 9.24 Lymphocyte Dose > Median 0.730 1.148 0.52 2.55 NK Dose > Median <0.001 0.097 0.03 0.33
aGvHD
Female to Male Transplant 0.320 2.049 0.49 8.52 Mismatched Unrelated Donor (9/10) 0.030 7.988 1.23 51.96 Sibling Transplant 0.720 0.649 0.06 7.02 Full Intensity Conditioning 0.006 11.414 2.01 64.73 CD34 Dose > Median 0.130 0.341 0.08 1.39 Lymphocyte Dose > Median 0.860 1.176 0.19 7.21 T Cell Dose > Median 0.820 1.207 0.23 6.30
NRM
> 56 Years Old 0.360 1.530 0.61 3.84 Mismatched Unrelated Donor (9/10) 0.014 2.970 1.24 7.10
OS
Mismatched Unrelated Donor (9/10) 0.012 3.449 1.32 9.02 Alemtuzumab T cell Depletion 0.127 0.560 0.27 1.18 High HCT-CI 0.008 2.525 1.27 5.03 NK Dose > Median 0.102 0.547 0.27 1.13
Table 5.3 – NK cell dose remains an independent predictor of relapse incidence in a multivariate analysis. Multivariate analysis. Patient characteristics or stem cell product cell dose with a univariate p value <0.2 association with a clinical outcome were included to assess independent predictors in a regression model. Fine and Gray regression method was used for RI, aGvHD and NRM to take competing risk into account. Cox proportional hazard regression analysis was used to identify independent associations with overall survival.
168
The number of CD56dim NK cells within the stem cell graft is the predominant determinant of the risk of disease relapse
To investigate the mechanisms underlying the association between infusion of a high
NK cell dose and relative protection from disease relapse it was determined whether
a specific NK cell subset was associated with this effect. The mean NK cell dose that
had been given in the stem cell graft in patients who went on to suffer disease
relapse was 4.9 x 10⁶/kg compared to an average of 11.5 x 10⁶/kg in patients who
did not relapse following allo-HSCT (Figure 5.6A). This was mirrored by the lower
average total NK cell number (0.39 x 10⁹) and frequency of NK cells (3.2% of all
lymphocytes) received in the stem cell graft by patients who relapsed compared to
those who did not (0.91 x10⁹ and 5.7% of all lymphocytes respectively).
The expression level of CD56 is used to divide NK cells into immature CD56bright and
mature effector CD56dim NK cells. Having previously found an increased ratio of
CD56bright : CD56dim NK cells within stem cell products the numbers of these cells
within the stem cell infusion was assessed in relation to relapse risk. The risk of
disease relapse was not influenced by infusion of doses of CD56bright NK cells above
or below the median value (Figure 5.6B). Importantly however, the relapse incidence
at two years post-transplant for patients who received at least the median dose of
5.7 x 10⁶/kg CD56dim NK cells was only 8.3% compared to 43% in those who
received a dose below this value (p<0.0001) (Figure 5.6B). In relation to average
values, patients who went on to relapse had received lower doses of both CD56bright
(0.65 x 10⁶/kg) and CD56dim cells (4.3 x 10⁶/kg) compared to those who did not
relapse (1.2 x 10⁶/kg (p: 0.0241) and 10.4 x 10⁶/kg (p: 0.0004) respectively) (Figure
5.6C). These observations indicate that the number of mature cytotoxic effector

169
CD56dim NK cells infused within the stem cell graft is a powerful determinant of the
strength of the graft versus leukaemia effect following allogeneic transplantation.
Figure 5.6 –CD56dim
NK cells within the stem cell product are the major contributing factor to the association with disease relapse risk. Relationship between the number of CD56
bright and CD56
dim NK cells administered within the
stem cell infusion and relapse incidence. The cohort was split into patients who relapsed or not within two years post transplant to assess absolute number (n=100), dose (n=100) and percentage (n=107) of total NK cells within the stem cell product (A). The median dose of both subsets was defined and transplants were divided into those where the infusion contained a cell dose either above (black) or below (red) this median value (B). The dose of CD56
bright and
CD56dim
NK cells received by patients who relapsed or not within two years post transplant was also assessed (n=100) (C). All NK cell groups proved to be significantly reduced in relapse patients. p values calculated using a mann-whitney u test. Cumulative incidence analysis was tested using the Gray method.

170
The influence of the NK cell dose on clinical outcome in patients with myeloid or lymphoid disease
Several studies have shown that donor NK cells appear to have a protective
influence on relapse for patients with myeloid malignancy following allo-HSCT,
however this has been difficult to also demonstrate in patients with lymphoid
malignancy (Giebel et al. 2003; Cooley et al. 2010; Ruggeri et al. 2015).
Therefore, I next went on to assess the effect of NK cell dose on the clinical outcome
of different disease subtypes. Patients were divided into those who received an allo-
HSCT for a myeloid or lymphoid malignancy and comparisons were made on the
importance of NK cell dose with patient outcomes in both settings (Figure 5.7).
Interestingly, in both cases patients receiving a high dose of NK cells in the stem cell
graft had a lower incidence of disease relapse (Figure 5.7A; 5.7B).
No significant differences were seen in the incidence of acute GvHD or non-relapse
mortality incidence with high or low NK cell dose with either myeloid or lymphoid
malignancies. Similarly no significant effect on overall survival was found although a
trend towards greater protection in association with higher dose of NK cells was
clear for patients with both types of disease. Together these findings suggest that the
NK cells within the stem cell graft have an important influence on clinical outcome of
many disease subtypes in allo-HSCT.

171
Figure 5.7 – NK cell dose effect in myeloid and lymphoid allo-HSCT patients Patients were split based upon whether they were receiving allo-HSCT for a myeloid or a lymphoid malignancy to determine whether the effect of NK cell dose was different in each case. The median number of NK cells was defined and transplants were divided into those where the infusion contained either above (black) or below (red) this median value. Clinical outcome measures were incidence of relapse (A/B), aGvHD (C/D), non-relapse mortality (E/F) and overall survival (G/H). The protective effect of a high NK cell dose was seen in both myeloid and lymphoid disease. Cumulative incidence analysis was tested using the Gray method. Log-Rank tests were used to analyse Kaplan-Meier survival curves.
0 200 400 600 800 1000
0.0
0.2
0.4
0.6
0.8
1.0
Days Post allo-HSCT
Probability
0 20 40 60 80 100
0.0
0.2
0.4
0.6
0.8
1.0
Years
Probability
0 11 10 21 2
0 200 400 600 800 1000
0.0
0.2
0.4
0.6
0.8
1.0
Years
Probability
0 11 10 21 2
0 200 400 600 800 1000
0.0
0.2
0.4
0.6
0.8
1.0
Years
Probability
0 11 10 21 2
0 200 400 600 800 1000
0.0
0.2
0.4
0.6
0.8
1.0
Years
Probability
0 11 10 21 2
0 20 40 60 80 100
0.0
0.2
0.4
0.6
0.8
1.0
Years
Probability
0 11 10 21 2
0 200 400 600 800 1000
0.0
0.2
0.4
0.6
0.8
1.0
Years
Probability
0 11 10 21 2
800400 6000 1000200
0 200 400 600 800 1000
0.0
0.2
0.4
0.6
0.8
1.0
Days Post all-HSCT
Probability
Myeloid
p - 0.0015
p - 0.4986
p - 0.5097
p - 0.137
Lymphoid
p - 0.0124
p - 0.4026
p - 0.4643
p - 0.378
A
C
E
G
RI
Prob
abilit
y
Days Post HSCT Days Post HSCT
Days Post HSCT Days Post HSCT
Days Post HSCT Days Post HSCT
Days Post HSCT Days Post HSCT
B
D
F
H
aGvH
DPr
obab
ility
NR
M
Prob
abilit
yO
S Pr
obab
ility
0.2
0.4
0.6
0.0
0.8
1.0
800400 6000 1000200
8040 600 10020
800400 6000 1000200
0.2
0.4
0.6
0.0
0.8
1.0
0.2
0.4
0.6
0.0
0.8
1.0
8040 600 10020
0.2
0.4
0.6
0.0
0.8
1.0
800400 6000 1000200
800400 6000 1000200 800400 6000 1000200
0.2
0.4
0.6
0.0
0.8
1.0
0.2
0.4
0.6
0.0
0.8
1.0
0.2
0.4
0.6
0.0
0.8
1.0
0.2
0.4
0.6
0.0
0.8
1.0

172
Validation in a secondary cohort trends towards an association between high NK dose in the stem cell graft and protection from relapse
In order to provide further validation of these findings I next went on to assess the
influence of NK cell dose within the stem cell graft on disease relapse in a second
cohort of 30 patients (Table 2.4). However, only five patients relapsed in this study
(17%) and this number is too low to draw statistically significant findings from the
data. Despite this, a trend towards a correlation between the NK cell dose and
protection from relapse was observed as four out of the five patients who went on to
relapse received less than the 6.3x10⁶ NK cells/kg threshold that was established in
the previous cohort (Figure 5.8A). At two years post-transplant the probability of
relapse when receiving an NK cell dose below the median level was 35% compared
to only 5% in patients receiving greater than the median dose (Figure 5.8B). This
compares well with the comparable values of 40% to 6% seen in the initial cohort.
Figure 5.8 – A trend towards a protective effect of a high NK cell dose in the stem cell graft and protection from disease relapse is observed in a second patient cohort The number of NK cells within the stem cell graft was assessed in a further 30 patients and correlated with the incidence of disease relapse. A trend was observed towards a protective effect of a high NK cell dose and protection from disease relapse (A). p value calculated using a Mann-Whitney t test. Patients were divided into those where the infusion contained either above (black) or below (red) the previously measured threshold of 6.3x10
6 NK cell per
kg and compared against instance of relapse (B). Analysis was tested using the Gray method.

173
Discussion
Summary
My work has uncovered a strong association between the infusion of high numbers
of donor NK cells within the stem cell graft and relative protection from disease
relapse. This was shown both in univariate and multivariate models and the effector
CD56dim NK cell population was found to be the phenotype most highly associated
with this effect. Patients with both myeloid and lymphoid disease benefitted from this
protective effect and a smaller second cohort of patients also showed the same
trend.
Impact of NK cell dose on the strength of the GvL effect post-transplant
These findings indicate that the number of NK cells infused at the time of transplant
is a strong determinant of the potency of the graft versus leukaemia effect of
allogeneic transplantation. Healthy individual NK cells have a half-life of around two
weeks although they will undergo homeostatic proliferation following transfer into a
lymphodepleted host and this may further extend their lifespan (Prlic et al. 2003;
Ullah et al. 2016). As such, relatively modest differences in the number of NK cells
within the initial infusion might translate into relatively profound differences in tumour
cell lysis within the first few weeks following transplantation.
The mechanisms that might underlie this association are unclear at the current time.
The most straightforward explanation is that donor NK cells have a direct lytic activity
against residual tumour cells within the patient (Ruggeri et al. 2002; Porgador et al.
1997). NK cells demonstrate a range of cytotoxic and immunomodulatory functions
however our data showed the critical importance of the CD56dim NK cell subset

174
suggesting that the cytotoxic activity of NK cells is a predominant factor in providing
protection against relapse. NK cells have potent activity against transformed cells
and purified NK cell infusions have been shown to demonstrate anti-tumour efficacy.
High NK cell dose would result in a more beneficial effector to target cell ratio
potentially resulting in greater killing of residual tumour cells. Alternatively, NK cells
might exert an indirect effect on the priming, expansion or activity of the alloreactive
T cell immune response that develops in the early post-transplant period. As such,
larger number of NK cells might act to boost T cell activation, perhaps through
mechanisms such as stimulation of host dendritic cells or suppression of inhibitory
cell subsets (Vivier et al. 2008; Olson et al. 2010). This may be the more likely
situation as previous data showing the beneficial effect of NK cell reconstitution and
alloreactivity has been primarily in myeloid malignancies rather than lymphoid
(Savani et al 2007; Velardi 2008). This is thought to be due to the enhanced NK cell
resistance of lymphoid cells indicating that a direct GvL response in these cases may
not occur (Romanski et al. 2005). However, I did not see a difference in the effect of
the stem cell graft NK cell dose on the relapse incidence of myeloid or lymphoid
disease, suggesting that these NK cells may not be killing the tumour directly but are
influencing the immune environment. Alternatively, the relative activation level of NK
cells within the first two weeks post-transplant may result in enhanced capacity for
lysis of lymphoid cells. Further detailed assessment of the phenotype and function of
NK cells in the early post-transplant period may help to identify a more precise
mechanism of NK cell involvement in relapse protection.
NK cells dominate the lymphocyte repertoire during the early phase of immune
reconstitution. Therefore the clinical impact of the NK cell infusion at the time of

175
transplant will most likely have greatest effect during the first month (Dunbar et al.
2008). The substantial use of alemtuzumab for T cell depletion in our transplant
cohort is likely to enhance the dominance of NK reconstitution post-transplant and
may also increase their relative clinical importance in relation to GvL. When the 79
patients who received alemtuzumab were analysed alone the protective effect of the
high NK cell dose was still statistically powerful (p: 0.0008) (Figure 5.9A). In addition,
removing the HLA-mismatched patients and those receiving full intensity conditioning
left a 60 patient cohort of RIC alemtuzumab T cell depleted HLA-matched
transplants and this still demonstrated significant protection from relapse when a
higher than median dose of NK cells was received, with a tenfold difference in
relapse incidence between those receiving high or low NK cell doses (Figure 5.9B).
The remarkable nature of these findings has not been shown previously in other
cohorts.
Figure 5.9 – The NK cell dose remains protective for patients who received an alemtuzumab-conditioned transplant Cohort analysis was limited to those patients who received alemtuzumab for T cell depletion (A) (n=79) or those who underwent a reduced intensity conditioned, HLA matched and alemtuzumab-incorporting transplant regimen (B) (n=60). Patients were divided into those where the infusion contained either above (black) or below (red) the previously measured threshold of 6.3x10
6 NK cell per kg and this was related to incidence of disease relapse. In
both instances a high NK cell dose was highly predictive of disease relapse protection. Analysis was tested using the Gray method.

176
Impact of T cell depletion
Anti-thymocyte globulin (ATG) acts primarily to deplete T lymphocytes but can also
reduce the numbers of B and NK cells in the peripheral blood (Mohty 2007). Within
the secondary lymphoid tissues of animal models high doses of ATG, comparable to
those used in clinical allo-HSCT, were seen to result in depletion of B and NK cells
along with T lymphocytes (Mohty 2007). Alternatively in another murine model of
allo-HSCT, comparable clinical doses of alemtuzumab significantly depleted
circulating lymphocytes but did not substantially affect the number of cells in
secondary lymphoid organs (Hu et al. 2009). Indeed, even tenfold increases in the
treatment dose did not achieve total removal of T cells from the thymus and spleen.
If these findings translate directly to humans it suggests that there could be a
disparity in the clearance of lymphocytes within patients receiving alemtuzumab and
ATG, in which alemtuzumab does not achieve such a profound T-cell lymphopenia
within secondary lymphoid organs. Consequently, the clinical correlations that I
observed between NK cell dose and clinical outcome in patients who had received
alemtuzumab may not necessarily translate directly into cohorts which incorporate
ATG. Alemtuzumab is a CD52-specific monoclonal antibody and may partly exert its
effects through ADCC in a process mediated by NK cells (Hu et al. 2009). This could
potentially aid in NK cell activation by providing ‘easy’ targets for the cells to kill and
priming them for more efficient serial killing (Choi et al. 2013). The expression level
of CD52 varies on different lymphoid subsets, with B cells expressing the highest
level and NK cells the lowest (Figure 5.10). An in vitro assay that I undertook to
assess killing of healthy PBMC found no dose dependent effect on NK cell depletion,
compared to a linear correlation between the dose of alemtuzumab and T cell
depletion (Maggs, 2013, MRes Thesis). Greater understanding of how alemtuzumab

177
and ATG affect early immune cell reconstitution following allo-HSCT, and the clinical
importance of NK stem cell dose in each setting, may help to describe the
mechanisms of protection.
Overall survival
Whilst the difference in relapse incidence between the two groups was substantial
this did not transform into a significant difference in overall survival. A trend towards
greater survival with a higher dose of infused NK cells was seen and is presumably
related to a lower rate of relapse-related deaths in these patients. However, of the
patients who did relapse, only 75% of those who received a low NK cell dose went
on to die due to their disease compared to 100% of the patients who relapsed
*****
**
Figure 5.10 – Expression of CD52 on lymphocytes in stem cell graft samples PBMC isolated from stem cell graft samples were stained for lymphocyte markers (anti-CD19 PE-Cy7 [SJ25C1] - eBioscience; anti-CD3 PB [OKT3] – eBioscience; antiCD56 APC-Cy7 [HCD56] - Biolegend) and CD52 surface expression (anti-CD52, FITC [HI186] - Biolegend). (N=13). Bar chart compares mean fluorescence intensity (MFI) of CD52 on stem cell graft lymphocytes. All p values calculated using a Mann-Whitney U test. Bar charts show median values with interquartile range. P values: B – NK <0.0001; B – T 0.0007; T – NK 0.0008.

178
following receipt of a high NK cell dose, potentially indicating a greater severity of
disease within these patients which higher numbers of NK cells were unable to
control. The use of intervening treatments should also be noted, such as donor
lymphocyte infusions (DLI) to convert mixed chimerism or restore remission. This
was given to 14 patients, however in the three patients who also relapsed only one
did not die of their disease. Interestingly the patients receiving a higher dose of NK
cells also showed a trend towards higher incidence of non-relapse related mortality.
Whilst this was not significant it is important to note as it may indicate poorer
infection control in these patients.
An association between a high number of CD34+ cells in the graft and protection
from non-relapse mortality is likely to reflect more effective haemopoietic
engraftment, subsequent improvement in immune function and lower infection risk.
In most cases within our cohort (91%) the dose of CD34+ cells given to the patient
was kept between 4-8 x10⁶ cells per kg as a measure to improve overall survival
(Törlén et al. 2014). This limited variability may explain why no significant differences
in non-relapse mortality or overall survival were found in relation to the CD34+ cell
dose. However, an association was observed in relation to the absolute number of
CD34+ cells and may potentially reveal a dissociation between correction for patient
weight and the finite limit in bone marrow capacity. As such the absolute number of
CD34 cells may potentially provide a more accurate predictive correlate for
protection from transplant related mortality in similar transplant cohorts.

179
Other influences on the frequency of disease relapse
Multivariate analysis found that several patient characteristics were independent
predictors of protection from disease relapse in addition to the dose of NK cells in the
stem cell graft. Low HCT-CI, indicating a patient has minimal comorbidities likely to
affect the transplant outcome, has been shown to impact on overall survival and non-
relapse mortality but not specifically on relapse (Sorror et al. 2005). Here low HCT-
CI was found as an independent predictor of protection against relapse as well as
overall survival.
Additionally, patients receiving alemtuzumab as opposed to ATG as their source of T
cell depletion had a lower incidence of relapse. The choice of these anti-T cell
antibodies is down to Consultant preference, centre experience or participation in a
clinical trial. T cell depletion is used to prevent occurrence of GvHD but this is also
known to result in an increase in the rate of disease relapse compared to
unmanipulated transplants (Soiffer et al. 2011). Soiffer et al did not find a significant
difference between relapse rates in patients receiving ATG or alemtuzumab at three
years post allo-HSCT, albeit the majority of patients did receive ATG. Interestingly
use of alemtuzumab correlated with greater overall survival compared to ATG and
univariate analysis showed a similar association within our cohort.
Patents who received a transplant from a matched unrelated donor as opposed to a
sibling donor were found to have relative protection from disease relapse. It is likely
that the increased ‘histoincompatibility’ that is present following use of an unrelated
donor acts to enhance the allogeneic immune response, although this has been
difficult to substantiate (Weisdorf et al. 2002). A ten out of ten HLA-matched
patient/donor pairing only compares HLA-A, -B, -C, DRB1 and -DQB1 however there

180
are many other HLA and non-HLA genes which could remain mismatched and
influence patient outcome. For instance, HLA-DPB1 matching between patient and
donor is associated with lower risk of aGvHD but greater risk of relapse (Shaw et al.
2007) and suggests that HLA-DPB1 can act as a restriction element for alloreactive
T cells. Further classification can divide HLA-DPB1 mismatched pairs into those that
are potentially tolerable (‘permissive’) or ‘non-permissive’ based upon matching or
mismatching of T cell epitope groups. Non-permissive mismatches are associated
with significantly lower rates of disease relapse compared to permissive mismatches
which suggests a greater alloreactive T cell-mediated GvL (Fleischhauer et al. 2014).
Similarly, KIR-ligand mismatch between donor and patient has been shown to impact
upon disease relapse (Cooley et al. 2014). KIR genotyping could offer another
opportunity to improve donor selection but these potential advantages must be
traded against further limitation of donor availability and financial cost.
Correlative trends towards higher donor age and the NK cell dose as well as a
protective effect of the percentage of CD56dim cells in the graft were found but did
not significantly affect patient outcomes. An interquartile range of 22 years is
probably too small to allow an accurate assessment of the impact of donor age in
this study.
Previous infections may represent an important influence on donor NK cell repertoire
and function (Strauss-Albee et al. 2015). This is clearly true for CMV as seropositive
donors showed a trend towards having higher frequencies of CD56dim NK cells,
however this did not result in a difference in the doses received by patients. Further
in depth analysis of donor NK cell repertoires, potentially using techniques such as
CyTOF analysis, may prove more predictive for allo-HSCT outcome.

181
My analysis of these findings in a second cohort revealed comparable findings to the
first study but this was too small to achieve statistical significance. In addition, due to
time constraints on analysis of the clinical outcomes these patients had only reached
at least six months post-transplant. Four out of the five patients who relapsed within
this time received less than the 6.3x10⁶ NK cells/kg median of the main cohort and it
will be interesting to see how this data matures during follow up.
Conclusions
The magnitude of the impact that the NK cell ‘dose’ has on the risk of disease
relapse after allo-SCT was striking and the findings could have considerable impact
for clinical practice. Within the context of T cell depleted allo-HSCT, stem cell grafts
containing at least 6.3x10⁶ NK cells/kg are associated with 6.7 fold reduction in the
risk of relapse, without increasing the risk of clinically significant aGvHD or non-
relapse mortality. CD34+ cell dose is already measured within stem cell donations
and it would be relatively straightforward to also assess the number of the CD3-
CD56dim cells. Where the NK dose is inadequate it is likely to be possible to add
more cells from processing of residual apheresis product. Alternatively, up to 2x10⁷
NK cells/Kg can be obtained following a single donor lymphopheresis.
These findings indicate the profound influence that the initial NK cell infusion has on
determining the clinical features following allogeneic stem cell transplantation.
Further investigation of the mechanism that underlies this association has the
potential to uncover new insights into NK cell biology and may have the potential to
greatly improve the clinical outcome of patients undergoing this procedure.

182
Chapter 6 - Phenotypic and functional analysis of stem cell graft NK cells
My previous work had revealed that a higher dose of mature CD56dim NK cells within
the stem cell graft was associated with relative protection from disease relapse. I
next went on to assess the phenotypic and functional profile of NK cells within the
stem cell product. This was considered to be important as there is extensive
heterogeneity within the NK cell repertoire of different individuals and as shown
previously G-CSF mobilisation and apheresis processing impacts on the phenotype
and functional capacity of NK cells within the stem cell graft.
A variety of inhibitory and activatory receptors on each NK cell receive signals from
target cells and the local microenvironment which are integrated in order to
determine the overall cellular response. The pattern of receptor expression on
different NK cells is related to NK cell differentiation status and is also influenced by
genotype and environmental factors such as infection history.
Differences in the functional capacity of NK cell populations from different donors
may influence patient outcomes following HLA matched T cell depleted allo-HSCT. I
therefore decided to determine the phenotype and cytotoxic function of NK cells
within the stem cell grafts and related this to clinical outcome.
183
Results
Phenotypic analysis of NK cell markers within the stem cell graft and their association with incidence of relapse within the patient
Stem cell grafts received by 107 patients undergoing stem cell transplantation were
analysed for phenotypic differences (Table 2.2). Associations were investigated with
four clinical outcomes in the patient and a Bonferroni correction was therefore
applied, reducing the significance value to <0.0125.
Initially comparison with relapse incidence was assessed by examining the NK cell
population within the stem cell graft and dividing them into those received by patients
who did not go on to relapse (NR) and those who did (R). An increased percentage
of CD56dim cells (87.3 vs 83.1%) and lower percentage CD56bright (12.7 vs 16.9%)
NK cells was found to have been given to patients who did not go on to relapse
compared to those who did (p - 0.027) (Figure 6.1A). Patients who relapsed also
received NK cells with a significantly lower percentage expression of the activatory
receptor DNAM compared to those that remained in remission (72.7% vs 84.5; p -
0.0013) (Figure 6.1B). A similar trend was seen in relation to the activatory receptors
NKp46 (37.1% vs 43.2%; p – 0.1734) and CD16 (15.6% vs 31.1; p – 0.0373) but
these did not reach significance. KIR expression was detected on an average of
28.3% of NK cells in the stem cell grafts that were administered to patients who went
on to relapse compared to a value of 42.9% in patients that remained in remission
(p- 0.0007).
The proliferation status of NK cells, as measured by Ki-67 expression, was very
similar between the groups (5.1% vs 5.2% for NR and R respectively; p – 0.97). A
trend towards higher percentage expression of the degranulation marker CD107 was

184
seen in relapse patients (14.9% (NR) vs 23.4%(R); p - 0.22). Patients who went on
to relapse also received NK cells with a reduced expression of the cytotoxic proteins
granzyme B (33.5% (NR) vs 21.9% (R); p - 0.096) and perforin (47.5% (NR) vs
17.0% (R); p - 0.029) (Figure 6.1C). Markers of NK cell maturity and exhaustion
displayed large variation between patients but did not show any significant
differences between the relapse and non-relapse groups (NR vs R - CD57: 20.1% vs
16.1%; p – 0.14; PD-1: 18.6% vs 20.7%; p – 0.45; Tim-3: 40.1% vs 32.4%; p - 0.89.
Eomes/Tbet: 45.4% vs 44.6%; p – 0.2749) (Figure 6.1D).
As clear differences had been observed in the phenotypic profile of NK cells within
the stem cell graft and the relative rate of relapse, I next went on to determine
whether these differences were specific to either the immature or mature NK cell
subsets by analysing them as separate populations (Figure 6.2). As expected,
overall differences in activatory and inhibitory receptors were mainly observed within
the CD56dim population, with DNAM (83.2% vs 71.7%; p - 0.0012) and KIR (47.1%
vs 30.5%; p - 0.0012) expression significantly reduced in the relapse cohort.
Reduced DNAM expression was also seen to a lesser extent in the CD56bright
population (89.1% vs 79.7%; p - 0.097) whilst the KIR disparity was not (11.1% vs
8.5%; p – 0.038). Differences in granzyme and perforin did not reach significance
when split into CD56bright and CD56dim cells, nor were any differences observed in
relation to expression of markers of maturity or exhaustion.
In conclusion, patients who went on to relapse received grafts containing a lower
CD56dim to CD56bright NK cell ratio. The mature effector CD56dim cells they did
receive also had significantly reduced expression of DNAM and KIRs. This suggests
that the NK cells received by patients who go on to relapse displayed reduced
cytotoxic potential compared to those given to patients who remained in remission.

185
Figure 6.1 – Phenotypic analysis of NK cells within the stem cell graft in patients who remained in remission and those who relapsed Stem cell graft NK cells were immunophenotyped and results analysed based upon whether patients who received the cells went on to relapse or remained in remission within two years post transplant. Expression of CD56 (A), activatory and inhibitory receptors (B), functional markers (C) and maturity and exhaustion markers (D) were assessed. Bonferroni correction was applied reducing the significance cut off to <0.0125. Significant p values: DNAM – 0.0013; KIR – 0.0007; Perforin – 0.0285. (A: NR n=68; R n=24. B: NR n=68; R n=24. C: NR n=62; R n=16. D: NR n=60; R n=13). All p values calculated using a Mann-Whitney U test. Bar charts show median values with interquartile range.

186
Figure 6.2 – Phenotypic analysis of CD56bright
and CD56dim
NK cells within the stem cell graft in patients who remained in remission and those who relapsed Stem cell graft CD56
bright and CD56dim NK cells were immunophenotyped and analysed
based upon whether patients who received the cells went on to relapse or not. Expression of activatory and inhibitory receptors on CD56
bright (A) and CD56
dim (B) NK cells, functional
markers on CD56bright
(C) and CD56dim
(D) NK cells and maturity and exhaustion markers on CD56
bright (E) and CD56
dim (F) NK cells were assessed. A Bonferroni correction was applied
reducing the significance cut off to <0.0125. Significant p values: CD56dim
DNAM – 0.0012; CD56
dimKIR – 0.0012. (A/B: NR n=68; R n=24. C/D: NR n=62; R n=16. E/F: NR n=60; R
n=13). All p values calculated using a Mann-Whitney U test. Bar charts show median values with interquartile range.
NKp46+ NKG2D+ DNAM+ CD16+ KIR+0
20
40
60
80
100
Per
cen
tag
e o
f C
D56
bri
gh
t NK
Cel
ls
*
CD107+ Granzyme+ Perforin+ Ki-67+0
20
40
60
80
100
Per
cent
age
of
CD
56di
m N
K C
ells
CD57+ PD-1+ Tim-3+ Eomes+Tbet+0
20
40
60
80
100
Per
cent
age
of
CD
56di
m N
K C
ells
CD107+ Granzyme+ Perforin+ Ki-67+0
20
40
60
80
100
Per
cent
age
of
CD
56br
ight
NK
Cel
ls
CD57+ PD-1+ Tim-3+ Eomes+T-bet+0
20
40
60
80
100
Per
cent
age
of
CD
56br
ight
NK
Cel
ls
NKp46+ NKG2D+ DNAM+ CD16+ KIR+0
20
40
60
80
100
Perc
en
tag
e o
f C
D56
dim
NK
Cells
**
**
A
C
E
B
D
F
CD56bright CD56dim0
20
40
60
80
100
Per
cent
age
of N
K C
ells
Non-relapse
Relapse
*
*
187
Association between NK cell phenotype in the stem cell graft and additional clinical outcomes
I next assessed how NK cell phenotype in the stem cell graft was related to the
three-year post-transplant overall survival, incidence of aGvHD and non-relapse
mortality. Patients with competing risks were removed. In all circumstances there
were no statistically significant differences between the NK cell populations received
within the stem cell graft and outcome (Figure 6.3; 6.4; 6.5). As such NK cell
phenotype within the stem cell graft appears to be exclusively associated with
relapse incidence.
Validation that low expression of DNAM and KIR on CD56dim NK cells within the stem cell graft is associated with an increased risk of disease relapse
Initial findings suggested that the number and phenotype of CD56dim NK cells plays
an important role in regulating the risk of disease relapse. Further analysis of this
specific population was made within a separate cohort of patients who had all
undergone a T cell-depleted conditioning regimen (Table 2.3). As had been seen in
the initial cohort, expression of NKG2D and NKp46 on CD56dim NK cells did not vary
between patients who did not relapse compared to those who did (78.2% vs 76.6%;
p – 0.6381 and 41.6% vs 35.4%; p – 0.4087 respectively) (Figure 6.6A and B).
However, a lower percentage of cells expressed KIR proteins (45.0% vs 34.2%; p -
0.016) and the transmembrane activatory glycoprotein DNAM (74.9% vs 58.6%; p -
0.0013) in patients who went on to suffer disease relapse (Figure 6.6C and D).
This validates the finding that the expression level of DNAM and KIR on NK cells
within the stem cell graft associates with disease relapse rate in two cohorts of allo-
HSCT.

188
Figure 6.3 – Association between the phenotype of NK cells within the stem cell graft and overall survival Stem cell graft NK cells were immunophenotyped and divided based upon whether patients who received donor infusions were alive at three years post allo-HSCT or deceased. Expression of CD56 NK cell subsets (A), activatory and inhibitory receptors (B), functionality markers (C) and maturity and exhaustion markers (D) were assessed. A Bonferroni correction was applied reducing the significance cut off to <0.0125. (A: Alive n=60; Deceased n=47. B: Alive n=60; Deceased n=47. C: Alive n=45; Deceased n=33. D: Alive n=44; Deceased n=29). All p values calculated using a Mann-Whitney U test. Bar charts show median values with interquartile range.

189
Figure 6.4 – Association between the phenotype of NK cells within the stem cell graft and acute GvHD Stem cell graft NK cells were immunophenotyped and divided based upon whether patients who received the donor infusion acquired grade 2 or above aGvHD within 100 days following allo-HSCT or not. Expression of CD56 NK cell subsets (A), activatory and inhibitory receptors (B), functionality markers (C) and maturity and exhaustion markers (D) were assessed. A Bonferroni correction was applied reducing the significance cut off to <0.0125. (A: None n=59; aGvHD n=45. B: None n=59; aGvHD n=45. C: None n=40; aGvHD n=35. D: None n=39; aGvHD n=31). All p values calculated using a Mann-Whitney U test. Bar charts show median values with interquartile range.

190
Figure 6.5 – Association between the phenotype of NK cells within the stem cell graft and non-relapse mortality Stem cell graft NK cells were immunophenotyped and divided based upon whether patients who received donor infusions died of non-relapse related causes following allo-HSCT or not. Expression of CD56 NK cell subsets (A), activatory and inhibitory receptors (B), functionality markers (C) and maturity and exhaustion markers (D) were assessed. A Bonferroni correction was applied reducing the significance cut off to <0.0125. (A: Alive n=58; NRM n=30. B: Alive n=58; NRM n=30. C: Alive n=42; NRM n=20. D: Alive n=41; NRM n=18). All p values calculated using a Mann-Whitney U test. Bar charts show median values with interquartile range.

191
Figure 6.6 – Patients receiving NK cells with high DNAM+ or KIR
+ CD56
dim expression
within stem cell graft demonstrate a reduced incidence of disease relapse A separate T cell depleted cohort of patients undergoing T cell depleted allo-HSCT was divided into those who relapsed or remained in remission within two years post transplant. Populations of CD56dim NK cells from the stem cell graft received by patients were examined by immunophenotyping. Expression of NKG2D (A) and NKp46 (B) did not associate with relapse but DNAM (C) and KIR (D) expression did. (n=71 for all phenotypic markers). All p values calculated with a Mann-Whitney U test. Bar charts show median values with interquartile range.
DNAM
A NKG2D NKp46
KIRs
p0.6381 p0.4087
p0.0013 p0.0159C
B
D
N o n -R e la p s e R e la p s e0
2 0
4 0
6 0
8 0
1 0 0
Pe
rce
nta
ge
of
CD
56
dim
NK
N o n -R e la p s e R e la p s e0
2 0
4 0
6 0
8 0
1 0 0
Pe
rce
nta
ge
of
CD
56
dim
NK
N o n -R e la p s e R e la p s e0
2 0
4 0
6 0
8 0
1 0 0
Pe
rce
nta
ge
of
CD
56
dim
NK
N o n -R e la p s e R e la p s e0
2 0
4 0
6 0
8 0
1 0 0
Pe
rce
nta
ge
of
CD
56
dim
NK

192
The pattern of co-expression of activatory markers on NK cells in the stem cell graft and clinical outcome
I next went on to assess the pattern of co-expression of individual markers on the NK
cell subsets. In particular, a sequential series of defined Boolean parameters was
used to calculate the proportion of cells expressing multiple markers. This analysis
was applied to the activatory receptors DNAM, NKG2D and NKp46 to determine
their overlapping expression on NK cells received by patients who went on to relapse
and patients who did not (Figure 6.7). The proportion of NK cells expressing all three
receptors was lower in stem cell grafts received by the relapse group at 3%
compared to 8% in the non-relapse patients. Decreases in the double positive
NKp46+DNAM+ cells (4% vs 1%) and single positive DNAM+ NK cells (25% vs 14%)
were also observed. Interestingly, NKG2D+DNAM+ and single-positive NKG2D+
subsets were found in higher proportions in the relapse group.
Non-relapse Relapse
SumofNKp46+NKG2D+DNAM- SumofNKp46+NKG2D+DNAM+ SumofNKp46+NKG2D-DNAM-SumofNKp46+NKG2D-DNAM+ SumofNKP46-NKG2D+DNAM- SumofNKp46-NKG2D+DNAM+SumofNKp46-NKG2D-DNAM+
Figure 6.7 – The pattern of co-expression of activatory receptors on NK cells within the stem cell graft in relation to clinical outcome of relapse or non-relapse Stem cell graft NK cells were split into those received by patients who went on to relapse and those that did not. Single, double and triple expression of activatory receptors NKp46, NKG2D and DNAM was assessed via Boolean gating (Non relapse n=40; Relapse n=17).

193
The influence of donor CMV serostatus on NK cell phenotype within the stem cell graft
As donor age and CMV status had been shown to influence the NK cell repertoire in
the stem cell graft I next went on to examine their influence on DNAM expression.
Donor age had no effect on the percentage of DNAM+CD56dim NK cells found in
donor stem cell grafts (R2 – 0.010; p – 0.477) (Figure 6.8A). CMV seropositive status
in the donor was associated with an almost 12% higher percentage of
DNAM+CD56dim NK cells compared to CMV seronegative donors (75.5% vs 85.7%;
p: 0.021) (Figure 6.8B). However, this did not translate into a significantly different
dose of DNAM+CD56dim NK cells within the seronegative or seropositive grafts (3.2
vs 5.4 x10⁶ cells/kg; p – 0.082) (Figure 6C).
CMV seropositive individuals have higher numbers of CD57+NKG2C+ ‘memory’ NK
cells within the blood and it has been suggested that they may play a role in
mediating protection from relapse in association with an episode of CMV reactivation
following allo-HSCT (Cichocki et al. 2015). CMV seropositive donors did display a
small increased proportion of these cells (0.46% in CMV seronegative vs 1.11% in
seropositive; p - 0.0097) (Figure 6.8D). However there was no association between
this CD57+NKG2C+ NK cell population and protection from relapse post-transplant
(p: 0.4713) (Figure 6.8E).

194
0 20 40 60 800
20
40
60
80
100
Donor Age (Years)
DN
AM
+ C
D56
dim
NK
cel
l %
Donor Age v CD56DNAM
R2: 0.01017p: 0.4768
A
B
D
C
E
S e r o n e g a t iv e S e r o p o s it iv e0
1
2
3
4
5
CD
57
+N
KG
2C
+P
erc
en
tag
e o
f N
K c
ell
s
p : 0 .0 0 9 7
N o R e la p s e R e la p s e0
1
2
3
4
5
CD
57
+N
KG
2C
+P
erc
en
tag
e o
f N
K c
ell
s
p : 0 .4 7 1 3
S e r o n e g a t ive S e r o p o s it ive 0
2 0
4 0
6 0
8 0
1 0 0
DN
AM
+
CD
56
dim
NK
ce
ll %
p : 0 .0 2 1 4S e r o n e g a t ive S e r o p o s it ive
0
1 0
2 0
3 0
4 0
5 0
6 0
DN
AM
+
CD
56
dim
NK
Ce
lls
x1
06
/ k
g
p : 0 .0 8 1 9
Figure 6.8 – The influence of age and CMV serostatus on NK cell phenotype within the stem cell graft Specific stem cell graft NK cell phenotypes were correlated with donor age and CMV serostatus. DNAM
+CD56
dim NK cell expression did not change in relation to donor age
(A). CMV seropositive donors did express higher proportions of DNAM+CD56
dim NK cells
(B), however this did not result in a statistically significant higher dose delivered to the recipient (C). NKG2C+CD57+ NK cells were also found at a higher frequency in CMV seropositive donors (D) but the expression of these cells in the stem cell graft was not related to risk of subsequent relapse (E). (n=59). All p values calculated using a Mann-Whitney t-test.

195
The pattern of chemokine receptor expression differs on NK cells within stem cell grafts received by patients who go on to relapse
A final phenotypic panel was added to measure chemokine receptor expression in
order to determine whether the potential trafficking of NK cells within the stem cell
graft could be associated with clinical outcome. CCR6 and CCR9 promote trafficking
to the skin and gastrointestinal tract respectively (Inngjerdingen et al. 2001).
ChemR23 and CX3CR1 are found on CD56dim NK cells and promote migration to
inflamed peripheral sites whilst CXCR3, CXCR4 and CCR7 are found predominantly
on CD56bright cells and promote migration to secondary lymphoid organs
(Maghazachi 2010). The chemotaxis and distribution of these cells within the body
immediately following infusion may be important in mediating an effective GvL
response.
There was variation in the expression of chemokine receptors between stem cell
grafts, however there were no significant differences in the phenotype of NK cells
given to patients who went on to develop aGvHD and those that did not (Figure
6.9A). In contrast NK cells received by patients who relapsed showed a significantly
higher expression of CXCR4 (9.5% vs 21.1%; p - 0.010), CCR7 (5.6% vs 12.8%; p -
0.046), and CCR9 (2.3% vs 6.7%; p - 0.016) compared to those that did not relapse
(Figure 6.9B).
When analysis was split into the CD56bright and CD56dim subsets the differences seen
in relation to relapse risk were diminished. No differences in CD56bright NK cell
chemokine receptor expression and clinical outcome were detected (Figure 6.10A).
However, on CD56dim NK cells a higher proportion of cells expressing CXCR4 was
found on NK cells received by patients who went on to relapse (7.1% vs 16.6%. p –

196
0.0422) whilst overall a large degree of heterogeneity was seen in chemokine
receptor expression on these cells (Figure 6.10B).
Figure 6.9 – Chemokine receptor expression on NK cells within the stem cell graft and association with subsequent outcome Expression of chemokine receptors was determined by immunophenotyping of stem cell graft NK cells. These were then analysed in patients according to the development of aGvHD (A) or relapse (B). Bar charts show median values with interquartile range. Significant p values: RI CCR9 - 0.0190; RI CXCR4 - 0.0160; RI CCR7 – 0.0358. (A: No aGvHD n= 16; aGvHD n=11. B: Non–relapse n=20; Relapse n=7). All p values calculated using a Mann Whitney u test.

197
Figure 6.10 – Chemokine receptor expression on NK cell subsets within the stem cell graft and association with subsequent risk of relapse Expression of chemokine receptors was determined by immunophenotyping of stem cell graft CD56
bright (A) and CD56
dim (B) NK cells. This was assessed against relapse
incidence within the first year following allo-HSCT. Bar charts show median values with interquartile range. Significant p values: CD56dim NK cells CXCR4 - 0.0422. (Non–relapse n=20; Relapse n=7). All p values calculated using a Mann Whitney u test.

198
No difference in NK cell killing between cells received by patients who went on to relapse and those that did not
As NK cells received by patients who went on to relapse showed reduced DNAM
and KIR receptor expression it was felt important to assess if this correlated with less
efficient killing of target cells in vitro. NK cells were isolated from stem cell graft
samples of patients who either went on to relapse (R) or did not (NR) and stimulated
with IL-2 prior to incubation with 721.221 cells at an E:T ratio of 0.1 for 16 hours. No
difference was found between the two groups in the elimination of these cells (NR –
12.02%; R - 14%. p – 0.8125) (Figure 6.11). Therefore, the ability of activated NK
cells from stem cell grafts to kill an MHC class I null target cell line is not related to
subsequent risk of relapse.
N o n r e la p s e R e la p s e0
1 0
2 0
3 0
4 0
Pe
rce
nta
ge
of
72
1.2
21
Cel
ls K
illed
Figure 6.11 – The capacity of NK cells from stem cell grafts to kill MHC class I null target cell line does is not related to subsequent relapse incidence NK cells were isolated from stem cell grafts, stimulated with IL-2 and incubated for 16 hours with 721.221 cells at 0.1 E:T. The ability to kill target cells was then related to clinical outcome of relapse or not. No difference was seen in the ability of NK cells received by patients who went on to relapse and those that did not in the ability to kill 721.221 target cells (p – 0.8125). Non-relapse n = 7; Relapse n = 10. p value calculated using a Mann Whitney U test.

199
Assessment of NK cell cytotoxicity against AML target cells in vitro
In order to further evaluate the potential basis for a direct GvL response by NK cells
against residual tumour in allo-HSCT, the potential capability of NK cells taken from
the stem cell graft to kill tumour cell lines was further assessed. Previous work had
shown that IL-2 activated stem cell graft NK cells can kill K562 and 721.221 HLA-null
cell lines (Figure 4.10) and, as the positive associations between NK cells in allo-
HSCT have been predominantly seen in myeloid disease, I next went on to assess
their capability to kill AML cell lines.
PL-1 and Kasumi AML cell lines were donated from Professor Constanze Bonifer’s
laboratory and combined at a 0.1 E:T with IL-2 stimulated healthy donor derived NK
cells for 16 hours. In comparison to the MHC Class-I negative cell lines (K562 –
44.8%; 721.221 – 33.7%) the percentage of PL-21 and Kasumi cells killed (3.9% and
9.2% respectively) were significantly reduced (compared to K562; 721.221 p –
0.212, PL-21 p – 0.037, Kasumi p – 0.004) (Figure 6.12A).
Similarly, to test whether NK cells are functionally effective against primary tumour
targets, three primary AML blast samples were acquired at the point of diagnosis
from Professor Mark Drayson. NK cells from healthy donors exhibited some degree
of lysis on cells from all three samples (8.9%, 14% and 4.2% respectively) when
stimulated with IL-2 and incubated at a 0.1 E:T ratio for 16 hours (Figure 6.12B). The
observation that NK cells are able to directly kill AML cells adds support for the
theory that NK cells within the stem cell graft may act directly to eliminate residual
tumour cells in the immediate post-transplant period.

200
A
B
AML 1 AML 2 AML 30
5
10
15
20
25
Perc
enta
ge C
ells
Kill
ed
K562 721.221 PL-1 Kasumi0
10
20
30
40
50
60
Perc
enta
ge T
arge
t C
ells
Kill
ed
**
Figure 6.12 – The ability of NK cells to lyse AML cell lines and primary AML cells NK cells were isolated from healthy donors, stimulated with IL-2, and incubated for 16 hours with target cells at 0.1 E:T. Target cells included HLA class I-negative cell lines and AML cell lines (PL-1 and Kasumi) (A) as well as primary AML blasts (AML1-AML3) (B). p values calculated using a Mann Whitney U test.

201
DNAM inhibition significantly reduces NK cell cytotoxicity against AML target cells in vitro
The association between a high number of DNAM-positive NK cells within the stem
cell graft and protection from disease relapse suggested that DNAM-mediated
cytotoxicity is involved in an effective GvL response. As direct killing of tumour cells
is a potential mechanism for GvL I next went on to assess whether this could be
DNAM dependent.
Expression of the DNAM ligands CD155, and CD112 was assessed by flow
cytometry on the cell lines K562 and Kasumi as well as primary AML cell samples
(Figure 6.13A). Expression of both ligands was higher on K562 cells compared to
Kasumi cells (K562 MFI: CD112 – 0.74; CD155 - 0.69; Kasumi MFI: CD112 – 0.29;
CD155 - 0.58) and was particularly low on primary AML samples (MFI: CD112 –
0.08; CD155 - 0.11).
To assess the potential importance of DNAM in the killing of these target cells, IL-2
stimulated NK cells were incubated with excess DNAM antibody for 30 minutes prior
to incubation with the target cell in order to inhibit signalling from the receptor. The
NK cells were then incubated for 16 hours with target cells at an E:T ratio of 0.1.
K562, Kasumi and AML sample 2 were chosen as they demonstrated the greatest
susceptibility to NK killing. DNAM inhibition significantly reduced lysis of all three
target cells. K526 (40.8% (without incubation) vs 26.6% (with incubation); p -
<0.0001), Kasumi (9.3% vs 3.2%; p – 0.0304) and AML sample 2 (13.9% vs 9.2%; p
- 0.0321) (Figure 6.13B).

202
Together this data is supportive of a hypothesis that residual AML cells could be
partially eliminated in the early post-transplant period by CD56dim NK cells in a
DNAM-specific manner.
K562 Kasumi AML 20
10
20
30
40
50
Per
cent
age
of
Cel
ls K
illed
*
**
DNAM Inhibition - + - + - +
A
B
CD112CD155CD33
K562
KASU
MI
AML2
Figure 6.13 – NK cells can kill AML cells in a manner that is partially dependent on DNAM-specific lysis Expression of CD33, a myeloid specific marker, and DNAM ligands (CD155 and CD112) was examined on target cells K562, Kasumi and AML blasts (A). Black – isotype control; Grey – test sample. NK cells from healthy donors were isolated, stimulated with IL-2 and inhibited with DNAM antibody. Cells were then incubated for 16 hours with a target cell line at 0.1 E:T (B). DNAM inhibition significantly reduced target cell killing of K562, Kasumi and primary AML cells. All p values calculated using a Mann Whitney U test.

203
Discussion
Summary
The phenotype and function of NK cells within the stem cell graft were assessed for
potential association with subsequent patient outcomes post-transplant. Whilst there
was a large degree of heterogeneity in the phenotypic properties of NK cells from
different donors, the only positive associations with outcome were related to low
expression of DNAM, KIRs and perforin on NK cells received by patients who went
on to relapse. A slightly higher expression of several chemokine receptors was also
seen on these populations. The cytotoxic ability of NK cells within stem cell grafts
was not shown to be different in relation to whether patients subsequently went on to
relapse. However, DNAM inhibition was able to significantly reduce NK cell killing of
primary AML target cells indicating that a lack of DNAM expression in vivo may
hinder NK cell killing of residual tumour cells.
The potential importance of DNAM in relation to the mechanisms of GvL
Whilst the number of NK cells within the stem cell graft is important for protection
from relapse, the phenotype of these NK cells also has an impact on this outcome. In
particular, my data show the critical importance of the CD56dim subset, indicating that
cytotoxic activity of NK cells may be the predominant factor in providing protection
against relapse. It was further observed that DNAM expression by CD56dim NK cells
may be a mechanism of tumour cell targeting and protection from relapse following
transplant.

204
DNAM is a dominant activatory molecule involved in T and NK cell mediated
cytotoxicity (Shibuya et al. 1996). The DNAM ligands CD155 (also known as PVR
and NECL5) and CD112 (also known as nectin 2) are members of the nectin and
nectin-like molecule family and are known to be variably expressed by AML blast
cells (Pende et al. 2005; Bottino et al. 2003). Moreover, DNAM-dependent killing of
AML cell lines has been shown in vitro (Kearney et al. 2016) as well as here in
primary AML cells. Decreased expression of DNAM has been demonstrated on NK
cells taken from patients with AML and is believed to be induced as a mechanism of
tumour evasion (Sanchez-Correa et al. 2012). Therefore, an infusion of donor
CD56dim NK cells which express high levels of DNAM would be expected to have the
potential to directly lyse CD112 or CD155 expressing tumour cells.
Interestingly, the expression of DNAM was increased on CD56dim NK cells from CMV
seropositive donors but donor CMV status was not found to be a pre-transplant
factor influencing transplant outcome. CMV reactivation following allo-HSCT has
previously been associated with protection from relapse (Elmaagacli et al. 2011;
Green et al. 2013) and it is possible that the induction of DNAM expression by NK
cells in response to CMV viremia may influence GvL. It is also known that CMV
reactivation post-transplant produces an increase in CD56dimCD57+NKG2C+ NK
cells and associates with reduced relapse incidence (Cichocki et al. 2015).
Interestingly within this cohort, stem cell grafts from CMV seropositive donors had
significantly higher percentages of CD57+NKG2C+ NK cells (p: 0.0097) indicating
the lasting effect of their primary infection. This difference however did not impact on
relapse rates suggesting that CMV reactivation may be an additional necessary
factor to deliver the beneficial expansion of these cells.

205
The expression of multiple activatory receptors on NK cells received by patients that
went on to relapse was lower compared to those that did not. NK cell killing usually
requires two signals to be initiated and synergy between activation of NKG2D,
NKp46 or DNAM is usually required for efficient lysis (Bryceson et al 2006). As such
this finding may represent an important topic for further study.
The potential importance of KIR expression on NK cells and risk of relapse
Expression of a group of predominantly inhibitory KIRs (KIR2DL1/DS1;
KIR2DL2/DL3; KIR3DL1) was assessed on NK cells within the stem cell graft. Their
collective expression was reduced on CD56dim NK cells in patients who went on to
relapse. The impact of KIRs in allo-HSCT has previously been reported as patients
receiving grafts from KIR haplotype B donors show greater relapse protection in the
T cell replete transplant setting (Cooley et al. 2009). This was particularly relevant
when patients and donors exhibited a HLA-C mismatch, which was thought to
stimulate development of alloreactive NK cells (Cooley et al. 2014). A similar effect
on patient outcomes in a large cohort of T cell depleted transplants has not been
shown however. Group B haplotypes contain one or more of the following genes
which encode primarily activatory receptors; KIR2DL5, KIR2DS1, KIR2DS2,
KIR2DS2, KIR2DS5 and KIR3DS1 (Uhrberg et al. 1997; Hsu et al. 2002). Haplotype
A is defined by containing primarily inhibitory KIRs and lacks the activatory genes
and genetic variability associated with haplotype B. Distinguishing donor haplotype
based upon the immunophenotyping data was not possible due to the use of anti-
KIR2DS1 within the pan-KIR antibody mixture. Individual KIR genotyping of patients
and donors will be necessary to ascertain whether the relevance of the reduced KIR

206
expression observed on stem cell derived CD56dim NK cells is secondary to a
predominance of KIR haplotype B in this cohort.
Although most patients and donors were HLA-matched, the variability in KIR
expression within an individual’s NK cell population may produce some alloreactive
NK cells. A greater population of KIR+ NK cells might represent a possibility of more
alloreactive NK cells in this setting whilst the reduced expression of KIRs received by
patients who went on to relapse may also indicate a greater population of un-
licenced NK cells with less responsiveness to residual tumour.
Chemokine receptor expression and risk of disease relapse
Immunophenotyping also revealed higher expression of several chemokine
receptors on NK cells received by patients who went on to relapse. In particular this
was seen for CXCR4 and CCR7 which stimulate NK cell migration towards potential
tumour sites in the bone marrow and lymph nodes respectively (Bernardini et al.
2008; Förster et al. 2008). This may however be representative of a more immature
NK cell phenotype which is generated during the G-CSF mobilisation and apheresis
processing donors undergo. Interestingly CD56dim cells showed high levels of
CXCR3, CXCR4 and CCR7 expression which is not normally reported on this subset
in healthy donors. As such, when infused into the host these NK cells may traffic to
tissue sites before undergoing differentiation into fully mature effector NK cells and
this may limit their immediate GvL potential within the first two weeks post-transplant.
This is a challenging hypothesis to investigate in vivo and would require invasive
tissue biopsies or, potentially, radiolabelling of cells prior to infusion. Previous reports
have also shown that the chemokine receptor expression of the NK cell population

207
within the donor grafts is different to that seen within normal peripheral blood and
may impact upon the NK cell role in relapse protection (Inngjerdingen et al. 2001;
Maghazachi 2010). As such, manipulation of chemokine-mediated cell migration may
represent an important determinant of clinical outcome.
Conclusions
The phenotype of NK cells received by patients as part of their stem cell graft
appears to play an important role in the incidence of disease relapse. Direct killing of
residual target cells produced by CD56dim DNAM+ NK cells present in the stem cell
graft is a viable mechanism of GvL and the associated protection from disease
relapse.
T-cell depletion was used in this patient cohort and as such NK cells therefore
dominate the lymphoid repertoire during the early phase of immune reconstitution.
However, T and NK cell reconstitution correlated positively with each other (Figure
3.2B) and therefore both compartments may have influence over the other. One
mechanism by which NK cells may regulate the T cell response is via the killing of
immature dendritic cells which promote immune tolerance and suppression via Tregs
(Dickinson et al. 2017; Ghadially et al. 2014). This dendritic cell editing is therefore
useful when initiating an immune response, resulting in an increase in effector T cells
(Morandi et al. 2012; Ferlazzo & Moretta 2014). Within the context of allo-HSCT an
infusion of cytotoxic CD56dim NK cells which can kill host dendritic cells might
enhance the allogeneic immune response. Our finding that DNAM expression is
important in relapse protection also supports this hypothesis of GvL as DNAM

208
ligands are highly expressed by dendritic cells and DNAM-mediated killing of
immature dendritic cells is well documented (Pende et al. 2006). Furthermore, Treg
cells have been shown to suppress both T and NK cell cytotoxicity through
expression of TGF-β in murine models (Ghiringhelli et al. 2005). High numbers of NK
cells may therefore compete with T cells for this regulation, which may allow a more
effective T cell-mediated GvL effect. This data supports a hypothesis that DNAM-
mediated killing of recipient cells by stem cell derived NK cells may also represent a
valid mechanism for the GvL effect following T cell depleted allo-HSCT.

209
Chapter 7 – General Discussion
Summary This thesis investigated primarily the role of stem cell graft derived NK cells in
determination of the clinical outcome of adult T cell depleted allo-HSCT. It was found
initially that the reconstitution of higher numbers of both CD56dim and CD56bright NK
cells in the peripheral blood of patients by day 14 post-transplant was associated
with relative protection from disease relapse. As these NK cells are likely to be
derived directly from the stem cell graft, assessment of the cellular components
within this infusion product was then undertaken.
NK cells within the stem cell graft are phenotypically and functionally different to
peripheral blood NK cells from healthy individuals. In particular, CD56dim NK cells
display a reduced cytotoxic capacity with decreased expression of activatory
receptors and cytotoxic proteins which resulted in less efficient killing of MHC class I
null cell lines. In contrast, CD56bright NK cells from the stem cell graft are increased in
frequency compared to circulating blood of healthy individuals and displayed a more
activated and proliferative phenotype. As such, the NK cells received by patients are
generally of a more immature phenotype and display reduced cytotoxic potential. A
large degree of variability in the number of cells collected, and their phenotypic
expression, was also observed between donors.
In a T cell deplete allo-HSCT setting a cohort of 107 patients demonstrated a strong
association between the infusion of high numbers of donor NK cells in the stem cell
graft and relative protection from disease relapse (Maggs et al. 2017). This was
shown both in univariate and multivariate models. This suggests a role for stem cell

210
graft derived NK cells in establishing a GvL response and it is likely that this is
mediated in the very early post-transplant period.
Mature effector CD56dimDNAM+ NK cells transferred within the graft were strongly
associated with protection from disease relapse indicating that cytotoxic function
appears to be important in mediating an effective GvL response. In order to explore
this concept I was also able to demonstrate DNAM-mediated NK cell killing of
primary AML blasts.
Whilst the number of the cellular components within the stem cell graft did not
correlate with the number of cells in patient peripheral blood over the first month
post-transplant, the influence of NK cell number on disease relapse rate was also
seen throughout this early time period. It is therefore highly likely that NK cells within,
and derived from, the stem cell graft influence the allogeneic immune response in
patients and are indeed beneficial for establishing a GvL response immediately
following T cell depleted allo-HSCT.
NK cells and the allogeneic immune response post allo-HSCT
These data support a hypothesis that donor derived NK cells in the stem cell graft
contribute directly towards a GvL response and result in a lower incidence of disease
relapse. DNAM-mediated killing of recipient target cells occurring within the first two
weeks post-transplant is one viable mechanism as to how this effect may be
mediated.
Killing of residual tumour cells would be the most direct way through which these NK
cells might mediate GvL. This would require that NK cells can identify tumour cells
211
for elimination, receive appropriate signalling and mediate effective cytolytic function.
Receiving a higher number of NK cells in the stem cell graft might therefore be
beneficial simply by increasing the ‘effector:target ratio’ of NK cell activity.
Haploidentical transplants are widely used for treatment of myeloid leukaemia and
increased GvL responses have been reported in association with KIR receptor ligand
mismatch (Ruggeri et al. 1999). Host HLA mismatch with donor KIR will limit
inhibitory signalling and a resultant increase in alloreactive NK cells may mediate the
protective clinical effect (Ruggeri et al. 2015b). Within the context of HLA-matched
allo-HSCT the probability of KIR-ligand mismatch is less, however the variability in
KIR expression within an individual’s NK cell repertoire would suggest that a
subpopulation of the cells are likely to exist that carry alloreactive potential.
Determining if these cells are indeed present and confer such a response is,
however, difficult.
Beneficial associations between KIR ligand mismatch and survival and relapse rates
were seen in a study of 130 patients receiving unrelated donor transplants (Giebel et
al. 2003), although this has not been corroborated in other studies with unrelated
donors, albeit using differing conditioning, T cell depletion and stem cell graft
sources (Davies et al. 2002; Bornhäuser et al. 2004; Rocha et al. 2016). Whilst our
data did not assess potential KIR mismatch between patient and donor, it was
observed that patients who did not subsequently relapse received NK cells with a
higher expression of KIR receptors. Interestingly the protective effect of NK cell KIR
expression on relapse incidence was seen in both myeloid and lymphoid
malignancies (Lymphoid: 45.8% vs 34.2%, p -0.0241; Myeloid 42.47% vs 27.67%, p
– 0.0017) (Figure 7.1A; 7.1B). This may be representative of an NK population with

212
increased alloreactive activity as well as more responsive ‘licenced’ NK cells that are
capable of tumour cell killing.
AML patients receiving T cell replete unrelated transplants from KIR B genotype
donors, which express more activatory KIRs, have lower relapse rates and greater
survival that those receiving KIR A genotype infusions (Cooley et al. 2009). This
indicates that NK cell alloreactivity may be less influential in this transplant setting
but that the degree of activatory receptor expression is in fact more important. NK
cell killing of tumour cells requires a priming and a triggering signal to be received,
usually via downregulation of a MHC molecule and the expression of an activatory
receptor ligand (Brenner et al. 2010). NK resistant B-ALL cell lines are thought to
mediate this phenotype due primarily to deficiencies in NK cell activation rather than
any inhibitory mechanism failures (Romanski et al. 2005). Interestingly, loss of
DNAM ligand expression by AML cell lines results in poorer DNAM-mediated killing
(Kearney et al. 2016). In out cohort lower NK cell DNAM expression was significantly
associated with disease relapse incidence for patients with a myeloid but not
lymphoid malignancy, indicating that the importance of DNAM-mediated killing in
GvL may vary in different circumstances (Lymphoid: 84.1% vs 77.0%, p -0.4009;
Myeloid 85.1% vs 70.0%, p – 0.0013) (Figure 7.1C; 7.1D).
Indeed, the importance of tumour NK-ligand expression on clinical outcome of AML
has recently been demonstrated following chemotherapy. The balance of activating
or inhibitory ligands on tumour cells in a cohort of AML patients receiving induction
chemotherapy was an important determinant of outcome, with a higher ‘overall
activating NK ligand phenotype’ being associated with improved two year overall
survival and lower relapse rate (Mastaglio et al. 2018).

213
N o n -r e la p s e R e la p s e0
2 0
4 0
6 0
8 0
1 0 0
Pe
rce
nta
ge
of
NK
Ce
lls
p - 0 .4 0 0 9
N o n -r e la p s e R e la p s e0
2 0
4 0
6 0
8 0
1 0 0
Pe
rce
nta
ge
of
NK
Ce
lls p - 0 .0 2 4 1
Lymphoid Myeloid
N o n -r e la p s e R e la p s e0
2 0
4 0
6 0
8 0
1 0 0
Pe
rce
nta
ge
of
NK
Ce
lls
p - 0 .0 0 1 3
N o n -r e la p s e R e la p s e0
2 0
4 0
6 0
8 0
1 0 0
Pe
rce
nta
ge
of
NK
Ce
lls p - 0 .0 0 1 7
DNAM
KIRA B
C D
Figure 7.1 – The phenotype of NK cells in the stem cell graft is correlated with disease relapse at 1 year
Patients with a lymphoid or myeloid malignancy were separated. The percentage expression of KIR (A/B) and DNAM (C/D) on NK cells within the stem cell graft was assessed in each group and correlated with whether or not the patient went on to relapse within 1 year post-transplant. Decreased KIR expression was associated with relapse in both instances whereas decreased DNAM was associated only with relapse for myeloid patients. Lymphoid: NR n=21; R n=8. Myeloid: NR n=42; R n=16. All p values calculated using a Mann-Whitney U test. Bar charts show median values with interquartile range.

214
The presence of greater numbers NK cells that are both more functionally active and
‘primed’ may be a main factor in achieving direct killing of residual tumour cells after
allo-HSCT. However, it would be naïve to suggest that NK cells are the sole
mediator of the GvL response in this circumstance. Uharek et al. showed over 20
years ago in a murine model of HLA-matched transplantation that whilst elimination
of malignant disease resistant to NK cell killing could be enhanced by ex vivo
cytokine activation, this did not compensate for the loss of CD3+ T cells (Uharek et
al. 1998).
A more reasonable suggestion is that that NK and T lymphocytes mediate differential
GvL responses, the importance of which may vary at different times post-transplant.
NK cells may also be beneficial by exerting an indirect effect on the priming,
expansion, or activity of the alloreactive T cell immune response that develops
(Dickinson et al. 2017). As such, larger numbers of NK cells may act to regulate T
cell activation. Despite this, some studies show that NK cells may actually suppress
the alloreactive response. The mechanism behind NK cell suppression of the
alloreactive T cell response is still unclear, although killing of immature dendritic cells
is thought to be involved (Ferlazzo & Moretta 2014).
Conventional dendritic cells are known to be necessary for presenting alloantigen to
donor T cells following allo-HSCT in order to initiate the alloreactive immune
response that leads to GvHD (Shlomchik 2007; Markey et al. 2009). Dendritic cells
can also take up tumour cells and cross present leukemic-specific antigens to T
cells, as shown in murine post-transplant models (Toubai et al. 2014; Markey et al.
2018). These processes rely on the presence of mature activated dendritic cells
whilst immature dendritic cells may be detrimental in alloreactive immune induction
due to their promotion of immune tolerance and regulatory T cells (Ichim et al. 2003;
215
Fairchild & Waldmann 2000). Dendritic cell editing by NK cells may adjust this
balance by lysing immature dendritic cells which have a low expression of HLA class
I molecules and increasing the proportion of residual mature cells (Ferlazzo &
Moretta 2014; Morandi et al. 2012; Ferlazzo et al. 2001).
Ghadially et al. observed in a murine model of splenocyte transfer that absence of
the activatory receptor NKp46 resulted in increased GvHD, thought to be mediated
by reduced control of immature dendritic cells expressing the unknown NKp46 ligand
(Ghadially et al. 2013; Ghadially et al. 2014). However the expression of NKp46 on
NK cells in the stem cell graft was not associated with GvHD or GvL in our cohort.
The NKp30 receptor is an important mediator of the regulation of immature dendritic
cells in humans and NK and dendritic cell engagement through NKp30 can either kill
the immature dendritic cell or trigger the release of IFN-γ and TNF-α to promote
dendritic cell maturation (Vitale et al. 2005).
A role for DNAM in NK cell mediated dendritic cell editing is less well established,
however does have some basis. Pende et al. showed the involvement of DNAM in
the killing of dendritic cells in vitro through the expression of DNAM ligands CD112
and CD155 (Nectin-2 and PVR) on dendritic cells (Pende et al. 2006). NK cells with
low level expression of NKp30 could maintain suitable dendritic cell editing through
DNAM-mediated killing. Therefore within the context of human allo-HSCT, DNAM
and NKp30 expression on stem cell graft NK cells may have a large impact upon
dendritic cell editing. In contrast to NKp30, the role of DNAM in dendritic cell editing
is restricted to target cell lysis rather than cytokine release (Pende et al. 2006). This
may fit with my finding that DNAM expression on cytotoxic CD56dim NK cells was
most relevant in relation to subsequent relapse rate.

216
Interestingly dendritic cells can in turn promote the activation and priming of NK cells
which may also be important to consider when assessing NK cell activity post-
transplant (Ferlazzo et al. 2002; Lucas et al. 2007). A model is emerging in which
CD56bright NK cells appear to be important in the initial cytokine-mediated activation
of dendritic cells, which in turn primes NK cells and leads to killing of immature
dendritic cells leaving an ‘edited’ population of mature dendritic cells that can
effectively promote an alloreactive T cell response. Whether or not the number of NK
cells that a patient receives in the stem cell graft would impact upon this process
would require tracking of cell populations to patient lymph nodes and determination
of the functional and phenotypic subtypes of the dendritic cells present.
In murine models NK cells post-transplant have been reported to protect against
acute GvHD whilst maintaining GvL (Asai et al. 1998; Ruggeri et al. 2002). Similarly,
high NK cell reconstitution following allo-HSCT in patients with haematological
malignancies has been found to associate with lower occurrence of acute GvHD (B
N Savani et al. 2007; Ullah et al. 2016). Recently the presence of high numbers of
IL-10 producing NK cells at day 14 has been associated with protection from GvHD
(Chan et al. 2017). IL-10 is produced by CD56bright NK cells and suppresses T cell
proliferation and the development of antigen-specific immunity (Akdis & Blaser
2001). No correlation was observed between the number of NK cells received in the
stem cell graft and reconstitution of cells in the peripheral blood of patients within the
first month post-transplant in our cohort. Nevertheless, the complicated dynamics of
lymphoid reconstitution may not be identifiable through assessment of peripheral
blood. GvL is likely to be mediated primarily within bone marrow, whilst acute GvHD
affects the skin and gut tissues (Dickinson et al. 2017; Shlomchik 2007). Migration of
donor derived NK cells to these sites is presumably necessary for a direct effect to

217
occur. Chan et al. found that NK cell aGvHD protection at day 14 correlated with
expression of chemokine receptors to both lymphoid and peripheral sites (Chan et al.
2017). As such the first two weeks following T cell deplete allo-HSCT seems to
represent a short window during which the NK cells from the stem cell graft can have
a powerful influence.
Indeed the establishment of GvHD and GvL responses within this very early time
period post-transplant has been recognised through the effects that differing doses
of cyclosporine have on patient outcomes following HLA matched allo-HSCT where
higher serum levels during the first 10 days post-transplant are associated with
higher relapse rates (Bacigalupo et al. 1991). The effect of cyclosporine on NK cell
activity is less marked than that on T cells, with no major influence on functional
cytotoxicity and even an increase in the numbers of NK cells derived from CD34+
progenitor cells in vitro (Wang et al. 2007). Proliferation of NK cells cultured with
cyclosporine however is inhibited, with CD56dim NK cells affected more so than
CD56bright cells (Wang et al. 2007).
Within our cohorts nearly all patients received cyclosporine at 2.5mg/kg twice daily
until around 90 days post-transplant. At this point the dose starts to be tapered,
usually reducing every couple of weeks until either the patient is off the
immunosuppression or they develop GvHD. This may therefore have an adverse
effect on the homeostatic proliferation of the infused donor NK cells and as such
affect the numbers of CD56dim NK cells within the first two weeks post-transplant.
It is also important to note the difference in function between CD56bright and CD56dim
NK cells. Immature CD56bright NK cells generally produce cytokines which can
influence the immune environment, whilst cytotoxic CD56dim cells can directly
eliminate target cells (Caligiuri 2008). Protection from relapse was conferred by stem

218
cell grafts containing a higher percentage of CD56dim NK cells, whilst at day 14 the
frequency of both subsets within the peripheral blood was relatively similar.
CD56bright cells are the main population of NK cells in the lymph nodes where they
have a major influence on the development of the adaptive immune system (Dalbeth
et al. 2004). The presence of such a high frequency of CD56bright NK cells in the
peripheral blood during patient reconstitution suggests that they are likely to play an
influential role in the development of the GvL response.
Immature CD56bright NK cells have a predominantly cytokine producing function and
the secretion of chemokines and cytokines by activated NK cells will further impact
upon immune function. Cell to cell contact between NK cells and dendritic cells
through the NKp30 receptor can result in the release of TNF-α and IFN-γ, promoting
the maturation of the dendritic cells (Vitale et al. 2005; Walzer et al. 2005). Within
lymph nodes NK cell release of IFN-γ helps to promote a TH1 phenotype for naïve
CD4+ T cells (Martín-Fontecha et al. 2004). Together these cytokines can enhance
NK cell cytotoxicity against targets and act to promote tumour elimination (Ikeda et
al. 2002; Balkwill 2009). Measuring the presence of cytokines in patients post-
transplant provides interesting data, especially in terms of GvHD prediction where
increased TNF-α and IL-10 levels have both been associated with aGvHD onset
(Visentainer et al. 2003; Zhang et al. 2017). Foley et al. also showed that the
functional activity of reconstituting NK cells, in relation to cytotoxic activity or
chemokine expression, were not always strongly correlated following allo-HSCT
(Foley et al. 2011). However, how this effect may impact upon patient outcomes is
not yet clear.
Together these studies, along with my findings, lead to a hypothesis that NK cells
produce a GvL response in the early period after a T cell depleted allo-HSCT and

219
that this operates through CD56dim-mediated killing of residual tumour cells and
potential indirect killing of immature dendritic cells. This would explain why receipt of
greater numbers of NK cells in the stem cell graft is beneficial in protection against
disease relapse (Maggs et al. 2017). Additionally, CD56bright NK cell expansion
following transplant may act to protect against acute GvHD by suppression of an
alloreactive T cell response (Ullrich et al. 2016; Chan et al. 2017).
No significant associations were found between the stem cell graft NK cell dose or
phenotype and overall survival or non-relapse mortality in our cohort. Similarly, trials
of adoptive transfer of purified NK cells have typically been shown to reduce relapse
rates and improve disease free but not overall survival (Rubnitz et al. 2010; Stern et
al. 2013; Curti et al. 2016). This supports a hypothesis that T cell depletion within a
transplant setting may provide the ideal environment for stem cell derived NK cells to
mediate a direct GvL effect and suppress an alloreactive T cell GvHD response, but
their ultimate benefit can only be considered in relation to the composition of the
whole stem cell graft.

220
Hypothesis
The data collected in this project add to the growing understanding surrounding the
role of NK cells in T cell depleted HLA-matched allo-HSCT. The results indicate that
the stem cell graft NK cell ‘dose’, phenotype and function are linked with relapse
incidence but that this does not necessarily associate with significant effects on
aGvHD, NRM or OS. The impact of NK cells on the GvL effect is likely to occur very
early following T cell depleted allo-HSCT as NK cells are the predominant
lymphocyte population at this period. A threshold of ‘cytotoxic capacity’ may need to
be met in order to prevent disease relapse whereby the two-step activation of the NK
cells is achieved. This may well be influenced by the residual tumour burden, the
pattern of NK-ligand expression and both the number of NK cells transferred with the
stem cell graft (NK cell dose) and their phenotype (CD56dimDNAM+ frequency)
(Figure 7.2).
HighRelapseRisk
LowRelapseRisk
MediumRelapseRisk
Relapse
%ofDNAM+NKcells
CD56dimNKCellDose
Figure 7.2 – Model of the potential beneficial effects of CD56dim
stem cell graft dose and DNAM expression frequency

221
It is currently unclear whether or not the role of stem cell graft NK cells on GvL is
primarily direct killing of residual tumour cells, indirect influence over the alloreactive
T cell GvL response or a combination of the two (Figure 7.3). The individual
circumstances of each patient and their treatment will be important determinants of
this response.
Figure 7.3 – NK cells from the stem cell product may act in either a direct or indirect manner to produce a GvL effect.
Residual tumour cells may potentially be eliminated via engagement of DNAM on NK cells with ligands on the tumour cell. In addition, NK cells may act indirectly to boost the alloreactive T cell response by influencing the immune environment through cytokine release or modulation of host regulatory cell function.
NKCells
DNAM
CD112/CD155
Treg Cells
APC
CD8+TCells
Tumour
Cytokine

222
Acquisition of optimal NK cell grafts for patients undergoing allo-HSCT
Allogeneic haematopoietic transplant in adults is a complicated and highly variable
treatment and whilst I have shown an association between NK cells and relapse
incidence it is important to state that a finding of this magnitude has not been shown
previously. Small differences in transplant procedure as well as donor selection and
patient variation may have large effects on the cellular dynamics achieved following
the transplant and therefore the potential clinical outcomes. As such my findings
require validation and any potential association in clinical cohorts with different
transplant protocols will be interesting to observe.
G-CSF mobilisation is the most commonly used method of donor stem cell graft
collection but, as shown, this affects the phenotype and function of NK cells received
by the patient. Maintaining normal levels of receptor expression at the surface of the
NK cells and retaining a high proportion of CD56dim NK cells may be important for
relapse protection. As such the generation of new haematopoietic stem cell
mobilisation agents presents a new factor to consider (Cashen et al. 2007; Devine et
al. 2008). Plerixafor, a CXCR4 antagonist which blocks the binding of SDF-1, a
chemokine expressed by bone marrow stromal cells, is now widely used to mobilise
CD34+ cells into the peripheral blood (De Clercq 2003). Plerixafor can promote
mobilisation of donor CD34+ cells in hours rather than days and has been used as a
strategy to improve the yield of stem cells from donors where mobilisation with G-
CSF was insufficient (Devine et al. 2008; Hauge et al. 2014; Gattillo et al. 2015).
Whilst plerixafor presents a potentially beneficial method of hematopoietic progenitor
cell collection its effect on the other stem cell graft cellular components needs to be
elucidated. Lundquist et al. found that T cell phenotype and function were not altered

223
in healthy donors mobilised with plerixafor and this resulted in higher rates of GvHD
in a murine transplant model (Lundqvist et al. 2013). Plerixafor preferentially
mobilises B cells, then T cells and finally NK cells of the lymphocyte compartment
however a direct effect on NK cells has not been investigated. Currently plerixafor
use in allo-HSCT is predominantly as a method to rescue poorly G-CSF mobilised
donors. In comparison between donors receiving G-CSF alone or G-CSF and
plerixafor there was no difference in the number of NK cells collected (Rutella et al.
2014). The effect on patient outcome also does not seem to be affected by the
addition of plerixafor in a trial of haploidentical HSCT (Jaiswal et al. 2018). Together
this suggests that plerixafor has little effect on the NK cell population collected in the
stem cell graft.
It is also important to note that analogues of G-CSF exist which can produce differing
effects on the cellular composition of a donor product and can influence GvHD and
GvL responses (Morris et al. 2004; Morris et al. 2005). Pegylated G-CSF has a
polyethylene glycol molecule attached which prolongs the half-life of the drug, whilst
also making it capable of mobilising murine CD34+ and PBMC to a greater number
and in a shorter timeframe than normal G-CSF (Molineux et al. 1999). When this
long acting G-CSF analogue is given to wildtype mice it results in the generation of
IL-10 producing regulatory T cells, which inhibit the alloreactive T cell response
following transplant and provide greater protection from GvHD compared to normal
G-CSF (Morris et al. 2004). Similarly, G-CSF analogues have been found capable of
expanding the donor NKT cell population, which when transferred in a murine model
of allogeneic transplantation enhanced host dendritic cell activation and T cell
alloreactivity (Morris et al. 2005). Multi-pegylated G-CSF improves this effect even
further, inducing greater numbers of progenitor and invariant NKT cells and
224
improving leukemic clearance in an in vivo murine model (Banovic et al. 2009). The
clinical outcomes from use of these long acting G-CSF analogues in humans is less
well studied. Pegylated-G-CSF is capable of mobilising CD34+ cells, albeit with
differential molecular and functional properties in comparison to unconjugated G-
CSF (Bruns et al. 2008). The effect on NK cells seems to be minimal and no
difference in the size of the NK cell population was seen in a small cohort of patients
with gynaecological malignancies who received normal or pegylated-G-CSF
(Bonanno et al. 2010). Multi-pegylated G-CSF had no greater effect on the number
of NK cells collected compared to the peg-G-CSF in mice (Banovic et al. 2009). This
suggests that whilst long acting G-CSF analogues may not impact upon the NK cell
population their ability to alter the donor T and NKT populations, which are beneficial
to a GvL response, may be of value. Trials using stem cell grafts from donors treated
with pegylated G-CSF have been performed, showing the feasibility and
comparability to normal G-CSF (Hill et al. 2006). However, the beneficial effects
seen in mice have not been shown in humans and therefore peg-G-CSF is not
commonly used in allo-HSCT.
Ensuring that alternative methods of stem cell graft collection also produce a
beneficial population of NK cells that will produce a GvL effect should be considered
before they are introduced into routine practice.
Influence of T cell depletion method on NK cell number and function
Another important consideration is the method used for T cell depletion.
Alemtuzumab and ATG are two commonly used approaches and the use of these
different drugs may have a differential effect on the NK cell population infused into
the patient. Murine models suggest that ATG may lyse more lymphocytes within

225
secondary lymphoid tissues compared to alemtuzumab (Mohty 2007; Hu et al.
2009). This might therefore be expected to affect the role of NK cells in interacting
with residual tumour cells and other immune cells at these sites. Alemtuzumab
markedly depletes T cells within the peripheral circulation and is highly effective at
reducing rates of GvHD whilst maintaining some degree of GvL.
T cell depletion was given directly to the patient in our cohort (in vivo depletion) and
therefore contrasts with direct ex vivo T cell depletion of the stem cell graft which can
also be used as a GvHD prophylaxis method (Novitsky et al. 2005). Use of
alemtuzumab with this latter method of T cell depletion may potentially have a more
detrimental effect on the NK cell population within the stem cell graft despite
expression of CD52 on NK cells being lower than on other lymphocytes (Figure
5.10). PBMC taken from filgrastim (a recombinant form of G-CSF)-mobilised donors
and subjected to increasing concentrations of alemtuzumab in vitro for 30 minutes
effectively depleted CD3+ T cells at a 0.001mg/ml dose whilst also reducing the NK
cell population by around 50% (Novitsky et al. 2013). The concentration of
alemtuzumab used ex vivo is usually 10-20mg, which would create a far higher
concentration than that shown in vitro and is therefore likely to lower the dose of NK
cells received by patients within the stem cell graft. However higher concentrations
did not further diminish the NK cell population in Novitsky’s experiments, which may
reflect the lower CD52 expression on NK cells. Additionally, whilst the serum
concentration of alemtuzumab can remain at high levels post-transplant for a longer
period of time when given in vivo rather than when received with the graft, NK cell
reconstitution is clearly still able to thrive in this environment (Morris et al. 2003).
Together this suggests that the use of ex vivo T cell depletion within the stem cell
graft may suppress the beneficial effects against disease relapse mediated by

226
inadvertently reducing the initial dose of NK cells present. As shown, T cell depletion
in vivo does allow a beneficial stem cell graft NK cell effect to occur in a dose
dependent manner. An adequate comparison of the two methods of T cell depletion
would be needed to test their influence over the NK cell population in the early post-
transplant period.
Alternative methods of stem cell graft manipulation ex vivo that do not deplete the
NK cell population may be more effective. For example, the use of αβ+ T cell and
CD19+ B cell-depleted stem cell grafts, which retain mature alloreactive NK cells,
are in clinical trials after proving to be a viable transplant regimen with beneficial
patient outcomes in the haploidentical paediatric transplant setting (Locatelli et al.
2017).
Impact of post-transplant factors on NK cell function
As mentioned before, CMV reactivation has been found to associate with a reduced
rate of disease relapse in some AML cohorts, but this effect has not generally been
observed with other malignancies (Green et al. 2013). CMV reactivation leads to an
increase in the number of CD56dim NK cells with a memory phenotype within the
blood (Foley et al. 2012; Della Chiesa et al. 2013). This is one example of how an
environmental influence can shape the peripheral NK cell repertoire post-transplant
and it is therefore important to consider potential factors that could modulate the
activity of the NK cell populations that are infused at the time of transplant.
The chimerism status of the host is one such factor that needs to be considered.
Within a variable time period following successful allo-HSCT, the patient’s immune
system will come to be either fully derived from the donor or develop a mixture of
host and donor cells termed ‘mixed chimerism’. This is particularly common within

227
the T cell compartment where mixed chimerism is frequently present following T cell
depleted RIC allo-HSCT and is thought to confer greater protection from GvHD as a
weaker alloreactive T cell response is produced (Huss et al. 1996). The effect of
mixed chimerism on the rate of disease relapse however is less clear. In some
instances mixed chimerism has been found not to impact upon relapse rates,
whereas in others it has (van Besien et al. 2009; Nikolousis et al. 2013; Koreth et al.
2014). These differences may be due to the extent of T cell depletion received and
the time point at which the chimerism was measured, however a detrimental effect
on alloreactive T cell response is certain. It is possible that the increased ratio of
regulatory T cells to effector cells that is observed in early mixed chimerism, and
which prevents activation of dendritic cells, may suppress GvL (Kinsella et al. 2018 –
manuscript in preparation). In such circumstances NK cell expansion might then be
sub-optimal, further limiting establishment of a GvL effect. (Toubai et al. 2014).
Kinsella et al recently assessed a cohort of 212 T cell-depleted RIC allo-HSCT
patients based upon total PBMC and T cell chimerism at one to two months post-
transplant (Kinsella et al. 2014). Patients who had PBMC chimerism >99%, but T-cell
chimerism <98% were termed ‘split chimerism’ and displayed similar overall survival
to the full chimerism patients whilst the mixed chimerism group (<98% in both PBMC
and T cell compartments) displayed significantly worse outcomes. Mixed chimerism
patients at day 50 post-transplant also showed a significantly higher risk of relapse.
The difference between the split and mixed chimerism patients could relate to
differential activity within the NK cell population of the PBMC compartment and this
is currently under investigation.
Chan et al. performed microsatellite NK cell chimerism in three patients at our
institution at day 14 post-transplant (Chan et al. 2018). The NK cells present in the

228
peripheral blood of all patients were entirely donor. Jiang et al. tracked NK cell
chimerism following allo-HSCT in a cohort of 153 patients (Jiang et al. 2015) and
observed a significant drop off in donor chimerism of peripheral blood NK cells one
or two weeks prior to relapse in non-B-ALL patients. Therefore, monitoring the NK
cell chimerism following allo-HSCT may be an important factor for predicting patient
outcomes and our understanding of their effect on GvL.
It is also important to note that post-transplant donor lymphocyte infusions (DLI) may
be utilised when patients are in mixed chimerism as this is associated with a
reduction in the risk of disease relapse (Marijt et al. 2006; von dem Borne et al.
2007). The role that NK cells play in DLI-associated responses needs to be
assessed however. Within our cohort only 15 patients received a DLI. Of those 12
received DLI due to the presence of mixed chimerism with the remaining three
receiving the cells due to molecular disease relapse. Of the three patients who
received the DLI due to relapse all subsequently were deceased within a year, two
from disease relapse and one from GvHD. The impact of receiving a DLI for mixed
chimerism on disease relapse within this cohort was seemingly quite positive. Ten
out of the twelve patients were alive at two years post-transplant. Four of the twelve
patients received an original transplant with a low NK cell dose, only one of whom
went on to relapse. Determining the impact that the NK cell dose plays in this context
is currently unclear but represents an exciting opportunity for future study. A large
cohort in which assessment of the DLI composition was undertaken, and correlated
with clinical response, could provide more insight into this question.

229
Potential clinical applications
The potential benefits of using NK cells in the treatment of haematological
malignancies are clear, yet evaluating suitable strategies to harness these effects
are still under intense investigation (Cooley et al. 2018; Bachanova & Miller 2014).
The data presented in this thesis has the potential to influence donor selection, stem
cell graft composition and the ability to predict patient relapse within two weeks of
allo-HSCT. It also provides insight into further ways to manipulate adoptively
transferred NK cells and our understanding of the role NK cells play in producing a
GvL effect.
Firstly, it may be worth applying a NK cell threshold of 6.3 x 10⁶ cells per kg for
patients undergoing T-cell depleted allo-HSCT within the context of a prospective
clinical trial. Harvested donor CD34+ haemopoietic stem cells are already
enumerated following collection, and the additional assessment of CD3-CD56+ cells
should therefore be feasible. Where NK cell dose is inadequate, a second
aphaeresis procedure may be possible, as up to 2 x 10⁷ NK cells per kg can be
obtained from a single donor lymphapheresis (Miller et al. 2005). As mentioned
above, the use of G-CSF would be necessary to achieve this. Alternatively the
production of large numbers of activated NK cells expanded ex vivo could be used
as an ‘off the shelf’ treatment alongside allo-HSCT (Baggio et al. 2017; Boyiadzis et
al. 2017).
NK cells for adoptive transfer can be sourced in several ways, either directly from
cord or peripheral blood, or differentiated from CD34+ progenitor cells. NK cells
differentiated from cord blood CD34+ cells are effective killers of target cells when
either resting or following CTV-1 tumour cell line priming or IL-2 stimulation in vitro,

230
comparable to peripheral or cord blood NK cells (Domogala et al. 2017). They can
be produced in large numbers, retain their function following cryopreservation and
have longer telomeres and a less terminally differentiated phenotype than peripheral
blood NK cells, suggesting they may continue to proliferate well in vivo.
Alternatively, cell lines established from patients with clonal NK cell lymphoma
provide a source of cytotoxic and genetically manipulatable NK cells. In particular
NK-92 has been safely given to patients and has been shown to confer a clinically
significant response in several solid tumours and haematological malignancies
(Klingemann et al. 2016). This population of pure and activated continually growing
NK cells that can easily be manipulated to acquire specific targeting potential
provides an ‘off the shelf’ adoptive NK cell transfer option that has several
advantages over NK cells collected from patient or donor peripheral blood.
Determining the best time to give additional NK cells is also important. NK cells given
in isolation are capable of persisting when patients receive intense conditioning
(Miller et al 2005). When received as part of the stem cell graft they can also persist
but as in vitro culture of NK cells with leukemic blasts leads to the downregulation of
DNAM, it suggests that donor NK cells in the presence of residual tumour within the
host may eventually succumb to immune evasion mechanisms (Sanchez-Correa et
al. 2011). Therefore the infusion of additional NK cells post-transplant may also
prove beneficial enhancing upon the work performed by the initial stem cell graft NK
cell population and could be used as a rescue strategy for patients with poor NK cell
reconstitution. NK cells can be safely given in this context however larger trails are
needed to prove the effectiveness of this procedure (Shaffer et al. 2016).

231
It is also worth noting that weight-based dosing may not be the best method of
determining the quantity of cells that should be given. Immune cells are not a drug
that may diffuse evenly throughout the body, they will traffic to different locations and
can accumulate differentially in various tissues. As shown there was not a correlation
between the dose of cells given and the numbers in the peripheral blood at two
weeks post-transplant. The ability for cells to be accepted within the host requires
there to be ‘space’ available, which is determined by patient-specific factors and the
effectiveness of the conditioning regimen used.
I am interested in the potential to create a mathematical model that could predict
patient outcomes based upon early immune cell reconstitution dynamics. If validated,
clinicians could use this to estimate a patients’ recovery following allo-HSCT and
intervene to prevent aGvHD or relapse at an early stage should the model indicate
that an event is likely to occur. This could potentially be based on assessment of cell
number, cellular phenotypes and cytokine serum levels. Whilst this could be an
effective way to give a general estimate of the probability of a patient outcome, it
would need to be proven to be highly predictive for individual patients.
Enhancement of the priming of NK cells is another method where a beneficial
application could potentially be developed. The identification of DNAM as an
important NK cell receptor for protection against relapse post allo-HSCT makes it an
ideal therapeutic target. Donor selection based upon high DNAM expression, or the
application of immunotherapeutic methods to enhance DNAM specific killing, are
worthy of further investigation. Similarly, attempts to increase DNAM ligand
expression in patients could be explored. Nitric oxide can increase CD155
expression on multiple myeloma tumour cell lines although it is also thought to
negatively regulate haematopoietic progenitor cell proliferation and would therefore

232
require careful consideration in the allo-HSCT setting (Fionda et al. 2015; Michurina
et al. 2004). Bortezomib, a proteozome inhibitor used in the treatment of multiple
myeloma, has been shown at low doses to increase the expression of DNAM and
NKG2D ligands on the surface of multiple myeloma cell lines. This causes increased
NK cell functionality against them (Niu et al. 2017). Application of this drug in
combination with stem cell transplantation may therefore lead to enhanced DNAM
specific killing of tumour cells. Alternatively T cell immunoreceptor with Ig and ITIM-
domains (TIGIT) is an inhibitory receptor expressed on NK cells which shares the
same ligands as DNAM (Yu et al. 2009; Stanietsky et al. 2009). Blockade of TIGIT
can improve NK cell cytokine secretion and cytotoxicity in a murine model and could
therefore also be used as a way to increase the effectiveness of DNAM in allo-HSCT
(Stanietsky et al. 2013).
Donor KIR and recipient MHC class I expression mismatching is thought to result in
a population of alloreactive NK cells. This criteria is often taken into account when
determining patients for haploidentical transplantation. KIR typing has been available
for over 20 years, but this method does not reliably pick up on subtle allelic
differences (Uhrberg et al. 1997). The development of high throughput, next
generation sequencing methods allow more in depth KIR typing and once brought
into the clinical setting may allow for greater donor patient selection for HLA matched
allo-HSCT (Maniangou et al. 2017).
Similarly, the isolation and expansion of specific NK cell products for patients with
discrete KIR genotypes could provide an immediate source of alloreactive NK cells
that could be administered as an immunotherapy. This source of NK cell therapy is
being explored in an autologous transplant setting for treatment of multiple myeloma.
HLA mismatched NK cells expanded from umbilical cord blood can safely be

233
administered to patients receiving high dose melphalan, which allows space for
homeostatic proliferation, and lenalidomide which is thought to provide an activating
effect to the infused NK cells (Snowden & Hill 2017; Shah et al. 2017). The
adoptively transferred NK cells could be detected at 26 days, a time frame within
which our data suggests is suitable for a GvL response to be influential. This therapy
may provide elimination of residual tumour whilst carrying no risk of GvHD. The
curative potential however is still under consideration and requires greater numbers
of patients to power the study.
Cytokines have been effectively used to activate NK cells when adoptively
transferred, in particular IL-2 given intravenously following the infusion (Miller et al.
2005). The addition of IL-2 promotes changes in cytokine and NK cell population
dynamics, however the effectiveness of patients receiving IL-2 stimulation compared
to those whose NK cells are unstimulated has not been definitively shown to impact
upon clinical outcomes (Brehm et al. 2011). IL-2 administration also results in an
expansion of host Treg cells which may have a detrimental effect on the immune
response (Bachanova & Miller 2014). IL-15 is also an effective activator of NK cells
and can rapidly expand NK cell numbers in the peripheral blood, but does not initiate
the same Treg stimulation (Conlon et al. 2015). The use of IL-15 alone or the IL-15-
based superagonist ALT-803 following adoptive transfer of NK cells is under
investigation (Wong et al. 2013; Davis et al. 2015).
Alternative ways to activate and enhance NK cells besides the use of cytokines
include NK cell priming through prior exposure to tumour cells such as leukaemia
cell lines (North et al. 2007; Sabry et al. 2011). This priming occurs via NK cell CD2
binding to a CD15 ligand on the tumour cell. These cells can be given safely and in a

234
trial of seven patients who received NK cells from haploidentical donors primed in
this way a GvL effect was potentially produced in four cases (Kottaridis et al. 2015).
The rapid maturation of NK cells to create a population of CD57+ cells, which are
functionally more cytotoxic and greater producers of TNF-α and IFN-γ, can be
achieved through inhibition of GSK3 kinase and expansion with IL-15 (Cichocki et al.
2017). Adoptive transfer of a population of mature or ‘memory-like’ NK cells may
have the same potential benefit as the expansion of CD56dimCD57+NKG2C+ NK
cells seen in CMV infection and protection from disease relapse when reactivation
occurs post-transplant (Green et al. 2013; Cichocki et al. 2015).
The artificial activation of NK cells to create an expanded population of primed cells
is thought to contribute towards beneficial outcomes through the improved
cytotoxicity and a greater number of cells expanded within the host. Our data
supports this from an unstimulated standpoint however further manipulation of stem
cell graft or post-transplant cytokine application may be able to enhance the effect of
NK cells in allo-HSCT.
Tumour cell killing can also be enhanced by the blockade of inhibitory receptors at
the surface of NK cells when the target cells still express MHC class I (Vahlne et al.
2010). Attempts to improve outcomes in AML and multiple myeloma patients through
KIR2D blockade, potentially creating a population of alloreactive NK cells, have
shown clinical safety and increased cytokine and NK cell activation but no outcome
effects so far (Vey et al. 2012; Benson et al. 2012; Korde et al. 2014). Similarly
blockade of the CD94:NKG2A receptor is also under investigation as it has been
shown to improve NK cell cytotoxicity of CLL patients as well as haploidentically
transferred NK cells in vitro (Nguyen et al. 2005; McWilliams et al. 2016).

235
The use of PD-1 blockade has been shown to produce a beneficial GvL response in
pre-clinical murine models (Koestner et al. 2011; Michonneau et al. 2016). This has
led to PD-1 blockade being utilised across a range of haematological malignancies
(Ansell et al. 2015; Younes et al. 2016; Lesokhin et al. 2016). In the context of allo-
HSCT anti-PD-1 monoclonal antibodies are being tested as a treatment strategy in
relapsed patients following transplant (Haverkos et al. 2017). In these circumstances
the PD-1 blockade is used primarily as a way to improve T cell antitumor response,
however this is often accompanied by increased GvHD related mortality. The effects
this has on the NK cells present are less well studied. Our data suggests that PD-1
expression on NK cells in G-CSF mobilised stem cell grafts is generally increased
and that this has a negative impact on the cytotoxic capability of these cells.
Therefore, pre-infusion graft manipulation or application of PD-1 blockade early post-
transplant could provide beneficial functional effects to the NK cells while not
influencing the poorly reconstituted T cell compartment. Indeed adoptive transfer of
NK cells expanded from peripheral blood have been shown to produce improved
killing of multiple myeloma cells in a murine model with PD-1 blockade (Guo et al.
2016). This strategy needs to be tested in an allo-HSCT transplant setting but could
have the potential to improve the NK cell related GvL effect.
Expression of CD16, the low affinity Fc receptor, on NK cells can also be
manipulated to influence NK cell function and patient outcomes. Differing allotypes of
this receptor produce different affinities for IgG however and this can result in
functional effects. NK cells from VV and VF versus FF genotype donors show
greater affinity for rituximab the anti-CD20 IgG1 monoclonal antibody utilised in
several B cell lymphomas (Congy-Jolivet et al. 2008). Therefore donor selection of
appropriate FcR genotype may improve the ADCC ability of NK cells infused at the
236
time of allo-HSCT. Expression of CD16 on stem cell graft NK cells was significantly
reduced in comparison to peripheral blood cells. ADAM17 is a metalloprotease which
is required for CD16 shedding from the cell surface (Romee et al. 2013). Inhibition of
ADAM17 retains CD16 and results in increased CD16-mediated ADCC. Use of
ADAM17 inhibition could be tested in donors receiving G-CSF mobilisation to
establish whether it could maintain the presence of CD16 at the surface of NK cells
within the apheresis product. However CD16 expression on stem cell graft NK cells
did not have an effect upon patient outcome which may indicate that ADCC does not
have a significant role to play in an lymphodepleted individual early post-transplant.
Therefore a greater propensity for stem cell graft NK cells to perform ADCC may
only be likely to improve patient outcome in allo-HSCT when combined with
monoclonal antibody therapy.
CD16 is also being utilised in the production of bi-specific killer engagers (BiKEs).
These ex vivo generated molecules comprise of two variable antibody regions, one
which binds to a tumour antigen and the other to a receptor on the NK cell surface.
In particular antiCD16xCD33 has been effectively tested against myeloid tumour
cells in vitro (Gleason et al. 2014; Wiernik et al. 2013). Further development of this
molecule with the addition of IL-15 produces a trispecific killer engager (TriKE) which
improves the functional, proliferative and survival capabilities of NK cells in a murine
model of AML (Vallera et al. 2016). A CD16/IL-15/CD33 TriKe for CD33+
haematological malignancies is currently in clinical trials. The use of TriKEs in
combination with ADAM17 inhibition could be an effective way to enhance stem cell
graft NK cells in allo-HSCT.
The development of chimeric antigen receptor (CAR) technology, which has
predominantly been applied to T cells also has potential with NK cells. In fact CAR

237
NK cells actually have several advantages over CAR T cells such as a shorter life
span in vivo, less potency to cause a GvHD reaction, they are not CAR restricted in
their killing mechanism and they are capable of serial target cell killing (Klingemann
2014). By genetically engineering synthetic receptors into immune cells it can greatly
improve their specificity against a defined ligand. This is achieved through
transfection of DNA which can be performed on peripheral blood NK cells, NK cell
lines or NK cells derived from pluripotent stem cells (Hermanson & Kaufman 2015).
The efficiency of viral transfection in peripheral blood NK cells however is relatively
poor (Sutlu et al. 2012). The NK-92 cell line is more easily transfected than primary
cells and several CAR engineered NK-92 cells have been produced against varying
targets with successful results in vitro. Anti-CD19-CAR NK-92 cells that are effective
killers of CD19 expressing leukaemia targets with no change in their cytotoxicity
against CD19 negative cells have been produced (Romanski et al. 2016). Similarly
CAR engineered NK-92 cells have been created against target ligands found on
lymphoid malignancies, multiple myeloma and several solid tumours (Boissel et al.
2013; Müller et al. 2008; Yang et al. 2005; Chu et al. 2014). Several CAR NK cell
therapies are currently in clinical trials including one against NKG2D-ligand
expressing cancer cells. Whilst the transfer of CAR NK cells against specific cancer
ligands may assist in the treatment of haematological malignancies a DNAM-ligand
targeting CAR NK cell may also produce longer term beneficial effects in
combination with allo-HSCT.
It may also be important to regulate any NK cells that are being adoptively
transferred, especially if they have been modified in some way. They may be useful
in producing a GvL response and providing protection from infections in the
238
immediate aftermath of allo-HSCT but their continual persistence may have a
detrimental effect on healthy reconstitution.
Most of the current trials involving the adoptive transfer of NK cells are looking to
harness a short term GvL effect where the NK cell given are primed and therefore
more adept at directly eliminating residual tumour in the host. Data presented in this
thesis adds to the backing of this theory, however also suggests that treatments to
enhance the longer term reconstitution of NK cells within a patient influencing the
overall immune response may be the key to curing patients rather than just a short
term beneficial effect. Adoptive transfer of NK cells alone does not seem to produce
substantial long term results suggesting that the beneficial effects of allo-HSCT as a
whole are also important and that the role of NK cells in the stem cell graft are
necessary to allow time for this to generate and promote their effects.
Allo-HSCT is developing towards a much more individualised treatment and it is
becoming clear that stratification of transplant conditioning and post-transplant
management can help to improve clinical outcomes. This may benefit from
assessment of immune measures that optimise NK cell engraftment. However,
determining the best method of harnessing the beneficial effect of NK cells in allo-
HSCT still requires more understanding of their basic biology and the fundamental
mechanisms of GvL.
Strengths and limitations of this study My access to a large and relatively uniform cohort of T cell depleted transplant
recipients and ability to collect clinically relevant samples was excellent. Peripheral

239
blood samples collected during the first month post-transplant allowed for
measurement of reconstitution during this early time period. However, the low
cellularity at these early time points and ethical restrictions on the volume of blood to
be collected meant that calculations of cell numbers, at day 0 and day 7 particularly,
must be treated cautiously.
Residual cells collected from the infusion bag following transfer into the patient were
used to assess the cellular composition of the stem cell graft. The cells in these
samples were often adhesive to one another and would on occasion require filtering,
especially following cryopreservation. This complicated analysis of some flow
cytometric panels and the ability to obtain sufficient cells for cytotoxic assays.
Obtaining “fresh” stem cell graft samples prior to infusion would reduce this concern
but would require further ethical approval.
All samples were collected over the course of three years and therefore correlations
with clinical outcomes were limited by the time since transplantation. Whilst aGvHD,
by definition, develops within 100 days post allo-HSCT, relapse usually occurs 6
months to a year later (Tauro et al. 2005). Within my analysis cohort, survival could
be assessed for all patients at 1-year post transplant which will capture most
episodes of relapse. Despite this, assessment of survival over a longer time period
would be a valuable measurement.
This project benefited from being able to use clinically relevant samples from a
relatively large cohort of patients undergoing allo-HSCT, however it must also be
noted that there was a large range of disease, patient and donor characteristics.
Over the course of the study transplant procedures at the hospital have been
consistent, as well as the leading personnel who decide upon the actions for each

240
patient, maintaining a level of reliability in transplant management. Whilst many
clinical factors are beyond the control of the researcher it is important to be aware of
them when trying to undertake analysis.
The majority of data acquired in the research was obtained through multicolour flow
cytometry. Whilst this permits analysis of many thousands of cells per sample, the
major limitation is the finite number of markers that can be analysed and the
complicated compensation entailed, plus the subjective nature of the analysis which
accompanies increases in this number. Whilst the analysis was validated, some
degree of human error is likely. In future analyses, the development of automated
flow gating software to more reliably assess the data, especially with increases in
markers identified, will be useful to remove the subjective element of analysis
(Verschoor et al. 2015).
Overall findings
It was hypothesised that the impact of NK cells on transplant outcome was most
likely to be observed during the first month after T cell-depleted transplantation.
We set out to appraise this and found that:
• NK cells reconstitute quicker and in greater volume than T cells after T cell
deplete allo-HSCT, with high numbers of NK cells in the peripheral blood at
two weeks associating with protection from relapse.
• NK cells derived from the stem cell graft are phenotypically and functionally
different to those derived from the peripheral blood of healthy individuals with
reduced cytotoxic capacity and an enhanced immature population.

241
• High CD56dim NK cell dose in the stem cell graft associates with protection
from disease relapse following allo-HSCT, suggesting an NK cell mediated
role in GvL produced by these cells.
• High frequency of DNAM expression on CD56dim NK cells in the stem cell
graft associates with relapse protection following allo-HSCT, indicating that an
effective GvL effect may by partially produced through DNAM mediated
cytotoxicity.
My findings therefore support the beneficial effect of using large numbers of NK cells
within a stem cell graft during T cell depleted allo-HSCT.
Concluding remarks
The ethical and logistical restrictions of translational research make it a challenging
undertaking, but an incredibly rewarding one when progress is achieved. Allogeneic
hemopoietic stem cell transplantation is a complicated treatment given for a large
range of haematological malignancies. The large degree of variability in this process
can produce seemingly contradictory results and separating out the differing effects
and influences of the factors involved is important in improving our knowledge of how
best to apply this treatment. Compiling and sharing information from transplant
centres across the world is the only way to continually improve this treatment which
benefits the lives of thousands of patients worldwide each year. The work in this
thesis has hopefully made a useful contribution to this scientific area which can be
built upon to improve patient outcomes.

242
References
Akdis, C.A. & Blaser, K., 2001. Mechanisms of interleukin-10-mediated immune suppression. Immunology, 103(2), pp.131–6.
Alexandrov, L.B. et al., 2013. Signatures of mutational processes in human cancer. Nature, 500(7463), pp.415–421.
Alousi, A.M. et al., 2013. Who is the better donor for older hematopoietic transplant recipients: an older-aged sibling or a young, matched unrelated volunteer? Blood, 121(13), pp.2567–73.
Alter, G., Malenfant, J.M. & Altfeld, M., 2004. CD107a as a functional marker for the identification of natural killer cell activity. Journal of immunological methods, 294(1–2), pp.15–22.
Alter, G., Malenfant, J.M. & Altfeld, M., 2004. CD107a as a functional marker for the identification of natural killer cell activity. Journal of Immunological Methods, 294, pp.15–22.
de Andrade, L.F., Smyth, M.J. & Martinet, L., 2014. DNAM-1 control of natural killer cells functions through nectin and nectin-like proteins. Immunology and Cell Biology, 92(3), pp.237–244.
Anegón, I. et al., 1988. Interaction of Fc receptor (CD16) ligands induces transcription of interleukin 2 receptor (CD25) and lymphokine genes and expression of their products in human natural killer cells. The Journal of experimental medicine, 167(2), pp.452–72.
Anfossi, N. et al., 2006. Human NK Cell Education by Inhibitory Receptors for MHC Class I. Immunity, 25(2), pp.331–342.
Anguille, S. et al., 2015. Interleukin-15 Dendritic Cells Harness NK Cell Cytotoxic Effector Function in a Contact- and IL-15-Dependent Manner N. Lapteva, ed. PLOS ONE, 10(5), p.e0123340.
Ansell, S.M. et al., 2015. PD-1 Blockade with Nivolumab in Relapsed or Refractory Hodgkin’s Lymphoma. New England Journal of Medicine, 372(4), pp.311–319.
Antoun, A. et al., 2012. The genotype of RAET1L (ULBP6), a ligand for human NKG2D (KLRK1), markedly influences the clinical outcome of allogeneic stem cell transplantation. British journal of haematology, 159(5), pp.589–98.
Apoil, P.A. et al., 2017. Reference values for T, B and NK human lymphocyte subpopulations in adults. Data in Brief, 12, pp.400–404.
Armand, P. et al., 2012. A disease risk index for patients undergoing allogeneic stem cell transplantation. Blood, 120(4), pp.905–13.
Asai, O. et al., 1998. Suppression of graft-versus-host disease and amplification of graft-versus-tumor effects by activated natural killer cells after allogeneic bone marrow transplantation. The Journal of clinical investigation, 101(9), pp.1835–42.

243
Asou, H. et al., 1991. Establishment of a human acute myeloid leukemia cell line (Kasumi-1) with 8;21 chromosome translocation. Blood, 77(9), pp.2031–6.
Ayuk, F.A. et al., 2016. Impact of Donor-Recipient Histocompatibility and CMV-Mismatch on Outcome of Allogeneic Stem Cell Transplantation for AML and MDS: A Retrospective Registry Study of the German Stem Cell Transplant Registry (DRST) of the German Working Group for Blood and …. Blood, 128(22).
Bachanova, V. & Miller, J.S., 2014. NK cells in therapy of cancer. Critical reviews in oncogenesis, 19(1–2), pp.133–41.
Bacigalupo, A. et al., 2001. Antithymocyte globulin for graft-versus-host disease prophylaxis in transplants from unrelated donors: 2 randomized studies from Gruppo Italiano Trapianti Midollo Osseo (GITMO). Blood, 98(10), pp.2942–7.
Bacigalupo, A., Van Lint, M.T., et al., 1991. Increased risk of leukemia relapse with high-dose cyclosporine A after allogeneic marrow transplantation for acute leukemia. Blood, 77(7), pp.1423–8.
Bacigalupo, A. et al., 2004. Reducing transplant-related mortality after allogeneic hematopoietic stem cell transplantation. Haematologica, 89(10), pp.1238–47.
Baggio, L. et al., 2017. Natural killer cell adoptive immunotherapy: Coming of age. Clinical Immunology, 177, pp.3–11.
Baldomero, H. et al., 2011. The EBMT activity survey 2009: trends over the past 5 years. Bone Marrow Transplantation, 46(4), pp.485–501.
Balkwill, F., 2009. Tumour necrosis factor and cancer. Nature Reviews Cancer, 9(5), pp.361–371.
Ballen, K., 2017. Umbilical Cord Blood Transplantation: Challenges and Future Directions. Stem cells translational medicine, 6(5), pp.1312–1315.
Banovic, T. et al., 2009. Donor Treatment with a Multipegylated G-CSF Maximizes Graft-versus-Leukemia Effects. Biology of Blood and Marrow Transplantation, 15(1), pp.126–130.
Barnes, D.W.H. et al., 1956. Treatment of Murine Leukaemia with X Rays and Homologous Bone Marrow. BMJ, 2(4993).
Baron, F. et al., 2005. High doses of transplanted CD34+ cells are associated with rapid T-cell engraftment and lessened risk of graft rejection, but not more graft-versus-host disease after nonmyeloablative conditioning and unrelated hematopoietic cell transplantation. Leukemia, 19(5), pp.822–828.
Barrett, A.J. & Battiwalla, M., 2010. Relapse after allogeneic stem cell transplantation. Expert review of hematology, 3(4), pp.429–41.
Bauer, S. et al., 1999. Activation of NK cells and T cells by NKG2D, a receptor for stress-inducible MICA. Science (New York, N.Y.), 285(5428), pp.727–9.
Bauer, S. et al., 1999. Activation of NK Cells and T Cells by NKG2D, a Receptor for Stress-Inducible MICA. Science, 285(5428).
Beatty, G.L. & Gladney, W.L., 2015. Immune escape mechanisms as a guide for

244
cancer immunotherapy. Clinical cancer research : an official journal of the American Association for Cancer Research, 21(4), pp.687–92.
Becknell, B. & Caligiuri, M.A., 2005. Interleukin-2, Interleukin-15, and Their Roles in Human Natural Killer Cells. In Advances in immunology. pp. 209–239.
Bendall, L.J. & Bradstock, K.F., 2014. G-CSF: From granulopoietic stimulant to bone marrow stem cell mobilizing agent. Cytokine & Growth Factor Reviews, 25(4), pp.355–367.
Benjamin, J.E., Gill, S. & Negrin, R.S., 2010. Biology and clinical effects of natural killer cells in allogeneic transplantation. Current opinion in oncology, 22(2), pp.130–7.
Bensinger, W. et al., 1993. Autologous transplantation with peripheral blood mononuclear cells collected after administration of recombinant granulocyte stimulating factor. Blood, 81(11).
Bensinger, W.I., 2012. Allogeneic transplantation: peripheral blood vs. bone marrow. Current opinion in oncology, 24(2), pp.191–6.
Benson, D.M. et al., 2012. A phase 1 trial of the anti-KIR antibody IPH2101 in patients with relapsed/refractory multiple myeloma. Blood, 120(22), pp.4324–33.
Benson, D.M. et al., 2010. The PD-1/PD-L1 axis modulates the natural killer cell versus multiple myeloma effect: A therapeutic target for CT-011, a novel monoclonal anti-PD-1 antibody. Blood, 116, pp.2286–2294.
Bernardini, G. et al., 2008. CCL3 and CXCL12 regulate trafficking of mouse bone marrow NK cell subsets. Blood, 111(7), pp.3626–34.
van Besien, K. et al., 2009. Patterns and kinetics of T-cell chimerism after allo transplant with alemtuzumab-based conditioning: mixed chimerism protects from GVHD, but does not portend disease recurrence. Leukemia & Lymphoma, 50(11), pp.1809–1817.
van Besien, K. et al., 2003. Regimen-related toxicity after fludarabine–melphalan conditioning: a prospective study of 31 patients with hematologic malignancies. Bone Marrow Transplantation, 32(5), pp.471–476.
Bhat, R. & Watzl, C., 2007a. Serial killing of tumor cells by human natural killer cells--enhancement by therapeutic antibodies. PloS one, 2(3), p.e326.
Bhat, R. & Watzl, C., 2007b. Serial killing of tumor cells by human natural killer cells--enhancement by therapeutic antibodies. PloS one, 2, p.e326.
Bi, J. & Tian, Z., 2017. NK Cell Exhaustion. Frontiers in immunology, 8, p.760.
Biron, C.A., Byron, K.S. & Sullivan, J.L., 1989. Severe Herpesvirus Infections in an Adolescent without Natural Killer Cells. New England Journal of Medicine, 320(26), pp.1731–1735.
Björklund, A.T. et al., 2010. NK cells expressing inhibitory KIR for non-self-ligands remain tolerant in HLA-matched sibling stem cell transplantation. Blood, 115(13), pp.2686–94.
Le Blanc, K. et al., 2009. Lymphocyte recovery is a major determinant of outcome

245
after matched unrelated myeloablative transplantation for myelogenous malignancies. Biology of blood and marrow transplantation : journal of the American Society for Blood and Marrow Transplantation, 15(9), pp.1108–15.
Bleakley, M. & Riddell, S.R., 2004. Molecules and mechanisms of the graft-versus-leukaemia effect. Nature Reviews Cancer, 4(5), pp.371–380.
Boieri, M. et al., 2016. The Role of Animal Models in the Study of Hematopoietic Stem Cell Transplantation and GvHD: A Historical Overview. Frontiers in immunology, 7, p.333.
Boissel, L. et al., 2013. Retargeting NK-92 cells by means of CD19- and CD20-specific chimeric antigen receptors compares favorably with antibody-dependent cellular cytotoxicity. OncoImmunology, 2(10), p.e26527.
Bonanno, G. et al., 2010. Effects of pegylated G-CSF on immune cell number and function in patients with gynecological malignancies. Journal of translational medicine, 8, p.114.
von dem Borne, P.A. et al., 2007. Donor Lymphocyte Infusion for Mixed Chimerism or Residual Disease after Reduced-Intensity T Cell Depleted Stem Cell Transplantation Results in Conversion to Full Donor Chimerism Combined with Graft Versus Tumor Responses and Limited GVHD. Blood, 110(11).
Bornhäuser, M. et al., 2004. Role of KIR ligand incompatibility in hematopoietic stem cell transplantation using unrelated donors. Blood, 103(7), p.2860–1; author reply 2862.
Bottino, C. et al., 2003. Identification of PVR (CD155) and Nectin-2 (CD112) as cell surface ligands for the human DNAM-1 (CD226) activating molecule. The Journal of experimental medicine, 198(4), pp.557–67.
Boyiadzis, M. et al., 2017. Phase 1 clinical trial of adoptive immunotherapy using “off-the-shelf” activated natural killer cells in patients with refractory and relapsed acute myeloid leukemia. Cytotherapy, 19(10), pp.1225–1232.
Braud, V.M. et al., 1998. HLA-E binds to natural killer cell receptors CD94/NKG2A, B and C. Nature, 391(6669), pp.795–799.
Brehm, C. et al., 2011. IL-2 Stimulated but Not Unstimulated NK Cells Induce Selective Disappearance of Peripheral Blood Cells: Concomitant Results to a Phase I/II Study F. Dieli, ed. PLoS ONE, 6(11), p.e27351.
Brenner, C.D. et al., Requirements for control of B-cell lymphoma by NK cells.
Bruns, I. et al., 2008. Pegylated granulocyte colony-stimulating factor mobilizes CD34+ cells with different stem and progenitor subsets and distinct functional properties in comparison with unconjugated granulocyte colony-stimulating factor. Haematologica, 93(3), pp.347–355.
Brunstein, C.G. et al., 2010. Allogeneic hematopoietic cell transplantation for hematologic malignancy: relative risks and benefits of double umbilical cord blood. Blood, 116(22), pp.4693–4699.
Bryan, L.J. & Gordon, L.I., 2015. Blocking tumor escape in hematologic malignancies: The anti-PD-1 strategy. Blood Reviews, 29(1), pp.25–32.

246
Bryceson, Y.T. et al., 2006. Activation, coactivation, and costimulation of resting human natural killer cells. Immunological Reviews, 214(1), pp.73–91.
Bryceson, Y.T. et al., 2005. Cytolytic granule polarization and degranulation controlled by different receptors in resting NK cells. The Journal of Experimental Medicine, 202(7), pp.1001–1012.
Bryceson, Y.T. et al., 2007. Defective cytotoxic lymphocyte degranulation in syntaxin-11-deficient familial hemophagocytic lymphohistiocytosis 4 (FHL4) patients. Blood, 110(6), pp.1906–1915.
Bryceson, Y.T. et al., 2011. Molecular mechanisms of natural killer cell activation. Journal of innate immunity, 3(3), pp.216–26.
Bryceson, Y.T., Ljunggren, H.-G. & Long, E.O., 2009. Minimal requirement for induction of natural cytotoxicity and intersection of activation signals by inhibitory receptors. Blood, 114(13), pp.2657–2666.
Buell, J.F., Gross, T.G. & Woodle, E.S., 2005. Malignancy after transplantation. Transplantation, 80(2 Suppl), pp.S254-64.
Bukowski, J.F. et al., 1983. Natural killer cell depletion enhances virus synthesis and virus-induced hepatitis in vivo. Journal of immunology (Baltimore, Md. : 1950), 131(3), pp.1531–8.
Burnet, F.M., 1970. The concept of immunological surveillance. Progress in experimental tumor research, 13, pp.1–27.
Burns, L.J. et al., 2003. IL-2-based immunotherapy after autologous transplantation for lymphoma and breast cancer induces immune activation and cytokine release: a phase I/II trial. Bone Marrow Transplantation, 32(2), pp.177–186.
Caligiuri, M.A., 2008. Human natural killer cells. Blood, 112, pp.461–469.
Cao, T.M. et al., 2005. CD34, CD4, and CD8 cell doses do not influence engraftment, graft-versus-host disease, or survival following myeloablative human leukocyte antigen-identical peripheral blood allografting for hematologic malignancies. Experimental Hematology, 33(3), pp.279–285.
Carrega, P. & Ferlazzo, G., 2012. Natural killer cell distribution and trafficking in human tissues. Frontiers in Immunology, 3, p.347.
Carreras, E., 2000. Veno-occlusive disease of the liver after hemopoietic cell transplantation. European journal of haematology, 64(5), pp.281–91.
Cashen, A.F., Lazarus, H.M. & Devine, S.M., 2007. Mobilizing stem cells from normal donors: is it possible to improve upon G-CSF? Bone Marrow Transplantation, 39(10), pp.577–588.
Chaidos, A. et al., 2012. Graft invariant natural killer T-cell dose predicts risk of acute graft-versus-host disease in allogeneic hematopoietic stem cell transplantation. Blood, 119, pp.5030–5036.
Chan, A. et al., 2007. CD56bright human NK cells differentiate into CD56dim cells: role of contact with peripheral fibroblasts. Journal of immunology (Baltimore, Md. : 1950), 179(1), pp.89–94.

247
Chan, Y.T. et al., 2017. NK cells produce high levels of IL-10 early after allogeneic stem cell transplantation and suppress development of acute GVHD. European Journal of Immunology.
Chatta, G.S. et al., 1994. Effects of in vivo recombinant methionyl human granulocyte colony-stimulating factor on the neutrophil response and peripheral blood colony-forming cells in healthy young and elderly adult volunteers. Blood, 84(9), pp.2923–9.
Chen, X. et al., 2007. Many NK cell receptors activate ERK2 and JNK1 to trigger microtubule organizing center and granule polarization and cytotoxicity. Proceedings of the National Academy of Sciences, 104(15), pp.6329–6334.
Della Chiesa, M. et al., 2016. Features of Memory-Like and PD-1(+) Human NK Cell Subsets. Frontiers in immunology, 7, p.351.
Della Chiesa, M., Muccio, L. & Moretta, A., 2013. CMV induces rapid NK cell maturation in HSCT recipients. Immunology Letters, 155(1–2), pp.11–13.
Choi, P.J. & Mitchison, T.J., 2013. Imaging burst kinetics and spatial coordination during serial killing by single natural killer cells. Proceedings of the National Academy of Sciences, 110(16), pp.6488–6493.
Chu, J. et al., 2014. CS1-specific chimeric antigen receptor (CAR)-engineered natural killer cells enhance in vitro and in vivo antitumor activity against human multiple myeloma. Leukemia, 28(4), pp.917–927.
Ciccone, E. et al., 1992. Involvement of HLA class I alleles in natural killer (NK) cell-specific functions: expression of HLA-Cw3 confers selective protection from lysis by alloreactive NK clones displaying a defined specificity (specificity 2). The Journal of experimental medicine, 176(4), pp.963–71.
Cichocki, F. et al., 2015. CD56(dim)CD57(+)NKG2C(+) NK cell expansion is associated with reduced leukemia relapse after reduced intensity HCT. Leukemia.
Cichocki, F. et al., 2017. GSK3 Inhibition Drives Maturation of NK Cells and Enhances Their Antitumor Activity. Cancer Research, 77(20), pp.5664–5675.
De Clercq, E., 2003. The bicyclam AMD3100 story. Nature Reviews Drug Discovery, 2(7), pp.581–587.
Congy-Jolivet, N. et al., 2008. Fc RIIIa Expression Is Not Increased on Natural Killer Cells Expressing the Fc RIIIa-158V Allotype. Cancer Research, 68(4), pp.976–980.
Conlon, K.C. et al., 2015. Redistribution, hyperproliferation, activation of natural killer cells and CD8 T cells, and cytokine production during first-in-human clinical trial of recombinant human interleukin-15 in patients with cancer. Journal of clinical oncology : official journal of the American Society of Clinical Oncology, 33(1), pp.74–82.
Cooley, S. et al., 2014. Donor killer cell Ig-like receptor B haplotypes, recipient HLA-C1, and HLA-C mismatch enhance the clinical benefit of unrelated transplantation for acute myelogenous leukemia. Journal of immunology (Baltimore, Md. : 1950), 192(10), pp.4592–600.

248
Cooley, S. et al., 2010. Donor selection for natural killer cell receptor genes leads to superior survival after unrelated transplantation for acute myelogenous leukemia. Blood, 116, pp.2411–2419.
Cooley, S. et al., 2009. Donors with group B KIR haplotypes improve relapse-free survival after unrelated hematopoietic cell transplantation for acute myelogenous leukemia. Blood, 113, pp.726–732.
Cooley, S., Parham, P. & Miller, J.S., 2018. Strategies to activate NK cells to prevent relapse and induce remission following hematopoietic stem cell transplantation. Blood, 131(10), pp.1053–1062.
Cooper, M.A., Fehniger, T.A. & Caligiuri, M.A., 2001. The biology of human natural killer-cell subsets. Trends in immunology, 22(11), pp.633–40.
Cornelissen, J.J. et al., 2007. Results of a HOVON/SAKK donor versus no-donor analysis of myeloablative HLA-identical sibling stem cell transplantation in first remission acute myeloid leukemia in young and middle-aged adults: benefits for whom? Blood, 109(9), pp.3658–3666.
Corre, E. et al., 2010. Long-term immune deficiency after allogeneic stem cell transplantation: B-cell deficiency is associated with late infections. Haematologica, 95(6), pp.1025–9.
Croudace, J.E. et al., 2012. Chemokine-mediated tissue recruitment of CXCR3+ CD4+ T cells plays a major role in the pathogenesis of chronic GVHD. Blood, 120, pp.4246–4255.
Curran, E. et al., 2016. STING Pathway Activation Stimulates Potent Immunity against Acute Myeloid Leukemia. Cell reports, 15(11), pp.2357–66.
Curran, E.K., Godfrey, J. & Kline, J., 2017. Mechanisms of Immune Tolerance in Leukemia and Lymphoma. Trends in Immunology, 38(7), pp.513–525.
Curti, A. et al., 2016. Larger Size of Donor Alloreactive NK Cell Repertoire Correlates with Better Response to NK Cell Immunotherapy in Elderly Acute Myeloid Leukemia Patients. Clinical Cancer Research, 22(8), pp.1914–1921.
Curti, A. et al., 2011. Successful transfer of alloreactive haploidentical KIR ligand-mismatched natural killer cells after infusion in elderly high risk acute myeloid leukemia patients. Blood, 118(12), pp.3273–3279.
Dalbeth, N. et al., 2004. CD56bright NK cells are enriched at inflammatory sites and can engage with monocytes in a reciprocal program of activation. Journal of immunology (Baltimore, Md. : 1950), 173(10), pp.6418–26.
Davies, S.M. et al., 2002. Evaluation of KIR ligand incompatibility in mismatched unrelated donor hematopoietic transplants. Blood, 100(10), pp.3825–3827.
Davis, Z.B. et al., 2015. Natural Killer Cell Adoptive Transfer Therapy: Exploiting the First Line of Defense Against Cancer. Cancer journal (Sudbury, Mass.), 21(6), pp.486–91.
Devine, S.M. et al., 2008. Rapid mobilization of functional donor hematopoietic cells without G-CSF using AMD3100, an antagonist of the CXCR4/SDF-1 interaction. Blood, 112(4), pp.990–998.

249
Dickinson, A.M. et al., 2017. Graft-versus-Leukemia Effect Following Hematopoietic Stem Cell Transplantation for Leukemia. Frontiers in immunology, 8, p.496.
Diefenbach, A. et al., 2001. Rae1 and H60 ligands of the NKG2D receptor stimulate tumour immunity. Nature, 413(6852), pp.165–171.
Domagała, A. & Kurpisz, M., 2001. CD52 antigen--a review. Medical science monitor : international medical journal of experimental and clinical research, 7(2), pp.325–31.
Domogala, A. et al., 2017. Natural killer cells differentiated in vitro from cord blood CD34+cells are more advantageous for use as an immunotherapy than peripheral blood and cord blood natural killer cells. Cytotherapy, 19(6), pp.710–720.
Dorfman, J.R. et al., 1997. The basis for self-tolerance of natural killer cells in beta2-microglobulin- and TAP-1- mice. Journal of immunology (Baltimore, Md. : 1950), 159(11), pp.5219–25.
Dunbar, E.M. et al., 2008. The relationship between circulating natural killer cells after reduced intensity conditioning hematopoietic stem cell transplantation and relapse-free survival and graft-versus-host disease. Haematologica, 93(12), pp.1852–8.
Eapen, M. et al., 2011. Effect of stem cell source on outcomes after unrelated donor transplantation in severe aplastic anemia. Blood, 118(9), pp.2618–2621.
Eissens, D.N. et al., 2010. CD3+/CD19+-depleted grafts in HLA-matched allogeneic peripheral blood stem cell transplantation lead to early NK cell cytolytic responses and reduced inhibitory activity of NKG2A. Leukemia, 24(3), pp.583–591.
Elliott, J.M., Wahle, J.A. & Yokoyama, W.M., 2010. MHC class I–deficient natural killer cells acquire a licensed phenotype after transfer into an MHC class I–sufficient environment. The Journal of Experimental Medicine, 207(10), pp.2073–2079.
Elmaagacli, A.H. et al., 2011. Early human cytomegalovirus replication after transplantation is associated with a decreased relapse risk: evidence for a putative virus-versus-leukemia effect in acute myeloid leukemia patients. Blood, 118(5), pp.1402–1412.
Engel, A.M. et al., 1997. MCA sarcomas induced in scid mice are more immunogenic than MCA sarcomas induced in congenic, immunocompetent mice. Scandinavian journal of immunology, 45(5), pp.463–70.
Fairchild, P.J. & Waldmann, H., 2000. Dendritic cells and prospects for transplantation tolerance. Current Opinion in Immunology, 12(5), pp.528–535.
Fauriat, C. et al., 2010. Regulation of human NK-cell cytokine and chemokine production by target cell recognition. Blood, 115(11), pp.2167–2176.
Fehniger, T.A. et al., 2007. Acquisition of Murine NK Cell Cytotoxicity Requires the Translation of a Pre-existing Pool of Granzyme B and Perforin mRNAs. Immunity, 26(6), pp.798–811.

250
Ferlazzo, G. et al., 2002. Human dendritic cells activate resting natural killer (NK) cells and are recognized via the NKp30 receptor by activated NK cells. The Journal of experimental medicine, 195(3), pp.343–51.
Ferlazzo, G. & Moretta, L., 2014. Dendritic cell editing by natural killer cells. Critical reviews in oncogenesis, 19(1–2), pp.67–75.
Ferlazzo, G., Semino, C. & Melioli, G., 2001. HLA class I molecule expression is up-regulated during maturation of dendritic cells, protecting them from natural killer cell-mediated lysis. Immunology letters, 76(1), pp.37–41.
Fernandez, N.C. et al., 2005. A subset of natural killer cells achieves self-tolerance without expressing inhibitory receptors specific for self-MHC molecules. Blood, 105(11), pp.4416–4423.
Ferrara, J.L.M. et al., 2009. Graft-versus-host disease. Lancet, 373, pp.1550–1561.
Fine, J.P. & Gray, R.J., 1999. A Proportional Hazards Model for the Subdistribution of a Competing Risk. Journal of the American Statistical Association, 94(446), p.496.
Fionda, C. et al., 2015. Nitric oxide donors increase PVR/CD155 DNAM-1 ligand expression in multiple myeloma cells: role of DNA damage response activation. BMC Cancer, 15(1), p.17.
Fleischhauer, K. et al., 2014. Risk associations between HLA-DPB1 T-cell epitope matching and outcome of unrelated hematopoietic cell transplantation are independent of HLA-DPA1. Bone marrow transplantation, 49(9), pp.1176–83.
Foley, B. et al., 2012. Cytomegalovirus reactivation after allogeneic transplantation promotes a lasting increase in educated NKG2C+ natural killer cells with potent function. Blood, 119(11), pp.2665–74.
Foley, B. et al., 2011. NK cell education after allogeneic transplantation: dissociation between recovery of cytokine-producing and cytotoxic functions. Blood, 118(10), pp.2784–92.
Förster, R., Davalos-Misslitz, A.C. & Rot, A., 2008. CCR7 and its ligands: balancing immunity and tolerance. Nature reviews. Immunology, 8(5), pp.362–71.
Frassoni, F. et al., 1996. Results of allogeneic bone marrow transplantation for acute leukemia have improved in Europe with time--a report of the acute leukemia working party of the European group for blood and marrow transplantation (EBMT). Bone marrow transplantation, 17(1), pp.13–8.
Freud, A.G. et al., 2005. A Human CD34(+) Subset Resides in Lymph Nodes and Differentiates into CD56brightNatural Killer Cells. Immunity, 22(3), pp.295–304.
Fry, T.J. & Mackall, C.L., 2005. Immune reconstitution following hematopoietic progenitor cell transplantation: challenges for the future. Bone Marrow Transplantation, 35, pp.S53–S57.
Gabrilovich, D.I. et al., 1996. Production of vascular endothelial growth factor by human tumors inhibits the functional maturation of dendritic cells. Nature medicine, 2(10), pp.1096–103.

251
Gajewski, T.F., Schreiber, H. & Fu, Y.-X., 2013. Innate and adaptive immune cells in the tumor microenvironment. Nature Immunology, 14(10), pp.1014–1022.
Garrido, F. et al., 2016. The urgent need to recover MHC class I in cancers for effective immunotherapy. Current opinion in immunology, 39, pp.44–51.
Gattillo, S. et al., 2015. Plerixafor on demand in ten healthy family donors as a rescue strategy to achieve an adequate graft for stem cell transplantation. Transfusion, 55(8), pp.1993–2000.
Ghadially, H. et al., 2014. NK cell receptor NKp46 regulates graft-versus-host disease. Cell reports, 7(6), pp.1809–14.
Ghadially, H. et al., 2013. NKp46 regulates allergic responses. European Journal of Immunology, 43(11), pp.3006–3016.
Ghiringhelli, F. et al., 2005. CD4 + CD25 + regulatory T cells inhibit natural killer cell functions in a transforming growth factor–β–dependent manner. The Journal of Experimental Medicine, 202(8), pp.1075–1085.
Giebel, S. et al., 2003. Survival advantage with KIR ligand incompatibility in hematopoietic stem cell transplantation from unrelated donors. Blood, 102(3), pp.814–819.
Gill, S. et al., 2012. Rapid development of exhaustion and down-regulation of eomesodermin limit the antitumor activity of adoptively transferred murine natural killer cells. Blood, 119(24), pp.5758–68.
Gleason, M.K. et al., 2014. CD16xCD33 bispecific killer cell engager (BiKE) activates NK cells against primary MDS and MDSC CD33+ targets. Blood, 123(19), pp.3016–26.
Glucksberg, H. et al., 1974. Clinical manifestations of graft-versus-host disease in human recipients of marrow from HL-A-matched sibling donors. Transplantation, 18(4), pp.295–304.
Gõmez-Almaguer, D. et al., 2013. Higher doses of CD34+ progenitors are associated with improved overall survival without increasing GVHD in reduced intensity conditioning allogeneic transplant recipients with clinically advanced disease. , 28(5), pp.349–355.
Goodier, M.R. et al., 2014. Rapid NK cell differentiation in a population with near-universal human cytomegalovirus infection is attenuated by NKG2C deletions. Blood, 124(14), pp.2213–2222.
Gordon, S.M. et al., 2012. The Transcription Factors T-bet and Eomes Control Key Checkpoints of Natural Killer Cell Maturation. Immunity, 36(1), pp.55–67.
Gotwals, P. et al., 2017. Prospects for combining targeted and conventional cancer therapy with immunotherapy. Nature Reviews Cancer, 17(5), pp.286–301.
Gratwohl, A. et al., 2005. Cause of death after allogeneic haematopoietic stem cell transplantation (HSCT) in early leukaemias: an EBMT analysis of lethal infectious complications and changes over calendar time. Bone Marrow Transplantation, 36(9), pp.757–769.

252
Gratwohl, A., 2012. The EBMT risk score. Bone Marrow Transplantation, 47(6), pp.749–756.
Gray, D., 2002. A role for antigen in the maintenance of immunological memory. Nature reviews. Immunology, 2, pp.60–65.
Gray, R.J., 1988. A Class of $K$-Sample Tests for Comparing the Cumulative Incidence of a Competing Risk. The Annals of Statistics, 16(3), pp.1141–1154.
Green, M.L. et al., 2013. CMV reactivation after allogeneic HCT and relapse risk: evidence for early protection in acute myeloid leukemia. Blood, 122(7), pp.1316–1324.
Green, M.R. et al., 2010. Integrative analysis reveals selective 9p24.1 amplification, increased PD-1 ligand expression, and further induction via JAK2 in nodular sclerosing Hodgkin lymphoma and primary mediastinal large B-cell lymphoma. Blood, 116(17), pp.3268–3277.
Gruver, A., Hudson, L. & Sempowski, G., 2007. Immunosenescence of ageing. The Journal of Pathology, 211(2), pp.144–156.
Gunturi, A., Berg, R.E. & Forman, J., 2004. The Role of CD94/NKG2 in Innate and Adaptive Immunity. Immunologic Research, 30(1), pp.029–034.
Guo, Y. et al., 2016. PD1 blockade enhances cytotoxicity of in vitro expanded natural killer cells towards myeloma cells. Oncotarget, 7(30), pp.48360–48374.
Gur, C. et al., 2010. The activating receptor NKp46 is essential for the development of type 1 diabetes. Nature immunology, 11(2), pp.121–8.
Gur, C. et al., 2013. The expression of the beta cell-derived autoimmune ligand for the killer receptor nkp46 is attenuated in type 2 diabetes. PloS one, 8(8), p.e74033.
Gyger, M., Stuart, R.K. & Perreault, C., 2000. Immunobiology of allogeneic peripheral blood mononuclear cells mobilized with granulocyte-colony stimulating factor. Bone Marrow Transplantation, 26(1), pp.1–16.
Hale, G. et al., 1998. Improving the outcome of bone marrow transplantation by using CD52 monoclonal antibodies to prevent graft-versus-host disease and graft rejection. Blood, 92(12), pp.4581–4590.
Hasenkamp, J. et al., 2006. Resistance Against Natural Killer Cell Cytotoxicity: Analysis of Mechanisms. Scandinavian Journal of Immunology, 64(4), pp.444–449.
Hatam, L., Schuval, S. & Bonagura, V.R., 1994. Flow cytometric analysis of natural killer cell function as a clinical assay. Cytometry, 16(1), pp.59–68.
Hauge, A.W. et al., 2014. Addition of plerixafor for CD34+ cell mobilization in six healthy stem cell donors ensured satisfactory grafts for transplantation. Transfusion, 54(4), pp.1055–1058.
Haverkos, B.M. et al., 2017. PD-1 blockade for relapsed lymphoma post allogeneic hematopoietic cell transplant: high response rate but frequent GVHD. Blood.
Hayakawa, Y. & Smyth, M.J., 2006. CD27 dissects mature NK cells into two subsets

253
with distinct responsiveness and migratory capacity. Journal of immunology (Baltimore, Md. : 1950), 176(3), pp.1517–24.
van Heijst, J.W.J. et al., 2013. Quantitative assessment of T cell repertoire recovery after hematopoietic stem cell transplantation. Nature medicine, 19(3), pp.372–7.
Hellerstein, M. et al., 1999. Directly measured kinetics of circulating T lymphocytes in normal and HIV-1-infected humans. Nature Medicine, 5(1), pp.83–89.
Henney, C.S. et al., 1981. Interleukin-2 augments natural killer cell activity. Nature, 291(5813), pp.335–8.
Herberman, R.B., Nunn, M.E. & Lavrin, D.H., 1975. Natural cytotoxic reactivity of mouse lymphoid cells against syngeneic acid allogeneic tumors. I. Distribution of reactivity and specificity. International journal of cancer. Journal international du cancer, 16(2), pp.216–29.
Hermanson, D.L. & Kaufman, D.S., 2015. Utilizing Chimeric Antigen Receptors to Direct Natural Killer Cell Activity. Frontiers in Immunology, 6, p.195.
Hill, G.R. et al., 2006. Allogeneic Stem Cell Transplantation with Peripheral Blood Stem Cells Mobilized by Pegylated G-CSF. Biology of Blood and Marrow Transplantation, 12(6), pp.603–607.
Holig, K. et al., 2009. Safety and efficacy of hematopoietic stem cell collection from mobilized peripheral blood in unrelated volunteers: 12 years of single-center experience in 3928 donors. Blood, 114(18), pp.3757–3763.
Holling, T.M., Schooten, E. & Van Den Elsen, P.J., 2004. Function and regulation of MHC class II molecules in T-lymphocytes: Of mice and men. Human Immunology, 65, pp.282–290.
Holmes, T.D. et al., 2011. A Human NK Cell Activation/Inhibition Threshold Allows Small Changes in the Target Cell Surface Phenotype To Dramatically Alter Susceptibility to NK Cells. The Journal of Immunology, 186(3), pp.1538–1545.
Horowitz, A. et al., 2013. Genetic and environmental determinants of human NK cell diversity revealed by mass cytometry. Science translational medicine, 5(208), p.208ra145.
Horowitz, M.M. et al., 1990. Graft-versus-leukemia reactions after bone marrow transplantation. Blood, 75, pp.555–562.
Hosie, L. et al., 2017. Cytomegalovirus-Specific T Cells Restricted by HLA-Cw*0702 Increase Markedly with Age and Dominate the CD8+ T-Cell Repertoire in Older People. Frontiers in immunology, 8, p.1776.
Hou, S. et al., 2014. CD226 protein is involved in immune synapse formation and triggers Natural Killer (NK) cell activation via its first extracellular domain. The Journal of biological chemistry, 289(10), pp.6969–77.
Howard, C.A. et al., 2015. Recommendations for donor human leukocyte antigen assessment and matching for allogeneic stem cell transplantation: consensus opinion of the Blood and Marrow Transplant Clinical Trials Network (BMT CTN). Biology of blood and marrow transplantation : journal of the American Society for Blood and Marrow Transplantation, 21(1), pp.4–7.

254
Hsu, K.C. et al., 2002. The killer cell immunoglobulin-like receptor (KIR) genomic region: gene-order, haplotypes and allelic polymorphism. Immunological reviews, 190, pp.40–52.
Hu, Y. et al., 2009. Investigation of the mechanism of action of alemtuzumab in a human CD52 transgenic mouse model. Immunology, 128(2), pp.260–70.
Huang, H. et al., 2010. Up-regulation of NKG2F receptor, a functionally unknown killer receptor, of human natural killer cells by interleukin-2 and interleukin-15. Oncology Reports, 24, pp.1043–1048.
Huss, R. et al., 1996. Effect of mixed chimerism on graft-versus-host disease, disease recurrence and survival after HLA-identical marrow transplantation for aplastic anemia or chronic myelogenous leukemia. Bone marrow transplantation, 18(4), pp.767–76.
Iacobelli, S. & EBMT Statistical Committee, 2013. Suggestions on the use of statistical methodologies in studies of the European Group for Blood and Marrow Transplantation. Bone Marrow Transplantation, 48, pp.S1–S37.
Ichim, T.E., Zhong, R. & Min, W.-P., 2003. Prevention of allograft rejection by in vitro generated tolerogenic dendritic cells. Transplant Immunology, 11(3–4), pp.295–306.
Ikeda, H., Old, L.J. & Schreiber, R.D., 2002. The roles of IFN gamma in protection against tumor development and cancer immunoediting. Cytokine & growth factor reviews, 13(2), pp.95–109.
Impola, U. et al., 2016. Graft Immune Cell Composition Associates with Clinical Outcome of Allogeneic Hematopoietic Stem Cell Transplantation in Patients with AML. Frontiers in immunology, 7, p.523.
Inngjerdingen, M., Damaj, B. & Maghazachi, A.A., 2001. Expression and regulation of chemokine receptors in human natural killer cells. Blood, 97(2), pp.367–75.
Ishwaran, H. et al., 2008. Random survival forests. The Annals of Applied Statistics, 2(3), pp.841–860.
Iwai, Y. et al., 2002. Involvement of PD-L1 on tumor cells in the escape from host immune system and tumor immunotherapy by PD-L1 blockade. Proceedings of the National Academy of Sciences, 99(19), pp.12293–12297.
Jagasia, M. et al., 2012. Risk factors for acute GVHD and survival after hematopoietic cell transplantation. Blood, 119(1), pp.296–307.
Jagasia, M.H. et al., 2015. National Institutes of Health Consensus Development Project on Criteria for Clinical Trials in Chronic Graft-versus-Host Disease: I. The 2014 Diagnosis and Staging Working Group Report. Biology of Blood and Marrow Transplantation, 21(3), p.389–401.e1.
Jahn, R. & Scheller, R.H., 2006. SNAREs — engines for membrane fusion. Nature Reviews Molecular Cell Biology, 7(9), pp.631–643.
Jaiswal, S. et al., 2009. CD47 Is Upregulated on Circulating Hematopoietic Stem Cells and Leukemia Cells to Avoid Phagocytosis. Cell, 138(2), pp.271–285.

255
Jaiswal, S.R. et al., 2018. Impact of Single-Dose Plerixafor as an Adjunct to Granulocyte Colony-Stimulating Factor–Based Peripheral Blood Stem Cell Mobilization on the Graft Composition and Outcome for T Cell–Replete Haploidentical Peripheral Blood Stem Cell Transplantation with Post-Transplantation Cyclophosphamide: A Comparative Study. Biology of Blood and Marrow Transplantation, 24(3), pp.542–548.
Jamieson, A.M. et al., 2004. Turnover and proliferation of NK cells in steady state and lymphopenic conditions. Journal of immunology (Baltimore, Md. : 1950), 172(2), pp.864–70.
Jedema, I. et al., 2004. New CFSE-based assay to determine susceptibility to lysis by cytotoxic T cells of leukemic precursor cells within a heterogeneous target cell population. Blood, 103(7), pp.2677–2682.
Jiang, K. et al., 2000. Pivotal role of phosphoinositide-3 kinase in regulation of cytotoxicityin natural killer cells. Nature Immunology, 1(5), pp.419–425.
Jiang, Y. et al., 2015. Donor Chimerism of B Cells and Nature Killer Cells Provides Useful Information to Predict Hematologic Relapse following Allogeneic Hematopoietic Stem Cell Transplantation. PloS one, 10(7), p.e0133671.
Joncker, N.T. et al., 2010. Mature natural killer cells reset their responsiveness when exposed to an altered MHC environment. The Journal of Experimental Medicine, 207(10), pp.2065–2072.
Joncker, N.T. et al., 2009. NK cell responsiveness is tuned commensurate with the number of inhibitory receptors for self-MHC class I: the rheostat model. Journal of immunology (Baltimore, Md. : 1950), 182, pp.4572–4580.
Juelke, K. et al., 2010. CD62L expression identifies a unique subset of polyfunctional CD56dim NK cells. Blood, 116(8), pp.1299–1307.
Kalland, T., 1986. Generation of natural killer cells from bone marrow precursors in vitro. Immunology, 57(4), pp.493–8.
Kanda, J., Lopez, R.D. & Rizzieri, D.A., 2011. Alemtuzumab for the prevention and treatment of graft-versus-host disease. International Journal of Hematology, 93(5), pp.586–593.
Kärre, K. et al., 1986. Selective rejection of H–2-deficient lymphoma variants suggests alternative immune defence strategy. Nature, 319(6055), pp.675–678.
Kearney, C.J. et al., 2016. Loss of DNAM-1 ligand expression by acute myeloid leukemia cells renders them resistant to NK cell killing. Oncoimmunology, 5(8), p.e1196308.
Keever-Taylor, C.A. et al., 2001. Factors affecting neutrophil and platelet reconstitution following T cell-depleted bone marrow transplantation: differential effects of growth factor type and role of CD34+ cell dose. Bone Marrow Transplantation, 27(8), pp.791–800.
Kehrl, J.H. et al., Novel Interleukin 2 (IL-2) Receptor Appears to Mediate IL-2-induced Activation of Natural Killer Cells.
Kelly, J.M. et al., 2002. A role for IFN-gamma in primary and secondary immunity

256
generated by NK cell-sensitive tumor-expressing CD80 in vivo. Journal of immunology (Baltimore, Md. : 1950), 168(9), pp.4472–9.
Kiessling, R., Petranyi, G., et al., 1975. Genetic variation of in vitro cytolytic activity and in vivo rejection potential of non-immunized semi-syngeneic mice against a mouse lymphoma line. International journal of cancer, 15(6), pp.933–40.
Kiessling, R., Klein, E. & Wigzell, H., 1975. “Natural” killer cells in the mouse. I. Cytotoxic cells with specificity for mouse Moloney leukemia cells. Specificity and distribution according to genotype. European journal of immunology, 5(2), pp.112–7.
Kim, D.H. et al., 2005. Transplantation with higher dose of natural killer cells associated with better outcomes in terms of non-relapse mortality and infectious events after allogeneic peripheral blood stem cell transplantation from HLA-matched sibling donors. European Journal of Haematology, 75(4), pp.299–308.
Kim, H.T. et al., 2016. Donor and recipient sex in allogeneic stem cell transplantation: what really matters. Haematologica, 101(10), pp.1260–1266.
Kim, S. et al., 2005. Licensing of natural killer cells by host major histocompatibility complex class I molecules. Nature, 436(7051), pp.709–713.
Kinsella, F.A.M. et al., 2014. Split Mixed Donor Chimerism Early after T-Cell Depleted Reduced Intensity Conditioned Allogeneic Haematopoietic Stem Cell Transplantation Predicts Survival. Blood, 124(21).
Klein, E. et al., 1976. Properties of the K562 cell line, derived from a patient with chronic myeloid leukemia. International journal of cancer, 18(4), pp.421–31.
Klingemann, H., 2014. Are natural killer cells superior CAR drivers? Oncoimmunology, 3, p.e28147.
Klingemann, H., Boissel, L. & Toneguzzo, F., 2016. Natural Killer Cells for Immunotherapy - Advantages of the NK-92 Cell Line over Blood NK Cells. Frontiers in immunology, 7, p.91.
Knorr, D.A. & Kaufman, D.S., 2010. Pluripotent stem cell-derived natural killer cells for cancer therapy. Translational research : the journal of laboratory and clinical medicine, 156(3), pp.147–54.
Koestner, W. et al., 2011. PD-L1 blockade effectively restores strong graft-versus-leukemia effects without graft-versus-host disease after delayed adoptive transfer of T-cell receptor gene-engineered allogeneic CD8+ T cells. Blood, 117(3), pp.1030–41.
Koh, L.-P. & Chao, N., 2008. Haploidentical hematopoietic cell transplantation. Bone Marrow Transplantation, 42, pp.S60–S63.
Koka, R. et al., 2003. Interleukin (IL)-15R[alpha]-deficient natural killer cells survive in normal but not IL-15R[alpha]-deficient mice. The Journal of experimental medicine, 197(8), pp.977–84.
Kollman, C. et al., 2001. Donor characteristics as risk factors in recipients after transplantation of bone marrow from unrelated donors: the effect of donor age. Blood, 98(7), pp.2043–51.

257
Körbling, M. et al., 1995. Allogeneic Blood Stem Cell Transplantation: Peripheralization and Yield of Donor-Derived Primitive Hematopoietic Progenitor Cells (CD34+ Thy-1dim) and Lymphoid Subsets, and Possible Predictors of Engraftment and Graft-Versus-Host Disease. , 86(7), pp.2842–2848.
Körbling, M. & Freireich, E.J., 2011. Twenty-five years of peripheral blood stem cell transplantation. Blood, 117(24), pp.6411–6.
Korde, N. et al., 2014. A phase II trial of pan-KIR2D blockade with IPH2101 in smoldering multiple myeloma. Haematologica, 99(6), pp.e81–e83.
Koreth, J. et al., 2014. Donor Chimerism Early after Reduced-Intensity Conditioning Hematopoietic Stem Cell Transplantation Predicts Relapse and Survival. Biology of Blood and Marrow Transplantation, 20(10), pp.1516–1521.
Kottaridis, P.D. et al., 2015. Two-Stage Priming of Allogeneic Natural Killer Cells for the Treatment of Patients with Acute Myeloid Leukemia: A Phase I Trial. PloS one, 10(6), p.e0123416.
Kruse, P.H. et al., 2014. Natural cytotoxicity receptors and their ligands. Immunology and cell biology, 92(3), pp.221–9.
Kubonishi, I. et al., 1984. Establishment of a new peroxidase-positive human myeloid cell line, PL-21. Blood, 63(2), pp.254–9.
Kurtzberg, J. et al., 1996. Placental Blood as a Source of Hematopoietic Stem Cells for Transplantation into Unrelated Recipients. New England Journal of Medicine, 335(3), pp.157–166.
Kusunoki, Y. et al., 2000. NK-mediated elimination of mutant lymphocytes that have lost expression of MHC class I molecules. Journal of immunology (Baltimore, Md. : 1950), 165(7), pp.3555–63.
Lane, T.A. et al., 1995. Harvesting and enrichment of hematopoietic progenitor cells mobilized into the peripheral blood of normal donors by granulocyte-macrophage colony- stimulating factor (GM-CSF) or G-CSF: Potential role in allogeneic marrow transplantation. , 85(1), pp.275–282.
Lanier, L.L., 2005. NK CELL RECOGNITION. Annual Review of Immunology, 23(1), pp.225–274.
Larsen, S.K., Gao, Y. & Basse, P.H., 2014. NK cells in the tumor microenvironment. Critical reviews in oncogenesis, 19(1–2), pp.91–105.
Laughlin, M.J. et al., 2001. Hematopoietic Engraftment and Survival in Adult Recipients of Umbilical-Cord Blood from Unrelated Donors. New England Journal of Medicine, 344(24), pp.1815–1822.
Lee, S.J. et al., 2007. High-resolution donor-recipient HLA matching contributes to the success of unrelated donor marrow transplantation. Blood, 110(13), pp.4576–4583.
Lehmann, C., Zeis, M. & Uharek, L., 2001. Activation of natural killer cells with interleukin 2 (IL-2) and IL-12 increases perforin binding and subsequent lysis of tumour cells. British journal of haematology, 114(3), pp.660–5.

258
Leong, J.W. & Fehniger, T.A., 2011. Human NK cells: SET to kill. Blood, 117(8), pp.2297–8.
Lesokhin, A.M. et al., 2016. Nivolumab in Patients With Relapsed or Refractory Hematologic Malignancy: Preliminary Results of a Phase Ib Study. Journal of clinical oncology : official journal of the American Society of Clinical Oncology, 34(23), pp.2698–704.
Levine, A.J., 1997. p53, the cellular gatekeeper for growth and division. Cell, 88(3), pp.323–31.
Li, C. et al., 2008. JNK MAP kinase activation is required for MTOC and granule polarization in NKG2D-mediated NK cell cytotoxicity. Proceedings of the National Academy of Sciences of the United States of America, 105(8), pp.3017–22.
Liao, N.S. et al., 1991. MHC class I deficiency: susceptibility to natural killer (NK) cells and impaired NK activity. Science (New York, N.Y.), 253(5016), pp.199–202.
Lieberman, J., 2003. The ABCs of granule-mediated cytotoxicity: new weapons in the arsenal. Nature Reviews Immunology, 3(5), pp.361–370.
Lieschke, G.J. et al., 1994. Mice lacking granulocyte colony-stimulating factor have chronic neutropenia, granulocyte and macrophage progenitor cell deficiency, and impaired neutrophil mobilization. Blood, 84(6), pp.1737–46.
Lim, T.S. et al., 2012. CD80 and CD86 Differentially Regulate Mechanical Interactions of T-Cells with Antigen-Presenting Dendritic Cells and B-Cells. PLoS ONE, 7.
Lind, M.H. et al., 2004. Tumor necrosis factor receptor 1-mediated signaling is required for skin cancer development induced by NF- B inhibition. Proceedings of the National Academy of Sciences, 101(14), pp.4972–4977.
Liu, F., Poursine-Laurent, J. & Link, D.C., 2000. Expression of the G-CSF receptor on hematopoietic progenitor cells is not required for their mobilization by G-CSF. Blood, 95(10), pp.3025–31.
Ljunggren, H.-G. & Kärre, K., 1990. In search of the ‘missing self’: MHC molecules and NK cell recognition. Immunology Today, 11, pp.237–244.
Lopez-Vergès, S. et al., 2010. CD57 defines a functionally distinct population of mature NK cells in the human CD56dimCD16+ NK-cell subset. Blood, 116(19), pp.3865–3874.
Lowdell, M.W. et al., 2002. Evidence that continued remission in patients treated for acute leukaemia is dependent upon autologous natural killer cells. British Journal of Haematology, 117(4), pp.821–827.
Lucas, M. et al., 2007. Dendritic Cells Prime Natural Killer Cells by trans-Presenting Interleukin 15. Immunity, 26(4), pp.503–517.
Lundqvist, A. et al., 2013. Differences in the Phenotype, Cytokine Gene Expression Profiles, and In Vivo Alloreactivity of T Cells Mobilized with Plerixafor Compared with G-CSF. The Journal of Immunology, 191(12), pp.6241–6249.
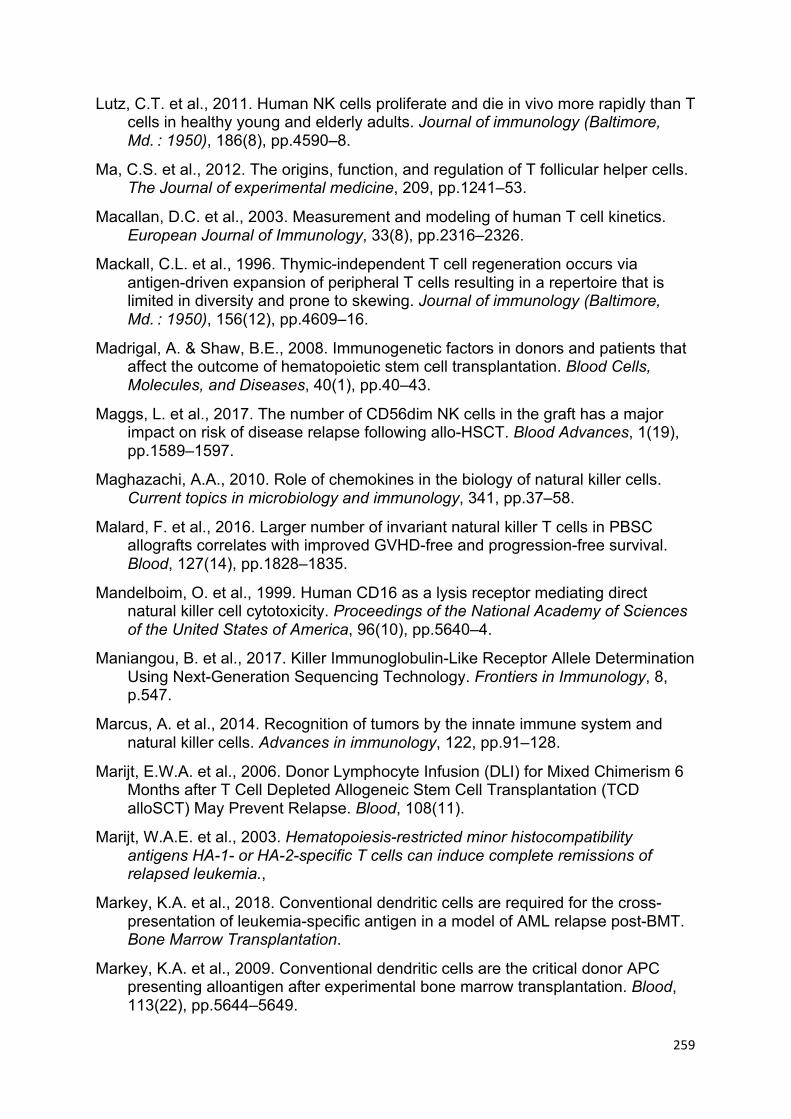
259
Lutz, C.T. et al., 2011. Human NK cells proliferate and die in vivo more rapidly than T cells in healthy young and elderly adults. Journal of immunology (Baltimore, Md. : 1950), 186(8), pp.4590–8.
Ma, C.S. et al., 2012. The origins, function, and regulation of T follicular helper cells. The Journal of experimental medicine, 209, pp.1241–53.
Macallan, D.C. et al., 2003. Measurement and modeling of human T cell kinetics. European Journal of Immunology, 33(8), pp.2316–2326.
Mackall, C.L. et al., 1996. Thymic-independent T cell regeneration occurs via antigen-driven expansion of peripheral T cells resulting in a repertoire that is limited in diversity and prone to skewing. Journal of immunology (Baltimore, Md. : 1950), 156(12), pp.4609–16.
Madrigal, A. & Shaw, B.E., 2008. Immunogenetic factors in donors and patients that affect the outcome of hematopoietic stem cell transplantation. Blood Cells, Molecules, and Diseases, 40(1), pp.40–43.
Maggs, L. et al., 2017. The number of CD56dim NK cells in the graft has a major impact on risk of disease relapse following allo-HSCT. Blood Advances, 1(19), pp.1589–1597.
Maghazachi, A.A., 2010. Role of chemokines in the biology of natural killer cells. Current topics in microbiology and immunology, 341, pp.37–58.
Malard, F. et al., 2016. Larger number of invariant natural killer T cells in PBSC allografts correlates with improved GVHD-free and progression-free survival. Blood, 127(14), pp.1828–1835.
Mandelboim, O. et al., 1999. Human CD16 as a lysis receptor mediating direct natural killer cell cytotoxicity. Proceedings of the National Academy of Sciences of the United States of America, 96(10), pp.5640–4.
Maniangou, B. et al., 2017. Killer Immunoglobulin-Like Receptor Allele Determination Using Next-Generation Sequencing Technology. Frontiers in Immunology, 8, p.547.
Marcus, A. et al., 2014. Recognition of tumors by the innate immune system and natural killer cells. Advances in immunology, 122, pp.91–128.
Marijt, E.W.A. et al., 2006. Donor Lymphocyte Infusion (DLI) for Mixed Chimerism 6 Months after T Cell Depleted Allogeneic Stem Cell Transplantation (TCD alloSCT) May Prevent Relapse. Blood, 108(11).
Marijt, W.A.E. et al., 2003. Hematopoiesis-restricted minor histocompatibility antigens HA-1- or HA-2-specific T cells can induce complete remissions of relapsed leukemia.,
Markey, K.A. et al., 2018. Conventional dendritic cells are required for the cross-presentation of leukemia-specific antigen in a model of AML relapse post-BMT. Bone Marrow Transplantation.
Markey, K.A. et al., 2009. Conventional dendritic cells are the critical donor APC presenting alloantigen after experimental bone marrow transplantation. Blood, 113(22), pp.5644–5649.
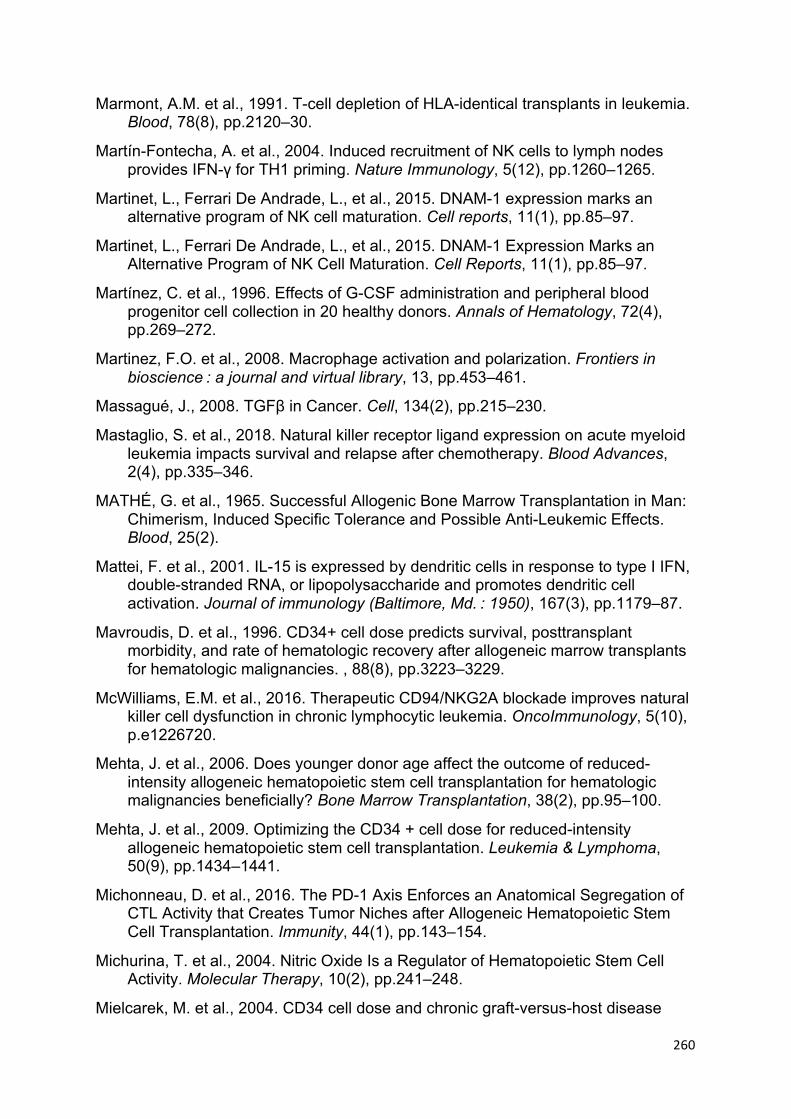
260
Marmont, A.M. et al., 1991. T-cell depletion of HLA-identical transplants in leukemia. Blood, 78(8), pp.2120–30.
Martín-Fontecha, A. et al., 2004. Induced recruitment of NK cells to lymph nodes provides IFN-γ for TH1 priming. Nature Immunology, 5(12), pp.1260–1265.
Martinet, L., Ferrari De Andrade, L., et al., 2015. DNAM-1 expression marks an alternative program of NK cell maturation. Cell reports, 11(1), pp.85–97.
Martinet, L., Ferrari De Andrade, L., et al., 2015. DNAM-1 Expression Marks an Alternative Program of NK Cell Maturation. Cell Reports, 11(1), pp.85–97.
Martínez, C. et al., 1996. Effects of G-CSF administration and peripheral blood progenitor cell collection in 20 healthy donors. Annals of Hematology, 72(4), pp.269–272.
Martinez, F.O. et al., 2008. Macrophage activation and polarization. Frontiers in bioscience : a journal and virtual library, 13, pp.453–461.
Massagué, J., 2008. TGFβ in Cancer. Cell, 134(2), pp.215–230.
Mastaglio, S. et al., 2018. Natural killer receptor ligand expression on acute myeloid leukemia impacts survival and relapse after chemotherapy. Blood Advances, 2(4), pp.335–346.
MATHÉ, G. et al., 1965. Successful Allogenic Bone Marrow Transplantation in Man: Chimerism, Induced Specific Tolerance and Possible Anti-Leukemic Effects. Blood, 25(2).
Mattei, F. et al., 2001. IL-15 is expressed by dendritic cells in response to type I IFN, double-stranded RNA, or lipopolysaccharide and promotes dendritic cell activation. Journal of immunology (Baltimore, Md. : 1950), 167(3), pp.1179–87.
Mavroudis, D. et al., 1996. CD34+ cell dose predicts survival, posttransplant morbidity, and rate of hematologic recovery after allogeneic marrow transplants for hematologic malignancies. , 88(8), pp.3223–3229.
McWilliams, E.M. et al., 2016. Therapeutic CD94/NKG2A blockade improves natural killer cell dysfunction in chronic lymphocytic leukemia. OncoImmunology, 5(10), p.e1226720.
Mehta, J. et al., 2006. Does younger donor age affect the outcome of reduced-intensity allogeneic hematopoietic stem cell transplantation for hematologic malignancies beneficially? Bone Marrow Transplantation, 38(2), pp.95–100.
Mehta, J. et al., 2009. Optimizing the CD34 + cell dose for reduced-intensity allogeneic hematopoietic stem cell transplantation. Leukemia & Lymphoma, 50(9), pp.1434–1441.
Michonneau, D. et al., 2016. The PD-1 Axis Enforces an Anatomical Segregation of CTL Activity that Creates Tumor Niches after Allogeneic Hematopoietic Stem Cell Transplantation. Immunity, 44(1), pp.143–154.
Michurina, T. et al., 2004. Nitric Oxide Is a Regulator of Hematopoietic Stem Cell Activity. Molecular Therapy, 10(2), pp.241–248.
Mielcarek, M. et al., 2004. CD34 cell dose and chronic graft-versus-host disease

261
after human leukocyte antigen-matched sibling hematopoietic stem cell transplantation. Leukemia & lymphoma, 45(1), pp.27–34.
Miller, J.S., Tessmer-Tuck, J., et al., 1997. Low dose subcutaneous interleukin-2 after autologous transplantation generates sustained in vivo natural killer cell activity. Biology of blood and marrow transplantation : journal of the American Society for Blood and Marrow Transplantation, 3(1), pp.34–44.
Miller, J.S. et al., 2007. Missing KIR ligands are associated with less relapse and increased graft-versus-host disease (GVHD) following unrelated donor allogeneic HCT. Blood, 109(11), pp.5058–5061.
Miller, J.S. et al., 2005. Successful adoptive transfer and in vivo expansion of human haploidentical NK cells in patients with cancer. Blood, 105(8), pp.3051–7.
Miller, J.S., Prosper, F. & McCullar, V., 1997. Natural killer (NK) cells are functionally abnormal and NK cell progenitors are diminished in granulocyte colony-stimulating factor-mobilized peripheral blood progenitor cell collections. Blood, 90(8), pp.3098–105.
Miller, R.A., 1996. The aging immune system: primer and prospectus. Science (New York, N.Y.), 273(5271), pp.70–4.
Minculescu, L. et al., 2016. Early Natural Killer Cell Reconstitution Predicts Overall Survival in T Cell–Replete Allogeneic Hematopoietic Stem Cell Transplantation. Biology of Blood and Marrow Transplantation, 22(12), pp.2187–2193.
Mocikat, R. et al., 2003. Natural killer cells activated by MHC class I(low) targets prime dendritic cells to induce protective CD8 T cell responses. Immunity, 19(4), pp.561–9.
Mohty, M., 2007. Mechanisms of action of antithymocyte globulin: T-cell depletion and beyond. Leukemia, 21(7), pp.1387–1394.
Molineux, G. et al., 1999. A new form of Filgrastim with sustained duration in vivo and enhanced ability to mobilize PBPC in both mice and humans. Experimental hematology, 27(12), pp.1724–34.
Morandi, B. et al., 2012. Dendritic Cell Editing by Activated Natural Killer Cells Results in a More Protective Cancer-Specific Immune Response F. Dieli, ed. PLoS ONE, 7(6), p.e39170.
Moretta, A. et al., 2001. A CTIVATING R ECEPTORS AND C ORECEPTORS I NVOLVED IN H UMAN N ATURAL K ILLER C ELL -M EDIATED C YTOLYSIS. Annual Review of Immunology, 19(1), pp.197–223.
Moretta, A. et al., 1996. RECEPTORS FOR HLA CLASS-I MOLECULES IN HUMAN NATURAL KILLER CELLS. Annual Review of Immunology, 14(1), pp.619–648.
Moretta, L. & Moretta, A., 2004a. Killer immunoglobulin-like receptors. Current Opinion in Immunology, 16(5), pp.626–633.
Moretta, L. & Moretta, A., 2004b. Unravelling natural killer cell function: triggering and inhibitory human NK receptors. The EMBO journal, 23(2), pp.255–9.
Morris, E.C. et al., 2003. Pharmacokinetics of alemtuzumab used for in vivo and in

262
vitro T-cell depletion in allogeneic transplantations: relevance for early adoptive immunotherapy and infectious complications. Blood, 102(1), pp.404–6.
Morris, E.S. et al., 2004. Donor treatment with pegylated G-CSF augments the generation of IL-10-producing regulatory T cells and promotes transplantation tolerance. Blood, 103(9), pp.3573–3581.
Morris, E.S. et al., 2005. NKT cell-dependent leukemia eradication following stem cell mobilization with potent G-CSF analogs. Journal of Clinical Investigation, 115(11), pp.3093–3103.
Mrózek, E., Anderson, P. & Caligiuri, M.A., 1996. Role of interleukin-15 in the development of human CD56+ natural killer cells from CD34+ hematopoietic progenitor cells. Blood, 87(7), pp.2632–40.
Müller, T. et al., 2008. Expression of a CD20-specific chimeric antigen receptor enhances cytotoxic activity of NK cells and overcomes NK-resistance of lymphoma and leukemia cells. Cancer Immunology, Immunotherapy, 57(3), pp.411–423.
Murphy, K., Travers, P. & Walport, M., 2008. Janeway’s Immunobiology,
Nakamura, R. et al., 2008. Impact of graft cell dose on transplant outcomes following unrelated donor allogeneic peripheral blood stem cell transplantation: higher CD34+ cell doses are associated with decreased relapse rates. Biology of blood and marrow transplantation : journal of the American Society for Blood and Marrow Transplantation, 14(4), pp.449–57.
Narni-Mancinelli, E. et al., 2012. Tuning of Natural Killer Cell Reactivity by NKp46 and Helios Calibrates T Cell Responses. Science, 335(6066), pp.344–348.
Nausch, N. & Cerwenka, A., 2008. NKG2D ligands in tumor immunity. Oncogene, 27(45), pp.5944–5958.
Ndhlovu, L.C. et al., 2012. Tim-3 marks human natural killer cell maturation and suppresses cell-mediated cytotoxicity. Blood, 119(16), pp.3734–43.
Nguyen, S. et al., 2005. NK-cell reconstitution after haploidentical hematopoietic stem-cell transplantations: immaturity of NK cells and inhibitory effect of NKG2A override GvL effect. Blood, 105(10), pp.4135–42.
Nichols, W.G. et al., 2002. High Risk of Death Due to Bacterial and Fungal Infection among Cytomegalovirus (CMV)–Seronegative Recipients of Stem Cell Transplants from Seropositive Donors: Evidence for Indirect Effects of Primary CMV Infection. The Journal of Infectious Diseases, 185(3), pp.273–282.
Nikolousis, E. et al., 2015. Impact of pre-transplant co-morbidities on outcome after alemtuzumab-based reduced intensity conditioning allo-SCT in elderly patients: A British Society of Blood and Marrow Transplantation study. Bone Marrow Transplantation, 50(1), pp.82–86.
Nikolousis, E. et al., 2013. Post-transplant T cell chimerism predicts graft versus host disease but not disease relapse in patients undergoing an alemtuzumab based reduced intensity conditioned allogeneic transplant. Leukemia Research, 37(5), pp.561–565.

263
Niu, C. et al., 2017. Low-dose bortezomib increases the expression of NKG2D and DNAM-1 ligands and enhances induced NK and γδ T cell-mediated lysis in multiple myeloma. Oncotarget, 8(4), pp.5954–5964.
North, J. et al., 2007. Tumor-primed human natural killer cells lyse NK-resistant tumor targets: evidence of a two-stage process in resting NK cell activation. Journal of immunology (Baltimore, Md. : 1950), 178(1), pp.85–94.
Nowak, J., 2008. Role of HLA in hematopoietic SCT. Bone Marrow Transplantation, 42, pp.S71–S76.
O’Leary, J.G. et al., 2006. T cell– and B cell–independent adaptive immunity mediated by natural killer cells. Nature Immunology, 7(5), pp.507–516.
Ogonek, J. et al., 2016. Immune Reconstitution after Allogeneic Hematopoietic Stem Cell Transplantation. Frontiers in immunology, 7, p.507.
Olson, J.A. et al., 2010. NK cells mediate reduction of GVHD by inhibiting activated, alloreactive T cells while retaining GVT effects. Blood, 115(21), pp.4293–301.
Oppenheim, D.E. et al., 2005. Sustained localized expression of ligand for the activating NKG2D receptor impairs natural cytotoxicity in vivo and reduces tumor immunosurveillance. Nature Immunology, 6(9), pp.928–937.
Orange, J.S., 2013. Natural killer cell deficiency. The Journal of allergy and clinical immunology, 132(3), pp.515–525.
Orr, M.T., Murphy, W.J. & Lanier, L.L., 2010. “Unlicensed” natural killer cells dominate the response to cytomegalovirus infection. Nature Immunology, 11(4), pp.321–327.
Oszmiana, A. et al., 2016. The Size of Activating and Inhibitory Killer Ig-like Receptor Nanoclusters Is Controlled by the Transmembrane Sequence and Affects Signaling. Cell reports, 15(9), pp.1957–72.
Pageon, S. V. et al., 2013. Superresolution Microscopy Reveals Nanometer-Scale Reorganization of Inhibitory Natural Killer Cell Receptors upon Activation of NKG2D. Science Signaling, 6(285), pp.ra62-ra62.
Pende, D. et al., 2006. Expression of the DNAM-1 ligands, Nectin-2 (CD112) and poliovirus receptor (CD155), on dendritic cells: relevance for natural killer-dendritic cell interaction. Blood, 107(5), pp.2030–2036.
Pende, D. et al., 1999. Identification and molecular characterization of NKp30, a novel triggering receptor involved in natural cytotoxicity mediated by human natural killer cells. The Journal of experimental medicine, 190, pp.1505–1516.
Pende, D. et al., 2005. PVR (CD155) and Nectin-2 (CD112) as ligands of the human DNAM-1 (CD226) activating receptor: involvement in tumor cell lysis. Molecular immunology, 42(4), pp.463–9.
Penn, I., 1988. Tumors of the Immunocompromised Patient. Annual Review of Medicine, 39(1), pp.63–73.
Pical-Izard, C. et al., 2015. Reconstitution of natural killer cells in HLA-matched HSCT after reduced-intensity conditioning: impact on clinical outcome. Biology

264
of blood and marrow transplantation : journal of the American Society for Blood and Marrow Transplantation, 21(3), pp.429–39.
Piper, K.P. et al., 2007. CXCL10-CXCR3 interactions play an important role in the pathogenesis of acute graft-versus-host disease in the skin following allogeneic stem-cell transplantation. Blood, 110, pp.3827–3832.
Pisani, R.J. et al., 1989. Lymphokine-activated killer (LAK) cell activity in tumor-infiltrating lymphocytes from non-small cell lung cancer. American journal of clinical pathology, 92(4), pp.435–46.
Porgador, A. et al., 1997. Natural killer cell lines kill autologous beta2-microglobulin-deficient melanoma cells: implications for cancer immunotherapy. Proceedings of the National Academy of Sciences of the United States of America, 94(24), pp.13140–5.
Prlic, M. et al., 2003. In vivo survival and homeostatic proliferation of natural killer cells. The Journal of experimental medicine, 197(8), pp.967–76.
Radaev, S. & Sun, P.D., 2003. Structure and function of natural killer cell surface receptors. Annual review of biophysics and biomolecular structure, 32, pp.93–114.
Randolph, S.S.B. et al., 2004. Female donors contribute to a selective graft-versus-leukemia effect in male recipients of HLA-matched, related hematopoietic stem cell transplants. Blood, 103(1), pp.347–352.
Rao, S.P. et al., 2012. Human peripheral blood mononuclear cells exhibit heterogeneous CD52 expression levels and show differential sensitivity to alemtuzumab mediated cytolysis. PLoS ONE, 7(6).
Raulet, D.H. et al., 2013. Regulation of ligands for the NKG2D activating receptor. Annual review of immunology, 31, pp.413–41.
Raulet, D.H. et al., 2013. Regulation of Ligands for the NKG2D Activating Receptor. Annual Review of Immunology, 31(1), pp.413–441.
Raulet, D.H. & Vance, R.E., 2006. Self-tolerance of natural killer cells. Nature reviews. Immunology, 6(7), pp.520–31.
Reddy, R.L., 2005. Mobilization and collection of peripheral blood progenitor cells for transplantation. Transfusion and apheresis science : official journal of the World Apheresis Association : official journal of the European Society for Haemapheresis, 32, pp.63–72.
Reshef, R. et al., 2015. High Graft CD8 Cell Dose Predicts Improved Survival and Enables Better Donor Selection in Allogeneic Stem-Cell Transplantation With Reduced-Intensity Conditioning. Journal of clinical oncology : official journal of the American Society of Clinical Oncology, 33(21), pp.2392–8.
Rezvani, K. et al., 2006. High donor FOXP3-positive regulatory T-cell (Treg) content is associated with a low risk of GVHD following HLA-matched allogeneic SCT. Blood, 108(4), pp.1291–7.
Ringdén, O. et al., 2002. Transplantation of peripheral blood stem cells as compared with bone marrow from HLA-identical siblings in adult patients with acute

265
myeloid leukemia and acute lymphoblastic leukemia. Journal of clinical oncology : official journal of the American Society of Clinical Oncology, 20(24), pp.4655–64.
Robertson, M.J. et al., 1996. Characterization of a cell line, NKL, derived from an aggressive human natural killer cell leukemia. Experimental hematology, 24(3), pp.406–15.
Robin, M. et al., 2013. Matched unrelated or matched sibling donors result in comparable outcomes after non-myeloablative HSCT in patients with AML or MDS. Bone Marrow Transplantation 2013 48:10, 48(10), p.1296.
Rocha, V. et al., 2016. Killer Cell Immunoglobulin-Like Receptor-Ligand Matching and Outcomes after Unrelated Cord Blood Transplantation in Acute Myeloid Leukemia. Biology of blood and marrow transplantation : journal of the American Society for Blood and Marrow Transplantation, 22(7), pp.1284–1289.
Romagnani, C. et al., 2007. CD56brightCD16- killer Ig-like receptor- NK cells display longer telomeres and acquire features of CD56dim NK cells upon activation. Journal of immunology (Baltimore, Md. : 1950), 178(8), pp.4947–55.
Romanski, A. et al., 2016. CD19-CAR engineered NK-92 cells are sufficient to overcome NK cell resistance in B-cell malignancies. Journal of Cellular and Molecular Medicine, 20(7), pp.1287–1294.
Romanski, A. et al., 2005. Mechanisms of resistance to natural killer cell-mediated cytotoxicity in acute lymphoblastic leukemia. Experimental Hematology, 33(3), pp.344–352.
Romee, R. et al., 2013. NK cell CD16 surface expression and function is regulated by a disintegrin and metalloprotease-17 (ADAM17). Blood, 121(18), pp.3599–608.
Roux, E. et al., 2000. Recovery of immune reactivity after T-cell-depleted bone marrow transplantation depends on thymic activity. Blood, 96(6), pp.2299–303.
Rubnitz, J.E. et al., 2010. NKAML: A Pilot Study to Determine the Safety and Feasibility of Haploidentical Natural Killer Cell Transplantation in Childhood Acute Myeloid Leukemia. Journal of Clinical Oncology, 28(6), pp.955–959.
Ruggeri, L. et al., 2015a. Alloreactive Natural Killer Cells for the Treatment of Acute Myeloid Leukemia: From Stem Cell Transplantation to Adoptive Immunotherapy. Frontiers in immunology, 6, p.479.
Ruggeri, L. et al., 2015b. Alloreactive Natural Killer Cells for the Treatment of Acute Myeloid Leukemia: From Stem Cell Transplantation to Adoptive Immunotherapy. Frontiers in immunology, 6, p.479.
Ruggeri, L. et al., 2002. Effectiveness of donor natural killer cell alloreactivity in mismatched hematopoietic transplants. Science (New York, N.Y.), 295(5562), pp.2097–100.
Ruggeri, L. et al., 2002. Effectiveness of Donor Natural Killer Cell Alloreactivity in Mismatched Hematopoietic Transplants. Science, 295(5562), pp.2097–2100.
Ruggeri, L. et al., 1999. Role of natural killer cell alloreactivity in HLA-mismatched

266
hematopoietic stem cell transplantation. Blood, 94, pp.333–339.
Russell, N.H. et al., 2015. A comparative assessment of the curative potential of reduced intensity allografts in acute myeloid leukaemia. Leukemia, 29(7), pp.1478–1484.
Rutella, S. et al., 2014. Mobilization of healthy donors with plerixafor affects the cellular composition of T-cell receptor (TCR)-αβ/CD19-depleted haploidentical stem cell grafts. Journal of translational medicine, 12, p.240.
Saber, W. et al., 2012. Outcomes after matched unrelated donor versus identical sibling hematopoietic cell transplantation in adults with acute myelogenous leukemia. Blood, 119(17), pp.3908–3916.
Sabry, M. et al., 2011. Leukemic Priming of Resting NK Cells Is Killer Ig-like Receptor Independent but Requires CD15-Mediated CD2 Ligation and Natural Cytotoxicity Receptors. The Journal of Immunology, 187(12), pp.6227–6234.
Sanchez-Correa, B. et al., 2012. Decreased expression of DNAM-1 on NK cells from acute myeloid leukemia patients. Immunology and Cell Biology, 90(1), pp.109–115.
Sanchez-Correa, B. et al., 2011. Human NK cells in acute myeloid leukaemia patients: analysis of NK cell-activating receptors and their ligands. Cancer immunology, immunotherapy : CII, 60(8), pp.1195–205.
Savani, B.N. et al., 2007. Absolute Lymphocyte Count on Day 30 Is a Surrogate for Robust Hematopoietic Recovery and Strongly Predicts Outcome after T Cell-Depleted Allogeneic Stem Cell Transplantation. Biology of Blood and Marrow Transplantation, 13(10), pp.1216–1223.
Savani, B.N. et al., 2007. Rapid natural killer cell recovery determines outcome after T-cell-depleted HLA-identical stem cell transplantation in patients with myeloid leukemias but not with acute lymphoblastic leukemia. Leukemia, 21(10), pp.2145–52.
Savva, G.M. et al., 2013. Cytomegalovirus infection is associated with increased mortality in the older population. Aging Cell, 12(3), pp.381–387.
Schlahsa, L. et al., 2011. Granulocyte-colony-stimulatory factor: a strong inhibitor of natural killer cell function. Transfusion, 51(2), pp.293–305.
Scholzen, T. & Gerdes, J., 2000. The Ki-67 protein: From the known and the unknown. Journal of Cellular Physiology, 182(3), pp.311–322.
Schonberg, K. et al., 2015. JAK Inhibition Impairs NK Cell Function in Myeloproliferative Neoplasms. Cancer Research, 75(11), pp.2187–2199.
Scrucca, L., Santucci, A. & Aversa, F., 2007. Competing risk analysis using R: an easy guide for clinicians. Bone Marrow Transplantation, 40(4), pp.381–387.
Scrucca, L., Santucci, A. & Aversa, F., 2010. Regression modeling of competing risk using R: an in depth guide for clinicians. Bone Marrow Transplantation, 45(9), pp.1388–1395.
Sengsayadeth, S. et al., 2015. Reduced intensity conditioning allogeneic

267
hematopoietic cell transplantation for adult acute myeloid leukemia in complete remission - a review from the Acute Leukemia Working Party of the EBMT. Haematologica, 100(7), pp.859–869.
Shaffer, B.C. et al., 2016. Phase II Study of Haploidentical Natural Killer Cell Infusion for Treatment of Relapsed or Persistent Myeloid Malignancies Following Allogeneic Hematopoietic Cell Transplantation. Biology of Blood and Marrow Transplantation, 22(4), pp.705–709.
Shah, N. et al., 2017. Phase I study of cord blood-derived natural killer cells combined with autologous stem cell transplantation in multiple myeloma. British Journal of Haematology, 177(3), pp.457–466.
Shaw, B.E. et al., 2007. The importance of HLA-DPB1 in unrelated donor hematopoietic cell transplantation. Blood, 110(13), pp.4560–4566.
Shibuya, A. et al., 1996. DNAM-1, a novel adhesion molecule involved in the cytolytic function of T lymphocytes. Immunity, 4(6), pp.573–81.
Shifrin, N., Raulet, D.H. & Ardolino, M., 2014. NK cell self tolerance, responsiveness and missing self recognition. Seminars in Immunology, 26(2), pp.138–144.
Shimizu, Y. & DeMars, R., 1989. Production of human cells expressing individual transferred HLA-A,-B,-C genes using an HLA-A,-B,-C null human cell line. Journal of immunology (Baltimore, Md. : 1950), 142(9), pp.3320–8.
Shlomchik, W.D., 2007. Graft-versus-host disease. Nature Reviews Immunology, 7(5), pp.340–352.
Shulman, Z. et al., 2011. Transendothelial migration of lymphocytes mediated by intraendothelial vesicle stores rather than by extracellular chemokine depots. Nature Immunology, 13, pp.67–76.
da Silva, I.P. et al., 2014. Reversal of NK-cell exhaustion in advanced melanoma by Tim-3 blockade. Cancer immunology research, 2(5), pp.410–22.
Simonetta, F. et al., 2015. NK Cell Functional Impairment after Allogeneic Hematopoietic Stem Cell Transplantation Is Associated with Reduced Levels of T-bet and Eomesodermin. The Journal of Immunology, 195(10), pp.4712–4720.
Simonetta, F., Pradier, A. & Roosnek, E., 2016. T-bet and Eomesodermin in NK Cell Development, Maturation, and Function. Frontiers in immunology, 7, p.241.
Sivori, S. et al., 1997. p46, a novel natural killer cell-specific surface molecule that mediates cell activation. The Journal of experimental medicine, 186, pp.1129–1136.
Smyth, M.J. et al., 2005. Activation of NK cell cytotoxicity. Molecular Immunology, 42(4), pp.501–510.
Smyth, M.J. et al., 2000. Perforin-mediated cytotoxicity is critical for surveillance of spontaneous lymphoma. The Journal of experimental medicine, 192(5), pp.755–60.
Snowden, J.A. & Hill, G.R., 2017. Conditioning regimens for autologous haematopoietic stem cell transplantation - can natural killer cell therapy help?

268
British Journal of Haematology, 177(3), pp.341–342.
Socié, G. & Blazar, B.R., 2009. Acute graft-versus-host disease: from the bench to the bedside. Blood, 114(20), pp.4327–36.
Socié, G. & Ritz, J., 2014. Current issues in chronic graft-versus-host disease. Blood, 124(3), pp.374–84.
Soiffer, R.J. et al., 2011. Impact of immune modulation with anti-T-cell antibodies on the outcome of reduced-intensity allogeneic hematopoietic stem cell transplantation for hematologic malignancies. Blood, 117(25), pp.6963–6970.
Solana, R. et al., 2014. Shaping of NK cell subsets by aging. Current opinion in immunology, 29, pp.56–61.
Sorror, M.L. et al., 2005. Hematopoietic cell transplantation (HCT)-specific comorbidity index: a new tool for risk assessment before allogeneic HCT. Blood, 106(8), pp.2912–9.
Stanietsky, N. et al., 2013. Mouse TIGIT inhibits NK-cell cytotoxicity upon interaction with PVR. European Journal of Immunology, 43(8), pp.2138–2150.
Stanietsky, N. et al., 2009. The interaction of TIGIT with PVR and PVRL2 inhibits human NK cell cytotoxicity. Proceedings of the National Academy of Sciences of the United States of America, 106(42), pp.17858–63.
Steidl, C. et al., 2011. MHC class II transactivator CIITA is a recurrent gene fusion partner in lymphoid cancers. Nature, 471(7338), pp.377–381.
Stern, M. et al., 2013. Pre-emptive immunotherapy with purified natural killer cells after haploidentical SCT: a prospective phase II study in two centers. Bone marrow transplantation, 48(3), pp.433–8.
Storek, J. et al., 2001. Factors influencing B lymphopoiesis after allogeneic hematopoietic cell transplantation. Blood, 98(2), pp.489–91.
Storek, J. et al., 2008. Reconstitution of the immune system after hematopoietic stem cell transplantation in humans. Seminars in Immunopathology, 30(4), pp.425–437.
Strauss-Albee, D.M. et al., 2015. Human NK cell repertoire diversity reflects immune experience and correlates with viral susceptibility. Science translational medicine, 7(297), p.297ra115.
Street, S.E.A. et al., 2002. Suppression of lymphoma and epithelial malignancies effected by interferon gamma. The Journal of experimental medicine, 196(1), pp.129–34.
Stute, N. et al., 1992. Pharmacokinetics of subcutaneous recombinant human granulocyte colony- stimulating factor in children. Blood, 79(11).
Su, Y.-C. et al., 2012. G-CSF downregulates natural killer cell-mediated cytotoxicity in donors for hematopoietic SCT. Bone Marrow Transplantation, 47, pp.73–81.
Subramanian, A. et al., 2005. Gene set enrichment analysis: a knowledge-based approach for interpreting genome-wide expression profiles. Proceedings of the National Academy of Sciences of the United States of America, 102(43),

269
pp.15545–50.
Suciu, S. et al., 2003. Allogeneic compared with autologous stem cell transplantation in the treatment of patients younger than 46 years with acute myeloid leukemia (AML) in first complete remission (CR1): an intention-to-treat analysis of the EORTC/GIMEMAAML-10 trial. Blood, 102(4), pp.1232–40.
Sugrue, M.W. et al., 1998. The effect of overnight storage of leukapheresis stem cell products on cell viability, recovery, and cost. Journal of hematotherapy, 7, pp.431–436.
Sun, J.C. et al., 2011. Homeostatic proliferation generates long-lived natural killer cells that respond against viral infection. The Journal of experimental medicine, 208(2), pp.357–68.
Sun, J.C., Beilke, J.N. & Lanier, L.L., 2009. Adaptive immune features of natural killer cells. Nature, 457(7229), pp.557–561.
Sun, J.C. & Lanier, L.L., 2011. NK cell development, homeostasis and function: parallels with CD8+ T cells. Nature reviews. Immunology, 11(10), pp.645–57.
Sun, J.C. & Lanier, L.L., 2008. Tolerance of NK cells encountering their viral ligand during development. The Journal of Experimental Medicine, 205(8), pp.1819–1828.
Surh, C.D., 2000. Homeostatic T Cell Proliferation: How Far Can T Cells Be Activated to Self-Ligands? Journal of Experimental Medicine, 192(4), p.9F–14.
Sutlu, T. et al., 2012. Inhibition of intracellular antiviral defense mechanisms augments lentiviral transduction of human natural killer cells: implications for gene therapy. Human gene therapy, 23(10), pp.1090–100.
Swann, J.B. & Smyth, M.J., 2007. Immune surveillance of tumors. The Journal of clinical investigation, 117(5), pp.1137–46.
Tauro, S. et al., 2005. Allogeneic Stem-Cell Transplantation Using a Reduced-Intensity Conditioning Regimen Has the Capacity to Produce Durable Remissions and Long-Term Disease-Free Survival in Patients With High-Risk Acute Myeloid Leukemia and Myelodysplasia. Journal of Clinical Oncology, 23(36), pp.9387–9393.
Theilgaard-Mönch, K. et al., 2001. Flow cytometric assessment of lymphocyte subsets, lymphoid progenitors, and hematopoietic stem cells in allogeneic stem cell grafts. Bone Marrow Transplantation, 28(11), pp.1073–1082.
Tonn, T. et al., 2001. Cellular Immunotherapy of Malignancies Using the Clonal Natural Killer Cell Line NK-92. Journal of Hematotherapy & Stem Cell Research, 10(4), pp.535–544.
Topham, N.J. & Hewitt, E.W., 2009. Natural killer cell cytotoxicity: How do they pull the trigger? Immunology, 128, pp.7–15.
Törlén, J. et al., 2014. Low CD34 dose is associated with poor survival after reduced-intensity conditioning allogeneic transplantation for acute myeloid leukemia and myelodysplastic syndrome. Biology of blood and marrow transplantation : journal of the American Society for Blood and Marrow

270
Transplantation, 20(9), pp.1418–25.
Toubai, T., Mathewson, N. & Reddy, P., 2014. The role of dendritic cells in graft-versus-tumor effect. Frontiers in immunology, 5, p.66.
Tratkiewicz, J.A. & Szer, J., 1990. Loss of natural killer activity as an indicator of relapse in acute leukaemia. Clinical and experimental immunology, 80(2), pp.241–6.
Uharek, L. et al., 1998. Abrogation of graft-vs.-leukemia activity after depletion of CD3+ T cells in a murine model of MHC-matched peripheral blood progenitor cell transplantation (PBPCT). Experimental hematology, 26(2), pp.93–9.
Uhrberg, M. et al., 1997. Human diversity in killer cell inhibitory receptor genes. Immunity, 7(6), pp.753–63.
Ullah, M.A., Hill, G.R. & Tey, S.-K., 2016. Functional Reconstitution of Natural Killer Cells in Allogeneic Hematopoietic Stem Cell Transplantation. Frontiers in Immunology, 7, p.144.
Ullrich, E. et al., 2016. Relation between Acute GVHD and NK Cell Subset Reconstitution Following Allogeneic Stem Cell Transplantation. Frontiers in immunology, 7, p.595.
Vahlne, G. et al., 2010. In vivo tumor cell rejection induced by NK cell inhibitory receptor blockade: Maintained tolerance to normal cells even in the presence of IL-2. European Journal of Immunology, 40(3), pp.813–823.
Valiathan, R. et al., 2012. Evaluation of a Flow Cytometry-Based Assay for Natural Killer Cell Activity in Clinical Settings. Scandinavian Journal of Immunology, 75(4), pp.455–462.
Vallera, D.A. et al., 2016. IL15 Trispecific Killer Engagers (TriKE) Make Natural Killer Cells Specific to CD33+ Targets While Also Inducing Persistence, In Vivo Expansion, and Enhanced Function. Clinical Cancer Research, 22(14), pp.3440–3450.
Velardi, A., 2008. Role of KIRs and KIR ligands in hematopoietic transplantation. Current Opinion in Immunology, 20(5), pp.581–587.
Verschoor, C.P. et al., 2015. An Introduction to Automated Flow Cytometry Gating Tools and Their Implementation. Frontiers in immunology, 6, p.380.
Vey, N. et al., 2012. A phase 1 trial of the anti-inhibitory KIR mAb IPH2101 for AML in complete remission. Blood, 120(22), pp.4317–23.
Vinay, D.S. et al., 2015. Immune evasion in cancer: Mechanistic basis and therapeutic strategies. Seminars in Cancer Biology, 35, pp.S185–S198.
Visentainer, J.E.L. et al., 2003. Serum cytokine levels and acute graft-versus-host disease after HLA-identical hematopoietic stem cell transplantation. Experimental hematology, 31(11), pp.1044–50.
Vitale, M. et al., 2014. Effect of tumor cells and tumor microenvironment on NK-cell function. European Journal of Immunology, 44(6), pp.1582–1592.
Vitale, M. et al., 2005. NK-dependent DC maturation is mediated by TNFalpha and

271
IFNgamma released upon engagement of the NKp30 triggering receptor. Blood, 106(2), pp.566–71.
Vitale, M. et al., 1998. NKp44, a novel triggering surface molecule specifically expressed by activated natural killer cells, is involved in non-major histocompatibility complex-restricted tumor cell lysis. The Journal of experimental medicine, 187, pp.2065–2072.
Vivier, E. et al., 2008. Functions of natural killer cells. Nature immunology, 9, pp.503–510.
Voskoboinik, I., Whisstock, J.C. & Trapani, J.A., 2015. Perforin and granzymes: function, dysfunction and human pathology. Nature Reviews Immunology, 15(6), pp.388–400.
Vyas, Y.M. et al., 2001. Spatial organization of signal transduction molecules in the NK cell immune synapses during MHC class I-regulated noncytolytic and cytolytic interactions. Journal of immunology (Baltimore, Md. : 1950), 167(8), pp.4358–67.
Waldmann, H. et al., 1984. Elimination of graft-versus-host disease by in-vitro depletion of alloreactive lymphocytes with a monoclonal rat anti-human lymphocyte antibody (CAMPATH-1). Lancet, 2, pp.483–486.
Walzer, T. et al., 2005. Natural-killer cells and dendritic cells: "l’union fait la force" Blood, 106(7), pp.2252–2258.
Wang, H. et al., 2007. The unexpected effect of cyclosporin A on CD56+CD16 and CD56+CD16+ natural killer cell subpopulations. Blood, 110(5), pp.1530–1539.
Wang, J.-W. et al., 2002. Influence of SHIP on the NK Repertoire and Allogeneic Bone Marrow Transplantation. Science, 295(5562), pp.2094–2097.
Weiden, P.L. et al., 1979. Antileukemic Effect of Graft-versus-Host Disease in Human Recipients of Allogeneic-Marrow Grafts. New England Journal of Medicine, 300(19), pp.1068–1073.
Weisdorf, D. et al., 1991. Risk factors for acute graft-versus-host disease in histocompatible donor bone marrow transplantation. Transplantation, 51, pp.1197–1203.
Weisdorf, D.J. et al., 2002. Allogeneic bone marrow transplantation for chronic myelogenous leukemia: comparative analysis of unrelated versus matched sibling donor transplantation. Blood, 99(6), pp.1971–7.
Welte, K., 2012. Discovery of G-CSF and Early Clinical Studies. In Twenty Years of G-CSF. Basel: Springer Basel, pp. 15–24.
Werneck, M.B.F. et al., 2008. T-bet plays a key role in NK-mediated control of melanoma metastatic disease. Journal of immunology (Baltimore, Md. : 1950), 180(12), pp.8004–10.
Wiernik, A. et al., 2013. Targeting natural killer cells to acute myeloid leukemia in vitro with a CD16 x 33 bispecific killer cell engager and ADAM17 inhibition. Clinical cancer research : an official journal of the American Association for Cancer Research, 19(14), pp.3844–55.

272
Wingard, J.R. et al., 2011. Long-term survival and late deaths after allogeneic hematopoietic cell transplantation. Journal of clinical oncology : official journal of the American Society of Clinical Oncology, 29(16), pp.2230–9.
Wong, H.C., Jeng, E.K. & Rhode, P.R., 2013. The IL-15-based superagonist ALT-803 promotes the antigen-independent conversion of memory CD8 + T cells into innate-like effector cells with antitumor activity. OncoImmunology, 2(11), p.e26442.
Wu, J. et al., 1999. An activating immunoreceptor complex formed by NKG2D and DAP10. Science (New York, N.Y.), 285(5428), pp.730–2.
Yamasaki, S. et al., 2003. Influence of transplanted dose of CD56+ cells on development of graft-versus-host disease in patients receiving G-CSF-mobilized peripheral blood progenitor cells from HLA-identical sibling donors. Bone Marrow Transplantation, 32(5), pp.505–510.
Yang, S. et al., 2005. Development of Retargeted CD38-Specific NK-92 Cell Line for Potential Anti-Myeloma Immunotherapy. Blood, 106(11).
Yokoyama, W.M. & Seaman, W.E., 1993. The Ly-49 and NKR-P1 Gene Families Encoding Lectin-Like Receptors on Natural Killer Cells: The NK Gene Complex. Annual Review of Immunology, 11(1), pp.613–635.
Younes, A. et al., 2016. Nivolumab for classical Hodgkin’s lymphoma after failure of both autologous stem-cell transplantation and brentuximab vedotin: a multicentre, multicohort, single-arm phase 2 trial. The Lancet Oncology, 17(9), pp.1283–1294.
Yu, J., Freud, A.G. & Caligiuri, M.A., 2013. Location and cellular stages of natural killer cell development. Trends in Immunology, 34, pp.573–582.
Yu, X. et al., 2009. The surface protein TIGIT suppresses T cell activation by promoting the generation of mature immunoregulatory dendritic cells. Nature Immunology, 10(1), pp.48–57.
Zafirova, B. et al., 2009. Altered NK Cell Development and Enhanced NK Cell-Mediated Resistance to Mouse Cytomegalovirus in NKG2D-Deficient Mice. Immunity, 31(2), pp.270–282.
Zaucha, J.M. et al., 2001. CD34 cell dose in granulocyte colony-stimulating factor-mobilized peripheral blood mononuclear cell grafts affects engraftment kinetics and development of extensive chronic graft-versus-host disease after human leukocyte antigen-identical sibling transplantation. Blood, 98(12), pp.3221–7.
Zhang, C. et al., 2017. Dynamic changes in serum cytokine levels and their clinical significance in predicting acute GVHD. Oncotarget, 8(32), pp.53691–53700.
Zhang, Q. et al., 2013. DAMPs and autophagy. Autophagy, 9(4), pp.451–458.
Zhang, Y. et al., 2007. In vivo kinetics of human natural killer cells: the effects of ageing and acute and chronic viral infection. Immunology, 121(2), pp.258–65.
Zuo, J. et al., 2017. A disease-linked ULBP6 polymorphism inhibits NKG2D-mediated target cell killing by enhancing the stability of NKG2D ligand binding. Science Signaling, 10(481).

273
Appendix