Embed Size (px)
Citation preview

RESEARCH
UAE INDUSTRIAL & LOGISTICSMARKET REVIEW 2019
THE UAE’S INDUSTRIAL AND LOGISTICS SECTOR CONTINUES TO MATURE PROVIDING NEW OPPORTUNITIES FOR OCCUPIERS

Bha
rain
Inte
rnat
iona
lIn
vest
men
t Pa
rk
Kin
g Ab
dulla
hEc
onom
ic C
ity
Dam
mam
3rd
Indu
stria
l City
Riy
adh
3rd
Indu
stria
l City
Jebe
lAli
Free
Zon
e
Nat
iona
l Ind
ustr
ies
Park
Dub
ai S
outh
Dub
ai In
vest
men
tsPa
rk
Shar
jah
Airp
ort
Inte
rnat
iona
l Fre
ezon
e
Kha
lifa
Indu
stria
l Zon
e
Ras
Al k
haim
ahFr
ee T
rade
Zon
e
Soha
r Po
rt a
ndFr
ee Z
one
Take-up from new entrants of industrial and logistics space has been limited. The relatively anaemic level of growth in demand coupled with greater levels of supply has exerted pressure on industrial real estate.
In the year to Q2 2019, average headline industrial rents have softened in Abu Dhabi and Dubai by 12.1% and 4.8% respectively.
In both cities, we are seeing a two-tiered market continuing to operate where rents for Grade B stock continue to fall at a faster pace compared to Grade A stock.
Headlines
“Initiatives by the government to ease regulations in the UAE will ensure that its regional hub status as an industrial and logistics hub stands firm in the face of increasing competition from regional peers. From a real estate and operations perspective, in order to set itself apart from the regional competition, the UAE must now focus on providing solutions that cater towards medium and high-tech sectors in manufacturing.”
Macroeconomic and sector overview Global economic growth rates over the last year have begun to moderate, with global GDP growth slowing from 3.8% in 2017 to 3.6% in 2018 according to IMF estimates. Escalating trade and geopolitical tensions have also weighed on global growth rates; the global trade volume growth rate has slowed from 5.5% in 2017 to 3.7% in 2018. The impact of these headwinds has largely been borne by the manufacturing sector, whilst the service sector has remained relatively resilient.
The UAE, as a central trading hub, has felt the impact of these headwinds more acutely in comparison to the global average and its emerging market counterparts. The UAE’s manufacturing, transport and storage output, which are the third (9.9% of GDP) and sixth largest (6.4% of GDP) components of the UAE’s economy, have both seen their annual rate of growth slow from 5.0% and 4.3% in 2017 to 1.9% and 1.4% in 2018 respectively. In comparison to global benchmarks, the United Nations Industrial Development Organisation (UNIDO) data shows that the average share of manufacturing of GDP in developed countries stands at 19.6%, currently the UAE is some distance from this mark at 9.2%.
There are material challenges for incumbents in these sectors, these are not only economic challenges, but also challenges raised by rapid changes in supply chains and customer demands. Despite these headwinds, the long-term prospects for the sectors remain favourable for firms that are agile to this change and countries that provide the right infrastructure and malleable business environment.
The UAE recognises the importance and potential of the manufacturing and logistics sectors. As a result, these sectors are a core facet of the UAE’s economic diversification plans, examples include the UAE Vision 2021, Abu Dhabi’s Economic Vision 2030 and Dubai’s Industrial Strategy 2030. Please refer to the important notice
at the end of this report.
The strategy aims to take advantage of the UAE’s modern infrastructure, ranked 5th globally (Figure 2) and central location. Its geographical location places the UAE on the doorstep of MEASA and its three billion inhabitants, a further two billion inhabitants are accessible within an eight-hour flight time. The UAE also complements this with its favourable soft infrastructure, where its World Bank Ease of Doing Business ranking has rapidly improved from 21st in 2018 to 11th in 2019.
These attributes have already attracted many multi-national firms to use the UAE as their regional supply and redistribution gateway. Despite this take-up, the manufacturing and transport and storage sectors have shown lacklustre growth of 27% each over the 10 years to 2018.
Over the last year, there have been various initiatives that have been enacted to facilitate stronger growth rates in these sectors. On a federal level, we have seen the UAE Cabinet announce a list of 122 activities and 13 sectors that have been approved for 100% foreign ownership, with local governments given the ability to cap the level of foreign ownership. The manufacturing industry and transport and storage sector are among the activities approved for 100% foreign ownership.
One of the historic drawbacks of Free Zone licences has been the limitation that firms may only operate within Free Zone boundaries. With the expansion of dual licencing, which initially was limited to Free Zones such as Abu Dhabi Global Market, D3, Dubai International Financial Centre and Dubai Airport Free Zone, this limitation has effectively been removed.
Dual licencing is now applicable in over eight main Free Zones in the UAE, allowing firms to retain 100% ownership, tax and excise duties advantages but removing the chief drawback of only being able to trade within the Free Zone. The easing of such regulations as well as Dubai’s proposed common Free Zone licence law amendment announced in May are likely to drive activity in the sector from both existing and new occupiers. Mars, the confectionery giant, has been one of the first multi-nationals that has taken advantage of the new foreign ownership regulation by making whole its
INDUSTRIAL RESEARCH
UAE INDUSTRIAL & LOGISTICS MARKET REVIEW 2019
stake in its Dubai business. On the back of this, the firm intends to strengthen its presence in the Middle East.
These initiatives to ease regulations in the UAE will ensure that its regional hub status as an industrial and logistics hub stands firm in the face of increasing competition from regional peers. From a real estate and operations perspective, in order to set itself apart from the regional competition, the UAE must now focus on providing solutions that cater towards medium and high-tech sectors in manufacturing. In established manufacturing output markets such as Singapore, Japan and South Korea, the medium and high-tech technology manufacturing sector accounted for over 75% of manufacturing according to the UNIDO. Increasing the share of medium and high-tech investment in this sector will be critical for the UAE in achieving the UN’s Sustainable Development Goal Nine, doubling the manufacturing industry’s share of GDP by 2030.
Looking ahead, global GDP growth is forecast to weaken further in 2019 to 3.2% before strengthening to 3.5% in 2020, both projections are 0.1% lower
compared to forecasts made in the first quarter of 2019. Global trade volume growth is also expected to weaken further, with forecasts expecting the 2019 rate of growth to decline to 2.5%, down from 3.7% in 2018. Over the same period, trade volumes of developed markets are forecast to decline from 3.1% to 2.2% and in emerging and developing markets from 4.7% to 2.9%. Trade volume growth is expected to pick up for both developed and emerging markets in 2020 to 3.1% and 4.8% respectively.
Stronger forecasts for long-term global growth, coupled with significant easing of regulations over the last year are expected to underpin growth in the UAE’s industry sector (which consists of the extraction, manufacturing, utilities and construction sectors) over the next decade. This forecast growth is likely to be centred in the UAE’s two largest economies, Abu Dhabi and Dubai, where growth over the next decade to 2028, is forecast to register at 37% and 57% respectively.
Quality of overall infrastructure
Overall infrastructure ranking Quality of roads
Liner shipping connectivity index
Efficiency of air transport services
Airport Connectivity Efficiency of seaport service
Quality of transport infrastructure
19
7
5
15
9
12
13
3
FIGURE 2 UAE Competitiveness, Global Rank (out of 140)
FIGURE 1 Cost of Doing Business - Manufacturing
Source: World Economic Forum
Source: KPMG
$ 7
USD
, Mill
ions
$ 6
$ 5
$ 4
$ 3
$ 2
$1
$
Cost of Setup of a Manufacturing Business Lower Estimate Total
Cost of Operations of a Manufacturing Business Higher Estimate Total
UAE INDUSTRIAL & LOGISTICS MARKET REVIEW 2019
MATTHEW DADD Partner, Occupier Solutions Commercial Agency (OSCA)

Location Dubai Airport Free Zone Al Quoz Al Qusais Ras Al Khor JAFZA
Jebel Ali Industrial
AreaDIC
Dubai Investments
ParkDubai South Dubai
Maritime City
Established 1996 1973 1975 1976 1985 1995 2004 1997 2006 2007
Status Free Zone Non Free Zone Non Free Zone Non Free Zone Free Zone Non Free Zone Non Free Zone Non Free Zone Non Free Zone / Free Zone Non Free Zone
Total area (sq km) 0.7 27 8 12 56 22 32 52 146 2.3
Time to airport
Located next to DXB
25 minutes to DXB
15 minutes to DXB
18 minutes to DXB
25 minutes to DWC
15 minutes to DWC
20 minutes to DWC
15 minutes to DWC
Located next to DWC
20 minutes to DXB
DU
BAI
Location Mussafah Industrial City of Abu Dhabi
Khalifa Industrial Zone Abu Dhabi
(KIZAD)
Abu Dhabi Airport Free Zone
Established 1998 2004 2010 2006
Status Non Free Zone Non Free Zone Non Free Zone / Free Zone Free Zone
Total area (sq km) N/A 40 100 12
Time to airport 20 mins to AUH 22 mins to AUH 32 minutes to AUH & DWC Located next to AUH
ABU
DH
ABI
Source: Knight Frank ResearchNote: This map is for illustrative purposes only. It outlines thebroader areas in each case, rather than only the industrial areas. DXB - Dubai International Airport / DWC - Al Maktoum International Airport / AUH - Abu Dhabi International Airport
FIGURE 3 Abu Dhabi industrial zones overview
FIGURE 4 Dubai industrial zones overview
UAE INDUSTRIAL & LOGISTICS MARKET REVIEW 2019 UAE INDUSTRIAL & LOGISTICS MARKET REVIEW 2019
ICAD
MussafahADAFZ
Al Markaz
KIZAD
DICDubaiSouth
NationalIndustries
Park
JAFZA
JAFZA
Jebel Ali Industrial
Dubai Investments Park
Dubai Maritime City
Ras Al Khor
DAFZAAl Quoz
Source: Knight Frank ResearchNote: This map is for illustrative purposes only. It outlines thebroader areas in each case, rather than only the industrial areas. DXB - Dubai International Airport / DWC - Al Maktoum International Airport / AUH - Abu Dhabi International Airport

UAE INDUSTRIAL & LOGISTICS MARKET REVIEW 2019
Source: Knight Frank Research
UAE INDUSTRIAL & LOGISTICS MARKET REVIEW 2019
Al Quoz
Al Quoz 2 (Class 2)
Jebel Ali Ind (Class 2)
DIP
NationalIndustries Park
DIC
Dubai Maritime City
JAFZA
JAFZA (Class 2)
FIGURE 8 Average Abu Dubai Industrial Rents, AED per sqm, per annum
Q4
2014
0
100
200
300
400
500
600
700
800
900
1000
Q1
2015
Q2
2015
Q3
2015
Q4
2015
Q1
2016
Q2
2016
Q3
2016
Q4
2016
Q1
2017
Q2
2017
Q3
2017
Q4
2017
Q1
2018
Q2
2018
Q3
2018
Q4
2018
Q1
2019
Q2
2019
Abu Dhabi Airport Free Zone ICAD 1Mussafah Al Markaz KIZAD
FIGURE 9 Average Dubai Industrial Rents, AED per sq ft, per annum
10
-
20
30
40
50
60
Q2
2014
Q3
2014
Q4
2014
Q1
2015
Q2
2015
Q3
2015
Q4
2015
Q1
2016
Q2
2016
Q3
2016
Q4
2016
Q1
2017
Q2
2017
Q3
2017
Q4
2017
Q1
2018
Q2
2018
Q3
2018
Q4
2018
Q1
2019
Q2
2019
Market overview Using data from KPMG’s Cost of Doing Business: Manufacturing, Knight Frank has analysed the UAE’s manufacturing competitiveness in comparison to other GCC countries. This analysis looks at the cost of setting up and operating a manufacturing business across key manufacturing centres in GCC countries.
The data shows that of the 12 locations covered in this report (figure 1), Dubai hosts the top two most expensive locations for setting-up and operating a manufacturing business. However, it is important to note that compared to the average total cost of setting-up and operating across these 12 locations, Dubai’s two locations only equate to a 4% mark-up compared to the regional average total cost.
Khalifa Industrial Zone Abu Dhabi’s (KIZAD) cost of setting-up and operating registered at 1% cheaper in comparison to the regional average. Bahrain International Investment Park was the cheapest location in the region to setup and operate a manufacturing business, with UAE based hubs registering 16% to 21% more expensive on average in comparison.
However, given the infrastructure advantages that the UAE enjoys over its GCC peer countries, the uplift in setup and operating costs seem warranted.
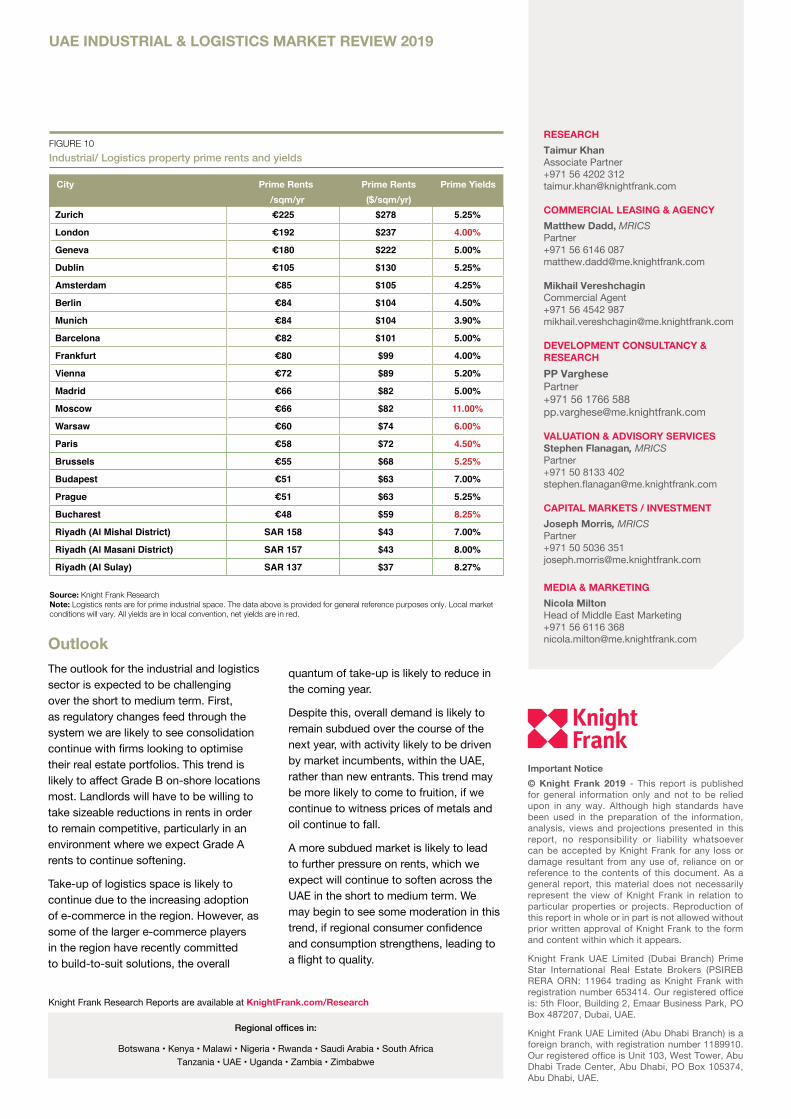
On a global level, the UAE industrial and
logistics market compares favourably to various global hubs, with rents on average registering 15.6% lower compared to our European and Middle East sample (Figure 10).
Investment MarketDespite a more subdued market, investment appetite for industrial and logistics assets remains strong in the UAE, from both institutional and private investors. This is driven by the sector’s favourable long-term outlook, particularly as a result of the rapid growth in sectors such as e-commerce and third party logistics; where demand stems from the UAE and the wider GCC region. Easing of regulations relating to customs clearances and dual licencing are set to facilitate this growth further. However, finding opportunities remains a challenge, one that is not eased by restrictive regulations such as sub-leasing charges, which discourage investment from potential investors.
Due to these adverse market conditions and fragmented levels in quality of assets in the industrial and logistics sector, prime industrial yields in the UAE have a healthy spread over global averages (Figure10). More so, as investment opportunities and quality assets become more scarce we are seeing industrial and logistics yields move out further.
Market ReviewDue to the challenging global economic backdrop and lacklustre growth in the UAE’s economy, which has in turn impacted consumer consumption, the industrial and logistics sectors are facing challenging trading conditions.
Furthermore, there are fundamental changes which are currently affecting the industrial and logistics sector. First, as the practice of dual licencing becomes more prevalent we are beginning to see greater levels of consolidation in the market as occupiers look to increase the efficiency of their real estate portfolios. Given general market conditions, occupiers are using this as an opportunity to upgrade to higher specification units that comply with the standards borne in leading industrial centres.
Due to these conditions, take-up from new entrants has been limited. This relatively anaemic level of growth in demand coupled with greater levels of supply, both new supply and supply which is now increasingly more feasible for tenants to sublease with a reduction or removal of subleasing fees across a range of zones. This increase in supply will likely exert pressure on industrial real estate.
As a result, in the year to Q2 2019, average headline industrial rents have softened in Abu Dhabi and Dubai by 12.1% and 4.8% respectively.
In both cities, we are seeing a two-tiered market continuing to operate where rents for Grade B stock continues to fall at a faster pace compared to Grade A stock. In Abu Dhabi’s secondary locations such as Al Markaz rents fell by much at 18.4% on average in the 12 months to June 2019. Grade A locations such as Abu Dhabi Airport Free Zone performed better comparatively with rents falling marginally by 2.5%.
A similar trend has also been witnessed in Dubai, however due the demand and supply imbalance, Grade A rents have seen material declines. According to Dubai Statistics Centre, new industrial licence issuance increased by 9.7% in 2018, with renewal of existing licences remaining relatively flat at 0.4% and cancellation of industrial licences recording a 5.2% increase over the same period.
Due to this lack of demand and decisions by occupiers to vacate Grade B units which are no longer fit for purpose. We have seen rents in areas such as JAFZA and the Jebel Ali Industrial area soften over the last year. Rents currently stand on average at AED 28 and AED 24 per square foot, per annum, respectively.
Demand in the industrial and logistics sector in the first two quarters of 2018 was driven by manufacturing firms, which
accounted for 27% of total enquiries. The Food and Beverage and IT/ technology sector accounted for over 18% of total enquiries each. Logistics firms continue to be a strong source of demand with 14% of total enquiries originating from this sector.
Knight Frank data shows that over 74% of total enquiries in the six months to June 2019 required space in Dubai Industrial City, DAFZA or JAFZA. Dubai Investments Park and Dubai South complete the list of
top five most enquired locations.
Finally, over the first two quarters of 2019, 40% of enquiries have been for floor space of up to 10,000 square feet. Another 40% of enquiries demanded floor space of over 10,000 and up to 50,000 square feet. Demand for large units of over 50,000 square feet remains low with 20% of enquiries requiring space on this scale.
Source: Knight Frank Research
Source: Knight Frank Research
FIGURE 5 UAE, Industrial and logistics enquiries by location (% of total enquiries)
FIGURE 6 UAE, Industrial and logistics enquiries by industries (% of total enquiries)
FIGURE 7 UAE, Industrial and logistics enquiries by size (% of total enquiries)
Dubai South
DIC
DAFZA
National Industries ParkJAFZA
Dubai Investments Park Media / PublishingManufacturing
Food & Beverage Architects / Interior Design
Consultant
Engineering & constructions
IT / Technology
Logistics
34% 27%
20%
40%
40%18%
18%
14%
9%
5%5%
5%
20%20%
14%
9%3%
50,001+
0 - 9,999
10,000 - 50,000
“Take-up of logistics space is likely to continue due to the increasing adoption of e-commerce in the region. However, as some of the larger e-commerce players in the region have recently committed to build-to-suit solutions the overall quantum of take-up is likely to reduce in the coming year.”
TAIMUR KHAN Associate Partner
Knight Frank Research Reports are available at KnightFrank.com/Research
Regional offices in:
Botswana • Kenya • Malawi • Nigeria • Rwanda • Saudi Arabia • South Africa Tanzania • UAE • Uganda • Zambia • Zimbabwe
RESEARCHTaimur KhanAssociate Partner+971 56 4202 [email protected]
COMMERCIAL LEASING & AGENCY Matthew Dadd, MRICS Partner+971 56 6146 [email protected]
Mikhail Vereshchagin Commercial Agent+971 56 4542 [email protected]
DEVELOPMENT CONSULTANCY & RESEARCHPP VarghesePartner+971 56 1766 [email protected] VALUATION & ADVISORY SERVICESStephen Flanagan, MRICSPartner+971 50 8133 [email protected] CAPITAL MARKETS / INVESTMENTJoseph Morris, MRICSPartner+971 50 5036 [email protected] MEDIA & MARKETINGNicola MiltonHead of Middle East Marketing+971 56 6116 [email protected]
Important Notice© Knight Frank 2019 - This report is published for general information only and not to be relied upon in any way. Although high standards have been used in the preparation of the information, analysis, views and projections presented in this report, no responsibility or liability whatsoever can be accepted by Knight Frank for any loss or damage resultant from any use of, reliance on or reference to the contents of this document. As a general report, this material does not necessarily represent the view of Knight Frank in relation to particular properties or projects. Reproduction of this report in whole or in part is not allowed without prior written approval of Knight Frank to the form and content within which it appears.
Knight Frank UAE Limited (Dubai Branch) Prime Star International Real Estate Brokers (PSIREB RERA ORN: 11964 trading as Knight Frank with registration number 653414. Our registered office is: 5th Floor, Building 2, Emaar Business Park, PO Box 487207, Dubai, UAE.
Knight Frank UAE Limited (Abu Dhabi Branch) is a foreign branch, with registration number 1189910. Our registered office is Unit 103, West Tower, Abu Dhabi Trade Center, Abu Dhabi, PO Box 105374, Abu Dhabi, UAE.
UAE INDUSTRIAL & LOGISTICS MARKET REVIEW 2019
OutlookThe outlook for the industrial and logistics sector is expected to be challenging over the short to medium term. First, as regulatory changes feed through the system we are likely to see consolidation continue with firms looking to optimise their real estate portfolios. This trend is likely to affect Grade B on-shore locations most. Landlords will have to be willing to take sizeable reductions in rents in order to remain competitive, particularly in an environment where we expect Grade A rents to continue softening.
Take-up of logistics space is likely to continue due to the increasing adoption of e-commerce in the region. However, as some of the larger e-commerce players in the region have recently committed to build-to-suit solutions, the overall
quantum of take-up is likely to reduce in the coming year.
Despite this, overall demand is likely to remain subdued over the course of the next year, with activity likely to be driven by market incumbents, within the UAE, rather than new entrants. This trend may be more likely to come to fruition, if we continue to witness prices of metals and oil continue to fall.
A more subdued market is likely to lead to further pressure on rents, which we expect will continue to soften across the UAE in the short to medium term. We may begin to see some moderation in this trend, if regional consumer confidence and consumption strengthens, leading to a flight to quality.
FIGURE 10 Industrial/ Logistics property prime rents and yields
Zurich €225 $278 5.25%
London €192 $237 4.00%
Geneva €180 $222 5.00%
Dublin €105 $130 5.25%
Amsterdam €85 $105 4.25%
Berlin €84 $104 4.50%
Munich €84 $104 3.90%
Barcelona €82 $101 5.00%
Frankfurt €80 $99 4.00%
Vienna €72 $89 5.20%
Madrid €66 $82 5.00%
Moscow €66 $82 11.00%
Warsaw €60 $74 6.00%
Paris €58 $72 4.50%
Brussels €55 $68 5.25%
Budapest €51 $63 7.00%
Prague €51 $63 5.25%
Bucharest €48 $59 8.25%
Riyadh (Al Mishal District) SAR 158 $43 7.00%
Riyadh (Al Masani District) SAR 157 $43 8.00%
Riyadh (Al Sulay) SAR 137 $37 8.27%
City Prime Rents /sqm/yr
Prime Yields Prime Rents ($/sqm/yr)
Source: Knight Frank ResearchNote: Logistics rents are for prime industrial space. The data above is provided for general reference purposes only. Local market conditions will vary. All yields are in local convention, net yields are in red.