Embed Size (px)
Citation preview

U11,0,tLE COPV
A RAND NOTE
The Cost and Performance Implloatlons ofReliability Improvements In the F-16A/B Aircraft
CD
0 John B. Aboil, Thomas F. Klrkwood,L) Robert L. Petrusohell, Giles K. Smith
March 1988
DTICELECTSE
MAY 1 3
C~r
ALpproved lot puhM•C Tel",B|Distibution UnlunltOd .. I
4oVe~rRAND
Sýk88 ,5 C -,2". -

The Nmeh reported here was sponsored by the United States Air Forceunder Contract P49620-S&-C-000. Furtber information may be obtained fromthe Long Rangp Planning and Doctrine Division, Directorate of Plans, HqUSAF.
I
The RAND Publication Series: The Report is the principal publIcation documen--- ting and transmitting RAND's major research findings and final research resuirs.
The RAND Note reports other outputs of sponsored research for general distri-bution. Publications of The RAND Corporation do not necessarily reflect the4 'opinions or policies of the sponsors of RAND research.
Published by The RAND Corporation1700 Main Street, P.O. "Pox 2138, Santa Monica, CA 90406-2138
P0 x
14CNIIY CL.ASSIIICAYION ON T41S OAGC (When, Du ,ateS.E
REPOT DCUMNTATON AGEREAD INSTRUCTIONSREPOR DOCUENTATON PAE BEORE COMPL&TING FORMIREOR? 14UMSEIR 2. GOVY AC.CESSION NO. 3-01. RCI0191NS CAT ALOC' fiUmaSIR
N-2499-AF ___________
4. TITLE (and Subwei). S. TY101 OF ngpostT & foEIjIOO COVEREDo
The Cost and Performance Implications of Interim hS
Reliability Improvements in the F-16A/B4-Aircraft 'PIENPORWIMINO ORG. Roepopti MUM SIR
John B. Abell, Thomas F. Kirkwjood, Robert L.Petruschell, Giles K. Smith 1'49620-86-C-0008,
6. PER"FORMING ORGANIZATION MAMIL AND ACONESIIS I" PA AtOGR XAM.O9 I'EME NT, PROJZ9C T. T ASKC
The RANT) Corporation tUrU,1I
1700 Main StreetSantaMonica,_CA. 90406 ____________
It. CONTROL.LING OFIFICIE MAMIE AND ADORIESS 11-AEPIR DATEDirectorate of Plans ach18
Office, ~ ~ ~ ~ ~ ~ UNE DC/Fan Pn oprtin 13 EmnofpaSHq. USAF, Washington DC 20330 77
Is. MONITORliNG A09NCY MAMIE & AO3ORIESS(if difeentfrom,#l Controlling Ditt,111) 16, 1ECUPITY CLASS (of thsa empate)
Unclassified168. 0~SI I CATION/ DOWN43RADING
IC. DISTftIOUTION STATIEMIENT (91 this e port)
Approved'for Public Release; Distribution Unlimited
17- OISYRIOUTIOpe STATIEMENHT (01 the offselt entereod In Stock 20, It dlutqfne from Report)
No Restrictions
IC SUPPLEMEIIIINTARY NOTES
( 13 KEtY WOODS (COcniinu* On POV.6.4 lid* if ne-4140MY and Identfyi~ by block cismbgp)
'-Fighter Aircraft) Cost Analysis/Reliabilitvr Air Force Procurement/Maintainabilt Perf ormance jEngineering). -
20.~~~~~9 fI~vTNAC (64041 n ~~e ad It n104686orr and Identify by block n.ymber)
See reverse side c
DO I' W73UNCLASSIFIED
0SaCURIIV CLASSIPICArIO N OF T" -II PA E (7 i-- 04t- 8..e-n.d)
0 tl~l 10 1 11 1 11 1 *,1' 0 0 0 0 0

SeCu NITY CLASAUI ICATI@N OP T141S PAOCMI%, 0010 E80ceed) ____________________
.. This Note suggests the magnitude of the
effects of policies and strategies toenhance reliability of Air Force aircraftweapon systems. Using the F-16A/B fighter Saircraft program as a case study, theauthors found that the benefits of improvedreliability include (1) a reduction inbase-level maintenance manpowerrequirements, (2) increased capability togenerate sorties, (3) lowered costs forprocurement and repair of engines and spareparts, and (4) reductions in the resources(both equipment and manpower) required to . LI)deploy a combat unit to an overseas site. •A ,K. .
INI
UNCLAS SIVTFnSECURITY CAUIPICATION OF ?Mic 9AG[(Wh.m 0ale IntePd)
• O • • • 0 • • • • • • •Q1

A RAND NOTE N-2499-AF
The Cost and Performance Implications ofReliability Improvements In the F-I 6A/B3 Aircraft
John B. Abell, Thomas F. Kirkwood,Robert L. Petruscheii, Giles K. Smith
March 1988
Prepared forThe United States Air Force
Aceosior For
NTIS CRA&I1OTIC TAB rUundinounrced
Ot.buotBy....
RAND
RA N D ~ APROVED FOE PUBLIC 11111.1,41 DISTRIBUTION UNILIMUITD

PREFACEIThe work reported in this Note is intended to support the formulation (and evaluation)
of policies and strategies to enhance the combat effectiveness of Air Force aircraft weapon
systems through improvements in reliability and maintainability (R&M). RAND's overall
R&M studies comprise three tasks:
1 Develop methods to quantify the full range of R&M effects on the operational
capabilities and lifecycle costs of weapon systems.
2. Develop acquisition strategies to achieve specified levels of R&M.3. Improve the way R&M specifications are written and the measurement of
R&M in force status reporting systems.
Reliability improvements carry both costs and benefits, as do improvements inmaintainability. Thus, in effect, four separate factors are involved in overall R&M studies.
This Note focuses solely on efforts to estimate part of the effect of one of those four factors,
selected benefits that could be obtained from improved reliability. Using the F-16 A/Bfighter aircraft program as a case study, it was found that the benefits of improved reliability
include:
* A reduction In base-level maintenance manpower requirements,0 Increased capability to generate sorties,
0 Lowered costs for procurement and repair of engines and spare parts, and0 Reductions in the resources (both equipment and manpower) required to deploy
a comabat unit to an overseas site.
This research is being conducted under the Project AIR FORCE ResourceManagement Program project entitled "Reliability and Maintainability" and should be ofinterest to senior Air Force officials concerned with acquisition and logistics management.
I oi

S
SUMMARY
The reliability of an aircraft's systems and subsystems determines to an important
extent its need for support resources and its ability to continue operating when resources are
limited. In the work described in this Note, which comprises several different studies
accomplished over a two-year period, Monte Carlo simulation models were used to estimatesome of the benefits of a postulated twofold or fourfold improvement in the reliability of the
F-16 A/B aircraft. The specific benefits estimated include:
* Reouctions in base-level maintenance manpower requirements.
* Enhanced sortie generation capability.
* Reductions in the cost of engines and certain spare parts.
. * Improvements in squadron deployment flexibility.
The amount of estimated benefits is substantial, totaling more than $1.2 billion InIlfecycle costs for engines and spare parts alone.
A twofold improvement in the overall reliability of the aircraft (a 50 percent
reduction in the rate of maintenance actions on all components of the aircraft) could reduce
maintenance manpower requirements an estimated 9 percent, given the same level of flyingactivity. A fourfold improvement could theoretically reduce manpower requirements by
nearly twice that.
Virtually Ill of the manpower savings occur In the C"omponent RepairSqumUron, such as reducing the requirements for avionics technicians by ab.l)ut a fourth and
for propulsion technicians by about a third, accompanied by ri odest reductions in certainother skills. Including training costs, the manpower reductions from a twofold reliability
Improvement represent an annual savings of about $5 million per 72-PAA F-1 A/B
wing.
The most Important benefit of Improved reliability lies in its effects on combat* capability. Improving reliability increases both sortie gLneration capability and the
probability of individual mission accomplishment, The reduction in maintenance manningdescribed above can, in fact, be traded off against an estimated 17 percent Increase In
wartime sortie generation capability with current manning levels.
AA V v
-1000ft & IA

-vi -
The effects of improved reliability (through lowered aircraft component removal andrepair rates) on the capital costs of spare engines and engine modules, and the costs ofprocurement, depot-level repair, and condeninations of certain recoverable spare parts for
the F-16 A/B program were also estimated.
Both twolold and fourfold reliability improvements just in the F- 16's fire-control andpropulsion system components (as reflected by a 50 percent reduction in component removalrates) were analyzed. Given a constant 80 percent aircraft availability goal, the twofold
reliability Improvement alone would yield an estimated cost savings of $1.2 billion (inconstant, undiscounted FY 84 dollars) over the 13-year period from 1978 through 1990.
Even more important than the dollar estimate of potential savings in capital costs,however, was the Identification of the effects of database churn, the yearly change in the
database used to calculate the numbers of spare parts needed and their cost. It results fromthe addition of entirely new parts, the exchange of new parts for parts currently in inventory,and changed characteristics of various parts (e.g., demand rates) over the time period, 4
Analysis of the 1982, 1983, and 1984 databases shows that chum alone can induce the need
for annual expenditures on spare parts equal to 16 to 21 percent of the total cost of all thespares in the system. The implications of this finding are important in estimating the costs ofspare parts needed for the F- 16 A/B over its lifecycle and are probably equally important
when applied to other weapons systems over their lifetimes.
Improving reliability decreases both the number of personnel and the tonnage ofspare parts and equipment required to support short-term tactical deployments of aircraft.
The postulated twofold reliability improvement would reduce by approximately 40 tons thebare-base deployment support required for a 24-PAA F- 16 A/B squadron. Although
seemingly large in absolute terms, this tonnage represents only about 5 percent of the total
tonnage required by the squadron and includes only selected tractors, trailers, and loaders forhandling munitions and towing aircraft. Thus improved reliability does not dramatically
affect deployment support requirements,
Table S. I translates the twofold reliability improvement into monetary terms for threeof the individual benefits: reduced maintenance manpower requirements; lower capital costsfor engines and spare parts; and the reduction in lifecycle costs of spare parts. It excludes,however, the modest cost savings achieved by reducing deployment requirements by 40
tons. The table also reflects a rough estimate of the savings in the capital cost of WarReserves Spares Kits (WRSK). Two alternative ways of applying the benefits are shown,
either reducing manpower or increasing the sortie rate.
I€k-

Table S.1
AGGREGATE BENEFITS OF TWOFOLD IMPROVEMENTS IN RELIABILITY, FY 78-FY 90(Billions of FY 84 $)
Estimated Direct Engines,Wartime Savings Modules, and Reduction in
Sortie Rate from Reduced Recoverable WRSK LifecycleCategory of per Aircraft Maintenance Spare Parts Investment Costs of
Benefit per Day Manning Cost Savings Cost Savings" Spare Parts
Manpower reduction 3.0 0.3 1,2 0.2 1.7
Sortie capabilityincrease 3.5 0.0 1.1 0.1 1.2'Does not include replenishment or other lifecycle costs.
The first line of Table S. I shows the savings if the reliability improvement is used to
reduce maintenance manpower requirements without lowering wartime sortie generation
capabilities. It would be possible to save a total of $300 million (about $5 million
annually per 72 PAA wing for each of the eight USAF F-16 A/B operational and training
wings), plus about $1.4 bIllIon In capital costs and repair coats for spare parts.
Assuming that the total force was built up during the first half of the 1978-1990 time period,
the total estimated savings in lifecycle costs would be roughly $1.7 billion.
The sortie capability data in Table S. 1 am based on the assumption that all of tie
benefits of improved reliability would be realized in terms of increased sortie rates. This
would cause a slight reduction in the savings in capital costs for spares and WRSK.
Both cases are extremes in the sense that all of the benefits of the postulated
reliability improvements are applied in only one way. Nevertheless, the data provide some
insights into the dramatic size of the tradeoffs that might be possible."p ]Another way to view the savings in capital costs for engines and recoverable spare
pans, WRSK, and the lifecycle cost of spare parts would be to use them to reduce the overall
size of the USAF F-16 A/B force; fewer aircraft would be needed for the same sortieI• generation rate, Alternatively, the savings could be used to purchase additional aircraft.
S•' Used this way, the $1.7 billion savings in Ilfecycle costs would translate Into
approximately two additional 72-PAA F-16 wings.
S

-ix -
ACKNOWLEDGMENTS
The authors are indebted to Lieutenant Colonel Paul Cunningham, USAF, CaptainGlen Titus, USAF, and Mr. Phil Stone of Headquarters, TAC, for their advice and supportof our LCOM data requirements; to Major Lou Medal, USAF, for providing manpower
authorization data and for his helpful suggestions; and to Major Paul J. Wolf, USAF, forproviding us with F-16 manning data.
They are also indebted to Lieutenant Colonel James Masters, USAF, AF/LEXY, andT. J. O'Malley, Dr. Randall M. King, Lauretta Burke, and Virginia Mattem of the Logistics
Management Institute for their contributions to the estimation of investment savings forPeacetime Operating Stocks (POS) of recoverable spare parts; to Victor J. Presutti, Jr.,Captain Melinda S. Grant, USAF, Michael R. Niklas, Leonard Kramer, and Donald Keatonof the Air Force Logistics Command for their contributions to the estimation of engine andengine module investment savings; and to colleagues at RAND, Joseph P. Large, for hisestimates of aircraft flyaway cost; Donald E. Emerson, for modifying TSAR to adapt it tothis analysis and for his help in using it; Milton Kamins, for gathering and preparing input
data; and Michael Rich and Robert Paulson, for their helpful comments and suggestions.Dr. King made especially important contributions to the estimates of the chum in the
Air Force's recoverable item database that made it possible to translate capital costs ofrecoverable POS into lifecycle costs. He was supported in this effort by Virginia Mattem.
, , QUIP

-xi -
CONTENTS
PREFA C E ..................................................... iii
SU M M AR Y .................................................... v
ACKNOWLEDGMENTS .......................................... ix
FIGURES.................................................... xiii
TA BLES .. .................................................... xv
THE COST AND PERFORMANCE OF IMPLICATIONS OF RELIABILITYIMPROVEMENTS IN THE F-16 A/B AIRCRAFT
Introduction .................. ............. .............. 1Analytic Approach ............. ............................ 2Maintenance Manning and Sortie Generation ....................... 3The Effects of Reliability on the Lifecycle Costs of Engines, Engine Modules,
and Recoverable Spares ..................................... 7Deploym ent ............................................... 12Overall Benefits ............................................ 15
Appendix
A. ESTIMATING THE BENEFITS OF IMPROVED RELIABILITY ONMAINTENANCE MANPOWER REQUIREMENTS AND WARTIMESORTIE GENERATION CAPABILITY ............................ 19
Personnel Estimates by Skill Area ............................... 19Methodology ......................................... 23How the TSAR Model Works. ................. 24The Scenario, Assumptions, and Analyses ......................... 26Overview of the Estimating Method .............................. 27Personnel Requirements Estimated with TSAR ...................... 29Estimating Day-Shift Flightline Personnel ......................... 31Estimating Support Shop and Night-Shift Flightline Personnel ........... 34Accounting for Indirect Work .................................. 36Personnel Not Estimated with TSAR ............................ 36Dealing with Random Numbers and Multiple Trials .................. 37
B. ESTIMATING THE EFFECTS OF RELIABILITY ON THE LIFECYCLECOSTS OF ENGINES, ENGINE MODULES, AND RECOVERABLESPA R ES .................................................... 39
Introduction ............................................... 39The Capital Costs of Engines and Engine Modules ................... 41Estimating the Effects of Enhanced Reliability on the Capital Costs for
Recoverable Spare Parts ........................ ........... 42Estimating Lifecycle Costs of Recoverable Spares ................... 47
C. THE EFFECTS OF IMPROVED RELIABILITY ON DEPLOYMENTREQUIREMENTS .......................................... 64
Types of Equipment and Personnel Deployed....................... 64Equipment that Need Not Be Deployed by Airlift .................... 64Air-Delivered Support Equipment .............................. 66Deployed Personnel........................................ 66Potential Reductions Due to Improved Reliability.................... 66Method of Determining Savings in Support Equipment.................69Using TSAR to Model the Potential Savings........................ 70Conclusion .............................................. 73
REFERENCES................................................ 77
al INUl I ti 1S l

- xiii -
FIGURES
1, Total Maintenance Personnel Savings vs. Sortie Rate for ReliabilityImprovement Factors of I X, 2X, and 4X ........................... 5
2. The Effects of Improved Reliability on F-16 A/B Total Investment andLifecycle Costs, Fiscal Years 1978 through 1990, 0.16 Chum ............ 10
3. Savings in Deployed Equipment ................................. 144. Savings in Deployed Personnel .................................. 145. Effect of Sortie Rate and Reliability on Total Weight of Support Equipment 15
A.1. Avionics Maintenance Personnel, F-16 A/B Wing .................... 21A.2. Airframe and AGE Maintenance Personnel, F-16 A/B Wing ............. 22A.3. Propulsion Maintenance Personnel, F-16 A/B Wing ................... 23A.4. Loaders, We-apons Release, and Gun Maintenance Personnel,
F-16 A/B W ing ............................................. 24A.5. Munitions Maintenance Personnel, F-16 A/B Wing ................... 25A.6. Probability that the Number of Personnel Working is Less than or
Equal to P ................................................. 33C.1. Deployed Support Items ....................................... 68C.2. F-16 Deployment Support ..................................... 70C.3. Effect of Soitie Rate and Reliability on Total Weight of Support Equipment . 74C.4. Maintenance Personnel ........................................ 75C.5. Savings in Deployed Equipment Weight per Squadron ................. 76C.6. Savings in Deployed Personnel per Squadron ....................... 76
LI
*u
I !tI

-xv -
TABLES
S.I. Aggregate Benefits of Twofold Improvements in Reliability,FY 78-FY 90 ............................................... vii
1. Effect of Improved Component Reliability on Base Level MaintenancePersonnel by Organization ..................................... 6
2. Effect of Improved Component Reliability on Base Level MaintenancePersonnel by Skill Group ...................................... 6
3. How Design Reliability Might Have Affected the F-16 A/B ProgramTotal Investment and Lifecycle Costs, FY 78 Through FY 90, with an0.16 Chum Factor ........................................... 11
4. How Design Reliability Might Have Affected the F-16 A/B ProgramTotal Investment and Lifecycle Costs, FY 78 Through FY 90, with an0.21 ChumnFactor..........................................1I1
5. How Design Reliability Might Have Affected the F-16 A/B ProgramTotal Livestment Lnd Lifecycle Costs, FY 78 Through FY 90, with ani0.10 Chum Factor .............. ....... .................... 12
6. Aggregate Benefits of Twofold Improvements in Reliability,FY 78-FY 0 ............................................... 16
A.l. Summary of Personnel Estimates by Case and Aggregate Skill Area ....... 20A.2. Identification of Analyses, 5 Waves per Day ........................ 27A.3. Source of F-16 Maintenance Manpower Estimates, Summary Table ....... 30A.4. Source of F-16 Maintenance Manpower Estimates, Deputy Commander
for M aintenance ............................................. 31A.5. Source of F-16 Maintenance Manpower Estimates, Aircraft Generation
Squadron .................................................. 32A.6. Source of F-16 Maintenance Manpower Estimates, Component Repair
Squadron .................................................. 34A.7. Source of F-16 Maintenance Manpower Estimates, Equipment
M aintenance Squadron ........................................ 35A.8. Sorties Achieved vs. Sorties Scheduled by Case ...................... 38B. 1. Scenario for Engine and Engine Module Requirements Computations ...... 41B.2. Engine and Engine Module Requirements ......................... 42B.3. Infenvd Mapping of Federal Stock Class into Aircrafi System ........... 44B.4. Scenario Data for Computing Recoverable POS Requirements ........... 45
B.5a. Capital Costs of Recoverable Spares to Maintain 80 Percent AircraftA vailability ................................................ 47
B.5b. Capital Costs of Pipeline Plus Safety-Level Stocks for the Fire Controland Propulsion System Components .............................. 48
B.6. Assumptions Underlying the 1983 to 1984 Computation ............... 52B.7. Composition of the 1983 to 1984 Capital Requirement ................. 52B.8. Assumptions Underlying the 1983 to 1985 Computation ............... 53B.9. Results of the 1983 to 1985 Computation .......................... 53
B.10. Assumptions Underlying the 1984 to 1985 Computation ............... 54B.1 1. Results of the 1984 to 1985 Computation .......................... 54B. 12. Effects of Changing Component Unit Prices ........................ 55B.13. Assumptions Underlying the 1982 to 1983 Computation ............... 55B.14. Composition of the 1982 to 1983 Capital Requirement ................. 56B 15. Assumptions Underlying the 1982 to 1984 Computation ............... 56B. I o. Results of the 1982 to 1984 Computation .......................... 57

-xvi-
B.17. Results of the 1983 to 1984 Computation Following the 1982 to 1983Procurem ent ............................................... 57
B.18. Effects of Changing Component Uidt Prices ........................ 58B.19. Comparison of Effects of 1982 to 1983 Chum with Effects of 1983 to
1984 Chum ................................................ 58B.20. F-16 A/B POS Investment Requirements by Fiscal Years, for 1978
Through 1990 .............................................. 60B.21. The Effects of Reliability and Chum on the Lifecycle Costs of
Recoverable Spares .......................................... 61B.22. Lifecycle C2ondemnation and Depot Repair Costs FY 78 Through FY 90 .... 62C. 1. Deployment of 24 F- 16s ....................................... 65C.2. Weight of Support Material Not Included in UTCs .................... 65C.3. Deployed Support and Maintenanc Items .......................... 67C.4. Deployed Personnel .......................................... 69C.5. Support Items Used in TSAR Analysis ............................ 72
I..'
I' 1
I
I
I

THE COST AND PERFORMANCE OF IMPLICATIONS OF RELUABILITYIMPROVEMEN'rS IN THE F-16 A/B AIRCRAFT
INTRODUCTION
In recent years there has been a growing consensus that U.S. weapon systems would
benefit from better reliability and maintainability (R&M). Numerous studies and reviews
have concluded that procedural deficiencies in the acquisition and support process have led
to serious R&M deficiencies in our operational systems. Early in 1985, the Air Force
responded to the problem by organizing a new headquarters office, the Special Assistant for
Reliability and Mainwinability, headed by a br!.gadier gnera1.. The uffice r•ports both w rie
Deputy Chief of Staff for Logistics and Engineering and to the Deputy Chief of Staff for
Research, Development and Acquisition.
Increasing attention is being paid to R&M requirements in the development
specifications for weapon systems. In the early 1960s, the development specification for the
F- 111 aircraft contained no mention of reliability and only a brief qualitative statement about
maintainability. The comparable specification for the F-15, issued nearly a decade later,
included a paragraph on reliability, but again it was entirely qualitative. When full scale
development was initiated on the F-16 in the mid- 1970s, the specification contained several
quantitative requirements for reliability and maintainability at both the system and subsystem
levels.[l] The specifications for more recent new aircraft starts, such as the C-17, contain
extensive requirements for R&M, backed up by warranties that will penalize the
manufacturer if those required levels of performance ait not achieved.[2]
Because there are costs associated with the achievement of higher levels of R&M, it
is important to quantify the benefits of specified levels of improvement so that sensible
R&M goals can be set In weapon system development programs. Eventually some sort of
yardstick will be needed to compare the costs of increasing R&M performance with the
benefits that would be achieved.
This Note addresses only the problem of estimating the benefits and only those
benefits associated with enhancing reliability, not with improved maintainability. It is
intended to provide some insights into the magnitude of savings achievable by improving
reliability in order to help USAF set future reliability goals and allocate resources to
reliability improvement programs. Reliability improvements can yield such benefits as
reductions in procurement and repair costs for spare parts or improvements in combat
capability.
I V,. ./i

-2"
In late 1984, a special task group was formed in Headquarters USAF to recommend
approaches to improving R&M. It defined a set of criteria for evaluating the benefits,
including:
"1. Manpower. The acquisition, training, and maintenance costs of support
manpower, especially in skills for which the Air Force competes with the
civilian economy.
2. Readiness. The measure of the number of sorties by fully mission-capable
aircraft that can be launched in a specified period of time, or the sortie rate that
can be sustained under some specified set of operational conditions.
3. Dollar costs. The investment and operation-and-support costs of the force.4. Mobility. Measured by the amount of maintenance equipment required to
support the deployment of combat units to "bare" bases.5. Dependability. The probability that all critical systems will continue to function
properly throughout the mission.
6. Vulnerability. Measured by the amount of support resources that are vulnerable
to loss in a combat environment.
These criteria, of course, are interrelated. For example, an improvement in reliability
can be reflected in increased sortie rate, or reduced maintenance manning, or reduced spares
levels, or some combination of all three; and the effects on support costs will depend on the
particular mix of actions taken to derive the benefits of the improvement. Thus it is not
possible to assess each potential benefit hidependently. However, by examining a mix of
possible benefits under different assumptions it is possible to gain some useful insights into
the magnitude of the benefits that can be achieved.
ANALYTIC APPROACH
In three largely independent studies reflected in this Note, we considered informationabout four of the six criteria for evaluating the benefits of reliability: manpuwer, readiness,the dollar costs (at least for spare parts), and mobility. We focused on the F- 16 A/B fighter
aircraft. One study examined the tradeoff between maintenance manning and sustainable
sortie rate; the second addressed the lifecycle investment costs for engines and enginemodules ond fth lifecycle procurement, depot-level repair, and condemnation costs ofrecoverable spare parts; and the third analyzed mobility requirements. The first and third
Ik
-3-
studies considered reliability improvements affecting the entire aircraft, while the second
study (detailed in App. B) dealt with the F-16's propulsion and fire control systems.
Summaries and results of each of the three analyses follow. Discussions of methodology
and further details concerning results can be found in the three appendices.
MAINTENANCE MANNING AND SORTIE GENERATION
Among the most important consequences of improved reliability are opportunities for
reduced requirements for support resources, for increased aircraft availability, or some
combination of the two. In this study, the Theater Simulation of Airbase Resources model
(TSAR), a detailed Monte Carlo simulation model, was used to estimate the tradeoffs
between base-level maintenance manpower requirements and sortie generation
capability.[3,4,5] This was done by varying the rates of maintenance actions three ways: by
setting them equal to current Air Force experience (the IX cas.), then to one half of those
values (the 2X case), and then to one fourth of those values (the 4X case), thus postulating
twofold and fourfold improvements in the reliability of all components of the aircraft. A
twofold reliability improvement simply means that half as many failures, component
removals, or maintenance actions occur as before. In this study we varied only the reliability
parameters and did not modify any of the maintenance networks--the set of maintenance
actions specified to the model.
Using input values obtained from Headquarters TAC, the model produced estimates
of maintenance manning requirements consistent with current Air Force manning documents
and. sortie generation rates. With the model so calibrated, we systematically varied the
desired sortie rate and determined the maintenance manning needs for each rate, first at the
current reliability levels, then for each of the two postulated reliability improvements.
Our analysis encompasses base-level maintenance manning requirements for a
72-PAA F-16 wing. The manpower requirements examined incl -.e those of the Deputy
Commander for Maintenance (DCM), the Aircraft Generation Squadron (AGS), the
Component Repair Squadron (CRS), and the Equipment Maintenance Squadron (EMS).
The wing was assumed to be operating in place during a seven-day surge in activity under
simulated wartime conditions. Modeling of the base case-about three sorties per aircraft per
day with current component reliability-produces estimated manning requirements that are
very close to the current manpower authorizations of 72-PAA F-16 wings.
Sorties were air-to-ground, lasting 1.7 hours on the average, and all flying was during
daylight hours. Each aircraft was scheduled to fly five sorties per day, at 0600, 0900, 1200,
1500, and 1800 hours. Aircraft were launched in flights of four, but if four were not

I
.4.
available, flights of three were acceptable. Flights of less than three aircraft were scrubbed.
Delays of up to 30 minutes were allowed in meeting the scheduled takeoff times.
Non-mission-critical maintenance was deferred until the end of the flying day.
All resources other than personnel (e.g., fuel, support equipment, spare parts, and
munitions) were assumed to be available in sufficient quantities that they did not limit the
scheduled flying program. The results reflect balanced mixes of the skills required; no skills
were in either long or short supply,
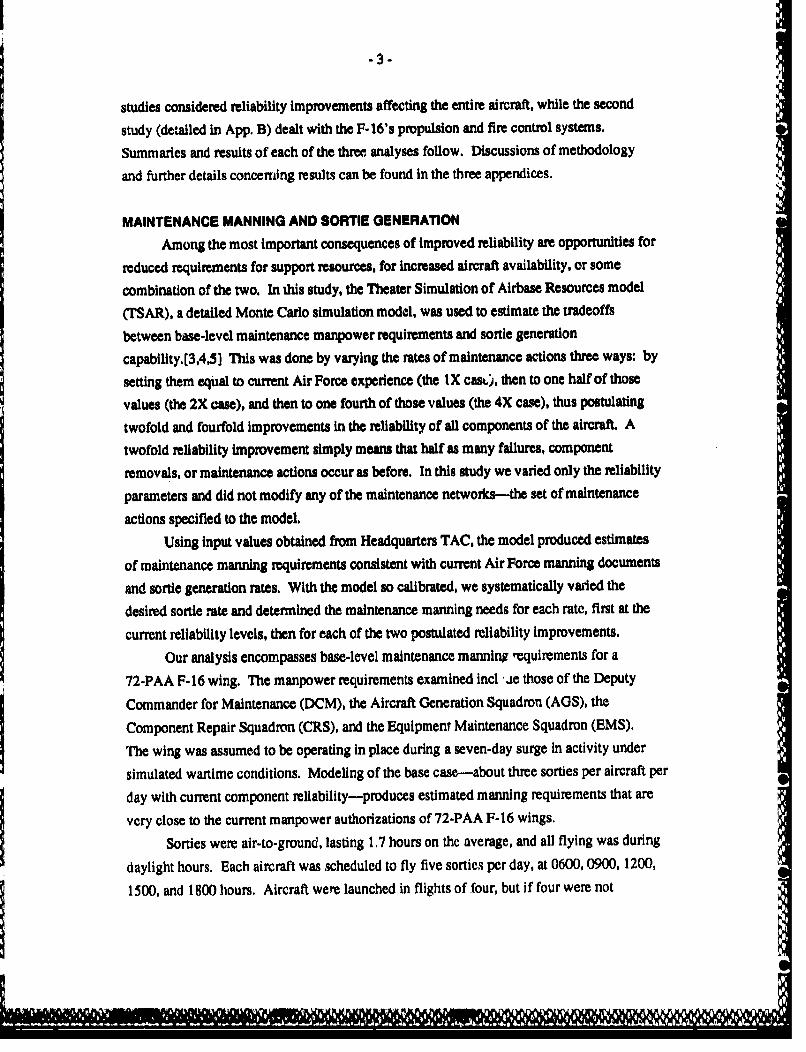
The results are shown in the curves in Fig. 1. Considering the base case, we estimate
that a twofold improvement in the reliability of all components could either reduce
maintenance manning requirements by 9 percent or increase sortie production by 17 percent.
Of course, some of the benefits could be taken in reduced manning and the rest in increased
sortie production. At a fourfold reliability improvement, maintenance manning
requirements could be reduced 16 percent or the sortie rate increased 30 percent. The curves
suggest how such tradeoffs could be made over a range of improvements up to four timesWgreater than present reliability and a range of sortie rates from about 1.5 to 4.0,
Table 1 shows the potential manpower savings, by organization, for the reference
case and for the 2X and 4X improved-reliability cases at an operating rate of slightly overthree sorties per day. A twofold improvement in reliability saves roughly 8 percent in
manpower, and a fourfold improvement saves about 14 percent.
The small difference between these numbers and the ones quoted above in describing
Fig. 1 results from slightly different assumptions about the sortie rate.
Organizationally, the manpower savings occur mostly in the Component Repair
Squadron (CRS). Some slight savings occur in the Aircraft Generatiorn Squadron (AGS),
almost none in the Equipment Maintenance Squadron (EMS), and none at all in the office of
the Deputy Commander for Maintenance (DCM). A twofold improvement in reliability
yields a 25 percent reduction in CRS manning and a 7 perce'nt ireduction in AGS manning.
We have assumed that DCM manning is necessary overhead that is independent of
component reliability and sortie rates. These results indicate that EMS manning is alsolargely independent of component and subsystem failure rates.
Savings by aggregate skill area are shown in Table 2. A more detailed breakdown is
shown in Figs. A. 1 through A.5 and the accompanying discussion in App. A.
The requirements for avionics technicians can be reduced by 24 and 38 percent,
respectively, for twofold and fourfold reliability improvements. Similarly, propulsiontechnicians can be reduc.,d by 32 and 50 percent, and Airplane General (APG) manpower
and Aerospace Ground Equipment (AGE) manpower by 14 and 26 percent, respcctively.
-5.
2000
Shaw AFB - - 17% 00
1500 12
Ix
2X4X
JSooo
500
Sorties per aircraft per day
Fig. 1-Total maintenance personnel savings vs. sortie ratefor reliability improvement factors of IX, 2X, and 4X

-6-
Table 1
EFFECT OF IMPROVED COMPONENT RELIABILITY ON BASE LEVELMAINTENANCE PERSONNEL BY ORGANIZATION'
Reliability Improvement Factor
1x 2X 4X
3,2 3.3 Difference 3.3 DifferenceOrganization S/A/Db S/A/ % S/A/D %
Deputy Commander for Maintenancle 142 142 0 142 0Aircraft Generation Squadron 798 750 -7 693 --13Component Repair Squadron 297 222 -25 183 -38Equipment Maintenance Squadron 399 395 -1 392 -2
Total Maintenance Personnel 1636 1509 -8 1410 -14
072-PAA F-16 A/B wing operating in place during a seven-day surge.bSorties per aircraft per day.
Table 2
EFFECT OF IMPROVED COMPONENT RELIABILITY ON BASE LEVELMAINTENANCE PERSONNEL BY SKILL GROUP
Reliability Improvement Factor
iX 2X 4X
3.2 3.3 Difference 3.3 DifferenceSkill Area S/A/Db S/A/D % S/D %
Avionics 229 175 -24 142 -.38Propulsion 127 86 -32 63 -50Aircraft General and AGE" 357 309 -14 266 -26Crew Chiefs, Weapons and
Munitions Handlers 923 939 +2 939 +2
Total Maintenance Personnel 1636 1509 -8 1410 -14
"72-PAA F-16 A/B wing operating in place during a seven-day surge.bSorties per aircraft per day.cAerospace ground equipment.
0I i

-7-
Highly skilled maintenance personnel, such as avionics and propulsion technicians,
are much more likely to be in short supply in the future and are more expensive to train and
retain than those in most other skills. A twofold improvement in component reliability could
make possible a reduction of 54 avionics technicians for a single wing, from 229 down to
175. For the roughly eight thee-squadron equivalent F-16 A/B wings in the Air Force
today, that would amount to a reduction of 430 avionics technicians. Similarly, we might
save a total of about 330 propulsion technicians and 380 airframe and AGE technicians. All
of this adds up to over 1,100 skilled maintenance people that the Air Force might be able to Ieither do without or use for other purposes.
The requirements for other maintenance manpower change little as a result of
reliability improvements. Although some fraction of the overhead and supervisory
personnel could be reduced if the requirement for other (direct) personnel were reduced,
such gains would be modest at best.
We have also made rough estimates of the possible commensurate reduction in the
annual operating cost for the wing. The savings am $5 million and $7 million per wing,
respectively, for the postulated twofold and fourfold Improvements, or roughly 2-3 percent
of a single wing's $250 million total annual operating cost.
THE EFFECTS OF RELIABILITY ON THE LIFECYCLE COSTS OF
ENGINES, ENGINE MODULES, AND RECOVERABLE SPARES
The reliability of an aircraft's systems to an important extent determines its need for
support resources. Logisticians have long argued that those needs should be considered
early in the conceptual phase of a weapon system's life and should influence the levels of
reliability that become an inherent part of the aircraft's design characteristics.[61
The work described below attempts to quantify the relationships between reliability
(as reflected by component removal and repair rates) and:
0 Capital costs for engines, engine modules, and recoverable spare parts;
a Total lifecycle costs (capital costs of replenishment and depot-level repair, and
replacement costs for condemned parts) for recoverable spare parts.
Substantial reductions in capital costs and lifecycle costs might have been achieved if
the F-16 A/B's fire control and propulsian systems (the two systems in the aircraft with the
greatest effects on support cost and system performance) had been designed initially with
I2 111111,1 N F

greater reliability. The lifecycle costs estimated here are based on postulated twofold and
fourfold improvements in component reliabilities for only the components of these two
systems. The Logistics Management Institute's Aircraft Availability Model (AAM) was
used for this analysis.
We estimate a potential total savings in these cost categories of $1.2 billion (in
constant, undiscounted FY 84 dollars) over the 13-year period from 1978 through 1990,
assuming only that the propulsion and fire control systems had been twice as reliable as they
actually were. (This estimated saving is roughly the equivalent in FY 84 dollars of theI
flyaway cost of 100 additional aircraft. The magnitude of these numbers in a program of the
dimensions of the F-16 A/B program suggests the benefits of enhancing the reliability we
design into our weapon systems.)
ChurnIn performing this study, we identified the importance of the effects of churn in the
annual database used to calculate the numbers of spai parts and their costs. Churn is the
year-to-year change in the database caused by the addition of entirely new parts, exchanges
of new parts for existing parts, and changes in the item characteristics of existing parts (e.g.,
price, specifications). Random changes In Item characteristics tend to create additional
capital cost requirements; however, whether such changes actually result in additional costs
depends on the asset position of the item (the total number of spares of the item in the
Inventory system) as well as the direction and magnitude of the changes in the item's
incharacteristics as reflected in the requirements database. Consider two items, A and B,
whose asset positions are consistent with past estimates of their pipeline values. Now
suppose the requirements database reflects changes in the characteristics of both items such
that the estimated pipeline of item A increases and that of item B decreases compared with
the estimates made using past databases. The computed requirement of item A will then be
increased by the computational system to maintain a constant level of aircraft availability,
and the computed requirement of item B will be zero. The "excess" of item B will
contribute less to increasing availability, other things equal, than the "shortage" of item A
detracts from it. Thus, on balance, random changes tend to induce the need for additional
assets.The database used by the Air Force to compute capital costs of recoverable spare
parts is not a model of a steady-state system, and it should not be thought of as such. If it
were a steady-state system, then accurate estimates of the cost of spare parts for all future
years of a weapon system's life could be made very early in its lifecycle. Clearly, that is not
the case.
-,

-9.
Instead, from year to year there are many changes in the database, creating the need
for investments in recoverable spare parts beyond those just to replace spares that have beencondemned as not economically repairable. This additional annual investment is required to
maintain the specified level of system performance. Our techniques for estimating chum so
as to account explicitly for the changes in item characteristics in the database are discussedin detail in App. B. The main points are summarized below.
The USAF database is subject to all of the dynamics that affect the world it
represents. If there were no changes from year to year In the numbers and types of items inthe database and in the characteristics of individual items, the annual requirement for spareparts would consist only of replacements for parts that had been condemned (assuming noother changes in the force posture, aircraft availability rate, or flying hour program).
The extent to which the database changes from year to year is substantial, however,even In the fairly benign peacetime environment. In wartime, the rate of change is likely tobe compounded by changing characteristics of the operational scenario. Planners must beable to estimate with accuracy the lifecycle costs of the recoverable spare parts needed tomaintain a specified level of aircraft availability across the life of the weapon system. And
we believe this ability depends on the ability of planners to quantify chum and to estimate its
effects on annual investment requirements over time.In accounting for the chum phenomenon, we developed a measure of the effect of
churn on the computed annual capital cost of recoverable spare parts. We call this measurethe churn factor, which is simply the estimated cost of replenishment spare parts (as opposedto initial spares) needed to maintain a specified level of system performance, divided by thetotal capital cost (the total cost of all stock levels at all locations In the supply system). Inother words, it is the proportion of the total capital costs spent on additional spare parts justto keep up with database dynamics.
In estimating lifecycle procurement costs for recoverable spares, we computed thedollar amount of chum and the associated chum factors using tiree consecutive USAF D041databases (those actually used by the Air Force to compute investment requirements forrecoverable spares). This resulted in the computation of two chum factors, 21 percent and16 percent. The first reflects the chum between the September 1982 and September 1983
databases, and the second reflects the chum between the September 1983 database and theone for September 1984.
I IU I RE0 sMW

-10-
Results
In the tables below and in Fig. 2 we summarize the estimated effects of improved
reliability on F-16 A/B investment costs. As can be seen by comparing the tables, the
effects of chum in the calculations for recoverable POS are substantial. In fact, the
magnitude of the effects of churn are especially remarkable when they are contrasted with
analytic results derived from the view that the database is a model of a steady-state system.
Table 3 summarizes the effects with a 0.16 chum factor (based on the 1983 and 1984
databases). A twofold reliability improvement could result in a total cost reduction of $1.2
billion, and a fourfold reliability improvement would result in a $1.8 billion savings. Table 4
5000 500 Recoverable POS
[ Depot repair
4045 condemnations4000
* Engines, modules
$1.2 billion
3000 2831
$0.6 billion2213
2000
1000
0 1 2X 4X
Reliability Improvement factor
Fig. 2-The effects of improved reliability on F-16 A/B total investmentand lifecycle costs, fiscal years 1978 through 1990, 0,16 churn
0v

Table 3
HOW DESIGN RELIABILITY MIGHT HAVE AFFECTED THE F-16 A/BPROGRAM TOTAL INVESTMENT AND LIFECYCLE COSTS,
FY 78 THROUGH FY 90, WITH AN 0.16 CHURN FACTOR(Million $)
Reliability Improvement
Investment Category iX 2X 4X
Recoverable POS 1245 977 839Depot-level component repair 1175 870 718Condemnation replacements 837 536 385Engines and engine modules 788 448 271
Totals 4045 2831 2213
Table 4
HOW DESIGN RELIABILITY MIGHT HAVE AFFECTED THE F-16 A/BPROGRAM TOTAL INVESTMENT AND LIFECYCLE COSTS,
PY 78 THROUGH FY 90, WITH AN 0.21 CHURN FACTOR(Million $)
Reliability Improvement
Investment Category IX 2X 4X
Recoverable POS 1506 1182 101,5Depot-level component repair 1175 870 718Condemnation replacements 837 536 385Engines and engine modules 788 44__8 27_1.
Totals 4306 3036 2389
is based on a chum factor of 0.21 (based on the 1982 and 1983 databases) and Table 5 on a •
chum factor of 0.10 (an arbitrary lower chum factor chosen by the researchers to help
illustrate the potential range of chum's effects). Even with a chum factor of 0.10, a twofold
reliability improvement would result in a savings of almost $1.2 billion, and a fourfold
reliability improvement would produce a $1.7 billion savings.
The reason for including a table of results fctofrhm r of 0t r0 is simply that
both the 0.16 and 0.21 estimates of the chult factor f rom the three successive databases
seem quite high and could be due to a handful of aberrant items. Indeed, in the estimate
made from the 1983-1984 computation, 50 line items accounted for 64 percent of the dollar
6

-12-
Table 5
HOW DESIGN RELIABILITY MIGHT HAVE AFFECTED THE F-16 A/BPROGRAM TOTAL INVESTMENT AND LIFECYCLE COSTS,
FY 78 THROUGH FY 90, WITH AN 0.10 CHURN FACTOR(Million $)
Reliability Improvement
Investment Category iX 2X 4X
Recoverable POS 901 707 607Depot-level component repair 1175 870 718Condemnation replacements 837 536 385Engines and engine modules 788 448 271
Totals 3701 2561 1981
amount of chum. Further estimates of chum from examination of additional databases could
be higher or lower. Thus it is difficult to infer a single chum factor that can be used reliably
to estimate lifecycle costs, based on the results of only two estimates of the dollar amount of
chum. These tables should be viewed, then, as a sort of sensitivity analysis showing how
lifecycle costs for recoverable spare parts vary as a function of the chum. As shown in these
three tables, it is the recoverable POS costs that are affected by the chum in the database.
Using the chum factor of 0.16, Fig. 2 presents a bar chart showing the reliability
effects from Table 3.
Based solely on this study, it is difficult to guess how the estimates of chum in the
lifecycle costs for F- 16 A/B recoverable POS might differ from those made for a different
weapon system. However, we believe it is an experiment worth replicating on several other
weapon systems.
DEPLOYMENT
Improvements in reliability would allow reductions to be made both in the amount of
equipment and spare parts and in the number of support personnel required to support the
overseas deployment of a squadron. We investigated this effect by examining bare-base
deployment requirements reflected in Wing Mobility Materiel Lists for 24-PA A F-16
squadrons.[71
*•

-13-
The support equipment covered by this analysis does not represent all of the tonnage
needed: fuel, armament, housing, and food were excluded, for example. These items
actually represent far more total tonnage than equipment items, but it is likely they would be
available locally or from sites where they have been prepositioned much closer to the
overseas deployment area, thus obviating the need for delivery from the CONUS.
Starting with the basic material list, we used the TSAR model to estimate the possible
reduction in support equipment and spare parts, as well as maintenance personnel, that could
be achieved with either a twofold or a fourfold improvement in the reliability of all of the
components of the F-16 A/B weapon system. The estimated reductions in mobility
requirements are expressed in terms of tons of material and numbers of people. At a twofold
reliability improvement, the savings for a 24-PAA Squadron range from approximately 30
tons of equipment and 20 personnel when the sortie rate is two sorties per aircraft per day to
as much as 60 tons of equipment and 100 personnel at four sorties per aircraft per day.
The combined effect of sortie rate and reliability on the weight of equipment and the
number of personnel deployed with a squadron of 24 aircraft is shown in Figs. 3 and 4. As
in the analysis of maintenance manpower requirements and the cost of spare parts described
above, most of the benefit is achieved with the twofold reliability improvtement, with less
marginal benefit obtained from the fourfold improvement.
The actual amount of savings, especially in tons of material, appears large. However,
those savings are a small fraction of the total deployment effort because only a small fraction
of the total material required is affected by changes in reliability. Most of the deployment
tonnage is due to tractors, trailers, and loaders for handling ammunitiorn and moving the
aircraft. Improving reliability does not reduce the need for such equipnment; in fact, if
improved reliability generates more sorties, there may be need for more tractors, trailers, and
loaders. The variation in total weight of support equipment deployed with an F- 16 squadron
is shown in Fig. 5. Doubling reliability yields only about a 5 percent reduction in total
deployment tonnage.'
'If this case study were on the F-15, whose Avionics Integrated Systems testequipment is deployed with the aircraft, a much greater airlift savings might. have beenrealized during deployment.

- 14.
100
80Sorti ft Per aircra ft per day
g4
40 /00I 12I/2
0ItGi~j~
2 x 3 x

- 15-
" 1000 Independent squadron of i-24 F-16a X s
"• • ~4X-
500-
00 1.0 2.0 3.0 4.0
Sorties per aircraft per day
Fig. 5-Effect of sortie rate and reliability on totalweight of support equipment
OVERALL BENEFITS
We believe that the most important benefit of improved reliability is enhanced
combat capability. In the discussion that follows, the gains in wartime sortie generation
capability achievable through reliability improvements are compared with other benefits. As
previously shown, doubling the reliability of all components of the aircraft would yield an
estimated 17 percent increase in wartime sortie generatior. capability given current
manpower levels. Alternatively, the worth of the cost savings could be applied to acquiring
additional aircraft. Or the capability Increase from improved reliability could be used to
reduce the number of airrraft required to accomplisb a given sortie generation capability.
Although such estimates are highly dependent on the specific scenario considered as
well as the estimating models used. they do provide some sense of the importance of
reliability improvements and some insight into tho, relationship between reliability and
wartime sortic generation capability. An added dimension of improving reliability is
increased dependability; once, launched, a more reliable aircraft has an improved chance of
* accomplishing its mission.
Sb

-16-
Table 6 (which is the same as Table S.1 in the Summary) translates the manpower,
spares, and wartime sortie generation benefits of a two-fold reliability improvement into
monetary terms, based on an assumption of no change in flying activity. We have excluded
the value of the modest 40-ton per squadron savings in deployment equipment requirements,
although the table does reflect a rough estimate of the savings in capital costs for War
Reserves Spares Kits (WRSK) that would be realized from the postulated twofold reliability
improvement if wartime sortie rates remained the same. Two alternative ways to apply the
benefits are shown, either simply reducing manpower or increasing the sortie rate.
Manpower
The first line of Table 6 reflects the assumption that the reliability improvement is
exploited solely by reducing maintenance manpower while keeping wartime sortie
generation capability constant. This would make it possible to save a total of $300 million
(about $5 million annually per wing for each of the eight operational and training wings),
plus about $1.4 billion in spare parts repair and capital costs. Assuming that the force was
built up over the first half of the 1978-1990 time period, the total estimated savings in
lifecycle costs would be roughly $1.7 billion,
Table 6
AGGREGATE BENEFITS OF TWOFOLD IMPROVEMENTS IN RELIABILITY, FY 78-FY 90(Billions of FY 84 $)
Estimated Direct Engines,Wartime Savings Modules, and Reduction in
Sortie Rate from Reduced Recoverable WRSK LifecycleCategory of per Aircraft Maintenance Spare Parts Investment Costs of
Benefit. per Day Manning Cost Savings Cost Savings' Spare Parts
Manpower reduction 3.0 0.3 1.2 0.2 1.7
Sortie capabilityincrease 3.5 0.0 1.1 0.1 1.2I 'Does not include replenishment or other lifecycle coats,

-17.-
Sortie Capability
The data in the second line are based on using the reliability improvement to achieve
a 17 percent increase in wartime sortie generation rates. It results in fewer spare parts being
needed and an investment savings for WRSK, but no savings at all in manpower.
Both cases are extremes in the sense that all of the benefits of the postulated
reliability improvements are derived in only one way; nevertheless, the data provide some
insights into the dramatic dimensions of the tradeoffs that might be possible.
Force SizeAnother way to view the savings in capital costs for engines and recoverable spare
parts, WRSK, and the lifecycle costs of spare parts would be to use it to reduce the overall
size of the USAF F-16 A/B force; fewer aircraft would be required to accomplish the same
sortie generation rate, Alternatively, the savings could be used to purchase additionalaircraft. Used this way, the $1.7 billion savings in lifecycle costs would translate into
approximately two additional 72-PAA F-16 wings.
i8M
A
iN

n -19.
Appendix A
ESTIMATING THE BENEFITS OF IMPROVED RELIABILITYON MAINTENANCE MANPOWER REQUIREMENTS AND
WARTIME SORTIE GENERATION CAPABILITY
This appendix describes the methods used to estimate the benefits of improved
reliability on the maintenance manpower requirements for a 72-PAA F-16 A/B wing and on
the wing's ability to generate sorties under simulated wartime conditions (while operating in
place during a seven-day surge in activity).
Maintenance personnel include those assigned to the Deputy Commander of
Maintenance, the Aircraft Generation Squadron, the Component Repair Squadron, and the
Equipment Maintenance Squadron, but only those normally included in DOD Program
Element 27133 (F-16 squadrons).
As described in the text, we concluded that a postulated twofold improvement in
reliability enables an 8 percent reduction in maintenance manpower, and a fourfold
reliability improvement enables a 14 percent manpower reduction.
A full summary of personnel estimates by skill area for 12 analysis cases is shown in
Table A.1 and discussed below. How the 12 cases were constructed Is discussed on pp. 26-27,
PERSONNEL ESTIMATES BY SKILL AREA
Although we did make separate estimates for each combination of individual AFSCs
and maintenance organization, we have found the results more meaningful after grouping
the estimates by aggregate skill category. Our final estimates are presented by skill category
and case, along with the achieved sorties, in Table A. 1. The notes to the table describe the
relation between the major skill categories and AFSCs.
For each case, the total personnel were presented in Fig. 1. Results for the moreinteresting skill categories are presented graphically in Figs. A.1 through A.5. The reader
should be aware that the results for the separate skill categories do not stand alone; rather
they help detail the total personnel requirements shown on Fig. I and discussed earlier. In
other words, the relationship shown on Fig. A. I for avionics maintenance personnel is
completely dependent on having the appropriate number of all other kinds of maintenance
personnel available simultaneously. The numbers derived from Figs. 1 and A. 1 through A.5
differ slightly from the numbers shown earlier on Tables 1 and 2 because, as noted in Sec. I,
slightly different assumptions were used about the sortie rate.

-20-
Table A. 1
SUMMARY OF PERSONNEL ESTIMATES BY CASE AND AGGREGATE SKILL AREA
SortiesDCM Per
Analysis Airframe Crew Struct Wheel and AircraftCase Avionics &AGE Propulsion Chiefs Loaders Munitions Repair /Tire OH Total Per Day
1 x24 171 191 94 219 115 91 26 12 338 1257 1.672 x 24 137 166 68 216 99 91 26 12 338 1153 1.674 x 24 104 150 57 216 97 95 25 12 338 1094 1.67
1 x32 180 221 100 228 140 146 26 12 338 1400 2.222 x32 154 195 78 226 131 146 26 12 338 1305 2.224x32 127 166 61 222 127 146 25 12 338 1224 2.22
1x48 229 256 127 243 167 238 26 12 338 1636 3a182x48 175 223 86 243 164 242 26 12 338 1509 3,2d4x48 142 190 63 240 154 246 25 12 338 1410 3.31
1 x64 269 288 152 267 202 337 26 12 338 1891 3.722x64 196 250 95 261 198 343 26 12 338 1791 3.874x64 169 213 74 258 1865 340 25 12 338 1614 3,95
Notes: Aggregate Skill Areas include the following AFSCs.Avionics: 832X4 Automatic Test Station
326X6 Fire Control System326X7 Auto Pilot/Instruments326X8 Communicationm/Navigation/Eletronic Countermeasures404X1 Photographic
Airframe & AGE: 423X0 Electrical423X1 Environmental423X2 Eigress42313 Fuel Systems423X4 Pneudraulics423X5 Aerospace Ground Equipment Maintenance
Propulsion: 42814 Engine
Crew Chiefs: 431X1 Crew Chiefs
Loaders: 426 GO Gun Servicing462LO Leaders462W0 Weapons Release
Munitions: 464X0 Munitions Assembly464X1 Missile Maintenance
Structural Repair: 427X0 Machinist427X1 Corrosion Control427X2 Non-destructive Inspection427X4 Welder427X5 Structural Repair
Wheel/Tire: 431RI Repair and reclamation431W1 Wheel & Tire
DCM & OH: Deputy Commander for Maintenance and Overhead338 = Total that could not be estimated by TSAR
0

-21 -
300
200-
I lx
2X
4X100-
ON I0 1.0 2.0 3.0 4.0
Sorties per aircraft per day
Fig. A.1-Avionics maintenance personnel, F-16 A/B wing
The largest single effect of improved reliability on personnel requirements is in the
avionics skill group (see Fig. A. I). At roughly three sorties per aircraft per day, a twofold
improvement in reliability results in a reduction of approximately 59 personnel, 26 percent
of the number in this group. A fourfold improvement yields a further reduction of 31
personnel, 18 percent of the required avionics maintenance personnel. As reliability
improvements are made, the requirements for avionics maintenance personnel are less
sensitive to increases in sortie rate. With no change in reliability (the 1X casc), moving from
two to three sorties per aircraft per day results in a 25 percent increase in avionics
maintenance personnel requirements. However, had reliability been improved by a factor of
two (the 2X case), the required increase would have been only 18 percent.Airframe and Aerospace Ground Equipment personnel (see Fig. A.2) behave
somewhat differently. At about three sorties per aircraft per day, a twofold reliability
improvement results in a savings of 32 personnel, approximately 13 percent of the total
airframe and AGE personnel, while the fourfold improvement in reliability gives an
- - -. -

-22-
JJ4X300
• 200 -- 1X
2X •
S100 -
0O 1.0 2.0 3.0 4.0
Sorties per aircraft per day
Fig. A.2-Airframe and AGE maintenance personnel, F-16 A/B wing
additional saving of about the same amount. We still see the decrease in the sensitivity of
personnel requirements to sortie rate with improvements in reliability, but not nearly so
much as in the case of the avionics technicians. This group behaves differently in the model
largely because in our analysis, the AGE maintenance personnel who make up a large mfraction of this group are only indirectly influenced by reliability improvements, and the
different AFSCs. For each AFSC, certain minimum numbers of pcrsonnel are always
required on each shift.
Propulsion maintenance personnel requirements (see Fig. A.3) behave much like the
avionics skill group. At three sorties per aircraft per day, a twofold reliability Improvementreduces the requirement by 38, or about 32 percent of the total; a fourfold improvementsaves only an additional 19 personnel, or another 23 percent. Again, improvement in
reliability reduces the sensitivity of personnel requirements to increases in sortic rates.
~~M^ XM .1 ".4 1 ~ VMV

-23-5
200 .. - - - -
100 4
1 .040
111g. A.3-.propulsion maintenance Personnel, P'.16 A/B wing
The remaining maintenance personnel requirements (not including those forsupervisory and overhead people) show little change as a result Of im~proved reliability (seeFigs. AA4 and A.5). However, the requirement for these personnel i agl ucinois arelya uncio Isortie rate Independent of reliability, Ile curves on Fig. A.5 are heavily influenced by die
constant requirement for 156 dedicated crew chiefs independent of sortie rate.METHODOLOGY
Our estimates were made using a RAND simulation model called TSAR (TheaterSimulation of Air Base Resourccs).[3,4,51P" ~~The following dicsso includes u short description of the TSAR model, our choiceof scenario, the key assumptions, and the analyses themselves, plus a discussion of the
overall estimnating method.Methodobogically, not all of the mnainteniance manpower associated with the F- 16 A/Bwing was estimated using TSAR. As described in detail below, we used two differintestimating methods depending on whether the personnel were assigned to the flig~jitine or to
ifý

-24 -
200
'1002X
010 1.0 2.0 3.0 4.0
Sorties per aircraft per day
Fig. A.4-Loaders, weapons release, and gun maintenance personnel,F-16 A/B wing
the support shops. Then we describe how we handled data on personnel not simulated byTSAR, followed by how we accounted for indirect work. Finally, we discuss how we dealt
with v.riations caused by the random numbers and multiple trials inherent in the simulation.
HOW THE TSAR MODEL WORKS
The TSAR model was used to make most of the personnel estimates presented here.
TSAR is a large Monte Carlo simulation model similar to the Air Force's Logistics
Composite Model (LCOM). Both models were developed by RAND.
For this analysis, TSAR was used in one of its simplest modes-no base damage, nochemical warfare, a single operatinig base, etc. We simply simulated flying and maintenance
activities for a wing of 72 F-16s during a seven-day wartime surge in an otherwise benigncnvironmentIno losses to attrition and no battle damage. Sorties were ccheduled and TSAR
attempted to fly them according to the schedule. As the sorties were flown, the modelgenerated requirements for maintenance people, equipment, spare parts, fuel, ammunition,
and the like, in order to fuel, arm, launch, recover, and repair aircraft and component parts.
IltS • •_ _. . . . . •.__ _ .•.%...

- 25-
400
Ix2X4x
300
xCrew chiefs
I200
100
5 01.0 2.0 3.0 4.0
Sorties per aircraft per day
Fig. A.5-Munitions maintenance personnel, F-16 A/B wing

-26-
Similar to LCOM, TSAR represents on-equipment aircraft maintenance tasks by
using on-equipment task networks. There is a separate network for each important aircraft
system or subsystem---e.g., fire control system, propulsion, landing gear, vertical stabilizer
assembly, primary flight control electronics. There are 84 of these networks for the F-16
A/B in LCOM and in TSAR. Associated with each network is a probability that it will be
entered on any given sortie; once a network is entered, probabilities are again used to select
the alternative paths through it,
After each sortie, a random draw is made for each network to determine whether the
maintenance tasks represented by that network will be required. To reflect improved
component reliability, we simply reduced the probability that the on-equipment network ,
would be entered. The probabilities used to calculate personnel requirements assuming
no-change-in reliability (the IX case) were obtained from Headquarters, Tactical AirCommand (LCOM/XPM). They reflect TAC experience with the F-16 A/B during the lastsix months of 1984, adjusted by TAC to reflect the differential use of a few aircraft systems
in wartime vs. peacetime (for example, electronic countermeasures (ECM)),
For each maintenance task, the probability of occurrence, the expected time to
complete the task, the number and kind of maintenance people needed to accomplish it and
the probability that a spare part would be required, and any requirement for AGE were
specified Individually. When parts are replaced, the faulty parts are sent to intermediate-
level maintenance (ILM) to be repaired or, If beyond the capability of ILM, to the next
higher echelon (Centralized Intermediate Repair Facility (CIRF), depot, or contractor) for
repair. Repair procedures and maintenance resource requirements-people, parts, and AGE-are
also specified for each parts repair procedure for every part repaired in ILM.
THE SCENARIO, ASSUMPTIONS, AND ANALYSES
We simulated the operation of a single F- 16 A/B wing (three squadrons of 24 aircraft
each) fighting in place during a seven-day wartime surge, but with no aircraft attrition and
no damage to the base, All sorties were air-to-ground and lasted an average of 1.7 hours.
We tried to launcn aircraft in flights (groups) of four, but accepted flights of three when four
aircraft were not available. Otherwise, the entire flight was canceled. We allowed a
30-minute launch window (the flight could be launched any time during the 30-minute
window before being scnbbed).
The model assumed that an unlimited supply of pilots was available, and no
restrictions were placed on the availability of any nonpersonnel resources.
Non-mission-critical maintenance was deferred until after the flying day if performing it
W*

-27-
sooner would disrupt the flying schedule. However, cross-utilization training was not
considered.
Twelve analyses were specified to span an interesting range of reliability
improvemems and sortie generation capability. These 12 cases are identified in Table A.2.
Detailed maintenance personnel estimates were made for each case.
Table A.2
IDENTIFICATION OF ANALYSES, 5 WAVES PER DAY(72-PAA F-16 A/B wing)
Scheduled Reliability Improvement FactorSorties
per Wave' iX 2X 4X
24 1 x24 2 x 24 4 x 2432 1 x32 2 x 32 4 x 32,48 1 x48 2 x 48 4 x 4864 1 x64 2 x64 4 x64
'Waves scheduled at 0600,' 0900, 1200, 1500, and 1800hours each day.
The number of sorties scheduled to be launched in each of the five waves was set at
24, 32, 48, and 64, or an average total of 1.67, 2.22, 3.33, and 4.44 sorties per aircraft per
day. As will be seen later, TSAR did not actually fly all of the scheduled sorties. The model
aborts some flights before launch, and resource constraints sometime prevent an aircraft
from being ready to fly at the time a sortie is scheduled.
We also examined three different ievels of reliability. The 1X case reflects recent
TAC experience with the F-16 A/B fleet. The 2X case reflects cutting the failure rates for
the IX case. in half, and the 4X case cuts the failure rates in half again. We refer to IX, 2X,
and 4X as Reliability Improvement Factors.
Combining each of the four sortie generation schedules with the three reliability
improvement factors yields the 12 analyses shown in Table A.2. For example, combining
the IX reliability improvement factor with a scheduled 48 sorties per wave results in the 1X48 case.
OVERVIEW OF THE ESTIMATING METHOD
Both TSAR and LCOM have been used extensively by RAND and the Air Force to
estimate maintenance manpower requirements. The usual approach, at the outset, is to
provide the models with a flying scenario, an organizatioral description, an operating policy,
a set of failure probabilities, and a baseline set of resources (number and kind of personnel,

- 28 -
AGE, spare parts, etc.). Usually several trials are then run using these resources and the
results are examined to suggest possible changes in the initial resource set.
Both models provide an extensive set of indexes to describe how the weapon system
in question performed during the simulations. These indexes include: the fraction ofscheduled sorties actually achieved, number of maintenance tasks performed, number ofshortages of each type of spare part, number of shortages of AGE, and average utilization
rate for each type of personnel.The analyst who examines these performance indexes looks for choke points or
places where resources were provided but not used. On a particular trial, the analyst mayfind that several aircraft were grounded for lack of parts. or that there were not enough fuel
trucks, or that aircraft were grounded because not enough people were available to performa particular maintenance task. The analyst may also observe, for example, that the initialma nning level provided four "widget fixers" but that they were never used. These insightsthen can be used to adjust baseline resources up or down in an attempt to balance the
-' resource mix. The simulation is then rerun using a revised set of resources. Until a stablesituation is achieved, the model may be run many times, Once stability is achieved, theanalyst presumes that the resources are matched to the activity simulated and that the model
will generate a reasonable estimate of the requirements.The richness of detail allowed In the simulation models is a virtue because a great
deal of realism is created. However, that detail makes it very difficult for the analyst to traceany problems encountered in the output performance indexes to their root causes. For
example, the analyst may observe that avionics maintenance technicians in the support shopare •ung undenitilized and suspect that too many technicians were provided. However, the
real reason for this underutilization might have been that not enough power carts were
provided to allow the flightline specialists to troubleshoot and remove the components that
would otherwise have to be sent in for repair. There are just so many possible constraints on
system performance that it is almost impossible to determine precisely which one is
operating at any moment, and hence determine what to do about it.
Because TSAR and LCOM are Monte Carlo models, they must be run many times to
sort out the effects of random variation from effects due to the controlled parameter values.
Thus, using these models in the traditional way to estimate resource requirements becomesiargely a matter of cutting, fitting, and iterating--a very time-consuming and expensivw. proccss
and one not easily replicated.
IS

- 29-
We ran TSAR a bit differently in this analysis in order to reduce many of these
difficulties. Instead of loading the model with a baseline set of resources (people) at the
outset, we provided unlimited resources and let TSAR tell us what tesources it actually
utilized during the simulation. Also, at the outset we modified TSAR so that, at the end ofeach simulation time step (a three-minute period), data on the actual number of peopleassigned to the tasks (categorized by their specialty, shift, organization, and work place)
were output. Later we used these data to make our personnel estimates. Exactly how is
explained below in the sections starting with Estimating Day.-Sh(ft Flightline Personnel.
Another analytic problem inherent in the use of any large Monte Carlo simulation
model Is that every trial run yields a different answer, and it is difficult to decide whether the
differences are due to changes made in the input values or to chance alone. The usual
solution is to make many trials with the same input values and then average the results in
some way to reduce the effects of chance. However, with models as large as TSAR or
LCOM (with many random variables), that approach can be quite expensive. We have not
found a simple solution to the random variation problem, but we did develop a method for
working with it systematically and efficiently. We made many trials but, rather than
averaging all the trials with the same input values, we used a regression approach to
simultaneously average all the trials for all cases.
As noted above, each analysis is associated with a scheduled (desired) flying
program, although just scheduliiWg sorties does not guarantee that they will actually be flown.Even with unlimited resources, they seldom all are, either in reality or in the TSAR model,
because of realistic time constraints and scheduling requirements that preclude the aircraft
from flying constantly. Thus, having estimated the maintenance personnel required for a
given sortie schedule does not actually tell us how many sorties we could actually generate.
To derive the sortie generation capability of a given mix of maintenance people, we loaded
our personnel estimates back into TSAR along with the scheduled sorties from which the
personnel were estimated and then ran TSAR again to observe the sorties that were actually
achieved. This will be described further In the section Dealing with Random Numbers and
Multiple Trials.
PERSONNEL REQUIREMENTS ESTIMATED WITH TSAR
As noted above, we actually used two different personnel estimating methods within
TSAR, Reasoning that launching of aircraft was the paiamount task, we provided sufficient
flightline personnel during the flying day so that seldom if ever would a demand for
maintenance people go unsatisfied by the model. In other words, we manned the fllghtlire

- 30-
topeak requirements during this period. During nighttime on the flightline and at all times
in the support shops, however, we felt that such immediacy was not required, So, for those
situations, we provided only enough manpower to ensure tha! the workload received was
accomplished sometime, we did not care wheia, during the shift.
Maintenance personnel are defined as all personnel in an F-16 A/B wing normally
assigned to the Deputy Commander for Maintenance, the Aircraft Generation Squadron, the
Component Repair Squadron, and the Equipment Maintenance Squadron. On many bases,
such personnel might be augmented in order to provide maintenance support to tenant
organizations on the base, but all such additional personnel were specifically excluded from
our model._* Table A.3 presents a summary of the split by squadron of maintenance people
estimated with TSAR and those estimated outside the model, Tables A.4 through A.7
provide a breakout of these figures by organization and organizational structure code.
Estimates for the staff of the Deputy Commander for Maintunance as well as for several
organizations within the three squadrons could not be made with the TSAR model because it
does not deal with those functions. The numbers shown in the tables are those estimated
outside of TSAR and were obtained specifically from the Unit Manpower Documents for
the F-16 A/B wing at Shaw AFB during the 4th quarter of fiscal year 1986. These figures.
totaling 338 people, were included, unchanged, In all of our estimates. The entire DCM
staff was treated In this way. Also the people not dealt with in TSAK perform primarily
supervision and overhead functions,
Tablo A.3
SOURCE OF F-16 MAINTENANCE MANPOWER ESTIMATES,SUMMARY TABLES
Organization Shaw AFB Simulation
* Deputy Commander for Maintenance 142-363rd Aircrsaft Generation Squadrcu 105 TSAR363rd Component Repair Squadron 44 TSAR363rd Equipment Maintenance Squadron 47 TSAR
_ Totpl 338'In organizations in which a number is shown for Shaw and TSAR is
not indicated, we have estimated the manpower countting the personnel inthe Unit Manting Documents (PEC 27133-) FY 86 position, for 364rd Tac.tical Fighter Wirg,, three 24-PAA F-16 A/B Squadrons. In organizations inwhich a number s shown for Shaw and TSAR is also indicat~d, vie haveestimated manpower using both Unit Manning Documents and TSAR,
• becauwe the model does not deal with all poesible functions within thatorganization.
* p,
S...= ,•. ,.-- .,• L.•••• m, • •, ,, ' • -••t, MA , kA . , •d, ,,d ~ ,• • . JJ4,•' ;d. ,•• ',,•, •N '.X. . I,./• jVg .Sf' .~. : .,'•.;,• "..; ',....'X• "*. :/ ,; •'A,'P ;"•..,V ,"X •'

-31 -
Table A.4
SOURCE OF F-16 MAINTENANCE MANPOWER ESTIMATES,DEPUTY COMMANDER FOR MAINTENANCEa
OSCb Organization Shaw AFB Simulation
JN Command 4 -JNB Training Management 3 -JNBA Training and Administration 7 -JNBB Development and Application 14 -JNF Maintenance Management 1 -JNFA Maintenance Sye,; .-s Analysis 13 -JNFB Administration 7 -JNFC Programs 5 -JNH Quality Control 3 --JNHA FCF Weight Balance 2 -JNHB Inspection 24 -JNHC Technical Order Distribution 2 -
* JNHE Product Improvement 1 -JNI Maintenance Control 3 -JNIA Maintenance Operations Control 23 -JNIB Maintenance Plans 9 -JNIBB Combat Plans/Mobility 1 -JNIC Materiel Control 2 -JNICA Maintenance Supply Liaison 9 -JNICC Repair Cycle Monitor 11 -JNID Consolidation Engineering Maintenance 9 -
Total 142 -
"5TSAR is not indicated because the model does not deal with any functions within theDCM staff. We have estimated manpower using the Urdt Manning Documents (PEC27133), FY 86 position, for 363rd Tactical Fighter Wing, three 24.PKA F-16 A/B Squad.rons.
bOSC is the Organizational Structure Code.
ESTIMATING DAY-SHIFT FLIGHTLINE PERSONNEL.
Flightline personnel are responsible for doing on-equipment aircraft maintenance,
uploading (and, when necessary, downdoading) munitions, fueling, and otherwise recoveringaircraft after a sortie and preparing it for the next sortie. Included in this category arc the
crew chiefs, various equipment maintenance specialists, and loaders.
Their primary responsibility is to recover the aircraft after each sortie anu to prepare
the aircraft to be launched on the next sortie. Many aircraft must be launched nearly
simultaneously (within a 30-minute window). Thus, the workload is subject to c xtreme
fluctuations. For short peiiods of time all available personnel will be required; at other
times, they will have little to do. This fluctuation makes for low manpower utilization rates
I

-32-
Table A.5
SOURCE OF F-16 MAINTENANCE MANPOWER ESTIMATES,AIRCRAFT GENERATION SQUADRON'
AFSC OSCb Organization Shaw AFB Simulation
AA Command 3AZ Squadron Section 8SA General Supervision 11SAA Load Standardization 28SA- AC Maintenance (3 AMUs) 43 TSAR
431X1 SA..A Crew Chiefs 1 TSARSAB Flight Line Specialists 3 TSAR
462X0 SA..C Weapons, Flight Line 6462X0 SA...CA Loading - TSAR462X0 SACB Maintenance - TSAR
Total 105
'In organizations in which a number is shown for Shaw and TSAR is not indi-cated, we have estimated the manpower counting the personnel in the Unit Man-ning Documents (PEC 27133), FY 86 position, for 363rd Tactical Fighter Wing,three 24-PAA P-16 A/B Squadrons. In organizations in which only TSAR Is incdcated, we have used the model alone to estimate manpower. In organizations Inwhich a number is shown for Shaw and TSAR is also indicated we haveestimated manpower using both Unit Manning Documents and HTSa becausethe model does not deal with all poesible functions within that organizaton.
bOSC is the Organizational Structure Code.
but probably reflects wartime requirements adequately. This fluctuation requires that
personnel be provided to meet approximately peak flightline manning (rather than average)
demands. Therefore, our estimating methods have been tailored to provide the number of
personnel needed to meet peak demands.
Each simulation provides sufficient data to prepare a probability distribution like the
one shown in Fig, A.6 for each type of person working on the flightline during the daytime.
The sample disUtibution shown is for crew chiefs in one Aircraft Maintenance Unit (AMU).
Actually, a separate distribution is prepared for each AMU. The number of men observed to
have been working per shift (during the simulation) is indicated on the horizontal axis. The
vertical axis indicates the cumulative frequency or probability that this number or fewer will
have been working at any time during the shift. The curve reflects the probability
distribution obtained from a single simulation run and Is used as follows:
Suppose that it was desired to provide enough crew chiefs so that only five out of
every 100 times would there be a need for more of them than were provided. In other
words, we would man according to a 95 percent peak cutoff criterion. The number of
people required is then estimated by selecting the 95 percent point on the vertical axis,

-33-
1.0
Cutoff P -0.95
i ~I
0.5 6
Personnel -21
0 I I.
0 10 20 30
Personnel
Fig. A6--Probability that the number of personnel working is le..than or equal to P
reading over to the curve and down to the horizontal axis as illustrated in Fig. A.6, For this
example, 21 crew chiefs would have provided the desired capability in the simulation.
As noted above, separate estimates are made for each personnel type (AFSC) In each
of the three AMUs. The observed workload will probably have been different among
AMUs during the simulation, so each AMU will be found to have required a different
number of people of the same specialty. We know that in another simulation, the AMU that
had required the largest number of people previously might now require the fewest. That issimply the luck of the draw. Actually, there is no difference between the AMUs, so for :determining requirements, we chose the maximum number of people required by any of the
three AMUs and assigned that number to each AMU.Obviously, the number of people assigned is a function of the cutoff criterion. After
some initial discussions with people in the Tactical Air Command, we came to the
conclusion that something like a 99 percent cutoff criterion would most nearly approximate
Air Force policy and practice. We used this cutoff value in some early runs to calibrate the
model and, by comparing our results with UMD figures, found that our estimates were a bit
on the high side. We also did some experimenting by making personnel estimates using
different cutoff criteria and then loading those people into TSAR and redoing the simulation,
W tj-- pl

- 34 -
Table A.6
SOURCE OF F-16 MAINTENANCE MANPOWER ESTIMATES,COMPONENT REPAIR SQUADRON'
AFSC O3 0 b Organization Shaw AFB Simulation
AA Command and Supervision 2AZ Squadron Sectioning 5SC Supervision 5SCB Accesior7, Maintinance 3
423X4 SCBE Pr eldl.nulic" - TSAR423XI SCBF Env' ronmental Systems - TSAR423X3 SCBH Aheraft Fuel Systems 1 TSAR423X2 SCBI Pirress Systems - TSAR423X0 SCBJ Electrical Systems - TSAR
SCD Propulsion 5426X4 SCDA F-100 Jet Engine 1 TSAR426X4 SCDB Test Cell - TSAR
SCE PMEL-Type 11 1SCF Integrated Avionics 3
326X4 SCFA Automatic Test Station 3 TSAR328X3 SCFC EW Test Station - TSAR404X1 SCFD Sensor/Photos Systems - TSAR
SCFF Type 4 PMEL 15
Total 44"Iln organizations in which a number in shown for Shaw and TSAR is not indicated, we
havij estimated the manpower counting the personnel in the Unit Manning Documents(PEC 27138), FY 86 position, for 363rd rTactical Fighter Wing, three 24-PAA P-18 A/BSquadron', In organizations in which only TSAR is Indicated, we have used the modelalone to estimate manpower. In organizations in which a number Is shown for Shaw andTSAR is also indicated, we have estimated manpower using both Unit Manning Docu.monts and TSAR, because the model does not deal with all possible functions within orga.nization.
b0 SC is the Organizational Structure Code,
We observed the resulting sortie production and noted that we could reduce the cutoff
percent from 99 to 95 percent with no distinguishable effect on sortie production; when we
dropped it to 90 percent and lower, sortie production decreased noticeably. We finally
settled on a 95 percent cutoff criterion and have used that value in the analyses presentedhere.
ESTIMATING SUPPORT SHOP AND NIGHT-SHIFTFLIGHTLINE PERSONNEL
Support shop personnel include all of the technicians assigned to the Component
Repair Squadron and the Equipment Maintenance Squadron, For the most part, the people
in these shops are insulated from the flightline by the base spares. When an aircraft returns

- 35 -
Table A.7
SOURCE OF F-16 MAINTENANCE MANPOWER ESTIMATES,EQUIPMENT MAINTENANCE SQUADRONa
AFSC OSCb Organization Shaw AFB Simulation
AA Command and Supervision 2 -AZ Squadron Section 6 -SB Equipment Maintenance Supervision 7 -SBA AGFE-Flight Line Equipment 6 -
423X5 SBAA Repair and Inspection - TSAR423X5 SBAB Service/Pickup/Delivery - TSAR423X5 SBAD Nonpowered Support - TSAR
SBB Maintenance 3 -
SBBA Aircraft Inspection - TSAR431X1 SBBC Repair and Reclamation - TSAR
SBE Armament Systems 3 -
462X0 SBEA Maintenance - TSAR462X0 SBEB Alternative Mission Equipment 6 -
462X0 SBEC Armament Support Equipment - TSAR461X0 SBG Munitions Systems Support 1 TSAR461X0 SBGB Munitions Control 10 -
SBCC Line Delivery 2 -
461X0 SBGCA Handling - TSAR461X0 SBGCB Munitions Maintenance - TSAR461X0 SB(OCO Equipment Maintenance - TSAR461X0 SBGE Missile Maintenance - TSAR
SBGF Material Production 2 -I
SBGFA Storage and Handling - TSARSBGFB Inspection - TSARSBH Fabrication 2 -
4,-!7X4 SBHA Metals Processing - TSAR427X5 SBHB Structural Repair - TSAR427X3 SBHC Survival Equipment - TSAR427X0 SBHFE Machine Shop - TSAR427X1 SBHF Corrosion Control - TSAR427X2 SBHG Nondestructive Inspection TSAR
Total 47
'In organizations in which a number it shown for Shaw and TSAR is not indicated, wehave estimated the manpower counting the personnel in the Unit Manning Documents(PEC 27133) FY 86 position, for 363r-d Tactical Fighter Wing, three 24-PAA F.16 A/BSquadrons. In organizations in which only TSAR is indicated, we have used the modelalone to estimate manpower. In organizations in which a number is shown for Shaw andTSAR is also indicated, we have estimated man power using both Unit Manning Docu-ments ard TSAR, because the model does not deal with all possible functions within thatorganization.
OSC is the Organizational Structure Code.
- 36-
from a sortie needing repair, the most likely sequence of events is for the flightline people to
recover the aircraft, diagnose the problem, and either fix it or remove and replace a faulty
component with a serviceable spare from base supply. At that point, the aircraft is flyable
again. The faulty part is then sent to the support shops for rmpair, but exactly when it is
repaired is not an important factor in determining when the particular aircraft can fly again.
Because spares are likely to be limited, however, the part must be repaired in a reasonabletime and returned to supply in serviceable condition.
AU of this leads to a different critcrion for manning the support shops. Our
calibration runs led us to choose the maximum total manhours required for the shift (day and
night) over the seven days in the simulation. The manhours actually used during the
unconstrained simulation run were calculated, from TSAR output data, for each personnel
type (AFSC) in each of the support shops. The appropriate maxim,nm manhours were
selected and manning requirements were calculated by assuming that men were available for
work 12 hours per day seven days per wv',(k,I The same method was used to estimate night-
shift personnel for the flightline. As before, manning for 3ach specialty in each AMU was
calculated separately, and the maximum across the three AMUs was given to each AMU.
ACCOUNTING FOR INDIRECT WORK
All of the manpower estimates made using TSAR were inflated to account for
indirect work by using the currently acceptable Air Force factors of 0,82 dIrect and 0.18
indirect,2 Normal Air Force practice is to vary these figures slightly among the different
specialties, but we applied the same figures across the board,
PERSONNEL NOT ESTIMATED WITH TSAR
Activities that generate requirements for administrative, overhead, and certain other
kinds of maintenance personnel are not simulated with TSAR. For most of these, we simply
used figures from the Unt Manpower Document for Shaw AFB (4th quarter, FY 86
position). At that point the F-16 wing at Shaw was operating similarly to our simulated
wing. 'rables A.4 through A.7 indicate by organization and OSC exactly whichrequirements we took directly from the Shaw UMD and which were estimated using TSAR,
As indicated, the entire DCM staff and 338 people in all were estimated in this way.
'AFR 26-1, Vol, 1II, (CI), Table 1-2, Standard Air Force Workwecks and ManhourAvailability, p. 1-3.
2Ibid.

- 37 -
An additional requirement for 156 dedicated crew chiefs was calcvlated outside the
model. We added one crew chief per aircraft per shift for a total of 144 and another 12 for
end-of-runway duty.3
DEALING WITH RANDOM NUMBEVS AND MULTIPLE TRIALS
As with any Monte Carlo simulation model, numerous trials are required simply to
distinguish between variation in the results caused by variation in the random number
streams and that caused by changes in the values of the inputs, After considerable
experimentation we decided on five trials for each of tLh 12 analysis cases. Given that there
are roughly 2000 sorties flown per trial, this meant that we simulated approximately 120,000sorties, Thn differences between cases were usually more significant than the variation from
trial to trial for the same case,
Several methods were tried in an effort to make our final estimates vary smoothly and
* reasonably with changes in the component reliability and sorties flown. For example, it Isnot reasonable to determine that there is a requirement for more maintenance personnel
when the component failure rates used were lower and the sortie schedule was the same,Occasionally, there werf two trials whose outcomes would be inverted in that way,
We first ran five trials for each of the 12 analyses (four sortie schedules times three
reliability Improvement factors) and preserved the detailed output from TSAR for each of
these 60 trials. Using these data, we then estimated personnel requirements by AFSC andorganization for each ot the 60 trials, At that point we regarded each combination of AFSCand organization as a separate database and ran a separate regression for each using the
equation
P = ai + 13.1 x SORTIES + P-2 x WORK + P-3 x SORTIES x WORK,
whcre: P = personnel In a speclflod AFSC and organization,SORTIES = scheduled sorties,
WORK = 1,0, 0,5, 0.25 for reliability improvement
factois of IX, 2X, and 4X, respectivciy.Sa and 3- 1,-2,-3 = parameters estimited
The particular form of the regression was chosen after we plotted the initiai personnel
estimates for each AFSC against tile reliability improvement factor and sortie schedule. All
at Hill AFB during the summer of 1985,
e o

-38-
of the plots indicated the same general relationship (for each reliability improvement factor,
people were a linear function of SORTIES, but the level and the slope were increasing
functions of WORK). The equation chosen was selected because it was among the simplest
forms we could find to cxpiress tie desired overall relationship. Most of the time we
obtained R2 values above 90 percent. With the coefficients estimated, we used the
regression equations to adjust the number of maintenance personnel required.
At this point, with a refined and largely consistent set of personnel estimates, we
turned our attention to the following problem: Thus far, personnel requirements had been
estimated from planned sorties but what we really wanted was to calculate personnel
requirements as a function of sorties actually flown, Therefore, we now loaded our
personnel estimates back into TSAR (for each of the 12 analysis cases) and ran 10 more
trials for each case, or a total of 120 trials, in order to observe the sorties actually produced.
Our final estimate of sorties produced was obtained by averaging the sortie production over
the 10 trials for each case, The results are shown in Table AX8,
We made one more refinement by repeating the regression analysis, but this time
using the achieved rather than the scheduled sorties, We then adjusted the results for
expected availability and added in the people not dealt with in TSAR-the dedicated crew
chiefs and the supervisory and overhead personnel.
Although we arc sure that the estimates presented here are not "accurate" in any
definitive sense, we believe that they present a realistic picture of the savings in maintenance
manpower that can be expected from improving aircraft component reliability,
Table A.8
SORTIES ACHIEVED VS. SORTIES SCHEDULED BY CASE
Scheduled Sorties per Achieved Sorties perCase Aircraft per Day Aircraft per Day
1 x 24 1.67 1.672 x 24 1.67 1.674 x 24 1.67 1.671 x 32 2,22 2.222 x 32 2.22 2.224 x 32 2,22 2.221 x 48 3.33 3.192 x 48 3.33 3.264 x 48 3.33 3.311 x 64 4.44 3.722 x 64 4.44 3.874 x 64 4,44 3.95
UAS

- 39 -
Appendix B
ESTIMATING THE EFFECTS OF RELIABILITY ON THELIFECYCLE COSTS OF ENGINES, ENGINE MODULES,
AND RECOVERABLE SPARES
INTRODUCTIONIn this study, we have estimated the effects that enhanced reliability of selected
aircraft systems and subsystems would have on the costs for engines, engine modules, and
recoverable spare parts for the F-16 A/B aircraft. Recoverable spare parts are those that are
repaired when they fail rather than being discarded (as consumable parts are), Inventories of
spare parts comprise both peacetime operating stocks and war reserve materiel (WRM).
The portion of war reserve materiel intended to be deployed in wartime with operational
units is usually maintained in air-transportable containers and constitutes what is called war
reserve spares kits, The focus of this work is on recoverable POS, but a rough estimate was
also made of the effects of enhanced reliability on capital requirements for recoverable
spares in the WRSK.The effect of improved reliability on costs was examined in two separate analyses:
The first estimated the potential effect of increased reliability on reducing the capital costs of
the F-16 A/Bs engines, engine modules, and POS. The second extended the first byestimating the effect of increased reliability on the total lifecycle costs of their recoverablePOS (the capital costs of acquiring enough recoverable spare parts to initially fil the, entire
spare parts resupply pipeline-including removal from an aircraft, through repair facilities at
the base or depot, to final return to the base or condemnation when beyond economical
repair-plus the costs of replenishing the inventory system with new spare parts). Lifecycle
costs thus include initial procurement of spare parts, the costs of repairs at the depot, and thecost of replenishment spares to replace those that have been condemned in order to keep the
inventory system operating at some desired level of performance. The computation of
requirements for recoverable spare parts is done with computerized computational systems,
each of which contains a model of the resupply system.In the model, when a component in an aircraft is deemed to have failed, it is removed
and sent to the base's repair shop. If a serviceable spare is available, that spare is installedon the aircraft immediately. Meanwhile, the failed part is either repaired at the base and
added to its supply of spare parts or designated as not-repairable-this-station (NRTS) and
07. I~l ~ h~W W

- 40-
shipped to the next level, which is delot repair, along with an order that a replacement be
sent to the base to replenish its serviceable stock.At the depot, the failed part is repaired and returned to a base or placed in inventory.
If it is beyond economical repair, it is condemned and a replacement is usually ordered from
the manufacturer. At all times, the model attempts to keep the number of spare partsavailable throughout the entire supply system at or above the authorized stock level. Forexample, whenever the number of components on hand at the base plus those on order(minus those already ordered to make up for existing shortages in aircraft) falls below the
authorized stock level, another spare is ordered Immediately.
Condemnation costs refer to the replacement costs of spare. parts that are beyondeconomical repair and are disposed of, As used in the model, apipeline is defined as the
expected number of spare parts In resupply--in base repair, depot repair, in transit betweendepot and base, or awaiting replacement after condemnation. When we occasionally refer to
sections of the resupply pipeline-e.g,, "the base repair pipeline" or the "order-and-shippipelinc"-we simply mean the expected number of components undergoing base repair or In
transit from the depot to the base.
The analytical techniques used to estimate the effects of enhanced reliability on the
capital and replenishment costs of engines, engine modules, and recoverable spare parts armdiscussed in this appendixt. The two analyses were done about I-1M2 years apart,
The first study estimated the reduction in the capital costs of engines, engine
modules, and recoverable spares that might have been achieved if the F- 16 A/B aircraft's
fire control and propulsion systems had been initially designed with greater reliability. By
capital costs we mean the total cost of all initial stock levels in the supply system, given aspecified, steady-state description of the flying hour program, aircraft force structure, item
characteristics, and aircraft availability goal. We postulated twofold and fourfold
improvements in component reliabilities for these two systems,.The second study attempted to extend our estimates of capital costs for recoverablc
spares to include their total lifecycle costs from the initial investment for procurementthrough depot-level repair and stock reple~ishment to eventual disposal.
Clearly, cost reductions constitute only one class of benefit to be dc'ived from
improved reliability. Enhanced combat capability through improved mt.-,sion performanceand higher sortie generation rates are also achievable.
This appendix is divided into two main sections: The first covers the case of
estimating capital costs for engines and engine modules. The second major section deals
with recoverable spare parts, It describes how capital costs were estimated, then discusses
*: ,

-41-
problems encountered in riferring lifecycle procurement costs of recoverable spares (the
additional capital cost of replacements needed just to maintain a certain level oi performance
in the face of cha, gighg demands and changes in the characteristics of parts--e.g., demand
rates) from our knowledge of initial capital costs. Then we suggest a way of estimating the
lifecycle costs of recoverable spares. After that we discuss their lifecycle depot-level repair
and condemnation costs.
THE CAPITAL COSTS OF ENGINES AND ENGINE MODULES
The estimate of initial capital costs for engines and engine modules was done by
Headquarters, AFLC/XRS, using Mod-METRIC, the model the Air Force itself uses to
compute such requirements. Our computation is literally a replication of the Air Force's.
The resulting estimaten were scrutinized by personnel at the Acquisition Logistics Division Iand Headquarters, AFLC. The scenario shown in Table B.1, which was used for thiscomputation, approximates the F-16 A/B force structure and flying hour program in the third
quarter of fiscal year 1985. The flying hour piogram specified assumes equal utilizationr
rates for all aircraft.
AFLC computes two requirements for engines ana engine modules. The first is for IPOS; the second is the wartime requirement based on providing for 30 days of removals atwartime rates. AFLC's stated requirement, iubject to later adjustment, is simply the larger
of the two numbers. In our computation, the wartime requirement was invariably the larger
Table B,1
SCENARIO FOR ENGINE AND ENGINE MODULEREQUIREMENTS COMPUTATIONS
Order-and- Flying HoursBase PAA Ship Time per Month
McEntire 24 10 670USAFE-A 72 15 2000USAFE B 72 15 2000 IPACAF A 48 15 1,40Hill 121 10 3370 -Shaw 48 10 1340
Nellis 93 10 2590Eglin 3 10 80MacDill 84 10 2340Luke 51 10 1420Edwnrdc. 16 10 450
.I

-42-
of the two. The computed peacetime requirements were $462 million, $280 million, and
$i70 million for the current (IX), the twofold (2X), and the fourfold (4X) reliability cases, Irespectively. Table B.2 reflects the wartime requirements, which were 60-65 percent higher
for each ease.
The computation of investment requirements for engines and engine modules was
done for the time when the combination of force posture and flying hour program yielded
the greatest requirement--the third quarter of fiscal year 1985. In contrast to the case Uf
recoverable spare parts, which is discussed below, initial capi' al cost ;onstitutes the total
investment cost requirement for engines and engine modules oser the lifecycle of the
weapon system. Also, the phenomenon of ch/arn, the substantial year-to-year changes in the
database used to support the computation of require'mnents for recoverable POS, is not aconcern in these calculations of engine requirements because engines and engine modules
are not included in the recoverable spares database but engine recoverable spare parts are.Thus, thk; engine and engine module capital costs in Table B.2 already represent total
lifecycle investment costs. As can be seen, at a twofold reliability improvement, the Ipotential saving in capital costs is approximately $340 million.
ESTIMATING THE EFFECTS OF ENHANCED RELIABILITY ON THECAPITAL COSTS FOR RECOVERABLE SPARE PARTS
The capital cost for recoverable spare parts Is the cost of providing ,sufficient stock to
fill the recoverable spare parts supply pipeline and protect against demand variability. The
requirements computational method presumes a given (specified) steady-state system
description and specified level of performance.
Table B,2 S
ENGINE AND ENGINE MODULEREQUIREMENTS
Reliability RequirementFactor ($ millions)
Ix 787.82X 448.14X 270.7
It
-43-
Our estimates of the capital costs for recoverable spares were made using the Logistic
Management Institute's Aircraft Availability Model. The logic of the model is consistentwith that planned for the Air Force's computation of recoverable item requirements. [8]
AAM is an analytical model based on probabilistic and economic concepts. It
produces expenditure vs. availability curves by relating procurement and repair costs toaircraft availability rates.
By ranking aircraft spare parts as candidates for procurement and repair in decreasing
order of benefit per cost, AAM optimizes aircraft availability for any given funding
constraint and produces optimal "shopping lists" and repair requirements by component, for
any specified funding level.AAM considers an aircraft "available" as long as it Is not awaitinig repair,
replacement, or shipment of a recoverable component. However, such other circumstancesas the need for on-aircraft maintenance or a lack of consumable spare parts may prevent, an
aircraft from performing its mission. Thus, availability is not a complete measurement ofmission readiness.
Our approach to estimating capital coats as a thnction of reliability consisted ofseveral steps:
1. Specify the force structure and aircraft utilization rates consistent with the
AAM's average base assumption.2. Using the Air Force's current D041 database, compute the stockcge posture
(total stock levels of all recoverable spare parts required to achieve an estimated
80 percent aircraft availability rate during peacetime).
3. Compute the baseline capital cost of this stockage posture using the curent unitprice extended over the total quantity of each line.
4. Postulate inproved reliability for just the subsets of items associated with the
propulsion and fire control systems, and recompute the stockage posture for 80
percent availability (for both 2X and 4X reliability improvements).
Up to this point, we are dealing only with initial capital costs. Therefore, thisprocedure does not account for condemnation costs nor for the costs caused by chum in thedatabase over time (e.g., items being deleted from the database, new items being added, andexisting item characteristics changing). These issues, as well as depot-level repair and
condemnation costs, are addressed below.
I

"-44-
To use AAM in step 1, we fitst attempted to determine the stock numbers associated
with each of the two aircraft systems, propulsion and fire control, through use of the
WUC NSN dictionary that matches the work unit codes used in the maintenance data
system with national stock numbers. However, we found that the dictionamy did not contain
work unit codes for many items, so we finally used federal stock class (FSC) as a surrogate
for WUC. We inferred the first two digits of the WUC from a cross-tabulation of FSC with
WUC. This mapping supports the use of the FSC for our purpose; the estimate appeared to
be quite good in the sense that each of the federal stock classes chosen for inclusion in one of
the two systems had a very high proportion of applications to that system. Table B.3 shows
the mapping.
A few of these FSCs are exclusive to the propulsion and fire control systems (1270
and 2840, for example). Most are not, Those that are not were chosen for inclusion based
on the high proportion of their applications to these two systems. Certain other FSCs also
@ applied to the systems but were excluded because those particular applicationis represented
only R small proportdon of their total applications.
In step 2 we computed the required stockage posture. The analysis consisted of
several steps.1 Firot, an F-16 database was extracted from the March 1984 D041 database.
Table B.3
INFERRED MAPPING O0 FEDERAL STOCKCLASS INTO AIRCRAFT SYSTEM
Pmcpulsion Fire ControlSystem System
2840 1270*2915 6841
2925 59852935 59902995 660563-,06685
This dtiscussion draws heavily from Ref. 1i.
0"

-45-
This file contained only those components applicable to the F-16. For F-16 components that
also were common to one or more other model-design aircraft as specified in the March
1984 D041 database, prorated condemnations and demand rates were used.
We then examined the F-16 A/B force structure from FY 78 through FY 90 (the
period covered in available Air Force planning documents). As time passes during this
period, the F-16 A/B aircraft used by USAF are turned over to the Air National Guard and
replaced by the F.16 C/D. This "migration" of the F-16 A/B results in a changing force
posture. The number of P-16 A/B aircraft locations grows over time while the iiumber of
aircraft per location diminishes.
Because the force configuration has implications for resource requirements, we also
determined for each resource category (engines, engine modules, and recoverable spares)the time when the combination of programmed flying hours and force structure would yield
the greatest investment requirement. As noted above, the third quarter of FY 85 was found
to be the most demanding for each of the resource categories examined.
We then modifled this F-16 database to reflect the force configuration and activity
levels extracted from the USAF planning documents. They are summarized in Table B.4.
AAM asset levels (the numbei of recoverable spares in the model) were set to zero,
except for the expectcd number of items in the condemnation portion of the supply pipeline.
This was done because we were interested in estimating the capital cost of stick levels tosupport a specified 80 percent aircraft availability under Mssurnptionp of alternative system
reliability. The reaulting capital costs eomputed by the AAM for stock levels in the supply
pipelines (plus safety levels) were then offset by the condemnation pipeline quantities,
leaving only the safety level portions. This was because we did not wish to include, any
mplen1shment costs in our estimates (such as those represented by asset condemnations).
Table B.4
SCENARIO DATA FOR COMPUTING RECOVERABLE POS REQUIREMENTS
Item All F-16. F-16A F-16B
Number of aircraft 627 533 94Hundreds of flying hours per quarter" 527 448 79
"Flying hours based on 11 base# 57 aircraft per base, and 84 flying hours per aircraftper quarter, an abstraction of the UUAF planning factorr,
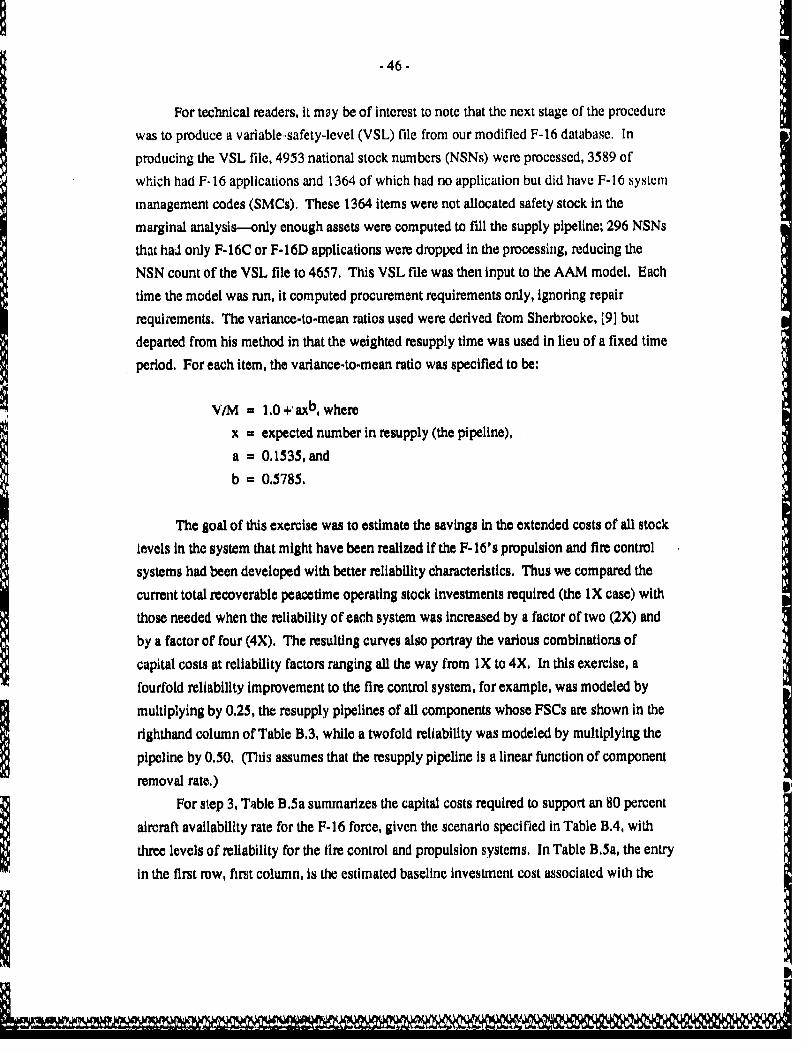
I
-46-
For technical readers, it may be of interest to note that the next stage of the procedure
was to produce a variable-safety-level (VSL) file from our modified F-16 database. In
producing the VSL file, 4953 national stock numbers (NSNs) were processed, 3589 of
which had F-16 applications and 1364 of which had no application but did have F-16 system
management codes (SMCs), These 1364 items were not allocated safety stock in the
marginal analysis--only enough assets were computed to fill the supply pipeline; 296 NSNs
that had only F-16C or F-16D applications were dropped in the processing, reducing the
NSN count of the VSL file to 4657. This VSL file was then input to the AAM model. Each
time the model was run, it computed procurement requirements only, ignoring repair
requirements. The variance-to-mean ratios used were derived from Sherbrooke, [9] but
departed from his method in that the weighted resupply time was used in lieu of a fixed time
period. For each item, the variance-to-mean ratio was specified to be:
V/M , 1.0 +,axb, where
x a expected number in resupply (the pipeline),
a = 0.1535, and
b = 0.5785.
The goal of this exercise was to estimate the savings in the extended costs of all stock
levels In the system that might have been realized if the F- 16's propulsion and fire control
systems had been developed with better reliability characteristics. Thus we compared the
current total recoverable peacetime operating stock investments required (the IX case) with
those needed when the reliability of each system was increased by a factor of two (2X) and
by a factor of four (4X). The resulting curves also portray the various combinations of
capital costs at reliability factors ranging all the way from IX to 4X. in this exercise, a
fourfold reliability improvement to the fire control system, for example, was modeled by
multiplying by 0.25, the resupply pipelines of all components whose FSCs are shown in the
righthand column of Table B.3, while a twofold reliability was modeled by multiplying the
pipeline by 0.50. (This assumes that the resupply pipeline is a linear function of componentremoval rate.)
For step 3, Table B.5a summarizes the capital costs required to support an 80 percent
aircraft availability rate for the F- 16 force, given the scenario specified in Table B.4, with
three levels of reliability for the tire control and propulsion systems. In Table B.5a, the entry
"in the first row, first column, is the estimated baseline investment cost associated with the
I-oMas

- 47 -
"Table B.5a
CAPITAL COSTS OF RECOVERABLE SPARES TO MAINTAIN80 PERCENT AIRCRAFT AVAILABILITY
(Million $)
Propulsion System Reliability FactorFire Control System
Reliability Factor 1X 2X 4X
iX 627.3 573.3 541.02X 545.5 492.4 461.04X 505.7 453.5 422.7
Baseline Investment - $627.3 million.Savings = baeline - entry (investment costs after improved reliability).
component removal rates in the USAF's DO41 database. The entry in the second row, third
column, for example, represents the costs that result from an increase in reliability by a
factor of two for the fire control system and a factor of four for the propulsion system.
Other entries in the table are interpreted similarly, Again, these estimates represent only the
capital costs for recoverable spares required to fll resupply pipelines, plus safety levels, Aspointed out previously, they do not Include the costs of condemnation replacements nor the
costs induced by chum in the database--changes in weapon system configuration, item
configuration, or item characteristics.
The results of step 4 are presented in Table B.Sb. It summarizes these same pipeline
and safety-level costs for the fire control and propulsion system components. These are a
subset of the costs shown in Table B.Sa and the data are arranged similarly to those in Table
B.5a.
ESTIMATING LIFECYCLE COSTS OF RECOVERABLE SPARESIn this section, we discuss some of the problems involved in extending these findings
to lifecycle cost estimates for recoverable spares.
The lifecycle costs of recoverable spares include procurement, depot-level repair, and
condemnation costs. The work described here was undertaken about a year after theestimates in the previous section were made. Thus, there are some differences in the
assumptions made about flying hour programs and force structure simply because the data
sources had been revised between the two analyses.Ii
.I.

IJ-48-
Table B.5b
CAPITAL COSTS OF PIPELINE PLUS SAFETY-LEVEL STOCKS FORTHE FIRE CONTROL AND POPULSION SYSTEM COMPONENTS"
(Million $)
Propulsion System Reliability FactorFire Control System
Reliability Factor IX 2X 4X
iX 174.6 152.8 141.92X 137.1 115,4 104.54X 127.1 105,4 94.5
'Excludes $160 million in fixed insurance costs and related costs not associ-ated directly with the demand for spare parts.
Baseline Investment= $174.6 million.Savings = baseline -. entry (investment costs after improved reliability),
The Problem of Estimating Lifecycle Procurement Costs2
Estimating lifecycle procurement costs for recoverable spares is difficult because of
the dynamics of the database itself. The database, in fact, changes dramatically from year to
year. This churn considerably increases the lifecycle costs of recoverable spare parts.
Consider the case in which there is no stock in the system and we wish to compute the mix
of stock levels that would minimize the cost of achieving some specified level of aircraft
availability. We define the planning horizon involved in such computations as the average
procurement lead time for the spare parts to be acquired in order to fill those stock levels and
have set that lead time at 24 months.
As previously discussed, the LMI Aircraft Availability Model is designed to solve
this optimization problem.[8] Let's say we apply the AAM to this problem (based on an
Initial no-asset position) and determine that the level of investment required is, for example,
$600 million in recoverable spares for the F-1 6 A/B force to achieve an aircraft availability
rate of 80 percent. Suppose, too, that we wish to determine how much additional investment
would be required each year to maintain that 80 percent availability rate across an indefinite
future planning horizon. If we run AAM a second time using the same database (the VSL
file), but this time compute only the additional investment that would be required a year
later, the result would be a fairly small investment requirement. In fact, the requirement
would be only that associated with the cost of condemnation replacements, giveni a constantforce stnicture and flying hour program.
2The discussion that follows is based largely on Ref. 12.
forc stuctue ad flinghourproram
I -__ -
-49 -
If we waited for a year before computii, the investment needed to maintain the
specified level of performance, however, the database on which our computations are based
would have changed in many ways in the intervening year. For example, the force structure
might not have evolved as we had originally planned, or the flying hour programs might
have changed, or items formerly applicable to the aircraft would no longer be applicable,
and new items would have appeared in the database that were not there before. Moreover,
many item characteristics themselves would have changed, such as the NRTS ratet, repair
times, component removal rates, order-and-ship times, unit prices, etc. With all the changes,
computation of the investment required to mahitain the specified level of system
performance is likely to be dramatically different from that using the previous year's
database.
As a practical matter, the investment requirement is likely to be far higher for two
reasons: First, if an item's supply pipeline requirements decrease, some of the stocks of that
item on hand do not contribute much to aircraft availability because they are less likely to be
needed; second, if the number of items in the pipeline increases, additional investment is
required to provide the same level of performance as before, Intuitively, such random
changes in the factors influencing item pipelines occur across many items and tend to induce
the need for substantial additional annual investments in order to sustain a specified level of
performance.
The magnitude of the effects of chum is really rather remarkable when contrasted
with analytic results derived from the naive viewpoint that the requirements database models
a steady-state system, It clearly does not. The database is subject to all of the dynamics that
affect the real world that it represents. Those dynamics are substantial even in a fairly
benign peacetime environment and are likely to be compounded by rapidly changing
circumstances in wartime. We believe that planners should be able to accurately estimate
the lifecycle procurement costs of the recoverable spares needed to maintain a specified
level of availability across the life of a weapon system. Doing so requires that chum be
quantified, assigned a dollar value, and incorporated into estimates of annual investment
requirements for replenishment spares.In accounting for this chum, we developed a measure of its effect on the computed
annual investment requirement. This chum factor is simply the computed additional
investment caused by the chum alone divided by the total capital costs, In other words, it is
the proportion of the total capital costs (the total cost of all stock levels at all locations in the
system) spent on additional spares just to keep up with database dynamics.

- 50-
The Analytic Design
In estimating total lifecycle procurement costs for recoverable spares for the F-16A/E, we estimated the dollar amount of churn in successive years, the chum factors, and •,
th-ir effects on additional annual investment requirements. What we learned is undoubtedlyrnot unique to this program, however, and we believe it can and should be applied inprinciple to virtually all weapon system programs.
The method we used to estimate the dollar amount of chum, and ultimately the chumfactor, Involved the use of two sets of D041 databases. For the first estimate, we used the
databases for September 1983 and September 1984 (shown In the tables as the 83S and 84S
databases). Ignoring most of the technical details of database processing involved, we willdescribe the method of estimating the chum and the chum factor, using the 1983 and 1984databases. The method consists of the following major steps:
1. Using the 1983 database, we computed the investment required in 1984 (whichwe will refer to as the $83S4 costs) to buy the spare parts to fill the optimal mix
of stock levels thuroughout the system to yield an 80 percent airraft availability
rate at the point beyond 1984 of an average 24-month procurement lead time, inabout mid-1986. We based the calculation on the assumption that there was no
stock in the system at the start, This yielded the $83S4 capital cost estimate.2. Then, again using the 1983 database, we computed the investmnent required in
1985 (the $83S5 costs) to maintain the same 80 percent aircraft availability 24
months later, in mid-1987, assumhig that the mix of spares that emerged from
the 1983 to 1984 computation had actually been procured, This yielded the
additional funding required in 1985 on the basis of 1983 data-the $83S5 amountshown In the tables later in this section.
3. Using the 1984 database, we then computed the Investment required in 1985 tomaintain the same 80 percent aircraft availability In mid-1987, again assuming
that the mix of spares that emerged from the 1983 to 1984 computation was
actually procured, This yielded the additional funding required in 1985 on thebasis of 1984 data-the $84S5 amount shown in the tables.
4. Thus, our estimate of the dollar amount of chum (the amount due to the change
in the database between 1983 and 1984) was simply made by subtracting $83S5from $84S5. The chum factor is the additional dollar amount of Investment Uinduced by chum divided by the total capital cost ($83S4), and is calculated as
[($84S5 - $83S5) + $83S4].
... .. .. ..

-51-
The costs of additives and condemnations were excluded, although the costs of safety
levels for the condemnation pipelines were included. Additives are requirements that are
determined outside the formal computational algorithms of the D041 system, and are. also
beyond the scope of .he AAM used in this analysis. Thus the data discussed here do not
reflect the effects of aircraft modification programs. (Condemnations and depot-level repair
costs are discussed separately below,)
In our analysis, the $8355 costs were estimated using the flying hour program for mid-
1987 that was current as of September 1983, but only with program changes and
condemnations accounted for. When the $84S5 costs were estimated, the flying hour
program for mid-1987 that was current as of September 1984 was used, along with the 1984
database that reflected many changes In Item applicability and characteristics from the 1983
database.
This estimate of additional annual investment fails to account for the fact that AFLC
does not actually buy the mix of spares suggested by the requirements computation', in
execution, managers modify the recommended buy quantities for various of reasons. These
judgmental modifications may cause even more turbulence In requirements determination
than estimated by the method described here. Our estimating technique assumes that, in the
above case for example, the mix of spares computed in the 1983 to 1984 computation
actually was procured.
The individual components included in this analysis were selected from the D041
data system based on application data that tied them to the F-16 A/B aircraft, If no
application record could be found, the system management code (SMC) was used. If a
component was selected on the basis of SMC alone, no safety level was computed by tle
AAM because application data are required in order to support the computation of safety
level requirements. The 1983 database contained 3121 components with F-16 A/Bapplications and an additional 1441 components that, although without data reflecting an
F-16 A/B application, were Included on the basis of SMC. Factors applicable to common
components were prorated to the F-16 A/B based on usage.
The two analyses described In the discussion that follows estimated the dollaramounts of chum on the basis of both the chum from the 1983 to the 1984 databases and the
1982 to 1983 databases.
S 61

-52-
Estlmatlng the Dollar Amount of the 1983 to 1984 Churn
Step one reduced the 1983 to 1984 computation; Table B.6 reflects the flying hour
program and air' -aft force posture assumed for our computation, 18 months past the end of
fiscal year 1984.
As shown below, the $83S4 capital requirement turned out to be $527.1 million.Table B.7 reflects the breakdown of this investment.
Table B.6
ASSUMPTIONS UNDERLYING THE1983 TO 1984 COMPUTATION
(Number of bases - 11)
Flying HoursAircraft (hundreds) Number
F-I 6A 443 838F-16B 73 93
Totals 516 631
Table B.7
COMPOSITION OF THE 1983 TO 1984CAPITAL REQUIREMENT
(Million $)
Pipeline requirements 184.7Safety levels' 183.7Negotiated levelsb 105.2Insurance roquirementsc 53.5
Total $83S4 requirement 527.1
"Safety levels protect against variabilityin the number of iems in the pipeline.
bNegotiated levels represent additionalspares required because of judgmentsapeplied by supply offiers and managers in
tlefield.I~naurance requirements are intended to
provide protecton against unforecast tie.mends.
I)L
Iv

-53.
Table B.8
ASSUMPTIONS UNDERLYING THE1983 TO 1985 COMPUTATION
(Number of bases = 14)
Flying HoursAircraft (hundreds) Number
F.16A 426 528F-16B 73 93
Totals 499 621
Step two was the $83S5 computation, As explained before, the computation is based
on the assumpton that the mix of spares emerging from dhe 1983 to 1984 computation was
actually procured. That mix constituted the starting asset position for the 1983 to 1985
computation. The flying hour program and force posture assumed are shown in Table B.8,
Table B.9 shows the 1983 to 1985 computational results.
The slight decrease in programmed flying hours and projected force size for fiscal
year 1987 is probably largely offset by the increase In the projected number of F-16 A/B
bases. As reflected in Table B.9, the additional funding in fiscal year 1985 to maintain the
80 percent aircraft availability goal is $9.8 million, less than 2 percent of the $527.1 million
capitalization Investment. (Recall that this $9.8 million requirement excludes condemnation
replacements.)
In step three we use the 1984 database to compute the $84S5 costs. Table B, 10
reflects the underlying assumptions current as of September 1984; Table B. 11 shows the
results.
Table B,9
RESULTS OF THE 1983 TO 1985 COMPUTATION
Additional insurance, negotiated,and pipeline requirements 7.6
Safety level 2.2
Total $83S5 requirement $9.8 million
* V

Table B.10
ASSUMPTIONS UNDERLYING THE.1984 TO 1985 COMPUTATION
(Number of bases = 13)
Flying HoursAircraft (hundreds) Number
F-16A 430 531F-16B 74 95
Totals 504 626
Table B.11
RESULTS OF THE 1984 TO 1985 COMPUTATION
Additional insurance, negotiated,and pipeline requirements 59.9
Safety level 26.9
Total $84S5 requirement $86,8 million
In step four we subtracted the $83S5 requirement from the $84S5 requirement to
determine the dollar amount of the 1983 to 1984 chum, This totaled $77 million ($86.8 -
$9.8 million), a ratier substantial 14.6 percent of the $83S4 capital cost, and almost eight
times that assumed in the 1983 to 1985 computation,
Compensating for Changing Component Unit Prices
In an effort to understand how much of the estimated dollar amount of the 1983 to
1984 chum might be due to changing component unit prices between the 1983 and 1984
databases, we compared the 1983 database item by item with the 1984 database.
Surprisingly, on the average, for the set of components considered, the 1984 prices were
lower. The results are shown in Table B. 12.
Thus the dollar amount of chum due to changing unit prices of components is, in this
particular case, insignificant.
The chum factor is the estimated dollar amount of the 1983 to 1984 chum divided by
the $83S4 level of capitalization: $77.2 million + $475.1 million - 0.162 (for $84S),
LOM
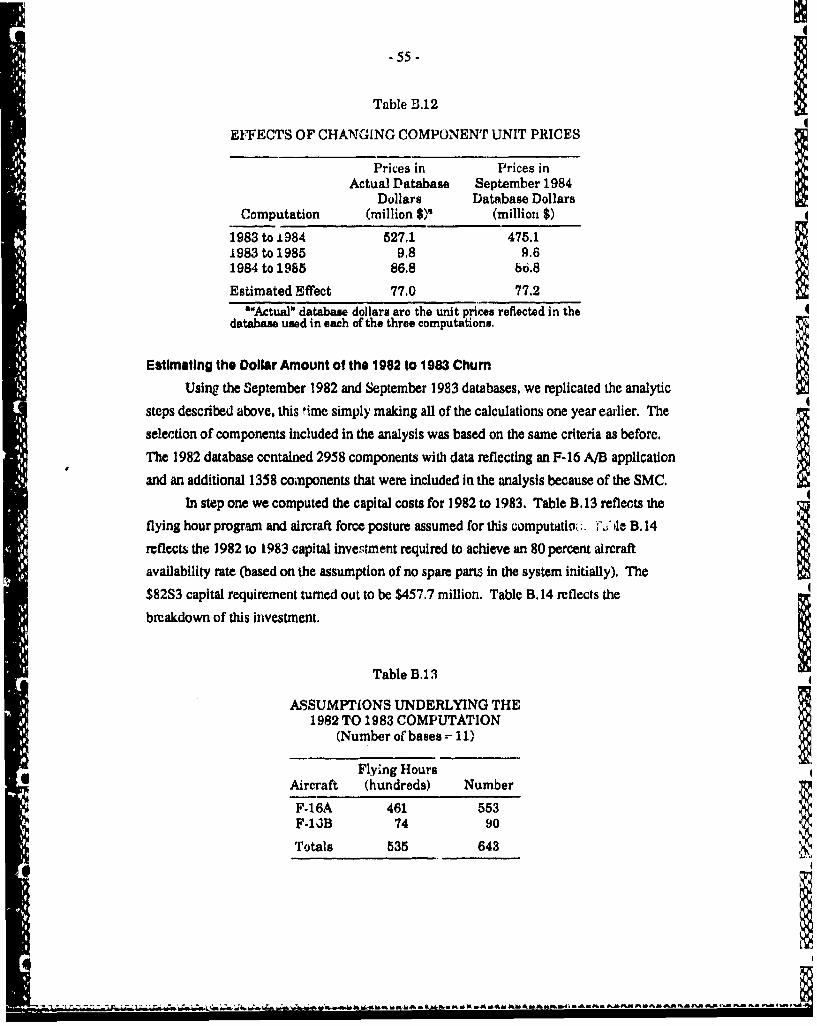
-55-
Table B.12
EFFECTS OF CHANGING COMPONENT UNIT PRICES
Prices in Prices inActual Database September 1984
Dollars Database DollarsComputation (million $1' (million $)
1983 to 1984 527.1 475.11983 to 1985 9.8 9.61984 to 1985 86.8 b6.8
Estimated Effect 77.0 77.2"Actual" database dollars aro the unit prices reflected in the
database used in each of the three computations.
Estimating the Dollar Amount of the 1982 to 1983 Churn
Using the September 1982 and September 1983 databases, we replicated the analytic
steps described above, this time simply making all of the calculations one year eaiier. The
selection of components included in the analysis was based on the same criteria as before.
The 1982 database ccntained 2958 components with data reflecting an F-16 A/B application
and an additional 1358 components that were included in the analysis because of the SMC.
In step one we computed the capital costs for 1982 to 1983. Table B.13 reflects the
flying hour program and aircraft force posture assumed for this uomputatio;: 1", Ale B. 14
reflects the 1982 to 1983 capital investment required to achieve an 80 percent aircraft
availability rate (based on the assumption of no spare parts in the system initially). The
$82S3 capital requirement turned out to be $457.7 million. Table B. 14 reflects the
breakdown of this investment.
Table B.13
ASSUMPTIONS UNDERLYING THE1982 TO 1983 COMPUTATION
(Number of bases - 11)
Flying Hours
Aircraft (hundreds) Number
"F-16A 461 553F-1JB 74 90
Totals 535 643
L
-~ - - -- - ~eM ~ ~ ~ - ~ ~ a .~- . ~ .~ ~ ~ ~ ~ ~

-56-
Table B.14
COMPOSITION OF THE 1982 TO 1983CAPITAL REQUIREMENT
(Million $)
Pipeline requirements 171.4Safety levelsa 150.1Negotiated levelab 95.3Insurance requirements0 40.9
Total $82S3 requirement 457.7
"Safety levels protect against variabilityin the number of items in the pipeline.
"1Negotiated levels represent additionalsp.res required because of judgments
applied by supply officers and managers in= the field.'Insurance requirements are intended to
provide protection against unforeceast de-mands.
Step two began with the assumptions underlying the estimation of the $82S4
requirement-the additlunal funding required in 1984 based on the 1982 data (shown In Tables
B.15). Table B.16 shows the results of the 1982 to 1984 computation.
Again, as in our estimate of the dollar amount of 1983 to 1984 chum, the changes in
flying hour program mid force posture on the one hand and number of bases on the other
tended to be offsetting. The additional Investment of $7.1 million required to maintain the
80 percent aircraft availability goal Is quite modest, only about 1.5 percent of the total capital
cost.
Table B.15
ASSUMPTIONS UNDERLYING THE1982 TO '1984 COMPUTATION
(Number of bases = 10)
Flying HoursAircraft (hundreds) Number
F-16A 485 573F-16B 71 83
Totals 556 656
IIWMW-- . .',

I
.57-
Table B.16
RESULTS OF THE 1982 TO 1984 COMPUTATION
Additional insurance, negotiated,and pipeline requirements 7.0
Safety level 0,1
Total $8284 requirement $7.1 million
In step three we used the 1983 database to compute the $83:%4 costs, based on the Iassumption that the mix of spares that emerged from the 1982 to 1983 computation wasactually procured and constituted the starting asset position for this 1983 to 1984
computation. Refer to Table B.6.
Table B. 17 shows the results of this new 1983 to 1984 computation; the estimated Iadditional requirement is $117.5 million. The result differs from the one previously
described as the 1983 to 1984 computation (see Table B.7) because the starting asset
position is not zero but rather the result of buying the mix of spares suggested by the 1982 to
1983 computation.
In step four we determined the dollar amount of the 1981 to 1983 chum by
subtracting the $82S4 requirement from the $83S4 re-wpquirement: $117.5 - $7.1 = $110.4
million. This is more than 24 percent off the $82S3 capital investment and over 16 times that
assumed in the 1982 to 1984 computation. The difference is even more dramatic when
viewed in the context of the 7.1 percent decrease in flying hour program.
Table B.17
RESULTS OF THE 1983 TO 1984 COMPUTATIONFOLLOWING THE 1982 TO 1983 PROCUREMENT
(Million $)
Additional insurance, negotiated,and pipeline requirements 73.1
Safety level 44.4
Total $83S4 requirement $117.5 million

-58-
Compenhating Again for Changing Component Unit Prices
Actual database dollars were again translated into constant database dollars, this time
1983 dollars. The results are shown in Table B.18. In this case the changing unit prices of
components had no effect whatever on the dollar amount of the chum.
The chum factor is the estimated dollar amount of the 1982 to 1983 chum divided by
the $82S3 capital cost: $110.4 million + $522,0 million = 0,211 (for $835).
Table B. 19 compares the two estimates of dollar amount of chum, compensating in
each case for chMnging component unit prices.
Table B.18
EFFECTS OF CHANGING COMPONENT UNIT PRICES
Prices in Prices inActual Database September 1984
Dollars Database DollarsComputation (Million $) (Million $)
1983 to 1984 457.7 522.01983 to 1985 7.1 7.11984 to 1985 117.5 117.5Estimated Effect 110,4 110.4
Table B.19
COMPARISON OF EFFECTS OF 1902 TO 1983 CHURN WITH EFFECTSOF 1983 TO 1984 CHURN
Time Period Capitalization Estimated Amount' Churn Faertorb
1983 to 1984 $475.1 million $ 77.2 million 0.162 ($84S)1982 to 1983 $522.0 million $110.4 million 0,211 ($83S)
'Estirmatod dollar amount of churn.bEstimated dollar amount divided by total capital costs.
Estimates of the Dollar Amount of Churn
Given the variability in computed capital cost levels, it is hardly surprising that the
estimates of dollar amounts due to chum differ as much as they do. The best we could have
hoped for was that the estimates of those amounts as a percenrtage of capita cost (the chum
factors) would have been closer. That would have been encouragieg in tcalms of the
I,

-59-
feasibility of using such estimates to project lifecycle procurement costs for recoverable
spares. However, it is not clear, based or. these estimates alone, that this method provides a
sound basis for such cost projections. The dynamic changes in the database from year to
year are dramatic. indeed and need to be explicitly accounted for in any use of thi database to
project future investment requirements for recoverable spares.
Despite our conIems about whether we had In fact achieved estimates of the dollar
amount of chum that could reasonably be viewed as representative of the amounts that
would actually be experienced across the life of this weapon system, we did apply them to
the estimate of lifecycle procurement costs on the assumlition that a replication of these
analyses would yield roughly comparable estimates. Thus, the following discussion of the
possible magnitude of lifecycle procurement costs of recoverable spares for the F- 16 A/B
program may be viewed as somewhat hypothetical. We believe that it will suggest the
magnitude of Iavings in such costs that might be achievable thiough reliability*0 improvements is very substantial indeed, much more so than would be the case in the world
seen as a steady state system.
Tile Estimate of Lifecycle Procurement C sto for Recoverable Spares
First, since we knew only total flying hours for fiscal years 1980 through 1983, we
assigned the flying hours in a way that is consistent with a linear buildup of the force
posture. Fer the fiscal years from 1984 through 1990, we extracted the flying hours from
USAF documents. This results in the flying hours by fiscal year shown In Table B.20.
Next, we adjusted the capital required for each fiscal year so that It was proportional to the
$83S4 capital costs computed using the 51,600 flying hours (a quarterly figure) shown in
Table B.A. This adjustment raises the capital required in FY 84 to achieve an 80 percent
aircraft availability rate in FY 816 from the $527.1 million shown in Table B,7 to $564.5
million. The capital costs for every other year are in the same proportion to the flying hours
for that year as in FY 86&
The estimates contained in Table B.20 are based on the simplifying assumption that
an investment in spare parts in ary particular fiscal year is reflected in aircraft availability
two years later.The required annual investments shown in Table B.20 are based on the chum factors
reflected in the column headings. In addition to showing the annual investment resulting
from the two chum factors we calculated, we also have included estimates of the annual
invesunent that would be required if the chum factors were 0, 100, or even 0.0 (as if therewere no chum and no dollar amounts of churn, and all program data were known with
"I

p-60-
Table B.20
F-16 A/B POS INVESTMENT REQUIREMENTS BY FISCAL YEARS, FOR 1978 THROUGH 1990
Additional Investment Required (million $)
Churn Churn Churn ChurnFiscal Flying Capital Factor - Factor = Factor = Factor =Year Hours Costs 0,211 0.162 0.100 0.000
78 0 0.0 83.0 83.0 83.0 83.079 0 0.0 100.5 96.4 9,1.3 83.080 32496 83.0 118.0 109.9 99.6 83.081 64991 166.0 135.5 123.3 107.9 83.082 97487 249.0 237.1 220.8 200.2 167.083 129982 332.0 158,0 133.5 102.6 52.784 195402 499.0 129.2 102.2 68.0 12.885 216020 551.7 100.6 72.9 38.0 0.086 221041 564.5 90.1 63.4 29.5 0.087 213782 546.0 89.0 63.5 31.2 0.088 203960 520.9 73.0 48.5 17.5 0.089 195776 500.0 68.3 45.4 16.5 0.090 183079 467.5 63.9 42.5 15.4 0.091 171205 437.292 160102 408.9
Total 1505.9 1244.9 900.7 564.5
certainty), The inclusion of these additional chum factors (0.100 and 0.0) reflects our
uncertainty about the accuracy of our estimates of the dollar cost of chum and uncertainty
whether we have actually bracketed the "true" cost, To us, the 0.211 factor seems especiallyhigh. The inclusion of the two additional factors helps to show the sensitivity of lifecycle
cost estimates to the value of the chum factor.The required additional annual investments are computed by deducting the total
capital required one year in the future from that required two years in the future, and thenadding to that the dollar amount calculated by multiplying the chum factor by the capital
required one year in the future. In computing the estimated additional investment required in
FY 83 with a chum factor of 0.211, for example, we deduct $499.0 million from $551.7million, to get $52.7 million, which is the increase in capital cost, and then add to that 0.211
times the total capital required in FY 84 (0.211 x $499.0 million - $105.3 million, and $52.7million + $105.3 million = $158.0 million).
I' .. "Hem

-61-
In summary, these investments are based on the assumption that, to maintain a
specified level of performance from one year to the next, we must not only buy
condemnation replacements but we must also invest an additional amount to overcome the
effects of chum in the database. However, whether a single numerical constant such as the
"chum factor" can be used over time to represent that additional Investment requirementmust be a subject of additional and more thorough research. If it is teasible to model the
process in this way, then estimates of lifecycle procurement costs for recoverable spares
requirements could be made quite early in a weapon system's lifecycle. More important,
perhaps, such an approach could be especially useful in the plannin, programming, andbudgeting system (PPBS). '6
In Table B,21 we show the lifecycle procurement costs of recoverable spares as a
function of the churn factor and reliability level. Obviously, the highest capital cost required
In any single year in the life of a weapons system only hints at the total lifecycle cost of its
recoverable spue parts.
Estimating Lifecycle Condemnation and Depot Repair CostI
Our estimate of the lifecycle costs for condemnation replacements and depot levelrepairs of recoverable spares were computed from the three different databases, 1982, 1983,and 1984. They were based on a cumulative total flying program of 1,484,950 hours and
269,057 hours for the F-16A and F-16B, respectively. The results are shown In Table B.22. IThe averages shown in the bottom line of Table B.22 are the best estimates of
lifecycle condemnation and depot repair costs that can be made with these three databases.
However, the behavior of the sequence of estimates of condemnation replacement costs
Table B.21
THE EFFECTS OF RELIABILITY AND CHURN ON THELIFECYCLE COSTS OF RECOVERABLE SPARES
(Million $)
Churn Reliability ImprovementFactor iX 2X 4X
0.211 1505.9 1182.1 1015.00.162 1244,9 977.2 839.1
0.100 900,7 707.0 607.1
- -:-I

- 62-
Table B.22
LIFECYCLE CONDEMNATION AND DEPOT REPAIR COSTSFY 78 THROUGH FY 90
(Million $)
Condemnation Costs Depot Repair Costs
Database Database 84S Database 84882S 983.4 1072.1 988.0 1231.1838 937.2 897.7 1-226.4 1228.984S 542.4 542.4 1065.2 1065.2
AverageB 837.4 1,175.1
suggests that the use of the $837.4 million average could be misleading. The substantial* ~decrease In the annual estimates of condemnation costs over these thre databases is due
largely to changes in the condemnation costs ah-sociated with the engine overhaul program.These changed from $645.7 million to $Si4.5 million to $250.6 million from the 1982 to the1983 to the 1984 databases rebpectively (in nominal dollars).
The engine in the F- 16 A/B aircraft has benefited from substantial productimprovement investments over this time period. This has had an Important effect on all ofthe estimates of lifecycle costs and, Indeed, on the total costs incurred by the Air Force tosupport the program. One might argue, therefore, that these cost estimates are atypical in thesense that they tend to be driven inordiinately by engine reliability problems. Nonetheless,we do not know how to improve thcm without much mor ecxtensive research than wasundertaken here. Changes in item characteristics due to reliability modifications contributesubstantially to chum; therefore, the doliar amount of chum is likely to be lower, other thingsequal, for a weapon system whose initial reliability is greater. This logic providesreinforcement for strategies designed to enhance design r~oiability.
The use of the average value of depot repair costs of $1,175.1 million seems morereasonable because of the consistency of tht- estimates from year to year.
In conclusion, it Is difficult to guc 's how our estimates of the dollar amount of chum
and lifecycle depot repair and condemnation costs for the F- 16 A/B might differ from thosemade for a different weapon system. Perhaps It is an experiment worth replicating onI several other weapon systems to get a better sense of the size of chum's contribution to
hm

0U
.63-
lifecycle costs of recoverable POS. Clearly, such an analysis could enhance the Air Force's
ability to project investment requirements for recoverable spares in future years. It would
also provide a better basis for understanding the potential dollar value of reliabilityimprovements in hardware design.

-64-
Appendix C
THE EFFECTS OF IMPROVED RELIABILITY ONDEPLOYMENT REQUIREMENTS
In examining the effects of improved reliability on the amount of air-delivered
support items (including personnel, spares, and equipment) needed to support a bale-
base deployment of a 24-PAA F-16 A/B squadron, we used the equipment list in the "Wing
Mobility Materiel List" for the 388th Tactical Fighter Wing at Hill Air Force Base in
November 1983 [7] Infonnatiun on personnel was obtained from the Air Force Manpower
and Personnel FReadiness Team.[10] Because such equipment and personnel lists are
continually being revised, our results are representative only; however, we believe the major
conclusions rt ached would be the same unless radical changes in deployed equipment were
made,
TYPES OF EQUIPMENT AND PERSONNEL DEPLOYED
Reference I defines the equipment and personnel to be deployed by means of Unit
Type Code (UTC). The items in each UTC am broken down by Deployment Echelon
(DEPECH), which defines the purpose of each group of equipment and people, The UTCs
and deployment echelons we have considered are shown in Table C. 1.The equipment in the UTC lists allow an independent squadron of 24 F-16s to deploy
and operate for a 30-day period, making 2.8 sorties a day per aircraft for the first seven days
and 1.1 sorties per day per aircraft thereafter. It also includes the equipment necessary to
provide an intermedikite maintenance capability after 30 days, and to allow for handling
munitions.
EQUIPMENT THAT NEED NOT BE DEPLOYED BY AIRLIFT
The air delivered equipment covered by these trrCs does not represent all of thetorunage that must be delivered to mount an effective operation. Major items such as fuel,armament, housing, and food are excluded because they often will be available locally or
from sites much closer to tie deployment area than the CONUS and thus need not be
delivered by air from the CONUS. Such items actually weigh far more than the support
equipment items (see Table C.2), but their closer location would probably allow them to bedelivered in time by truck, train, or ship.
I

-65--
- 65 -
Table 0.1
DEPLOYMENT OF 24 F-16S
Equipment PersonnelUTC DEPECH Purpose Weight (tons) (excluding pilots) I
3FKAA El En route support 5.8 383
E2 En route support 7.6E3 En route support 5.2S1 Support for 7 days 70.0
operation at 1.1sortie rate
Increment to raise 69.3
sortie rate to 2,8in the first 7 days
T2 Increment to maintain 42.6sortie rate of 1,Afrom day 8 to 30
HGHAB Mi Munition suppoit 137.4 66 -
HFAGA T3 Intermediate maintenance 82.8 113facility availableafter 30 days
Total 420.7 562
Table C.2
WEIGHT OF SUPPORT MATERIALNOT INCLUDED IN UT~s
WeightItem (tons)'
Fuel 16,641Bombs 2,346Housing 519Food 18
OF-16s are loaded with 2 AIM-9Je, 2Mk 8&., 1 ALQ.119-12 ECM Pod, 157 lbof ammo of which half is expended oneach mission, and two 370 gal fuel tanks.Fuel load is 34,318 lb of which 90 per-cent is expended. Combat radius = 486n. mi.
Housing is Harvest Eagle equipment.Data are obtained from the 4449thMobility Support Squadron at HollomanAFB.
Food is estimated as 2 lb/man/day.
I I

- 66-
AIR-DELIVERED SUPPORT EQUIPMENT
From the "Wing Mobility Material LisN" we obtained a listing of the support items
that must bc deployed by air. It shows approximately 150 different types of equipment, in
addition to hand tools, small parts, and war reserve spares kits (WRSK). The heaviest
individual item (an aircraft towing tractor) weighs slightly over 11,000 lb. The heaviest
items have been arranged In descending order of total aggregate weight (number of Items x
individual weight) and are shown in Table C.3 and Fig, CA.
The weight of the items shown (591,619 lb or 296 tons) amounts to about 70 percent
of the total 421 tons of support material deployed.
DEPLOYED PERSONNEL
A total of 562 support and maintenance people are deployed. Based on the data
obtained from the Air Force Manpower and Personnel Readiness Team, we have broken
these down into groups associated with various types of work. The results are shown in
Table C.4,
POTENTIAL REDUCTIONS DUE TO IMPROVED RELIABILITY
Improvements in aircraft rellability raight be expected to allow redutlons in the
amount of equipment and personnel that must be deployed to support a specified flying
schedule. For example, fewer spare parts may be required, and thus the amount of WRSK
could be reduced. Likewise, if the avionics become more reliable, the number of generators
needed to supply power to the aircraft during avionics system checkout might be reduced.
However, there are limitations on these potential savings. Much of the deployed
equipment is not affected by reliability. For example, as long as the sortie rate is kept
constant, the number of bomb jammers and ammunition carts will be unchanged, and more
tractors and loaders might be needed If reliability is improved.
In additior, the possible reduction in equipment may be limited when only a few
items of a particular type are deployed. For example, the CI tMst station is used for checkingand repairing inertial and computer components, items whose reliability might be expectedto improve ir, the future. Typically, two CI test stations are deployed together to guarantee
the availability of at least one stand at all times; therefore, it may not be possible to reduce
the number of stations deployed even if component reliability is improved.
I0•g'

- 67 -
Table C.3
DEPLOYED SUPPORT AND MAINTENANCE ITEMS
TotalItem Number Weight (lb)
Ammo Trailers 28 103,160Bomb Jammers 20 80,760Ammo Tractors 7 75,460Aircraft Tow Tractors 8 42,470Generators 14 40,375Spare Engines & Components 5 29,177WRSK - 26,426Light Carts 12 24,480Hydraulic Test Stands (MJ.2) 3 15,360Air Conditioners (C-10) 11 13,420Truck 1 12,500Hand Tools - 11,187Gas Carts, Cylinders (LOX,N2,02) 6 10,260Specialized Testers 4 9,921Compressors & Vacuum Pumps 10 9,320Ammo Loaders (Unloaded) 6 9,120Aircraft Engine Trailers 12 8,880Storage Cabinets 12 8,320Maintenance Stands 15 7,440TER, Launchers, Pylons, Missile
Trailers - 6,900Weapons (Rifles) 600 6,780Cranes 2 5,470Material Handling Equipment 18 5,415Maintenance Bays 4 5,000Furniture 17 4,883Chock Assemblies 8 4,760CRT Consoles 2 4,300Test Station (Processor/Pneumatic) 2 4,225Test Station (Computer/Inertial) 2 4,160Aircraft Towbars 5 2,500
Total 592,429
.. . ..

-68-
120
1101
100
80-
70-
j50 4 1i30-
20-
10
0Deployed weight (1000 Ib)
Fig. C.1--Deployed support itemsI

- 69-
Table 0.4
DEPLOYED PERSONNEL
3FKAA HGHAB HFAGA•Vý Type of
Work' CRS AGS EMS DCM EMS CRS EMS DCM Total
Engine 16 1 32 4 53Avionics 11 34 1 14 1 71Airframe 20 23 1 11 1 56Supervisory 12 4 69 3 5 93Armament 66 8 2 63 7 146Flight Line 78 1 A 14 97Other 6 4 22 14 46
Total 562
"CRS = Component Repair Squadron.AGS = Aircraft Gener-dion Squadron.EMS = Equipment Maintenance Squadron.
* @DCM = Deputy Commander for Maintenance.
Finally there are locational problems. Generators arc currently assigned at the rate of
one to every two aircraft and are located so that cables can be run promptly to either of thetwo aircraft they serve. Even if an Increase in aircraft reliability were to make the use of
fewer generators possible in an overall sense, it might not be possible to reduce the number
of generators without causing a delay in their availability.
METHOD OF DETERMINING SAVINGS IN SUPPORT EQUIPMENT
To investigate the effect of changes in aircraft reliability and in sortie rate on the
amount of equipment required during a deployment, we took sevcral steps:
First, we made a preliminary estimate of the potential savings in deployment weight
due to improved reliability by separating the deployed equipment into four groups: (a)
equipment related to the number of personnel deployed; (b) equipment related to the number
of aircraft deployed and their sortie rate; (c) equipment directly related to the reliability of
the aircraft; and (d) all remaining items that did not fit any of the other groups The results
O are shown in Fig, C.2. About 35 percent of the deployed weight is associated with aircraft
reliability. Obv'-isly, not all oflthis can be saved, even if reliability is impnrved
substantially. For example, although the number of electrical generators is somewhat relatedto reliability, ground power is also used for other activities. To determine how equipment
usage would actually vary with aircraft reliability, it was necessary to examine the support
cquipment in further detail.
0,
- i _____

-70-
500
and intermediatemaintenance
400 7 days @ 2.8 sorties •, Small armsper dny per aircraft Furniture
+days 830 @ sorties \Spare parts, enginesper day per aircraft Test stands
Light carts300 -Air conditioning
Generators7 days @ 1.1 sorties Work standsper aircraft per Gas carts
2 tTractorsPersonnel Bomb jammers
[Irelated Ammunition trailers100 Reliability Gun loaders
relatedFi xed
U Unidentifiedo
Fig. C.2-F-16 deployment support
USING TSAR TO MODEL THE POTENTIAL SAVINGS
To do this, we used the TSAR model. Although TSAR models the peacetime, steady
state operation of an airbase, we believe that following a rapid deployment, peacetime
conditions would be approached once the munitions and munition support were brought in
and the base was organized.
Given data on the breakdown rates and repair times for various components, together
with the equipment required to repair them, TSAR steps through a seven-day period in three
minute intervals, keeping track of the time each piece of equipment is in use and the
numbers of each type of equipment in use at any one time. The flow of each aircraft, part,
piece of support equipment, and maintenarcc technician is followed through the repair and
maintenance cycle. At each branch point in the cycle (where there is a choice of events,
such as a spare part is or is not needed, test equipment is or is not available), a random
I4Sr'

-71-
choice, weighted with the appropriate probabilities, is made. Thus, if a component has a 20
percent probability of breaking during the mission, and has a quantity of one per aircraft, it
will be assumed to need repair on 20 percent of the TSAR sorties. (A detailed description of
TSAR and the assumptions used in making these runs can be found in Refs. 3 through 5.)
Each TSAR run was made for a combination of reliability and sortie rate. Because of
different choices at the branch points, every run produces a different result for the total
numbers of each type of support equipment and personnel needed. Each run also defines a
cumuladve distribution of the fraction of time various pieces of equipment are in use. From
these distributions, we determined the numbers of each type of equipment that would allow
operations to continue without an equipment shortage for 95 percent of the time. The results
of five such distributions were averaged to obtain the maximum numbers of each piece of
support equipment needed for the specified sortie rate and reliability.
Sortie rates were varied from approximately one to four sorties per aircraft per day.Reliability was varied by assuming that the time between failures of all aircraft components 4
was increased by a factor of two or four.
Limitations on computer time prevented considering all of the support equipmentshown in Table C.3. Instead, we constructed an abbreviated list of items that were mostlikely to be affected by changes in reliability and sortie rate and that made a large
contribution to the weight of the equipment that has to be deployed. The items selected,
together with the numbers of each Item deployed and ,heir total weight, are given in Table IC.5. The items shown are those TSAR estimated were necessary for peacetime operation.
Consequently, the list differs slightly from the list in the UTC shown in Table C.3. We
believed that this was acceptable because we were using TSAR to calculate the increment in
weight due to changes in sortie rate and reliability.The items most likely to be affected by reliability (this includes all items in Table C.5
except ammo trailers) total only 72.3 tons, which is only about 17 percent of the total weight
deployed (420.7 tons as shown on Table C.I)..
It was not possible to obtain a breakdown by weight of the spare parts making up the
WRSK. Because of this, we could not estimate the effect of improvements in reliability andof changes in sortie rate on the weight of the WRSK that needed to be deployed. Although
this is a shortcoming, WRSK amounts to only 3 percent of the total deployed weight (see
Table C.3). Thus, the omission of changes in WRSK should not cause an error large enough
to affect our final conclusions. I
p(
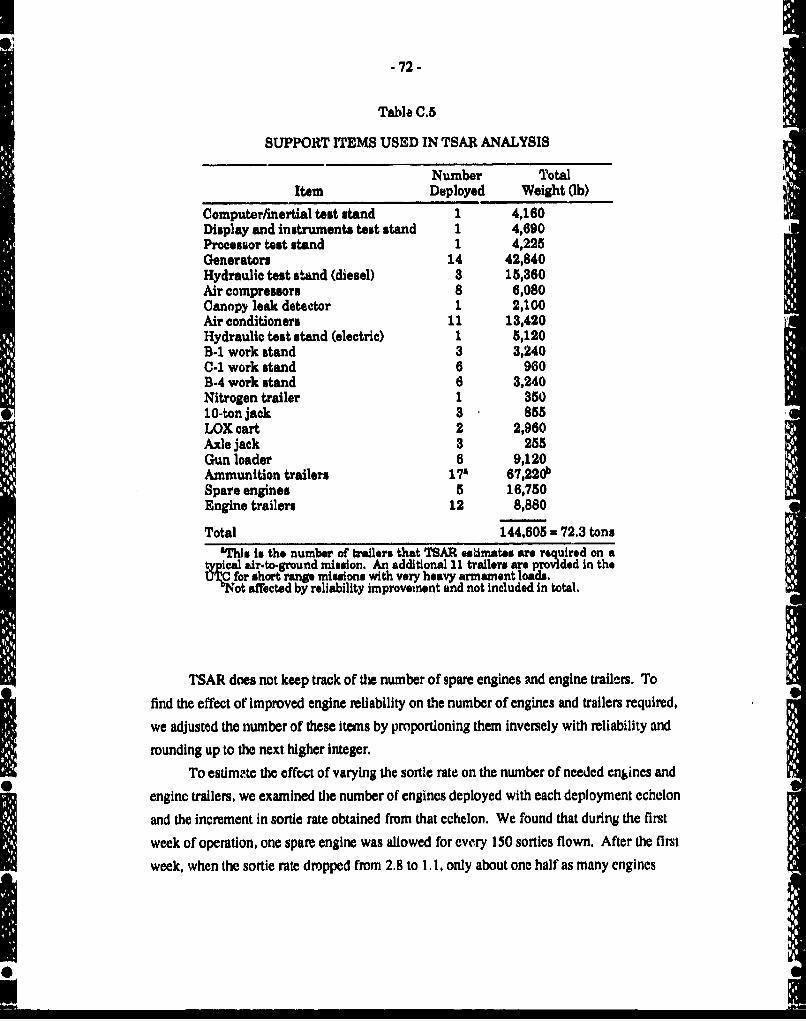
I-72 -
Table C.5
SUPPORT rIEMS USED IN TSAR ANALYSIS
Number TotalItem Deployed Weight (ib)
Computer/inertial test stand 1 4,160Display and instruments test stand 1 4,690Processor test stand 1 4,225Generators 14 42,840Hydraulic test stand (diesel) 3 15,360Air compressors 8 6,080Canopy leak detector 1 2,100Air conditioners 11 13,420Hydraulic test stand (electric) 1 5,120B-1 work stand 3 3,240C-1 work stand 6 960B-4 work stand 6 3,240Nitrogen trailer 1 35010-ton jack 3 855LOX cart 2 2,960Axle jack 3 255Gun loader 6 9,120Ammunition trailers 17' 67,220bSpare engines 5 16,750Engine trailers 12 8,880
Total 144,605 = 72.3 tons
'This it the number of trailers that TSAR esdmates are required on atypical air-to-ground mission. An additional 11 trailers are provided in theUT for short range missions with very heavy armament loads.
'Not affected by reliability improvement and not included in total.
TSAR does not keep track of the number of spare engines and engine trailers. To
find the effect of Improved engine reliability on the number of engines and trailers required,
we adjusted the number of these items by proportioning them inversely with reliability and
rounding up to the next higher integer.
To estimate the effect of varying the sortie rate on the number of needed enines and
enginc trailers, we examined the number of engines deployed with each deployment echelon
and the increment in sortie rate obtained from that echelon. We found that during the first
week of operation, one spare engine was allowed for every 150 sorties flown. After the first
week, when the sortie rate dropped from 2.8 to 1.1, only about one half as many engines

-73-
were allocated per sortie. Presumably this is because the longer time available allows some
of the engines removed earlier to be repaired and returned to service. We assumed that the
number of engines required was determined by the peak sortie rate in the first week of
operations, and that one engine was required for each 150 sorties flown.
Since we averaged only five distributions for each combination of reliability and
sortie rate, the resulting plots of equipm ent weight deployed against sortie rate show some
scatter. We have made least squares fits of them. points to obtain the final results shown in
Fig. C.4 but also lave shown the actual data points on this plot to suggest the amount of
uncertainty due to the limited number of runs that could be made.
A similar approach, also using TSAR, was taken to evaluate the effect of reliability
and expected sortie rate on the number of maintenance personnel that must be deployed with
an independent 24-PAA squadron. The results are summarized in Fig. C.4,
The effect of sortie rate and reliability on the weight of equipment and the number of
personnel deployed with a squadron of 24 F-16s is shown in Figs. C.5 and C.6 in terms of
the net savings achievable through improved reliability. In general the savings are a small
fraction of the total deployment effort. Most of these savings occurred when reliability (the
mean time between repair) was doubled; further increases in reliability resulted in smaller
savings.
CONCLUSION
Higher sortie rates require only small percentage increases In equipment (weight), but
larger percentage increases in personnel. With present reliability, raising the sortie rate from
1.5 to 4 requires a 13 percent Increase In the weight of support equipment (see Fig. C.3) but
a 67 percent increase in the number of support personnel (see Fig. C.4). Doubling the
reliability drops these increments to 5 and 55 percent respectively (Figs. C.3 and C.4,
respectively).From these revults we conclude that improvements in reliability will have only small
effects on deployment requirements.
* S
SII

- 74 -
1000 Independent Present
SReliability
500
0 I I ,I
0 1.0 2.0 ý,O 4.0Sorties per aircraft per day
Fig. C.3-Effect of sortie rate and reliability on totalweight of support equipment
S
I

- 75 -
800
Reliability
700Present
600 2X.
500- X
I-400300
200
100
00 1.0 2.0 3.0 4.0
Sorties per aircraft per day
Fig. C.4-Maintenance personnel
I

- 76-
100
80
I3
40 2
F11 C-5- 8avinp In deployd equ Pm~znt weight Per squadron
200
44
100affty4
P i g , C O -S v i n s i n d e p o y e d p e r o n n e p e s q u d r o

-77-
REFERENCES
1. System Specocation for Air Combat Fighter System 2185 (F-16A & F-16B),Specification Number 16PSOO1, Code Ident 81755, 16 December 1974.
2. System Specocation for the C-1 7 Airlift System, Specification MDC SO01, CodeIdent 88277, 1 April 0983.
3. Donald E. Emerson and Louis H. Wegner, TSAR User's Manual-A Program forAssessing the Effects of Conventional and Chemical Attacks on Sortie Generation:Vol. I-Program Features, Logic, and Interactions, The RAND Corporation,N-2241-AF, August 1985.
4. --.. , TSAR User's Manual-A Programfor Assessing the Effects of Conventional andChemical Attacks on Sortie Generation: Vol. il, Data Input, Program Operationsand Redlmensioning, and Sample Pioblem, The RAND Corporation, N-2242-AF,August 1985.
5. =..-, 7SAR User's Manual-A Program for Assessing the Effects L Convendonal andChemical Attacks on Sortie Generation: Vol. III, Variable and Array DefInitions andOther Program Aids, The RAND Corporation, N-2243.AF, August 1985.
6. Reliability and Maintainability Action Plan, R&M 2000, Department of the AirForce, Washington, D.C., I February 1985.
7. Wing Mobility Materiel List, Magnetic tape file obtained from the 388th TacticalFighter Wing, Hill AFB, Utah, November 1983.
8. T. J. O'Malley, The Aircraf Availability.Model: Conceptual Framework andMathematics, Logistics Management Institute, Bethesda, MD, June 1983.
9. Craig C. Sherbrooke, Estimation of the Variance-to-Mean Ratio for AFLCRecoverable Items, Sherbrooke and Associates, Potomac, MD, January 1984,
10. Personal communication from Lt. Col. Ronald E. Sortor, USAF, Air Force WartimeManpower and Personnel Readiness Team, September 1985.
11. Letter to Col. William A. Smiley, USAF, AF/LEXY, Subj: Senslilvity of F-16Reparable Spares Inventory to Reliability of Fire Control and Propulsion System,from Lauretta Burke, Logistics Management Institute, Bethesda, MD, 10 October1984.
12. Randall M. King and Virginia A. Mattem, The Effects of Data-Base Dynamics inEstimating Spares Costs: An Analysis of the F.46, Working Note AF501-2, LogisticsManagement Institute, Bethesda, MD, December 1985.


![TLE ANALYSER · TLE ANALYSER User Manual v2.8 TLE analysis ... TLE ANALYSER Version 2.8 - 2013 TLE ANALYSER - User Manual [4] 2. TLE Analyser Setup and Options TLE Updater allow to](https://img.pdfslide.us/doc/110x75/5aa68a5c7f8b9a517d8ea13c/tle-analyser-analyser-user-manual-v28-tle-analysis-tle-analyser-version-28.jpg)