Embed Size (px)
Citation preview
U N I V E R S I T Y O F W A S H I N G T O N S C H O O L O F N U R S I N G
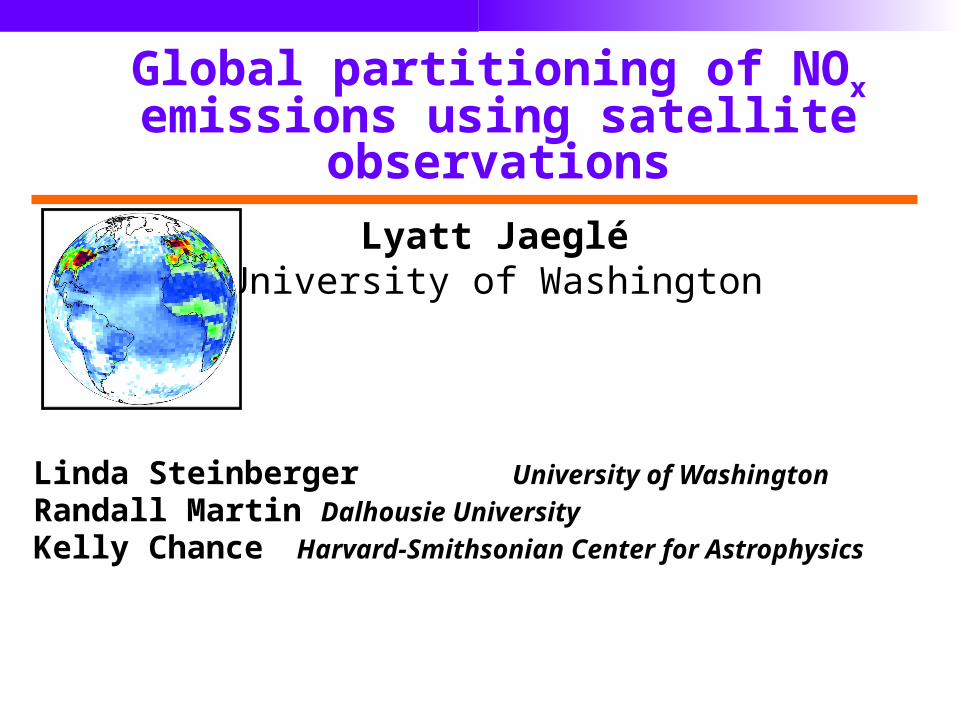
Global partitioning of NOx emissions using satellite observations
Lyatt JaegléUniversity of Washington
Linda Steinberger University of WashingtonRandall Martin Dalhousie UniversityKelly Chance Harvard-Smithsonian Center for Astrophysics
U N I V E R S I T Y O F W A S H I N G T O N S C H O O L O F N U R S I N G
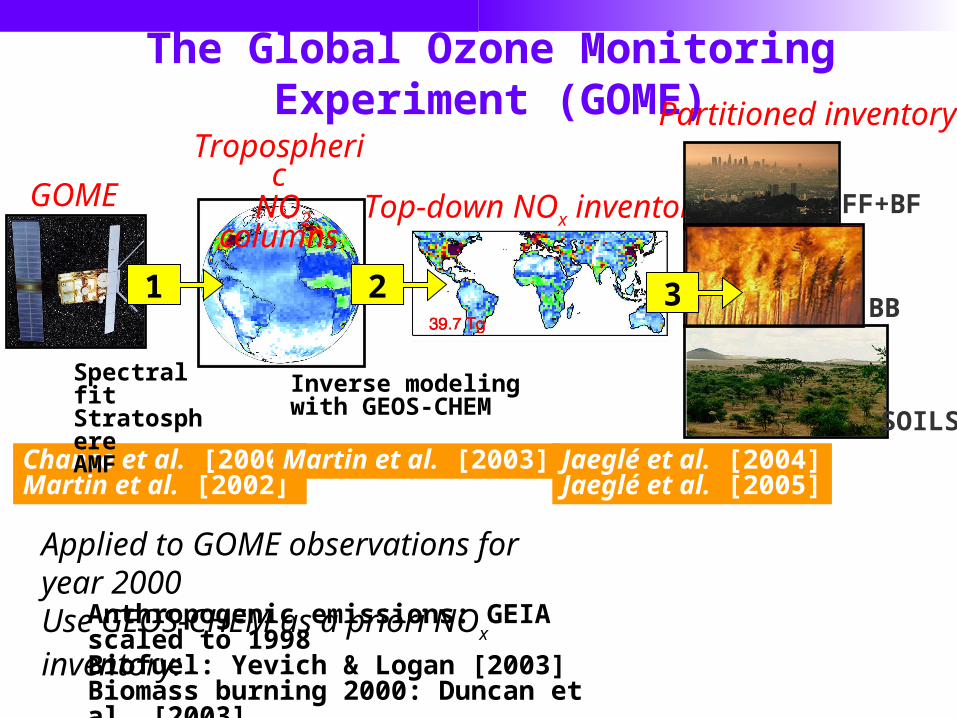
Tropospheric NO2 columns
Top-down NOx inventory
Chance et al. [2000]Martin et al. [2002]
Martin et al. [2003]
GOME
The Global Ozone Monitoring Experiment (GOME)
Applied to GOME observations for year 2000Use GEOS-CHEM as a priori NOx inventory:
1 2
Jaeglé et al. [2004]Jaeglé et al. [2005]
Partitioned inventory
FF+BF
BB
SOILS
3
Spectral fitStratosphereAMF
Inverse modeling with GEOS-CHEM
Anthropogenic emissions: GEIA scaled to 1998Biofuel: Yevich & Logan [2003]Biomass burning 2000: Duncan et al. [2003]Soils: Yienger & Levy [1995]
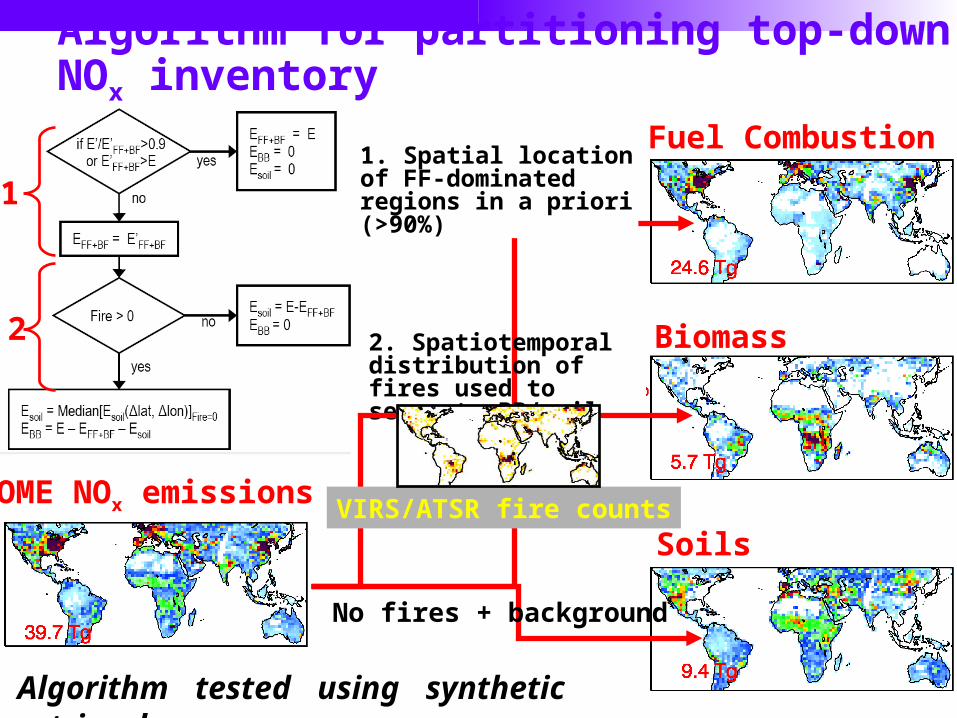
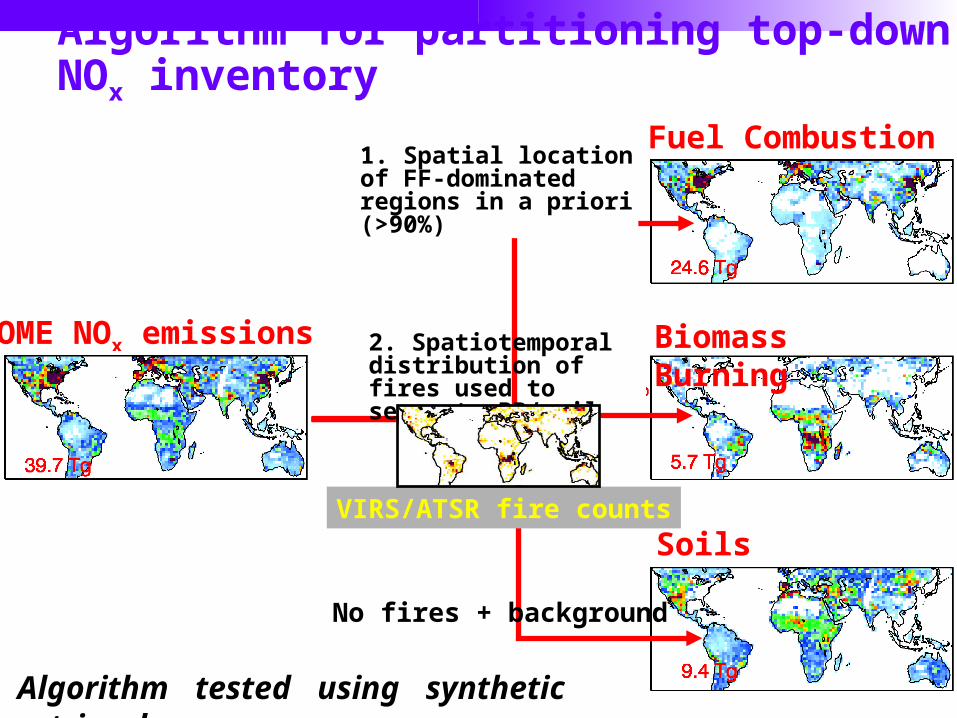
Algorithm for partitioning top-down NOx inventory
Algorithm tested using synthetic retrieval
GOME NOx emissions
Fuel Combustion1. Spatial location of FF-dominated regions in a priori (>90%)1
Biomass Burning2. Spatiotemporal distribution of fires used to separate BB/soil
VIRS/ATSR fire countsSoils
No fires + background
2
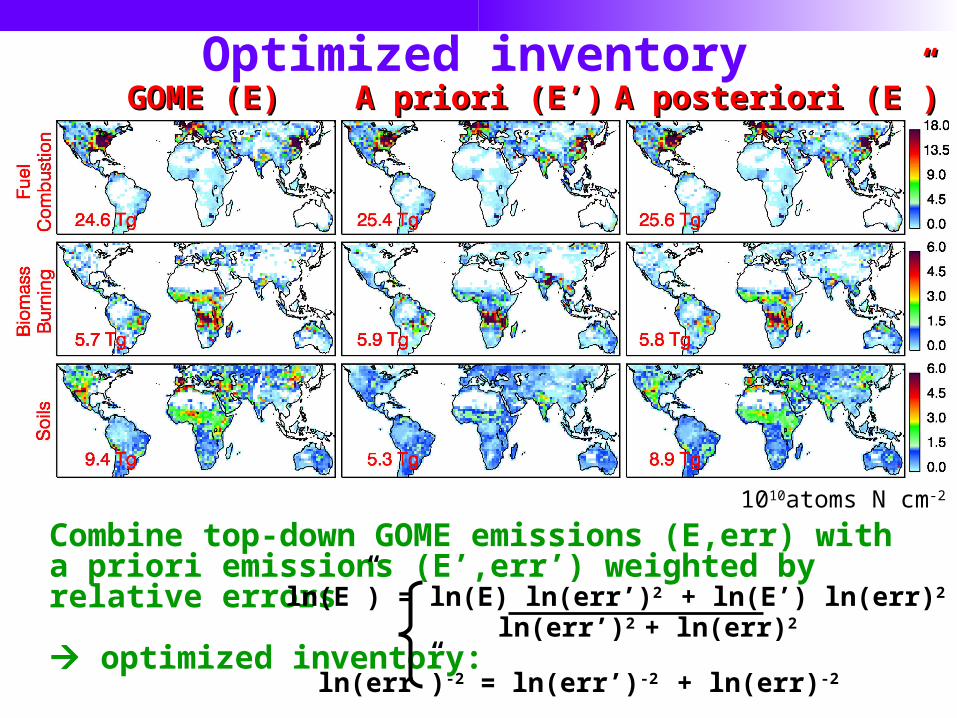
Combine top-down GOME emissions (E,err) with a priori emissions (E’,err’) weighted by relative errors
optimized inventory:
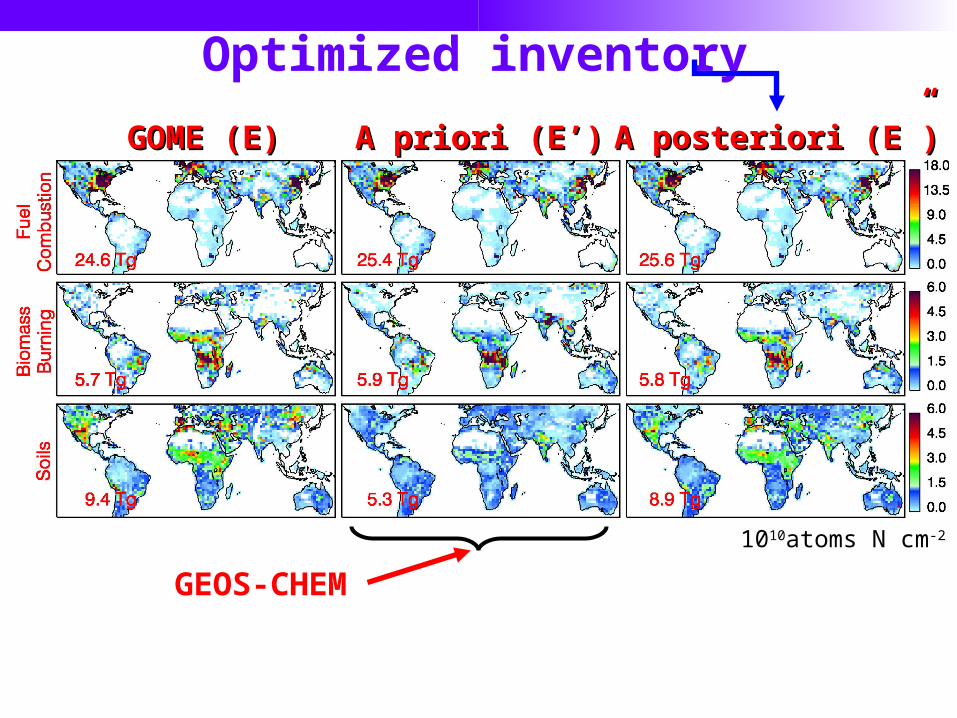
Optimized inventoryGOME (E)GOME (E) A priori (E’)A priori (E’) A posteriori (E”)A posteriori (E”)
ln(E”) = ln(E) ln(err’)2 + ln(E’) ln(err)2
ln(err’)2 + ln(err)2
ln(err”)-2 = ln(err’)-2 + ln(err)-2
1010atoms N cm-2 s-1
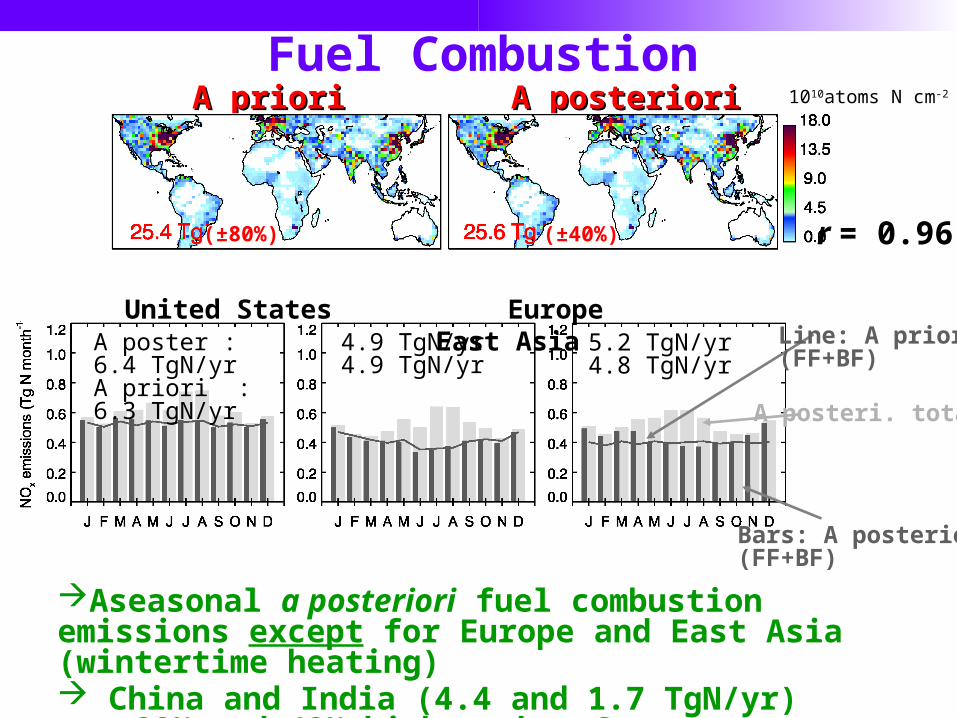
Fuel CombustionA prioriA priori A posterioriA posteriori
(±80%) r = 0.96(±40%)
Aseasonal a posteriori fuel combustion emissions except for Europe and East Asia (wintertime heating) China and India (4.4 and 1.7 TgN/yr) are 38% and 43% higher than Streets et al. [2003] inventory
United States Europe East Asia
1010atoms N cm-2 s-1
Bars: A posteriori(FF+BF)
Line: A priori(FF+BF)
A poster : 6.4 TgN/yrA priori : 6.3 TgN/yr
4.9 TgN/yr4.9 TgN/yr
5.2 TgN/yr4.8 TgN/yr
A posteri. total
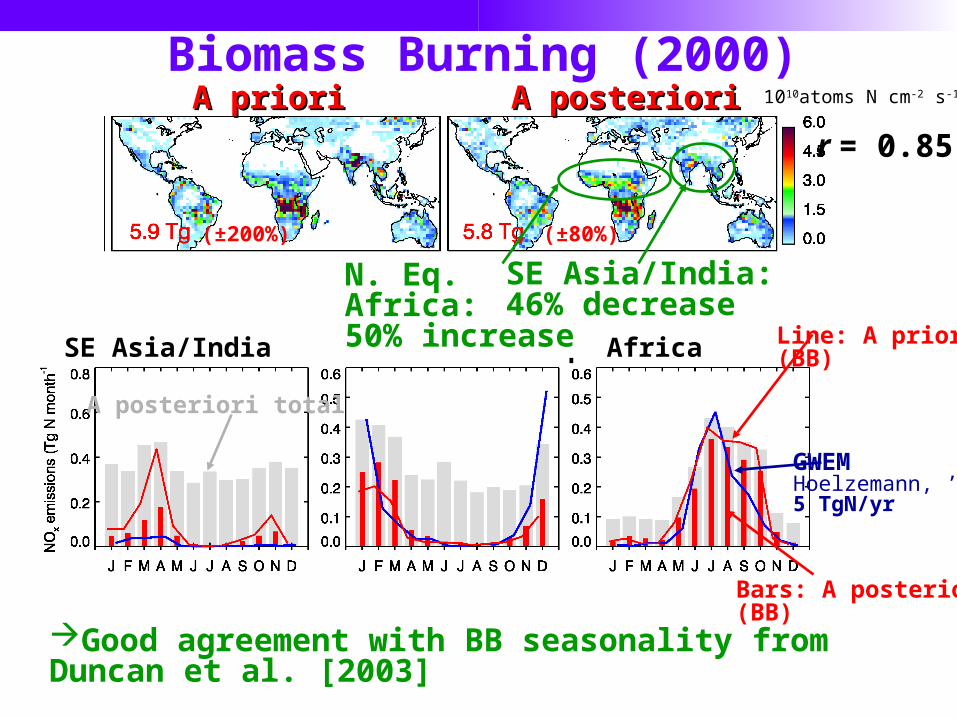
Biomass Burning (2000)A prioriA priori A posterioriA posteriori
Good agreement with BB seasonality from Duncan et al. [2003]
(±200%)
r = 0.85
(±80%)
SE Asia/India N. Eq. Africa S. Eq. Africa
N. Eq. Africa:50% increase
SE Asia/India:46% decrease
GWEMHoelzemann, ’055 TgN/yr
Line: A priori(BB)
Bars: A posteriori(BB)
1010atoms N cm-2 s-1
A posteriori total
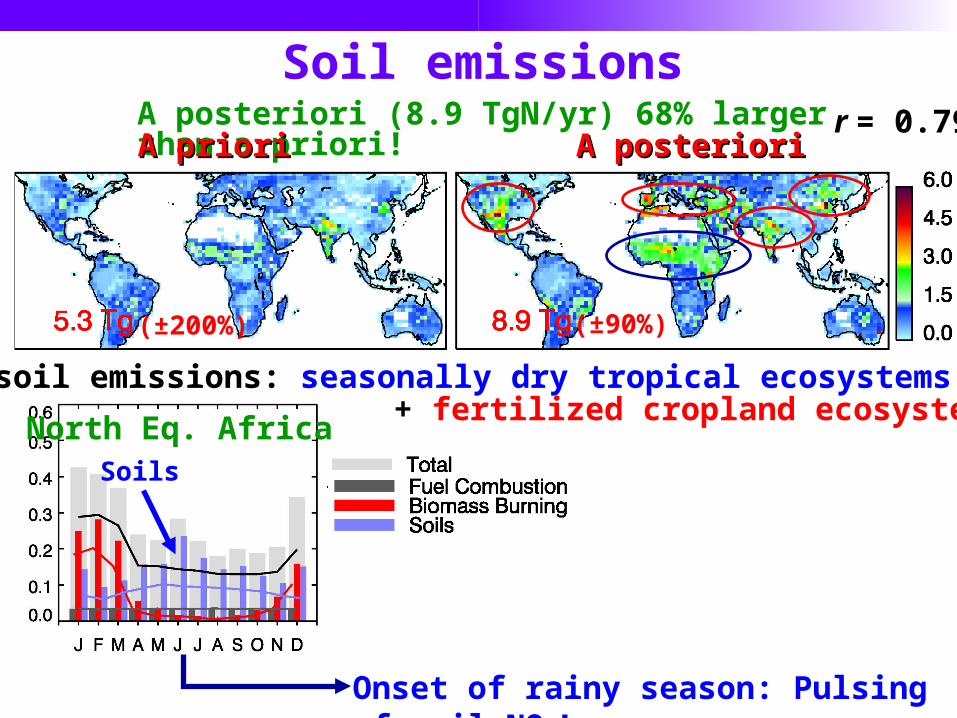
Soil emissionsA posteriori (8.9 TgN/yr) 68% larger than a priori!
A prioriA priori A posterioriA posteriori
Largest soil emissions: seasonally dry tropical ecosystems
(±200%) (±90%)
+ fertilized cropland ecosystems
r = 0.79
Soils
Onset of rainy season: Pulsing of soil NOx!
North Eq. Africa
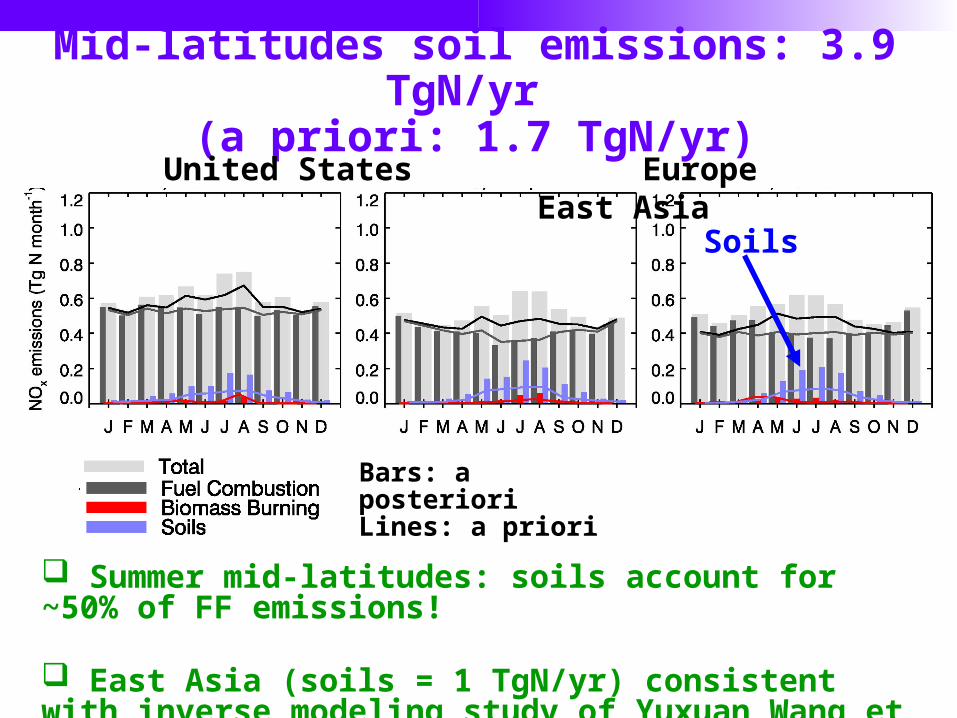
Mid-latitudes soil emissions: 3.9 TgN/yr (a priori: 1.7 TgN/yr)
Summer mid-latitudes: soils account for ~50% of FF emissions!
East Asia (soils = 1 TgN/yr) consistent with inverse modeling study of Yuxuan Wang et al. [2004]
United States Europe East Asia
Bars: a posterioriLines: a priori
Soils
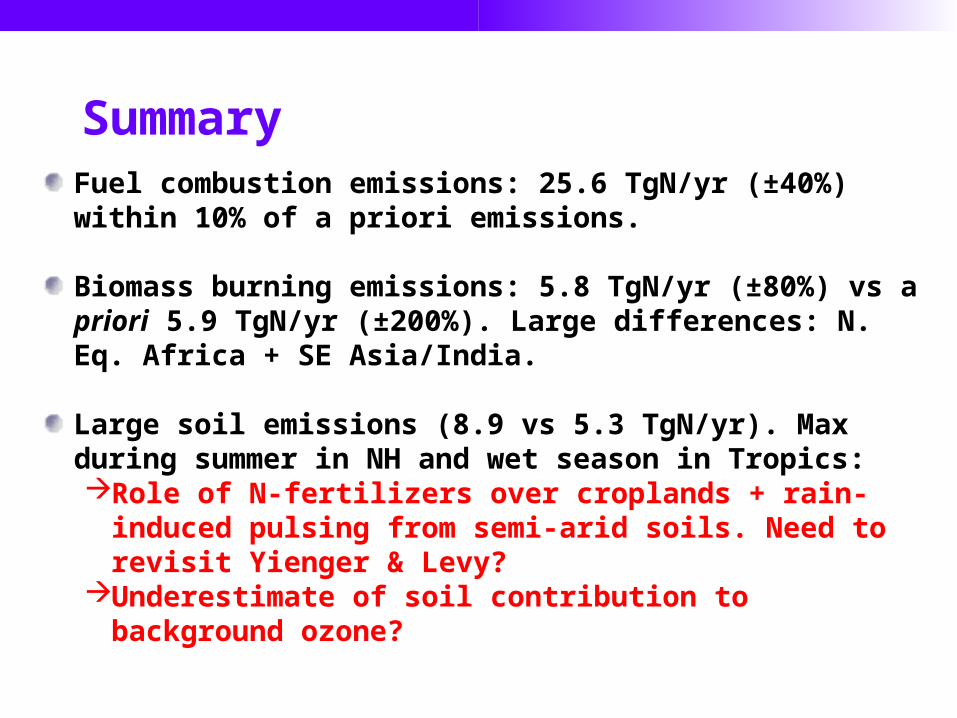
SummaryFuel combustion emissions: 25.6 TgN/yr (±40%) within 10% of a priori emissions.
Biomass burning emissions: 5.8 TgN/yr (±80%) vs a priori 5.9 TgN/yr (±200%). Large differences: N. Eq. Africa + SE Asia/India.
Large soil emissions (8.9 vs 5.3 TgN/yr). Max during summer in NH and wet season in Tropics:Role of N-fertilizers over croplands + rain-induced pulsing from
semi-arid soils. Need to revisit Yienger & Levy? Underestimate of soil contribution to background ozone?
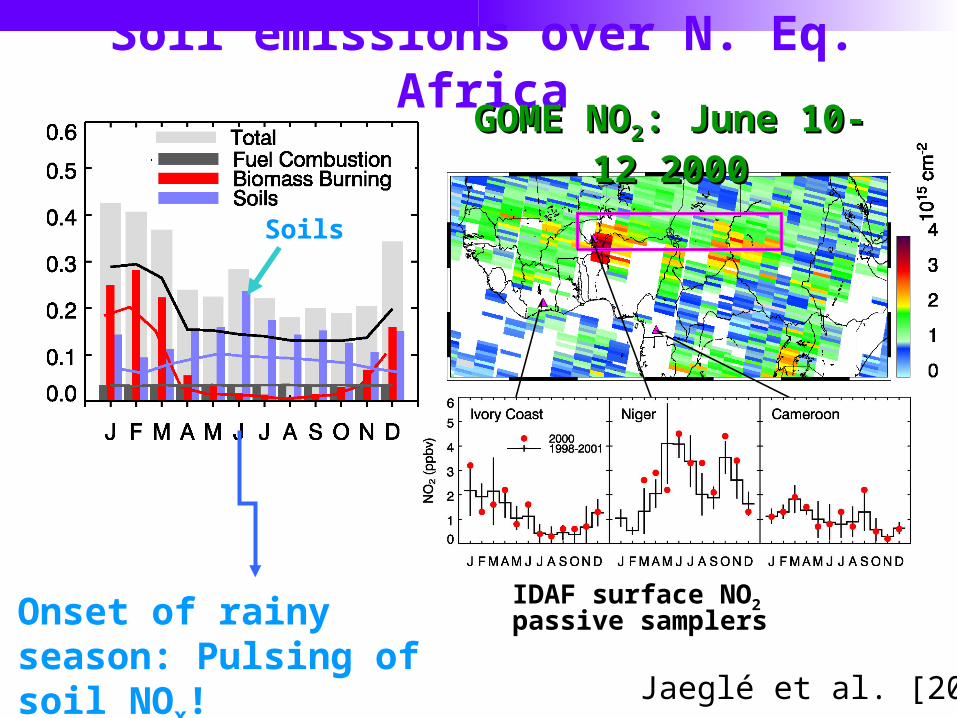
Soil emissions over N. Eq. Africa
Onset of rainy season: Pulsing of soil NOx!
GOME NOGOME NO22: June 10-12 2000: June 10-12 2000
IDAF surface NO2 passive samplers
Jaeglé et al. [2004]
Soils
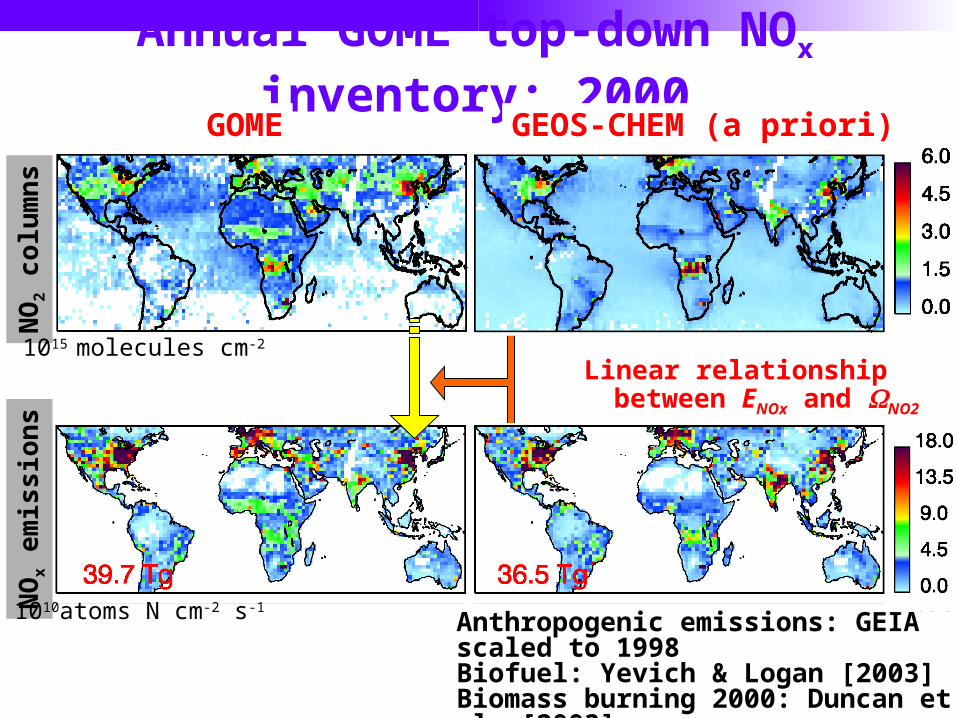
Annual GOME top-down NOx inventory: 2000N
Ox e
mis
sion
s
1010atoms N cm-2 s-1
NO
2 col
umns
GOME GEOS-CHEM (a priori)
1015 molecules cm-2
Anthropogenic emissions: GEIA scaled to 1998Biofuel: Yevich & Logan [2003]Biomass burning 2000: Duncan et al. [2003]Soils: Yienger & Levy [1995]
Linear relationship between ENOx and NO2
Algorithm for partitioning top-down NOx inventory
Algorithm tested using synthetic retrieval
GOME NOx emissions
Fuel Combustion1. Spatial location of FF-dominated regions in a priori (>90%)
Biomass Burning2. Spatiotemporal distribution of fires used to separate BB/soil
VIRS/ATSR fire countsSoils
No fires + background
Optimized inventory
GOME (E)GOME (E) A priori (E’)A priori (E’) A posteriori (E”)A posteriori (E”)
1010atoms N cm-2 s-1
GEOS-CHEM


![O S A N J O S[ S O L D A L U N A]](https://img.pdfslide.us/doc/110x75/5590a4011a28abbc1f8b4638/o-s-a-n-j-o-s-s-o-l-d-a-l-u-n-a.jpg)