Embed Size (px)
Citation preview

U N E C E 2 0 0 5 1
Software Tools for Statistical Software Tools for Statistical Disclosure Control by Disclosure Control by
Complementary Cell SuppressionComplementary Cell Suppression – – Reality CheckReality Check
Ramesh A. DandekarRamesh A. DandekarU. S. Department of EnergyU. S. Department of Energy
Washington DCWashington DC
U N E C E 2 0 0 5 2
Equality Constraints Associated With Equality Constraints Associated With Suppression PatternSuppression Pattern
A x = b
Used To Create Solution Space Around Unknown or Suppressed Table Values

U N E C E 2 0 0 5 3
SchematicSchematic N-D Solution Space N-D Solution Space Surrounding True Table ValuesSurrounding True Table Values
Solution Space Defined by Lower and Upper Bounds on Suppressed Table Cells
Typically Multiple Solutions Satisfying Ax=b Exist
Safe distance away from edges

U N E C E 2 0 0 5 4
http://www-unix.mcs.anl.gov/otc/Guide/faq
Two families of solution techniques are in wide use today. Both visit a progressively improving series of trial solutions, until a solution is reached that satisfies the conditions for an
optimum. Who needs it?Who needs it?

U N E C E 2 0 0 5 5
Simplex methods, introduced by Dantzig about 50 years ago, visit "basic" solutions computed by fixing enough of the variables at their bounds to reduce the constraints Ax = b to a square system, which can be solved for unique values of the remaining variables. Basic solutions represent extreme boundary points of the feasible region defined by Ax = b, x >= 0, and the simplex method can be viewed as moving from one such point to
another along the edges of the boundary.

U N E C E 2 0 0 5 6
Simplex Solutions Tend to Cluster Simplex Solutions Tend to Cluster around Edges of the Solution Spacearound Edges of the Solution Space
Neutral or Null Objective Function

U N E C E 2 0 0 5 7
Barrier or interior-point methods, by contrast, visit points within the interior of the feasible
region.
Creates Real Big Problem for SDL Task Creates Real Big Problem for SDL Task
U N E C E 2 0 0 5 8
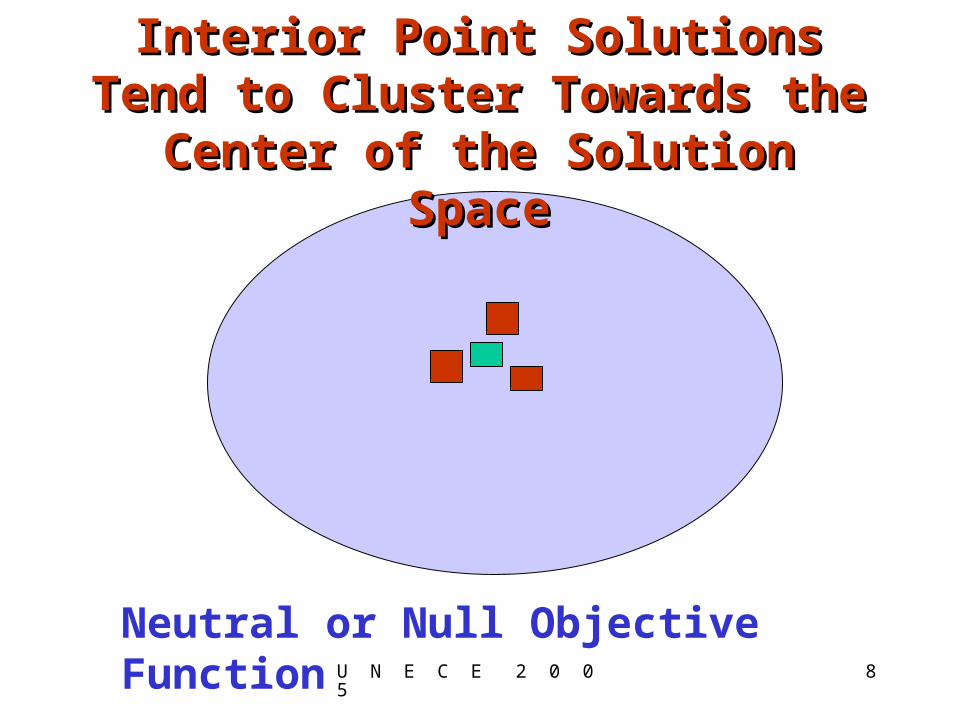
Interior Point Solutions Tend to Interior Point Solutions Tend to Cluster Towards the Center of the Cluster Towards the Center of the
Solution SpaceSolution Space
Neutral or Null Objective Function

U N E C E 2 0 0 5 9
Supporting Example FromSupporting Example FromProf. Jordi CastroProf. Jordi Castro min 0min 0
st. x1 + x2 + x3 = 3 st. x1 + x2 + x3 = 3 x1, x2, x3 > = 0 x1, x2, x3 > = 0
Interior point methods will provide the solution Interior point methods will provide the solution x1 = x2 = x3 = 1 x1 = x2 = x3 = 1
Simplex methods will provide Simplex methods will provide
some xi = 3, the remaining two xj = 0.some xi = 3, the remaining two xj = 0.

U N E C E 2 0 0 5 10Table available from http://mysite.verizon.net/vze7w8vk/Table available from http://mysite.verizon.net/vze7w8vk/

U N E C E 2 0 0 5 11

U N E C E 2 0 0 5 12
Statistical EstimatesStatistical Estimates
• Additive Point EstimatesAdditive Point Estimates
• AveragesAverages
• Frequency DistributionsFrequency Distributions
• Additive Using AveragesAdditive Using Averages
• Additive Using Frequency DistributionsAdditive Using Frequency Distributions
Using CTA PrinciplesUsing CTA Principles

U N E C E 2 0 0 5 13

U N E C E 2 0 0 5 14

U N E C E 2 0 0 5 15
U N E C E 2 0 0 5 16
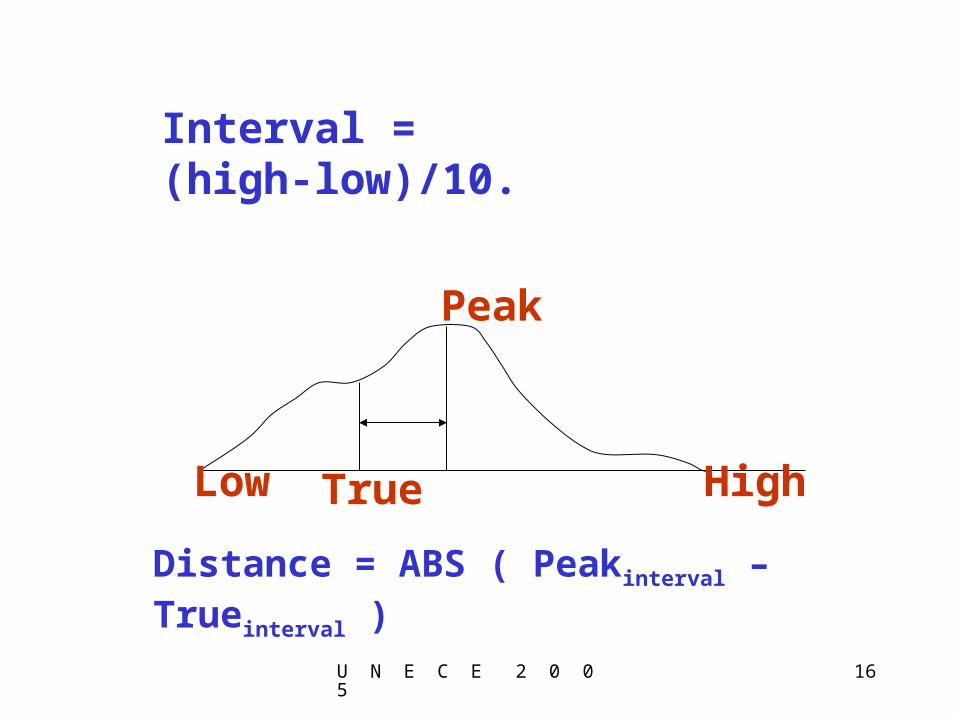
Peak
TrueLow High
Interval = (high-low)/10.
Distance = ABS ( Peakinterval – Trueinterval )

U N E C E 2 0 0 5 17
Cell: 1 True Value: 714. Range: 409. Dif 0 Within: 697 - 738
12. 2. 2. 6. 2. 97. 7. 1. 4. 5.
493 - 533 - 574 - 615 - 656 - 697 - 738 - 779 - 820 - 861 - 902
LP audit based range = 409
Peak Density Range
TRUE VALUE AND FREQUENCY DISTRIBUTION TRUE VALUE AND FREQUENCY DISTRIBUTION OF FIRST SUPPRESSED CELLOF FIRST SUPPRESSED CELL

U N E C E 2 0 0 5 18

U N E C E 2 0 0 5 19
Conclusions and SuggestionsConclusions and Suggestions
• Avoid Tighter BoundsAvoid Tighter Bounds• Over Protection Over Protection (not same as over (not same as over
suppression) suppression) is is not unnot undesired Propertydesired Property• Use Larger Cells as ComplementsUse Larger Cells as Complements• Use of Cost Function 1/( call value) or Log(cell Use of Cost Function 1/( call value) or Log(cell
value)/value is preferredvalue)/value is preferred• Synthetic Tabular Data a.k.a. Controlled Synthetic Tabular Data a.k.a. Controlled
Tabular Adjustments might be worth Looking Tabular Adjustments might be worth Looking in toin to

U N E C E 2 0 0 5 20
THANK YOU!
ADDITIONAL INFORMATION FROMADDITIONAL INFORMATION FROM
http://mysite.verizon.net/vze7w8vk/
![e :I .,.r '"""" , "..,~ ~"'-~. -,-.-'.. c ~. ,, " ~--' .c !., -.~ ..-,0 ~ ] J!J § ~ ~ ] ] t '-0 ~ ~ ~ ~ ~ > u -, .:::: '0 >, U Q Q U '" .. § ~ ';;j .;;j ~ '0](https://img.pdfslide.us/doc/110x75/5e625580fdc2e133b957db08/e-i-r-c-.jpg)

![hikarinokodomonoie.com · No. 108 öñDøc O) U U 0) z 0) (D 0 0) U 1) O) & U 1/\] & & J 0) lfiJ O) No. 108 < 4' < & O & c < O lìíj 0) < 0) & (D (D z 0 0) ìùî & & E ¿b O & 0](https://img.pdfslide.us/doc/110x75/5f4aea331ed97844592ecd2e/no-108-dc-o-u-u-0-z-0-d-0-0-u-1-o-u-1-j-0-lfij.jpg)