Embed Size (px)
Citation preview

~ U Marshall Stability Test
.....---"lisphalt Paving Mix Desig·n ·
. Ill_
C. T. METCALF, Research Laboratory, Shell Oil Co. , Wood River, Ill.
A continuing problem in the design of bituminous pavements is the spec;:ification of the properties of the mix so that it will have su,fficient stability to resist displacement under traffic. This problem has been made more acute by the demands of heavier wheel loads which are anticipated for modern highways and airfields. Thus, to aid mix formulation there is a pressing need for specifications in terms of the results of laboratory tests.
An analysis of the Marshall stability test shows that the bearing capacity of a paving mix can be related to Marshall stability and flow by the following equation:
Bearing Capacity (psi) = 1/5 sta:i~~y x ( 2 + K) F
in which K 1 + sin4>
1 - sin cj>
F = (1-0. 055 K)
Derivation of this equation is based on two important assumptions:
1. Allowable design stress corresponds to the stress calculated at 1 percent strain in the Marshall test.
2. Confining pressure in the pavement is equal to 50 percent of unconfined compressive strength (confinement is proportional to lateral strain; this is 50 percent of vertical strain for materials that do not change volume) .
A convenient approximation of the above equation is given by: B · c •t ( ') _ stability ( 120-Flow) earmg apac1 y psi - Flow 100
The design curves representing the above relationships emphasize that the load-carrying ability of an asphaltic mix is a function of the flow value as well as the stability and reveal the inadequacy of the usual specifications which call for only a minimum stability and maximum flow value . A single bearing capacity for any mix can be calculated from the combination of stability and flow. Marshall stability alone, however, isnotanabsolutemeasure of strength.
It is believed that the results of this analysis will be very useful in highway and airfield design.
e THERE ARE several tests commonly employed at the present time to measure the resistance to deformation of asphalt-aggregate mixtures (1) . These tests include:
1. Marshall stability 2. Hveem Stabilometer 3. Hubbard-Field 4. Unconfined Compression 5. Triaxial
All of these are used to measure plastic stability or the ability of a mix to resist being squeezed out from under a load. All except the triaxial and possibly the uncon-
12

13
fined compression tests are empirical and are not considered to measure any fundamental material property. They are extensively used, however, in design and control work.
Popularity of these tests can be divided somewhat according to geographical locati0n, but the most widely used at present is the Marshall Stability test ( 2) , originally developed by the U.S. Army, Corps of Engineers ( 3). Because of its wide usage it is the basis of many specifications and is a familiar and accepted measure of stability. Quite often design problems must be solved by this test alone. Thus, it is essential to obtain a better understanding of its significance.
During the study of a number of small-scale pavement test sections, however, it became especially evident that neither Marshall Stability nor flow value alone satisfactorily predicted resistance to plastic displacement. It appeared that sections having equal stabilities did not have the same supporting power when their flow values differed. Similarly, sections having equal flow values often performed quite differently as a result of differences in stability. Examples are shown in the following table.
Section No .
3A-7B 2B-11B 2A-2B 2B-15A 2B-2B
3A-4B 2A-17B 2A-2B 2A-5B
MIXES OF EQUAL STABILITY
Stability Flow Value (lb) (0.01 in.)
1460 6 1425 12 1400 13 1465 16 1425 16
MIXES OF EQUAL FLOW VALUE
4005 13 2010 13 1400 13 1170 13
Performance (Resistance
to Plastic Displacement)
Satisfactory II
Plastic II
II
Satisfactory "
Plastic II
Because of these problems and of the need to make a satisfactory appraisal of the properties of the field test sections, it was decided to make a closer investigation of the Marshall test which could serve as a basis for interpretation. To make better use of the test it appeared necessary to answer two fundamental questions: (a) What material properties are being measured in the Marshall test? ( b) What is the relation of these properties to the bearing capacity of a paving mix?
INTERPRETATION OF MARSHALL STABILITY RESULTS
A review of the literature shows that only a limited amount of work has been done to define the properties measured in the Marshall test. A previous investigation by Fink and Lettier ( 4) has shown the influence of asphalt viscosity on stability values and Endersby andVallerga ( 5) have demonstrated the effects of different compaction methods on test results. Van Iterson ( 6) interpreted the loading of a cylindrical shape such as used in the Marshall test as being similar to an unconfined compression test. Goetz and McLaughlin ( 7, B) have made some of the few studies that attempted to examine the results of Marshall testing in the light of triaxial and unconfined compression tests. A conclusion from their work is that the Marshall test is a type of confined test in which the confinement is attributed to the curved shape of the testing heads. Their work is significant because identical materials were tested in both the Marshall test and the unconfined compression test. The method of specimen preparation was not a variable in the comparison.
Use of the test for design purposes has indicated that a type of shear failure occurs

. I
14
in the test (Figure 1) that is similar to failures in direct compression tests. Analysis of the forces involved in the Marshall test shows that the measured verti
cal force is the sum of the stresses acting on the curved surface of the testing head at the interface with the specimen. These stresses consist of normal ( 8n_) and tangential ( Ss) components as shown in Figure 2. For any small elemental area dA on the testing head, the vertical stress Sy is given by:
Sy cos a. dA = 8n cos a. dA + Ss sin a. dA ( 1)
substituting
dA =rt da.
where
r = radius of curved surface t = width of area (normal to plane surface of specimen)
produces
rt SV cos a. da. =rt Sn cos a. da. +rt Ss sin a. da. ( 2)
Then, since a. ranges from 0 to + 70 in the Marshall apparatus, the sum of all the vertical forces acting on the head-becomes
2 rtSycosa. da.=2( rt8n_cosa. da.+2 rtSssina.da. ~a. = 70° a. = 70° ~a. = 70°
a.=0 Ja. =0 a.=0 ( 3)
Deformation of the specimen normal to the testing head is approximately equal to y0 cos a. where y0 is the vertical deformation of the specimen at the center. If stress is taken to be proportional to deformation, then the normal stress at any point on the testing head is Sn = S0 cos a. , in which S0 is the vertical stress at the center of the test head. Substituting this in Eq. 3, the total vertical reaction force R in the Marshall test is given by the value of the integral.
2f rt Sy cos a. d a. = R = 2 rt S0 cos2 a. d a. + 2 rt Ss sina.da. ( 4) a. = 700 \a. = 700 la. = 700
la.=0 a.=0 0.:0
If the tangential or shearing stresses are developed by friction alone,
Ss =f Sn =f S0 cosa.
The expression for vertical reaction then becomes
la.= 70°
R = 2 rt ( S0 cos2 a. + S0 sin a. cos a.) da. · a. = 0
Evaluation of the integral produces
R = (1.54 + 0.88 f) rt S0
( 5)
( 6)
For values of the coefficient of friction in the range of 0. 4 to 0. 6, Eq. 6 is approximately equal to: R = 2 rt S0
For the Marshall test, r = 2 in., t = 2. 5 in., so using English units,
( 7)
Coefficients of static friction of 0. 4 to 0. 5 have been measured in the laboratory and thus Eq. 7 seems a fair representation of stress conditions in the Marshall test.
If, then, the Marshall test is a type of unconfined compression test, Marshall stability should be approximately ten times the unconfined compressive stress. The investigations of McLaughlin and Goetz ( 8), however, have demonstrated that Marshall stabilities are much greater than this amount. Thus, the Marshall test resembles a compression test performed on a specimen of low height to diameter ratio in which the

15
Figure 1. Shear planes developed in Marshall Test specimen.
88 ,. 80 cos()(.
Sa • ~=~t~~c''!'~~~~n
failure planes intersect the testing head. Such an arrangement is represented by the drawing in Figure 3. This shows the middle portion of a specimen with a height-diameter ratio of approximately two to one being confined by the excess material around it. Such material would have the effect of exerting a lateral confining pressure on the center section.
The strength of a confined specimen according to the Mohr theory is given by:
Figure 2. Stress relations in Marshall Stabilit;y test.
in which
80 = 2c'\f"K+ LK
K = ( 1 + sin <j>) ( 1 - sin <j>)
<j> = angle of internal friction c =cohesion L = confining pressure
( 8)
Thus, strength is composed of elements involving the unconfined compressive strength ( 2c ,,fKJ plus a confining effect ( LK) that depends upon the angle of internal friction of the material. Confining pressure "L" in the above equation must be considered to be an "effective" pressure rather than a uniformly applied pressure as employed in a rational triaxial test. McLeod ( 8) has asserted that the effective lateral support which becomes active in the Marshall test is not constant but depends upon:
1. Coefficient of friction between specimen and test head. 2. Maximum vertical load applied. 3. Angle of internal friction of the mix. 4. Shearing resistance of the material.
He has made use of these premises in a theory of pavement design ( 10) in which the importance of friction in the development of pavement stability is pointed out.
A review of the work by McLaughlin and Goetz reveals that the effective confining pressures as calculated on the basis of their Marshall Stability values are directly related to the applied vertical load in the test. Confinement behaves as if deveJoped by the friction between the testing head and specimen. A reasonable approximation of this confinement can be obtained by taking 5. 5 percent of the Marshall Stability/ 10. Thus, a stability of 1, 000 lb tends to produc e a confining pressure of 5. 5 psi and 2, 000 lb corresponds to 11 psi. While these figures are approximate, and frictional forces are probably not constant, this method provides a reasonable approach to the establishment of a relationship between Marshall Stability and unconfined compressive stress.

16
(Stability) . Substituting L = 0. 055 10 m Eq. 8 and remembering that
s0
= Sta~~lity , the equation becomes:
Stability 10
_ =2c..JK + 0.055
Stability 10
2cV'K 1-0.055K
(Stability) 10 K ( 9)
By providing a reasonable measure of K which is a function of the angle of internal friction; it is possible to calculate the unconfined compressive stress from Marshall Stability results. The Purdue investigations ( 8) also showed that reasonably good correlation existed between the "flow" value in the Marshall test and actual measured values of the angle of internal friction. Although flow cannot be considered a direct measure of friction, the properties that affect friction appear to affect flow in a sin;iilar manner and thus the flow value offers a convenient, if inexact, means of estimating the friction angle. A rough estimate of internal friction can be obtained from:
Angle of internal friction (degrees) = 60 - Flow ( 10)
L L
Figure 3. Confinement provided by specimen of low height- diameter ratio.
Evaluation of K on this basis permits the unconfined compressive stress to be estimated from Marshall results. A convenient expression for estimating K directly from the flow value is given by:
K _ 3 5 ( 30 - Flow) 2
-.+( 10)
Similarly, the quantity ( 1-0.055 K) in Eq. 9 can be estimated from:
(1-o.055K) =o.1[8-% ~ao ioF1ow(]
'ii ~ m ~
~
·i ~ 8 " .s '2 ~ = .,,
i ~
100
50
Unconfined Compressive Stress = M?.ribaff,Slabilttt (1-0. 055 K)
Correlation Ratio =- 0. 96
50
Estimated Unconfined Compressive Stress (psi)
Figure 4. Correlation of measured unconfined compressive stress with unconfined compressive stress estimated from
Marshall Stability test.
100

Uniform L oading = $0
Asphaltic Surface
Confining Pre.ssure • L
S0 "' 2c ff + LK
when L = 1/2 2c '{K
S0 = Bearing Capacity = 2c VK (1 + K/2)
Figure 5. Bearing capacity of loaded pavement.
Thus, the approximate unconfined compressive strength corresponding to a given Marshall Stability is:
2 ~ 'K = Stability c "n. 100
4000
~ 3000
!i
i ~ ~ 2000
1000
17
10 20 .. n..i V.aluoi tO 01 ltd
Figure 6. Bearing capacity curves based on Marshall Stabil ity test.
[8 ( 30 - Flow) 2 J - % ( 10 )
When estimated values of the unconfined compressive stress are compared with the values measured by McLaughlin and Goetz, the correlation shown in Figure 4 is produced. The correlation ratio of 0. 96 between the two quantities indicates that the approximations made in this development are reasonable and that the Marshall Stability test can be described as a test involving differential confinement.
It is not intended to imply that the Marshall test is a form of triaxial test or should be substituted for triaxial testing. It does appear that, by proper interpretation, the Marshall results can be used to estimate useful information of a fundamental type.
APPLICATION OF MARSHALL STABILITY RESULTS TO PAVEMENT DESIGN
Eq. 8 indicates that the load-carrying ability of the critical element at the edge of a uniformly loaded area (Figure 5) in a pavement consists of the unconfined compression strength ( 2c V'Kf plus an allowance for the confinement provided by the surrounding material ( LK) . Analysis by McLeod ( 10, 11) has previously disclosed that frictional forces between load and pavement tend to increase the strength of the material at interior positions under the load.
In the previous section it was demonstrated that a reasonable estimate of unconfined compressive strength can be obtained from the Marshall Stability test. This strength, however, corresponds to a stress at which large deformations take place. Such great stresses are not generally acceptable for design purposes because they are accompanied by permanent deformations much larger than could be tolerated in any practical case. In order to limit plastic deformation it is necessary to select a portion of the unconfined strength that can be considered to be allowable for design purposes. Because surface deformation is the factor governing performance, allowable design stress should be based on the stress at equal deformations. Nijboer ( 12) has found that strains up to about one percent are essentially elastic and he has proposed this as a basis for calculation of allowable stress. One percent strain in the Marshall test occurs at a flow value of four and stresses calculated on this basis were accepted for design purposes.
Confinement provided by the material surrounding the loaded area must also be

18
5000
<OOO
~ 3000
i i ~ 2000
1000 -
Bmlth(200) /
I
I I
I I
/ 200
I I
I I
I I
I ,
10 20
Flow Value (0. 01 In,)
Figure 7. Comparison of bearing capacity curves with curves calculated from Smith
Triaxial Design Method.
estimated. McLeod ( 10) has suggested that the effective confining pressure can
4000
~ 3000
f ~ ~ 2000
1000
20
FlowVa.lue (O- Ol!n, )
Numbarere(erto Bearillg Capacity (pal}
••
Figure 8. Comparison of bearing capacity curves with curves calculated from McLeod Method. (Confinement equals unconfined
compressive strength).
be taken equal to the unconfined compressive strength. Field experience has indicated, however, that this is too generous. Lateral pressures must be activated by lateral strain. For materials that do not change volume, lateral strain is equal to one-half the vertical strain and therefore it might be expected that 50 percent of the unconfined design stress represents the lateral confining pressure more reasonably. Such an allowance is similar to that made in the development of curves for preventing overstress at a point based on the theory of elasticity for Poisson's ratio = 0. 5. These principles were employed by Smith ( 13) in the preparation of design curves for the closed-system triaxial test. -
Combining the estimates of allowable design stress and lateral confinement it is possible to substitute in Eq. 8 to provide an expression for the bearing capacity of a mix in terms of Marshall Stability results.
S0
=2c'\[K+LK (8)
Since unconfined compressive strength = 2c K and confining pressure = L = % (Unconfined compressive strength) then So = 2c ...JK+ K/2)
allowable stress = S0
x 4/Flow = ( 4/Flow) 2c {K( 1 + K/2) substituting the estimate • /Vi • rv. Stability ( ) . of 2c v n from Eq. 9 2c 'VK = 10 1 - 0. 055 K this produces:
Bearing capacity (psi) = % (Stability/Flow) ( 1-0. 0055 K) ( K + 2) ( 11)
Eq. 11 is the basis for the series of design curves in Figure 6, which show the Marshall Stability requirements corresponding to different intensities of uniform loading. Unit load figures on the curves are roughly equivalent to tire pressures of vehicles using the pavement. The 100 psi curve is considered to represent the maximum present intensity of highway loading.
Eq. 11 can be simplified to the form:
Stability ( 120 - Flow) Bearing capacity= Flow · ioo ( 12)

19
-4000 - '"' ..
3000 sooo
~ .. . I
~ ~ ... ·t· " i : I 3 .. ~ 2000 ] 2000
! j 19llpsl
lOOO - lOOO
.. JO 20 •• Fiow Value fD. OJ In.>
Figure 9. Stabilities of pavements with satisfactory resistance to plastic de
formation.
Figure 10. Stabilities of pavements showing excessive plastic deformation.
This is not an exact representation of Eq. 11 but it is sufficiently accurate for purposes of estimation.
Both equations emphasize that Marshall Stability alone is not an adequate measure of a pavement's ability to resist displacement. Stability and flow must be considered jointly.
Interesting comparisons of the above equation with the principles developed by Smith ( 13) and McLeod ( 10) are shown in Figures 7 and 8. These curves were calculated from the relationship between Marshall Stability and unconfined compressive strength. The Smith triaxial curves in Figure 7 are somewhat more conservative than those of Eq. 12, but both show similar trends. Differences between them, other than theoretical differences, might be caused by an imperfect relation between flow value · and angle of internal friction. In the McLeod method, the allowance for confining pressures equal to unconfined compressive strength causes a substantial reduction in stability requirements. Stabilities calculated by each method illustrate these differences.
McLeod Method Marshall Bearing Capacity Smith Triaxial Method
Marshall Stability (lb) for 100 psi Bearing Capacity Flow Value
10
500 910
1175
15
810 1430 1785
20
1195 2000 2490
AGREEMENT OF THEORY WITH PERFORMANCE
A series of small-scale asphaltic concrete field test sections provided an excellent opportunity to investigate the validity of the bearing capacity equations developed above. These sections were constructed as part of a refinery entrance road at Wood River / Illinois, and were exposed to a large amount of truck traffic at temperatures that frequently reached 140 deg Fin hot summer weather. During three and one-half years' service, performance of the sections was carefully observed for evidence of plastic displacement and core samples were taken periodically for measurements of the properties of the bituminous carpet.
Stabilities of pavements showing satisfactory performance during the test period are shown in Figure 9. These surfaces were judged to show no characteristics of plastic distress such as rutting, shoving, or flushing. Some were brittle or susceptible to raveling but had satisfactory resistance to plastic displacement at high temperatures
20
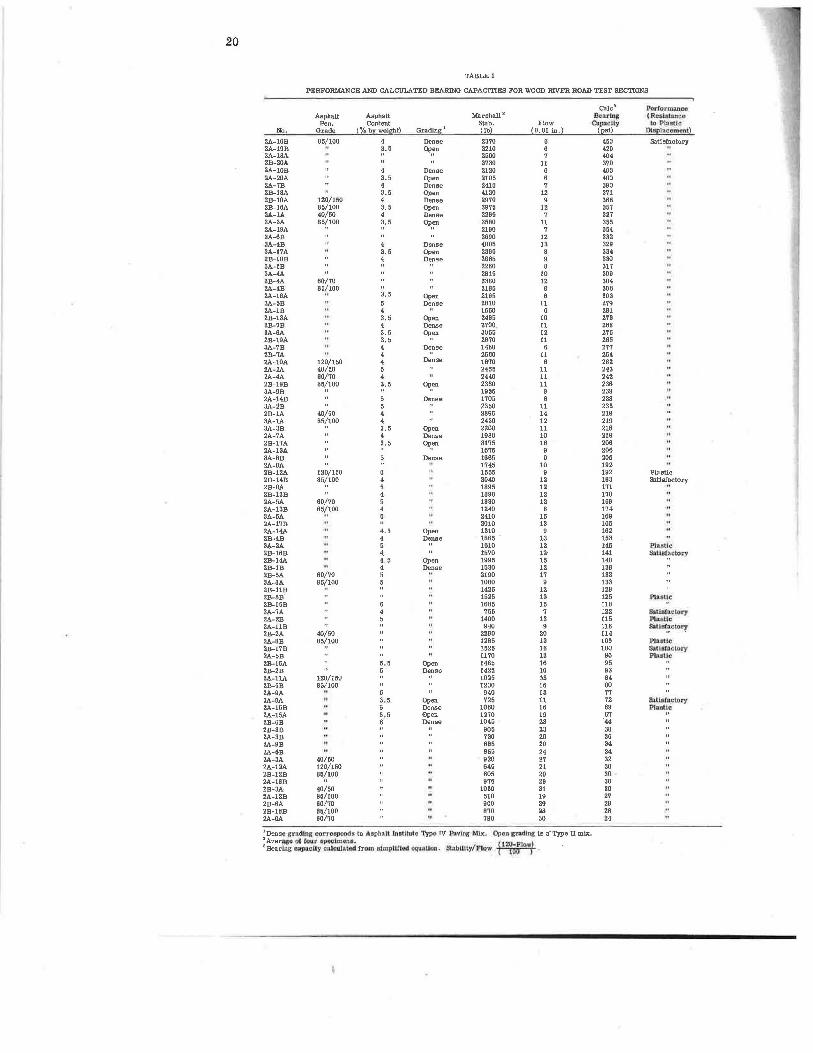
TABLE 1
PERFORMANCE AND CALCULATED BEARING CAPACITIES FOR WOOD IUVER ROAD TEST SECTIONS
Calc 3 E'crformilneO Asphalt Asphalt Marshall 2 Ilc>rln~ (Rc•l•1anco
Pen. Content stab. Flow ~lCUy 10 Pli.m.la No. G.rade ~lob[ wej~bt} Gra~ 1 pb) io.01 m.) (fsi) l'.M!!Elii.ccirn<"t1.l)
2A-16B 65/100 4 Dense 2370 6 450 Sati~~tory 2A-19B 3.5 Op,~n 2210 6 420 2A-16A 2500 7 404 2B-20A 3730 11 370 2A-10B 4 Denae 2120 6 403 2A-20A 3.5 Open 2105 6 400 2A-7B 4 Dense 2410 7 390 2B-16A 3.5 Open 4130 12 371 2B-10A 120/150 4 Dense 2970 9 366 2B-16A 85/100 3. 5 Open 3975 12 357 2A-1A 40/50 4 Dense 2265 7 327 3A-3A 85/100 3.5 Open 3560 11 355 2A-19A 2190 7 354 3A-6B 3690 12 332 3A-4B 4 Dense 4005 13 329 3A-17A 3.5 Open 2365 8 334 2B-10B 4 Dense 2666 9 330 3A-1B 2260 8 317 3A-4A 2815 10 309 2B-4A 60/70 3380 12 304 2A-4B 65/100 2165 8 306 2A-16A 3.5 Open 2165 6 303 3A-5B 5 Dense 2610 11 279 2A-1B 4 1550 6 261 2B-13A 3. 5 Open 2465 10 273 2B-7B 4 Dense 2700 11 268 3A-6A 3. 5 ~~n 3055 12 275 2B-19A 3.5 2670 11 265 3A-7B 4 Dense 1460 6 277 2B-7A 4 2560 11 254· 2A-10A 120/150 4 Dense 1670 6 262 2A-2A 40/50 5 2455 11 243 2A-4A 60/70 4 2440 11 242 2B-19B 65/100 3.5 ~~n 2380 11 236 3A-9B 1935 9 236 2A-14B 5 Dense 1705 6 236 3A-2B 5 2350 11 233 2B-1A 40/50 4 2695 14 219 3A-1A 85/100 4 2430 12 219 3A-3B 3.5 Open 2200 11 216 2A-7A 4 Dense 1960 10 218 2B-17A 3.5 DI?:m 3175 16 206 2A-13A 1675 9 206 3A-6B Dense 1665 9 206 2A-6A 1745 10 192 2B-12A 120/150 1555 9 192 Plastic 2B-14B 65/100 2040 12 163 Satl~~ctory 2B-8A 1695 12 171 2B-13B 1690 12 170 2A-5A 60/70 1680 12 169 2A-13B 85/100 1240 8 174 3A-5A 2410 15 169 2A-17B 2010 13 165 2A-14A 4.5 Open 1310 9 162 2B-4B 4 Dense 1665 . 13 153 3A-2A 5 1610 12 145 PtHUc 2B-16B 4 t57.0 12 141 Sltl";~i:!too 2B-14A 4.5 Open 1995 15 140 2B-1B 4 Dense 1630 12 138 2B-5A 60/70 5 2190 17 133 3A-6A 85/100 5 1060 9 133 2B-11B 1425 12 126 2B-6B. 1525 13 125 Ptuui:. 2B-15B 1665 16 116 3A-7A 756 7 122 S1tlol•olo17 2A-2B 1400 13 115 Pl;uiiUc 2A-11B 940 9 116 S11l8fi~lOrJ 2B-2A 40/50 2290 20 114 2A-8B 65/100 1265 13 106 .Piil.st.lo 2B-17B 1525 16 100 s.trsraclory 2A-5B 1UO 13 96 Pla.KIC 2B-15A 5. 5 Open 1465 16 95 2B-2B 5 Denae 1425 16 93 2A-11A 120/150 1025 13 64 2B-5B 85/100 1230 16 60 2A-9A 6 940 13 77 3A-9A 3. 5 Open 726 11 72 SQU.1!A.ctorr 2A-15B 6 Dense 1060 16 69 rI:u1Uc 2A-15A 5. 5 Open 12.70 19 67 2B-6B 6 Dense 1045 23 44 2B-3B 905 23 36 2A-3B 730 20 36 2A-9B 665 20 34 2A-6B 655 24 34 2A-3A 40/60 920 27 32 2A-12A 120/150 645 21 30 2B-12B 65/100 605 20 30 2A-16B 975 29 30 2B~3A 40/50 1030 31 30 2A-12B 65/100 510 19 27 2B-6A 60/70 900 29 26 2B-16B 66/100 670 26 26 2A-6A 60/70 790 30 24
1 Densa grD:dlng corre'llp()nd!J to Aspb"lt .tnl(ltuta "t)1>o IV Paving Atix. Opcin gr.uJlng is a: Type II mix. 3
Aver"'e Q( rour qeo.imen~. i l2,DP"tow; ' 3Bee.rhi"g e2P.'ll.Ci~)' 1:.r1lc:uli.ltcd frcm 81mpll11od CQ\IULlon. SU.blltty/Flow Q · .

21
( 140 deg F) . The curve representing a uniform load of 100 psi is considered equal to the most severe loading imposed by truck tires. This seems a fair estimation of highway loading even though it has been shown ( 14, 15) that the rigidity of tire sidewalls causes non-uniform contact pressures. - -
stabilities of all sections representing satisfactory performance except one are above the 100 psi curve indicating that theoretical bearing capacities as listed in Table 1 are greater than the loads imposed by traffic. A majority of the points representing sections with plastic distress in Figure 10 are in the area below the curve where bearing capacities are less than 100 psi. A few sections appear above the curve but the deviation is relatively small for most of them.
Bearing capacities calculated from the Marshall stability test generally appear to be in good agreement with performance of the sections. The theory provides a reasonable method for predicting performance in the range of highway loading for pavements that are frequently exposed to temperatures near 140 deg F.
In addition to the small-scale test sections discussed above, cores have been taken from regular highway pavements which have been in service for several years. Performance of these pavements together with bearing capacities calculated from Marshall stability tests are listed in Table 2. Although some variation exists in the type of construction and density of traffic, the agreement of theory and performance is reasonably good. All surfaces with bearing capacities above 100 psi are performing satisfactorily after ten years' service. Of the three surfaces with bearing capacities less than 100 psi, two show some evidence of plastic displacement. The behavior of these highways does not provide a rigorous test of the method for calculating bearing capacities but is in agreement with the predictions of the method.
Whether the curves can be successfully applied to the design of pavements that must support loads heavier than present highway loading has not been investigated directly. Equipment developing contact pressures of 200 psi, such as is produced by the wheels of military aircraft, has not been available. A limited examination of test results from the Corps of F.ngineers experiment station at Vicksburg shows a fair agreement between Marshall bearing capacities and performance under high pressure aircraft tires. Theoretical bearing capacity requirements are, however, more conservative than present engineer specifications for airfield pavements. The Corps of Engineers requires a minimum stability of 1, 800 lb and maximum flow of 16 for pavements presumed to support contact pressures greater than 200 psi. Bearing capacity for this stability and flow is 117 psi. At the same flow value, a stability of 3, 070 lb would be required for 200 psi and 3, 850 lb for 250 psi loading. At a flow value of 10, however, the 1, 800-lb stability corresponds to a 198 psi capacity and 2, 270 lb is equal to 250 psi. Comparison of these figures demonstrates the importance of the flow value in bearing capac-
TABLE 2
PERFORMANCE AND CALCULATED BEARING CAPACITIES FOR HIGHWAY PAVEMENTS IN SERVICE
Performance Marshall Flow (Resistance
No . Type of Traffic Age stab. (0.01 Cale Brg to Plastic
Construction Density (yr) (lb) in . ) Capacity Displacement)
Resurfacing of PC Very 10 3020 13 257 Satisfactory concrete bridge deck heavy
Resurfacing of Moderate 10 1820 12 168 PC concrete
Resurfacing of Light 10 1690 16 1io PC concrete
4 Resurfacing of Light 10 1530 15 107 flexible pavement
19 Resurfacing of Heavy 1165 14 88 Plastic PC concrete
Resurfacing of Heavy 10 1700 20 85 Satisfactory PC concrete
9 Resurfacing of Heavy 10 1365 17 83 Plastic

22
ity calculations. It is hoped that the results of future tests will provide a basis for confirming the theoretical calculations in designs for high pressure tires.
It should be realized that bearing capacity curves for the Marshall Stability test are based on in-place properties of the material in the pavement. The ability of the Marshall test to make a satisfactory prediction of field performance will depend largely on whether or not specimens can be prepared in the laboratory that will reproduce the properties of material in the field. Thus, satisfactory design· depends not only on the method of test but also on the preparation of material for testing.
CONCLUSION
It is be'lieved that the method described for the derivation of bearing capacities from the results of the Marshall stability test will lead to a better understanding of the test and to a more rational use of it in the design of highways and airfields. By providing a method for interpreting the empirical Marshall data in terms of fundamental properties, it is possible to design for different load conditions. The comparison of theory with field performance indicates that the necessary approximations in the theory are conservative and reasonable.
The Marshall test is not believed to be a rational test nor should it be used as a substitute for triaxial testing. Many situations occur, however, when it is necessary to design on the basis of the Marshall test alone. In these cases, reasonable estimates of fundamental properties which can be obtained from Marshall testing can aid in good design.
REFERENCES
1. "Mix Design Methods for Hot-Mix Asphalt Paving." The Asphalt Institute, (April 1956).
2. "Bituminous Paving Mixtures." HRB Bull. 160 (Jan. 1957). 3. "Symposium on Asphalt Paving Mixtures." HRB Res. Rpt. 7B ( 1949). 4. Fink, D.F., andLettier, J.A., Proc. AAPT20:246 (1951). 5. Endersby, V.A., andVallerga, B.A., Proc. AAPT21:298 (1952). 6. Van Iterson, Th. F. K., "Plasticity in Engineering." Blackie and Son Ltd.,
Toronto ( 1947) . 7. Goetz, W. H., Proc. AAPT 20:200 ( 1951). 8. McLaughlin, J.L., and Goetz, W.H., Proc. AAPT21:203 (1952). 9. "Triaxial Testing of Soils and Bituminous Mixtures." ASTM Spec. Tech. Pub.
No. 106 (June 1950) . 10. McLeod, N. W., "Application of Triaxial Testing to the Design of Bituminous
Pavements." ASTM Spec. Tech. Pub. No. 106 (June 1950). 11. McLeod, N. W., Proc. AAPT 21:349 ( 1952). 12. Nijboer, L. W., HRB Proc. 33:185 ( 1954). 13. Smith, V.R., Proc. AAPT 18:63 (1949). 14. McLeod, N. W., HRB Proc. 31:121 ( 1952). 15. Teller, L. W., and Buchanan, J.A., Public Roads 18 (Dec. 1937).
HRB:OR-279