Embed Size (px)
Citation preview
Carderock DivisionNaval Surface Warfare CenterBethesda, MD 20084--5000 -AD-A25 072
u CDNSWC-SME-92/32 August 1992
Ship Materials Engineering Departmento Research and Development Report
00
0 The Effect of a Seawater Environment on the0 Galvanic Corrosion Behavior of Graphite/Epoxy
Composites Coupled to Metalsi
by0 Denise M. Aylor
John N. Murray0E DTIC
0
(D ECT
woW00
S92-26795
z0 Approved for public release; distribution is unlimited.

Carderock DivisionNaval Surface Warfare Center
Bethesda, MD 20084-5000
CDNSWC-SME-92/32 August 1992
Ship Materials Engineering Department
Research and Development Report
The Effect of a Seawater Environmenton the Galvanic Corrosion Behavior of
Graphite/Epoxy Composites Coupled to Metalsby
Denise M. AylorJohn N. Murray
Approved for public release; distribution is unlimited.

CONTENTS
Page
Abstract .......................... ................................. 4
Administrative Information .................. ........................ 4
Acknowledgments ........................ ............................. 5
Introduction ........................ ............................... 5
Materials .......................... ................................ 6
Experimental Procedure .................... .......................... 7Galvanic Corrosion Testing ............... ....................... .. 7Electrochemical Impedance Spectroscopy Evaluation ....... ........... 9Potentiodynamic Polarization Testing ......... ................. .. 10
Results and Discussion ................ ......................... . .11Galvanic Corrosion Test Results ............. .................... .11
HY80-Composite Couples ................. ........................ ..11NAB-Composite Couples ................. ........................ ... 13
Discussion of Galvanic Corrosion Test Results ..... ............. .. 16Electrochemical Impedance Spectroscopy Test Results .... .......... .. 20Potentiodynamic Polarization Testing ......... ................. .. 24
Summary and Conclusions ................. ......................... .. 27
References ...................... ............................... .. 53
FIGURES
1. Gr/epoxy composite specimen used for galvanic corrosion testing . . . 34
2. Galvanic current data for HYBo steel - CAR (Gr/epoxy composite withno graphite fibers initially exposed) ........... .................. ..35
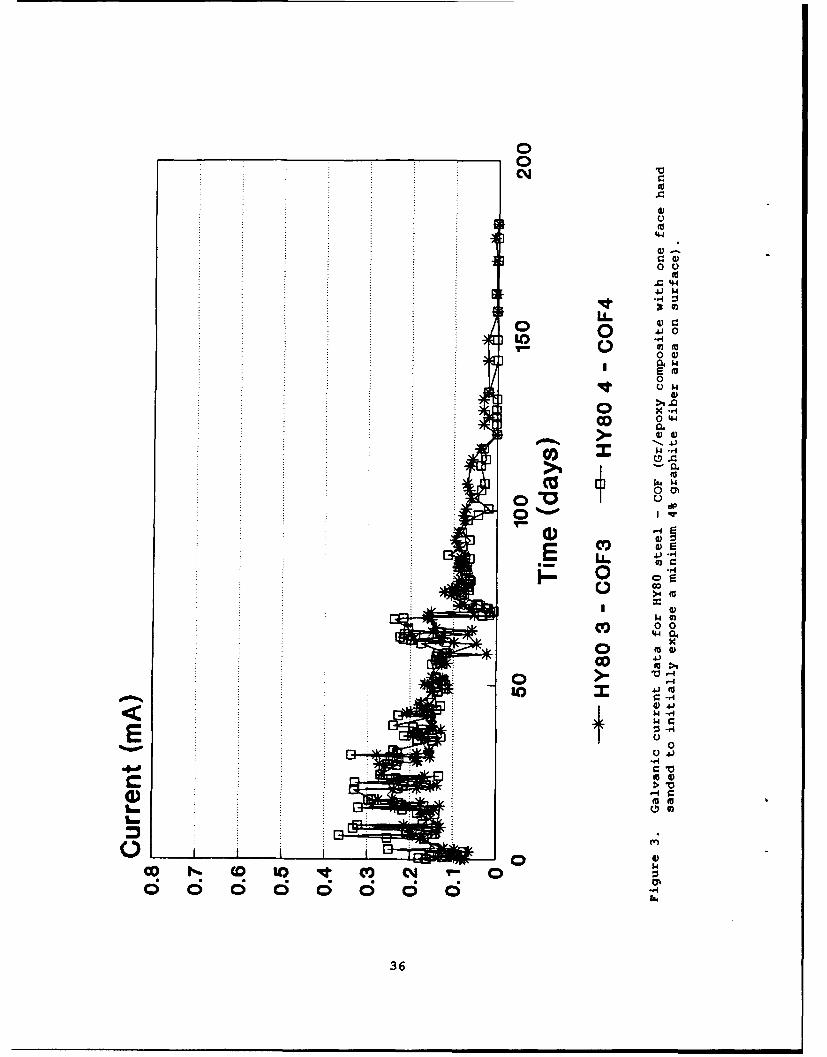
3. Galvanic current data for HY80 steel - COF (Gr/epoxy composite withone face hand sanded to initially expose a minimum 4% graphite fiber areaon surface) ....................... ............................... ..36
4. Galvanic current data for HY80 steel - CTF (Gr/epoxy composite withtwo faces hand sanded to initially expose a minimum 3% graphite fiberarea on surface) ..................... ............................ ... 37
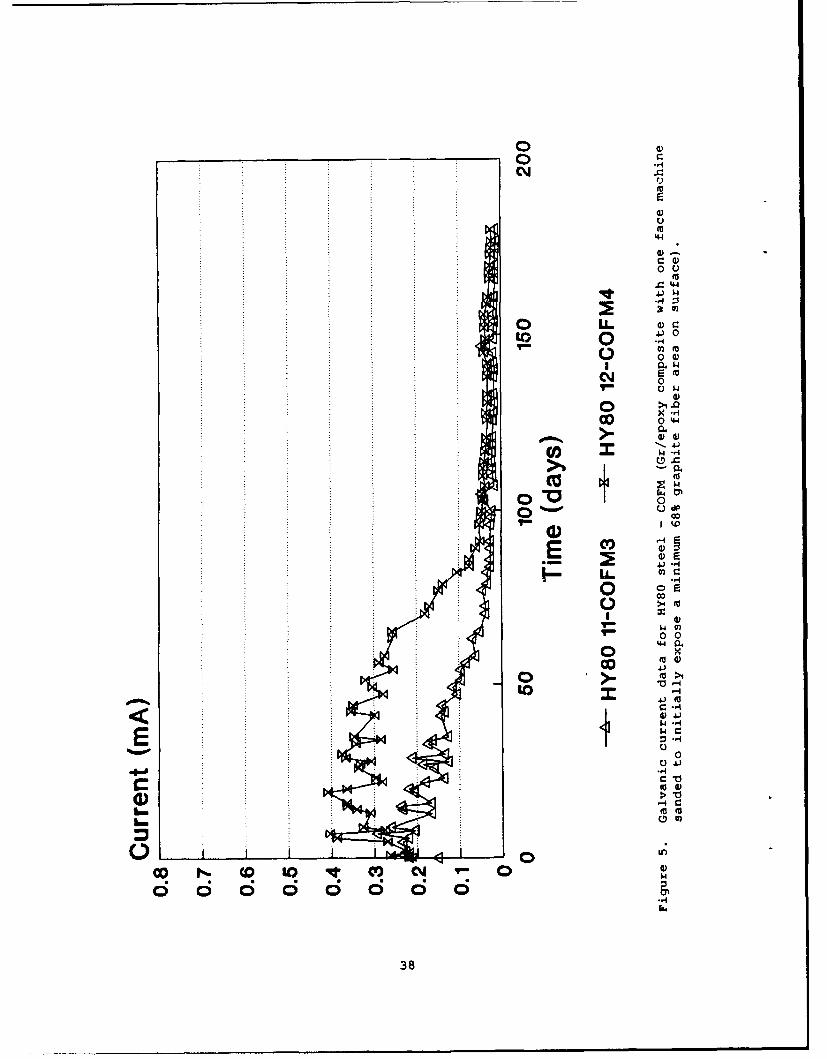
5. Galvanic current data for HY80 steel - COFM (Gr/epoxy composite withone face machine sanded to initially expose a minimum 68% graphite fiberarea on surface) ..................... ............................ ... 38
2
6. Representative photograph showing HY80 steel and Gr/epoxy galvaniccouple specimen surfaces after 180-day seawater exposure (specimensurfaces were brush cleaned after testing) ....... ............... ... 39
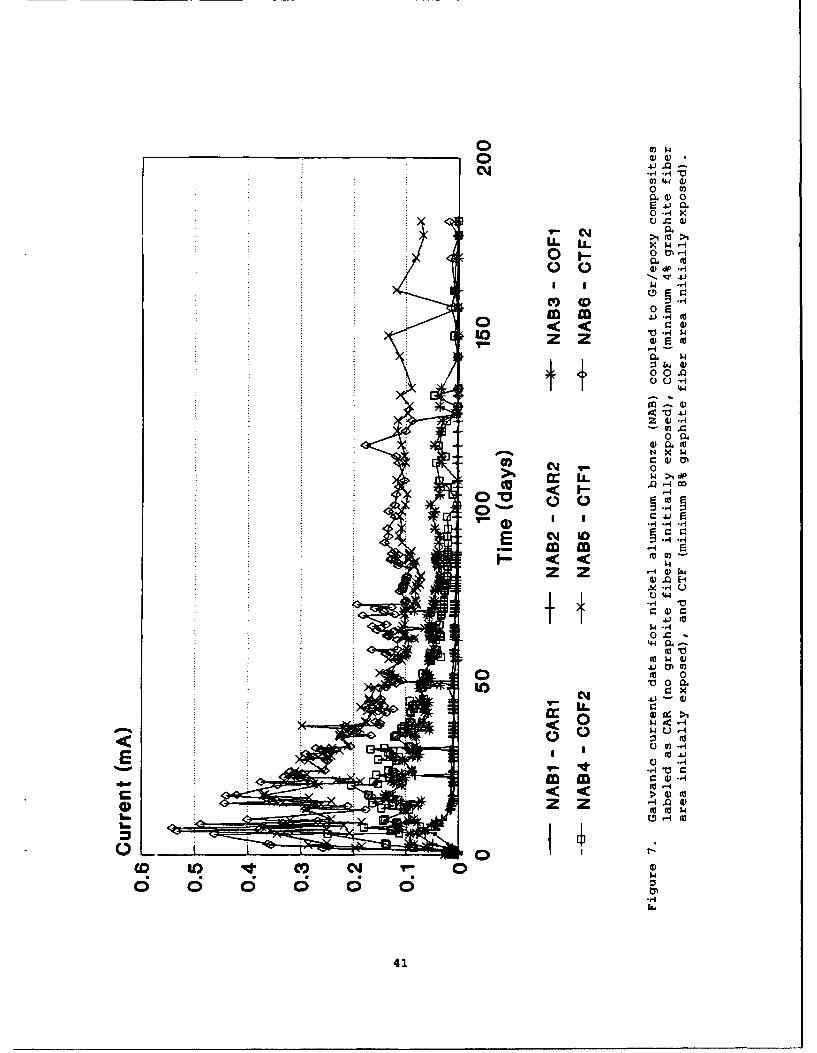
7. Galvanic current data for nickel aluminum bronze (NAB) coupled toGr/epoxy composites labeled as CAR (no graphite fibers initially exposed),COF (minimum 4% graphite fiber area initially exposed), and CTF (minimum8% graphite fiber area initially exposed) ......... ................ .. 41
8. Galvanic current data for nickel aluminum bronze (NAB) - COFM(Gr/epoxy composite machine sanded to initially expose a minimum 68%graphite fiber area on surface) ............ ..................... .. 42
9. Nickel aluminum bronze - Gr/epoxy composite galvanic couple specimensafter 180-day seawater testing (NAB specimen is representative of severelocalized corrosion present on NAB specimens coupled to COF, CTF, andCOFM Gr/epoxy composites) ................ ........................ .. 43
10. Current trends as determined from the composite-metal galvaniccouple testing .................... ............................. ... 45
11. Nested equivalent circuit for Gr/epoxy composite with calcareousdeposit ........................ ................................. .. 46
12. Simplified nested equivalent circuit for coupled Gr/epoxy compositewith calcareous deposit ................ ......................... ... 47
13. Simplified nested equivalent circuit for uncoupled Gr/epoxycomposite without calcareous deposit .......... .................. ... 48
14. Exposed graphite fiber surface area versus re-exposure time forGr/epoxy composite specimens (calculated from EIS data) .............. 49
15. Cathodic behavior of Gr/epoxy composite specimen COF6 (uncoupledspecimen with one face hand-sanded, one face as-fabricated) usingelectrochemical impedance spectroscopy at controlled potentials . . . . 50
16. Potentiodynamic polarization behavior of Gr/epoxy composites andmetals in seawater .................. ........................... ... 51
jTABLES
1. Chemical compositions of HY80 steel and nickel aluminum bronze
materials ........................ ................................ .. 30
2. Planar area estimate of graphite fibers in Gr/epoxy composites 0dinitially exposed to the seawater environment ...... .............. .. 31 .ion
3. Electrochemical impedance spectroscopy specimen test conditions . . 32-
4. A comparison of the composite-metal galvanic couple results from the LIt7Cod_potentiodynamic polarization tests and the 180-day seawater exposures 33I an/or
3

ABSTRACT
Galvanic compatibility between graphite/epoxy (Gr/epoxy) composites and
metals (HY80 steel and nickel aluminum bronze (NAB)) was evaluated in 180-
day seawater galvanic couple tests and laboratory electrochemical tests.
Results indicate that significant galvanic corrosion of NAB and HY80 can
occur when each material is coupled to a Gr/epoxy composite containing
exposed graphite fibers, with the rate of the metallic corrosion increasing
as the exposed graphite fiber area in the composite is increased. Galvanic
corrosion can also occur between Gr/epoxy composites with no graphite fibers
initially exposed to the environment and a metal as a result of moisture
absorption through the epoxy outerlayer to the graphite fibers. The
electrochemical impedance spectroscopy evaluation demonstrated that Gr/epoxy
composites with no graphite fibers initially exposed to the environment can
act as an effective cathode for oxygen reduction in seawater. It was
estimated that after 200 days' seawater exposure, 15% of the planar area of
this Gr/epoxy composite contained seawater-exposed graphite fibers. The
potentiodynamic polarization results suggest that short-term electrochemical
testing is not a reliable method for assessing long-term galvanic corrosion
behavior of Gr/epoxy-metal couples but does indicate a sensitivity to
graphite fiber area effects.
ADMINISTRATIVE INFORMATION
This report describes work that was authorized and funded under Work
Units 1-2802-303 and 1-2802-305. The work was performed in the Marine
Corrosion Branch (Code 2813) of the Naval Surface Warfare Center (NSWC)
4

under the supervision of Mr. Robert J. Ferrara. The research was funded by
the DARPA-UWO Man-Rated Demonstration Article Program (Program Manager, Mr.
James Kelly) and monitored at NSWC by Mr. Alastair G.S. Morton, Composites
Program Office, Code 2802.
ACKNOWLEDGMENTS
The authors are grateful for the efforts of Mr. Douglas Smith, Mr.
David Greenlaw, and Mrs. Anne Chamberlain of the Center's Metals and Welding
Division for the preparation of the composite and metal test specimens and
additionally to Mr. Douglas Smith for performing the potentiodynamic
polarization tests. The authors also commend the efforts of Mr. Fred
Hammond of the LaQue Center for Corrosion Technology for conducting the
galvanic corrosion tests.
INTRODUCTION
Interest in utilizing advanced composites such as graphite fiber-
reinforced epoxy in seawater environments has increased in recent years due
to their enhanced properties over more conventional materials.
Graphite/epoxy (Gr/epoxy) composites offer the advantage of high strength-
to-weight and stiffness-to-weight ratios (1,2), resulting in substantial
weight savings for seawater components. However, many marine applications
require that the Gr/epoxy composites be used in direct contact with metals.
Gr/epoxy composites electrically coupled to a metal structure in seawater
may result in accelerated galvanic corrosion of the metal due to the
cathodic influence of the graphite fibers in the composite.
Limited seawater corrosion data has been generated addressing che
5
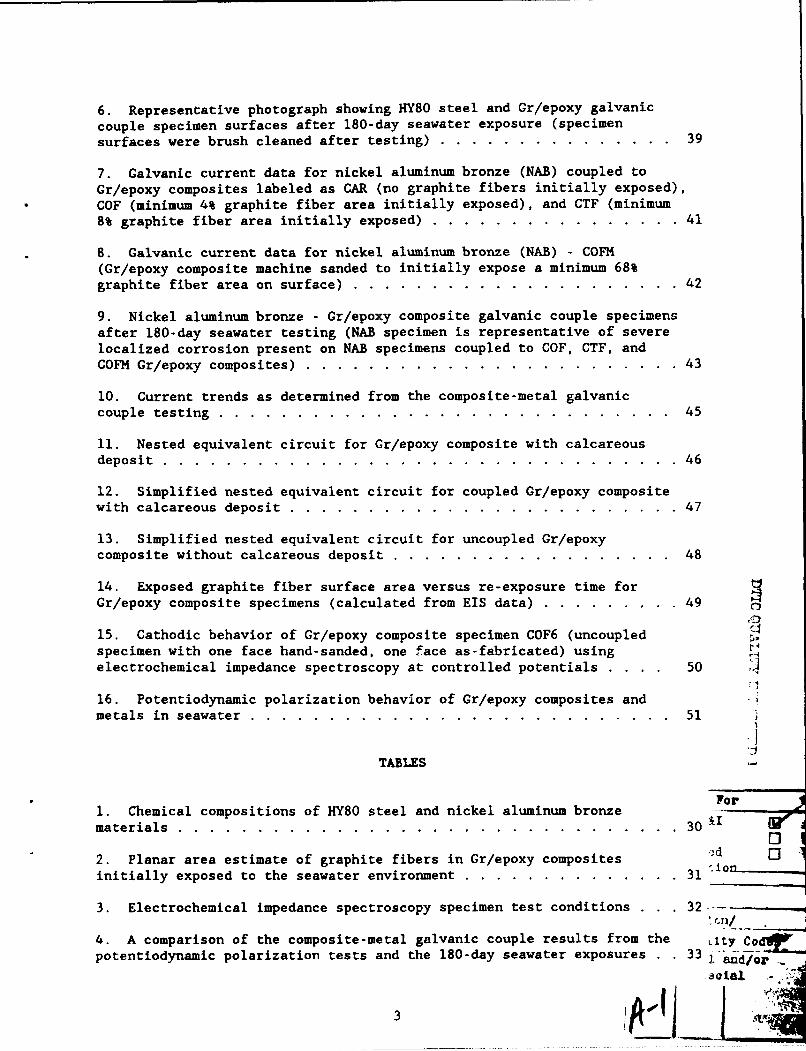
galvanic compatibility of Cr/epoxy composite-metal couples. The majority of
the research to date has been conducted for aerospace applications and has
been focused predominantly on the use of titanium, aluminum, and stainless
steel with the Cr/epoxy composites (1-5). Research by Hack and Macander (6)
evaluated the current demand on a zinc sacrificial cathodic protection
system when coupled to Cr/epoxy composites. The objective of this research
is to assess the galvanic compatibility of Gr/epoxy composites with HY80
steel and with nickel aluminum bronze by conducting both 180-day marine
corrosion exposures and laboratory electrochemical tests. In service,
protective measures in undersea vehicles may be required and will be
addressed as needed in future research programs.
MATERIALS
The Gr/epoxy composite material used in the galvanic corrosion
exiosures and the electrochemical testing contained AS4 graphite fibers (62%
fiber volume fraction) in a 3501-6 epoxy matrix. The composites were
prepared at the Naval Surface Warfare Center (NSWC), Annapolis using
pre-preg tape that was hand-layed in a [O]s orientation (8-ply, 0.16 cm thick
composite containing unidirectional graphite fibers) and then cured in an
autoclave. A composite panel measuring 0.1 m2 was produced, which was then
diamond-saw cut into smaller sections as required for the galvanic corrosion
and electrochemical specimens.
The metallic specimens utilized in the corrosion tests were
conventional wrought HY80 and nickel aluminum bronze (NAB) material. The
chemical compositions for both alloys are included in Table 1.
6
EXPERIMENTAL PROCEDURE
GALVANIC CORROSION TESTING
Galvanic corrosion tests were conducted for 180 days in quiescent,
filtered, natural seawater at ambient temperature. The testing was
performed at the LaQue Center for Corrosion Technology (LCCT). The galvanic
couples consisted of HY8O steel and NAB individually connected to Gr/epoxy
composites in the following conditions: (a) as-fabricated composite, (b)
one composite face hand-sanded to expose graphite fibers and one composite
face as-fabricated, (c) two composite faces hand-sanded to expose graphite
fibers, or (d) one composite face machine-sanded to expose graphite fibers.
The composites were prepared by both hand and machine sanding techniques
to alter the percentage of graphite fibers exposed to the seawater
environment. Both the hand and machine sanded composites were ground with
wet silicon carbide paper and baked in a 500 C oven overnight (approximately
15 hours) to remove any water that was absorbed during the grinding process.
Computer-aided optical measurements were made on the Gr/epoxy
composites after sanding to determine the percentage of graphite fibers
initially exposed to the environment for each condition. These measurements
provided only an approximation because the technique is two-dimensional and
relies on the judgment of the operator in identifying graphite fiber areas
that contain no epoxy. Thus, the measurements provided an estimate of the
minimum percentage of graphite fibers initially exposed on the surface of
the composite specimens. Based on these measurements, it was determined
that the percentages of graphite fibers that were initially exposed for the
Gr/epoxy composites are as shown in Table 2.
7
The composite specimens were prepared for testing by depositing silver
conducting paint along two transverse edges of each composite (to allow
electrical connection of all graphite fibers) and then attaching an
electrical lead. The edges were masked to expose two 6.5 cm2 faces to the
seawater for all Gr/epoxy composite specimens except the machine sanded
composites, where only one 6.5 cm2 face was exposed. A schematic of the test
specimen is included in Figure 1.
Metal alloy specimens were prepared by sanding one 6.5 cm2 surface to a
600-grit finish, attaching an electrical lead, and masking all edges and the
remaining, unsanded face. Immediately prior to immersion in seawater, the
metal alloy specimens were abraded with 800-grit SiC paper and rinsed in
distilled water. This final sanding was done to obtain a minimal oxide
layer on the surface of all of the metal specimens.
Individual galvanic couples were immersed in seawater, with the
Gr/epoxy composite specimens oriented perpendicular to the metal alloy
specimens. The two specimens in each galvanic couple were positioned
approximately 3.8 cm apart. For the as-fabricated and hand sanded
composite-metal galvanic couples, the cathode (composite) : anode (metal)
area ratio was 2:1. A cathode:anode area ratio of 1:1 was utilized for the
machine sanded composite-metal couples.
The area of the Gr/epoxy cathode used in the determination of the 2:1
and 1:1 cathode:anode area ratios was based on the total planar area of the
Gr/epoxy composite specimen (including both Gr fibers and epoxy) rather than
the actual planar area of only the cathodic Gr fibers exposed. Thus, the
actual Gr fiber surface areas initially exposed in the composites are
reduced to the estimated percentage (listed in Table 2) of the total surface
8
area. The objective in utilizing the hand and machine sanding techniques
was to vary the percentage of Gr fibers exposed to the seawater. This
objective was met by utilizing a 1:1 rather than a 2:1 cathode:anode area
ratio for the machine sanded composites and greatly reduced logistical
problems in preparing these composite specimens.
In addition to the galvanic couples, uncoupled control specimens were
immersed in seawater for 180 days. The controls included Gr/epoxy
composites in the four conditions listed above as well as HY80 and NAB
alloys.
For the galvanic couples, the specimen leads were electrically
connected through a zero resistance ammeter. Potential and current readings
were recorded ten times per week for the first two to three months of
testing, then reduced to one to three times per week for the remainder of
the 180-day test. Potential readings were taken on the uncoupled control
specimens with the same frequency as for the galvanic couple specimens.
ELECTROCHEMICAL IMPEDANCE SPECTROSCOPY EVALUATION
After galvanic corrosion testing for 180 days at LCCT, the specimens
were returned to NSWC, Annapolis. Five Gr/epoxy composite specimens were
subsequently immersed at NSWC, Annapolis in unstirred, ASTM ocean water for
an additional re-exposure time of 500 hours. Electrochemical impedance
spectroscopy (EIS) spectra were measured on the specimens periodically
during the 500 hour re-exposure period. This testing was done to obtain
electrochemical information regarding the effectiveness of the composite as
a cathode when galvanically coupled to a metal. The five graphite/epoxy
9
specimens evaluated using EIS are described in Table 3. In addition, EIS
was conducted on COF6 (uncoupled specimen with one face hand sanded, one
face as-fabricated) at several controlled potentials to obtain further
polarization information on the Gr/epoxy composite material.
For the EIS evaluation, the composite specimens were placed in a
polycarbonate tank electrochemical cell with two graphite rod
counterelectrodes positioned approximately 2 cm from each of the specimen
surfaces. The composite potentials were taken utilizing a Luggin capillary
with a saturated calomel (SCE) reference electrode that was positioned at
the specimen surface. The PAR Model 388 EIS equipment was utilized and has
been described previously (7). EIS spectra were measured starting at 0.1
hours' exposure to ASTM ocean water and remeasured periodically for
approximately 500 re-exposure hours. The EIS frequency range for this
evaluation varied from 5 x 10⁻³ to 105 l4z. Between runs, the solution and
specimens were left undisturbed.
POTENTIODYNAMIC POLARIZATION TESTING
Potentiodynamic polarization curves were generated at NSWC, Annapolis
on Gr/epoxy composites, both as-fabricated and with one face machine sanded
to expose graphite fibers (68% graphite fibers initially exposed), pure
graphite, HY80, and NAB specimens. The pure graphite specimens were not of
the same composition as the graphite fibers used in the Gr/epoxy composites
but were included in these tests to evaluate general differences in
polarization behavior in graphite exposed with and without an epoxy matrix.
Specimens were individually exposed in aerated, natural, ambient
10
temperature seawater and allowed to stabilize for 30 minutes before
beginning the potentiodynamic scan. A 0.1 volt/hour scan rate was used for
all tests. Anodic potentiodynamic curves were generated on the HYSO and NAB
materials, while cathodic potentiodynamic curves were generated for the
Gr/epoxy composite and pure graphite materials. The anodic curves began
approximately 10 mV electronegative to the material's corrosion potential
(Eorr) and continued until reaching a potential of +100 mV versus a
silver/silver chloride (Ag/AgCl) reference electrode. Likewise, the
cathodic curves began approximately 10 mV electropositive to Ecorr and
continued until reaching a potential of -800 mV versus Ag/AgCI.
RESULTS AND DISCUSSION
GALVANIC CORROSION TEST RESULTS
HY80-Composite Couples
Potential values measured for the HY80-composite couples remained
stable during the 180-day galvanic test. The galvanic couple potentials
ranged from -0.600 to -0.700 V versus a Ag/AgCI reference electrode, which
were similar in magnitude to the potentials reported for the uncoupled HY8O
control specimens.
Current versus time data for the HY80-composite galvanic couples is
included in Figures 2-5. The current data for all of the HYBO-composite
couples indicated an initial rise in current immediately after exposure to
seawater The amount of the initial current increase varied among the
different composite specimen types coupled to HYB0, and it was found to be
related to the percentage of graphite fibers initially exposed in the
11

Gr/epoxy composites. The HYSO-CAR (as-fabricated Gr/epoxy with no graphite
fibers initially exposed) couples exhibited initial maximum current levels
of 0.08-0.15 mA, while the HY80-COF (Gr/epoxy with one face hand sanded to
expose a minimum of 4% graphite fibers) couples showed maximum initial
levels of 0.29-0.36 mA. As the percentage of graphite fibers initially
exposed increased even more with the HY80-CTF (Gr/eoxy with two faces hand
sanded to expose a minimum of 8% graphite fibers) couples, the initial
current level also increased to an average of approximately 0.4 mA, with
current spikes as high as 0.7 mA. The initial maximum current levels for
the HY80-COFM (Gr/epoxy with on face machine sanded to expose a minimum of
68% graphite fibers) couples varied from 0.3-0.4 mA, which was within the
same initial current range as was reported for the HY80-COF and HY80-CTF
couples.
The initially high current levels exhibited by the HY80-COF, HY8O-CTF,
and HY80-COFM couples within the first 50 days of seawater exposure
decreased and leveled off to values less than 0.1 mA by 70-80 days of
seawater exposure. The HY80-COF and HY80-CTF couples remained in the 0.04-
0.1 mA current range between days 70 and 130, then displayed another
decrease in current to a level of 0.0001-0.03 mA for the remainder of the
180-day exposure period. The HY80-COFH couples leveled off to 0.01-0.04 mA
by 70-80 days' exposure and remained at that level for the rest of the
180-day exposure period.
The HY80-CAR couples exhibited slightly different current behavior from
the other HY80-composite galvanic couples. The HY80-CAR couples reached a
maximum current level of 0.15 mA within the first 10 days of exposure,
leveled off to approximately 0.05 mA for approximately 35 days, then
12

displayed a second increase in current which was at a maximum level of 0.35
mA by day 70. The current then continually decreased from day 70 through
125 until leveling off at 0.001-0.003 mA for the rest of the 180-day
exposure.
Figure 6 shows a representative photograph of the HY80-composite
galvanic couple specimens after the 180-day testing. The specimen surfaces
had been brush cleaned prior to photographing. At the conclusion of the
ga'Tanic couple testing, the HY80 specimens contained voluminous, rust-
colored corrosion products on their surfaces, while the Gr/epoxy composites
exhibited tenacious calcareous deposits over the majority of their surfaces.
After removing the corrosion products from the HY8O specimens, it was found
teat the HY80 specimens coupled to the CAR, COF, and CTF composites
contained corrosion that was predominantly concentrated along the specimen
edges. In contrast, the uncoupled HYBO control specimens and the HYBO
specimens coupled to the COFM composites exhibited general corrosion across
their surfaces. The maximum depth of corrosion attack measured on the HY80
specimens fro-m the hr!80-CAR and HY80-COFM couples was 0.20 mm, similar to
the 0.18 mm maximum depth of corrosion attack measured on the uncoupled HY80
controls. The HY80 specimens from the HY80-COF couples reported a maximum
depth of corrosion attack of 0.38 mm, and the HY80 specimens from the HY80-
CTF couples exhibited a maximum corrosion attack depth of 0.79 mm.
NAB-Comvosite Couples
Potential versus time data measured for the NAB-composite couples
showed stable potential values ranging from approximately -0.100 to -0.170 V
versus Ag/AgCl over the 180 days of seawater exposure. This range of
13
potential values was somewhat electropositive to the uncoupled NAB control
specimens, which varied from -0.210 to -0.270 V versus Ag/AgCl during the
180-day period. The electropositive shift in Ecorr for the NAB-composite
couples as compared to the NAB control specimens suggests that the graphite
fibers in the Gr/epoxy composite had a slight effect in polarizing the
galvanic couple in the electropositive direction.
Current versus time data for the NAB-composite galvanic couples is
included in Figures 7 and 8. As seen in these figures, all of the
NAB-composite couples exhibited a rise in current immediately after seawater
exposure. The amount of the initial current increase was found to be
related to the percentage of graphite fibers initially exposed in the
Gr/epoxy composites. A similar trend in the initial current data was
exhibited by the HY80-composite couples.
The NAB-CAR (as-fabricated Gr/epoxy with no graphite fibers initially
exposed) couples displayed initial maximum current levels of approximately
0.08 mA. As the percentage of graphite fibers initially exposed increased
to a minimum of 4% in the NAB-COF couples, the initial maximum current level
increased to approximately 0.17 mA while the NAB-CTF (Gr/epoxy with two
faces hand sanded to expose a minimum of 8% graphite fibers) couples showed
a maximum current level as high as 0.54 mA. The initial maximum current
level for the NAB-COFM couples was 0.3 mA, which was within the range of
initial maximum current reported for the NAB-COF and NAB-CTF couples.
The initial maximum current level for the NAB-CAR couples was reached
within the first ten days of testing, after which the current level
decreased to 0.01 mA or less and remained there until the end of the 180-day
test period. The NAB-COF and NAB-CTF couples reached their peak current
14
levels within the first 25 days of seawater exposure and then steadily
decreased to a current level of 0.1 mA or less by day 60. The couple
current then remained constant until approximately 125-135 days of exposure.
At that time, the current level for the NAB-COF couples and one of the two
NAB-CTF couples decreased to 0.01 mA or less. The remaining NAB-CTF couple
stayed at the 0.1 mA current level until the end of the 180-day exposure
period.
The NAB-COFM couples attained their maximum initial current level
within the first 20 days, after which the couple current decreased slightly
but never stabilized through the 180-day seawater exposure period. The
couple current fluctuated between 0.05 and 0.3 mA during days 20 through
180.
At the conclusion of the 180-day galvanic corrosion tests, the NAB
specimens from the NAB-composite galvanic couples contained greenish-brown
and brown corrosion products in localized areas on their surfaces. As in
the HY80 tests, the Gr/epoxy composites from these NAB-composite galvanic
couples had tenacious calcareous deposits on their surfaces. Figure 9 shows
a photograph of one NAB-CTF galvanic couple at the conclusion of the
seawater testing. The specimen surfaces had been brush cleaned to remove
the bulk of the corrosion products prior to photographing. The photograph
in Figure 9 represents the localized corrosion typically present on the NAB
surfaces after the NAB-composite galvanic couple testing was completed, but
the depth and quantity of pitting present varied among the various galvanic
couples.
All of the NAB specimens from the NAB-composite galvanic couples
exhibited localized corrosion that was predominantly oriented along the
15

specimen edges. The NAB specimens from the NAB-CAR couples contained
minimal pitting (0.03-0.05 mm deep) on their surfaces. The quantity and
depth of pitting was very similar to the pitting present on the uncoupled,
control NAB specimens. The NAB specimens from the NAB-COF and NAB-CTF
couples all displayed a maximum depth of pitting of 0.76 mm, although the
quantity of pitting was significantly greater on the NAB specimens from the
NAB-CTF couples. The maximum depth of pitting measured for the NAB
specimens from the NAB-COFM couples was 1.45 mm, significantly higher than
on any of the other NAB-composite couples.
DISCUSSION OF GALVANIC CORROSION TEST RESULTS
The individual galvanic current versus time curves for all of the
metal-composite couples (Figures 2-5, 7, and 8) were oscillatory in nature.
The oscillations were presumably due to localized differences in the active
anodic and cathodic areas contributing to the galvanic corrosion reaction,
with the actual contributing areas being related to the stability of the
films present on the composite and metal surfaces. A similar oscillatory
nature was also seen in the galvanic current data reported by Hack and
Macander (6) on Gr/epoxy-zinc and NAB-zinc couples in seawater.
The current trends determined from the galvanic couple testing are
incorporated into the plot shown in Figure 10. This plot divides the
current versus time curve into four distinct regions. Region I shows the
initial current increase upon exposure in seawater, which was attributed to
the activation of both the metal and graphite fiber surfaces by immersion in
seawater. As corrosion product films were formed on the active surfaces,
16

the currents decreased (Region II) and leveled off (Region III) due to a
reduction in the active surface areas. After a period of time, calcareous
deposits accumulated on the graphite fiber surfaces and controlled the
ongoing cathodic processes, which resulted in a second decrease in the
measured current to negligible values (Region IV).
The formation of calcareous deposits on the Gr/epoxy composites
occurred due to the oxygen reduction reaction, 02 + 2H20 + 4e- - 40H-, taking
place at the cathode (composite). The generation of hydroxyl ions from this
reduction reaction raises the pH of the seawater at the graphite surface and
typically results in the precipitation of CaCO3 and Mg(OH) 2 (8).
The corrosion produc. films formed on the anodic and cathodic surfaces
of the galvanic couple specimens reduced the measured galvanic couple
currents for a significant portion of the seawater test period. Thus, the
extent of galvanic corrosion exhibited by the anodic metal specimens was
highly dependent on the formation and maintenance of these protective films.
Under seawater flow conditions, the growth and maintenance of the corrosion
product films can be severely limited and the supply of dissolved oxygen to
the cathode increased (9), thus resulting in significantly higher galvanic
corrosion rates. Research by Hack and Macander (6) showed as much as an
order of magnitude increase in the galvanic currents measured for
Gr/epoxy-zinc and NAB-zinc couples in 10 m/s flowing seawater as compared to
0 m/s seawater.
All of the HY80-composite and NAB-composite couples displayed the
initial current increase and subsequent reduction in current as described
for Regions I and II, but after that variations from Figure 10 were evident
for individual galvanic couples. In general, it was found that the
17
magnitude of the initial current level increased as the graphite fiber
surface area increased. The HY80-CAR couples showed a second increase in
corrosion current after the initial current increase and reduction (Regions
I and II). This second corrosion current increase was presumably due to
increased moisture penetration within the composite which increased the
active cathodic graphite fiber surface area. The eventual buildup of
calcareous deposits on the CAR surface then resulted in the current decrease
to a negligible level. The NAB-CAR couples did not show a second increase
in current, but only an initial current increase followed by a reduction in
current to a very low level. The second increase in current that was seen
on the HY80-CAR couples and not found on the NAB-CAR couples was presumably
related to differences in the permeability of the films formed on the
Gr/epoxy composite surfaces.
It should be noted that the HYSO-CAR and NAB-CAR couples did display an
increase in the current level almost immediately upon seawater exposure
(Figures 2 and 7) even though these composites contained an approximately
0.01 mm thick epoxy layer on their surfaces, which initially prevented any
graphite fibers from being exposed to the environment. A computer program
(10) based on Fickian diffusion was used in this study to estimate the time
required for moisture to penetrate through the epoxy layer to the graphite
fibers within the composite. Input for this program included a resin
diffusivity of 1.48 x 10⁻⁶ in 2/hour and a maximum moisture content of the
resin equal to 6%. The basis for the selection of these input values is
explained in reference (11). The program calculations showed that moisture
could penetrate through the epoxy layer to the graphite fibers within ten
minutes after exposure, which is consistent with the increase in the
18

measured galvanic currents almost immediately upon immersion for both the
HY80-CAR and NAB-CAR couples.
After the 180-day seawater test period, inspection of the HY8O and NAB
specimens that were coupled to the CAR composites showed that the extent of
the corrosion attack was similar to the respective, uncoupled control
specimens, suggesting no increased corrosion from the galvanic coupling.
However, the galvanic current measurements for these couples indicated
galvanic activity during part of the exposure period as evidenced by rises
in the measured current level. The minimal corrosion on the metal alloy
specimens that were coupled to the CAR composites was attributed to the
small area of graphite fibers available to promote the galvanic corrosion
reaction with the anodic metal and to the corrosion product films formed on
both the anode and cathode which also reduced the effective surface areas
for the reaction.
The HY80-COF, HY80-CTF, NAB-COF, and one of two NAB-CTF couples
exhibited the four regions of corrosion current behavior as depicted in
Figure 10. The HY8O-COFM couple and the remaining NAB-CTF couple displayed
corrosion currents as defined by Regions I through III, but never showed the
Region IV reduction in current to very low levels. In addition, the NAB-
COFM couples showed the initial current rise and subsequent reduction in
current but did not exhibit a stable current level by the end of the 180-day
test. Thn- active currents evident in the HYSO-COFH, NAB-COFM, and one NAB-
CTF couple are presumably related to active surface areas of graphite fibers
available to promote the galvanic corrosion reaction with the metal surface,
thus preventing a reduction in the current level to negligible values.
Although the shape of the current versus time curve varied for the
19
metal-composite couples, the corrosion test results indicate that galvanic
corrosion will occur when NAB or HY80 is coupled to a Gr/epoxy composite
with exposed graphite fibers. In general, it was found that the magnitude
of the galvanic current increased as the graphite fiber area was increased.
Also, the depth of corrosion attack was greater on the NAB specimens coupled
to Gr/epoxy composites than on the HY80 specimens coupled to the Gr/epoxy.
ELECTROCHEMICAL IMPEDANCE SPECTROSCOPY TEST RESULTS
The EIS spectra obtained for the five graphite/epoxy composite
specimens after 500 re-exposure hours were analyzed assuming that the
conventional nested RC equivalent circuit model approximates the specimen
and electrolyte interface parameters. The nested model is shown as Figure
11. The physical test system is considered to be the composite surface with
pores in the polymer which can allow the test solution to contact the
reinforcing graphite. When the composite is electrically coupled to a metal
surface in an aqueous solution, the graphite surfaces become 02 reduction
areas for the galvanic couple. The resulting alkalinity from the 02
reduction reaction can allow precipitation of magnesium and calcium
compounds from the seawater onto the composite which then forms a calcareous
coating on the surface which should act as an electrical capacitor (C'.1c).
The calcareous deposit is anticipated to have some open porosity which would
then limit the solution exposure to the exposed graphite and in effect act
as an electrical (ionic) resistor (Rcae ,pore). The organic phase of the
composite may also act as a capacitor (Cpoiy) in parallel with the calcareous
coating. An initial solution resistance (Rn) exists between the test surface
and the Luggin capillary leading to the reference electrode. Finally, the
20
graphite surface itself responds electrochemically as a resistive element
(Rp) (for the electrochemical reduction of 02) in parallel with the
capacitive nature (Cdl) of the graphite and electrolyte interface.
For the composite specimens that were galvanically coupled, the
equivalent circuit simplifies somewhat as the C• and Ccaic elements add and
the two pore resistances add. The resulting equivalent circuit is shown as
Figure 12.
For the uncoupled composite specimens, the graphite surface corrosion
rate is very low and requires quite low 02 reduction current, therefore
yielding little local alkalinity. Under these conditions, very little (if
any) calcareous deposit forms on the composite. The polymer capacitance,
which would be expected to be observed in the high frequency range, appears
to be too small to be detected in the presence of the large polymer pores
(and therefore small pore impedances). The equivalent circuit then
simplifies even further to one of two possible cases. In the one case, the
02 reduction process at the specimen potential is moderate, therefore the
polarization resistance is measurable and the equivalent circuit reduces to
that shown as Figure 13. This equivalent circuit results in the general
response seen for the uncoupled composite specimens with one or two hand-
sanded faces. For the as-fabricated, uncoupled composite specimen with no
faces sanded, the equivalent circuit reduces even further in that the
polarization resistance is so large as to be unmeasurable at the lowest
frequency (0.005 Hz and in one case 0.0001 Hz) normally utilized.
The graphite fiber area exposed to the ASTM ocean water solution was
calculated from the EIS Cdl data as a function of re-exposure time for each
of the five graphite/epoxy composites. For these calculations, a specific
21

double layer capacitance of 25 pF/cm2 was assumed. This value was selected
from the 15 to 40 pF/cm2 range established for a smooth metallic mercury
surface in a variety of aqueous solutions (12) and appears to be reasonable
for graphite as well as several very slowly corroding metals.
Figure 14 presents the calculated graphite fiber areas for the five
composites as a function of re-exposure time. The data shows that all three
types of composites (as-fabricated, one face hand sanded, or two faces hand
sanded) contain an active, cathodic graphite fiber surface area which can
act in the oxygen reduction process. This data also indicates that the area
of the active gr&phite fiber surface increases as the initial, exposed
graphite fiber surface area is increased. Even the as-fabricated composite
specimen, CARS, has graphite fiber area which can act in the 02 reduction
process and, after the initial penetration period, the composite appears to
be stable to at least 500 hours' re-exposure.
The 02 reduction currents and current densities for the five composite
specimens in the unstirred, ASTM ocean water solution were also calculated
using the low frequency impedance values and the areas calculated from the
Cdl values. These Rp values were then converted to corrosion current
densities using the Stern-Geary equation (13). In general the uncoupled,
hand-sanded composite specimens (COF6 and CTF6) would allow 0.03 MA/cm2
cathodic current at the uncoupled potential of approximately 0 V vs. SCE.
The coupled, hand-sanded composite specimens (COF3 and CTF3) allowed
approximately 90% if that value or 0.027 MA/cm2 , with this lower current
density presumably due to diffusional constraints as a result of the
presence of the calcareous films. The uncoupled, as-fabricated composite
specimen CAR5 would then allow approximately 0.0045 MA/cm2 at the uncoupled
22

potential based on the total exposed composite area.
The total 02 reduction current possible from the graphite reinforced
composite is also a function of the cathode potential. The potential can
range from +0.2 V vs. SCE, as seen for these composite specimens retested in
the uncoupled mode to a low potential in the coupled mode which would depend
on the metal to which the composite was coupled and the relative anode to
cathode areas. EIS runs were made at several controlled potentials using
the composite specimen COF6 with one face hand-sanded. The 02 reduction
polarization data from the EIS runs are shown as Figure 15, with the general
schematic dashed line added to identify the Tafel and the limiting current
density ranges. As can be inferred, a large area steel anode (uncoupled
corrosion potential of -0.6 V vs. SCE (14)) could "drive" a small area
graphite cathode at 0.8 pA/cm2 in an unstirred solution. For the as-
fabricated composite material, the calculated cathodic current density is
0.12 pA/cm2 , which is considerably lower than the current density determined
for the Gr/epoxy composite with one face sanded. The cathodic currents for
the composites could be increased with increasing electrolyte flow.
In summary, the EIS investigation showed that after approximately 200
days of seawater exposure, all of the Gr/epoxy composites (COF, CTF, and CAR
composites) contained active cathodic graphite fiber surface areas which can
act in the oxygen reduction process. Even the Gr/epoxy composites in the
as-fabricated condition, which contained a 0.01 mm thick epoxy layer on
their surfaces, had exposed graphite after the seawater exposure (probably
through the surface porosity in the polymer matrix). It was estimated that
15% of the planar area of the as-fabricated composite contained seawater-
exposed graphite fibers. When this as-fabricated Gr/epoxy composite is
23

galvanically coupled to a metal, the composite can allow between 0.0045 and
0.12 pA/cm2 current density, with the specific value depending on cathode to
anode area ratios and seawater flow rate conditions.
POTENTIODYNAMIC POLARIZATION TESTING
The potentiodynamic curves produced for the pure graphite, Gr/epoxy
composite, and metallic materials are included in Figure 16. The anodic
curve for NAB indicates a reduction in current density at a potential of
-200 mV. This behavior was also reported by Scully (15) in potentiostatic
testing of 70/30 and 90/10 copper-nickel, which he attributed to either
passivity of the alloy or the buildup of a resistive film. The anodic curve
generated for HY80 showed no indication of passive behavior.
The cathodic curves produced for pure graphite, Gr/epoxy with one face
machine sanded (COFM - estimated 68% graphite fibers initially exposed), and
as-fabricated Gr/epoxy (CAR - no graphite fibers initially exposed) all
showed an orientation in the vertical direction at negative potentials,
indicating that the system had become diffusion limited. This vertical
orientation occurred at approximately -100 mV for the CAR specimens and at
approximately -400 mV for the COFM and pure graphite specimens.
Similar cathodic polarization curves were generated by Belucci, et al.
(16) on Gr/epoxy and pure graphite specimens in 3.5% NaCI. Their results
correlated well with the cathodic curves determined for the COFM and pure
graphite specimens in this research, with similar materials displayiug
limiting current densities within the same order of magnitude.
By coupling an individual anodic and cathodic curve, it is possible to
predict the potential and corrosion current density for that galvanic
24
couple. Coupling NAB to the three cathodic curves (CAR, COFM, and pure
graphite) yielded a couple Ecorr of approximately -300 mV in all three cases
due to the flatness of the anodic NAB curve. The couple corrosion current
densities, however, varied from 0.04 pA/cm2 for the NAB-CAR couple to 2 and 7
pA/cm2 for the NAB-COFM and NAB-graphite couples, respectively. This
approach showed a two-fold order of magnitude increase in the couple
corrosion current density between the NAB-CAR couple with no graphite fibers
initially exposed and the NAB-COFM (68% graphite fibers initially exposed)
and NAB-pure graphite couples.
The HY80 material coupled to the three cathodic curves (CAR, COFM, and
pure graphite) all showed a predicted couple Ecorr of -550 mV due to the
flatness of the anodic HY8O curve. The predicted couple corrosion current
densities were significantly higher for the HY80 couples than for the NAB
couples, but the data still indicated an increase in corrosion current
density with increasing graphite area (as was found for the NAB-composite
couples). The HY80-CAR couple showed a corrosion current density of 0.1
AA/cm2 , and the HY80-COFM and HY80-graphite couples exhibited corrosion
current densities of 20 and 80 pA/cm2 , respectively.
The polarization results for both the NAB-composite and HY80-composite
couples showed differences in predicted corrosion rates for the couples as
the amount of exposed graphite area was varied. Thus, this potentiodynamic
test method does indicate a sensitivity to graphite fiber area effects in
Gr/epoxy-metal couples.
A comparison of the couple potential and current density values
predicted from the polarization curves with the actual values measured
during the galvanic couple testing is reported in Table 4 This table
25

provides data for the NAB and HY80 alloys coupled to both CAR and COFM
Gr/epoxy composites. The poor correlation in data between the predicted
values from the polarization curves and the actual, measured values from the
galvanic couple tests indicates that the short-term polarization testing is
not an accurate method for predicting long-term galvanic couple corrosion
rates. These results agree with the conclusion stated by Belucci (17) after
evaluating Gr/epoxy composites and metals in 3.5% NaCl using potentiostatic
polarization and with research by Scully (15) on metals in seawater. The
poor correlation between the potentiodynamic and galvanic couple tests is
not unexpected, since film formation on the composite and metal specimens
can markedly affect the material's polarization behavior. Film formation is
severely limited in the potentiodynamic testing due to the short-term nature
of these tests.
As seen in Table 4, the couple current density values predicted from
the polarization testing were generally closest o the actual couple current
density values reported within the first 30 days of seawater testing. Also,
the predicted current density vaiues were generally lower than the actual
couple current densities averaged over the entire 180-day exposure period.
The one exception to this statement was for the HY80-COFM couples, where the
actual couple current densities were measured at approximately 20 MA/cm2 for
the first 30 days and then significantly decreased to an average 2 MA/cm2
over the last 90 days. The predicted couple current density of 20 MA/cm2 was
more similar to the initial actual current densities than the average actual
current densities over the last half of the exposure period.
For the couple potentials, it was found that the predicted couple
potentials correlated with the actual couple potentials measured after one
26
day of exposure for the NAB-CAR and NAB-COFM couples. The HY80-CAR and
HY80-COFM couples did not show any correlation between the predicted and
actual couple potentials. The predicted potentials were more
electropositive than the actual couple potentials.
SUMMARY AND CONCLUSIONS
The galvanic compatibility of Gr/epoxy composites with HY80 steel and
with nickel aluminum bronze was assessed by conducting 180-day seawater
galvanic couple tests and laboratory electrochemical tests. The galvanic
couple tests were conducted in quiescent seawater on Gr/epoxy-metal (HY80 or
NAB) couples and uncoupled control specimens. Results of these tests
indicated that galvanic corrosion of HY80 and NAB will occur when these
metals are individually coupled to Gr/epoxy composites with exposed graphite
fibers and immersed in quiescent seawater. As the exposed graphite fiber
area in the composite increases, galvanic corrosion of the NAB or HY80 will
also increase. The depth of corrosion attack due to galvanic coupling with
the Gr/epoxy composite is greater for NAB than for HY80. Galvanic corrosion
can also occur between Gr/epoxy composites with no graphite fibers initially
exposed to the environment and a metal. This corrosion is believed to be
due to moisture absorption through the epoxy outerlayer to the graphite
fibers. The extent of galvanic corrosion occurring on the metal will be
related to 1) the graphite fiber area contributing to the reaction due to
moisture absorption and 2) the presence of corrosion product films on the
anode and cathode which further limit the effective anodic and cathodic
areas.
The galvanic couple test results also showed that corrosion product
27

films present on both the Gr/epoxy and metal components of the galvanic
couple in quiescent seawater can significantly reduce the magnitude of the
galvanic corrosion occurring. Substantially higher galvanic corrosion rates
could, however, occur in flowing seawater conditions, where 1) the growth
and maintenance of the corrosion product films may be severely limited and
2) the supply of dissolved oxygen to the cathode would be increased.
The laboratory electrochemical evaluations consisted of both
electrochemical impedance spectroscopy and potentiodynamic polarization
testing. The EIS evaluations were conducted on Gr/epoxy composites that
were exposed for 180 days in the seawater galvanic couple testing. These
composites were re-immersed in ASTM ocean water for an additional
re-exposure of 500 hours, with EIS spectra measured periodically on the
specimens during this period. The EIS results showed that the
graphite/epoxy composite in the as-fabricated condition with no graphite
fibers initially exposed can act as an effective cathode for oxygen
reduction in seawater. After a total 200 days of seawater exposure, it was
estimated that 15% of the planar area of the composite contained seawater-
exposed graphite fibers. Under galvanic corrosion conditions, this
composite can allow between 0.0045 and 0.12 jiA/cm2 current density, with the
specific value dependent on the cathode:anode area ratio and the seawater
flow conditions.
The potentiodynamic polarization testing was conducted on Gr/epoxy
composites, pure graphite, HY8O steel, and nickel aluminum bronze specimens
in ASTM ocean water. The results of this evaluation confirmed that, as with
metals, this accelerated electrochemical test method is not accurate for
predicting long-term galvanic corrosion rates for Gr/epoxy-metal couples but
28
does indicate a sensitivity to graphite fiber area effects in these
composite-metal couples.
29

00wV
.00
I0
NNC00
.0 CD
0 E~
"4) c -s E
0 0 0
0
0 n d
0 -: ' o0 ; CIM
0 0
4))
S 0i0E
00
0. R C 0oo cc id
0- 0 cc
04
03
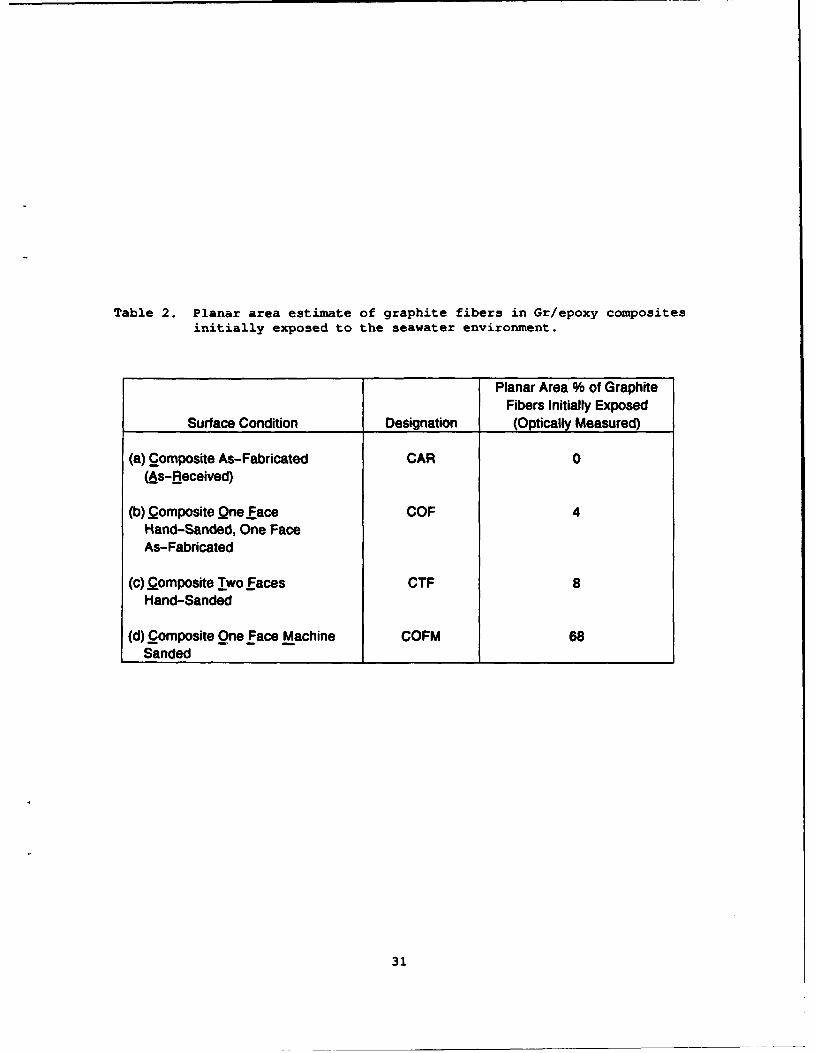
Table 2. Planar area estimate of graphite fibers in Gr/epoxy compositesinitially exposed to the seawater environment.
Planar Area % of GraphiteFibers Initially Exposed
Surface Condition Designation (Optically Measured)
(a) Composite As-Fabricated CAR 0(Ls-Received)
(b) Composite Qne Face COF 4Hand-Sanded, One FaceAs-Fabricated
(c) Qomposite Two faces CTF 8Hand-Sanded
(d) Composite One Face Machine COFM 68Sanded
31

Table 3. Electrochemical impedance spectroscopy specimen test conditions.
Exposed atSpecimen LCCT for Specimen
Code Condition 180 Days Area (cm2)
CAR5 As-Fabricated Uncoupled 12.9
COF6 One Face Hand-Sanded, Uncoupled 6.45
One Face As-Fabricated
CTF6 Two Faces Hand-Sanded Uncoupled 12.9
COF3 One Face Hand-Sanded, Coupled to 6.45One Face As-Fabricated HY80 Steel
CTF3 Two Faces Hand-Sanded Coupled to 12.9HY80 Steel
32

414
>1 E
0I 1 e
6441 1
-d1 clC
0
00(0
0 E44 ;A 8
010
0 10 0 0to CY to co
41 4-
JJ~CC
-10 c o
CiA o 3U i
co co0 04c < i6 .)
z I00
0LL0~LL33

ElectricalLead
2.54 cm
Gra•phite C ingFiber Conducting
Orientation Paint
All EdgesMasked
Figure 1. Gr/epoxy composite specimen used for galvanic corrosion testing.
34

-4)
CY2
0t
0j 0
0
9- 0-
> o 1
L0 I U)
0 -
too04
C.)•
CI I
L>1
-4
I,.,U
0
I,
0 004 0 0
35.
0
00
44
0 IL
C4.4
0 0
0 4
0 m
LL.0 C
I0 04
044
V 4
0
$4)
C4O
36I *0

0
00
CY,
~440
IL)L
0 4)
0Q 4
OD 0 44
64 -4
> d1
00
to 4.)
$4
0d4)>4
0 M*
0
Ity
374
fuo 44
0 .)0
to
0•V
C14 00
0
-,-I
.I.
w -4
oM-4
0% 0
cc 4)
o~~t o ooo
too
-I416m
0 0o
38o

Gr/epoxy(COF 3)
HY80 steel
Corrosion -
predominantlyalong edges
25 mm
Figure 6. Representative photograph showing HY80 steel and Gr/epoxy galvaniccouple specimen surfaces after 180-day seawater exposure (specimensurfaces were brush cleaned after testing).
39
o 0
0~) 04d
V- C4 1 >
L. L X $4 -4
o 4i)
It) (D z *0.4l00
-44
0 0.0
4-4
z W -. 4
0 C0.
0
04 0
U 44
4-4
m 0
0. 0.0to
' LLC
00LIC ) -. 4
< 0-4
go le co Z Z '-4.0:3L
41.

0
04.
@0 (0.444
E14
m 00~4)0
03 0 44
0 04
CC.
.0
54 - 4
00(
>111
422

Gr/epoxy(CTF 2) , ,
Nickelaluminumbronze
Localizedcorrosion
Figure 9. Nickel aluminum bronze - Gr/epoxy composite galvanic couplespecimens after 180-day seawater testing (NAB specimen isrepresentative of severe localized corrosion present on NABspecimens coupled to COF, CTF, and COFM Gr/epoxy composites).
43
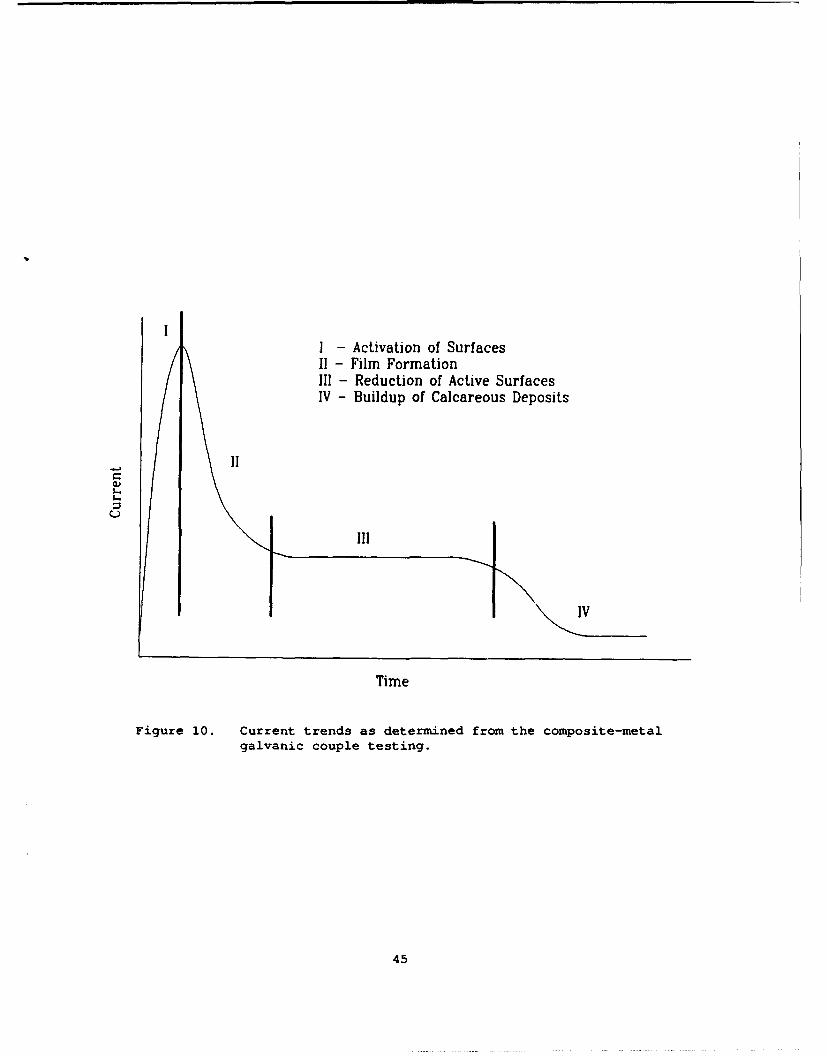
I - Activation of SurfacesII - Film FormationIII - Reduction of Active SurfacesIV - Buildup of Calcareous Deposits
.. o II
I III
Time
Figure 10. Current trends as determined from the composite-metalgalvanic couple testing.
45

cpoIy
Cealc
Rp
Figure 11. Nested equivalent circuit for Gr/epoxy composite withcalcareous deposit.
where %oly - capacitance (polymer)Ccalc - capacitance (calcareous deposit)RU- solution resistanceRcalc pore - resistance (pores in calcareous deposit)Rpoly pore - resistance (pores in polymer (Gr/epoxy composite))Cdl = double layer capacitanceR- polarization resistance
46

-H
CdI
R film pore L--• A
RP
Figure 12. Simplified nested equivalent circuit for coupled Gr/epoxycomposite with calcareous deposit.
where Cf i - film capacitanceS- solution resistance
Rf i pore - resistance (pores in film)Cdl - double layer capacitanceR- polarization resistance
47

RA+ pore
RP
Figure 13. Simplified nested equivalent circuit for uncoupledGr/epoxy composite without calcareous deposit.
where Cd - double layer capacitanceR- polarization resistanceRfL+ p*re - resistance (solution + pores in film)
48

04
00
30050
0 $4
C 0)00
o 4500c
0 0)
CCU 0
E U a)
-a c 4)
C ~ -.00
0 -0 0i Uto 0 00
-r) co oJ g - 44co -C D0
00 0' Fn- 0n 0000 0 00 1 14)
0L 000 0co E 0 E -0U. 4z
0 X0LU 00 0 w5
o0a3 )
000 0000
'r449

0 r.0
0- ~43
/ C;
0:ý4.)ow0 0
00
I. 0
Q L I OD -/O %J- 0 0 4
0
00 >2I00
O ~4-30
4I 4.).
-4I
0 cc~
C4.
>11
00 1m
0 14>. L.4II I I I I N.)
05

(/) :3
0)
V
I.C) 000 C0
X C)
(is(1)
U x
L:) V e
ME CD 00 0LL- 14
C=)_
00
(),x
X- aCD c0 -Z:CL 2om
C-4C 0-0-E
c~~~= 0 0 m)C ~C)~C )C
a a a a (CD ) a
.,. coL
511

REFERENCES
1. Brown, S.R. and J.J. Deluccia, "Corrosion Characteristics of Naval
Aircraft Metals and Alloys in Contact with Graphite-Epoxy Composites," inProceedings of the Environmental Degradation of Engineering MaterialsConference, 10-12 October 1977, Virginia Polytechnic Institute and StateUniversity, pp. 277-288, Blacksburg, VA (1977).
2. Thompson, S.D., B.L. White, and J.A. Snide, "Accelerated CorrosionTesting of Graphite/Epoxy Composites and Aluminum Alloy Mechanically-Fastened Joints," AFWAL-TR-84-3115, (Jun 1985).
3. Bellucci, F. and G. Capobianco, "Corrosion Characteristics ofComposite/Metallic Material Couples," British Corrosion Journal, Vol. 24,No. 3, (1989).
4. Morris, A.W., "Electrochemical Screening of Fastener Materials forCarbon Composite Joint Applications," in Proceedings of the NationalAssociation of Corrosion Engineers Annual Conference, Corrosion '80,Chicago, IL (1980).
5. Miller, B.A. and S.C. Lee, "The Effect of Graphite-Epoxy Composites onthe Galvanic Corrosion of Aerospace Alloys," AFML-TR-76-121, (Sept 1976).
6. Hack, H.P. and A.B. Macander, "Relative Effects of a Graphite FiberReinforced Epoxy Composite and Nickel-Aluminum Bronze on a CathodicProtection System in Seawater," DTNSRDC/SME-81/73, (Nov 1981).
7. Murray, J.N. and H.P. Hack, "Electrochemical Impedance of Organic CoatedSteel; Final Report - Correlation of Impedance Parameters with Long-TermCoating Performance," DTRC-SME-89/76, (Sept 1990).
8. Humble, R.A., "Cathodic Protection of Steel in Sea Water With MagnesiumAnodes," Corrosion, Vol. 4, No. 7, pp. 358-370, (Jul 1948).
9. Fontana, M.G. and N.D. Greene. Corrosion Engineering, McGraw-Hill, NewYork (1978).
10. Bohlmann, R.E. and C.J. Frank, MOIST Users Manual for IBM PCs,McDonnell-Douglas Missile Systems Co., Missile Airframe Technology MAT TECHNote #MTN-88-08 (May 1988).
11. Williams, C.J. and K.L. Gipple, 'The Effect of Immersion PressureConditions on the Diffusion Characteristics and Mechanical Properties ofAS4/3501-6, S2/3501-6, and AS4/PEEK Composite Materials," DTRC-SME-91/15(Jan 1991).
12. Grahame, D.C., "The Electrical Double Layer and the Theory ofElectrocapillarity," Chem. Rev., Vol. 41, pp. 441-501 (1947).
13. Stern, M. and A.L. Geary, "Electrochemical Polarization 1. ATheoretical Analysis of the Shape of Polarization Curves," J. Electrochem.
53
Soc., Vol. 104, No. 1, pp. 53-63 (Jan 1957).
14. Davis, J.R., Ed. Metals Handbook. Vol, 13 Corrosion, ASMInternational, Ohio (1987).
15. Scully, J.R. "Bimetal and Multimetal Galvanic Corrosion PredictionUsing Long- and Short-Term Polarization Curves," DTNSRDC/SME-83-85 (Feb1984).
16. Bellucci, F., A. Di Martino, and C. Liberti, "Electrochemical Behaviourof Graphite-Epoxy Composite Materials (GECM) in Aqueous Salt Solutions,"Journal of Apvlied Electrochemistry, Vol. 16, No. 1, pp. 15-22 (Jan 1986).
17. Bellucci, F. "Galvanic Corrosion Between Nonmetallic Composites andMetals: I. Effect of Metal and of Temperature," Corrosion, Vol. 47, No. 10,pp. 808-819 (Oct 1991).
54
INITIAL DISTRIBUTION
CENTER DISTRIBUTION
CopiesCopies Code Name
6 NAVSEAI SEA 92RP (A. Spero) 1 0113 D. Winegrad
I SEA 92RL (M. Troffer) 1 0114 L. Becker
1 SEA 514 (J. Pinto) 1 0115 I.L. Caplan
1 SEA 5542 (W. Will) 1 17
1 SEA 55Y2 (D. Nichols) 1 1702 J.A. Corrado
1 PMS 395 (R. Nyers) 1 28 G.A. Wacker1 281 P.W. Holsberg
NSWC White Oak 1 281s M. Cropley
Code R31 (Augl) 1 283 H.H. Singerman1 284 E.C. Fischer
1 NRL 1 2801 D. VentriglioCode 6383 (Wolock) 8 2801 A.G.S. Morton
Code 6380 (Badaliance) 1 2802 G. Camponeschi1 2803 J.L. Cavallaro
1 USNA (Dr. D. Hasson) 1 2809 A.A. Malec1 2812 O.P. Arora
1 Office of Naval Technology 3 2813 R.J. Ferrara
800 N. Quincy Street 10 2813 D.M. AylorArlington, VA 22217 5 2813 J.N. MurrayAttn: Dr. L. Sloter, Code 225 1 2814 T.W. Montemarano
Mr. G. Remmers, Code 233 1 2815 R. Denale1 2844 V. Castelli
1 Office of Naval Research 1 2844 K. Gipple
Code 1131 1 2844 T. Juska800 N. Quincy Street 1 2844 C. WilliamsArlington, VA 22217 1 342.1 TIC(C)
Attn: Dr. A. John Sedkriks 1 342.2 TIC(A)2 3431 Office Services
Defense Advanced ResearchProjects Agency
Underwater Warfare Office3701 N. Fairax Drive
Arlington, VA 22217Attn: Mr. J. Kelly
Naval Underwater Systems CenterCode 8215
Bldg. 679Newport, RIAttn: Dr. Wayne Tucker
55
2 Institute for Defense Analysis 1 McDonnell Aircraft Co.1801 N. Beauregard Street MC 1021310Alexandria, VA 22311 P.O. Box 516Attn: Mr. Charles Bersch St. Louis, MO 63166
Mr. George Sorkin Attn: Mr. Don Palmer
McDonnell Aircraft Company 1 Center for NDEDepartment 356 The Johns Hopkins Univ.Mail Code 1021310, Maryland Hall 102P.O. Box 516 Baltimore, MD 21218
St. Louis, MO 63166-0516 Attn: Dr. Robert Creen, Jr.Attn: Dr. Raymond Bohlmann
ICI Composite Structures 1 PRC, Inc.2055 East Technology Circle UWO Support OfficeTempe, AZ 85284 4301 N. Fairfax DriveAttn: Mr. Brian Coffenberry Arlington, VA 22203
Attn: Ms. Tricia HankinsonMcDonnell Douglas Astrcnautics Co.5301 Bolsa Ave. 1 Hercules Aerospace Co.Huntington Beach, CA 92647 1800 K Street, NW-Attn: Dr. Longin Greszczuk Suite 710
Washington, DC 20006
1 General Dynamics Attn: Mr. Jeffrey HendrixElectric Boat DivisionMail Stop Jll-431 1 McDonnell Aircraft CompanyEastern Point Road D357, MC 1021310Groton, CT 06340 P.O. Box 516Attn: Mr. George Leon St. Louis, MO 63166
Attn: Mr. Pete Hoffman1 Hercules Composite Structures
Bacchus Works, MS XllK4 1 Touchstone Research Laboratory
P.O. Box 98 The Millennium CentreMagna, UT 84044-0098 Tridelphia, WV 26059Attn: Mr. R. Nuismer Attn: Mr. Brian Joseph
University of Tennessee 1 E.I. Dupont Denemours & Co.Oak Ridge National Laboratory Composite DivisionP.O. Box 2003 Chestnut Run PlazaOak Ridge, TN 37831-7294 Box 80702Attn: Dr. Jack Weitsman Wilmington, DE 19880-0702
Attn: Mr. Steven KopfGrumman Aircraft SystemsM/S AOI-1O 1 Coastal Systems StationBethpage, NY 11714-3582 Code 30EAttn: Mr. Richard Collins PaLiama City, FL 32407-5000
Attn: Mr. R.E. LovejoyDirector, Advanced Submarine ProgramsCortana Corporation 1 Grumman Aircraft Systems520 N. Washington Street M/S 844-35Falls Church, VA 22046 Bethpage, NY 11714-3582Attn: Dr. John V. Dugan, Jr. Attn: Mr. Jim Suarez
56
Lockheed Palo Alto Research LaboratoryOrg 93-30, Bldg. 2513251 Hanover StreetPalo Alto, CA 94303-1191Attn: Dr. Donald L. Flaggs
1 ICI Composite Structures2055 East Technology CircleTempe, AZ 85284Attn: Mr. Thomas Triplett
1 Casde Corporation2300 Shirlington RoadSuite 600Arlington, VA 22206Attn: Mr. Charles Zanis
2 DTIC
57
Form ADwroved
REPORT DOCUMENTATION PAGE Nr 4p 2 766
.-. E No - 0-078
-. d n-11- d c ,rP C C
H• a, 5,tl '2Lc - .-3C.
1. AGENCY USE ONLY ( eave Oiank) 2. REPORT DATE 3. RiPOfI TYP'E AND DATES COV.REDIJuly 19921
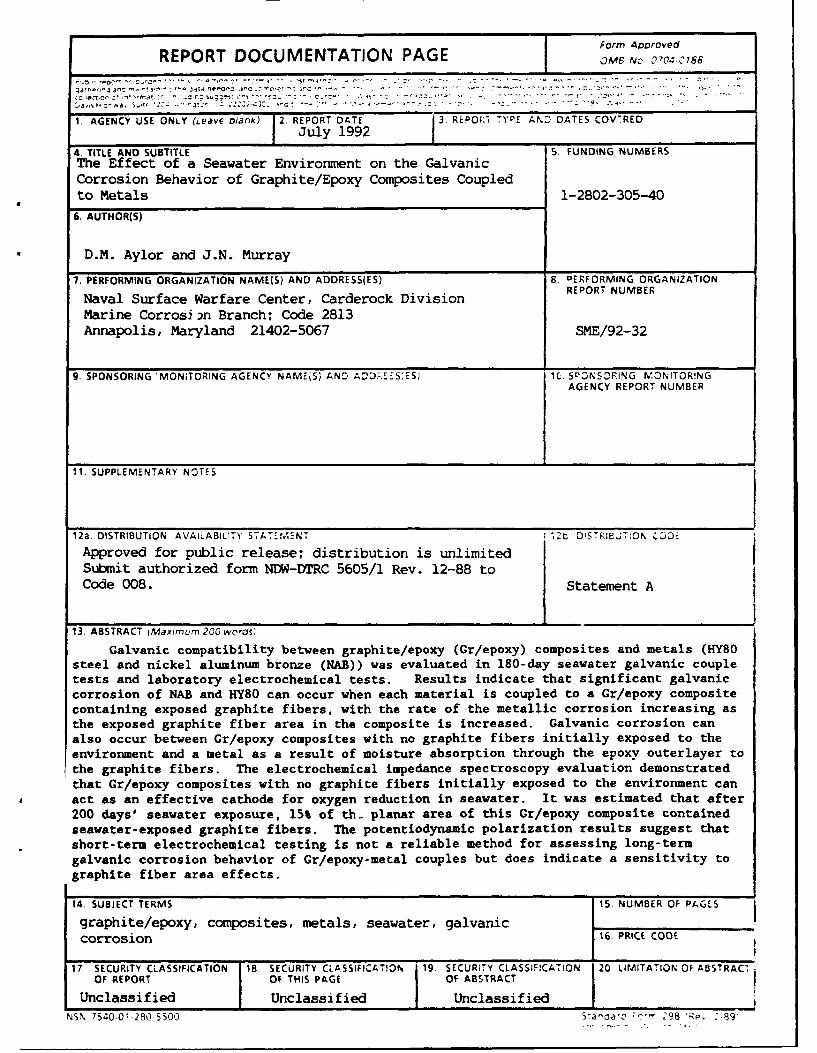
4. TITLE AND SUBTITLE 5. FUNDING NUMBERSThe Effect of a Seawater Environment on the GalvanicCorrosion Behavior of Graphite/Epoxy Composites Coupledto Metals 1-2802-305-40
6. AUTHOR(S)
D.M. Aylor and J.N. Murray
7. PERFORMING ORGANIZATION NAME(S) AND ADDRESS(ES) B. DERFORMING ORGANIZATION
Naval Surface Warfare Center, Carderock Division REPORT NUMBER
Marine Corrosj •n Branch; Code 2813Annapolis, Maryland 21402-5067 SME/92-32
9. SPONSORING 'MONITORING AGENCY NAME(S, AND AVDREESES; 1C. SPONSORING MONITORWNGAGENCY REPORT NUMBER
11. SUPPLEMENTARY NOTES
12a, DISTRIBUTION AVAILABIL!TY STATEt,,.1ENT 12t D!STRIEJT:OK C.D-
Approved for public release; distribution is unlimitedSubmit authorized form NDW-DTRC 5605/1 Rev. 12-88 toCode 008. Statement A
13. ABSTRACT (Maximum 200 words)
Galvanic compatibility between graphite/epoxy (Gr/epoxy) composites and metals (HY80steel and nickel aluminum bronze (NAB)) was evaluated in 180-day seawater galvanic coupletests and laboratory electrochemical tests. Results indicate that significant galvaniccorrosion of NAB and HY80 can occur when each material is coupled to a Gr/epoxy compositecontaining exposed graphite fibers, with the rate of the metallic corrosion increasing asthe exposed graphite fiber area in the composite is increased. Galvanic corrosion canalso occur between Gr/epoxy composites with no graphite fibers initially exposed to theenvironment and a metal as a result of moisture absorption through the epoxy outerlayer tothe graphite fibers. The electrochemical impedance spectroscopy evaluation demonstratedthat Gr/epoxy composites with no graphite fibers initially exposed to the environment canact as an effective cathode for oxygen reduction in seawater. It was estimated that after200 days' seawater exposure, 15% of th. planar area of this Gr/epoxy composite containedseawater-exposed graphite fibers. The potentiodynamic polarization results suggest thatshort-term electrochemical testing is not a reliable method for assessing long-termgalvanic corrosion behavior of Gr/epoxy-metal couples but does indicate a sensitivity tographite fiber area effects.
14. SUBJECT TERMS 15. NUMBER OF PAGES
graphite/epoxy, composites, metals, seawater, galvaniccorrosion 16. PRICE CODE
17. SECURITY CLASSIFICATION 18 SECURITY CLASSIFICATION 19. SECUR;TY CLASSIFICATION 20. LIMITATION OF ABSTRAC.OF REPORT OF THIS PAGE OF ABSTRACT
Unclassified Unclassified UnclassifiedNSN. 7540-01-280-5500 5:a-oa-,- Z--• ;98 (RP. _-89,


![Study on the Galvanic Corrosion Behavior of Q235 /Ti Couple ...Galvanic corrosion is an enhanced corrosion [4], which easily occurs when two or more different metals or alloys are](https://img.pdfslide.us/doc/110x75/60e7b2a036db1939922a458e/study-on-the-galvanic-corrosion-behavior-of-q235-ti-couple-galvanic-corrosion.jpg)