Embed Size (px)
Citation preview

USING THE CALIFORNIA RAPID ASSESSMENT METHOD (CRAM) FOR PROJECT ASSESSMENT AS AN ELEMENT OF REGULATORY, GRANT, AND OTHER MANAGEMENT PROGRAMS
TECHNICAL Bulletin – Version 2.0
PR E P A R E D B Y :
California Wetland Monitoring Workgroup Workgroup of the California Water Quality Monitoring Council
September 2019


Disclaimer This technical bulletin was prepared by the California Wetland Monitoring Workgroup to provide guidance on the application of California Rapid Assessment Method (CRAM) for project assessment. The recommendations are based on the technical construct, features, and in some cases, limitations of CRAM as well as accepted statistical and assessment practices. Use of CRAM consistent with this technical bulletin will ensure rigorous application and scientifically sound and defensible results consistent with the CRAM conceptual model and methodology. However, the recommendations in this bulletin are not binding, and final decisions regarding use of CRAM will be at the discretion of the relevant regulatory, grant-funding, or management agencies.
Recommended Citation California Wetland Monitoring Workgroup (CWMW). 2019. Using the California Rapid Assessment Method (CRAM) for Project Assessment as an Element of Regulatory, Grant, and other Management Programs. Technical Bulletin – Version 2.0, 85 pp

Using CRAM for Project Assessment i June 2019
Contents
List of Tables and Figures .......................................................................................... iii List of Acronyms and Abbreviations ........................................................................... v
Page
Glossary of Terms ....................................................................................................... vii Acknowledgements ...................................................................................................... ix
Summary of Recommendations.................................................................................. xi Chapter 1 Introduction and Goals ............................................................................. 1-1
1.1 U.S. Environmental Protection Agency Level 1-2-3 Monitoring Framework .............................................................................................................. 1-1 1.2 Existing Tools that Support the Level 1-2-3 Framework ......................... 1-2 1.3 Background on CRAM ............................................................................ 1-4 1.4 CRAM Development, Review, and Revisions ......................................... 1-6 1.5 Interagency Coordination and Policy Considerations ............................. 1-7
Chapter 2 General CRAM Application ....................................................................... 2-9 2.1 Appropriate Wetland and Stream Types for CRAM Assessments .......... 2-9 2.2 Appropriate Uses of CRAM ................................................................... 2-10 2.3 Inappropriate Uses of CRAM ................................................................ 2-12 2.4 Modifying CRAM Methodology ............................................................. 2-13 2.5 Multiplying CRAM Scores Size ............................................................. 2-13 2.6 Process to Address Technical Issues with CRAM ................................ 2-14 2.7 Addressing Multiple Versions of CRAM ................................................ 2-14 2.8 The Meaning of CRAM Scores ............................................................. 2-15
Chapter 3 CRAM Quality Assurance ......................................................................... 3-1 3.1 General Quality Assurance Requirements for CRAM Assessments .......................................................................................................... 3-1 3.2 CRAM Precision ..................................................................................... 3-1 3.3 Requirements for Practitioner Expertise and Training............................. 3-3 3.4 Reducing Practitioner Variability ............................................................. 3-4 3.5 CRAM Reporting and Submission of CRAM Scores ............................... 3-5
Chapter 4 Specific Guidance for Conducting Wetland Assessments .................... 4-1 4.1 Defining Wetland and Stream Condition Classes ................................... 4-1
California Wetland Monitoring Workgroup
Contents
Using CRAM for Project Assessment ii June 2019
4.2 Defining Reference Condition ................................................................. 4-2 4.3 Determining an Assessment Area .......................................................... 4-4 4.4 Boundaries in Relation to Uplands and Jurisdictional Wetlands ............. 4-6 4.5 Seasonal Variability of CRAM Assessments ........................................... 4-7 4.6 Comparing Scores across CRAM Types ................................................ 4-8 4.7 Type Conversion ..................................................................................... 4-8
4.7.1 Natural Type Conversion ................................................................... 4-9 4.7.2 Planned Anthropogenic Type Conversion ....................................... 4-10
4.8 Assessing Illegal Impacts ...................................................................... 4-11 4.9 Assessing Projects ............................................................................... 4-12
4.9.1 Assessing Small Projects ................................................................ 4-12 4.10 Comparing to Ambient Conditions ........................................................ 4-19 4.11 Temporal Comparisons ......................................................................... 4-21 4.12 Assessing Project Progress .................................................................. 4-22 4.13 Assessing Ambient Change .................................................................. 4-26 4.14 Estimating CRAM Scores ..................................................................... 4-28
4.14.1 How to Extrapolate or Interpolate CRAM Scores ............................ 4-28 4.14.2 How to Forecast or Hindcast CRAM Scores .................................... 4-29
Chapter 5 Conclusions and Additional Resources .................................................. 5-1
Chapter 6 References ................................................................................................. 6-1 Appendix A Summary of CRAM External Reviews and Peer-Reviewed Documents ................................................................................................................. 1 Appendix B Detailed Procedure for Assessing Large Wetlands and Large Projects ...................................................................................................................... 1 Appendix C Example Comparisons Within and Between Wetlands and Streams ..................................................................................................................... 1

California Wetland Monitoring Workgroup
Contents
Using CRAM for Project Assessment iii June 2019
Tables and Figures
Table Page 1 The CRAM Wetland Typology/Wetland Types for which CRAM Modules Currently
Exist ................................................................................................................... 2-10 2 The 90% Confidence Intervals of CRAM Scores to Address Two Different
Analytical Questions: (A) Is one score different than another? (B) Does a score represent poor, fair, or good condition?................................................................ 3-2
3 Recommended Maximum and Minimum AA Sizes and Preferred Size for Each Wetland Type .......................................................................................................4-4
4 CRAM Index and Attribute Scores for Year 1 and Year 5 of the Corte Madera Marsh Restoration Project .................................................................................. 4-24

California Wetland Monitoring Workgroup
Contents
Using CRAM for Project Assessment iv June 2019
Figure Page 1. The Organizational Structure of California’s Wetland and Riprarian Area Monitoring Plan .............................................................................................................................. 1-8 2. Trends in the Condition of a Hypothetical Wetland Area Gradually Converted from One Wetland Type to Another, Showing Decreasing Conditions for the Converted Type and Increasing Conditions for the Restored Type, After the Conversion Is Completed...................................................................................................................4-10 3. Trends in the Condition of a Hypothetical Wetland Area Abruptly Converted from One Wetland Type to Another ............................................................................................ 4-11 4. Small Project Example: Bridge Expansion in Estuary............................................4-14 5. Small Project Example: Small Riverine Restoration ............................................... 4-15 6. Small Project Example: Small Depressional Restoration........................................4-167. Example Sample Draw........................................................................................... 4-198. Cumulative Distribution Functions (CDFs) Can Be Plotted Over Condition Classes to Compare Different Areas of Interest........................................................................... 4-21 9. Statewide Habitat Development Curves for Estuarine Wetlands............................ 4-2310. Number Line Graph Showing CRAM Index and Attribute Scores with Their Precision Ranges for Year 1 and Year 5 of the Corte Madera Marsh Restoration Project, Superimposed on Standard Condition Classes (Poor, Fair, Good) ............................ 4-2411. CRAM Index Scores for Year 1 and Year 5 of the Corte Madera Marsh Restoration Project Plotted on the Statewide Habitat Development Curve (HDC) for Estuarine Wetlands .................................................................................................................... 4-2512. Year 1 and Year 5 Index Scores for the Corte Madera Marsh Project Plotted on the Cumulative Distribution Function (CDF) Curve of Ambient Overall Condition of Estuarine Wetlands in the San Francisco Bay Eco-Region........................................................ 4-2613. Intended Improvement in the Overall Watershed Condition or Functional Capacity of Riverine Wetlands in a Central Coast Watershed ...................................................... 4-2714. Boxplots showing the Measured Current...............................................................4-3215. Current “Pre-construction” and Forecasted Future “Post-construction” CRAM Index Scores for a Flood Control and Habitat Improvement Project in a Central Coast Watershed...................................................................................................................4-33
California Wetland Monitoring Workgroup
Contents
Using CRAM for Project Assessment v June 2019
Acronyms and Abbreviations
AA Assessment Area ASC Algal Stream Condition Index CARI California Aquatic Resources Inventory CDF Cumulative Distribution Function CDFW California Department of Fish and Wildlife CEDEN California Environmental Data Exchange Network CFD cumulative frequency distribution CI Confidence Interval CRAM California Rapid Assessment Method CSCI California Stream Condition Index CWMW California Wetland Monitoring Workgroup EPA U.S. Environmental Protection Agency ERDC Engineering Research and Development Center GIS geographic information system ha hectares HDCs Habitat Development Curves NWI National Wetland Inventory QA/QC Quality Assurance/Quality Control RipRAM Riparian Rapid Assessment Method for California SD standard deviation SWRCB State Water Resources Control Board USACE U.S. Army Corps of Engineers USFWS U.S. Fish and Wildlife Service WRAMP Wetland and Riparian Area Monitoring Plan

Using CRAM for Project Assessment vii June 2019
Glossary of Terms
Ambient Condition – Condition of one more wetlands in a specified geographic area, such as a watershed or ecoregion. An initial ambient assessment provides a baseline for assessing change in ambient condition over time.
Assessment Area (AA) – The fundamental spatial unit for California Rapid Assessment Method (CRAM) assessments. The AA is the area of a wetland that is assessed using CRAM.
Attribute – Attributes constitute the universal aspects of wetland condition. CRAM recognizes four attributes of wetland condition: (1) buffer and landscape context, (2) hydrology, (3) physical structure, and (4) biotic structure.
Attribute Score – The score for one CRAM Attribute of an AA, as calculated from the component Metrics Scores.
Condition – The state of one or more wetlands based on the CRAM Index Score, which represents the overall condition or functional capacity of the wetland(s).
Condition Classes – Mutually exclusive sub-ranges of the full range of possible CRAM Index Scores representing categories of condition, such as poor, fair, and good. Condition Classes are a way to bin CRAM scores to facilitate reporting, comparison, and evaluation.
Cumulative Distribution Function (CDF) – Distribution of AAs within the observed range of CRAM Metric Scores, Attribute Scores, or Index Scores for one or more wetlands. When based on a probabilistic survey, a CDF indicates the likelihood of any condition existing within the total wetland area surveyed, and the proportion of the area likely to have conditions above or below any particular score.
Ecosystem Services – The conditions and processes of ecosystems that generate benefits for people.
Ecosystem Values – The worth (monetary or otherwise) assigned to ecosystem services; includes both direct use and non-use “passive values.”
eCRAM – Online database of CRAM scores.
Estimated CRAM Score – A score that is not based on empirical observation. CRAM scores can be estimated by extrapolation, interpolation, hindcasting, or forecasting.
Function – Rate of ecological processes performed by a wetland area over time. Functions of ecosystems are value-neutral.

California Wetland Monitoring Workgroup
Glossary of Terms
Using CRAM for Project Assessment viii June 2019
Functional Capacity – A wetland area’s potential to perform its intrinsic physical, chemical, biological, and ecological functions.
Habitat Development Curve (HDC) – Tool to forecast the rate at which a wetland is likely to improve in condition, relative to the desired or reference condition, due to the development of its physical and biological attributes.
Index Score – The CRAM score representing the overall condition or functional capacity of an AA, as calculated from the component Attribute Scores.
Level 1-2-3 Framework – Tiered approach to assess wetland condition and stress. Level 1 data include maps, imagery, and inventories of wetland resources, assessment sites, data sources, etc., plus any qualitative or quantitative measures of condition derived from such data. Level 2 data include field-based, semi-quantitative and qualitative rapid assessments. Level 3 data include all field-based quantitative assessments.
Metric – Aspect of a CRAM Attribute that is assessed based on visible indicators.
Metric Score – The score for one CRAM Metric of an AA, as determined from metric-specific indicators and their scoring tables.
Mitigation Project – Project required by a regulatory agency to offset permitted impacts on wetlands. Mitigation Projects can include wetland establishment (creation), re-establishment (restoration), rehabilitation, and enhancement.
Practitioner – An individual who has completed a 5-day CRAM training course and is using CRAM. A list of trained practitioners is maintained on the CRAM website (www.cramewetlands.org).
Project – Any human activity that results in a change in the location, abundance, extent, form, structure, or condition of a wetland.
Reference Site – A wetland that exhibits good, best achievable, or desired condition, based on CRAM scores, to which other wetlands can be compared. (See Section 4.2, Defining Reference Condition.)
Restoration Project- For the purposes of this document, restoration project refers to non-mitigation projects. Restoration Projects can include wetland establishment (creation), re-establishment (restoration), rehabilitation, and enhancement.
Using CRAM for Project Assessment ix June 2019
Acknowledgements
Many individuals provided valuable input and feedback on use of the California Rapid Assessment Method (CRAM) since issuance of the 2009 Technical Bulletin. We acknowledge and thank them for their insightful comments and commitment to improving assessment of aquatic resources in California. The principle authors of this document are listed below:
l Eric D. Stein – Southern California Coastal Water Research Project
l Josh Collins – San Francisco Estuary Institute and Aquatic Science Center
l Sarah Lowe – San Francisco Estuary Institute and Aquatic Science Center
l Sarah Pearce – San Francisco Estuary Institute and Aquatic Science Center
l Kevin O’ Connor – Central Coast Wetlands Group at Moss Landing Marine Labs
l Cara Clark – Central Coast Wetlands Group at Moss Landing Marine Labs
l Lindsay Teunis – ICF
l Linnea Spears-Lebrun – ICF
l Melissa Scianni – U.S. Environmental Protection Agency, Region IX
The content of this technical bulletin was reviewed by the California Wetlands Monitoring Workgroup and its subcommittees, which include representatives of agencies, universities, private sector (consultants), and non-governmental organizations. Federal and state agencies represented include:
Federal Agencies l U.S. Fish and Wildlife Service
l U.S. Forest Service
l National Oceanic and Atmospheric Administration, National Marine Fisheries Service
l U.S. Army Corps of Engineers
l U.S. Environmental Protection Agency
l National Park Service
l U.S. Department of Agriculture Natural Resources Conservation Service
California Wetland Monitoring Workgroup
Glossary of Terms
Using CRAM for Project Assessment x June 2019
State Agencies l State Water Resources Control Board
l Regional Water Quality Control Boards
l California Department of Fish and Wildlife
l State Coastal Conservancy
l California Natural Resources Agency
l California Department of Water Resources
l California State Parks
l Delta Conservancy
The contents of this document do not constitute official policy of any agency. Individual project decisions will be made on a case-by-case basis at the discretion of the agencies.
Funding for this effort was provided by the U.S. Environmental Protection Agency, Region IX.

Using CRAM for Project Assessment xi June 2019
Summary of Recommendations
The California Rapid Assessment Method (CRAM) is a tool for assessing the condition of wetlands and streams at scales ranging from individual projects to watersheds, regions, and statewide. CRAM, alone or with other assessment methods, can be used to assess current conditions, understand potential factors impacting wetland/stream condition, evaluate alternative project sites and designs, and assess project performance. CRAM should be regarded as an integral component of a suite of monitoring methods. CRAM, by itself, is rarely adequate to assess all the aspects of condition for any wetland or stream and cannot be used as the sole method to evaluate restoration design. CRAM is most useful when applied as part of an integrated wetland or stream assessment program that includes both rapid and detailed assessment methods.
l Wetland Assessment in California should be consistent with the Tenets of the State Wetland and Riparian Monitoring Program (WRAMP): https://mywaterquality.ca.gov/monitoring_council/ wetland_workgroup/docs/2010/tenetsprogram.pdf. WRAMP is based on the U.S. Environmental Protection Agency’s (EPA’s) three-tiered monitoring framework: landscape assessment, rapid assessment, and intensive condition or functional assessment. CRAM can serve as a rapid assessment tool under WRAMP.
l CRAM should be conducted by trained practitioners consistent with all quality control measures developed for the CRAM program (https://www.cramwetlands.org/training).
l For those modules for which eCRAM1 is available, CRAM data should be uploaded to the eCRAM database to contribute to the statewide dataset (https://www.cramwetlands.org/dataentry) where it can ultimately be used in concert with a variety of other geospatial and condition data through the EcoAtlas portal (https://www.ecoatlas.org/). Only scores that are consistent with all quality assurance/quality control (QA/QC) requirements should be used to support regulatory and grant funding decisions; entry into eCRAM, for modules supported by eCRAM, is strongly encouraged.
The following summary recommendations from this Technical Bulletin pertain to technical concerns highlighted by CRAM practitioners and agency staff in recent years. These recommendations are consistent with, but do not substitute for, any CRAM training, the CRAM Manual, CRAM Module Field Books, or the rest of this Technical Bulletin. This Technical Bulletin assumes that the reader is a trained CRAM practitioner and/or has completed a Manager Level Training. Full
1 eCRAM is the electronic (online) CRAM database.

California Wetland Monitoring Workgroup
Summary of Recommendations
Using CRAM for Project Assessment xii June 2019
understanding of these recommendations requires studying this Technical Bulletin and the other CRAM supporting materials in their entirety.
A. Meaning of CRAM (Section 1.3, Background on CRAM, and Section 2.8, The Meaning of CRAM Scores) 1. CRAM Index Scores use overall condition of a wetland or stream to represent its
capacity to perform a suite of intrinsic ecological functions. CRAM does not measure functions, although one can infer whether certain functions are, or are not, likely to occur based on a CRAM score.
2. CRAM Attribute Scores represent the capacity of a wetland or stream to perform a particular subset of these intrinsic ecological functions.
3. The functions represented by the Index Scores and Attribute Scores vary among aquatic resource types.
4. For any given type, the sets of functions represented by the Attribute Scores overlap.
5. For any given type, increasing scores indicate an overall increase in functional capacity, but not necessarily an increase in all functions in the Assessment Area (AA).
6. Other methods besides CRAM are needed to identify and assess the intrinsic functions of a wetland or stream and to quantify the levels of those functions.
B. Modifying CRAM (Section 2.4, Modifying CRAM Methodology, and Section 2.5, Multiplying CRAM Scores by Wetland Size) 1. Under no circumstances should a CRAM assessment involve any modifications
of CRAM metrics, attributes, scoring tables, or scoring procedures. Modified versions of CRAM are not CRAM.
2. CRAM scores must not be multiplied by any measure of AA size or wetland size. The resulting product does not represent the actual relationship between wetland size and functional capacity for any wetland type.
3. CRAM assessments should be based on existing conditions at the site at the time of the assessment. Past conditions should not influence how a CRAM metric is scored. Similarly, anticipated future changes to site conditions should not influence the CRAM score.
4. CRAM may be used in a prospective manner to project potential future condition based on known (e.g., project designs) or hypothesized (climate change) factors (see discussion on CRAM Projections below). Note that estimations and projections of CRAM scores should never be entered in eCRAM.
California Wetland Monitoring Workgroup
Summary of Recommendations
Using CRAM for Project Assessment xiii June 2019
C. Choosing CRAM Modules (Section 2.1, Appropriate Wetland and Stream Types for CRAM Assessments) Different modules exist for different aquatic resource types. Each module is supported by a field book specific to that module. The determination of wetland and stream type and module selection is rarely uncertain. If classification of a wetland or stream is unclear after application of the CRAM classification flow chart, apply the modules that might be applicable to the problematic AA, and select the module providing the highest Index Score. Be sure to fully document the rationale behind the module choices. Note that some sites do not fit any CRAM classification and should not be assessed with CRAM; e.g., sites that are a transition zone between two wetland classes.
D. Determining CRAM Assessment Areas (Section 4.3, Determining an Assessment Area, and Section 4.9, Assessing Projects) 1. Guidelines for minimum or maximum AA size are set in the field books for each
CRAM module; for some modules, no minimum is specified.
2. If a project is smaller than the minimum required or recommended size for an AA but exists as part of a larger wetland or stream that can accommodate the minimum size, the AA should be extended outside the project boundary and include some of the adjacent area to meet the minimum AA size requirement. For projects that only affect a portion of the AA, the project may be too small to substantially influence the CRAM score. In this situation, a different assessment tool may be necessary to determine project effects.
3. CRAM should not be used to assess a wetland or stream that is smaller than the minimum specified AA size. This would apply where the AA encompasses the entire wetland (i.e., there is no adjacent wetland area), and the size is below the minimum specified AA size.
4. CRAM AAs do not follow or substitute for any jurisdictional determination of aquatic resources of any government agency. The extent of CRAM AAs may occasionally be similar to the extent of jurisdiction of a regulatory agency, but any such occurrences are coincidental and not inherent in the rules for establishing AAs.
E. Deciding Condition Classes (Section 4.1, Defining Wetland Condition Classes) 1. Three standard condition classes (poor, fair, good), are defined as the tertiles
(three equal sub-ranges) of the maximum range of possible CRAM Index Scores based on the internal CRAM reference. That is, poor condition scores range from 25 to 50; fair condition scores range from 51 to 75, and good condition scores are greater than 75.

California Wetland Monitoring Workgroup
Summary of Recommendations
Using CRAM for Project Assessment xiv June 2019
2. At a regional, watershed, or local level, other condition classes can be defined, based on other percentiles of the range in scores, statistically or graphically defined breaks in scores, or subdivisions of the standard classes.
F. Comparing Wetland or Stream Types (Section 4.6, Comparing Scores Across Wetland or Stream Types, and Section 4.7, Type Conversion) 1. Two wetlands or streams of different types with the same CRAM score have the
same overall functional capacity relative to their respective reference standards. Because different types of wetlands and streams perform different functions and the CRAM internal reference standard varies by aquatic resource type, a simple comparison of CRAM scores across type can be informative but does not provide a complete assessment of the functions being performed by each type.
2. CRAM can be used to track the effects of type conversion. This involves pre- and post-conversion assessments, which would involve applying two different CRAM modules.
3. A complete assessment of wetland or stream conversion will need to consider information developed through Level 1, 2, and 3 assessments.
G. Comparing Ambient Conditions (Section 4.10, Comparing a Wetland or Stream to Ambient Conditions) For any ambient survey, compare the percentage of CRAM scores within the standardized condition classes (as described in E above; i.e., poor, fair, good), defined as the tertiles of the range in potential scores. Condition classes may be adjusted based on regional, watershed, or local ambient surveys.
H. Defining Reference Conditions (Section 2.8, The Meaning of CRAM Scores, and Section 4.2, Defining Reference Conditions) There are several definitions of reference relevant for CRAM. The use of these (or any other) reference definition is at the discretion of the individual agency. However, the definitions below are consistent with best practices of aquatic resource monitoring and assessment. CRAM scores should only be compared to reference sites of the same wetland/stream type.
l CRAM Internal Reference Standard – The natural biological condition of a wetland/stream, undisturbed by human activity. It is considered the absolute “natural” or pristine condition that is known to exist in California in the absence of all human disturbances.
l CRAM Reference Site – A single wetland/stream site with a CRAM score in the upper tertile due the lack of apparent anthropogenic stress. A CRAM reference site serves as a standard or benchmark to which the condition of other

California Wetland Monitoring Workgroup
Summary of Recommendations
Using CRAM for Project Assessment xv June 2019
wetland/stream areas of the same type can be compared. However, use of a reference range based on several sites is preferred to use of a single site and score.
l CRAM Reference Range – A set of wetlands/streams (typically three or more) of a given type that are in the upper tertile and that collectively provide a range of scores that can be used to establish regulatory or management targets. For regional or ambient assessments, the reference range should include a larger number of sites (typically at least 10).
l Historical Reference Condition – The condition of a wetland/stream at some past time as interpreted from historical records or from remains (e.g., pollen or diatoms in lake sediments). The data used to construct this condition are often difficult to obtain and highly variable. Also, as with empirical assessments, they are static in the sense that they only provide a snapshot of condition at that particular time in history. Due to existing constraints and changes in the landscape over the last few centuries, many restoration projects cannot reach historical reference conditions, but they can use them as a guide to inform design and management opportunities, and potentially estimate scores where local project reference sites are not available.
l Project Reference Site – Site used to establish a regulatory or management objective specific to the individual project. The site may or may not be within CRAM reference range. Project reference sites typically represent existing condition (i.e., pre-impact), best achievable (i.e., the highest possible following implementation of best management practices and other rehabilitation activities), or natural conditions in the landscape with little or no anthropogenic stressors (i.e., what the project site could be if stressors were removed).
I. Comparing Projects or Other Individual Wetlands or Streams to Ambient Conditions (Section 4.10, Comparing a Wetland to Ambient Conditions) CRAM comparisons can be made by plotting project scores on a Cumulative Distribution Function (CDF) plot of scores provided by a probabilistic survey for wetlands/streams of the same type in the same geographic area of interest.
J. Comparing CRAM Scores (Section 3.2, CRAM Precision, and Section 4.10, Comparing a Wetland or Stream to Ambient Conditions) The overall precision of CRAM has been estimated from inter-calibration studies at multiple wetland and stream types and should be taken into account when comparing scores. Based on these studies, there is 90% confidence that an Index Score is significantly greater than another Index Score if the score is ≥7 points different. Similarly, there is 90% confidence that an Index Score is in Fair ecological
California Wetland Monitoring Workgroup
Summary of Recommendations
Using CRAM for Project Assessment xvi June 2019
condition if it is ≥55 (5 points above the poor/fair threshold of 50). For additional comparisons and statistical analysis at the project level, CRAM data should be checked for normality before parametric tests are used. If the data are not normal, transformations or non-parametric tests should be used.
K. Assessing Project Performance (Sections 4.10, Comparing a Wetland or Stream to Ambient Conditions, 4.11, Temporal Comparisons, and 4.12, Assessing Project Progress) Project performance can be evaluated in several ways. These approaches are presented in order of preference based on the degree that they rely on data-driven relationships. Agencies may use other approaches at their discretion:
1. Plot project Attribute Score or Index Score on the relevant Habitat Development Curve (HDCs) to assess the trajectory of projects relative to the reference range defined by the HDC. Project scores may be for existing conditions or projected for future conditions. It can be assumed that projects having scores that plot on or above the HDC are on a trajectory toward reaching reference condition. The HDC can be used to project when in the future the reference condition is likely to be achieved.
2. Plot project Attribute Score or Index Score on the relevant CDF to assess the project contribution to ambient condition. Project scores may be for existing conditions or projected for future conditions. Project scores above the 50th percentile score can be assumed to contribute to better ambient conditions.
3. Comparison to an individual reference site or reference range (as defined above).
L. Projection of CRAM Scores (Section 4.14, Estimating CRAM Scores) 1. CRAM scores may be projected by practitioners or regulators as a planning
exercise when evaluating conceptual restoration/mitigation options or when assessing potential impacts as part of an impact or alternatives analysis. Projected scores may be used to inform determination of mitigation ratios (or requirements), but this should be done in consideration of the uncertainty associated with estimating future scores.
2. CRAM scores should be projected with caution. All projected scores have less certainty or reliability than empirical scores and should be treated as hypotheses.
3. Projected scores should be reported as such, and their supporting data and underlying assumptions should be identified. Regression analysis can be used to extrapolate or interpolate scores along a gradient of condition defined by existing empirical CRAM scores. Extrapolated and interpolated scores should be reported with the margins of error and confidence intervals of their estimates.

California Wetland Monitoring Workgroup
Summary of Recommendations
Using CRAM for Project Assessment xvii June 2019
4. Future CRAM scores can be forecasted for impact sites and restoration/mitigation projects based on detailed site information and project designs. Forecasted scores should be regarded as preliminary until they can be replaced in the future with empirical assessments.
5. Projected scores should not be added to the eCRAM database.
M. Using the CRAM Database (Section 3.5, CRAM Reporting and Submission of CRAM Scores)
1. Every qualified CRAM assessment should be uploaded promptly into the online eCRAM database at www.cramwetlands.org. This is the only means by which anyone other than the person who produced the score can be assured of its integrity.
2. Users or reviewers of CRAM scores should avoid reliance on CRAM scores for regulatory or management decisions if the scores are not available through the eCRAM database at www.cramwetlands.org, because the essential quality assurance steps that come with eCRAM submittal would not be available to those users and reviewers. When eCRAM data are not available, users or reviewers should exercise caution. Trained practitioners should perform the data quality assurance steps that would otherwise have been conducted as part of an eCRAM submittal.

Using CRAM for Project Assessment 1-1 June 2019
Chapter 1 Introduction and Goals
The purpose of this document is to guide consistent and appropriate application of the California Rapid Assessment Method (CRAM) for wetland and stream restoration projects, mitigation projects, development projects, and ambient or baseline assessments across private, local, state, tribal and federal programs. For the purposes of this document, restoration refers to non-mitigation projects, but both mitigation and restoration can include wetland or stream establishment (creation), re-establishment, rehabilitation, and enhancement. This document does not constitute official guidance or policy by any agency; rather it provides recommendations based on best available science for a set of recently identified technical issues and considerations. This document cannot anticipate every situation or contingency that may arise in the regulatory or other wetland protection or restoration programs. Users are encouraged to consult with agency staff on questions regarding use of CRAM for regulatory or non-regulatory governmental programs. This Technical Bulletin will be updated in the future as needed to address future CRAM technical issues and considerations.
1.1 U.S. Environmental Protection Agency Level 1-2-3 Monitoring Framework
A common set of monitoring and assessment tools is needed to coordinate the various and numerous wetland and stream restoration and protection policies operating at all levels of government within California. A primary objective of this coordination is to assure monitoring data can be compiled through space and time to meet as many data needs as possible.
In 2003, a consortium of federal, state, and local scientists and managers began working to develop a framework and consistent set of tools to support wetland and riparian monitoring and assessment across a variety of agency programs. The overall goal of this effort is to provide tools to assist in making informed decisions regarding wetland, stream, and riparian resource protection and management, and to improve coordination and efficiency of various state and federal programs. This conceptual approach and collection of existing wetland and riparian assessment tools is modeled after the U.S. Environmental Protection Agency (EPA) Level 1-2-3 framework for monitoring and assessment of wetland resources. The fundamental elements of this framework are:

California Wetland Monitoring Workgroup
General CRAM Application
Using CRAM for Project Assessment 1-2 June 2019
l Level 1 consists of map-based landscape and watershed-scale inventories and analytics of wetlands, rivers, streams, and riparian areas, plus related projects that have a direct effect on the distribution, abundance, diversity, and condition of these habitats. Level 1 maps can serve as the basis for landscape and watershed profiles of wetland and stream systems, and as sample frames for surveys of condition based on Level 2 and Level 3 tools.
l Level 2 consists of rapid, field-based, assessments of the overall condition or functional capacity of wetlands/streams and/or their likely stressors. Level 2 results can be used to cost-effectively survey the overall condition of wetlands and streams across a broad range of scales, from individual wetlands/streams to watersheds, regions, and statewide.
l Level 3 consists of quantitative measurement of specific wetland and stream functions or stressors. Level 3 results can be used to calibrate and validate results from Level 2 assessments.
1.2 Existing Tools that Support the Level 1-2-3 Framework
The most commonly used tools of the Wetland and Riparian Area Monitoring Plan (WRAMP) are as follows.
l Level 1: standardized wetland, stream, riparian, and vegetation mapping methodologies—such as the National Wetland Inventory (NWI), the California Aquatic Resources Inventory (CARI), VegCAMP, and Project Tracker of the EcoAtlas information system—provide Level 1 wetland data.
l Level 2: the CRAM and the Riparian Rapid Assessment Method for California (RipRAM).
l Level 3: traditional assessments such as macroinvertebrate and algae indices of biotic integrity for wadable streams and depressional wetlands, the California Stream Condition Index (CSCI), the Algal Stream Condition Index (ASCI), standardized water chemistry and toxicity assessment methods, geomorphic or hydraulic surveys, plant surveys, or vertebrate surveys. The California Environmental Data Exchange Network (CEDEN) provides access to Level 3 water quality monitoring data collected using established protocols.
The Level 1, 2, and 3 tools are intended to be used together for a broad range of ambient and project-specific wetland monitoring and assessment purposes, based on the WRAMP.
WRAMP is produced by the California Wetland Monitoring Workgroup (CWMW), which was established by Senate Bill 1070, and is endorsed by the California Water

California Wetland Monitoring Workgroup
General CRAM Application
Using CRAM for Project Assessment 1-3 June 2019
Quality Monitoring Council to provide for comprehensive monitoring and assessment of aquatic resources using a watershed or landscape context.
This Technical Bulletin recognizes many regulatory and other applications of the WRAMP framework and toolset, including:
l Impact assessment
l Mitigation planning
l Alternatives analysis
l No net loss evaluation
l Climate change planning and response
l Evaluation of wetland protection and restoration projects, programs, and policies
Ambient Assessment: Ambient assessment refers to the characterization of the baseline conditions of wetlands and streams in a specified area, such as a watershed or eco-region. An ambient assessment can cover all types of wetlands and streams in the area or a subset of types. It can be based on an exhaustive survey of all the selected aquatic resource types or probabilistic sample of them. An ambient assessment relies on an adequate map of wetlands and streams that serves to guide the survey or sample. In California, the best available wetland map is the California Aquatic Resource Inventory (CARI), which consists of the best available local, regional, state, and federal data. An ambient survey typically provides information on the distribution, abundance, and condition of the selected aquatic resource types.
It is recognized that Level 1 and 2 tools, especially Project Tracker and CRAM, are being incorporated into regional ambient monitoring programs, such as the Southern California Integrated Wetlands Regional Assessment Program, the Bay Area Wetlands Regional Monitoring Program, the Tahoe Regional Monitoring Program, and the California Surface Water Ambient Monitoring Program. These tools are being tested for some regulatory and management requirements, such as U.S. Clean Water Act Section 404 permits and Section 401 Water Quality Certifications, California State Waste Discharge Requirements, restoration or mitigation site evaluation, and general resource or watershed planning.
Watershed Approach: WRAMP supports the watershed approach to wetland monitoring and assessment called for by the U.S. Army Corps of Engineers (USACE)/EPA mitigation regulations of 2008 and the California Procedures for Discharges of Dredged or Fill Material to Waters of the State (formerly known as the Wetland and Riparian Area Protection Policy for California). The CWMW recommends this framework for monitoring and assessing the extent and health of

California Wetland Monitoring Workgroup
General CRAM Application
Using CRAM for Project Assessment 1-4 June 2019
California’s wetland and stream resources, and it has been demonstrated by the CWMW through multiple pilot projects across the state since 2007 (Appendix A).
Several resources are available to guide the use and application of the tools, including technical documents and online resources (www.cramwetlands.org/documents). General application is also described in the white paper Improving Monitoring and Assessment of Wetland and Riparian Areas in California through Implementation of a Level 1, 2, 3 Framework by Stein et al. (2007).
1.3 Background on CRAM CRAM is a component of the broader WRAMP toolkit that has been developed in California based on EPA’s Level 1-2-3 Framework for wetland monitoring and assessment.
CRAM can be an effective tool for assessing the overall functional capacity or condition of a wetland or stream when used as directed by trained professionals in a comprehensive monitoring program that also includes accurate mapping and careful quantification of essential wetland/stream functions. CRAM is not intended to be used as a single, independent tool to meet all aquatic resource monitoring and assessment needs.
The EPA has funded much of the development of CRAM as part of a broad effort to increase the abilities of California government agencies and Tribes to assess the status and trends in the condition of wetlands, streams and riparian areas (CWMW 2013). CRAM provides consistent and comparable assessments of condition for most wetlands and streams in California yet accommodates special characteristics of different regions and types of wetlands/streams. CRAM assesses the overall condition of wetlands and stream; the results of a condition assessment can be used to infer the ability to provide various functions or services to which a wetland/stream is most suited. However, CRAM does not measure functions.
Assumptions that Guide CRAM Development A. The functional capacity of an aquatic resource is its potential to support its intrinsic physical, chemical, biological, and ecological functions.
B. The functional capacity of an aquatic resource can be assessed as its condition.
C. The condition of an aquatic resource can be assessed as its form and structure, and its spatial relationship to factors in the surrounding landscape that affect its form and structure.
D. The functional capacity of an aquatic resource increases with the complexity of the area’s form and structure.

California Wetland Monitoring Workgroup
General CRAM Application
Using CRAM for Project Assessment 1-5 June 2019
E. A CRAM Index Score represents the overall functional capacity of a wetland or stream because it represents the overall complexity of its form and structure.
F. A CRAM Attribute Score represents the capacity of a wetland or stream to support a particular subset of the full suite of intrinsic functions that are represented by the Index Score.
G. A CRAM Metric Score represents the capacity of a wetland or stream to support a particular subset of the functions that are represented by an Attribute Score.
H. The four CRAM Attributes are universal aspects of condition for all kinds of wetlands and streams.
I. Attribute Scores help explain index Scores, and Metric Scores help explain Attribute Scores, although every wetland/stream function is represented by multiple Metrics and Attributes.
J. Wetlands and streams of different kinds that have the same CRAM scores have comparable functional capacity, although their functions may differ.
CRAM assessments are conducted through observation of four universal attributes of wetland/stream condition: buffer and landscape context, hydrology, physical structure, and biotic structure. Each attribute is evaluated using two or three metrics, some of which have sub-metrics. CRAM assessments also identify key stressors that may be affecting condition. CRAM has been subject to extensive peer review and iterative refinement for all CRAM types. In addition, riverine, estuarine, depressional, vernal pool, and slope CRAM classes have been validated against independent Level 3 measures of condition including benthic invertebrates, algae, riparian birds, and plant richness and diversity (www.cramwetlands.org/documents). This has resulted in refinement of the metrics for these aquatic resource types and provides for a higher level of confidence in the ecological meaning of CRAM scores.
CRAM assumes that the overall condition, or functional capacity, of a wetland/stream depends on its physical and biological structure and hydrology, and its buffer and landscape context, relative to the best conditions observed statewide for the same type. Condition is evaluated based on observations made at the time of the assessment. CRAM does not measure functions, which are rates of characteristic processes or services over time. CRAM condition scores are correlated with some functions, and hence one can infer whether certain functions are, or are not, likely to occur based on a CRAM score. An important distinction between CRAM and functional assessment methods is that the condition scores in CRAM reflect aggregations of multiple functions, as opposed to providing insight into the performance of individual rates or processes of specific functions.
The fundamental unit of evaluation for CRAM assessments is termed the Assessment Area (AA). The AA is the portion of the wetland or stream that is

California Wetland Monitoring Workgroup
General CRAM Application
Using CRAM for Project Assessment 1-6 June 2019
assessed using CRAM. For small wetlands and streams, the AA might include the entire wetland/stream, but for most wetlands and streams, the AA will include a portion of the wetland (or a reach of the stream). An AA is typically defined as a spatially limited portion of the wetland/ stream that is hydrologically and geomorphically homogenous and can be assessed within a few of hours (see Chapter 4, Specific Guidance for Conducting Wetland Assessments). Assessing the overall condition of larger and/or structurally diverse wetlands and streams requires multiple AAs because of the spatial limitations for AA size. The CRAM User’s Manual provides procedures for defining an AA and recommended minimum and maximum AA sizes for each CRAM type (CWMW 2013).
Consistent use of CRAM will facilitate comparisons of condition across projects, programs, and agencies and facilitate data sharing between various wetland and stream programs.
The general procedure for performing a CRAM assessment consists of eight steps:
1. Assemble background information about the management of the wetland/stream.
2. Classify the wetland/stream using the manual.
3. Verify the appropriate season and other timing aspects of field assessment.
4. Estimate the boundary of the AA (subject to field verification).
5. Conduct the office assessment of stressors and on-site conditions of the AA.
6. Conduct the field assessment of stressors and on-site conditions of the AA.
7. Complete CRAM assessment scores and Quality Assurance/Quality Control (QA/QC) Procedures.
8. Upload CRAM results into to the eCRAM database.
eCRAM is an online data management tool to facilitate data quality control and availability. The tool allows uploading of CRAM scores to the statewide database (www.cramwetlands.org). These data are integrated with Level 1 maps in the EcoAtlas information system (www.ecoatlas.org) to facilitate easy viewing and downloading of data on wetland/stream extent and condition.
1.4 CRAM Development, Review, and Revisions
Like all assessment methods, CRAM will be continuously refined based on user feedback; consequently, the application of CRAM may adapt over time as more experience is gained. The statewide Level 2 Committee currently provides updates and revisions to the method. Information on CRAM, updates and revisions, and the eCRAM database can be accessed at www.cramwetlands.org.

California Wetland Monitoring Workgroup
General CRAM Application
Using CRAM for Project Assessment 1-7 June 2019
CRAM has undergone extensive technical and peer review with varying degrees of formality. A summary of external technical reviews of CRAM is provided in Appendix A:
l Technical input into the development of the method. A variety of individuals with different expertise and perspectives participated in the development and testing process of each CRAM module. Hundreds of individuals from all levels of government, academia, and the private sector were involved in various aspects of CRAM development and testing.
l Formal technical review (see Appendix A). To date, five peer-reviewed journal articles have been published on the CRAM development process, along with many reports reviewed by independent technical advisory committees. The USACE’s Engineering Research and Development Center (ERDC) as well as the State Water Resources Control Board (SWRCB) completed external, refereed, technical reviews, focusing on the overall structure and technical approach of CRAM development and revision. Formal review has also been provided for frequently used riverine and estuarine modules.
The iterative evaluation process has produced metrics that have been shown to reflect gradients of condition and disturbance defined by separate Level 1 and Level 3 indicators for all CRAM wetland types (see Table 1 below).
1.5 Interagency Coordination and Policy Considerations
As with any assessment method, discussion and debate on some elements of CRAM and its application is ongoing. As a result, it is expected that CRAM will continue to evolve in response to new science, new data, and changing needs of the user community. We encourage ongoing dialogue on differing viewpoints and perspectives, with a goal of continuing to improve the utility of CRAM for both ambient and project assessment.
To facilitate dialogue on technical aspects of CRAM and the policy implications of its use, the California Wetlands Monitoring Workgroup, under guidance from the California Water Quality Monitoring Council, formed a Level 2 Rapid Assessments Committee (see Figure 1). Coordination of this committee is provided by SWRCB staff. This committee provides a forum for agency staff (USACE, SWRCB, California Department of Fish and Wildlife [CDFW], U.S. Fish and Wildlife Service [USFWS], EPA), CRAM principal investigators, and consultants to discuss policy and scientific issues that are beyond the scope of this technical document (visit cramwetlands.org for more information). The committee develops priorities for future CRAM refinements and additional module development, QA/QC, ongoing testing and validation, and reporting. This committee also provides guidance for the training,
California Wetland Monitoring Workgroup
General CRAM Application
Using CRAM for Project Assessment 1-8 June 2019
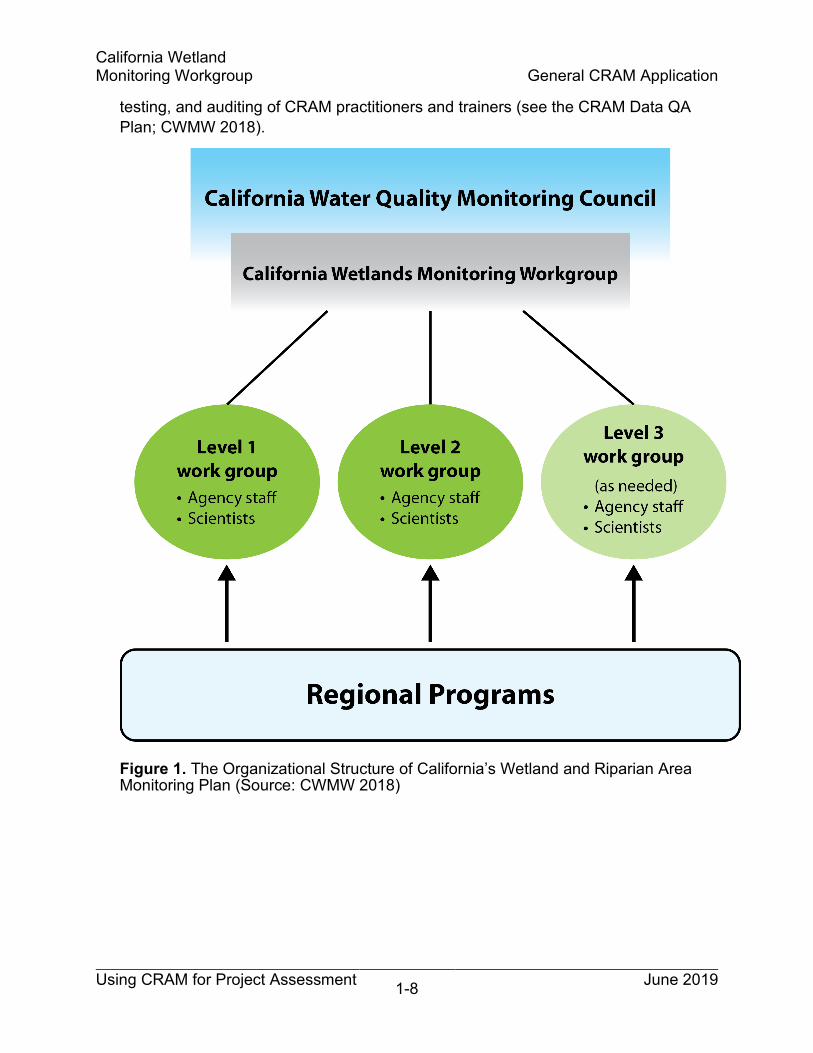
testing, and auditing of CRAM practitioners and trainers (see the CRAM Data QA Plan; CWMW 2018).
Figure 1. The Organizational Structure of California’s Wetland and Riparian Area Monitoring Plan (Source: CWMW 2018)

California Wetland Monitoring Workgroup
General CRAM Application
Using CRAM for Project Assessment 2-9 June 2019
Chapter 2 General CRAM Application
2.1 Appropriate Wetland and Stream Types for CRAM Assessments
The CRAM typology recognizes six major wetland and stream types, four of which have sub-types (Table 1). However, new modules may be developed in the future. The CRAM website provides the most current typology and list of available modules.
CRAM is not restricted to any particular jurisdictional definition. CRAM AAs are based on science and logistical practicalities and are not meant to identify or delineate the jurisdiction of any agency, nor does any jurisdictional delineation necessarily correspond to the boundaries of an AA.
Table 1. The CRAM Typology for which CRAM Modules Currently Exist
CRAM Types CRAM Sub-types Corresponding Field Book
Riverine Ecosystems
Confined Riverine Riverine Non-confined Riverine Riverine Confined Episodic Riverine Episodic Riverine Non-confined Episodic Episodic Riverine
Depressional Wetlands
Depressional Wetlands (Seasonal and Perennial) Depressional
Vernal Pool Systems Vernal Pool Systems
Individual Vernal Pools Individual Vernal Pools
Estuarine Wetlands
Perennial Saline Estuarine Wetlands
Perennial Saline Estuarine
Perennial Non-saline Estuarine Wetlands
Perennial Saline Estuarine
Bar-Built Estuarine Wetlands Bar-Built Estuarine Playas (module not yet developed) No sub-types NA
Slope Wetlands Wet Meadows (channeled and non-channeled) Slope Wetland
California Wetland Monitoring Workgroup
General CRAM Application
Using CRAM for Project Assessment 2-10 June 2019
CRAM Types CRAM Sub-types Corresponding Field Book
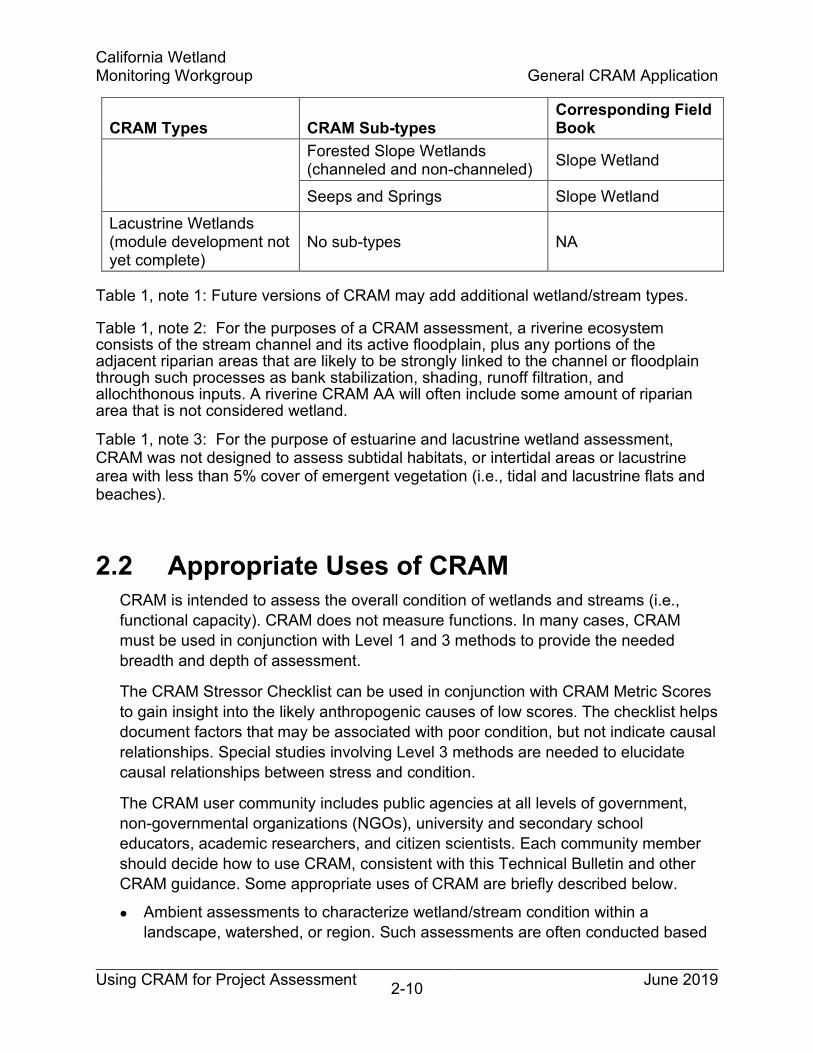
Forested Slope Wetlands (channeled and non-channeled) Slope Wetland
Seeps and Springs Slope Wetland Lacustrine Wetlands (module development not yet complete)
No sub-types NA
Table 1, note 1: Future versions of CRAM may add additional wetland/stream types.
Table 1, note 2: For the purposes of a CRAM assessment, a riverine ecosystem consists of the stream channel and its active floodplain, plus any portions of the adjacent riparian areas that are likely to be strongly linked to the channel or floodplain through such processes as bank stabilization, shading, runoff filtration, and allochthonous inputs. A riverine CRAM AA will often include some amount of riparian area that is not considered wetland.
Table 1, note 3: For the purpose of estuarine and lacustrine wetland assessment, CRAM was not designed to assess subtidal habitats, or intertidal areas or lacustrine area with less than 5% cover of emergent vegetation (i.e., tidal and lacustrine flats and beaches).
2.2 Appropriate Uses of CRAM CRAM is intended to assess the overall condition of wetlands and streams (i.e., functional capacity). CRAM does not measure functions. In many cases, CRAM must be used in conjunction with Level 1 and 3 methods to provide the needed breadth and depth of assessment.
The CRAM Stressor Checklist can be used in conjunction with CRAM Metric Scores to gain insight into the likely anthropogenic causes of low scores. The checklist helps document factors that may be associated with poor condition, but not indicate causal relationships. Special studies involving Level 3 methods are needed to elucidate causal relationships between stress and condition.
The CRAM user community includes public agencies at all levels of government, non-governmental organizations (NGOs), university and secondary school educators, academic researchers, and citizen scientists. Each community member should decide how to use CRAM, consistent with this Technical Bulletin and other CRAM guidance. Some appropriate uses of CRAM are briefly described below.
l Ambient assessments to characterize wetland/stream condition within a landscape, watershed, or region. Such assessments are often conducted based

California Wetland Monitoring Workgroup
General CRAM Application
Using CRAM for Project Assessment 2-11 June 2019
on a probabilistic sampling design where a statistically representative sample of wetlands/streams is assessed and used to make inferences about the overall condition of the larger population.
l Monitoring the wetland and stream resources of ecological reserves, mitigation banks, wildlife refuges, open spaces, parklands, or similar management units.
l Evaluation of potential and existing permitted impacts on wetland and stream resources. This may include using CRAM to support an evaluation of project impacts and mitigation.
l Evaluation of impacts associated with unauthorized (illegal) impacts on wetland and stream resources and subsequent on-the-ground enforcement actions. This may be accomplished by assessing wetlands/streams near the impact site that are expected to represent its pre-impact condition and assigning the average of their Index Scores to the impact site. The individual assessments of the nearby wetlands/streams should be entered into the CRAM database, but not the average of these assessments. Projected scores should not be added to the eCRAM database.
l Comparison of alternative restoration and mitigation sites, and evaluation of restoration/mitigation project performance. In this regard, CRAM usually will be used in conjunction with Level 1 and Level 3 assessment methods.
l Development of mitigation crediting and mitigation ratios. Projected CRAM scores may be used to inform determination of mitigation ratios (or requirements), but this should be done in consideration of the uncertainty associated with estimating future scores. All assumptions associated with projected scores should be documented in detail. When being used to inform mitigation ratios, CRAM should be used in conjunction with Level 1 and Level 3 tools. See Section 2.5, below, for additional considerations when setting mitigation ratios.
Stress Index To improve on the current qualitative stressor checklist, the Level 2 committee is developing a Stress Index. The Stress Index is constructed in parallel with the current CRAM Condition Index, in that it has Attributes and Metrics that the practitioner evaluates and scores. For each category of stressor, the Index evaluates proximity, extent, intensity, and severity, giving each a quantitative score. However, unlike the Condition Index, a higher Stress Index score indicates higher levels of stress and, thus, likely negative impacts on condition.

California Wetland Monitoring Workgroup
General CRAM Application
Using CRAM for Project Assessment 2-12 June 2019
2.3 Inappropriate Uses of CRAM This list provides some examples of inappropriate uses of CRAM. It is not exhaustive. The interested regulatory, funding, or management entity or entities should be consulted prior to any application of CRAM.
l Jurisdictional determinations and delineations.
l Assessment of habitats to determine presence or absence of specific species or monitoring of specific populations, such as threatened and endangered species.
l Substitution of CRAM for Level 3 methods to evaluate specific aspects of condition or stress, such as contaminant concentrations, intensity of human visitation, groundwater recharge, or wildlife population size.
l Evaluation of compliance with water quality objectives, species recovery objectives, stormwater management objectives, or other programmatic objectives or performance standards requiring Level 3 methods.
l Assessment of individual wetland/stream functions or services, including their frequency, extent, rate, or intensities, or their mechanism and controlling factors.
l Assessment of non-ecological societal services or values of wetlands/streams. It has been well-documented that wetlands provide a variety of services that are beneficial to people, such as flood flow attenuation, pollutant assimilation or sequestration, recreation, and aesthetics, and emotional well-being. Various cultural or spiritual uses are well-documented, especially for Native American tribes. CRAM is designed to evaluate the capacity of wetlands and streams to provide intrinsic ecological functions. The expected interrelations among the ecological functions and societal services of wetlands are not known well enough to interpret CRAM scores in terms of their societal services. Rapid assessments have been proposed for non-ecological services and values of wetlands/streams, and these methods may prove to have some value in the future, but it is likely that these will remain as separate Level 2 assessments from CRAM.
l Use of CRAM metric descriptors as stand-alone project design templates. The CRAM descriptors for good condition can be used to help guide project designs, but successful projects will also involve careful analyses of site-specific design constraints, and the likely resilience or permanence of any design features selected based solely on CRAM. Designing projects to get high CRAM scores is not wrong. However, the designers should understand that very few wetlands of any type get perfect CRAM scores, and that the best designs incorporate features of good condition wetlands/streams that are consistent with the ongoing natural processes and expected management practices of the project site and setting.

California Wetland Monitoring Workgroup
General CRAM Application
Using CRAM for Project Assessment 2-13 June 2019
2.4 Modifying CRAM Methodology All CRAM attributes should be assessed and reported when conducting an assessment. Under no circumstances should anyone modify procedures to establish CRAM AAs, combine any aspects of two or more CRAM modules, or modify CRAM Attributes, Metrics, Metric descriptors, scoring tables, or procedures for calculating scores. Doing so will invalidate the CRAM assessment. Modified CRAM is not CRAM.
CRAM has been developed through an extensive process of testing, calibration, and validation, and has been subjected to extensive technical peer review. Ad hoc modification of the method will reduce or eliminate the scientific reliability and defensibility of CRAM.
Level 1 and Level 3 assessments may be used in conjunction with CRAM as needed to meet the monitoring objectives of ambient and project assessments. However, these methods should not be “hybridized” with CRAM to form a modified method, as doing so would produce data of unknown reliability and comparability. This does not preclude the use of CRAM scores as independent variables in multivariate statistical analyses of wetland/stream condition, so long as the CRAM scores are generated using unmodified CRAM modules.
2.5 Multiplying CRAM Scores Size CRAM scores must not be multiplied by any measure of wetland or stream size because size does not necessarily relate to diversity or level of function. While weighting CRAM scores with the areas they represent might be desirable in some regulatory or planning situations, there are insufficient data available at this time to evaluate or support such practices. The resulting product does not represent any known relationship between wetland/stream size and overall functional capacity or condition for any wetland/stream type. For example, it cannot be assumed that the larger of any two wetlands having the same CRAM score has higher overall functional capacity or better condition. Similarly, small size does not necessarily relate to functional rarity or uniqueness.
The relationship between size and function is not likely to be linear and is very likely to vary among functions. Many of the CRAM metrics are designed to account for the effect of wetland size on condition, and several metrics are explicitly scaled by size. Multiplying CRAM scores by any dimension of size, such as wetland area, length, or perimeter, is likely to distort the scaling of these size-dependent metrics, or weight the values of other metrics in unintended ways, and thus lead to erroneous assessments. If the condition of additional wetland or stream area is desired, supplemental CRAM AAs should be added to the area of interest following the

California Wetland Monitoring Workgroup
General CRAM Application
Using CRAM for Project Assessment 2-14 June 2019
guidance in Section 4.9.2, Assessing Large Projects, and Appendix B. When considering mitigation ratios, CRAM scores themselves should not be directly multiplied by area, but they can be used, along with Level 1 and Level 3 information, to inform adjustments to a mitigation ratio that is then, in turn, multiplied by area. This approach will allow regulatory agencies to incorporate CRAM scores into mitigation ratios without violating the underlying assumptions of CRAM.
2.6 Process to Address Technical Issues with CRAM
Like all assessment methods, CRAM will continue to evolve and be refined with application and continued research. Comments or suggestions regarding improvement, modification, or adaptation of CRAM for specific applications can be submitted on the CRAM website (www.cramwetlands.org). All submitted comments are reviewed by the statewide Level 2 Committee of the CWMW and used to inform periodic CRAM updates and revisions. In general, given adequate resources, suggested modifications to CRAM, the online CRAM database, and EcoAtlas will be compiled annually, and any modifications recommended by the Level 2 Committee and endorsed by the CWMW, will be completed prior to the subsequent field season. Technical changes to CRAM will be reviewed and approved by the Level 2 Committee. Uncertainties or differences in opinion regarding application of CRAM will be addressed by the CWMW.
All individuals who register on the CRAM website will receive email alerts regarding CRAM updates and opportunities to attend quarterly meetings of the Level 2 Committee and participate in occasional CRAM workshops, where proposed updates or changes to CRAM are discussed.
2.7 Addressing Multiple Versions of CRAM Refinements and updates are made as needed and when resources are available. They typically serve to clarify metrics and do not involve substantial revisions of the method. The CRAM website should be consulted before conducting a CRAM assessment to ensure that the most recent version is being used. Practitioners may also register on the CRAM website to receive email updates regarding CRAM revisions and updates. The most current versions of CRAM can be found at https://www.cramwetlands.org/documents .
Different CRAM versions may be used over the course of a project or program to assess project maturation or the status and trends in ambient wetland/stream condition. Careful documentation of CRAM assessments, including uploading CRAM scores and AA maps to the online CRAM database, will allow translation of past

California Wetland Monitoring Workgroup
General CRAM Application
Using CRAM for Project Assessment 2-15 June 2019
CRAM scores into corresponding values for the current CRAM version. If this is not possible, then the AAs in question should be re-assessed using the previous and current CRAM versions to develop a matrix of corresponding scores. Updated scores (based on the most current version of CRAM) should be submitted to the eCRAM database as complements for the previous scores. However, the original CRAM scores in the eCRAM database cannot be revised for versions earlier than CRAM v.6.1. The original scores will remain archived and stamped with the version of CRAM with which they were calculated/collected. Consequently, there may be multiple CRAM scores for the same area and assessment period representing the different versions of CRAM.
2.8 The Meaning of CRAM Scores Any interpretation of CRAM scores should be guided by the following tenets:
l CRAM Index Scores represent the overall capacity of a wetland/stream to perform a suite of intrinsic ecological functions.
l The CRAM Attribute Scores represent the capacity of a wetland/stream to perform a particular subset of these intrinsic ecological functions.
l The ecological functions represented by the CRAM Index Scores and Attribute Scores vary among wetland/stream types.
l For any given wetland/stream type, there is overlap among the sets of ecological functions represented by the CRAM Attribute Scores.
l For any given wetland/stream type, an increase in CRAM scores means an overall increase in ecological functional capacity. This relationship exists when expressed in overall Index Scores or when expressed as Attribute or Metric Scores.
One of the main benefits of using CRAM is that it enables users to objectively compare projects to each other, to ambient conditions, and over time, based on standardized assessments of condition. CRAM can therefore be used to assess the contributions of projects to ambient conditions, evaluate different project designs and management practices, assess changes in baseline and reference conditions, compare different wetland/stream types to each other, and evaluate the efficacy of wetland and stream protection policies and programs.
The internal reference standard of CRAM accounts for its general usefulness. Each CRAM Metric Score for each CRAM module represents a condition relative to the best condition observed statewide for that Metric. For certain applications, it may be beneficial to develop/determine regional standards, which represent the best condition expected/observed for a specific wetland/stream type in a specific geographic region. Each Attribute Score is a percentage of its best possible score,

California Wetland Monitoring Workgroup
General CRAM Application
Using CRAM for Project Assessment 2-16 June 2019
which represents the best observed condition for each of its component Metrics. Likewise, each Index Score is a percentage of the best possible score, which represents the best possible Attribute Scores. For any AA, an Index Score of 100 means that the condition of the AA equals the best observed condition for every Metric of all four Attributes. As expected, perfect Index Scores are extremely rare. They have not been observed for some types of wetlands and stream, and as such, a perfect score of 100 is not necessarily the appropriate reference (or best score achievable) for specific wetland/stream types in specific geographic regions. Wetlands and streams that have the worst observed conditions have an Index Score of 25. Such very low scores are also rare. A score of 0 is not possible because all wetlands and streams have some functional capacity.
The internal reference standard of CRAM enables users to compare wetlands and streams of the same or different types to each other and over time. For example, an AA having an Index Score of 50 can be interpreted as having lower functional capacity relative to another AA (of the same or different wetland type) having an Index Score of 80. A similar interpretation can be made for Attribute Scores. However, two or more wetlands or streams of the same or different type that have the same overall functional capacity may support different functions or different magnitudes of the same functions.

Using CRAM for Project Assessment 3-1 June 2019
Chapter 3 CRAM Quality Assurance
3.1 General Quality Assurance Requirements for CRAM Assessments
The main objective of data quality assurance is to assure that the data are accurately collected and verified so that subsequent analysis and interpretation is based on the best available information. Procedures described in the CRAM Data Quality Assurance Plan (CWMW 2018) and the CRAM User’s Manual (CWMW 2013) are designed to help assure the accuracy and consistency of data collection and processing. Because Metric Scores are combined into Attribute Scores and overall Index Scores, any errors in Metric analysis can be compounded if quality control measures are not followed.
The CRAM Data Quality Assurance Plan, v8 describes in depth the quality assurance and quality control (QA/QC) plan to support consistent collection and reporting of CRAM data (www.cramwetlands.org)(CWMW 2018).
3.2 CRAM Precision In general, the precision of CRAM is affected by training, practitioner technical support, and the practitioner’s qualification and experience.
The quality of practitioner training is dependent on trainer competency, the quality of the curriculum and supporting materials, trainee evaluations and access to individualized training.
Precision is influenced by the qualifications of the assessment team; their competency in CRAM, level of field experience, and the diversity of field expertise among team members.
Precision is also influenced by the quality of the user support materials: their scientific correctness, completeness, clarity, currentness and accessibility.
The overall precision of CRAM has been estimated from inter-calibration studies at multiple wetland and stream types and should be considered when comparing scores. These studies have allowed two types of confidence intervals to be produced:
A. Confidence intervals that can be used to determine if two CRAM scores are different from each other.
California Wetland Monitoring Workgroup
CRAM Quality Assurance
Using CRAM for Project Assessment 3-2 June 2019
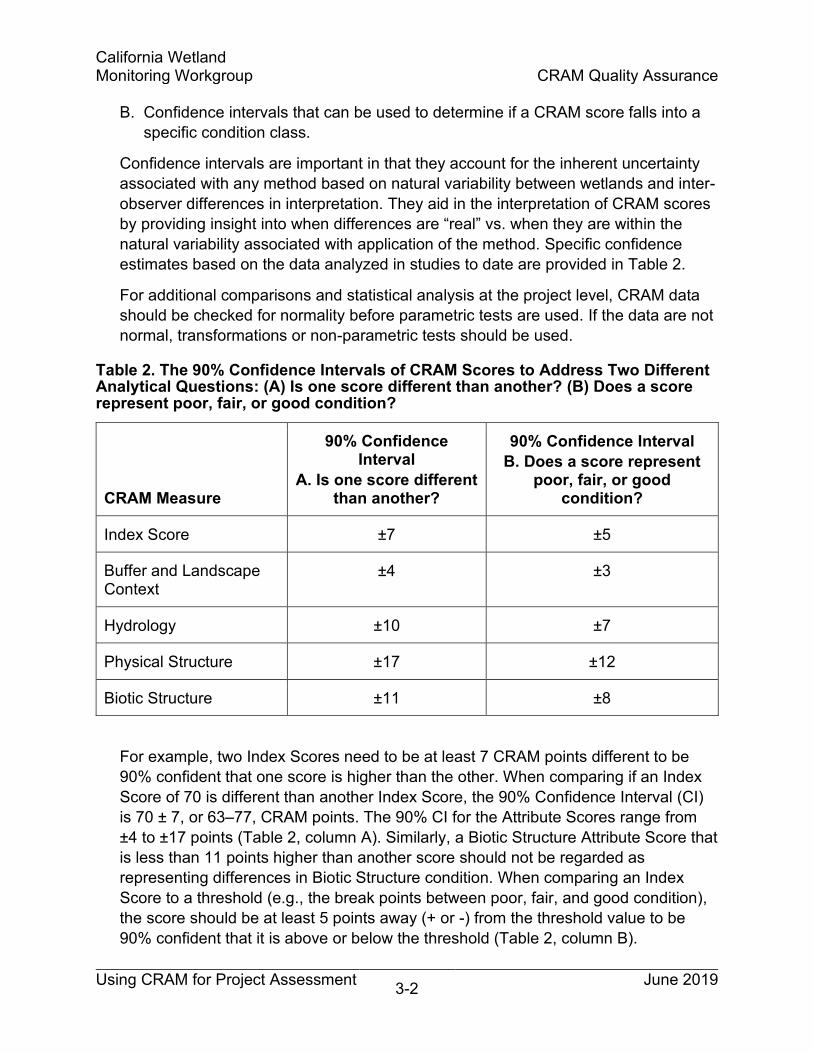
B. Confidence intervals that can be used to determine if a CRAM score falls into a specific condition class.
Confidence intervals are important in that they account for the inherent uncertainty associated with any method based on natural variability between wetlands and inter-observer differences in interpretation. They aid in the interpretation of CRAM scores by providing insight into when differences are “real” vs. when they are within the natural variability associated with application of the method. Specific confidence estimates based on the data analyzed in studies to date are provided in Table 2.
For additional comparisons and statistical analysis at the project level, CRAM data should be checked for normality before parametric tests are used. If the data are not normal, transformations or non-parametric tests should be used.
Table 2. The 90% Confidence Intervals of CRAM Scores to Address Two Different Analytical Questions: (A) Is one score different than another? (B) Does a score represent poor, fair, or good condition?
CRAM Measure
90% Confidence Interval
A. Is one score different than another?
90% Confidence Interval B. Does a score represent
poor, fair, or good condition?
Index Score ±7 ±5
Buffer and Landscape Context
±4 ±3
Hydrology ±10 ±7
Physical Structure ±17 ±12
Biotic Structure ±11 ±8
For example, two Index Scores need to be at least 7 CRAM points different to be 90% confident that one score is higher than the other. When comparing if an Index Score of 70 is different than another Index Score, the 90% Confidence Interval (CI) is 70 ± 7, or 63–77, CRAM points. The 90% CI for the Attribute Scores range from ±4 to ±17 points (Table 2, column A). Similarly, a Biotic Structure Attribute Score that is less than 11 points higher than another score should not be regarded as representing differences in Biotic Structure condition. When comparing an Index Score to a threshold (e.g., the break points between poor, fair, and good condition), the score should be at least 5 points away (+ or -) from the threshold value to be 90% confident that it is above or below the threshold (Table 2, column B).
California Wetland Monitoring Workgroup
CRAM Quality Assurance
Using CRAM for Project Assessment 3-3 June 2019
The CRAM Data Quality Assurance Plan (v8, January 2018) provides additional information about CRAM precision (CWMW 2018).
3.3 Requirements for Practitioner Expertise and Training
CRAM is relatively rapid, but it is not easy to apply. CRAM involves a systematic, detailed examination of wetland or stream structure at various spatial scales. According to the CRAM manual, completion of a CRAM assessment requires expertise comparable to that necessary to conduct a wetland jurisdictional delineation. Expertise in wetland/stream botany and geomorphology is particularly helpful in many cases.
The Data Quality Objectives and Procedures laid out in the CRAM Data Quality Assurance Plan, v8 (CWMW 2018) are based on having two trained practitioners complete each CRAM assessment.
A trained practitioner is a person who has completed a 5-day CRAM practitioner training course or an equivalent course of study that has been approved by the Level 2 Committee of the CWMW. An ideal CRAM assessment team has a mix of expertise in wetland ecology, botany, geology, geomorphology, biology, or other aspects of wetland science. Several CRAM metrics require interpretation of subtle differences in field condition based on indicators that cannot be mastered without supervised practice. Discussion of scoring decisions among members of an assessment team will improve the accuracy and reliability of the CRAM results by helping to bridge gaps in experience and by encouraging close examination of field conditions. The precision estimates listed in Table 2 can only be expected when assessments are completed by a trained team of CRAM practitioners.
Training for practitioners focuses on multiple wetland/stream types, with a field and office practicum. Each 5-day training course for practitioners includes an overview of CRAM, its applications, how to upload data to the online database, and intensive training in two wetland/stream types. Practitioners who have successfully completed the 5-day training are then prepared to conduct CRAM assessments in any wetland type except for vernal pools, which require a separate training.
In addition, online training videos for several CRAM types are available, as well as self-training sites spread throughout California. These training materials are for practitioners who are interested in learning about a wetland/stream type that was not visited during their 5-day training (see www.cramwetlands.org). The vernal pool module is taught separately in a stand-alone 3-day training.

California Wetland Monitoring Workgroup
CRAM Quality Assurance
Using CRAM for Project Assessment 3-4 June 2019
A list of individuals who have successfully completed a CRAM training is maintained on the CRAM website (https://www.cramwetlands.org/training/participants). The list includes the practitioner’s name, affiliation, the CRAM module, course type, region, and date of the training. Prior to accepting CRAM data for a given project, this list should be accessed to ensure the practitioner who is submitting the CRAM assessment has been properly trained.
Trained practitioners will be notified via email of CRAM updates and are expected to maintain familiarity with new versions of CRAM. Periodic retraining from a CRAM “Refresher course” may be necessary to ensure adequate proficiency of practitioners.
3.4 Reducing Practitioner Variability The following best practices should be used to maximize precision in CRAM scores and ensure that any difference in scores reflects a true difference in wetland condition.
1. Each assessment should be conducted by a team composed of at least two trained CRAM practitioners with first-hand experience in assessments during the previous 2 years. Assessments should only be conducted by practitioners who have completed a 5-day CRAM training course. Teams can include other members for training purposes, but assessments should only be made by practitioners who have completed the training. For trained practitioners seeking more experience, the following options are available:
A. Complete a refresher training course.
B. Complete online self-training sessions linked to reference sites.
C. Volunteer to audit assessments.
2. Whenever possible, teams should embody a mix of experience levels, partnering senior practitioners with junior practitioners. This will build expertise across the CRAM user community.
3. For large projects with multiple AAs that may require days or weeks to complete and for long-term projects that monitor a wetland/stream over time, all attempts should be made to use the same team for the length of the project. New practitioners who join the project after it begins should be paired with a CRAM practitioner who is very familiar with the project and wetland resources being assessed. If possible, senior CRAM practitioners should remain constant over time.

California Wetland Monitoring Workgroup
CRAM Quality Assurance
Using CRAM for Project Assessment 3-5 June 2019
4. Projects that involve multiple teams should conduct inter-team calibrations at the beginning and end and, if possible, midway through CRAM data collection.
l Calibration sites are selected for each wetland/stream type to be assessed.
l The teams independently assess the same AAs for each calibration site.
l Any discrepancies in Attribute Scores are discussed and resolved in ways consistent with the CRAM Manual and appropriate field books.
5. The project should use CRAM practitioners who are familiar with the wetland/stream type(s) to be assessed within the region of the assessment. For example, the expertise of a senior CRAM practitioner may be discounted if the practitioner is unfamiliar with the wetlands to be assessed. When assembling a regional team, familiarity with the regional nature of the type(s) of wetland/stream to be assessed should be considered. Although the 5-day CRAM training prepares practitioners to work in any CRAM module (except vernal pools), it does not replace the need for ecological expertise in a specific wetland/stream type or region.
3.5 CRAM Reporting and Submission of CRAM Scores
The complexity of reporting of CRAM scores and results varies with the complexity and scale of the project or program under investigation. Reports can range from a simple three-page summary to more complex reports with analysis and comparisons in multiple chapters. Regardless of the complexity of the report, it is important that CRAM data be submitted with at least the minimum complement of supporting documentation that allows a reasonable review of the results by interested parties, including public agency staff. At a minimum, the following elements should be included in any report:
l Fully completed CRAM data sheet. Note that all Submetric, Metric, and Attribute Scores must be provided as well as copies of the CRAM worksheets used to score metrics (where relevant).
l Completed Stressor Checklist.
l Photographs of the site illustrating key aspects of the wetland/stream being assessed. Photographs should be clearly associated with specific locations on the ground and should conform to the Standard Procedures for Stream Assessment provided by the SWRCB (http://www.waterboards.ca.gov/water_issues/programs/swamp/cwt_guidance.shtml).

California Wetland Monitoring Workgroup
CRAM Quality Assurance
Using CRAM for Project Assessment 3-6 June 2019
l Brief rationale for assignment of each Submetric and Metric Score (for simple reports, can be detailed notes on the datasheet);
l A map of the AA(s) that consists of the boundary of the AA on the imagery provided by the CRAM website or other imagery of comparable or better resolution and vintage (the CRAM website provides guidelines for submittal of maps with appropriate coordinates).
l General site information, including any relevant information such as recent natural or anthropogenic disturbances, known presence of sensitive species, etc.
l The timing of the assessment relative to the Assessment Window for the type of wetland being assessed.
l Names and contact information for all individuals who conducted the CRAM assessment (these will be cross-referenced with the names of trainees from the CRAM training classes).
eCRAM (www.cramwetlands.org/dataentry) is the primary repository for statewide CRAM data. It contains on-line forms for entering and editing CRAM assessment information. eCRAM assures that a trained practitioner has conducted the assessment and followed QC procedures to ensure data integrity, standardization, and completeness. All results marked as “public” when entered into eCRAM can be viewed by the public through interactive maps on both the CRAM web site as well as on EcoAtlas. Projects requiring confidentiality can also use eCRAM and elect not to select the “public” checkbox.
Anyone who wants to enter data into eCRAM must register on the CRAM website to obtain a database login name and password. eCRAM is only accessible to registered users, and they can only access and edit their own data. CRAM practitioners should register on the CRAM website (www.cramwetlands.org) to be able to review their uploaded assessment data and related information.
It is strongly recommended that all suitable CRAM results be entered into eCRAM. This important step guarantees the data are securely stored and can be easily accessed and shared with others. No public agency should rely on CRAM scores for regulatory or management decision that are not available through eCRAM database at www.cramwetlands.org.
California Wetland Monitoring Workgroup
CRAM Quality Assurance
Using CRAM for Project Assessment 3-7 June 2019
This page intentionally left blank.
Using CRAM for Project Assessment 4-1 June 2019
Chapter 4 Specific Guidance for Conducting Wetland
Assessments
4.1 Defining Wetland and Stream Condition Classes
Wetlands and streams can receive CRAM scores ranging from 25 to 100. However, there is often a need to bin sites based on categories of scores to facilitate reporting, prioritization, or evaluation of management actions. The full range of condition can be subdivided into categories or classes of condition based on CRAM scores. The use of condition classes can simplify the reporting of condition for populations of wetlands/streams, as well as the comparison of one wetland or stream to others. The most common approach to comparing wetlands/streams using condition classes involves three classes: poor, fair, and good.
The minimum approach for defining condition classes is simply to divide the maximum possible range of scores into three equal sub-ranges, called tertiles. In some circumstances, it may be desirable to create additional condition classes based on quartiles or quintiles; however, this should only be done with data sets large enough to create meaningful sub-ranges based on the distribution of the data. In most cases, creating three sub-ranges will be possible and therefore can serve as the minimum number of reasonable condition classes.
The maximum possible range of Index Scores is 75 (i.e., the maximum score minus the minimum score, or 100 minus 25) and the tertile break or threshold Index Scores are 50 and 75. In other words, Index Scores for poor condition range from 25 to 50; scores for fair condition range from 51 to 75; and scores for good condition range from 76 to 100. This is the most objective approach to defining poor, fair, and good condition wetlands/streams. It can be used to classify the condition of any wetland or stream based on CRAM Index or Attribute Scores, and it enables wetland and stream areas of the same or different types to be compared based on their condition class. Tertiles can be determined for Index Scores and Attribute Scores because they vary continuously between their maxima and minima. Tertiles cannot be determined for Metric Scores because they are categorical rather than continuous. Other approaches to define condition classes are less broadly applicable.
l Tertiles Based on Observed Range in Scores. In this case, the tertiles are calculated based on an observed range in CRAM scores, rather than the maximum possible range. This approach requires enough observations (i.e., enough scores) to define the range with reasonable certainty.

California Wetlands Monitoring Workgroup
Specific Guidance for Conducting Wetlands Assessments
Using CRAM for Project Assessment 4-2 June 2019
l Condition Classes Based on Subjective Thresholds. The threshold scores between condition classes (i.e., poor, fair, good) can be decided based on political or administrative criteria. For example, the National Park Service, having encountered only good condition sites in a National Park, decided to separate the good class into three categories of good: excellent (Index Scores > 90), very good (Scores 83–90), and good (Scores 75–82). In this case, the revised classes are consistent with the preferred approach, because the three sub-classes of good condition can be conflated into its single “good” class. However, other subjective threshold scores that are not consistent with the preferred approach risk generating condition classes that are not comparable to each other. CRAM precision should be carefully considered when establishing condition classes (see Section 3.2, CRAM Precision).
l Condition Classes Based on Breaks in Score Frequency. Some experienced practitioners have observed fairly consistent breaks or discontinuities in the frequency of Index Scores for some wetland/stream types. For example, 80 tends to correspond to a commonly observed break in the frequency of scores for some populations of estuarine and depressional wetlands. Breaks in frequency are not always well-defined, however. For some wetland/stream types, the number of available scores is too small to reveal any breaks. Unless the breaks are well-defined and rationalized, their use as thresholds between condition classes should be avoided.
4.2 Defining Reference Condition There are several definitions of reference relevant for CRAM. The definitions below are consistent with best practices of monitoring and assessment (Stoddard et al. 2006). In all instances, practitioners should clearly define the reference term being used, use them in a consistent manner, and ensure that CRAM scores are only compared to reference sites of the same wetland or stream type.
l CRAM Internal Reference Standard. The natural biological condition of a wetland/stream, undisturbed by human activity. It is considered the absolute “natural” or pristine condition that is known to exist in California in the absence of all human disturbances.
l CRAM Reference Site. A single wetland/stream site with CRAM score in the upper tertile due the lack of apparent anthropogenic stress. A CRAM reference site can serve as a standard or benchmark to which the condition of other wetland/stream areas of the same type can be compared. However, use of a reference range—when available—is preferred to use of a single site.
l CRAM Reference Range. A set of wetlands/streams (typically three or more) of a given wetland/stream type that are in the upper tertile and collectively can

California Wetlands Monitoring Workgroup
Specific Guidance for Conducting Wetlands Assessments
Using CRAM for Project Assessment 4-3 June 2019
provide a range of scores that can be used to establish regulatory or management targets. For regional or ambient assessments, the reference range should include a larger number of sites (typically at least 10). The reference range should be calculated as the mean ±1 standard deviation of their reference site scores.
l Historical Reference Condition. The condition of a wetland/stream at some specified point in time in the past as interpreted from historical records or from remains (e.g., pollen or diatoms in lake sediments). The data used to construct this condition are often difficult to obtain and highly variable. Such data may be static in the sense that they only provide a snapshot of wetland/stream condition at that particular time in history, and not an “average” or stable long-term past ambient condition. Thus, a past state may not be indicative of site potential in current conditions. Due to existing constraints and changes in the landscape over the last few centuries, many restoration projects cannot reach historical reference conditions, but they can use them as a guide to inform design and management opportunities, and potentially estimate scores where local project reference sites aren’t available.
l Project Reference Site. Site used to establish a regulatory or management objective specific to the individual project. The project reference site should be within the CRAM reference range if possible. However, in some cases it may not be possible (or practical) for project reference sites to be within reference ranges (i.e., the upper tertile of scores). In these cases, agencies may assign targets/goals based on a project reference site that is not within the CRAM reference range. Project reference sites typically represent existing condition (i.e., pre-impact), best achievable (i.e., the highest possible following implementation of best management practices and other rehabilitation activities), or natural conditions in the landscape with little or no anthropogenic stressors (i.e., what the project site could be if stressors were removed).
When applying CRAM for ambient assessments, regional monitoring, etc. the internal reference standard provides a sufficient basis of comparison for interpreting CRAM scores. Sites can be compared to each other and to overall regional condition through the use of Cumulative Distribution Function (CDF) plots, as discussed in Section 4.10, Comparing a Wetland to Ambient Conditions.
For project assessment, comparison to a reference range (as defined above) is preferred. Reference ranges can be defined based on tertiles, breaks in frequency of distribution of scores, or subjective thresholds as described in Section 4.1, Defining Wetland Condition Classes. However, reference ranges or sites must, at a minimum, have CRAM scores in the upper tertile based on the internal CRAM reference standard (i.e., Index Scores must be >75). In some cases, there may not be enough available sites to define a reference range, in which case a single reference site is
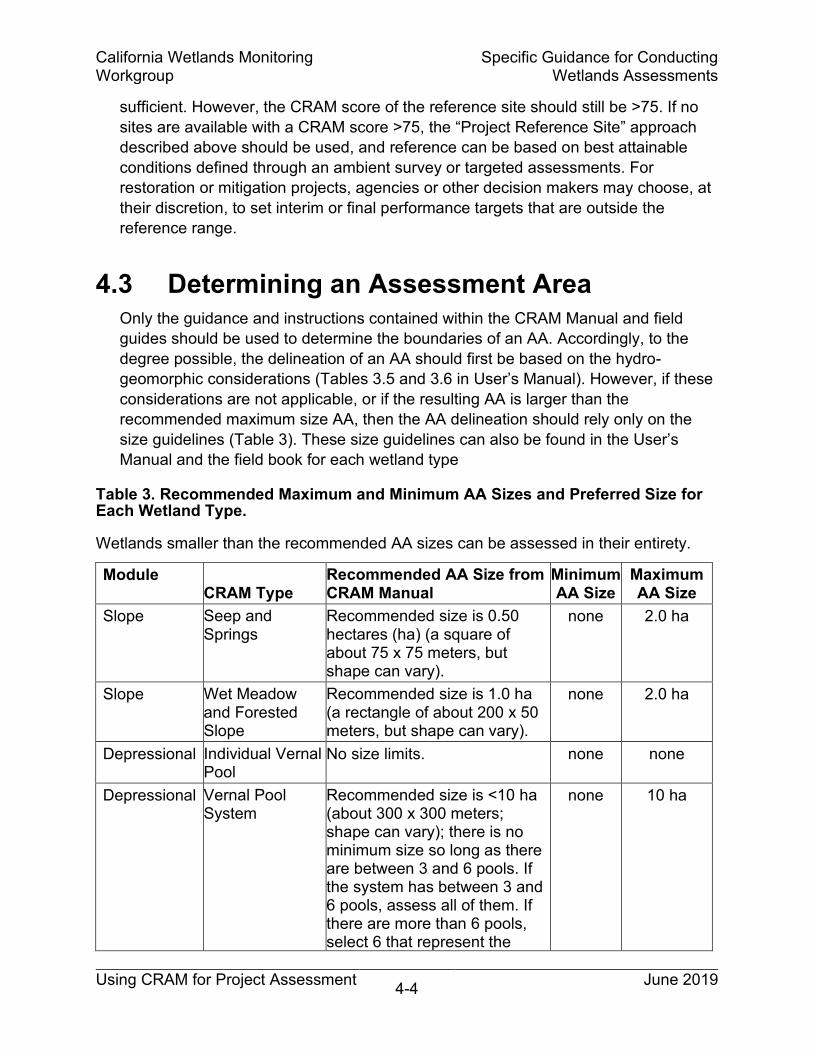
California Wetlands Monitoring Workgroup
Specific Guidance for Conducting Wetlands Assessments
Using CRAM for Project Assessment 4-4 June 2019
sufficient. However, the CRAM score of the reference site should still be >75. If no sites are available with a CRAM score >75, the “Project Reference Site” approach described above should be used, and reference can be based on best attainable conditions defined through an ambient survey or targeted assessments. For restoration or mitigation projects, agencies or other decision makers may choose, at their discretion, to set interim or final performance targets that are outside the reference range.
4.3 Determining an Assessment Area Only the guidance and instructions contained within the CRAM Manual and field guides should be used to determine the boundaries of an AA. Accordingly, to the degree possible, the delineation of an AA should first be based on the hydro-geomorphic considerations (Tables 3.5 and 3.6 in User’s Manual). However, if these considerations are not applicable, or if the resulting AA is larger than the recommended maximum size AA, then the AA delineation should rely only on the size guidelines (Table 3). These size guidelines can also be found in the User’s Manual and the field book for each wetland type
Table 3. Recommended Maximum and Minimum AA Sizes and Preferred Size for Each Wetland Type.
Wetlands smaller than the recommended AA sizes can be assessed in their entirety.
Module CRAM Type
Recommended AA Size from CRAM Manual
Minimum AA Size
Maximum AA Size
Slope Seep and Springs
Recommended size is 0.50 hectares (ha) (a square of about 75 x 75 meters, but shape can vary).
none 2.0 ha
Slope Wet Meadow and Forested Slope
Recommended size is 1.0 ha (a rectangle of about 200 x 50 meters, but shape can vary).
none 2.0 ha
Depressional Individual Vernal Pool
No size limits. none none
Depressional Vernal Pool System
Recommended size is <10 ha (about 300 x 300 meters; shape can vary); there is no minimum size so long as there are between 3 and 6 pools. If the system has between 3 and 6 pools, assess all of them. If there are more than 6 pools, select 6 that represent the
none 10 ha

California Wetlands Monitoring Workgroup
Specific Guidance for Conducting Wetlands Assessments
Using CRAM for Project Assessment 4-5 June 2019
Module CRAM Type
Recommended AA Size from CRAM Manual
Minimum AA Size
Maximum AA Size
range in size of pools present on the site.
Depressional Other Depressional
Recommended size is 1.0 ha (a 56-meter radius circle or about 100 x 100 meters, but shape can vary); maximum size is 2.0 ha (an 80-meter radius circle or about 140 x 140 meters, but shape can vary).
none 2.0 ha
Riverine Confined and Non-confined
Recommended length is 10x average bankfull channel width; maximum length is 200 meters; minimum length is 100 meters. AA should extend laterally (landward) from the bankfull contour to encompass all the vegetation (trees, shrubs vines, etc.) that probably provide woody debris, leaves, insects, etc. to the channel and its immediate floodplain; minimum width is 2 meters.
Minimum length 100
meters. Minimum width 2 meters.
Maximum length 200
meters.
Riverine Episodic Recommended length is 10x average AA width; maximum length is 200 m; minimum length is 100 meters. AA should extend laterally (landward) from the center of the main low flow channel to encompass all the vegetation (trees, shrubs vines, etc.) that probably provide woody debris, leaves, insects, etc. to the channel and its active floodplain; minimum width is 2 meters, maximum width is 200 meters.
Minimum length 100
meters. Minimum width 2 meters.
Maximum length 200
meters. Maximum width 200 meters.
Lacustrine Recommended size is 2.0 ha (about 140 x 140 meters, but shape can vary).
0.5 ha None
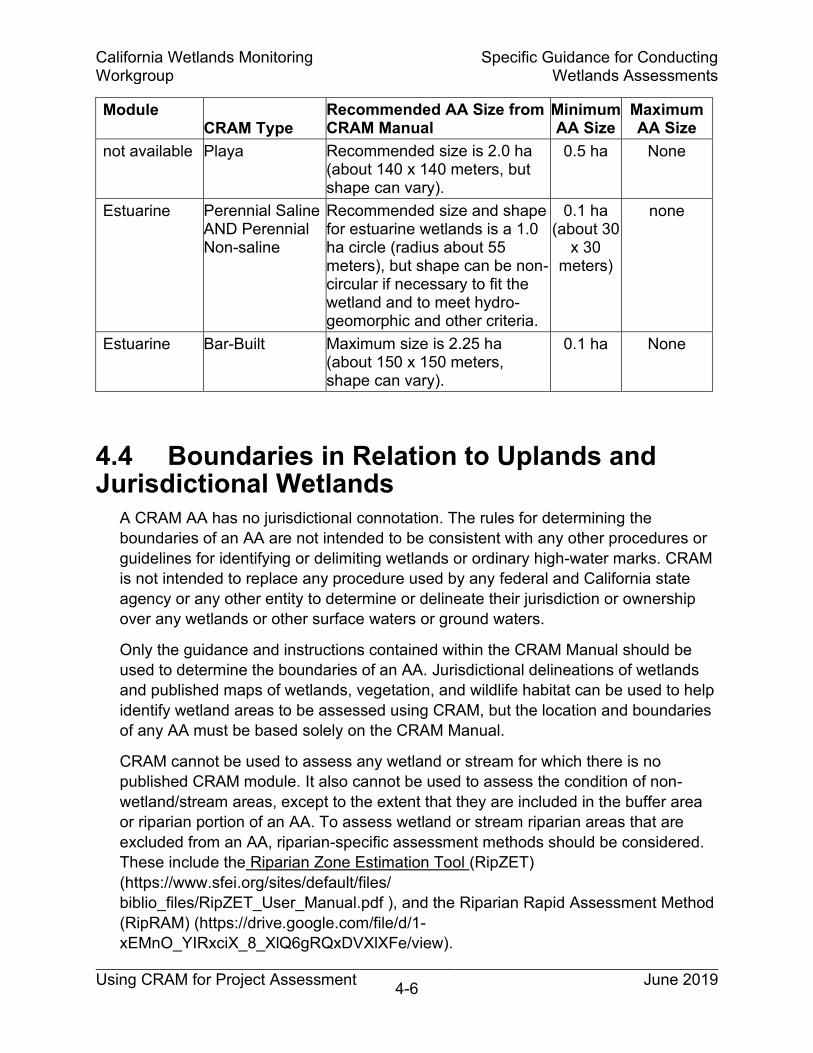
California Wetlands Monitoring Workgroup
Specific Guidance for Conducting Wetlands Assessments
Using CRAM for Project Assessment 4-6 June 2019
Module CRAM Type
Recommended AA Size from CRAM Manual
Minimum AA Size
Maximum AA Size
not available Playa Recommended size is 2.0 ha (about 140 x 140 meters, but shape can vary).
0.5 ha None
Estuarine Perennial Saline AND Perennial Non-saline
Recommended size and shape for estuarine wetlands is a 1.0 ha circle (radius about 55 meters), but shape can be non-circular if necessary to fit the wetland and to meet hydro-geomorphic and other criteria.
0.1 ha (about 30
x 30 meters)
none
Estuarine Bar-Built Maximum size is 2.25 ha (about 150 x 150 meters, shape can vary).
0.1 ha None
4.4 Boundaries in Relation to Uplands and Jurisdictional Wetlands
A CRAM AA has no jurisdictional connotation. The rules for determining the boundaries of an AA are not intended to be consistent with any other procedures or guidelines for identifying or delimiting wetlands or ordinary high-water marks. CRAM is not intended to replace any procedure used by any federal and California state agency or any other entity to determine or delineate their jurisdiction or ownership over any wetlands or other surface waters or ground waters.
Only the guidance and instructions contained within the CRAM Manual should be used to determine the boundaries of an AA. Jurisdictional delineations of wetlands and published maps of wetlands, vegetation, and wildlife habitat can be used to help identify wetland areas to be assessed using CRAM, but the location and boundaries of any AA must be based solely on the CRAM Manual.
CRAM cannot be used to assess any wetland or stream for which there is no published CRAM module. It also cannot be used to assess the condition of non-wetland/stream areas, except to the extent that they are included in the buffer area or riparian portion of an AA. To assess wetland or stream riparian areas that are excluded from an AA, riparian-specific assessment methods should be considered. These include the Riparian Zone Estimation Tool (RipZET) (https://www.sfei.org/sites/default/files/ biblio_files/RipZET_User_Manual.pdf ), and the Riparian Rapid Assessment Method (RipRAM) (https://drive.google.com/file/d/1-xEMnO_YIRxciX_8_XlQ6gRQxDVXlXFe/view).

California Wetlands Monitoring Workgroup
Specific Guidance for Conducting Wetlands Assessments
Using CRAM for Project Assessment 4-7 June 2019
4.5 Seasonal Variability of CRAM Assessments The Assessment Window is the period of time each year when assessments of wetland/stream condition based on CRAM should be conducted to achieve the most reliable CRAM scores. An Assessment Window exists for all attributes and metrics of each wetland/stream type, but different types of wetlands/streams can have different Assessment Windows, and all are subject to inter-annual variation due to that year’s weather. In general, the CRAM Assessment Window falls within the growing season for the characteristic plant community of the wetland/stream type to be assessed. For example, the window is not the same for vernal pools and estuarine wetlands. For wetlands that are not subject to snowfall and that are non-tidal, the main growing season usually extends from mid-March through September, although it may begin earlier at lower latitudes and altitudes. The growing season tends to start earlier for tidal wetlands, due to high spring tides that initiate plant growth in February. For wetlands subject to snowfall, the start of the growing season is delayed by the spring thaw, which at very high elevations may not happen until late May or early June, depending on the depth of the snow pack. For wetlands that are inundated seasonally (e.g., vernal pools, playas, and some slope wetlands), the growing season will generally be mid-March through July. Noticeable, and potentially significant, variation in Metric Scores—especially for biotic structure—can arise between early and late season assessments within the acceptable Assessment Window.
The greatest level of certainty and reliability will be achieved when CRAM assessments are conducted within the appropriate Assessment Window. For regulatory application, it may be necessary to conduct CRAM outside the Assessment Window. Doing so may lower confidence in the scores and may lead to erroneous results in some wetland/stream types that are characterized by strong seasonality, such as vernal pools. Moreover, some indicators, such as those for plant metrics, may be more sensitive to seasonal effects than others, such as physical structure (although physical patch diversity can express seasonal variability). Some experts can reconstruct conditions for the Assessment Window after it has closed, using forensic botany and other field techniques. Assessments conducted outside the proper Assessment Window might be regarded as temporary until replaced by assessments conducted during the subsequent assessment period. In all cases, it should be clearly noted on the CRAM data sheets if an assessment is being done outside the designated Assessment Window for that wetland/stream type.

California Wetlands Monitoring Workgroup
Specific Guidance for Conducting Wetlands Assessments
Using CRAM for Project Assessment 4-8 June 2019
4.6 Comparing Scores across CRAM Types CRAM assesses condition, which infers overall functional capacity, not absolute function or “value.” Scores rely on CRAM’s internal reference standard, which has been developed using state-wide data specific to each particular wetland or stream type. Therefore, two wetlands or streams of different types with the same CRAM score have the same overall functional capacity relative to their respective reference standards. Because different types of wetlands and streams perform different functions and the CRAM internal reference standard varies by type, a simple comparison of CRAM scores across wetland/stream type does not provide an assessment of the functions being performed, rates of different functions, or aquatic resource value. Level 1 and 3 information will, in most cases, be needed to fully evaluate how two different wetlands or streams compare to each other.
CRAM can be used to compare wetlands/streams of different types and different wetlands/streams of the same type anywhere in the state for the following reasons:
1. CRAM is standardized across wetland/stream types.
a. Every wetland and stream is assessed based on four attributes of condition that are common to all types.
b. Condition is evaluated using a common scale of scores, such that the minimum and maximum possible scores are the same for all wetland and stream types, and they represent the range of conditions expected to occur statewide from worst to best.
2. CRAM is not biased for or against any wetland or stream type.
a. Although every wetland and stream is assessed using the same four universal attributes of condition, the attributes are assessed using sets of metrics specific to each wetland/stream type and scaled relative to the ranges observed for that type.
b. The AA for each wetland/stream type represents the minimum area of wetland/stream that tends to demonstrate natural self-maintenance of good condition. This minimizes the systematic error of the procedures for all types.
c. Every assessment is subject to the same QA/QC procedures designed to minimize the effects of bias among practitioners.
4.7 Type Conversion Type conversion involves the natural or anthropogenic changes in a wetland or stream from one type to another. Anthropogenic changes may be planned (e.g., development or restoration projects) or unplanned (e.g., levee breaks, illegal filling). CRAM assesses condition, which infers overall functional capacity, not absolute
California Wetlands Monitoring Workgroup
Specific Guidance for Conducting Wetlands Assessments
Using CRAM for Project Assessment 4-9 June 2019
function or “value.” CRAM, in combination with Level 1 and 3 information, can be used to track all these varieties of type conversion.
4.7.1 Natural Type Conversion Many wetlands and streams are subject to periodic disturbances that are natural and even necessary for them to maintain their structural complexity. For example, drought and flooding are part of the natural history of riverine systems. Wildfire can be necessary to maintain the ecological diversity of depressional wetlands, including vernal pools. Natural processes can also convert one wetland/stream type to another. For example, natural migration of a riverine channel can isolate a meander to create a depressional wetland, and a lacustrine wetland can be converted to a depressional wetland through natural sedimentation. Natural conversions can be rapid, as when a landslide converts a stream into a depression wetland by impounding the stream flow. Evidence of such disturbances are not reasons to avoid using CRAM.
CRAM can be used to track the recovery of wetlands and streams from such disturbance. The CRAM data sheets provide a location to note if the AA was recently affected by these and other kinds of disturbances. Such notification will help interpret CRAM scores.
When using CRAM to assess gradual type conversion, CRAM modules for both the original and anticipated future wetland/stream type should initially be used. Over time, the assessments will likely show changing conditions for the original type and changing conditions for the new type. Use of the module for the original type can stop when the trends in condition for the two types intersect because that point suggests that the wetland/stream has undergone sufficient conversion to be considered as the new type (Figure 2). For more abrupt natural type changes, the period of time for which both modules should be used will be much shorter, with likely only a single (or few) assessments using the module for the prior type being necessary (Figure 3).

California Wetlands Monitoring Workgroup
Specific Guidance for Conducting Wetlands Assessments
Using CRAM for Project Assessment 4-10 June 2019
Figure 2. Trends in the Condition of a Hypothetical Wetland Area Gradually Converted from One Wetland Type to Another, Showing Decreasing Conditions for the Original Type and Increasing Conditions for the New Type, After the Conversion Is Completed.
Use of the CRAM module for the converted wetland/stream can stop after the temporal trends in condition for the two types intersect (red circle).
4.7.2 Planned Anthropogenic Type Conversion Intentional type conversions are planned and permitted. For example, a stream might be dammed to create a lacustrine or depression wetland, or a dam might be removed to restore the stream. Similarly, a depressional wetland might result from diking an estuarine wetland, or an estuarine wetland might be restored by breaching its dikes. Under present-day wetland conservation practices, most intentional conversions are usually reversals of previous conversions to restore the original wetland type.
CRAM can be used, in combination with Level 1 and 3 information, to track the effects of type conversion. Ideally, this involves pre- and post-conversion assessments, which would involve applying two different CRAM modules. The original type should ideally be assessed using its appropriate module for at least 2 years prior to being converted. Once the construction for the conversion is completed, assessments using the module for the converted type should begin. The assessment using the new module should continue until the CRAM scores stabilize over time. Gradual type conversion should be evaluated using an analysis such as the one shown in Figure 2. Abrupt type conversion would be more represented by an analysis such as the one shown in Figure 3.

California Wetlands Monitoring Workgroup
Specific Guidance for Conducting Wetlands Assessments
Using CRAM for Project Assessment 4-11 June 2019
Figure 3. Trends in the Condition of a Hypothetical Wetland Area Abruptly Converted from One Wetland Type to Another. Use of the CRAM module for the converted wetland can stop after the temporal trends in condition for the two wetland types stabilize.
CRAM alone cannot be used to determine whether or not a type conversion is appropriate. The agencies responsible for wetland protection and restoration should make such determinations based on Level 1, 2, and 3 information. Once a decision is made to allow a type conversion, CRAM can be used to assess the differences in overall functional capacity between the two wetland/stream types. However, wetland functions vary by type, and they also vary among wetlands of any given type, based on site-specific factors. The assessment of type conversion should involve Level 1 and Level 3 data to assess changes in functions, in addition to CRAM, to assess changes in functional capacity.
4.8 Assessing Illegal Impacts Impacts on wetlands and streams are subject to regulations. Impacts conducted without regulatory permission or exemption are illegal. CRAM can be used to assess such impacts, based on a comparison of pre- and post-impact conditions (see Section 4.14, Estimating CRAM Scores). The empirical assessments for the analogue sites (sites near the impact site that are expected to represent its pre-

California Wetlands Monitoring Workgroup
Specific Guidance for Conducting Wetlands Assessments
Using CRAM for Project Assessment 4-12 June 2019
impact condition) and the impact site should be entered into the online CRAM database, but the estimated retrospective scores for the impact site should not be entered, as they do not represent actual conditions of the impact site. See Section 4.14 for more information on estimating CRAM scores
4.9 Assessing Projects CRAM assesses condition, which infers overall functional capacity, not absolute function or “value.” For the purposes of this Technical Bulletin, a project is any human activity that results in a change in the location, abundance, extent, form, structure, or condition of an aquatic resource. This includes any such actions that would alter a wetland or stream through filling, excavation, or other alteration of vegetation, substrates, or hydrology of the wetland or stream. These alterations may be temporary or permanent, may be averse to aquatic resource conditions (e.g., development projects that fill a wetland) or beneficial. Beneficial projects are typically classified as: wetland/stream establishment (creation), re-establishment, restoration, rehabilitation, or enhancement. Beneficial projects may be conducted as voluntary efforts or may be conducted as mitigation for impacts in other places. Mitigation may be conducted pursuant to any public or private procedure, program, policy, or permit (e.g., Sections 404 and 401 of the Clean Water Act), Porter-Cologne Waste Discharge Requirements, a Lake and Streambed Alteration Agreement (Section 1600 of the California Fish and Game Code), or Coastal Development Permit.
4.9.1 Assessing Small Projects The minimum AA sizes are designed to account for sufficient internal structure to adequately capture condition of the site. CRAM should not be used if the wetland/stream is below the minimum specified size (Table 3). Note that some types do not have a minimum AA size allowing for naturally small wetlands/streams to be assessed; however, in all cases the CRAM guidelines for delineating an AA must be followed.
Similarly, there are situations where natural or unnatural features create hydrologic or geomorphic breaks that limit the size of an AA to less than the minimum size required. These natural or unnatural features include bridges or culverts close together (less than 100 meters apart), or a change from a natural bottom to a concrete-line channel, or a narrow canyon opening to a broader floodplain. Guidance on how to establish an AA in the CRAM User’s Manual and various CRAM module field books suggests moving the AA to avoid including these types of breaks within an AA. However, in situations where the AA cannot be moved, and the minimum AA size cannot be achieved, CRAM would not be the appropriate assessment tool.
California Wetlands Monitoring Workgroup
Specific Guidance for Conducting Wetlands Assessments
Using CRAM for Project Assessment 4-13 June 2019
For riverine sites, if access and topography allow, AAs above and below a project site may be informative if the AAs can be placed within a distance that is less than 20 times the bankfull width of the channel (i.e., within the typical extent of up- and downstream effects of a channel feature or modification).
If a CRAM AA will not fit entirely within a small project boundary, the CRAM guidelines should be followed to extend the AA boundary outside the project area to meet minimum or required AA size limits. In these cases, it is important to consider how much of the resulting AA is outside the project boundary. If a relatively small portion of the project includes the AA, the CRAM scores are unlikely to reflect the project’s impacts or benefits relative to the surrounding wetland or stream influence, and the CRAM scores are unlikely to change much over time. For small restoration projects, the CRAM scores may not clearly assess the project’s change in condition relative to reference conditions, as the project action itself likely affects only a small portion of the AA and has minimal influence on the score.
The impacts of a small development project may not be adequately captured or described using CRAM. In these cases, Level 1 or Level 3 information would be more effective in determining the impact or benefits of a project.
In all cases, careful consideration should be given to whether CRAM is the correct assessment tool to use for small projects. Several examples are detailed below.
Example 1: Small Impact Areas within a Large Estuary
In this example (Figure 4), a bridge expansion will result in permanent impacts on a perennial saline estuarine wetland at four locations. The direct impact areas are smaller than the minimum required AA size of 0.1 ha. The AAs were drawn by following the hydro-geomorphic guidelines for perennial saline estuarine wetlands, disregarding the permanent impact boundary. The resulting AAs were larger than the permanent impact areas but met the CRAM AA size criteria. These AAs provide a credible assessment of wetland condition for the impact areas.
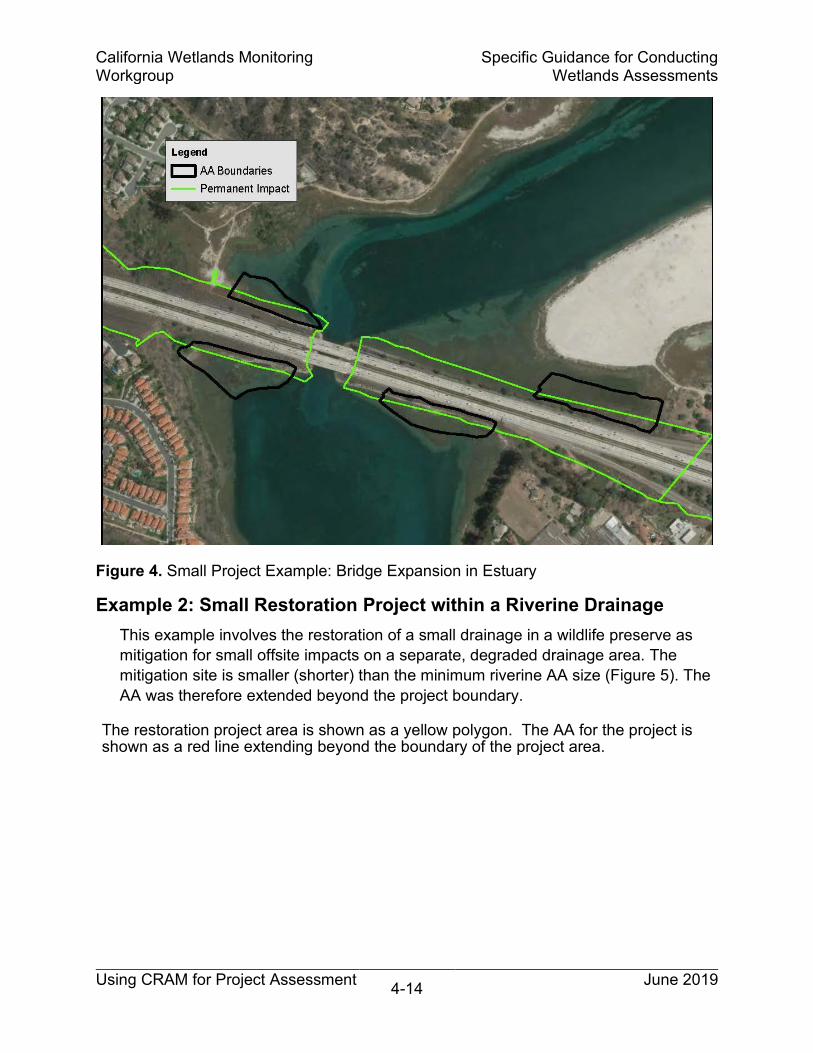
California Wetlands Monitoring Workgroup
Specific Guidance for Conducting Wetlands Assessments
Using CRAM for Project Assessment 4-14 June 2019
Figure 4. Small Project Example: Bridge Expansion in Estuary
Example 2: Small Restoration Project within a Riverine Drainage This example involves the restoration of a small drainage in a wildlife preserve as mitigation for small offsite impacts on a separate, degraded drainage area. The mitigation site is smaller (shorter) than the minimum riverine AA size (Figure 5). The AA was therefore extended beyond the project boundary.
The restoration project area is shown as a yellow polygon. The AA for the project is shown as a red line extending beyond the boundary of the project area.

California Wetlands Monitoring Workgroup
Specific Guidance for Conducting Wetlands Assessments
Using CRAM for Project Assessment 4-15 June 2019
Figure 5. Small Project Example: Small Riverine Restoration.
Example 3: Small Restoration Project Within a Large Depressional Wetland This example involves the restoration of a small portion of the edge of a larger depressional wetland. The AA was drawn following the hydro-geomorphic guidelines to meet the preferred AA size, which comprises a very small portion of the encompassing wetland but includes the entire restoration area (Figure 6). In this example, it is important to realize that a change in condition in the restoration area may only result in a modest change in the condition of the larger wetland given the latter’s much larger size; i.e., the benefits may be discernable via Level 3 assessment tools for targeted functions, but not at Level 2.

California Wetlands Monitoring Workgroup
Specific Guidance for Conducting Wetlands Assessments
Using CRAM for Project Assessment 4-16 June 2019
Figure 6. Small Project Example: Small Depressional Restoration. Assessing Large Projects
A large project (impact, mitigation, or restoration) may include a single large wetland/stream or multiple distinct wetlands/streams of the same or different classification. In cases where the project boundary encompasses features that are larger than the maximum or recommended AA size, multiple CRAM assessments may be needed to adequately characterize wetland/stream condition. As shown in Table 3, recommended and maximum AA sizes are provided for each CRAM type to facilitate achieving target accuracy and precision levels.

California Wetlands Monitoring Workgroup
Specific Guidance for Conducting Wetlands Assessments
Using CRAM for Project Assessment 4-17 June 2019
Heterogeneity generally increases with wetland/stream size, making it more difficult to determine Metric Scores that characterize the overall AA. In addition, it is difficult for practitioners to consistently assimilate natural variability over a large area into an overall score. Therefore, where the project area exceeds the maximum AA size, projects should be divided into multiple AAs, with each AA capturing a relatively homogenous portion of the overall wetland/stream. The multiple AAs can be assigned to the wetland/stream as a whole, or large heterogeneous wetlands/streams can be divided into smaller homogenous areas based on differences in hydrology, physical setting, dominant habitats, or other attributes.
In some cases, it may be possible to assess all the mutually exclusive AAs within a large wetland/stream or project boundary. In other cases, it may not be practical to assess all the AAs; therefore, a representative subset of all the potential AAs may be selected. The steps below describe the process of sampling a large wetland/stream/project (Figure 7). Additional procedures for the use of CRAM to assess large projects are presented in Appendices B and C.
1. Define the Project Boundary as the spatial limit of the project, as agreed upon by its sponsors and public agencies with planning or regulatory authority over the project.
2. Define the Sample Frame as the large wetland/stream (or wetlands/streams) that need to be assessed. The wetland/stream may be defined by jurisdictional delineation, the CRAM Manual, or the Standard Operation Procedure of the CARI. A Sample Frame encompasses all the possible AAs within all the wetlands/streams within the project boundary.
3. Define Sampling Strata as sub-regions of the Sample Frame that are likely to have markedly different Hydrology, Physical Structure, or Biological Structure Attribute Scores, and are large enough to warrant dedicated AAs, to assure that their contributions to the overall condition of the Sample Frame is not underestimated. Not all projects will have Sampling Strata, particularly if the wetlands/streams are relatively homogenous.
4. Map AAs for Each Sampling Strata based on the recommended AA size ranges. The AAs should not overlap and should encompass all wetland/stream area within the Sample Frame. Any AA that extends outside the frame by more than 50% is rejected as a possible AA. If the entire wetland/stream is covered by three or fewer AAs, then assess these AAs, and average the scores. If it takes more than three AAs to cover the entire wetland/stream, then proceed to the next step.
5. Develop the Sample Draw using a random number generator to select the order in which the target AAs will be assessed to represent the wetland/stream. This can be done manually or in a geographic information system (GIS). Begin by randomly selecting four AAs.

California Wetlands Monitoring Workgroup
Specific Guidance for Conducting Wetlands Assessments
Using CRAM for Project Assessment 4-18 June 2019
6. Conduct a Sequential CRAM Assessment of the randomly selected AAs in each stratum. For each stratum, assess the first four AAs (in order) on the randomized list. Compare the average of the first three AAs to the scores from the fourth, and if the Index and Attribute Scores are within the precision limits shown in Table 2, stop sampling. If the comparison shows scores that are greater than the precision limits shown in Table 2, the fifth randomly selected AA should be assessed and compared to the average Index and Attribute Scores of the first four AAs. This process should continue until the comparison of the averaged Index and Attribute Scores and the last sampled AA score are within the Table 2 precision limits or until all AAs within the Sample Frame (or Stratum) have been sampled. This (sequential) analysis will provide a recommendation for the minimum number of AAs that should be evaluated for large projects. However, agencies (at their discretion) may require a higher intensity of monitoring based on project size or condition/threat, or where more stringent calculations of site-specific precision are warranted.
7. Calculate an Overall Condition Score by averaging the CRAM scores for all AAs assessed. In addition to the average (mean) score, the standard deviation and minimum and maximum AA scores should be reported to characterize the range and variability among the AAs that make up the overall wetland/stream area.
Examples of the approach for assessing large wetlands/streams are provided in Appendix B.

California Wetlands Monitoring Workgroup
Specific Guidance for Conducting Wetlands Assessments
Using CRAM for Project Assessment 4-19 June 2019
Figure 7. Example Sample Draw. (Red is the Project Boundary, green is the limit of Sample Frame (wetland boundary) and grey is wetlands outside of the evaluation area B. Map of all potential AAs in the Sample Frame (maximum number of 1 hectare candidate AAs based on estuarine wetland) (circles) generated from grid or GIS C. Red AAs will be rejected for being more than 50% outside of the Sample Frame (red AAs) D. Yellow AAs are between 90% and 80% within the Sample Frame and will be reshaped following CRAM guidelines if assessed.)
4.10 Comparing to Ambient Conditions CRAM assesses condition, which infers overall functional capacity, not absolute function or “value.” AAs can be compared to AAs of the same type within a larger wetland/stream, between wetlands/streams, and between an AA of interest and reference sites. This is further described below and in Appendix C. However, it is also desirable to compare a wetland/stream AA to ambient conditions defined by probabilistic surveys whenever possible. Probabilistic surveys comprise an important sampling approach to assess the conditions of populations of wetlands/streams for
California Wetlands Monitoring Workgroup
Specific Guidance for Conducting Wetlands Assessments
Using CRAM for Project Assessment 4-20 June 2019
large projects, watersheds or other landscapes, regions, and statewide. The primary output from a probabilistic survey is a Cumulative Distribution Function (CDF) plot, which estimates the proportion of total assessed area less than or equal to any given CRAM score with a known level of confidence. The CDF is a representation of the range and distribution of scores in a given area and depicts the overall ecological condition of the wetlands or streams in the area being assessed. CDFs do not represent the condition of any specific site but provide a landscape (or watershed) context for comparing individual sites to the overall ambient conditions. CDFs can be presented in tabular or graphical format. Survey results can be plotted against the standard condition tertiles to characterize the proportion of poor, fair, and good wetland areas (or stream lengths). CDFs for different areas of interest can be plotted together and used to compare the overall ecological condition between areas based on any aspect of their CDFs, such as their percentile scores (e.g., their score for the 50th or 75th percentiles), as well as the proportions of wetland/stream areas in each condition class (Figure 8). The same approach can be used to compare wetland/stream types.
Figure 8 compares the overall condition of streams in two different watersheds by overlaying their CDFs and summarizing the scores in bar charts that show the proportion of stream lengths distributed between the standard CRAM condition classes (tertiles).The CDF for Watershed B (Coyote Creek) plots further to the right in Figure 8.A, indicating that streams in Watershed B are generally in better condition than streams in Watershed A (Guadalupe River). Figure 8.B summarizes the scores in terms of CRAM standard condition classes (tertiles), indicating a greater proportion of streams in good condition in Watershed B.
The Index Scores corresponding to any percentile are always higher for Watershed B. The lowest Index Scores for watershed A are in the 30s, and 14% of the streams are classified as having poor condition. In contrast, the lowest scores in watershed B are in the 40s, and only 2% of the streams are classified as having poor condition.

California Wetlands Monitoring Workgroup
Specific Guidance for Conducting Wetlands Assessments
Using CRAM for Project Assessment 4-21 June 2019
Figure 8. Cumulative Distribution Function plots (CDFs) Can Be Plotted Together to Compare the Ecological Condition of Different Areas of Interest. (B) Proportions of Stream Length in Each Condition Class. (C) Map Illustrating Assessment Areas Color-coded By Condition Class to Illustrate the Spatial Distribution of Condition in Watershed A (Guadalupe River) and Watershed B (Coyote Creek) Based on CRAM.
4.11 Temporal Comparisons CRAM assesses condition, which infers overall functional capacity, not absolute function or “value.” CRAM can be used to track the changes in condition of individual wetlands and streams over time. There are many applications of temporal monitoring using CRAM, but these are generally iterations over time of assessments for individual sites or groups of sites. Examples include, but are not limited to, the following:

California Wetlands Monitoring Workgroup
Specific Guidance for Conducting Wetlands Assessments
Using CRAM for Project Assessment 4-22 June 2019
l Assessment of change over time for sites known to be subject to changing environmental conditions; e.g., tidal wetlands responding to sea level rise.
l Assessing the progress and success of wetland projects relative to reference and ambient condition.
l Tracking changes in ambient condition of wetlands and streams across watersheds or other landscapes, regions, and statewide to determine the effects of climate change on wetland condition.
l Tracking changes in ambient condition of wetlands and streams across watersheds or other landscapes, regions, and statewide to determine the effectiveness of policies, programs, and permits to protect and restore wetlands.
4.12 Assessing Project Progress Early guidance by the EPA for wetland restoration planning recommends the use of Habitat Development Curves (HDCs) to forecast and evaluate expected project performance relative to desired or reference conditions (Kentula et al. 1992). HDCs (similar to terms such as “performance curves” or “recovery trajectories”) are developed by assessing conditions of multiple projects of different age and comparing them to the reference range that represents the intended endpoint of project maturation (Kentula et al. 1992, Zedler and Callaway 1999, Matthews et al. 2009). The uses of HDCs include, but are not limited to, the following:
l Assess whether a project is likely to achieve reference condition.
l Project when a project is likely to achieve reference condition.
l Identify projects that may require intervention to succeed. In these cases, the CRAM Attribute and Metric Scores may be used in conjunction with Level 3 data to guide changes in project design or management.
l Establish performance standards for wetland and stream projects. For example, projects might be required to be on or above the curve by Year 5 or be on a trajectory to intercept the curve within a reasonable period.
HDCs have been developed for three CARI aquatic resource types (riverine, estuarine, and depressional) using existing CRAM assessments from sites across California. Each curve represents the average rate of development bounded by its 95% CI, plus the average condition and 95% CI for the reference sites. Projects that are well-designed for their location and setting, and well-managed tend to be on or above the curve. In general, as projects age, their habitats should mature, gaining similarity to the reference sites, such that the project’s CRAM scores increase. HDCs for the CRAM Attributes and Metrics can be used to understand and correct habitat developmental problems.

California Wetlands Monitoring Workgroup
Specific Guidance for Conducting Wetlands Assessments
Using CRAM for Project Assessment 4-23 June 2019
The statewide HDC for estuarine wetland is shown in Figure 9. These HDCs represent the entire developmental timeframe for these wetland types. Close examination of the statewide HDC for estuarine wetlands reveals that the mean value of the reference range is 80. This is greater than the score of 75 used to demarcate good from fair wetlands, based on the standard tertiles of the potential range in scores. The greater value of 80 is due to the large number of reference sites occurring along the coast that score in the 90th percentile. Different reference ranges can be expected for different regional HDCs.
Figure 9. Statewide Habitat Development Curves for Estuarine Wetlands. The curve is enlarged for the range in age from 0 to 80 years. The mean score of the reference range is 80.
The following three examples of using CRAM to assess temporal changes in condition for individual wetlands utilize the same data from the Corte Madera Marsh Restoration Project that were used in previous examples of CRAM spatial analyses. These three new examples focus on CRAM results from Year 1 and Year 5 of the project. Because the project was completed in early 2018, the Year 5 results are forecasts (Table 4 and Figure 10). The projected results indicate a marked improvement in biological structure due to the expected development of the vegetation cover. See Section 4.14 for more discussion of forecasting CRAM scores.

California Wetlands Monitoring Workgroup
Specific Guidance for Conducting Wetlands Assessments
Using CRAM for Project Assessment 4-24 June 2019
Table 4. CRAM Index and Attribute Scores for Year 1 and Year 5 of the Corte Madera Marsh Restoration Project
CRAM Score Year 1 Year 5 Index Score 58 67 Buffer and Landscape Context 68 68
Hydrology 75 75 Physical Structure 63 63 Biotic Structure 25 61
Figure 10. Number Line Graph Showing CRAM Index and Attribute Scores with Their Precision Ranges for Year 1 (Red) and Year 5 (Blue) of the Corte Madera Marsh Restoration Project, Superimposed on Standard Condition Classes (Poor, Fair, Good)
HDCs are especially useful for assessing temporal changes for projects. To illustrate this use of an HDC, the Year 1 and Year 5 Index Scores for the Corte Madera Marsh Restoration Project were plotted on the statewide HDC for estuarine wetlands (Figure 11).

California Wetlands Monitoring Workgroup
Specific Guidance for Conducting Wetlands Assessments
Using CRAM for Project Assessment 4-25 June 2019
Figure 11. CRAM Index Scores for Year 1 (Red Dot) and Year 5 (Blue Dot) of the Corte Madera Marsh Restoration Project Plotted on the Statewide Habitat Development Curve for Estuarine Wetlands. Mean of Reference Range Scores is 80.
The temporal change in overall condition of the Corte Madera Project can also be evaluated by plotting its Year 1 and Year 5 Index Scores on the San Francisco Bay regional CDF (Figure 12). The plot shows that the project is projected to remain in the fair condition class based on its CRAM score but will improve from the 5th to the 22nd percentile of ambient condition. However, for the project to contribute to improved conditions for the region as a whole, its Index Score must exceed the 50th percentile threshold score of 73. However, the position of the site on the HDC suggests that the site on an appropriate trajectory to ultimately achieve the desired goals. Examination of the Attribute and Metric Scores suggest that additional management to improve its hydrology and physical structure can help ensure that the site remains on the desired trajectory.

California Wetlands Monitoring Workgroup
Specific Guidance for Conducting Wetlands Assessments
Using CRAM for Project Assessment 4-26 June 2019
50th percentile score = 73
Figure 12. Year 1 (Red Dot) and Year 5 (Blue Dot) Index Scores for the Corte Madera Marsh Project Plotted on the Cumulative Distribution Function Curve of Ambient Overall Condition of Estuarine Wetlands in the San Francisco Bay Eco-Region, Showing the 50th Percentile Score (73)
Regional or extra-regional factors can affect the shape of an HDC and thus alter the prognosis of projects. For example, climate change may increase the frequency or duration of droughts, and thus prolong the developmental timeframe for depressional wetlands. Accelerated sea level rise may postpone or prevent the development of mature, high-elevation estuarine wetlands, which usually manifest the reference condition for estuarine wetland restoration. CRAM metrics can help track the responses of wetland/stream projects and natural wetlands/streams to changes in these kinds of large-scale drivers of ambient condition.
4.13 Assessing Ambient Change Probabilistic ambient surveys can be repeated over time to evaluate changes in ambient conditions for any landscape area (e.g., watershed, region, or statewide). Change is evaluated by comparing the CDFs generated from different surveys (see

California Wetlands Monitoring Workgroup
Specific Guidance for Conducting Wetlands Assessments
Using CRAM for Project Assessment 4-27 June 2019
Section 4.10 for a description of CDFs). The CDFs can represent completed surveys of past and present ambient conditions or can represent anticipated future conditions.
Figure 13 illustrates two CDF curves that show the current (2010) ambient stream conditions for a watershed, overlaid on the estimated future (2050) CDF curve based on planned habitat projects scheduled in the watershed in the near-term and allowed to mature. The planned or expected future CDF serves as a watershed-based performance objective (or goal) for stream restoration and protection in the watershed. This approach to setting ambient goals and tracking progress toward them can be applied to watersheds and other landscape scales.
Figure 13. Intended Improvement in the Overall Watershed Condition or Functional Capacity of Streams in an Example Watershed, Comparing Empirical Conditions from 2010 to Estimated Conditions for 2050, Represented by (A) Cumulative Distribution Function curves with 95% Confidence Intervals for the Overall CRAM Index Scores, and (B) Bar Charts of the Proportion of Stream Lengths Distributed between the Standard Condition Classes (tertiles).
In this example (Figure 13), resource managers applied a watershed approach to resource management. They conducted an ambient survey at a watershed scale and designed and planned several habitat improvement projects that largely focus on the stream reaches that scored below the 50th percentile based on CRAM (the blue horizontal and vertical line in Figure 14.A indicates that 50% of stream miles have a CRAM Index Score of ≤76). Based on planned projects, they expect future conditions of those streams to improve over time, especially for the lower 50th
percentile of streams in the watershed, as illustrated by the shift in the CDF curve towards the right. Figure14.B shows the same expected overall improvement in stream condition in a chart using CRAM condition classes (or tertiles). The chart illustrates that the amount of stream miles in good ecological condition is expected

California Wetlands Monitoring Workgroup
Specific Guidance for Conducting Wetlands Assessments
Using CRAM for Project Assessment 4-28 June 2019
to increase by ~27% (from 53% in 2010 to 80% in 2050), based on planned habitat projects in the watershed. Additional probabilistic surveys would need to be conducted to verify progress toward the desired CDF goal.
The timeframe for measurable changes in ambient condition due to wetland/stream improvement projects is likely long, perhaps decades, at the watershed or regional scale. This is because the size of projects usually is small, relative to the total area of wetlands/streams at the watershed or regional scale, and many projects take years to complete. To show progress sooner, projects can be required to score above the 50th percentile of the relevant CDF within a reasonably short period. It can be assumed that any project scoring above the 50th percentile is making an incremental improvement in the overall ambient condition.
4.14 Estimating CRAM Scores CRAM is a field-based method to assess wetland and stream condition based on empirical observations which infers overall functional capacity, not absolute function or “value.” However, in some situations, gaps in CRAM data can be filled based on reasonable procedures that minimize the uncertainty of the estimates. Estimating CRAM scores should be done with caution. Estimated CRAM scores should not be considered as certain or as defensible as empirical scores. Too many estimated scores in a probabilistic survey can reduce its credibility. One concern about estimated scores is that they may not adequately represent the variability of condition. The following procedures pertain to four kinds of estimates: extrapolation, interpolation, hindcasting, and forecasting.
4.14.1 How to Extrapolate or Interpolate CRAM Scores Two common estimation techniques are extrapolation and interpolation. Extrapolation involves estimating CRAM scores beyond the range of empirical observations based on statistical relationships or trends. Interpolation involves estimating “missing” CRAM scores within the overall range of empirical observations. Spatial extrapolation and interpolation are based on a correlation between CRAM scores and independent measures of condition to estimate scores beyond the limits of the correlated data (i.e., beyond the AAs assessed). The correlation is represented by a best-fit regression model. The model can be linear or non-linear, and multivariate or single variate. The regression model can then be used to estimate CRAM scores for AAs not directly assessed based on values of the other independent measure(s).
Regression models must be based on independent measures of condition. In other words, the condition gradient underlying the correlation must be defined by measures of condition other than CRAM metrics. Example independent measures
California Wetlands Monitoring Workgroup
Specific Guidance for Conducting Wetlands Assessments
Using CRAM for Project Assessment 4-29 June 2019
include, but are not limited to, the age of the wetlands (as used to develop HDCs), percent impervious area, population density of adjacent landscapes, frequency of herbicide applications or other vegetation control efforts, and climatic factors such as rainfall or potential evapotranspiration. In addition, linear regression models must also be based on a linear relationship between independent and dependent variables, a normal distribution, and equal variation of residuals.
Spatial extrapolation and interpolation can be used with caution to estimate scores for inaccessible areas. Extrapolated or interpolated CRAM scores should NOT be entered into eCRAM. The basic step-wise procedure is outlined below.
1. Create a linear regression between CRAM score (y-axis) and the desired independent measures (e.g., wetland age, elevation, catchment imperviousness; x-axis). The regression plot should include representative points along the entire gradient being considered (i.e., try to avoid uneven clusters of points at one end of the plot). As a rule, at least 10 points should be included, and the regression should have a minimum R value of 0.6 (although agency staff may impose stricter requirements). Regression plots can typically be done in MS Excel or similar programs.
2. Select the range along the x-axis where CRAM scores need to be estimated.
3. For each selected area, use its independent (non-CRAM) metrics (x-axis) of condition to estimate the CRAM Score.
4. Report the resulting scores as estimates ±1 standard error of the estimate, based on the 95% confidence interval of the regression. In addition, the number of sample points and the R value of the regression line should be reported.
Extrapolation and interpolation are not always possible to fill gaps in CRAM datasets. Very large projects can encompass conditions that cannot be well represented through regression analysis. For example, consider a transportation project extending for hundreds of miles across multiple ecoregions, climatic regimes, land uses, and human population densities, and involving large numbers of accessible and inaccessible wetlands and streams of multiple types. In this situation, an alternative assessment approach should be used. A Level 1 tool may be appropriate for these situations. Remote CRAM assessments are not recommended.
4.14.2 How to Forecast or Hindcast CRAM Scores Forecasting is the estimation of future CRAM scores and hindcasting is the estimation of past scores. The credibility of either kind of estimation depends on information about the wetland/stream type, size, expected vegetation community, and landscape setting. For hindcasts, this information can sometimes be garnered from historical maps, imagery, written accounts, and modern analogous sites depending on the past time period of interest. Forecasts usually pertain to planned

California Wetlands Monitoring Workgroup
Specific Guidance for Conducting Wetlands Assessments
Using CRAM for Project Assessment 4-30 June 2019
projects and depend on the plan details, including project designs and implementation techniques, as well as information about the present and future project setting.
The practice of hindcasting or forecasting involves stepping through the CRAM assessment methodology with a trained assessment team, scoring each CRAM metric with the best information available, while documenting the data used and the assumptions made, which should be reported with the score estimates. It is very important to identify hindcasts and forecasts as estimates rather than empirical observations. These scores should not be entered into eCRAM. Hindcast and forecast scores can be used in a variety of ways. Examples of some of the uses of hindcasts include estimating:
l Conditions at time zero of a project, as needed to represent the project on an HDC.
l Previous conditions for comparison to existing conditions, as needed to estimate rates of change in condition.
Forecasts can help visualize or estimate:
l Future conditions.
l Future rates of change in condition.
l Likely future conditions relative to reference condition.
Forecasting or hindcasting scores should be done with the utmost care. Projecting ecological condition requires:
l Experienced CRAM practitioners who fully understand each metric and the ranges of potential scores.
l Knowledge of previous ecological condition or knowledge of any future project design, implementation activities, or maintenance plans, that clearly describe and show any project actions, areas affected, vegetation affected, and future maintenance of the project.
l An understanding of other wetlands/streams in the area and what condition is/was possible (this can be informed by data from ambient surveys and/or reference ranges).
l Reasonable estimates of past or future scores, with ample justification or narrative.
l An understanding of how the surrounding landscape has changed or may change (e.g., future protections or development plans, adjacent restoration/mitigation projects).

California Wetlands Monitoring Workgroup
Specific Guidance for Conducting Wetlands Assessments
Using CRAM for Project Assessment 4-31 June 2019
The experienced CRAM practitioners will start with the field assessments of existing condition at the site. They should evaluate each metric, carefully considering how the wetland/stream area, its buffer, and the surrounding landscape has changed or is expected to change in the future. Reference and ambient data should also be considered if they are available. Changes may be of any type and due to any cause, including project implementation plans, land-use changes, or climatic changes. The CRAM practitioner should rely upon support provided by other knowledgeable individuals such as the project design team, local land owners/managers, or professionals with experience in the area. In some instances, best professional judgment of the practitioner will be needed. For each metric, written justification for the scoring decision should be provided, including any necessary sketches, aerial photographs, or descriptions of assumptions. Every effort to represent reasonable historic or future scores should be made. Once scores have been projected, those scores and the justification for the scores should be discussed (e.g., with project partners or with agency staff) so that any assumptions are clear and agreed upon.
Example 4: Forecasting CRAM Scores This example, provided by a proposed flood control project in a Central Coast watershed, shows that a stream will be modified to improve onsite flood conveyance, enhance depressional wetlands on site, and re-establish riverine wetlands off site (Figure 14). Plans for the project include adding physical structural complexity to the existing channel and replacing nonnative riparian vegetation with native species. The current condition of the flood control channel was assessed using CRAM. The future condition of the channel, 25 years beyond project construction, was forecasted, based on the detailed project designs, maintenance plans, knowledge of the site, and knowledge of other reference sites in the region. The 25-year period was chosen to span the time required for planted trees to mature. The resulting present and future Index Scores are compared using a box plot. The comparison suggests a future increase in the average Index Score for the project.
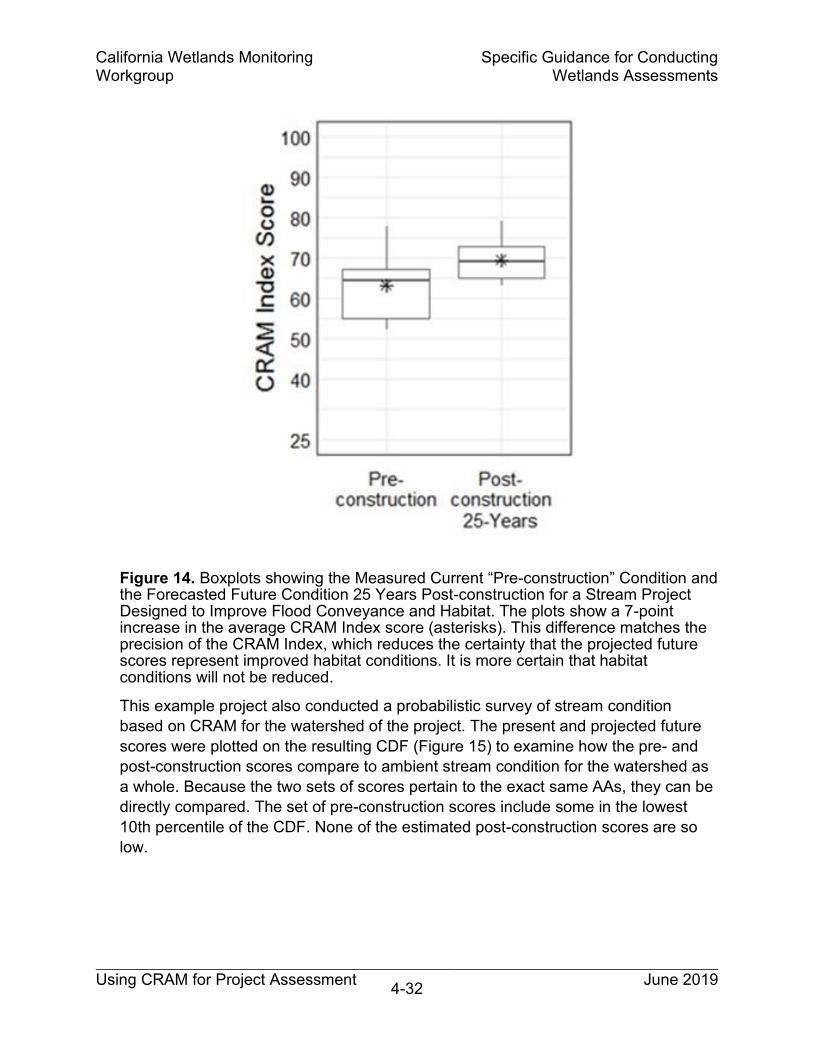
California Wetlands Monitoring Workgroup
Specific Guidance for Conducting Wetlands Assessments
Using CRAM for Project Assessment 4-32 June 2019
Figure 14. Boxplots showing the Measured Current “Pre-construction” Condition and the Forecasted Future Condition 25 Years Post-construction for a Stream Project Designed to Improve Flood Conveyance and Habitat. The plots show a 7-point increase in the average CRAM Index score (asterisks). This difference matches the precision of the CRAM Index, which reduces the certainty that the projected future scores represent improved habitat conditions. It is more certain that habitat conditions will not be reduced.
This example project also conducted a probabilistic survey of stream condition based on CRAM for the watershed of the project. The present and projected future scores were plotted on the resulting CDF (Figure 15) to examine how the pre- and post-construction scores compare to ambient stream condition for the watershed as a whole. Because the two sets of scores pertain to the exact same AAs, they can be directly compared. The set of pre-construction scores include some in the lowest 10th percentile of the CDF. None of the estimated post-construction scores are so low.

California Wetlands Monitoring Workgroup
Specific Guidance for Conducting Wetlands Assessments
Using CRAM for Project Assessment 4-33 June 2019
Figure 15. Current “Pre-construction” and Forecasted Future “Post-construction” CRAM Index Scores for a Flood Control and Habitat Improvement Project in a Central Coast Watershed. Current and future Index Scores for the same project AAs (n=15) are represented by black and blue dots, respectively. The CDF is for the project’s watershed is based on a probabilistic survey of current conditions.

Using CRAM for Project Assessment 5-1 June 2019
Chapter 5 Conclusions and Additional Resources
This Technical Bulletin is intended to provide guidelines for application of CRAM for project evaluation. The guidelines are based on the experiences of many CRAM practitioners and agency staff, informed by the questions, comments, and suggestions received as part of CRAM implementation over the last dozen years. However, every project is somewhat unique, and it is not possible to anticipate every situation or nuance that may arise during CRAM applications. Practitioners are encouraged to caucus among themselves, consult agency staff, and apply their judgment when applying CRAM. In all cases, it is critical to carefully document assumptions and decisions associated with specific CRAM applications. This will allow for open and transparent deliberations on the most appropriate application of CRAM to each project. Furthermore, practitioners are encouraged to submit questions and comments through the CRAM website and interact with the Level 2 Committee so that CRAM can continue to evolve to best meet the needs for rapid wetland and stream assessment in California.
Additional resources to support application of CRAM are available through the following links:
l EcoAtlas Home Page (https://www.ecoatlas.org/ )
¡ About EcoAtlas (https://www.ecoatlas.org/about/ )
l Wetland and Riparian Area Monitoring Plan (WRAMP) Information Site (https://mywaterquality.ca.gov/monitoring_council/wetland_workgroup/wramp/index.html )
¡ WRAMP Document (https://mywaterquality.ca.gov/monitoring_council/wetland_workgroup/docs/2010/tenetsprogram.pdf )
l California Rapid Assessment Method (CRAM) Home Page (https://www.cramwetlands.org/ )
¡ CRAM Trainings (https://www.cramwetlands.org/training)
¡ CRAM Data Entry (https://www.cramwetlands.org/dataentry )
¡ CRAM Field Books (https://www.cramwetlands.org/documents#field+books+and+sops )
¡ CRAM QA Plan (https://www.cramwetlands.org/sites/default/files/CRAM%20data%20QA%20plan%20v7-2016.9.19.pdf )

California Wetlands Monitoring Workgroup
Conclusions and Additional Resources
Using CRAM for Project Assessment 5-2 June 2019
l California Wetland Monitoring Work Group (CWMW) (https://mywaterquality.ca.gov/monitoring_council/wetland_workgroup/docs/2010/tenetsprogram.pdf )
l Habitat Development Curves (HDCs) https://www.ecoatlas.org/about/#hdc
l Cumulative Distribution Function Plots (CDFs) https://www.ecoatlas.org/about/#cram-cdf
Using CRAM for Project Assessment 6-1 June 2019
Chapter 6 References
California Wetlands Monitoring Workgroup (CWMW). 2013. California Rapid Assessment Method (CRAM) for Wetlands. Version 6.1 pp. 67
CWMW. 2018. Quality Assurance Project Plan for the Development of a Wetland Rapid Assessment Method in California, v8.
Kentula M. E., R. P. Brooks, S. E. Gwin, C. C. Holland, A. D. Sherman, and J. C. Sifneos. 1992. An Approach to Improving Decision Making in Wetland Restoration and Creation. U.S. Environmental Protection Agency, Environmental Research Laboratory, Corvallis, OR.
Matthews, Jeffrey & Spyreas, Greg & Endress, Anton. (2009). Trajectories of vegetation-based indicators used to assess wetland restoration. Ecological applications: a publication of the Ecological Society of America. 19. 2093-107. 10.1890/08-1371.1.
Ode, P., and K. Schiff. 2008. Draft Recommendations for the Development and Maintenance of a Reference Condition Management Program (RCMP) to Support Biological Assessment of California‘s Wadeable Streams. A report to the State Water Resources Control Board’s Surface Water Ambient Monitoring Program. 46 pp.
Stein, E. D., M. Sutula, R. Clark, A. Wiskind, and J. Collins. 2007. Improving Monitoring and Assessment of Wetland and Riparian Areas in California through Implementation of a Level 1, 2, 3 Framework. Southern California Coastal Water Research Project Technical Report #555.
Stoddard, J. L., D. P. Larsen, C. P. Hawkins, R. K. Johnson, and R. H. Norris. 2006. Setting Expectations for the Ecological Condition of Streams: The Concept of Reference Condition. Ecological Applications 16:1267–1276.
Zedler, J. B., and J. Callaway. 1999. Tracking Wetland Restoration: Do Mitigation Sites Follow Desired Trajectories? Restoration Ecology 7:69–73.

California Wetlands Monitoring Workgroup
References
Using CRAM for Project Assessment 6-2 June 2019
This page intentionally left blank.
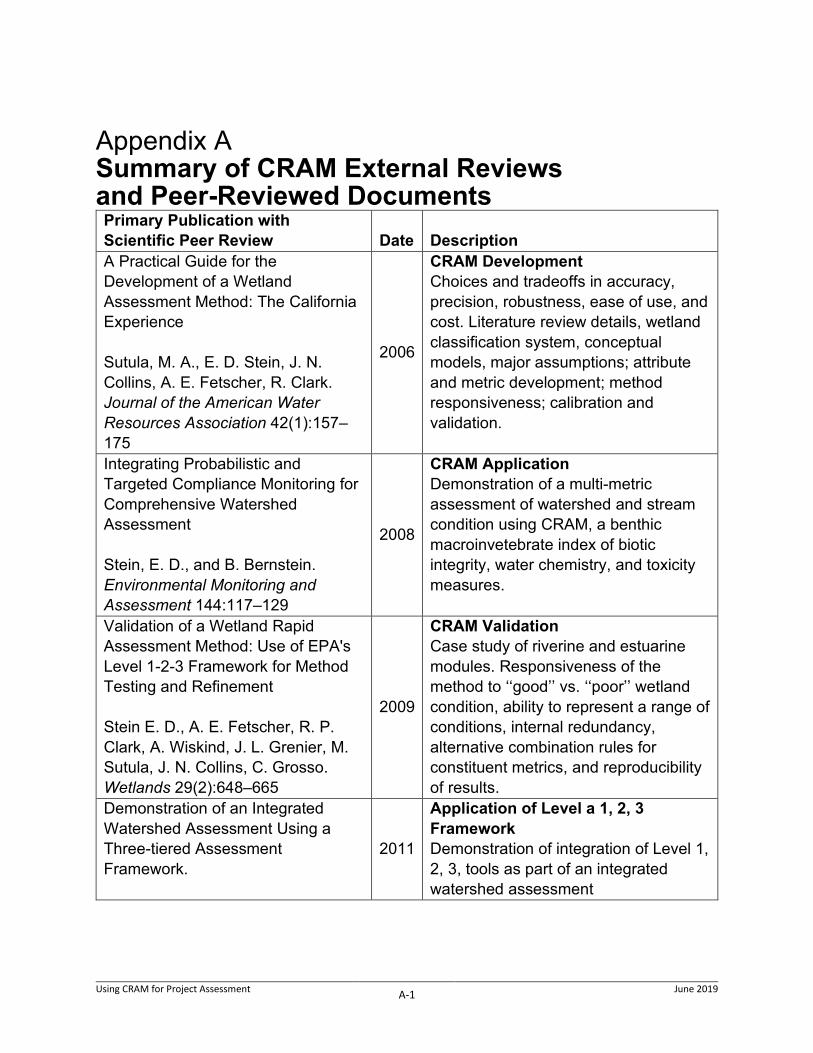
Using CRAM for Project Assessment A-1 June 2019
Appendix A Summary of CRAM External Reviews and Peer-Reviewed Documents Primary Publication with Scientific Peer Review Date Description A Practical Guide for the Development of a Wetland Assessment Method: The California Experience
Sutula, M. A., E. D. Stein, J. N. Collins, A. E. Fetscher, R. Clark. Journal of the American Water Resources Association 42(1):157–175
2006
CRAM Development Choices and tradeoffs in accuracy, precision, robustness, ease of use, and cost. Literature review details, wetland classification system, conceptual models, major assumptions; attribute and metric development; method responsiveness; calibration and validation.
Integrating Probabilistic and Targeted Compliance Monitoring for Comprehensive Watershed Assessment
Stein, E. D., and B. Bernstein. Environmental Monitoring and Assessment 144:117–129
2008
CRAM Application Demonstration of a multi-metric assessment of watershed and stream condition using CRAM, a benthic macroinvetebrate index of biotic integrity, water chemistry, and toxicity measures.
Validation of a Wetland Rapid Assessment Method: Use of EPA's Level 1-2-3 Framework for Method Testing and Refinement
Stein E. D., A. E. Fetscher, R. P. Clark, A. Wiskind, J. L. Grenier, M. Sutula, J. N. Collins, C. Grosso. Wetlands 29(2):648–665
2009
CRAM Validation Case study of riverine and estuarine modules. Responsiveness of the method to ‘‘good’’ vs. ‘‘poor’’ wetland condition, ability to represent a range of conditions, internal redundancy, alternative combination rules for constituent metrics, and reproducibility of results.
Demonstration of an Integrated Watershed Assessment Using a Three-tiered Assessment Framework.
2011
Application of Level a 1, 2, 3 Framework Demonstration of integration of Level 1, 2, 3, tools as part of an integrated watershed assessment

California Wetlands Monitoring Workgroup
Appendix A
Using CRAM for Project Assessment A-2 June 2019
Primary Publication with Scientific Peer Review Date Description Solek, C.W., E.D. Stein, and M.A. Sutula Wetlands Ecology and Management. 19(5):459-474. Determining the Health of California’s Coastal Salt Marshes Using Rapid Assessment
Solek, C. W., M. A. Sutula, E. D. Stein, C. Roberts, R. Clark, K. O’Connor, K. Ritter. WSP Research and Applications March, Section 1:8–28
2012
CRAM Application The integration of rapid assessment methods with probability-based regional survey designs provided a cost-effective means for making unbiased assessments of wetland condition over a large area within a short period.
Assessing California’s Bar-Built Estuaries using the California Rapid Assessment Method
Heady, W.H., R.P. Clark, K. O’Connor, C. Clark, C. Endris, S. Ryan, and S. Stoner-Duncan. Ecological Indicators 58: 300–310.
2015
CRAM Validation Validation of the CRAM module for bar-built estuaries by comparing results of CRAM to other accepted measures of wetland condition including vegetative surveys, water nutrient levels, and GIS landscape scale measures of stress for 32 sites throughout California.
Reports of Studies Advised and Reviewed by Study-Specific Technical Advisory Committees Date Description Ambrose, R. F., J. C. Callaway, and S. F. Lee. An Evaluation of Compensatory Mitigation Projects Permitted Under Clean Water Act Section 401 by the California State Water Quality Control Board, 1991–2002. Report to the State Water Resources Control Board. University of California. Los Angeles, CA, USA. December 2004, 253 pp.
2004
Mitigation Project Review Use of CRAM in the evaluation of mitigation projects in California.
Quigley, M., K. Ranke, D. Miller, R. Morris. Evaluation of Federal Clean Water Act Section 401 Water Quality Certification Wetland and Stream
2006
Mitigation Project Review Use of CRAM and HGM for the evaluation of mitigation projects in the Santa Margarita watershed, California.

California Wetlands Monitoring Workgroup
Appendix A
Using CRAM for Project Assessment A-3 June 2019
Reports of Studies Advised and Reviewed by Study-Specific Technical Advisory Committees Date Description Mitigation Sites in the Santa MargaritaWatershed. A report by the California Regional Water Quality Control Board, San Diego Region, San Diego, CA, USA, January 2006, 107 pages Stein, E. D., M. Sutula, R. Clark, A. Wiskind, and J. Collins. Improving Monitoring and Assessment of Wetland and Riparian Areas in California through Implementation of a Level 1, 2, 3 Framework. Southern California Coastal Water Research Project Technical Report #555.
2007
Application of Level a 1, 2, 3 Framework Discussion of how to apply Level 1, 2, 3 tools (including CRAM) in an integrated manner to support both project and ambient assessment of wetlands and riparian areas
Sutula, M. A., J. N. Collins, R. Clark, R. C. Roberts, E. D. Stein, C. S. Grosso, A. Wiskind, C. Solek, M. May, K. O’Connor, A. E. Fetscher, J. L. Grenier, S. Pearce, A. Robinson, C. Clark, K. Rey, S. Morrissette, A. Eicher, R. Pasquinelli, K. Ritter. California’s Wetland Demonstration Program Pilot. Southern California Coastal Water Research Project Technical Report #572
2008
Ambient Assessment Statewide assessment of ambient extent and condition of estuarine wetlands, plus ambient assessments of riverine wetlands for three demonstration watersheds.
Brown, J.S., E.D. Stein, C. Solek, and A.E. Fetscher. 2016. Assessment of the Condition of Southern California Depressional Wetlands: Application of Macroinvertebrate, Diatom and Overall Condition Indices for Assessing Southern California Depressional Wetlands. Southern California Coastal Water Research Project Technical Report #921
2016
CRAM Validation Adapt three readily available bioassessment tools for assessing depressional wetland condition in southern California, including: a statewide rapid assessment method that had been calibrated and validated for depressional wetlands (CRAM), a macroinvertebrate index, and a benthic diatom index.
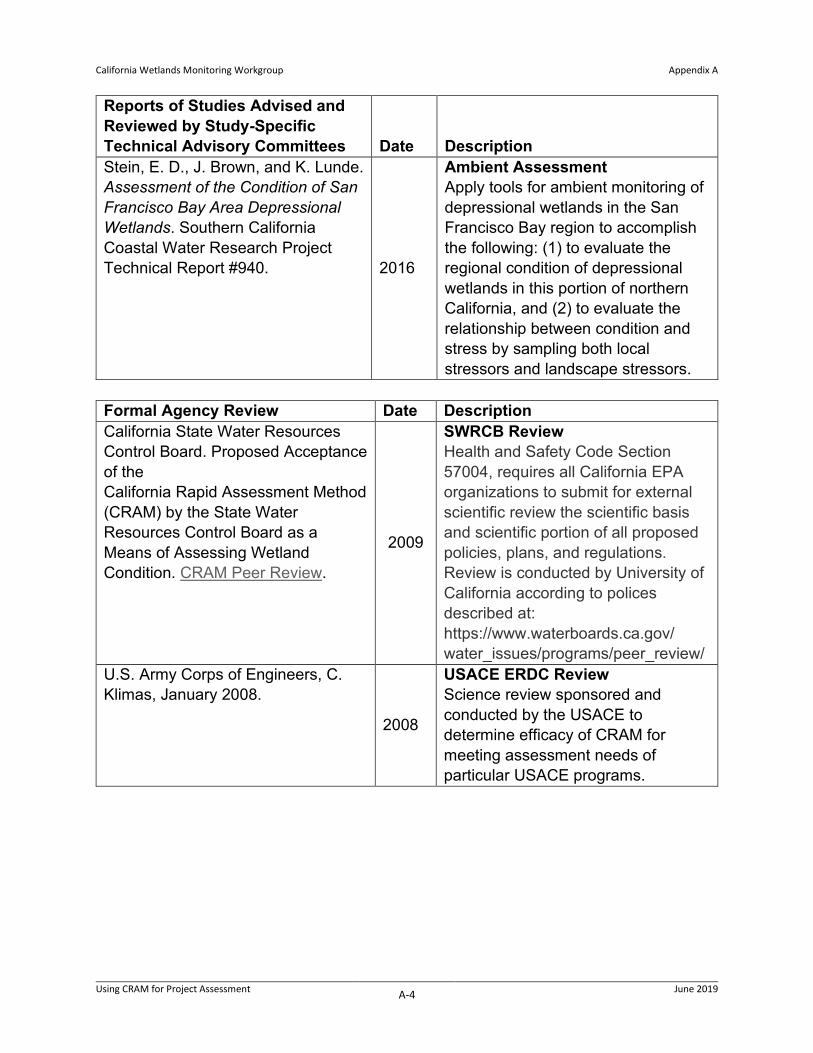
California Wetlands Monitoring Workgroup
Appendix A
Using CRAM for Project Assessment A-4 June 2019
Reports of Studies Advised and Reviewed by Study-Specific Technical Advisory Committees Date Description Stein, E. D., J. Brown, and K. Lunde. Assessment of the Condition of San Francisco Bay Area Depressional Wetlands. Southern California Coastal Water Research Project Technical Report #940. 2016
Ambient Assessment Apply tools for ambient monitoring of depressional wetlands in the San Francisco Bay region to accomplish the following: (1) to evaluate the regional condition of depressional wetlands in this portion of northern California, and (2) to evaluate the relationship between condition and stress by sampling both local stressors and landscape stressors.
Formal Agency Review Date Description California State Water Resources Control Board. Proposed Acceptance of the California Rapid Assessment Method (CRAM) by the State Water Resources Control Board as a Means of Assessing Wetland Condition. CRAM Peer Review.
2009
SWRCB Review Health and Safety Code Section 57004, requires all California EPA organizations to submit for external scientific review the scientific basis and scientific portion of all proposed policies, plans, and regulations. Review is conducted by University of California according to polices described at: https://www.waterboards.ca.gov/ water_issues/programs/peer_review/
U.S. Army Corps of Engineers, C. Klimas, January 2008.
2008
USACE ERDC Review Science review sponsored and conducted by the USACE to determine efficacy of CRAM for meeting assessment needs of particular USACE programs.

Using CRAM for Project Assessment B-1 June 2019
Appendix B Detailed Procedure for Assessing Large Wetlands and Large Projects
A large project (impact, mitigation, or restoration) may include a single large wetland/stream or multiple distinct wetlands/streams of the same or different classification. In cases where the project boundary encompasses features that are larger than the maximum or recommended AA size, multiple CRAM assessments may be needed to adequately characterize wetland/stream condition. The following process and examples illustrate how to sample a large project.
Step 1: Define the Project Boundary The Project Boundary is the spatial limit of the project and is usually designated by the project sponsors and public agencies with planning or regulatory authority over the project. The Project Boundary may include upland and other non-aquatic resource areas. The Project Boundary needs to be imported into a GIS as an overlay on 1-meter pixel resolution aerial imagery or a wetland inventory of comparable resolution and of recent vintage. Whenever possible, the project should be included in EcoAtlas.
Step 2: Define the Sample Frame Overlay the Project Boundary on the aerial imagery in the GIS and digitize the boundary of all wetlands/streams on site, denoting all non-riverine wetlands at least 0.1 ha in area and all streams at least 100 meters in length. The project may contain one large wetland/stream or multiple discrete wetlands/streams. For the purposes of mapping the wetlands/streams may be defined by jurisdictional delineation, the CRAM Manual, or the Standard Operation Procedure of the California Aquatic Resource Inventory (CARI). All the wetlands/streams within the Project Boundary comprise the Sample Frame.
Step 3: Define Sample Strata There may be a variety of reasons to stratify the wetlands/streams within a project, but the primary goal is to capture the variability of the site and ensure that samples are distributed across that variability. Stratification is required for different CRAM types but may be warranted within a distinct type where strong differences in habitat structure, disturbance level, hydrologic regime, adjacent land uses, and other variable may affect CRAM scores. In addition, stratification may be warranted if future management actions will differ significantly between distinct areas on site. A stratum must be large enough to warrant dedicated AAs, to assure that their contributions to the overall condition of the Sample Frame is not underestimated.

California Wetlands Monitoring Workgroup
Appendix B
Using CRAM for Project Assessment B-2 June 2019
Not all projects will have Sampling Strata, particularly if the wetlands/streams are relatively homogenous.
Step 4: Map All Potential AAs within the Sample Frame or Sample Strata
Map all candidate AAs within the Sample Frame/Sampling Strata. For non-riverine wetlands, the AAs should be circles of the recommended size in the appropriate CRAM field book. For streams, the AAs should be polygons or centerlines having the maximum recommended length based on the approximate width of the mapped stream resources. There are two ways to begin: (1) overlay the Sample Frame with a grid having a cell size just large enough to encompass one AA; (2) use GIS to generate a map of the maximum number of non-overlapping AAs. In this step candidate AAs can overlap the edge of the Sample Frame, although they cannot overlap each other.
Any AAs that do not meet the criteria for an AA as presented in the CRAM User’s Manual must be rejected. The following considerations are especially important.
l Each AA should not cross any obvious, major physical changes in topography, hydrology, or infrastructure that significantly control the sources, volumes, rates, or general composition of sediment supplies or water supplies within the AA at the time of the field assessment.
l Each AA can only include one CRAM type. No AA can include any portion of more than one type of wetland/stream, as defined by the CRAM Manual.2
l Reject any candidate AA that is more than 50% outside the Sample Frame. The remaining AAs comprise the total possible AAs for sample consideration.
Step 5. Evaluate Sample Size (Did you sample enough?) Develop the Sample Draw to address the number of AAs needed for the Sample Frame/Sampling Strata? l Step 5A (less than 3 AAs possible). For each Sample Frame or Sampling
Strata only large enough for 1 to 3 AAs, assesses all AAs. l Step 5B (more than 3 AAs possible): For each Sample Frame or Sampling
Strata large enough for four or more mutually exclusive AAs, number the AAs in the Sample Frame and randomly select four for assessments using a random number generator. Conduct a Sequential CRAM Assessment of the randomly selected AAs for in each stratum. For each stratum, assess the first four AA (in order) on the randomized list. Compare the average of the first, second, and third
2 The slope module is the only module that allows for AAs to contain multiple wetland types, e.g., depressions and streams surrounded by slope wetlands.
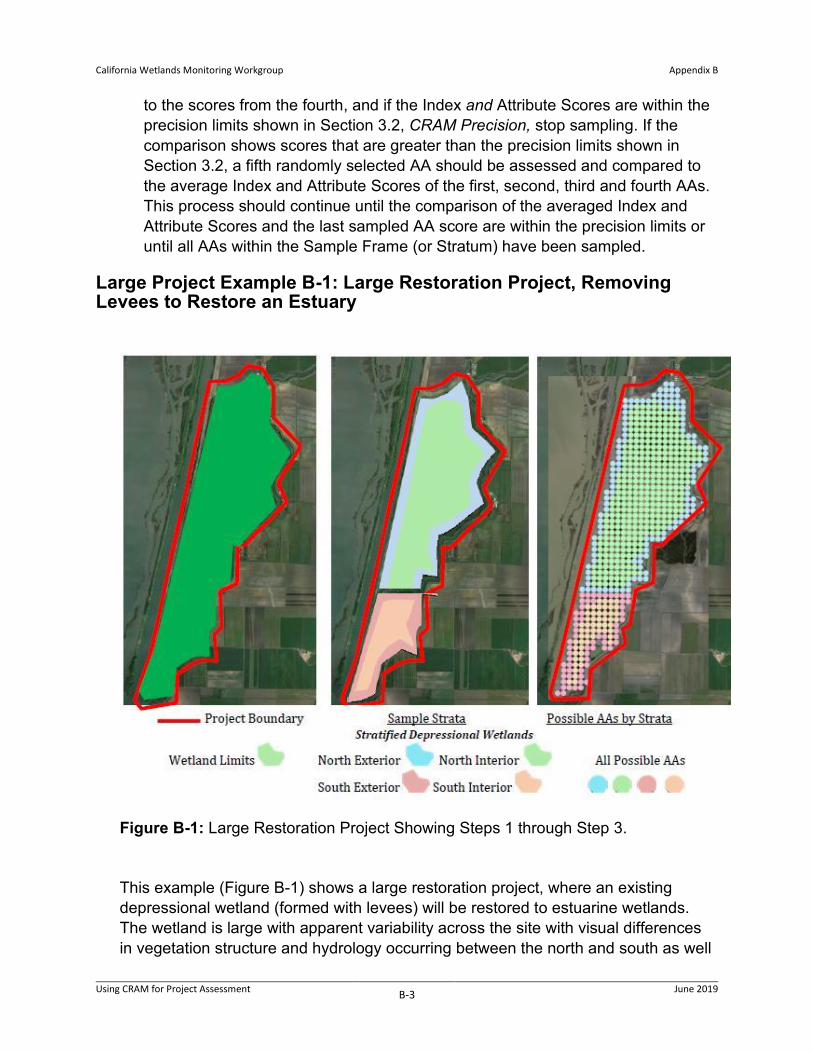
California Wetlands Monitoring Workgroup
Appendix B
Using CRAM for Project Assessment B-3 June 2019
to the scores from the fourth, and if the Index and Attribute Scores are within the precision limits shown in Section 3.2, CRAM Precision, stop sampling. If the comparison shows scores that are greater than the precision limits shown in Section 3.2, a fifth randomly selected AA should be assessed and compared to the average Index and Attribute Scores of the first, second, third and fourth AAs. This process should continue until the comparison of the averaged Index and Attribute Scores and the last sampled AA score are within the precision limits or until all AAs within the Sample Frame (or Stratum) have been sampled.
Large Project Example B-1: Large Restoration Project, Removing Levees to Restore an Estuary
Figure B-1: Large Restoration Project Showing Steps 1 through Step 3.
This example (Figure B-1) shows a large restoration project, where an existing depressional wetland (formed with levees) will be restored to estuarine wetlands. The wetland is large with apparent variability across the site with visual differences in vegetation structure and hydrology occurring between the north and south as well

California Wetlands Monitoring Workgroup
Appendix B
Using CRAM for Project Assessment B-4 June 2019
as the interior and the center of the site. Due to this observed variation (heterogeneity) stratification was deemed necessary to properly sample the site. The Sample Frame (wetland limits) was divided into four categories based on observations of distinctly different vegetation characteristics and potential inundation frequency.
As shown in Figure B-1, the Project Boundary is outlined in red (Step 1), while the Sample Frame is shown in dark green and was mapped based on the jurisdictional delineation completed for the project (Step 2). The mapped wetland features (depressional) were then stratified into four categories (Sample Strata) based on observed variation in site condition shown as four colors. Sample Strata included Interior (North and South) and Exterior (North and South) (Step 3 and Step 4). The Sample Draw was created by randomly selecting AAs from the Sampling Strata, using ArcGIS (Step 5). The Sample Size for each Sampling Stratum was established by implementing a sequential comparison procedure based on calculated precision values for CRAM (Step 6). The Overall Condition Score was calculated by averaging the CRAM scores for all AAs assessed by strata. In addition to the average (mean) score, the standard deviation and minimum and maximum AA scores were reported in order to characterize the range and variability among the AAs that make up the overall wetland area strata.
Large Project Example B-2: Large Solar Project with Stream Features The second example illustrates an impact evaluation for a solar project. As shown in Figure B-2 the Project Boundary is outlined in red (Step 1). The Sample Frame is colored in light and dark blue based on aerial mapping and the jurisdictional delineation (Step 3). These episodic stream features were further stratified into two Sample Strata (categories) based on topographic stream characteristics and flow frequency with dark blue representing the primary drainages and light blue showing the secondary drainages (Step 2). The Sample Draw was then determined by drawing all possible stream assessment (100-meter length center lines) areas on the Sample Strata using GIS and assigning each a number (Step 4). Assessment locations were then selected using a random number generator by strata and sequential comparison was used to determine the sample size (Step 5 and Step 6). The Overall Condition Score was calculated by averaging the CRAM scores for all AAs assessed by strata. In addition to the average (mean) score, the standard deviation and minimum and maximum AA scores were reported in order to characterize the range and variability among the AAs that make up the overall stream strata (Figure B-2).

California Wetlands Monitoring Workgroup
Appendix B
Using CRAM for Project Assessment B-5 June 2019
Figure B-2. Large Solar Project Impact Evaluation. Drainages were stratified by stream type, primary versus secondary drainages.
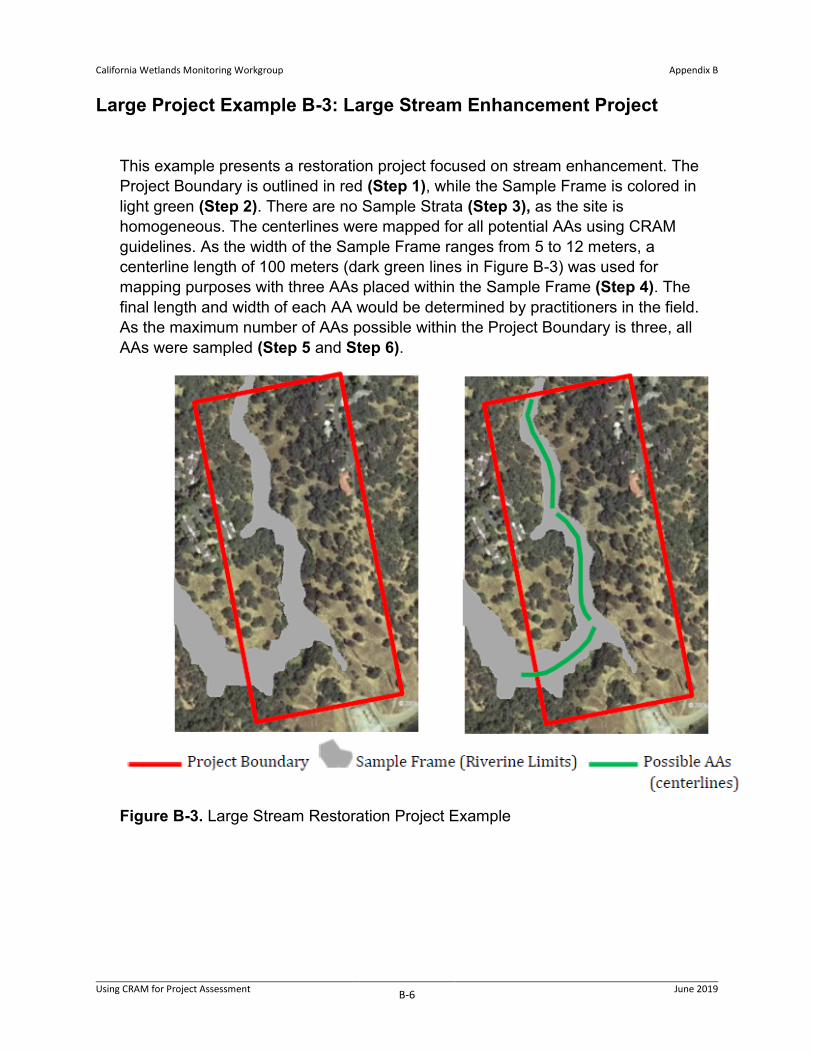
California Wetlands Monitoring Workgroup
Appendix B
Using CRAM for Project Assessment B-6 June 2019
Large Project Example B-3: Large Stream Enhancement Project
This example presents a restoration project focused on stream enhancement. The Project Boundary is outlined in red (Step 1), while the Sample Frame is colored in light green (Step 2). There are no Sample Strata (Step 3), as the site is homogeneous. The centerlines were mapped for all potential AAs using CRAM guidelines. As the width of the Sample Frame ranges from 5 to 12 meters, a centerline length of 100 meters (dark green lines in Figure B-3) was used for mapping purposes with three AAs placed within the Sample Frame (Step 4). The final length and width of each AA would be determined by practitioners in the field. As the maximum number of AAs possible within the Project Boundary is three, all AAs were sampled (Step 5 and Step 6).
Figure B-3. Large Stream Restoration Project Example
California Wetlands Monitoring Workgroup
Appendix B
Using CRAM for Project Assessment B-7 June 2019
This page intentionally left blank.

Using CRAM for Project Assessment C-1 June 2019
Appendix C Example Comparisons Within and Between Wetlands and Streams
This Appendix provides several examples for how to compare CRAM scores. The examples include:
l Comparing scores within a large wetland/stream
l Comparing a single score to another single score
l Comparing a single score to multiple other scores or to a reference range
Before comparing CRAM data from multiple AAs using statistical methods, the data should be checked for normality before parametric tests are used. If the dataset is not normally distributed, transformations or non-parametric tests should be used.
C-1 How to Compare Different Portions of a Large Wetland Large heterogeneous wetlands and streams should be sub-divided into strata if markedly different Hydrology, Physical Structure, or Biological Structure Attribute Scores are expected, and those strata are large enough to warrant dedicated AAs, to assure that their contributions to the overall condition of the Sample Frame is not underrepresented. Not all projects will need Sampling Strata, particularly if they are relatively homogenous. Once divided, each stratum can be assessed for comparison using the procedures outlined in Section 4.9.2, Assessing Large Project, or Appendix B.
All the assessments within each stratum should be used to create an average and standard deviation (±1 SD) for the Index Score and the Attribute Scores for each stratum within the large wetland or stream. The user can then compare strata to determine if the scores represent different ecological conditions. If the SD ranges between strata overlap at the attribute level, the strata cannot be considered significantly different.
Example C-1: Assessing Strata within a Large Depressional Wetland This example utilizes a large depressional wetland in the San Francisco Bay area (Figure C-1). To assess its condition, the wetland was subdivided into two strata: an exterior stratum along the levee characterized by dense stands of trees, and an interior stratum lacking trees. Both strata were assessed following the sampling guidance for large wetland areas in Section 4.9.2. A summary of the average and ±1 SD of the CRAM results for this example is provided in Table C-1.

California Wetlands Monitoring Workgroup
Appendix C
Using CRAM for Project Assessment C-2 June 2019
Table C-1. The Average and Standard Deviation of CRAM Scores for Each Stratum Within the Example Large Wetland. Results are summarized for each stratum (interior and exterior) and the wetland as a whole. Conditions between strata are not different if their numerical scores ±1 SD overlap.
CRAM Score Interior (n = 8)
Exterior (n = 8)
Are Strata Different?
All AAs (n = 16)
Index Score 72 (2) 77 (4) No 74 (4) Buffer and Landscape Context 94.97 (3.11) 94.59 (3.49) No 94.78 (3.2)
Hydrology 87.50 (4.46) 85.42 (7.39) No 86.46 (5.99)
Physical Structure 48.44 (4.42) 50.00 (14.94) No 49.22 (10.67)
Biotic Structure 57.38 (6.57) 76.74 (9.38) Yes 67.06 (12.69)
A non-parametric range test was used to assess the difference between strata. The strata differ only with regard to the Biotic Structure Attribute. In this regard, the exterior stratum is significantly more complex than the interior stratum. This difference is due to the presence of trees and other woody vegetation, which increases the Biotic Structure and CRAM Index scores. Stratification of the large wetland site improved the overall characterization of the site and revealed the contribution of the woody vegetation to the wetland’s overall ecological condition.
C-2 How to Compare Individual AAs from Different Wetlands/Streams
CRAM Index and Attribute Scores from two different wetlands/streams, each with a single AA, can be a compared directly without a statistical test. The comparison is simply based on the difference in scores, considering the reported CRAM precision (Section 3.2). Sites that require more than one AA to characterize their condition will require statistical comparison.
Example C-2: Comparing Two Estuarine AAs In this example, an AA for the Corte Madera Estuarine Marsh Restoration Project, adjacent to San Francisco Bay, California, is compared to an AA in the neighboring Corte Madera Marsh, which is a natural marsh that qualifies as a Project Reference Site (Figure C-1). It should be noted that a site-to-site comparison does not need to involve neighboring sites; any two AAs can be directly compared. Comparison between two individual CRAM scores takes into account CRAM precision: differences between scores must be greater than the precision values listed in Section 3.2 to be 90% confident that they represent different ecological conditions. In this example the Index Scores are more than 7 points apart (the CRAM precision at the Index Score

California Wetlands Monitoring Workgroup
Appendix C
Using CRAM for Project Assessment C-3 June 2019
level), indicating that the two wetland areas represent different ecological conditions. Likewise, the Attribute Scores for Buffer and Landscape Context and Biotic Structure also differ (with scores farther apart than the precision values for each Attribute), which accounts for the difference in Index Scores. The newly restored site has less overall functional capacity than the Project Reference Site.
The CRAM scores for the two sites can also be compared graphically, using a number-line graph (Figure C-2). This graph illustrates how much greater one score must be, based on the CRAM precision estimates listed in Section 3.2, to be confident that the scores are different. This graph plots the Index and Attribute Scores for each AA (red and blue dots), along with the reported CRAM precision points (arrows). If the two dots are outside the arrows, the Index or Attribute Scores can be considered different (e.g., the Index Score, the Buffer and Landscape Context Attribute, and the Biotic Structure Attribute in this example are significantly different at a 90% confidence level). However, if the dots are within the arrows, they cannot be considered different (e.g., the Hydrology Attribute and the Physical Structure Attribute in this example are not significantly different at a 90% confidence level). Based on this direct site comparison, it can be concluded that the Corte Madera Restoration Project has lower overall functional capacity than the Project Reference Site with the exception of Hydrology and Physical Structure, which are not significantly different from the Project Reference Site.
Figure C-1. Map of the Locations of the Corte Madera Marsh Restoration Site AA and the Project Reference Site AA, and Table Comparing Their Index and Attribute Scores. Maps and data were downloaded from EcoAtlas (www.EcoAtlas.org).

California Wetlands Monitoring Workgroup
Appendix C
Using CRAM for Project Assessment C-4 June 2019
Figure C-2. Number Line Graphic Illustrating the Index and Attribute Scores for Corte Madera Marsh Restoration Project (red) and Corte Madera Marsh Reference Site (blue) and the Associated Precision Ranges (arrows)
C-3 How to Compare One AA to Multiple AAs from Another Area Comparisons between a single AA and multiple AAs are compared as a single result compared to the standard deviation of the multiple AAs. The multiple AAs can consist of AAs from a single adjacent wetland/stream, AAs from many adjacent/nearby/regional wetlands/streams, or AAs from reference sites that are selected to create a reference range. The data can be tabulated or plotted; a difference between scores can be inferred if the single score and the standard deviation of the multiple scores do not overlap within the reported precision.
Example C-3: Comparing One Estuarine AA to Multiple Estuarine AAs In this example, the Index and Attribute Scores pertaining to the single AA for the Corte Madera Restoration Project are compared to the mean and standard deviation scores for 15 AAs of the same wetland type within the same region. In this example, it is important to note that the 15 sites were not selected to construct a reference range, rather they represent nearby estuarine wetland conditions. They were selected because they occur within the same local area near the project site, and their watersheds have similar geology, climate, and land use. However, the same
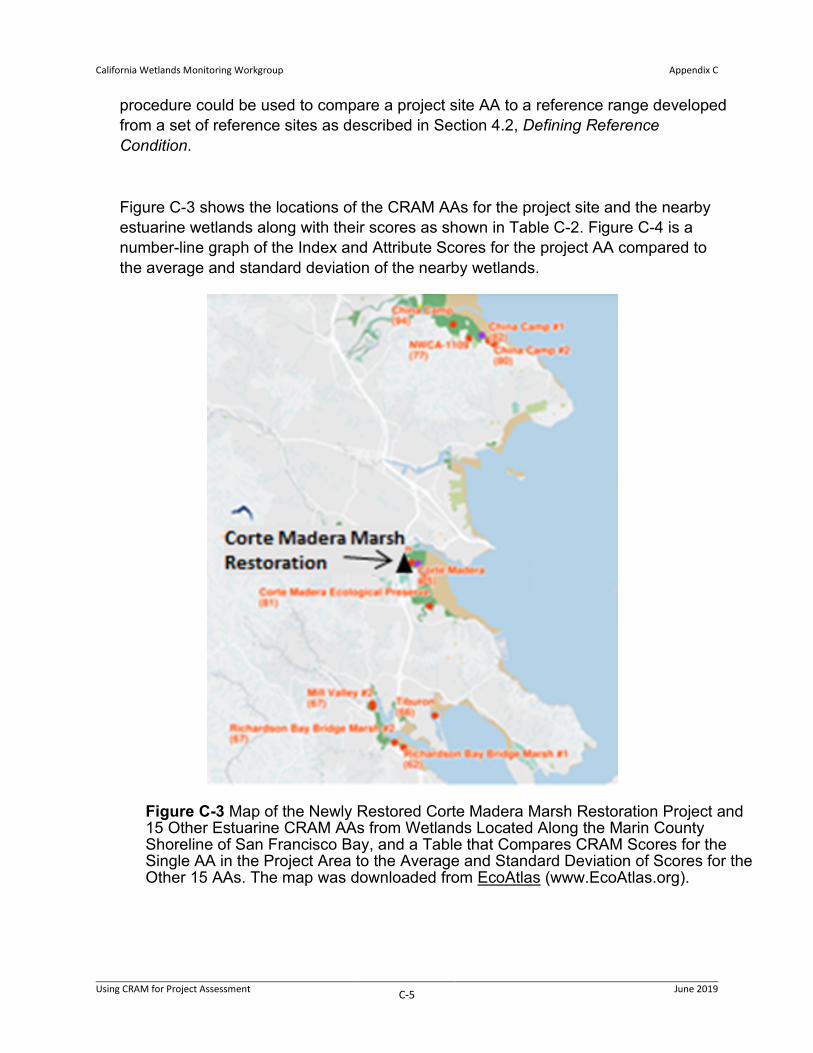
California Wetlands Monitoring Workgroup
Appendix C
Using CRAM for Project Assessment C-5 June 2019
procedure could be used to compare a project site AA to a reference range developed from a set of reference sites as described in Section 4.2, Defining Reference Condition.
Figure C-3 shows the locations of the CRAM AAs for the project site and the nearby estuarine wetlands along with their scores as shown in Table C-2. Figure C-4 is a number-line graph of the Index and Attribute Scores for the project AA compared to the average and standard deviation of the nearby wetlands.
Figure C-3 Map of the Newly Restored Corte Madera Marsh Restoration Project and 15 Other Estuarine CRAM AAs from Wetlands Located Along the Marin County Shoreline of San Francisco Bay, and a Table that Compares CRAM Scores for the Single AA in the Project Area to the Average and Standard Deviation of Scores for the Other 15 AAs. The map was downloaded from EcoAtlas (www.EcoAtlas.org).

California Wetlands Monitoring Workgroup
Appendix C
Using CRAM for Project Assessment C-6 June 2019
Corte Madera Marsh
Restoration n=1
Year 1
Nearby Estuarine Wetlands
n=15 Ave (+/- SD)
Index Score 58 71 (7) Buffer and Landscape Context 68.29 77.30 (12.36) Hydrology 75.00 75 (16.10) Physical Structure 62.50 60.23 (14.31) Biotic Structure 25.00 72.57 (12.58)

California Wetlands Monitoring Workgroup
Appendix C
Using CRAM for Project Assessment C-7 June 2019
Table C-2 Comparison of CRAM Scores for the Single AA in the Project Area to the Average and Standard Deviation of Scores for the Other 15 AAs. The map and CRAM data were downloaded from EcoAtlas (www.EcoAtlas.org). CRAM data were downloaded from EcoAtlas (www.EcoAtlas.org).
The Corte Madera Estuarine Marsh Restoration Project AA and the population of other nearby estuarine AAs differ only with regard to the Biotic Structure Attribute. This is evidenced by the lack of any overlap in the precision range (Figure C-4). However, the scores overlap for the other three attributes and therefore cannot be considered as different. The difference in Biotic Structure is so large that it almost causes a difference between the Index Scores (that is, the Index Scores barely overlap based on CRAM precision).
Reasonable explanations for these results can be inferred from the qualitative information about each AA available on the CRAM data sheets, and by examining relevant maps and other spatial (Level 1) data. In this example, the similarity in scores for the AAs is likely due to the similarity in geology, climate, land use, and surrounding landscapes. However, the restored project site is too new to have developed mature vegetation cover. Most of the project AA is not yet vegetated, which accounts for its
Figure C-4. Number-Line Graph Showing the Index and Attribute Scores for the Single AA at the Corte Madera Marsh Restoration Project (red dots) and the Average Scores (green dots) and Standard Deviations (green bubbles) for a Population of 15 Estuarine Wetland AAs in the Local Area Near the Project Site. The arrows represent estimated CRAM precision as described in Section 3.2.

California Wetlands Monitoring Workgroup
Appendix C
Using CRAM for Project Assessment C-8 June 2019
very low Biotic Structure Score. CRAM can be used in the future to track the development of the Biotic Structure of the project.