Embed Size (px)
Citation preview
AD—A0 52 609 TRW DEFENSE AND SPACE SYSTEMS GROUP REDO CO BEACH CALIF F~S 20/sDEFINITION OF THE LINEAR REGION OF X—RAY IPCUCED C~$LE RESPONSE—ETC (U)MAY 17 C E WULLER. I. C t&IL SEN. D H CLE$tNT DNAOOI—77—C—00#ft.
UNCLASSIFIED ONA—floS T Pt
_ _ U_ _ _

I ~~ L~ Ifi ‘I~~J L ~
_ _
L J ~~ ~~L
I.’ •L
HltL~______ 8
flfl~I.25 DIIU~ HH 6

- __________________
___
~~~~~~~~ I~~7DNA 4405T
DEFiNiTiON OF THE LiNEAR REGiON OFX-RAY INDUCED CAB LE RESPONSE
~~~~~~TRW Defense & Space Systems GroupOne Space Park
~~ Redondo Beach, California 90278
13 May 1977
Topical Report for Period January 1977—A pril 19771 . .
CONTRACT No. DNA 001-77-C-0084
/ APPROVED FOR PUBLIC RELEASE;DISTRIBUTION UNLIMITED.
=
THIS WORK SPONSORED BY THE DEFENSE NUCLEAR AGENCYUNDER RDT&E RMSS CODE B323077464 R99QAXEE5O3Q7 H2590D.
Pre a e d f 0 D CDirector fl Ea
DEFENSE NUCLEAR AGENCY APR 13 1918
W ashington, D. C. 20305 UUT~~t~E1TF1~a
- -

-
~~~
V
Destroy this report when it is no longerneeded . Do not return to sender.
.Q~.4 .
- - - - .

@L1Wt4 �~3::rt~NCLASS I F I E D _
~~~ ~~ .
SE - B C LA ~~~~F I CA T l N OF l o I S PA G L ~I4h.m fl~~ . Enli-ri l
b o r READ INSTRUCTIONS,~ ORT DOCUM A~ BEFO RE COM PLETIN G FO RM
I B
— /~2~ G OV I ACCESS IO N NO. 3 R E C I P I E N T S C A T A L OG N U MA E R
NA —~~~~ ~~~~‘
~~~
~ )
~~~~~~ ~~~ ~~1~~BflT ERIOD COVEB ED( D E F I N I T ION OF THE LINEAR REGION OF x—MY / Topical
~~~ I N DU CED CAB LE RESP~ NSE~ / ~~~~ ~~7—Ap r *7~~
/ ~_~~__ __j J.. ~ C L E E O~~Nl U C O11~~ *~~ø G I-~~~~~~
7 A I T o O R . .—— — 8 C O N T R A C T O R G R A N T NU MB E P-
c~~~ ies E7Wu1le~~ (
L David M. ) Clement ~J — -— _____
~~~~~~~~~~~~~~~~~~~~~~~~~~~~~~~~~~~~~ N A M E AND A D D R E S S IS PR O G R E L I MEN 7 PfIOiE CT . T A SKAR E P,. U N IT N u M S E BATRW Defense & Space Systems Group . ~ j ,.-
One Space Park ‘ ( /rSubta R990A ’d
Redondo Beach , California 90278 -
LI NO O F F I C E 14 A M E A N D AD DRESS
~~~~~~~~~~~~Defense Nuclear Agency ~~~~~~~~~~~~~~~~ ~ -o~-w-*~tsWas h ing ton , D . C . 20305 26T~~~~~~~N I TO R ~ NO A OENC ADD R EISS( , f j , ff e m n l f n , n i (in!,o!l,n,l Of (ii 15 S E C U R I T Y C L A S S - I lh ,a ~op rl)
/2 ~~V p0
l5~ O 1 L L A S S I F I C A T I O N D O W N G R A D I N G
15 D I S T R I B U T I O N S T A T E M E N T ( o f th , i R~ p’ r)
Approved for public release; distribution unlimited.
¶ 7 DISTRIBUTION STA T E M E N T (of I? a P t ~~~c r e nt~~ ,~ l ~ , Block ~5, if h Ue,,-,,
18 SUPPLEMENTAR Y NOTES
This work sponsored by the Defense Nuclear Agency under RDT&E RM SS CodeB323O77464 R99QAXEE5O3O7 H2590D.
9 ( EY WORDS fCo,,ri,,ua on ,, ‘c,’ .,,~~~~,,J , - r I necen,i,r.- ,.nd fd.~n Iifi hi- i,Io,-k no,nl,, ’,
Cables Air ConductivityX—Ray Response Field LimitingLinear Response Transmission LineNonlinear ResponseDielectric Conductivity
______
“ A W S TRA C T (( it Unite in reverse ti le If ,,ecessari soul ir f, r ,tih% hi block non I
Cable response due to X—irradiation is l inear with incident fluence providedthe deposited charge in cable dielectrics is directly proportional t i theX—ray flux. In order to estimate the level at whi ch the linear region ends ,we discuss three nonlinear processes which modif y the deposited charge profile
t in a hypothetical cable model: field limiting in vacuum gaps , ionizationeffects in air gaps , and radiation—induced dielectric conductivit y . The exact -1level , at which limiting of the Norton driver in an elemental length IT f cab l e~...—
DD ~~~~~~~ 1473 EDITION OF I NOV ES IS OBSOLETE t N ( 1,A ~~ I F T E D
S E C U R I T Y CL A 1 I A l l ‘N OF 11-115 l A ~~~ It ’ - . l ’ a , . I
L - .k_ ~~~~~~~~~~~~~~~~~~~~~~~~~~~~~~~~~~~~~~~~~~~~~~~
..-
~~~~~~~~~~

--.- - -
UNCLASSIFIEDS~~C UM I 1 Y C L A S S I P I C A T I O N OF - rsi s PAGE(ITh.n 0.1. Ent.,.d I
20. ABSTRACT (Continued)
beg ins , depends on the cable geometry and the X—ray source. Estimates of theonset of nonlinearities due to field limiting and to dielectric conductivityare found in terms of cable and source parameters. With air—filled gaps theNorton driver is always nonlinear. In addition to limiting of the Nortondrivers , the load response of a long cable may be limited due to attenuationof propagating currents in the induced conductivity of the h u l k of t h edielectric.
_______ UNC LA SST FT El)
S E C U B I TY CL 4 55 0 I 4 1 1 0 1 4 O t ~~1-0 5 P A , . I IU,v l’ a~~~~
_ _ _ ~— ~~~~~~~~~~~~~~~~~~~~~~~~~~~~~~~~~~~~~~~~~~~~~~~~~~~~~~~~~~~~~~~~~~~~~~ .~~. ~~ - , -

- - - _ _ _ _ _ _ _
TABLE OF CONTENTS
Section
1. INTRODUCTION 3
2. DEFINITION OF CABLE AND X—RAY SOURCE PARAMETERS 4
3. FIELD LIMITING IN VACUUM GAPS 5
4. IONIZATION EFFECTS IN AIR GAPS 10
5. RADIATION-INDUCED DIELECTRIC CONDUCTIVITY 13
6. LOSSY TRANSMISSION LINES 17
7. CONCLUSIONS 20
REFERENCES 21
PICCESSION for
NTIS W~~ Sect~uI~DOG Bull 5~ CtIOfl 0UNA NNOU~1CEO
0iUSTlFlC~Tl0H
YM~~IU1’~ ~ t3!~j
Dist. p~V ML. ar~t/ Ct SPLCIN—
F’
j~ - . .
I J

FIGURES
Figure
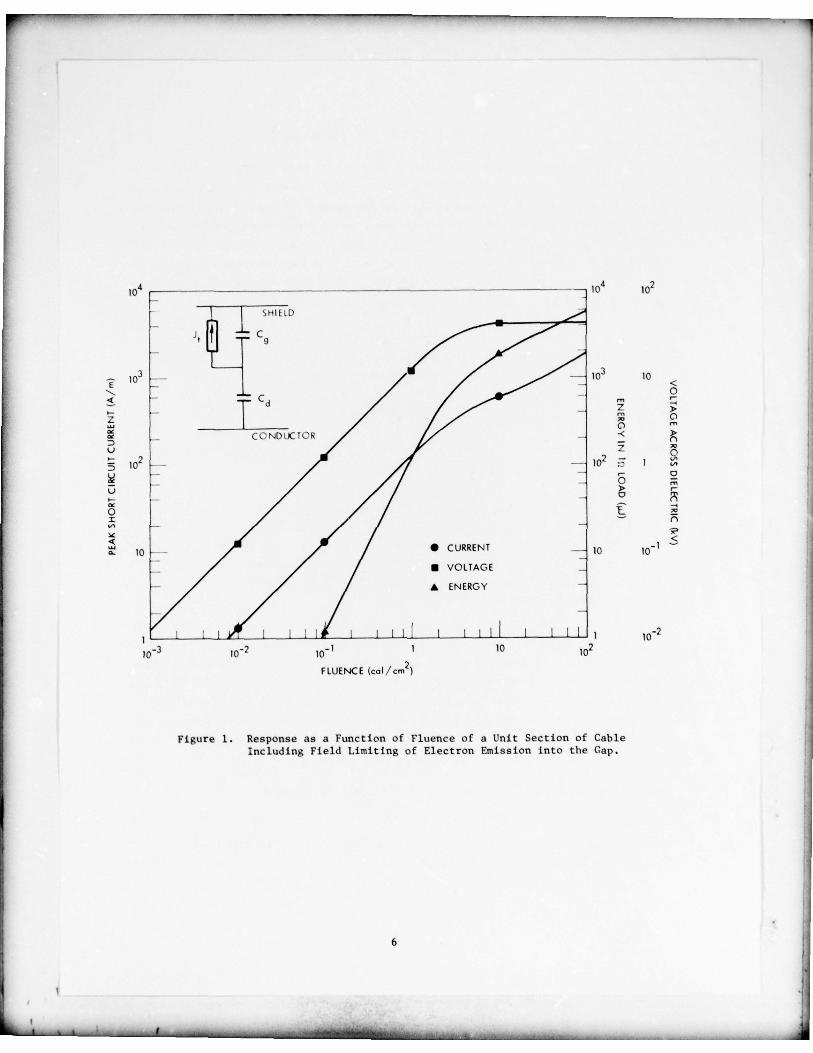
1. Response as a Function of Fluence of a Unit Section of CableInclusing Field Limiting of Electron Emission into the Gap 6
2. Assumed Differential Energy Spectrum of Electron Emissionfrom the Cable Shield 7
3. Comparison of Normalized Short Circuit Current Waveforms at ThreeFluence Levels Showing the Effect of Field Limiting in the Gap . . . . 9
4. Responses as a Function of Fluence of a Unit Section of CableIncluding Transient Conductivity in the Air—Filled Gap ii
5. Comparison of Normalized Short Circuit Current Waveforms at TwcFluence Levels Showing the Effect of Ionization in an Air—Filled Gap . .
6. Response as a Function of Fluence of a Unit Section of Cable IncludingTransient Dielectric Conductivity in the Enhanced and Bulk Regions . . 14
7. Comparison of Normalized Short Circuit Current Waveforms at ThreeFluence Levels Showing the Effect of Transient Dielectric Conductivity 1(
8. Load Response of a 20 m Cable as a Function of Fluence Comparingthe Effect of Delayed Conductivity 1~
9. Comparison of Normalized Load Current Waveforms for 20 m Cableat Two Fluence Levels, Showing the Effect of Limiting by Promptand Delayed Conductivity in the Dielectric 19
2
. -

1. INTRODUCTION
The response of a cable to X—radiation is linear with incident photon fluence
provided that the cable loads and cable impedance are non—dynamic , and the photon—
electron transport is not field—limited . When these conditions do not obtain , the
response is sublirtear with fluence , and it is of interest to determine both the limit-
ing effects which are responsible for this nonlinear behavior as well as the breakpoin t
where this limiting occurs.
The problem of determining a cable ’s response to X—ray photons divides natu-
rally into three parts: (1) determine the deposition of charge in cable dielectrics
(solve the electron—photon transport problem); (2) determine the induced current (solve
for the Norton—equivalent drivers); and (3) determine the response of cable loads
(solve the transmission line equations). The execution of the first two steps is
implicit in the operation of the present generation of cable response codes.1’2 The
third step has been either simulated using a lumped element equivalent circuit 3 or
solved direc t ly, for example , by finite difference techniques .4 The Norton drivers ,
which represent the input to the transmission line equations , are linear as long as the
deposited charge is directly proportional to the X—ray flux. This is the case when
charge transport is completely determined by the collisional stopping power of cable
materials. However, as the X— ray flux increases other processes begin to modify thedeposited charge profile . In this report we will discuss three of these nonlinear
effects. The first two, field limiting in vacuum gaps and ionization effects in air—
filled gaps, occur because gaps are consaonly found in braid—shielded cables. The third
effec t, radiation—induced dielectric conductivity, is responsible for both limiting of
the drivers and propagation losses in the cable itself. In principle , the calculation
of a nonlinear driver and the solution of the transmission line problem are coupled .
This is because gap effects are voltage dependent and the voltage in a given section
of cable depends on the response of the entire cable including its loads , even in the
case of lossless transmission lines .
The exact value of flux at which nonlineerities begin depends on the mechan—
ian and on the par t icular cable ’s construction , e.g., gap size, dielec tric material,
etc. Our approach in what follows is to define a hypothetical cable with the character-
istics of braid—shielded cables found in satellites or missiles and , then , to predict
the short circuit current per unit length of cable as a function of flux including each
limiting effect , one at a time. We will identify sensitivity parameters which affect
the onset of each process. Following that we will discuss transmission lines which are
simultaneously lossy and driven by nonlinear currents. The models which we present
will be reduced to equivalent circuit models which can be easily evaluated using a cir—
cul t analysis computer program .
3
-- ---_ . - - —~~
_-- —.- - - -~~~-.,-~----~~ - ---

2. DEFINITION OF CABLE AND X—RAY SOURCE PARAMETERS
In this section we define a hypothetical cable as well as the X—radiation
normally inciden t upon it. The cable is assumed to be a SOIl coax with an inner shield
radius , an outer conductor radius , and a shield gap of 0.1, .0299 , and .005 cm , respec-
tively. The conductors are copper and the dielectric is Teflon. Then, the total capac-
itance and inductance per unit length for the cable are 92 pF/rn and 0.24 raBin, and the
propagation velocity is 0.69 c.
The X—ray environment is specified to be nonoenergetic 50 keV pho tons whose
total fluence is a parameter to be varied. We assume a triangular pulse waveform whose
full—width—half—maximum is 10 na. Holding the pulse shape constant implies fluence and
f l ux , dose and dose ra te , are proportional.
In vacuum the replacement current , or image current , tends to be proportional
to the size of the gaps in the cable.’ This is because the response is proportional
to the distance the electrons emitted from each conductor travel , and since electron
ranges in d ielec trics are usually much less than gap sizes , the gap controls the
response. Therefore, in this sample problem , we ignore charge at the center conductor/
dielectric interface (where there is no gap) and take the direct injected current
source to be emission from the shield which is deposited on the dielectric surface. The
peak magnitude of the emission current source is taken as 1600(k/us)/(cal/cm2), which is
based on average emission efficiencies for copper from Dellin and MacCallum ,4 and a
10 ma pulse r ise time. Then , the emission current J(t) as a function of time is
J — J~ f ( t) , (1)
where f(t) is the envelope of the radiation pulse whose value at the peak of the pulse
is unity . As a check we examine the linear short circuit current due to this source
for a cable in vacuum. The emission current is weighted by t~’e ratio of the total to
gap capaci tances
— c__
~~‘ — 140 A/rn (2)
sc Cg cal/cm2
Multiply ing by the pulse width of 10 ma yields a normalized response of 1.4 x 1O~~C—cm/cal , which is consistent with both analysis and experiment)
4
I —,—- .—,- - — - k. -~ A—. ~~~~~~~~~~~~~~~~~~~~~~~~~~~~~~~~~~~~~~~~~ .1- -———— - — - - _-

-- --- - -.-~~~~~~~~ ~~~~~~~~~~~~~~~~~~~~~~~~~~~~~~~~~~~~~~~~ -~~~~-.— -~~- --~~. ,
3. FIELD LIMIrlN (: IN VACUUM CAPS
Consider the equivalent circuit for a section of cable given in Figure 1.
The current driver J~ shown there represents transmitted charge across the shield gap
which charges up the gap capacitance Cg~
But the transmitted current establishes a
retarding electric fi~-ld which opposes the motion of subsequently emitted electrons .
In order t o L-~ timate the fluence at which electrons will be stopped and returned to
t h t e m i t t i n g s u r f a c e , thus l i m i t i n g response , we set the gap p o t e n t i a l energy at the
end ot the pulse equal to the mean initial energy of created electrons E,
e Vg
_ E~ (3)
where e is the electronic charge . For the 50 keV X—rays assumed here , E f or copper
equals 42 keV (ref. 6). In the open circuit limit the total charge ~~
stored in
the gap is equal to the integral of the emission current
E ~t _ F J ~~~~te C C ‘
g g
where F is the fluence level , and ~~t is the full—width—half—maximum of the triangular
pulse . Then , the onset of field limiting will occur at
E CF = ~~2.5 cal/cm 2 , (5)
e J E~t
when evaluated using the parameters from the last section . This expression indicates
that the upper bound o2 the linear regime decreases as the electron spectrum softens ,
JF the gap thickness increases , and as the emission yield increases , on account of
the field limiting effect.
An analytic expression for the current transmitted across the gap J~ can be
obtained by starting with the Vlasov equation (the collisionless Boltzmann transport
equation). Since electron transit t imes in a gap are short compared to typical pulse
len gtti- , we seek a noorelativistic stead’.- state result dependent on the instantaneous
c.ij - vo lt . lg I and on the p h o t o — e m i s s i o n en e r gy d i s t r i b u t i o n . Since the c i rcumference
of a gap is much greater than its width , we approximate the system by a planar diode.
Then , the electron distribution function is given by the Vlasov equation
3f afv~~— + a ~~--- — O , (6,
where the decelera ti on due to the f i e l d bu i ld up in the gap is-e V
( 7 )
and V g is the m a g n i t u de of the gap potential difference , ni i s the e l e c t r o n i c mass ,
and d Is the gap width.
S
~~~~~~ -- — ~~~~~~~~~~~ - ~~~~~~~~~~~~~~~~~~~~~~~~ ~~~~~~~~~~~~~~~~~~~~~~~~~~~~~~
F~ ~~~ SH IELD ~~~
— - - -
~~~~
-——-—-- !0~ 102
~
- 1 03
;
10
C O N D U C T C ~R / - -<
o / z~ 2 ft 2 —~ 10 - --- — 1 0
/ ~
-
5LI Z- - / - C’
/-- / -
— C.,
4
~~ - - - • CURRENT — 10 10
_ i
7’ U VOLTAGE
A ENERGY -
1 1..... ! 1 I I I i i i f i t 1 1 i io 21 10 io2
FLU ENC E (cal/ cm 2)
Figure 1. Response as a Function of Fluence of a Unit Section of CableIncl uding Field Limiting of Electron Emission into the Gap .
6
- -~~ — —— .. .—~~~~~~~~~~~~~~
- — ~~~~~~~~~~~~~~~ .—.——-~~~
— -~~~-

This ignores space charge interactions in the gap . From the theory of quasilinear
partial differential equations , total energy
SW 2 axu — i -- — — -
* (8)
is a constant of the mot ion in Eq. (6) and any func t ion of u is a solution of Eq. (6 ) .
We can cons t ruc t the solut ion for the diode reg ion 0< x ~d subject to the boundary
conditions that the distribution function at the emitting surface f(x — 0, v > 0) is
known and that all particles reaching the other side have positive velocities
f (x d , v < 0) — 0. The first moment of the distribution function is the transmitted
current and transforming to the energy variable we get
J — J~ f ( t) f n (E) dE , (9)t eVg
where n ( E ) is the normal iz~.d energy distribution of emitted electrons .
The emission energy distribution could be found in detail from analytic trans-
port theory or Monte Carlo calculation; however, for this illustration , we take a
result from the simple X—ray induced emission theory given by Schaefe r . 6 The differ-
ential energy y ield at normal incidence is approximately
dY Mi IdEd E 4 ~~~ *
(10)
where is the linear absorption coefficient at the incident X—ray energy for inter—
action with the i—th electron shell. Now it is known that the range varies roughly as
E2 for a number of materials. Thus, the stopping power and the differential energy
yield should vary as E and n(E) is proportional to E. This approximately linear energy
variation has been observed both in Monte Carlo calculations and experimental results.
The use of a roughly linear energy spectrum appears justified as long as photon energies
are not too near absorption edges and the Conipton contribution is ignored. Figure 2
shows the distribution used in this calculation. We assume that the lower bound of the
distribution is 1 key.
(E)
ENERGY ( keV)
Figure 2. Assumed Differential Energy Spec trum ofElectron Emission from the Cable Shield .
~1 ~~~~~~~~~~~ ——-- - _._ _~~~~~~~ _:__ ~~~~~~~~~~ -~~-- —-- — —
‘ ~~~— — - —- -- - -- --- - -~~
~~~~~~~~~~~
ITh~ peak ~,! o r t c i r c u i t c u r r e n t w i l l be n o n l i n e a r w i t h respect to f l u e n c e when
the I n t e g r a l in Eq. (9) bcLone5 l e s s than unit s ’ . F i g u r e 1 shows t h e response \- e r -~us
lu e n c e of a un i t s e c t ion of cable d r ive n by t h e f i e ld l 1~~1 tin g source . The breakpoint
b e t w e e n the l i nea r and n o n l i n e a r p a r t s of the c u r r e n t p lo t is c lose to the 2 . 5 cal/cm 2
l ev e l e st i r ~ • - i above. The energy de l ive red to a 1C load b~~t ween t he sh i e l d an d ~en t er
conductor is also given in the figure . (One ohm Is essentially a short circuit compared
t o the capac i t i ve i m p e d a n c e . ) Also p l o t t ed is t h e volta~-.~ built up across the dielec-
tric l ay e r which is equal in m a g n i t u d e to the v o l t a g e across t h e gap because of the
- - c u ’t t ci r c u i t c o n d i t i o n . The p o t e n t i a l sa t u r a te s at 42 kV , the v o l t a g e r equ i red t o
reduce the t r a n s m i t t e d c u r r e n t t o z e r o . N o t e t h a t t h i s is e q u i v a l e n t to an e l e c t r i c
f i e l d 01 6x 10 5 V/c m in the d i e l e c t r i c wh i c h is more t h a n t w i c e the r a t e d s t r e n g t h of
r e t ion (2 . 4xl0 5 V/cm) , althou gh less than t h a t of K ap t o n (2 . 8x10 6 v/cm) , wh ich is t h e
st r - -n~ est of d i e l e c t r i c s used in c a b l e s . This suggest - ; t h a t t h er e may be combina t ions
of ;-nvironr ..ents and cable tY p e s for which dielectric breakdown could occur. Further
i n v e s t i g a t i o ns of t h i s p o s s i b i l i ty are a n t i c i pated u s ing our d e t a i l e d cable code.
To translate the abscissa of Figure 1, and s i r i l a r f i g u r e s wh ich f o l l o w , f rom
luence to peak flux , dose , an d peak dose rate use t he conve r s ion f a c t o r 1 cal/cm 2
corresponds to 108 cal/cm2.sec , lO~ rad(Si), i0~~ rad( S i) / sec .
The time h i s t o r y of t h e short circuit current is triangular and identical to
the N—ra y pulse shape in the l i n e a r regir ie . \~i t h the onset of limiting the latter part
is c l ipped o f f and the pulse gets progress ive ly nar rower with increasing fluence.
Figure 3 shows that the current waveform changes abruptly between 1 and 10 cal/cm2.
The triangular shape at 1 cal/cm2 shows that response was still linear at this level.
8
- - - - - ~~~~~~~~~~~~~~ ~~~~~~~~~~~~~~~~~~~ -- --
~~~~~~~~~~~~~~~~~~~~

-~~~~~~ _ _ _ _ _ _ _ _ _ _ _ _
hO —
I-zLU
:3I..) I cal/cmD
3 cal/cm2
~ 0.5 -
0I
LU
N
2 210 ca l/cm
00 10 20
lIME (ni)
I I g u i . I. C o mp a r i s on .‘t No rma t i r e d Sh or t (1 reu it Cu r r e n t W~ vei orn,a at ThreeFlu enee l evel Showing I ~~~ Cl feet ot Fiel d l i m i t l ug in I he Cap
_t _____ __ .
~
_ *.—-- ---- .- - ---~-_ ,---———. - - —~j~~~~~~~~~~
___ - . - —---- — -------— - — —
_ ____4

_ _ _ _ _ _
u . lON l~~A l l t ) N F’F’l-’l-Ci S IN A I R CAl ’S
When an a I r — I I I led u -al ; i i ’ g.t p I s I i’ rod i i t eel by X— F a vs • Ion I . at It ’l l u ’ I t lit ’ ,t I r
result a in a seeu ’nul;trv u ’u u t , d t i e t t u rn t~ u I t ren t wli (eli t e t iu ln t o n u t t lg.tl ‘‘ t t , , p1 t n i a i v i ’liot o—
Cetuptoti euuit’ e’tit em i t ( t’ei I toni t h e met a ~. i t l t act ’ . In o i u l e i I t ’ I n t l nub (lie a l t u o n u l u u t
lv i tv t ’I I O ct we’ w Ill tit l cul , i t e t h e rod t a t t on— t tiultit ’ed I i on s len t i i i u - u ’n u i t i c ( I ~i t \‘ 01 ( l i e
g~~’ and t i- ui n s t at e E l i Is I l i t 0 :1 t Imt’— ul. ’l’e’tleIi ’iit shunt it’s let a n ce
R — t / - o ( t~~ , ( I I )4 0 ~ ii
whi ch is then In se r ted i n t o I lie u - .tlu I t ’ t’qel I v a l t ’u t c i t e n t I shown In 1 - i g u t i ’ •~ . I- u ’! low t u g
t lit’ method ot Wut I or and C lenient • 1
lie’ e’ot~duc Liv I t y (~ c i i i cu t it cut t ’v so Iv ing , u t t — (on
r u I t ’ t’u lulo t ions I or t he’ u ’ u ’nce ’nt t i l t ions 01 ~ecu u tidi t i v el e’c t i - o t i s , gem, ’ i It’ pc’s I t lv i ’ • and
gt ’ne’r Ic iwg.i lvi ’ I ens . Tlit ’ cot ’t I i i’ t e n t s SlR ~li as O t t u chmt ’nt i a t (‘S • re ’comb i n., t t on t I I 05
e’ t t ’ . * which c ut er lu. ’ t a t e equ. i t Ions • and lie part I u It’ m o b l I l t tt ’~ ate I tine I I u ’un ; 01 tIn’
e ’le t’ t i l t ’ I I O I L I In the ’ gap. Thu . t he’ condite ’ t lv It v Is coup 1 e’d u ’ (lit ’ t e a I ol I l i t ’ c I i
Cu It t hr ougli (lit’ Inst an t aneous gum~u Vt ’ It age’ .
The dose’ i - a t e in a Ii - a t 1 i t t nuosp l i e i e ot p ressu r e , wh i cli i n i’t ’qu I red In ( l i t ’
conduct lvi t y t’a 1 e’ul i tt b u s , is I . 8xl() ‘~ (rail (at r)/sve’ )/(ca 1/cm 2) h i t1 (tie’ I utics t’n,’ is v
loss cent r I h u t I ens I roni t l ie ’ i ’i - l mulr ’. ’ e’ I e’~’ ( t’ens e i~ ’ou lug ( l i t ’ gal’ . I l u t ’ short t ’ l i t -t i l t
cu r r e n t Is shown in I-’ I gu rt ’ u as a I tin e t I on 01 1 1 tmt ’nc’t’ , I j u l81 1 0 ~ I t ’ I 0 ~‘a i/cur’ . t in ’
response’ Is a iwut vs non I t near In iti t s range . I” I g t im - e ‘ shows t h e c’l iui i a ~’ I t ’i ’ I s t le ’ h i po l i i
si gn al of I he a l t gap cab It ’ i e ’spo use . Th t a shOpe’ can lit’ c’~~’ 1 it tnt ’ul to t o i l ow’s . The’em Las Ion c urrent soti ret’ t rans I (‘I’S charge at’ ross th e ’ gap ; ( l i t s con I 1t int ’~ m i n t 11 t in ’ v I c e —
t t ic I (e ’tu I and (lie’ co~duc Liv it ’. in t he’ gap have’ b u t t I I o t he’ p o in t wlie’i’e I h t ’ see 0151,11 V
e lec t ron u ’ tmi re’nt t a n compel e w i t li t he’ t’nilss Ion c u r r e n t onul .11 t ;t ’luuiige ( lie ’ pot out l i l
bti itt up d u r i ng (h i ’ I I i st ~~~~~
t o I t he pu 1 Se’ , w h I ch 1 e’atls t O l b.’ sI gui i e ’~ ’ u ’ I s i I in ( li e ’
cur rent . A a I’ l ttt ’ tic e Inc r out Ce’s t lit ’ t (me re ’qtI I it’d lii r t li~ sec u ’ ulu l , t i - v u i t t ron I I o I’ o conic ’c o m p u i r i l ’ i t ’ tel (t i e ’ t ’ni ts ,u ten u ’ i i V t’e’flt ele’cre’uisea . lii Is ( i e ’titl can l’e seen in t lie’ u’ t l i i , ’ ii t
wave I e n s at 10~ ~ au nt 10~~ cal/cm 2 g Ivt’n in I-I gmire ~ . Above 1 0 cal/cni2 ( l i e’ cu r i t i l t
sp Ik e s a l t ’ v e t v ~; l iu ~rp , u ’t ’e’ut lug In (lit’ I I t a t I t’w i i I t l iOi uc ’ t ’t ’l ’ , l i i 01 ( lie’ t uid l I l t t on 1111 1 Se ,
anti t In’ shor t e’ I rcu It t’eirre’nt i-eisa I us near i’e ’ i t ’ l ot t lie t ’est 01 I lit’ e”.’t’uit , Now ,
i t t e t r n ( n g t o l-’I gti t ’ e u , ( l i t ’ s i gn I ttttie ’s ol hot Ii i ’e ;ik~; i i i (In’ sliu ’i’( u t r eel I t c n t i - e n t have’
been p l O t t t n l long wI Eli t he ,‘nt ’i - gv w h I c h weuetl d is’ do I t v t ’re’d t O i i h I l o a d . l’lie dt ’pe’ n —
tlt ’ne’ C I a a i i i ’ I I neil I’ wi t It t h u t ’ iice l b reuug lituu ( t h e i ;ingt ’ ex am I ne’d
I t should be’ p o in t e~ l out that 1% couetete ’t iv it v p ict t i re ’ ol a i t teu~ I :,,( lu ~ti I s
ap p r o pr i itt ,’ oil lv :iS I u ’ng as t l i t ’ met ion u ’I t i me ’ st ’i’u u n u l i t r v i’ I Oct l , ’lu; and b u m s (a cu ’mp I et ~‘I v
spce’ I I It’d liv (l i t ’ i t ‘~a’1’ t i l t it ’s. At 1 ow pi’ t’ s a u u t t ’a , t h i s Is flu ’ 1 oiig. ’i- h u e , mitt i e o u i ~’ I e,i
~o lut (t ,ul el Pot Sllu ’fl ‘S l’ u l u i u I t It’ll Onu l I lit’ t ’, j t u ui t I u , i i , ; ol met Ion I ot ’ l ’ l i t ( t Ie ~l\ nani Ic a Is
i- , ’u~ u u I i t’d . Tb Is liuis been u ’oflS lu ll ’i’t’ui l~’ WII1 I t ’i’ in ~‘u ~ t ’ d tm,’uia toi l ( rod l i i I u ’i ct ’, iX I ,i l
t ’ utl ’ l , ’s N i’,’i’ it t ’ utl ’ I. ’ w I ( I i :1 . t I 1 ~‘iu gulp (lie’ I i ; u u i a It lou I l u ’S ti l t - I (K,’ ( u ’ v . l c , u u i m Ilk .’
resp~’na ~’ was I 011151 ( * I ,‘t ’ e t t l t i l ’ u l i 0 . 1 atm .
I0
I _ _ _ -—_ -- -~~~~~~—‘—— - — _— -
~~~.- - — — ~~~ - - - - - — — - — — - —~~~~~~~~ - - - - — —~~~~~

—~ —~ -~ —‘ -~ --_ _ _ _ _ _ _ _ _~~~~
io2 -
10
— I I S H I E L D- rn~~~ -g R
10 ~~ I Cd
/
1
- CONDUCTOR -
/70’~
• FII~ T CURRENT PEAK — io_2
• SECOND C U R R E N T PEAK
- A ENERGY -
io -2
-
I I I / I I I I I I i1G 2 to 1 10 to 2
FLUENC E (cal/cm 2)
Figure 4. Response as a Func tion of Fluence of a Uni t Section of CableIncluding Transient Conductivity in the Air—Filled Gap .
11
~
~~~~~~~ , ,~~~~ - — ‘ -
~~ -

1 .0
zLu
0.5 IO~~ cal/cm2
1
~
10 cal/cm2
—I —_--___- I —30 10 20
TIME (,~)
I - I gui r t ’ S . Conup ar iu oj-m of N o r m a l i z e d Short Ci r c u it Cur ren t W a v e f o r m s a t TwoF1u~ nce Levels Showing the Effect of Ionization in an Air—filled Cap .
— - ,~~~~ — - ,, ~~~~~~~~~~~~~~~~~~~~~~~~~~~~~~~~~~~~~~~~~~~~~~~~~~~~~~~~~~~~ — -~ - ——-~~~~~—~----—

r
- - - - -‘
5. RADIATION —INDUCED DIELECTRIC CONDUCTIVITY
Ionization of the cable dielectric can have a shunting effect on the direct
injection current resulting from a radiation—induced conductivity. This conduct ivit y ,
In general , has promp t and delayed par ts
— K~DPf ( t) + K
dD~~
f ( t ) exp t-(t-t )It] dt , (12)
where is the peak dose rate and K , Kd, and t are parameters detennined from shor t9 p
pulsed irradiations . For Teflon , K and K,,, are l.1x10 5 (mho/f)/(rad/sec) and 280.10 11
(mhoff)/(rad) and ‘t is 216 ns. Weingart , et al , and Su l l ivan and Ewin g agr ee on
the prompt coefficient for Teflon ; however , Sul l i van and Ewing do not repor t del ayed
conductivity data. In the rest of this section , we assume that the t ransient dit’ l e’c-
tric conductivity is entirely prompt , Then, the transient resistance per length for ii
un i fo rmly irrad iated di electric has the form
R — 1/K~ôPf ( t ) C * ( 1 1)
where C is the capacitance per length of the cable,
In order to illustrate limiting due to dielectric conductivity alone , we
revise our model cable , eliminating the gap . Assuming that the gap has been filled
wi th Tef l on , the shield emission current will penetrate one electron range (tw7.SxlO k cm
for 42 key electrons) into the dielectric . The dose rate in the bulk of the Teflon is
9.SxlO u (rad/sec)/(cal/cm 2). Assuming that energy is uniformly deposited by electrons
stopp ing in the dielectric , the dose rate will he enhanced in the stopp ing region about
a factor of 50 times the bulk dose rate. Figure 6 shows t h e cable equivalent circuit
containing shunt resistances in the dose enhanced and bulk regions . In the short cir—
cul t case
V + Vb
— 0 , (14)
and th e node equations for this circuit
dV V(15)
and
tsc
C~ dt + ( l i t )
can be solved for the short circuit current I , subject to th u condition that both theSc
current source and the inverse of the resistances (conductances) have thc soni c t ime ’
h i s t o r y , i.e.,
— JR constant .’
I i
--- - - - -

r - -
~~~~~~~~~~~~~~~~~~~~~~~~~~~~~~~~~~~~~~~~~~~~~~~~~~~~~~~~~~~~~~~~~~~~~~~~~~~~~~~~~~~~~~~~~~~~~~~~~~~~~~~~~~~~~~~~~~~~~
I
—
—-- ------——- / — 1 to2
— SHI EtD —
- th ( C —
~ ~~~~ e R
_Is
~
~ 70_ I • FIRS T CURRENT PEAK — ~~~ l0~
1 Z
N SECOND CURRENT PEAK £
— L ENERGY -
• VOLTAGE —
to 2 1 1 I I 1 I I I 1 i i ± I J I 1 h0~~ io 2
io _2 1o ’ 1 10
FLUENC E (col/cm 2~
Figu re 6. Response as a Function of Fluence of a Unit Section of Cable IncludingTransient Dielectric Conductivity in the Enhanced and Bulk Regions.
14
-- —~~--,_ -i- - -
—- — -_
- -
--~~~‘~~~~~~~~~
--

The result fo r the shor t ci rcuit cur rent is
I - J ~~f (t ) 1 + J~ f (t ) ~~~~~~~~~~~~~~~~~~~~~~ - ~l lee, ( 17)cc ~ + (ó
~ C/ ñ ~Cb)
~‘ + (C /Cs) i + (~
PC / ñ ~ Cb)]
whereit (b’~c + ñt’c ) ,.t
— — ~p e e b b 1 f~ t”~ dtC + C . Ie D .‘o
Th is expression will be usef ul for explaining our resul ts. No te tha t the f i r s t te rm
follows the radiation pulse, while the second damps out as a function of accumulated
dose.
We should see evidence of dielectr ic cond uct ivi ty , i.e., the onset of limit-
ing, when the discharging time of the enhanced region capacitance through its shunt
resistance is comparable to the full—width—half—maximum of the X—ray pulse
ReCe fit . (13)
Using Eq. (13) to evaluate Re at the pea k of the pulse, then
1/x pô~ — ~t . (19)
Note tha t this dose rate is enhanced by the fac tor f , such tha t — f
Relating D~ to the total non—enhanced dose D via D fit, we obtain
D — 1/fit , (20)
For Teflon this corresponds to l0~ rads (Teflon) or 0.2 cal/cm2 incident.
Figure 6 shows our data for the response of the cable section obtained by
evaluating the equivalent circuit over a range of fluences . Above 2 cal/cm2 we have
plotted the magnitudes of both current peaks which are visible in the current wave-
forms. Figure 7 compares the current waveforms at several fluence levels. From the
linear (triangular) shape at l0 2 cal/cm2 the current peak narrows and moves away from
the peak of the photon pulse. The second term of Eq. (17) dominates the waveform
except at very high fluence (10 cal/cm2), when it appears as an ini tial spike on top
of the term proportional to the X—ray pulse shape. Returning to Figure 6, note that
the break between the linear and nonlinear regimes occurs at a few tenths of a
calorie/cm2 agreeing with our prediction. Also shown on this figure are the energy
in a 1i~ load and the voltage developed across the enhanced region . The voltage satu—
rates at a value corresponding to an electric field of 2.6xl05 V/cm . As in the field
limiting case, the field in the dielectric exceeds the strength of Teflon (2.4xlO S V/cm).
I t is , however, not clear that dielectric breakdown strengths have any meaning when thematerial is highly conductive.
15
It - t_, .t_ ,.. ,,tu,,,,, ..,. . ~~~~~~~~~~~~~~~~~~~~~~~~~~ - - —- ‘-_—— ~ ——- A

1
I
1 .0 —
zLu
—2 , 2LI 10 cal,cmI-
U 1 ca l/cm~- 0.5
0I
10 cal/cm2
0z
0 I
0 10 20TIME (ns )
Figure 7. Comparison of Normalized Short Circuit Current Waveforms at ThreeFluence Levels Showing the Effect of Transient Dielectric Conductivity.
16
,IL ,_-
~,_
~ ~ A . . ~~~~~~~~~~~~~~~~~~~~~~~~~~~~~~~~~~~~~~~~~~~~~~~~~~~ - - - - -—--- j -— -- - - J

F.— — -- -
~~~~~~~~
- .---- -------_---- - -
~~~~
_ -
6. LOSSY TRANSMIS SION LINES
Consider a long cable wh ich is un i f ormly irradiated along its length. Now
it is clear for the vacuum and air gap cases that the limited driver , i.e., the short
circuit curren t in an elemen tal sec tion of cable , is coupled through the gap voltage
to the solution of the rest of the cable equivalent circuit. In the absence of direct
numerical techniques for the solution of the transmission line equations with non-
linear dr ivers , one can simu la te a long cable by repeated lumped element sections in
a circui t analysis code. When the cable is long compared to the distance traveled by
a signal for the duration of the pulse , we will see a broadening of the load current
waveform because of the staggered arrival times of current from different sections of
the cable . The gap voltages, and thus the drivers , are depend ent on cable leng th bu t
any nonlinearity is associated with the limiting of the driver in each elemental
section.
We wish to dist inguish the above s i t ua t i on from propagation losses in the -
-
cable itself. Dielectric conductivity provides a shunt path throughout the dielectric
volume which is at least as big as the conductivity due to X—ray dose rate in the bulk
of the d ie lec t r ic . In this s i tua t ion , as the driver from one point in the cable prop-
agates down the line ,it is further dissipated in the bulk conductivity of the rest of
the cable.
To illustrate propagation losses in the load response of a long cable , con-
sider a 20 m gapless cable made of repeated sections whose equivalent circuit is anal-
ogous to that in Figure 6, along with an appropriate series inductance. The cable is
te rminated at both ends in a matched 5011 load . The load response as a function of
f l uence will include the e f f e c ts of bo th limi ting of the dr iver in each section and
di ssipation along the length of the cable due to dielectric conductivity. The qual-
itative features of the response of a short 1 in cable versus the response of the 20 m
cable can be seen by comparing Figures 6 and 8. The breakpoint between the linear and
nonlinear regimes occurs around 0.1 cal/cm2 for either length. Peak current and load
energy in the 20 m case increase very slowly in the limited regime . Long cable response
has nearly sa tura ted compared to the comparable curves in Figure 6 which show a stead y
but sublinear increase in the response in the limited regime. Data are shown in
Figure 8 for two treatments of the conductivity . These correspond to using the
expression for conductivity given in Eq. (17) with and without the second term , i.e.,
delayed conductivity . Accounting for delayed conductivity does not affect the peak
load current but it does decrease load energy about a factor of 5. This difference
in energy is exp lained by the fact that with prompt conductivity only the cable
returns to the lossless state at the end of the pulse; but with delayed conductivity ,
energy continues to be dissipated in the cable as the signal propagates to the loads
after the pulse is over. Furthermore, it was only in this 20 in cable including
‘7
_~~ ~~ - _ ‘. ~~~~~~~~~~~~~~ ~~~~~~~~~~~~~~ -. ________________ ..---_—-—- - -

ro 2 —
— --— - - 702
— 20m CABLEWITH MATCHED LOADS
10 — 10
- - 6>
U 1 _
- - z-
0-
S CURRENT: PROMPT COND.—
OR PROMPT • DELAYED COND.
7 N ENERGY: PROMPT COND. ONLYio
_ a— T£ ENERGY: PROMPT * DELAYED COND. -
- 1 1 1 1 1 1 l I l t t i t i I I l ~~~~1o 2
io_2
10_ i 1 10 io 2
FLUENC E (co~~cm2 )
Figu re 8. Load Response of a 20 in Cable as a Function of FluenceComparing the Ef fec t of Delayed Conductivity .
18
— —- _ £- -,--_---— _ -~~- ---, ------ -.- -‘- - -—_. - --~~~~~~~~~~~ _~~~~~~~‘—-- -_ _- -, _--- _.—----_ rn------ -_-----

delayed conductivity where we saw a response versus fluence plot which did not increase
monotonically The slight dip in energy centered at 6 cal/cm2 was present in our cal—
culations. We speculate that some other choice of parameters would alter the magnitude
of the dip , or eliminate it. Further study is indica ted to quan tif y the si tua tions
under which response might decrease with increased fluence .
In Figure 9 several load current waveforms are shown. At .01 cal/cm2 in the
unlimited region , the current has the broadened shape characteristic of a propagated
signal. Of course, the shape is the same with and without delayed conductivity. At
10 cal/cm2 in the limited region , delayed conduc tivity almost comple tely attenuated
curren t f r om points f a r away from the end of the cable. The reflection apparent in
this waveform is characteristic of an open circuit at the other end of the cable. This
can be explained because the shunt impedance presented by the delayed conductivity
lowers the cable impedance below that of the load (5011). Thus, the other end looks
like an open circuit.
.0 1 co~~~cm \
~~~5
OI
2~~~~~~~~~~~~~~~~~~~~~~~~~~~~~~~~~~I
6~~~~~~~~~~~
TIM E (nsl
Figure 9. Comparison of Normalized Load Current Waveforms for 20 inCable at Two Fluence Levels, Showing the Effect of Limitingby Prompt and Delayed Conductivity in the Dielectric .
‘9
L.~~. ~~~~~~~~~~~~~~ _ _ _ _ _ _ _ _ _ _ _ _ _ _ _ _ _ _ _ _ _ _ _ _ _
-

I
7. CON i ’L I’S I t ) N ~-
Wo have examined th ree processes which can cause the X - r i v induced response
ot .1 shielded - .ih1~- t - ~’ he n o n l i n e a r w i t h I l u en c e . The f l u en c e level at which the
l inear region ends . inj t h e nonlinear region beg ins depends on details of the particu-
lar c~ h 1e geon le t r v .ind materi als and of the X — r a y environment. Estimates for the
Leve l . it w h i c h l i m i t i n g beg ins d~o to each pro~- -~ s • based on re s u l t s f or t h e shor t
etrcuit current per length , art- as fol lows :
Fiehl Li rn t ti u~ in Va cuum Ca~~~: Limiting depends on th e ave r age e l e c t r o n
energy , the emission current per unit l e n g t h per unit flut-nct- , and the gap geometry
E CF — ~~~~~~~~~~~ (cal/cm 2)
eJ~ fit
I o n i z a t ion In A i r F i l l e d ‘ ,i~ s: At one at m o sp h er e ot p ressure a i r conduc—
t i v i t v leads to n o n l i ne ar response it all fluences (i0 3 cal/cm2 is the lowest fluence
i t wh i ch ~-e a c t ti a liv pet-formed cal c i i i at ion s ) ;
Radiation—Induc ed Dielectric C o n d u c t i v i t y : Limiting depends on the coeffi—
c lent of prompt conduct lvi v and the dose enhanc ement I . i e t or
D — 1/f K (rads)
In addition to the limiting observed in the short circuit current , load
response is further limited by t he d i e le ct r i c c o n d u c t i v i t y of the bulk of the cable.
Propagation losses occur t h r o u g h t h i s shunt as signals travel down the cable to its
loads. However , d e l ay e d cond uctivity (when present) m a r k e d l y reduces load response .
I
~~~~~~~~~~~~~~~~~~~~~~~~~~~~~~~~~~~~ - - -

- - - - -- —-—“- - - ~~~--- -- - - - -
I
R E F E R E N C E S
1. D. N. Clement , C. F. Wuller . and U . 7 . C hiv in g t o n , IEEE Trans . N u c i .S c i . N S — 2 3 , 1946 (1976) .
2 . W. L. ( h i d ~ ev , B. L. Beers, V . W. Pine . and C. W . W i l s o n . IEEE Trans .N u c i . Sri. NS—2 1 , 19 33 (1976) .
A . P. R . T rybus and A. ~l. Chodoro w , IE EE Trans . N u c l . S d . N S — 2 3 , 1977(1976).
5. T. A. Dell in and C. J . MacCallu m , “A Handbook of P l i o to—Compton Cur ren tData ” , San dia Labo r a to r ies , SCL—RR—72 0 086 , December 1972 .
6. R . R . Schaefer , J. App i . Phys . 44 , 152 ( 1973) .
7.
8. C. E. Wuller , “Secondary Electron SGEMP Currents in Cable Gaps atPartial Pressures”, TRW Systems Group , 99900—7810—RU—OO , November1975.
9. V . A. 3. van Lint , J. W. Harritv , and T. M . Flanagan , IEEE Tra ns .Nu ci . Sci. NS—l 5 , 194 (1968).
10. R. C. Weingart , R. H. Barlett , R . S . Lee, and P . Hofer . IEEE Trans .Nuci . Sci. NS—1 9, 15 (1972).
11. P. H. Sullivan and R. L. Ewing, IEEE Trans. Nuci. Sri. NS—l8 , 310(1971).
21
____
k L. - — - ~~~~~~~~ — ———— . _- —— .-_~s,__~___ ‘S— — _ -

~~~~~~~~-~~~1
DISTRIBUTIO N LIST
DEPA PT M ENT OF DEFENSE DEPARTMENT OF THE ARMY (Continued)
Director CoimnanderDefe nse Comu n i cat i ons Agenc y U.S . Army Elec t ron ics Comand
ATTN : NMR ATTN : DRS EL
Defense Documentation Center DEPARTMENT OF THE NAVYCameron Stat i on12 cy ATT N: TC Chief of Naval Research
ATTN : Henry Mullaney , Code 427DirectorDe fense Nuclea r Age ncy Director
ATTN : DDST Naval Research Labo rator y3 cy ATTN : TITL , Tech. L ibrary ATTN : Code 5565, P. Ul ri ch
ATT N : TISI , Arc hives ATTN : Code 7750, Jack Dav is2 cy ATTN : RAEV
Officer- i n-ChargeComander , F ield Comand Naval Su rface Wea pons CenterDefense Nuc lea r Agency ATTN : Code WA5O 1 , Navy Nuc. Prgms . Off .
ATTN: FCPRATTN: FCLMC Director
St rate gi c Systems Project Off iceD i recto r ATTN : NSPInterse rvice Nuclear Weapons School
ATTN : Document Control DEPARTMENT OF THE AIR FORCE
Ch ief AF Geophysics Laboratory , AFSCL i vermore D i v i sion , Field Coimnand , DNA ATTN: Charles PikeLaw rence Livermo re Laboratory
ATTN : FCPRL AF Materials Laboratory , AFSCATTN : Library
Under Secretary of Def. for Rsch. & Engrg .ATTN: S&SS (OS) AF Weapons Laboratory, AFSC
ATTN : SULDEPARTMENT OF THE ARMY 2 cy ATTN : NTS
2 cy ATTN: DYCD i rectorBMO Advanced Tech. Ctr. Hq . USAF/RDHuntsv ille Office ATTN: RDQSM
ATTN : RDMH-OComander
Dep. Ch ief of Staff for Rsch. Dev. & Acq. Rome Air Development Center, AFSCATTN : DAMA-CSM-N ATTN: Edward A. Burke
Coma nder SAMSO /DYHarry Diamond Laboratories ATTN : DYS
ATTN : DRXDO-TI , Tech. Lib .ATTN : DRXDO-RCC, John A. Rosado SAMSO/MNATTN : DRXDO-RCC , Raine Gilbe rt ATTN : MNNGATTN: DRXDO-NP ATTN : MNNH
Conanander SAMSO/SKPicatinny Arsenal ATTN : SKF
ATTN : SMUPAATT N : SARPA SAMSO /XR
ATTN : XRSComa nderRedstone Scientific Information Ctr. Cormiander in ChiefU.S. Army Missile Comand Strategic Air Coninand
ATTN: Chief , Documents ATTN : XPFSATTN : NRI-STINFO , Library
ChiefU.S. Army Coninunications Sys. Agency DEPARTMENT OF ENERGY
ATTN : SCCM-AO-SV , Libra ryUniversity of CaliforniaLawrence Livermore Laboratory
ATTN : Tech. Info . Dept. L-3
23
~~~ -
~1 PREC.~flIII~ P~~~~~~~~ ~~1.AJl~~
4
- T
L _ _ _ _ _ _ _ _ _ _ _ _ _ _ _ _ _ _ _
-
~
- - 1 -~~- - - - - ~~~~~~~~~~~~~~~~~~~~~~~ —-

_ _ _ -~~~~ ~--- ---- —
l i t l A I I I M I N I Ill I NI IIi \ ~ n t lnu , ’ ,t~ I i i ~AI i IMt NI i l l 1 7 7 7 N - I ‘NI l~AL I i ~~ ( I t ’ i i l lllIl, d~
I , i ~. A l i s o - i t - I l l l I l t I i l l l I l t l Id n t i t loll
A I I M I~~5 i t ’ l l - f il l Iii ; l l , - f ’, I 17. . - \ I 1 N Ilc i l i l i s w Il lA l I N- I , hu h il I i l -i - it - i
I —~ I i lso -i t t t II I i i il0i i I 111111 i l l I l i
Al I N - 11th - ( ‘II - Ii I hrll n flllC A - lie l ilu, A l l N I I.u uu ~~A l IN: i l l I .
I i I i l- u - u I l l IiI N I l l - Oil - i- i - I - I l . - 1113 i i 1I7il - i o i l - IAI ll~
A l I N I~ l I-l-l I ‘iii I lv iii117111 I~ i ll i I i~NMl NI A~ I Ni
_ l l f i l i — _ Ib l i lk i i i - liii I i-. —, - — I I IN-I - -I A 1 . 1— I i — I l f i ~ - _ _ I il — i - _ i l — iI w i - f~i - . ,_ i ,- , hi . 11 1 , , - Al IN I l - I I . l i,-l i-I t -i , —
A l l N N .1 - 7A l IN I _ f i l l l Ill l i i i I — IOlllkiii i t h S I I ‘I I l l ii-IIIN I i l — u - u i A l I N - I l l - i - u i 1
A. I114 . 14 b - - t e l 1I 11liIll -\ l; l ilI MI 17 Il l I N — I I ilNIi~_ \i lIii~- _ A l IN: i l l i I - l I l t — t I 7
- \ t i ‘ - I ’ ’ I i ; s h u f t h u I t t kbioe l MI II ~ih C 0 , , Ilu ~ -lI 1N I u- iu i i l i i i Al IN: Il i p t ~~~~~~-\ I N V - 3 t t ..,’~uhisii Ii-\ II N Iii II, uu lie I liNe I,,,,, I1 lion,,, 71 Iiiii~ j I i t- I- ~ i - i 11,111A I IM I lIuI il \ - A l IN -I _ i nl et
-I V 0 t I e - e u - Ii \ f ,’in . i~~llp M I . .. ISI lI e r_i i II I ltu Ih l l ia l 11111I I I I N R i — e u Ii I II - -lii i l l , lvi. 7 _ i l l ill IN: iIo )i - l - - I i I t u u i i
‘Al I N - I Iuui.i b I — I h l l pl i l l i.Nt h u e h,u.j I ‘lilp i Ill
-A l I N I ’ll l i i t ~hi Nll~.—.i ui lIi _ , _ u i - Ii I I I — i - _ il u l l l i ‘a n liI,’lilu-Il IN - I - A 1 . l i n I lilt
lii i I . 1 - i l i III I a I i f l l i l i _ u it iii I i Ie~~ll A l I N I I I l I li-\ I I N ‘hut ’ ,iuuiuu Ii , I — i - , - b
II~ l A - - ‘I ill,--— 1 ~ ii~ ~~~ ~
u -~ s— i - u l Ion -Il IN - I l i _ u i - I
Al IN A l i - i n I - - I I I ! -II IN l it liii 1 _ i l I
II. i l 5 lit~ 1’ - l1i i I lllil II’ ii~,’7 1 lii i ,‘u-ui.a t h,nui 1 I ‘ i l ~~li i t hiuuu
- A I I M I i iij , iu,’ I lh’l luuiiih , A I I N I,~i - Iuuuhal I l i - i t - i
Il I k I I~00 I I unite . I i - i e - _ • lu , - - iS ‘‘ - ~I’ I- I I - _i I l l - . I ii
I I I N : l i~ Ii . I Ii,. A l IN W I l l u rn I - I I l l - I - C t‘A l I N 1- . I i i
—I’ l i i I hi p ll i a lii . Iii, . A l IN li l l,- u i I i l l i e
-\ I l — 1 S I I I C I l l l l l Il ls I-Il IN Ii hui I ui I l I ’u u u i 1 I t’li~ . • ~ i l l S I u n ? - 0 lui n . I ii
A l I N - - lui f I CS II Wi l.o’ uu- S ) h .p_ i t ~, I liliuliuii. lu,l, II t hil l u - ; -‘II IN - I. liii, al I i t - i i i i
A l I N lli ’i u , i I . l II _ M, Mi’i i t’w . M - Ii Iii-\ 11 N - I I I ’ u - u u i I IIW I’i— I t u l e ~ - I i C - i h ill 1,1 bl Ip
-\ II N 1, Ii lu l l — I iii I t - - 1il I li~ t i l t I ibui l u lu t A l IN iIu,u-ie W iiI I I I
— l . I l I• l’ I l f i il bh l - A I I M I - i i t i — l i — ‘ i t — I - - ti iA l IN - b - _ t I l l I - I’i l ~~iu . V i i • l nu _ -I hI M A l lN - Lii i f 1, —ui - u I
- i -II IN l i l t -h I ~‘ We l l. . III . 1 7 III I I~ I i I — I iihih l i _ u u i i
eu i t i’, I I -I l v u u u ed ‘~t u t i l e .-II IN ‘-I l -IiII I N W I 1 1 iii N, N.iaiu i
Iii — i _ i t t I inf I _ l I h i
Al I N I . — Ii I i t —
A l i, i _ i l l I t lii l _ i u lI . ii — ‘ - i t t u i lt — I l --Al IN I Il~~ii 1 I - - i i b h l Ii . ~I -li- i’-IIIN W l I l l . i - 74 - I I. ~I -\I ~I:~ i
________ - -