Embed Size (px)
Citation preview
Atmos. Chem. Phys., 12, 105–124, 2012www.atmos-chem-phys.net/12/105/2012/doi:10.5194/acp-12-105-2012© Author(s) 2012. CC Attribution 3.0 License.
AtmosphericChemistry
and Physics
Typical types and formation mechanisms of haze in an Eastern Asiamegacity, Shanghai
K. Huang1,2, G. Zhuang1, Y. Lin 1, J. S. Fu2, Q. Wang1, T. Liu 1, R. Zhang1, Y. Jiang1, C. Deng1, Q. Fu3, N. C. Hsu4,and B. Cao1
1Center for Atmospheric Chemistry Study, Department of Environmental Science and Engineering, Fudan University,Shanghai, 200433, China2Department of Civil and Environmental Engineering, The University of Tennessee, Knoxville, TN 37996, USA3Shanghai Environmental Monitoring Center, Shanghai, 200030, China4Goddard Space Flight Center, NASA, Greenbelt, Maryland, USA
Correspondence to:G. Zhuang ([email protected])
Received: 13 July 2011 – Published in Atmos. Chem. Phys. Discuss.: 2 August 2011Revised: 6 November 2011 – Accepted: 16 November 2011 – Published: 2 January 2012
Abstract. An intensive aerosol and gases campaign was per-formed at Shanghai in the Yangtze River Delta region overEastern China from late March to early June 2009. Thisstudy provided a complementary picture of typical haze typesand the formation mechanisms in megacities over China byusing a synergy of ground-based monitoring, satellite andlidar observations. During the whole study period, sev-eral extreme low visibility periods were observed with dis-tinct characteristics, and three typical haze types were iden-tified, i.e. secondary inorganic pollution, dust, and biomassburning. Sulfate, nitrate and ammonium accounted for amajor part of PM2.5 mass during the secondary inorganicpollution, and the good correlation between SO2/NOx/COand PM2.5 indicated that coal burning and vehicle emissionwere the major sources. Large-scale regions with high AOD(aerosol optical depths) and lowAngstrom exponent weredetected by remote-sensing observation during the dust pol-lution episode, and this episode corresponded to coarse parti-cles rich in mineral components such as Al and Ca contribut-ing 76.8 % to TSP. The relatively low Ca/Al ratio of 0.75along with the air mass backward trajectory analysis sug-gested the dust source was from Gobi Desert. Typical tracersfor biomass burning from satellite observation (column COand HCHO) and from ground measurement (CO, particulateK+, OC, and EC) were greatly enhanced during the biomassburning pollution episode. The exclusive linear correlation
between CO and PM2.5 corroborated that organic aerosoldominated aerosol chemistry during biomass burning, andthe high concentration and enrichment degree of arsenic (As)could be also partly derived from biomass burning. Aerosoloptical profile observed by lidar demonstrated that aerosolwas mainly constrained below the boundary layer and com-prised of spheric aerosol (depolarization ratio<5 %) dur-ing the secondary inorganic and biomass burning episodes,while thick dust layer distributed at altitudes from near sur-face to 1.4 km (average depolarization ratio = 0.122± 0.023)with dust accounting for 44–55 % of the total aerosol extinc-tion coefficient during the dust episode. This study portrayeda good picture of the typical haze types and proposed thatidentification of the complicated emission sources is impor-tant for the air quality improvement in megacities in China.
1 Introduction
China is now undergoing tremendous challenges of air qual-ity impairment due to rapid industrial and transportation ex-pansion, sharply increased demands of fossil fuel usage andincreasing populations. Primary pollutant concentrationsgrow as a power-law function of population, and in Chinalarge emissions were concentrated in the mega-city clusters,such as Jing-Jin-Ji (Beijing-Tianjin-Hebei), the Pearl River
Published by Copernicus Publications on behalf of the European Geosciences Union.

106 K. Huang et al.: Typical types and formation mechanisms of haze in Shanghai
Delta and Yangtze River Delta (YRD) regions (Parrish andZhu, 2009). The YRD region, on which this study was focus-ing, included the biggest city in China, Shanghai, and Jiangsuand Zhejiang provinces. It has a population of over 80 mil-lion people and occupies over 21 % of China’s total grossdomestic product (GDP).
Upon a globally decreasing trend of incoming solar radi-ation, sunshine duration and sky visibility (Che et al., 2005;Kaiser and Qian, 2002; Wang et al., 2009), the YRD regionhad experienced substantially increasing haze days since the1990s (Chang et al., 2009; Che et al., 2007), which have beenattributed to the dimming effect of aerosol. Some air qual-ity research had been conducted in Shanghai and other areasin YRD. The emissions of black carbon and NOx in Shang-hai have been measured to be 2 to 3 times higher than inBejing and Guangzhou (2003–2005) (Chan and Yao, 2008),and the emission of NOx is predicted to increase 60–70 %by 2020 due to the expansion of transportation (Chen et al.,2006). Major aerosol constituents are found to be sulfate,nitrate, ammonium (Wang et al., 2006; Yao et al., 2002; Yeet al., 2003) and organic aerosol (Feng et al., 2006, 2009;Yang et al., 2005a), concluding that fossil fuel combustionand vehicle emission are major sources of secondary compo-nents. Compared to Beijing, higher concentrations of blackcarbon (BC) and higher ratio of BC/CO have been observedin Shanghai, which are attributed to larger contribution fromdiesel burning (diesel powered vehicles and marine vessels)(Zhou et al., 2009). Ground based sunphotometer observa-tion at various sites in YRD show relatively high aerosolextinction to sunlight (aerosol optical depths (AOD)>0.7)and high fraction of fine particles (Angstrom exponent>1.0)(Pan et al., 2010; Xia et al., 2007). Concentration and frac-tion of ultrafine (10–100 nm) particles in total particle countsat Taichang, YRD, are 2 to 3 times higher than those re-ported in the urban/suburban areas in North America andEurope (Gao et al., 2009). One research on the backgroundsite Lin’an suggested that the aerosol properties were moresimilar to urban areas rather than the suburban ones (Xu etal., 2002). Huang et al. (2008) found that there was a sig-nificantly decreasing trend of acid rain pH in Shanghai with15-fold increased acidity during 1997–2005. Health effectsof haze also have been investigated. It has been reportedthat cardiorespiratory diseases and carcinogenesis are par-tially associated with air pollution (Kan et al., 2007; Ye etal., 2000; Zhao et al., 2003) and reductions of primary PM2.5from industrial sector and mobile sources show good healthbenefits in YRD (Zhou et al., 2010). It was estimated thatthe total economic cost of health impacts due to particulateair pollution in urban areas of Shanghai in 2001 was approx-imately 625.40 million US dollars, accounting for 1.03 %of GDP of the city (Kan and Chen, 2004). In addition,the agriculture production was likely reduced by 2.5–9.2 %due to exposure to ambient ozone (Liu et al., 2009). How-ever, the mechanism on the formation of haze has seldombeen discussed (Fu et al., 2008; Pathak et al., 2009; Zhou et
al., 2009). While some intensive field campaigns have beencarried out in the Pearl River Delta region and Northeast-ern China, i.e. PRIDE-PRD2004, PRIDE-PRD2006 (Pro-gram of Regional Integrated Experiments on Air Quality overPearl River Delta of China 2004 and 2006; Garland et al.,2008; Zhang et al., 2008), CAREBEIJING (Regional for-mation processes and controlling effects of air pollution be-fore and during the Beijing Olympics: the results of CARE-BEIJING; Wang et al., 2010), and EAST-AIRE (East AsianStudies of Tropospheric Aerosols: An International RegionalExperiment; Li et al., 2007), no comprehensive initiativeshave been undertaken in YRD. Furthermore, the source ofhaze, which has also been referred to the atmospheric brownclouds (ABC), is not well disentangled due to the compli-cated aerosol sources in China currently.
In this study, an intensive field experiment using vari-ous techniques was targeted to determine the typical pol-lution types that caused the frequent occurrence of haze inEastern China. Aerosol chemical and optical experimentswere combined with remote-sensing observation to distin-guish and characterize different types of haze. Commentsand discussions are made to emphasize the importance ofaerosol source determination, which hopefully will be ben-eficial for the local governments to improve air quality andmitigate climate effects.
2 Methodology
2.1 Field observations
2.1.1 Observational site
The observational site (31.3◦ N, 121.5◦ E) in this study is onthe roof (∼20 m high) of a teaching building on the campusof Fudan University in Yangpu district of Shanghai. Almostno high buildings are around this sampling site. This ob-servational site is approximately 40 km inland from the EastChina Sea. The closest industrial sources are located approx-imately 10.5 km away and are primarily to the southeast andnorthwest (Li et al., 2011). About 1.3 million residents areliving in this area (SMSB, 2011). This site could be regardedas a representative of the megacity Shanghai, standing forthe mixing of residential, traffic, construction, and industrialsources (Wang et al., 2006).
2.1.2 Automatic aerosol and gases monitoring
The Thermo Scientific TEOM (Tapered Element Oscillat-ing Microbalance) 1405-D monitor simultaneously measuredPM2.5, PM-Coarse (PM10−2.5) and PM10 mass concentra-tion upon an oscillating balance. PM (particulate matter)accumulating on a filter mounted changes in the frequencyof oscillation, which were related to the mass of materialaccumulating on the filter, were detected in quasi-real-timeand converted by a microprocessor into an equivalent PM
Atmos. Chem. Phys., 12, 105–124, 2012 www.atmos-chem-phys.net/12/105/2012/

K. Huang et al.: Typical types and formation mechanisms of haze in Shanghai 107
mass concentration every few seconds at a 10 min runningaverage. The sampler split a PM10 sample stream into itsfine (PM2.5) and coarse (PM10−2.5) fractions using a USEPA(US Environmental Protection Agency)-designed virtual im-pactor for the additional 2.5 µm cutpoint. The total flow rateoperated at 16.67 l min−1, and two separate flow controllersmaintained the coarse particle stream at 1.67 l min−1 and thefine particle stream at 3.0 l min−1. Another Thermo Scien-tific TEOM 1405 monitor was set up to measure PM1 massconcentration operating at 3.0 l min−1 with a bypass flow rateof 13.67 l min−1. PM concentrations were averaged and usedat intervals of 1hr in this study. Trace gases instruments in-cluded a 43i SO2 analyzer, 42i NO-NO2-NOx analyzer, 49iO3 analyzer and 48i CO analyzer. The routine QA/QC proce-dures included the daily zero/standard calibration, span andrange check, station environmental control, staff certifica-tion, etc., according to the Technical Guideline of AutomaticStations of Ambient Air Quality in Shanghai based on thenational specification HJ/T193–2005, which was developedfollowing the technical guidance established by the US EPA(USEPA, 1998). The multi-point calibrations were appliedweekly upon initial installation of the instruments. And thetwo-point calibrations were applied on a daily basis.
2.1.3 Manual sampling
Aerosol samples of TSP and PM2.5 were collected onWhatman 41 filters (Whatman Inc., Maidstone, UK) usingmedium-volume samplers manufactured by Beijing Geolog-ical Instrument-Dickel Co., Ltd. (model: TSP/PM10/PM2.5-2; flow rate: 77.59 l min−1). Aerosol samples of PM10were collected on Whatman quartz microfiber filters (QM/A,18.5 cm× 23.7 cm) using the high-volume sampler (Thermo,flow rate: 1.00 m−3 min−1). All the samplers were co-locatedwith the online instruments on the roof (∼30 m) of the 4thTeaching Building at Fudan University, Shanghai. The dura-tion time of sampling was generally 24 h. More samples withshorter duration time were collected during the heavy hazedays. The filters before and after sampling were weighed us-ing an analytical balance (Model: Sartorius 2004MP) with areading precision 10 mg after stabilizing in constant tempera-ture (20± 1◦C) and humidity (40± 1 %). All the procedureswere strictly quality controlled to avoid the possible contam-ination of samples.
2.1.4 Lidar observation
A dual-wavelength depolarization lidar (Model: L2S-SM II)developed by the National Institute for Environmental Stud-ies (NIES) was operated in this field campaign. The lidarcould measure backscattering coefficients and the depolar-ization ratio at wavelength of 532 nm. The Lidar employeda flash lamp pumped Nd:YAG laser with a second harmon-ics generator. The laser beam was vertically oriented tothe sky after collimated with a beam expander. Transmit-
ted laser energy was typically 20 mJ per pulse at 1064 nmand 30 mJ per pulse at 532 nm. The pulse repetition ratewas 10 Hz. The scattered light was received with a 20 cmSchmidt Cassegrain type telescope collimated and directedto the dichroic mirror. The polarization components weredetected with two photomultiplier tubes (PMTs). Detectedsignals were recorded with a transient recorder (digital os-cilloscope), averaged and transferred to the data acquisitioncomputer for the web interface. The lidar continuously op-erated with 15 min intervals and 30 m height resolution bysetting a boundary condition at 3 km. The Fernald inversionmethod (Fernald, 1984) was applied to deriving the extinc-tion coefficient with lidar ratio (extinction-to-backscatter ra-tio) set to 50 sr (Liu et al., 2002) in inversion process.
2.2 Chemical analysis
2.2.1 Ion analysis
One-fourth of each sample and blank filter was extracted ul-trasonically by 10 ml deionized water (18 M� cm−1). Eleveninorganic ions (SO2−
4 , NO−
3 , F−, Cl−, NO−
2 , PO3−
4 , NH+
4 ,Na+, K+, Ca2+, Mg2+) and four organic acids (formic,acetic, oxalic, and methylsulfonic acid “MSA”) were ana-lyzed by Ion Chromatography (ICS 3000, Dionex), whichconsisted of a separation column (Dionex Ionpac AS 11), aguard column (Dionex Ionpac AG 11), a self-regeneratingsuppressed conductivity detector (Dionex Ionpac ED50) anda gradient pump (Dionex Ionpac GP50). The detail proce-dures are given elsewhere (Yuan et al., 2003).
2.2.2 Element analysis
Half of each sample and blank filter was digested at 170◦Cfor 4 h in high-pressure Teflon digestion vessel with 3 ml con-centrated HNO3, 1 ml concentrated HCl, and 1 ml concen-trated HF. After cooling, the solutions were dried and thendiluted to 10 ml with distilled deionized water. A total 24elements (Al, Fe, Mn, Mg, Mo, Ti, Sc, Na, Ba, Sr, Sb, Ca,Co, Ni, Cu, Ge, Pb, P, K, Zn, Cd, V, S, and As) were mea-sured by using an inductively coupled plasma atomic emis-sion spectroscopy (ICP-OES; SPECTRO, Germany). Thedetailed analytical procedures are given elsewhere (Sun etal., 2004; Zhuang et al., 2001).
2.2.3 Carbonaceous aerosol analysis
Quartz filters were pre-heated at 500◦C for 5 h before us-ing and the samples were analyzed for OC/EC using Ther-mal/Optical Carbon Analyzer (DRI Model 2001). The IM-PROVE thermal/optical reflectance (TOR) protocol (Chowand Watson, 2002) was used for the carbon analysis. Theeight fractions (OC1, OC2, OC3, OC4 at 120, 250, 450 and550◦C, respectively, in a helium atmosphere; EC1, EC2,EC3 at 550, 700 and 800◦C, respectively, in the 98 % he-lium/2 % oxygen atmosphere) and OPC (optically detected
www.atmos-chem-phys.net/12/105/2012/ Atmos. Chem. Phys., 12, 105–124, 2012

108 K. Huang et al.: Typical types and formation mechanisms of haze in Shanghai
pyrolized carbon) were measured separately. The IMPROVEprotocol defined OC as OC1 + OC2 + OC3 + OC4 + OPC andEC as EC1 + EC2 + EC3-OPC.
2.3 Satellite observation
In this study, a number of satellite sensors were used to pro-vide spatial information of aerosol and trace gases. TheMODIS instrument (Moderate-resolution Imaging Spectro-radiometer) provided a large regional view of aerosol distri-butions with a resolution of 10× 10 km. Operational aerosoloptical depths were reported at 0.55 µm by NASA (Chu etal., 2003; Kaufman et al., 1997). The total carbon monox-ide column concentration retrieved from Atmospheric In-frared Sounder (AIRS) on board NASA’s Aqua satellite wereused to observe large scale transport from biomass burn-ing sources (McMillan et al., 2005). Launched in 2004,the Dutch-Finnish built Ozone Monitoring Instrument (OMI)aboard NASA’s EOS Aura satellite provided daily globalcoverage with a spatial resolution of 13 km× 24 km at nadir(Levelt et al., 2006), and the total formaldehyde column con-centration was used to study the signals of possible biomassburning source. Detailed description about the OMI instru-ment can be found elsewhere (Kurosu et al., 2004).
3 Results and discussion
3.1 Identification of three pollution episodes
An intensive aerosol characterization campaign was carriedout in the Yangtze River Delta region with focus on Shang-hai in 2009, which aimed at gaining insights into the for-mation mechanisms of haze in Eastern China. The studyperiod included two time spans of 30 March–16 May and28 May–3 June; the absent interval between the two spanswas due to malfunction and maintenance of some instru-ments. Haze was usually defined as an atmospheric phe-nomenon, where dust, smoke and other pollutant particlesreduced the visibility of the sky. Here, we calculated the vis-ibility following the Koschmieder formulaLV = 3.912/σext,where LV (km) was the visibility and the total extinctioncoefficientσext (km−1) was accounted by the scattering andabsorption from particles and gases. The method for cal-culatingσext is described in Appendix A. Figure 1b showsthe calculated hourly visibility and the recorded visibility atPudong, which was about 32 km from the observational sitefor this study (an upper limit ofLV = 10 km was recorded atthe meteorological station of Pudong). As shown in the fig-ure, the visibility measured by two different approaches hadrelatively good time-series consistency, especially during thelow visibility periods, which suggested that visibilities esti-mated from aerosol extinction profile and pollutant gas werereasonable and could be used for further analysis.
Figure 1c shows the temporal variation of PM mass con-centration levels at three different sizes, i.e. PM1, PM2.5
and PM10. Based on the visibility, PM mass concentra-tion levels and mass fraction of fine particles (PM2.5/PM10),we sorted out three typical pollution episodes. The firstpollution episode (PE1) occurred from 4–10 April, duringwhich the mean visibility was as low as 3.5 km. The averageconcentrations of PM1, PM2.5, and PM10 were 60.9± 14.0,63.6± 16.4, and 120.1± 40.7 µg m−3, respectively. Theaverage ratio of PM2.5/PM10 was 0.54± 0.09, indicatingboth fine and coarse particles could be important in the for-mation of pollution. The mass ratio of PM1/PM2.5 rangedfrom 0.90 to 0.99, suggesting that the mass of PM2.5 wasmainly dominated by smaller particles, i.e. PM1. Time seriesof pollutant gases, i.e. SO2, NOx and CO, showed their sig-nificant enhancements during this period (Fig. 2); enhancedindustrial and traffic emissions were probably responsible forthis and the pollution during this period was probably causedby the local photochemical process. The detailed analy-sis on pollutant gases is discussed in Sect. 3.5. Figure 1ashows the hourly surface meteorological parameters, includ-ing wind speed, wind direction, relatively humidity (RH),dew point and atmospheric pressure. A surface high pres-sure system persisted during PE1 locally. As also illustratedin the weather map (Fig. S1), the center of surface high pres-sure strengthened in the major areas of Eastern and CentralChina, leading to the stagnant dispersion conditions and fi-nally moved out to the East China Sea at the end of thisepisode. During PE1, the local air was under a low pressuresystem, turning from a high one several days earlier. Windsblew from various directions and the wind speeds were rel-atively low and even stagnant sometimes, which were notfavorable for the dispersion of pollution. There was an ob-vious decrease of relative humidity (RH) during PE1. Acold front from inland China probably contributed to thehigh pollution of PE1. To study the aerosol transport char-acteristics, air mass backward trajectories were computedusing the NOAA Hybrid Single-Particle Lagrangian Trajec-tory (HYSPLIT) model (R. Draxler and G. Rolph, HYSPLIT(HYbrid Single – Particle Lagrangian Integrated Trajectory)Model, 2003,http://www.arl.noaa.gov/ready/hysplit4.html)with meteorological data provided by the Global Data As-similation System (GDAS). Three-day backward trajectoriesat the end point of Shanghai during PE1 showed that air flowsderived from various directions and traveled relatively shortdistances, consistent with the surface meteorological mea-surements. Additionally, the daily average mixing layer wasalmost below 500 m (Fig. 3a). This typical stagnant synop-tic meteorological condition was especially unfavorable forthe dispersion of particles and gases, and beneficial for theformation of haze pollution.
The second pollution episode (PE2) occurred on 25 Apriland lasted a short duration. The daily concentrations ofPM1, PM2.5, and PM10 were 26.3, 53.0, and 174.5 µg m−3,respectively. And the ratio of PM2.5/PM10 reached thelowest value of 0.35 over the whole study period, indicat-ing the characteristic of coarse particle pollution. Surface
Atmos. Chem. Phys., 12, 105–124, 2012 www.atmos-chem-phys.net/12/105/2012/

K. Huang et al.: Typical types and formation mechanisms of haze in Shanghai 109
Fig. 1. (a) Time-series of the meteorological parameters during the study period (30 March ~ 16 May and 28 May ~ 3 June) in 2009 over Shanghai, including wind speed (ms-1), wind direction, relatively humidity (%), dew point (℃) and atmospheric pressure (hPa) (b) Time-series of the calculated and observed hourly visibility (km) during the same study period as above. The observed visibility recorded at Pudong had an upper limit of 10km (Data source: National Climatic Data Center (NCDC)). The method of calculating the visibility was described in Appendix A. (c) Time-series of the hourly particulate concentrations of PM1, PM2.5 and PM10 (μgm-3), three pollution episodes were highlighted in the figure.
Fig. 1. (a) Time-series of the meteorological parameters during the study period (30 March–16 May and 28 May–3 June) in 2009 overShanghai, including wind speed (m s−1), wind direction, relatively humidity (%), dew point (◦C) and atmospheric pressure (hPa).(b) Time-series of the calculated and observed hourly visibility (km) during the same study period as above. The observed visibility recorded at Pudonghad an upper limit of 10 km (Data source: National Climatic Data Center (NCDC)). The method of calculating the visibility was describedin Appendix A.(c) Time-series of the hourly particulate concentrations of PM1, PM2.5 and PM10 (µg m−3), three pollution episodes werehighlighted in the figure.
Fig. 2. Time-series of the hourly gaseous concentrations of SO2, NOx and CO, all units are in μgm-3.
Fig. 2. Time-series of the hourly gaseous concentrations of SO2,NOx and CO, all units are in µg m−3.
meteorology showed a dominant northwest wind (Fig. 1a)and air backward trajectories starting at three altitudes of500, 1000 and 3000 m, which all flowed from Northern
China and passed over the Gobi Desert in Mongolia andInner-Mongolia (Fig. 3b). The average wind speed reachedas high as 7.5 m s−1 in Shanghai with gust speeds over10 m s−1. Relative humidity and dew points both had abruptdecreases, indicating the advent of a cold front. Addition-ally, the intraday average mixing height was about 1000 m,much more elevated than PE1. Thus, all the evidence aboveindicated that this coarse particle pollution was probablycaused by the entrainment of dust aerosol from the desert inMongolia and Inner-Mongolia via the long-range transport.Figure 4 depicts the regional distribution pattern of PM10concentration during 24–26 April in Northern and EasternChina. On 24 April, high pollution (PM10 > 300 µg m−3)occurred in Northern China, mainly in Inner-Mongolia andShanxi province, while the Eastern and Southern China wasvirtually dust-free (Fig. 4a). On the next day, abundant par-ticles moved to major areas of central China and stretchedto the eastern coastal regions (Fig. 4b). As for Shang-hai, our monitoring station observed that the dust entrain-ment actually had the most significant impacts on local air
www.atmos-chem-phys.net/12/105/2012/ Atmos. Chem. Phys., 12, 105–124, 2012

110 K. Huang et al.: Typical types and formation mechanisms of haze in Shanghai
(a)(b)
(c)
Fig. 3. Three days air mass backward trajectory at Shanghai computed by the NOAA Hybrid Single-Particle Lagrangian Trajectory (HYS-PLIT) model during(a) PE1,(b) PE2, and(c) PE3, respectively. The starting altitude during PE1 and PE3 was 500 m and three altitudes of500, 1000 and 1500 m were computed during PE2. The mixing heights during the three episodes were computed using the NCEP Global DataAssimilation System (GDAS) model (http://ready.arl.noaa.gov/READYamet.php) and shown below the trajectory panel (blue dots denotedthe 3 h average mixing height and the pink horizontal step lines denoted the daily average mixing height).
quality during two periods, i.e. from 01:30 to 08:00 LST (Lo-cal Standard Time) and 17:00 to 23:00 LST. The averagePM10 concentration reached 258 and 236 µg m−3, respec-tively, while the concentrations of fine particles and pollutantgases stayed at low values (Figs. 1b and 2), which was due tothe dilution effect of dust on local pollutants. Till 26 April,the PM concentrations in Northern China had sharply de-clined and the dust continued to travel southwestward alongthe east coast, which exerted a moderate influence on airquality of Southern China (Fig. 4c). In Shanghai, there wasa significant decreased PM10 concentration and an increasedPM2.5/PM10 ratio over 0.50, indicating the re-dominance offine particles after the pass of dust.
The third pollution episode (PE3) occurred from28 May to 3 June. The average concentrations ofPM1, PM2.5, and PM10 were 67.8± 37.6, 84.0± 48.4and 135.6± 71.4 µg m−3, respectively, with the averagePM2.5/PM10 ratio of 0.65± 0.04. Fine particle concentrationand its mass contribution to the total particles were both thehighest among all three pollution episodes. Notwithstand-ing, the concentration of pollutant gases were not as highas PE1 except CO, SO2 was at a moderate level and NOxwas relatively low (Fig. 2). Since the relative low concen-tration of pollutant gases during PE3 was different from thehigh concentrations of pollutant gases during PE1, the for-
mation mechanism of the PE3 pollution should be differentfrom that of PE1. As shown in the weather map (Fig. S2),Shanghai was at the edge of the high pressure system dur-ing this episode. Compared to PE1, the inversion during PE3should be weaker. The meteorological conditions during thisperiod were similar to PE1, i.e. slow transport of air flows(Fig. 1a) and relatively low mixing layer (Fig. 3c), which alsosuggested the stagnant atmospheric condition during PE3.
As demonstrated above, the analysis of PM, pollutantgases and meteorological parameters has already shed lighton the pollution types of three different episodes. In the fol-lowing sections, more information from the aerosol opticaland chemical properties will be discussed.
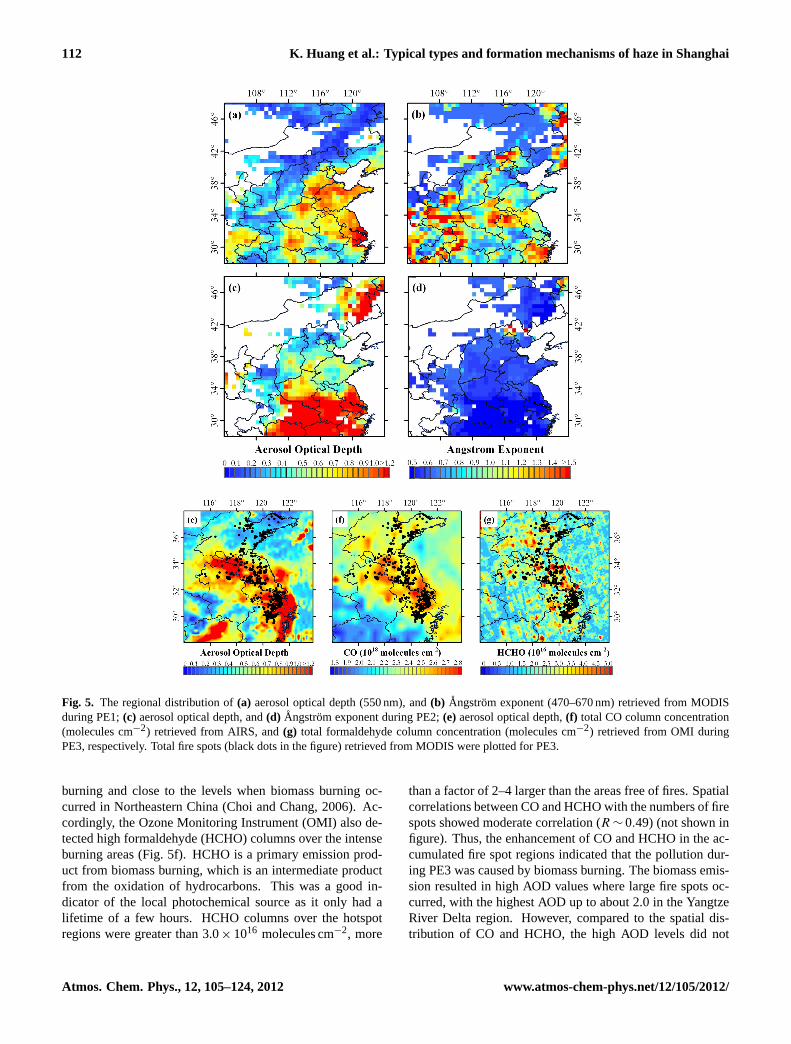
3.1.1 Regional characteristics and possible sources viaremote sensing observation
The satellite remote sensing delivers reliable informationabout the spatial distribution, transport and possible sourceof airborne pollutants. Figure 5 shows the signals of typi-cal pollutants observed by satellite sensors during the threeepisodes, respectively. During PE1, zones of high aerosoloptical depths (AOD) at the wavelength of 550 nm re-trieved from MODIS were mainly concentrated in Jing-Jin-Ji (Beijing-Tianjin-Hebei), Shandong, Anhui, Henan, Hubei
Atmos. Chem. Phys., 12, 105–124, 2012 www.atmos-chem-phys.net/12/105/2012/

K. Huang et al.: Typical types and formation mechanisms of haze in Shanghai 111
Fig. 4. Regional distribution of PM10 concentration (μgm-3) during 24-26 April (Data source: Ministry of Environment Protection of the PRC, http://www.zhb.gov.cn/).
Fig. 4. Regional distribution of PM10 concentration (µg m−3) during 24–26 April (Data source: Ministry of Environment Protection of thePRC,http://www.zhb.gov.cn/).
provinves, and the Yangtze River Delta region, includingnorthern part of Zhejiang, Jiangsu provinces and Shanghai(Fig. 5a). The average AOD value over Shanghai reached anextremely high value of over 1.2, indicating strong aerosolextinction to sunlight in the atmosphere. Figure 5b showsthe spatial distribution ofAngstrom exponent at the wave-length range from 470 to 670 nm.Angstrom exponent isan indicator of the aerosol size distribution, the larger valueindicates the smaller particle size, and vice versa. As theMODIS-reportedAngstrom exponent was only moderatelywell validated by using the ground-based AERONET mea-surements, it may be insufficient for quantitative analysis(Levy et al., 2010). Thus, it was used for the qualitativecomparison among the episodes in the study. The spatialpattern ofAngstrom exponent did not resemble that of AOD.In some regions with moderate AOD values, such as south-ern parts of Zhejiang province and major parts of centralChina, theAngstrom exponents ranged from 1.3 to 1.5, in-dicating these regions were mainly dominated by fine par-ticles. While in the high AOD regions specified above, theAngstrom exponents ranged from 0.8 to 1.2. The relativelow Angstrom exponents in these high AOD regions sug-gested there was non-negligible contribution of coarse par-ticles during PE1. This conclusion is consistent with themoderate PM2.5/PM10 ratio measured by the ground moni-toring results in Sect. 3.1. As shown in Fig. 5b, there wasa belt of relatively lowAngstrom exponent regions extend-ing from the Bohai Bay and the Shandong Peninsular to theYangtze River Delta region along the east coast. The spatialcontinuity ofAngstrom exponent probably indicates that theYangtze River Delta could have been more or less influencedby the dust flow from Northern China. As PE1 was in the
spring season when the occurrence of floating dust was fre-quent and ubiquitous, the downstream regions were probablyinfluenced by the transport of dust aerosol to some extent.
During PE2, high AOD values were observed in most partsof the study domain, which was similar to PE1 to a certainextent, especially in central and Eastern China with AOD ex-ceeding 1.2 (Fig. 5c). However,Angstrom exponents weremuch lower than PE1. It ranged from 0.5 to 0.6 (Fig. 5d), in-dicating the existence of considerable coarse particles, whichwas consistent with ground measurements. There were al-most no regional gradients ofAngstrom exponents, suggest-ing this episode was characteristic of large-scale influences.The remote sensing analysis confirmed that PE2 was im-pacted by the long-range transport of dust. The dust stormhad spread over almost the whole North China Plain andEastern China as shown in Fig. 5d.
During PE3, large quantities of fire spots retrieved fromMODIS were observed in the study domain (denoted byblack dots in Fig. 5e–g), and they were mainly located inthe conjunction of western Shanghai and southern Jiangsuprovince, major parts of Jiangsu, Northern Zhejiang, North-ern Anhui Province and eastern parts of Shandong Province.The total column concentration of carbon monoxide (CO) re-trieved from the Atmospheric Infrared Sounder (AIRS) ob-viously enhanced over the fire spots areas (Fig. 5e). Vari-ous studies have used CO as tracer for biomass burning inaircraft measurement (Boian and Kirchhoff, 2004), satelliteobservation (Choi and Chang, 2006; Mari et al., 2008) andother measurements (Kato et al., 1999; Kato et al., 2002).The column concentration of CO over the intense burning ar-eas reached 2.5∼3.0× 10¹⁸ molecules cm−2 as shown in thefigure, evidently distinguished from areas free of biomass
www.atmos-chem-phys.net/12/105/2012/ Atmos. Chem. Phys., 12, 105–124, 2012
112 K. Huang et al.: Typical types and formation mechanisms of haze in Shanghai
Fig. 5. The regional distribution of (a) aerosol optical depth (550 nm), and (b) Ångström exponent (470 – 670 nm) retrieved from MODIS during PE1; (c) aerosol optical depth, and (d) Ångström exponent during PE2; (e) aerosol optical depth, (f) total CO column concentration (molecules cm-2) retrieved from AIRS, and (g) total formaldehyde column concentration (molecules cm-2) retrieved from OMI during PE3, respectively. Total fire spots (black dots in the figure) retrieved from MODIS were plotted for PE3.
Fig. 5. The regional distribution of (a) aerosol optical depth (550 nm), and (b) Ångström exponent (470 – 670 nm) retrieved from MODIS during PE1; (c) aerosol optical depth, and (d) Ångström exponent during PE2; (e) aerosol optical depth, (f) total CO column concentration (molecules cm-2) retrieved from AIRS, and (g) total formaldehyde column concentration (molecules cm-2) retrieved from OMI during PE3, respectively. Total fire spots (black dots in the figure) retrieved from MODIS were plotted for PE3.
Fig. 5. The regional distribution of(a) aerosol optical depth (550 nm), and(b) Angstrom exponent (470–670 nm) retrieved from MODISduring PE1;(c) aerosol optical depth, and(d) Angstrom exponent during PE2;(e) aerosol optical depth,(f) total CO column concentration(molecules cm−2) retrieved from AIRS, and(g) total formaldehyde column concentration (molecules cm−2) retrieved from OMI duringPE3, respectively. Total fire spots (black dots in the figure) retrieved from MODIS were plotted for PE3.
burning and close to the levels when biomass burning oc-curred in Northeastern China (Choi and Chang, 2006). Ac-cordingly, the Ozone Monitoring Instrument (OMI) also de-tected high formaldehyde (HCHO) columns over the intenseburning areas (Fig. 5f). HCHO is a primary emission prod-uct from biomass burning, which is an intermediate productfrom the oxidation of hydrocarbons. This was a good in-dicator of the local photochemical source as it only had alifetime of a few hours. HCHO columns over the hotspotregions were greater than 3.0× 10¹⁶ molecules cm−2, more
than a factor of 2–4 larger than the areas free of fires. Spatialcorrelations between CO and HCHO with the numbers of firespots showed moderate correlation (R ∼ 0.49) (not shown infigure). Thus, the enhancement of CO and HCHO in the ac-cumulated fire spot regions indicated that the pollution dur-ing PE3 was caused by biomass burning. The biomass emis-sion resulted in high AOD values where large fire spots oc-curred, with the highest AOD up to about 2.0 in the YangtzeRiver Delta region. However, compared to the spatial dis-tribution of CO and HCHO, the high AOD levels did not
Atmos. Chem. Phys., 12, 105–124, 2012 www.atmos-chem-phys.net/12/105/2012/

K. Huang et al.: Typical types and formation mechanisms of haze in Shanghai 113
always coincide with the fire regions. For example, therewere no fire spots observed in Jiangxi province with lowCO concentrations, but a high AOD region was found there.As for Shandong Province, the regions with great fire spots,high CO, and HCHO concentrations were at the relativelylow AOD level. This suggested that CO and HCHO weremore sensitive to biomass burning than AOD as AOD repre-sented the overall extinction of various emission sources tolight rather than the single source from biomass burning. Therelatively low AOD over the Shandong Peninsula could havebeen due to the cleanup effect of the sea breezes as it wasclose to the sea. Anyway, the relatively good consistency be-tween the observed satellite signals (e.g. carbon monoxide,formaldehyde and aerosol optical depth) over Eastern Chinaand the fire hotspots clearly indicated that biomass burningshould be the major cause of heavy haze during this period.Every year during May, June and October in Eastern China,crop residues after harvest were either directly returned toagriculture fields as fertilizer, burned in the field, or used asbiofuels. It has been previously reported that biomass burn-ing usually occurs during the transition period from spring tosummer (Wang et al., 2002) and in autumn (Xu et al., 2002),which is due to the burning of post-harvest straws.
In this section, the remote sensing analysis has given someinsights into the different characteristics of three pollutionepisodes, including possible sources and transport pathwaysand provided some consistent results to our ground measure-ments. However, there were large uncertainties due to thesatellite detection limit of the small fire size of the field cropresidue burning that could therefore possibly be missed bysatellite observations (Chang and Song, 2010; Yan et al.,2006). And satellites could not capture all fire events oc-curring during this study period, because fires hidden underclouds can not be easily detected. Additionally, satellite over-pass also brings about the missed detection of hotspots.
3.2 Aerosol chemistry under different atmosphericconditions
The results of aerosol chemical analysis have been demon-strated in this section to further identify the different types ofhazes as envisioned by the above discussion. Figure 6 showsthe temporal variations of some typical aerosol componentsduring the whole study period. Time series of three majorsecondary inorganic species in PM2.5, i.e. SO2−
4 , NO−
3 , andNH+
4 are presented in Fig. 6a. Obviously, the total concentra-tions of the three species exhibited the highest levels duringPE1 with an average concentration of 48.86± 5.01 µg m−3,which accounted for an average of 77 % to PM2.5 mass. Asprecursors of sulfate and nitrate, SO2 and NOx also showedthe highest concentration levels during this episode, whichhad been stated in Sect. 3.1. This suggested that the pollu-tion during PE1 was dominated by the secondary inorganicaerosol. In addition, we found that during PE3, these speciesalso exhibited a moderate concentration level with an average
Fig. 6. Time series of (a) SO4
2-, NO3-, and NH4
+ concentration (μgm-3) in PM2.5 (b) Al concentration (μgm-3), the fraction of mineral aerosol, and the elemental ratio of Ca/Al in the total suspended particles (TSP) (c) K+ in PM2.5, during the whole study period (Missing data were due to rainfall or malfunction of instruments).
Fig. 6. Time series of(a) SO2−
4 , NO−
3 , and NH+
4 concentration
(µg m−3) in PM2.5 (b) Al concentration (µg m−3), the fraction ofmineral aerosol, and the elemental ratio of Ca/Al in the total sus-pended particles (TSP)(c) K+ in PM2.5, during the whole studyperiod (Missing data were due to rainfall or malfunction of instru-ments).
value of 27.12± 7.37 µg m−3, which probably indicates thatbiomass burning could also release considerable amounts ofinorganic pollutants. For the other periods, the concentrationof theses species were much lower with values almost be-low 20 µg m−3. The average sulfate concentration during thewhole study period was 8.0± 5.8 µg m−3. Compared to pre-vious studies (Fu et al., 2008; Pathak et al., 2009; Wang et al.,2006; Yao et al., 2002; Ye et al., 2003), sulfate concentrationwas much lower in this study, indicating the effective policycontrols on the SO2 emission. However, the average nitrateconcentration reached 6.3± 5.7 µg m−3, which was compa-rable or even higher than those previous results. Addition-ally, the mass ratio of NO−3 /SO2−
4 had an increasing trend ascompared to the value of 0.75± 0.26 in this study with 0.64in 2006 (Wang et al., 2006), and 0.43 during 1999–2000 (Yaoet al., 2002; Ye et al., 2003). The ratio of NO−
3 /SO2−
4 can beused as an indicator of the relative importance of stationaryvs. mobile sources (Arimoto et al., 1996). The increasingtrend of NO−
3 /SO2−
4 indicates that the role of mobile emis-sion has become more and more significant due to the rapidexpansion of transportation.
Figure 6b shows the temporal variations of elemental Alconcentration, the ratio of Ca/Al, and the estimated massfraction of mineral aerosol in the total suspended particles(TSP). Al is one of the inert and abundant elements in min-eral aerosol and has been used as a good tracer for min-eral aerosol in various studies (Huang et al., 2010; Wanget al., 2007; Zhang et al., 2010). As shown in the figure,the highest Al concentration occurred on April 25, i.e. thesecond pollution episode (PE2). The daily Al concentra-tion reached a high of 13.7 µg m−3, almost 2 to 3 times thatof the other periods. To quantify the mass concentration
www.atmos-chem-phys.net/12/105/2012/ Atmos. Chem. Phys., 12, 105–124, 2012

114 K. Huang et al.: Typical types and formation mechanisms of haze in Shanghai
of mineral aerosol, it could be estimated by summing themajor mineral elements with oxygen for their normal ox-ides, which was calculated using the formula: [Mineralconcentration] = 2.2[Al] + 2.49[Si] + 1.63[Ca] + 2.42[Fe]+ 1.94[Ti] (Malm et al., 1994). According to this estima-tion, the percentage of mineral aerosol in TSP during PE2was as high as 76.8 %. Oppositely, the average concen-tration of sum of SO2−
4 , NO−
3 , and NH+
4 in PM2.5 wasonly 11.23± 5.25 µg m−3, which was the lowest during thewhole study period. This indicates the dominance of non-anthropogenic sources and the prominent impact of dust en-trainment on the local aerosol chemistry. To further char-acterize the origin of dust, the temporal variation of the el-emental Ca/Al ratio was investigated, as different dust re-gions in China are characterized by distinct Ca content andCa/Al ratios in soils/particles (Zhang et al., 2003, 1996). TheCa/Al ratio during PE3 reached a low value of 0.75, whilein the other period it mainly ranged between 1.0 and 2.0.The relatively high Ca/Al ratios during the non-dust periodswere attributed to the frequent construction activities in re-cent years in Shanghai (Wang et al., 2006). The significantdrop of Ca/Al ratio during PE2 confirmed that the local airquality must have been impacted by outside sources. Ele-mental ratios of Ca/Al of dust aerosol in the three major dustsource regions of China, i.e. Gobi Desert, Loess Plateau,and Taklimakan Desert, were 0.52± 0.05, 1.09± 0.13, and1.56± 0.14, respectively (Huang et al., 2010). Combinedwith the backward trajectory analysis in Sect. 3.1, we couldconfirm that the aerosol chemistry over Shanghai duringPE2 was more close to that of the dust aerosol originatingfrom Gobi Desert. During PE1, moderate Al concentrations(5.48± 2.52 µg m−3) were observed, indicating the influencefrom long transported dust aerosol to some extent.
Figure 6c shows the temporal variation of particulate K+
concentration in PM2.5, which is a good indicator for tracingthe biomass burning source (Andreae, 1983). The highestK+ concentration was detected just during PE3, with an av-erage concentration of 2.84 µg m−3, which was 5 to 10 timeshigher than the other days. As K+ could be also derivedfrom soil and dust, we used the K/Fe ratio of 0.56 (Yang etal., 2005b) to exclude the contribution of mineral source. Itwas calculated that the biomass burning-derived K+ couldcontribute about 80 % of total K+, indicating the significantinfluence of biomass burning. The total potassium accountedfor an average of 3.25 % in PM2.5 during PE3, which wasalso higher than that of 1.07 % in the other times and closeto that of 3.58 % observed during the Mount Tai Experi-ment 2006 (MTX2006), which focused on biomass burn-ing in Eastern China (Deng et al., 2010). Cl− and K+ areboth important ions in particles from open burning of agri-cultural wastes (Li et al., 2007a). Individual particle analysishas found that large irregular shaped KCl particles existed inyoung smoke (Chakrabarty et al., 2006; Li et al., 2003). Dur-ing PE3, a very significant correlation between Cl− and K+
was observed with the correlation coefficient of 0.96. TheK+/Cl− ratio of 2.09 during PE3 was much higher than itsbackground ratio of 0.10 to 0.46 (Wang et al., 2006), indicat-ing the dominance of biomass burning source. However, Cl−
could be also derived from coal burning as coal had alwayscontributed to the biggest share of the energy structure inShanghai. Another significantly enhanced group of aerosolwas the organic aerosol, including organic carbon (OC) andelement carbon (EC). OC and EC in PM10 averaged 35.8± 8.1 and 5.7± 1.3 µg m−3 during PE3, and they were en-hanced 30–100 % compared to the other days. The concen-tration of organic aerosol was comparable to the extensiveburning biomass period during MTX2006 (EC: 7 µg m−3,OC: 24 µg m−3) (Yamaji et al., 2010). If an OM/OC ratioof 1.8 was applied to estimate the mass of organic matter(OM) (Turpin and Lim, 2001), the average mass contribu-tion of OM to PM10 would be as high as 50 %. Further-more, a higher factor (2.2–2.6) for aerosol heavily impactedby smoke was recommended (Turpin and Lim, 2001), thusit may result in an underestimated value for the faction ofOM in this work. Compared to previous results of the masspercentage of organic aerosol of∼30 % over YRD in thenon-biomass-burning times (Feng et al., 2009; Yang et al.,2005a), biomass burning evidently emitted much more hy-drocarbons. The OC/EC ratio is commonly on the order of3 in most urban cities of China (Zhang et al., 2008), wherethe major sources of OC and EC are dominated by fossil fuelcombustions. High ratio of OC/EC (6.4) was observed dur-ing PE3, which indicated that biomass burning contributedfar more organic carbon than fossil fuel combustion did (Yanet al., 2006). Field measurements have also observed a highratio of OC/EC (about 5) for the burning of wheat straw andan even higher ratio for maize stover (Li et al., 2007).
Figure 7 shows the enrichment factors (EF) of major el-ements in PM2.5 during three episodes, respectively, whichaims to evaluate the enrichment extents of various ele-ments in aerosol. Usually, Al is used as the reference el-ement as it is a relatively chemical inert element with al-most no anthropogenic sources. The calculation formula wasEFx = (X/Al)aerosol/(X/Al)crust, of which X was the elementof interest. Species with EFs less than 10 were usually con-sidered to have a major natural source, which included Sc,Na, Ca, Co, Fe, Mn, Sr, Ba, P, K, Ni, Mn, Ti, and V. TheEF of V was a little higher during PE1, which could be fromthe re-suspension of local soils and road pavement erosion(Amato et al., 2009). Species with higher EFs were contam-inated by anthropogenic sources, which included Cu, Mo,As, Sb, Ge, Pb, Zn, Cd, S, and Se. As shown in the figure,the enrichment degrees of almost all the elements were thelowest during PE2. The dust aerosol originating from theGobi Desert was relatively clean (Huang et al., 2010), andits entrainment had a cleanup and dilution effect on the lo-cal pollution, which lowered the enrichment degrees of mostpollution elements. Elements during PE1 were mostly en-riched, especially for those elements, i.e. Pb, Zn, Cd, S, and
Atmos. Chem. Phys., 12, 105–124, 2012 www.atmos-chem-phys.net/12/105/2012/

K. Huang et al.: Typical types and formation mechanisms of haze in Shanghai 115
Fig. 7. The average enrichment factors (EF) of various elements during PE1, PE2, and PE3, respectively.
Sc NaCa CoFe Mg Sr Ba P K Ni Mn Ti V Cu Mo As Sb Ge Pb Zn Cd S Se
Enr
ichm
ent F
acto
rs
0.1
1
10
100
1000
10000
PE3
PE1PE2
Fig. 7. The average enrichment factors (EF) of various elementsduring PE1, PE2, and PE3, respectively.
Se, with EF values larger than 1000. Pb had its major sourcefrom traffic emission in early years, while coal combustionhas dominated as the lead pollution source since the phasingout of leaded gasoline in 1997 in Shanghai (Chen et al., 2005;Tan et al., 2006; Zhang et al., 2009). Zn and Cd are mainlyderived from local industrial and traffic emission (Cao et al.,2008; Shi et al., 2008). As indicators for coal combustion(Nriagu, 1989), S and Se had the highest EFs among allthe elements, indicating coal combustion is one of the ma-jor sources of air pollution in Shanghai. Most of the EFsof pollution elements during the biomass burning period, i.e.PE3, were higher than PE2 and lower than PE1. The only ex-ception was arsenic (As), whose EF was comparable to thatduring PE1. The average As concentration during PE3 was7.53 ng m−3, higher than that of 4.46 ng m−3 during PE1 andmuch higher than 2.02 ng m−3 in the normal periods. Thehigh concentration and great enrichment of As was proba-bly not derived from its usual source such as coal burning, asno corresponding enrichment of the other pollution elementswere found as in the PE1 case. High arsenic levels in ground-water in many areas over mainland China have been observed(Mandal and Suzuki, 2002) and crops are most susceptibleto As toxicity, which is sourced from the As-contaminatedgroundwater used for irrigation (Brammer and Ravenscroft,2009). Thereby, the burning of agricultural residues wouldprobably release considerable amounts of As, resulting in theenrichment of As in particles.
3.3 Aerosol vertical profile
Figure 8 shows the time-height cross-section of the lidarmeasured aerosol properties at the wavelength of 532 nm dur-ing the three pollution periods, respectively. In this study,the total aerosol extinction coefficient was split to non-dust(spherical aerosols such as air pollution) and dust (nonspher-ical aerosol) fractions based on the aerosol depolarizationratio. Sugimoto et al. (2002) and Shimizu et al. (2004)described details of lidar observation and splitting method.Figure 8a presents the time-height cross-section of spheric
aerosol extinction coefficient during PE1. Lidar observationsuccessfully captured several high extinction peaks, whichwas consistent with the ground monitoring (Fig. 1b). Ver-tical distribution of aerosol extinction coefficient exhibitedstrong variations and showed obvious decreasing gradientsfrom the ground to upper layers, which reflected that pollu-tants were mainly constrained near the surface ground. Theheight of the boundary layer could be visually assumed fromthe vertical profile of aerosol optical properties. The pro-file, where the extinction coefficient sharply decreased, couldbe determined as the top of planetary boundary layer (PBL)(Noh et al., 2007). During the daytime, the PBL height wasrelatively high, and sometimes it could reach up to 2 km,which was due to the higher temperature and stronger airconvection. While during nighttime, it dropped to less than0.5 km due to the temperature inversion. We selected onetypical day (11:30–15:00 LST, 6 April) during PE1 to dis-cuss its vertical profile (Fig. 9a). The depolarization ratio atthe wavelength of 532 nm (δ532) from the ground to the upperlayer (∼1.5 km) was less than 5 %, indicating the aerosol wasmainly composed of spheric particles. While at higher alti-tudes, the depolarization ratio increased slightly, which maydue to the absence of spheric aerosol or the possible contam-ination of water clouds and ice clouds. The averaged pro-file of attenuated aerosol backscattering coefficient showeda steep decreased gradient from 0.037 km−1 sr−1 near theground to 0.0018–0.0030 km−1 sr−1 around 1–1.5 km.
As for PE2, we present the time-height cross-section ofspheric aerosol extinction coefficient and depolarization ratiomeasured during 22–28 April (Fig. 8b). The depolarizationratio showed high values on 25 April. The high depolar-ization ratio of aerosol was due to the nonsphericity (irreg-ular shapes) and relatively large size of particles (Mcneil andCarswell, 1975), we regarded this type of aerosol as mineralaerosol/dust aerosol since dust was the most important com-ponent of nonspheric aerosols in East Asia. On 25 April, twoconsecutive dust plumes were observed, which was consis-tent with the ground measurement. Before the dust event,the air quality was relatively good. The high extinction coef-ficients and low mixing layers (400–600 m) of the whole dayon 24 April were caused by the recorded rainfall. It shouldbe emphasized that on the advent of the first dust plume(01:30–08:00 LST), the extinction coefficients of sphericaerosol were still high, indicating the strong mixing of dustand pollutant aerosol. After the pass of dust, the values de-creased, indicating the clear-out of pollutants. The pollutantsconcentration increased again after the advent of the sec-ond dust plume (13:00–21:45 LST). One dust plume (01:30–08:00 LST, 25 April) was selected to portray its vertical pro-file (Fig. 9b). In addition to the profile of aerosol backscat-tering coefficient and total depolarization ratio, the fractionof dust aerosol extinction to the total aerosol extinction (fd)was also calculated based on the splitting method describedby (Shimizu et al., 2004; Sugimoto et al., 2002). Comparedto PE1, and PE3 that will be discussed below, PE2 showed
www.atmos-chem-phys.net/12/105/2012/ Atmos. Chem. Phys., 12, 105–124, 2012

116 K. Huang et al.: Typical types and formation mechanisms of haze in Shanghai
Fig. 8. Top panel: The time-height cross section of spheric aerosol extinction coefficient (km-1) during PE1. Middle panel: The time-height cross section of depolarization ratio from 22-28, April, including PE2 (25 April). Bottom panel: The time-height cross section of spheric aerosol extinction coefficient (km-1) during PE3. The gray columns represented the missing data which were due to the malfunction of the lidar instrument.
Fig. 8. Top panel: The time-height cross section of spheric aerosolextinction coefficient (km−1) during PE1. Middle panel: the time-height cross section of depolarization ratio from 22–28 April, in-cluding PE2 (25 April). Bottom panel: the time-height cross sec-tion of spheric aerosol extinction coefficient (km−1) during PE3.The gray columns represented the missing data which were due tothe malfunction of the lidar instrument.
an evidently different profile. The backscattering coefficientsharply decreased from 0.04 km−1 sr−1 at near surface to0.01 km−1 sr−1 at around 0.7 km. And then the coefficientalmost stayed constant value of about 0.01 km−1 sr−1 be-tween 0.7 and 1.0 km, which indicated the transport of out-side aerosol, a phenomenon not observed in the other twoepisodes. Upwards, the backscattering coefficient started tosharply decrease again to low values. The vertical distribu-tion of backscattering coefficient was closely related to theprofile of depolarization ratio. As shown in Fig. 9b, therewas an increase ofδ532 from ground and peaked at around1.0 km with a value of 0.155. Correspondingly, the contribu-tion of dust aerosol extinction to the total aerosol extinctionpeaked between 0.7 and 1.0 km with the values ranging from51 % to 57 %. Thus, the relatively constant backscatteringcoefficient between altitudes of 0.7 and 1.0 km should be dueto the increase of dust aerosol. Above this layer,fd was lessthan 10 %, indicating the negligible existence of nonsphericaerosol in the upper layers. Using a threshold ofδ532= 0.06to distinguish dust from other types of aerosol (Liu et al.,
Fig. 9. Vertical profile of backscattering coefficient (km-1sr-1) and depolarization ratio (%) during (a) PE1 (1130 - 1500 LST, 6 April), (b) PE2 (0130-0800 LST, 25 April), and (c) PE3 (1130 - 1530 LST, 1 June). The profile of the fraction of dust aerosol extinction to the total aerosol extinction (dust mixing ratio) was calculated and presented during PE2 (Fig. 9b).
0.00 0.01 0.02 0.03 0.04
0 5 10 15 20
0.00 0.01 0.02 0.03 0.040
500
1000
1500
2000
2500
30000 5 10 15 20
Backscattering Coefficient (/km/sr)
0.00 0.01 0.02 0.03 0.04
Hei
ght (
m)
Depolarization ratio (%)0 5 10 15 20
Dust mixing ratio
0.0 0.2 0.4 0.6
(a) (b) (c)
Backscattering Coefficient
Depolarization Ratio
Dust Mixing Ratio
Fig. 9. Vertical profile of backscattering coefficient (km−1 sr−1)and depolarization ratio (%) during(a) PE1 (11:30–15:00 LST, 6April), (b) PE2 (01:30–08:00 LST, 25 April), and(c) PE3 (11:30–15:30 LST, 1 June). The profile of the fraction of dust aerosol ex-tinction to the total aerosol extinction (dust mixing ratio) was cal-culated and presented during PE2 (Fig. 9b).
2008), the dust layer mainly distributed between ground andup to an altitude of around 1.4 km. The averageδ532 of thislayer was 0.122± 0.023, which was close to the dust ob-served in Korea that originated from the same dust region(Kim et al., 2010).δ532 decreased above this layer, indicatingthat dust was transported at relatively low altitudes. Actually,most of the dust plumes (approximately 70 %) were observednear the ground (Kim et al., 2010). The contribution of dustaerosol extinction to the total aerosol extinction exhibitedhigh values and relatively small vertical variations from thenear surface to the upper layer of around 1 km, ranging from44 % to 55 %. If we applied the dust and soluble aerosolextinction efficiency (σep) of about 0.5 and 3 m2 g−1, respec-tively (Lee et al., 2009), it could be estimated that the massconcentration of dust aerosol was almost 4 to 7 times that ofspheric aerosol by using the formula,σep=βext/M, of whichβext andM represented the extinction coefficient and massconcentration of dust/spheric aerosol. This was consistentwith our ground measurement that dust aerosol contributed76.8 % to the total aerosol mass as discussed in Sect. 3.3.
Figure 8c shows the time-height cross-section of sphericaerosol extinction coefficient during PE3. The high aerosolextinction coefficients and strong temporal variations dur-ing PE3 were similar to PE1; however, the PBL heightwas even lower. Figure 9c shows the vertical profileof backscattering coefficient and depolarization ratio on 1June (11:30–15:30 LST). The depolarization ratio fluctu-ated within 0.05 in the whole layer, indicating the domi-nance of spheric particles. The backscattering coefficientwas about 0.024 km−1 sr−1 near the surface, much lower
Atmos. Chem. Phys., 12, 105–124, 2012 www.atmos-chem-phys.net/12/105/2012/
K. Huang et al.: Typical types and formation mechanisms of haze in Shanghai 117
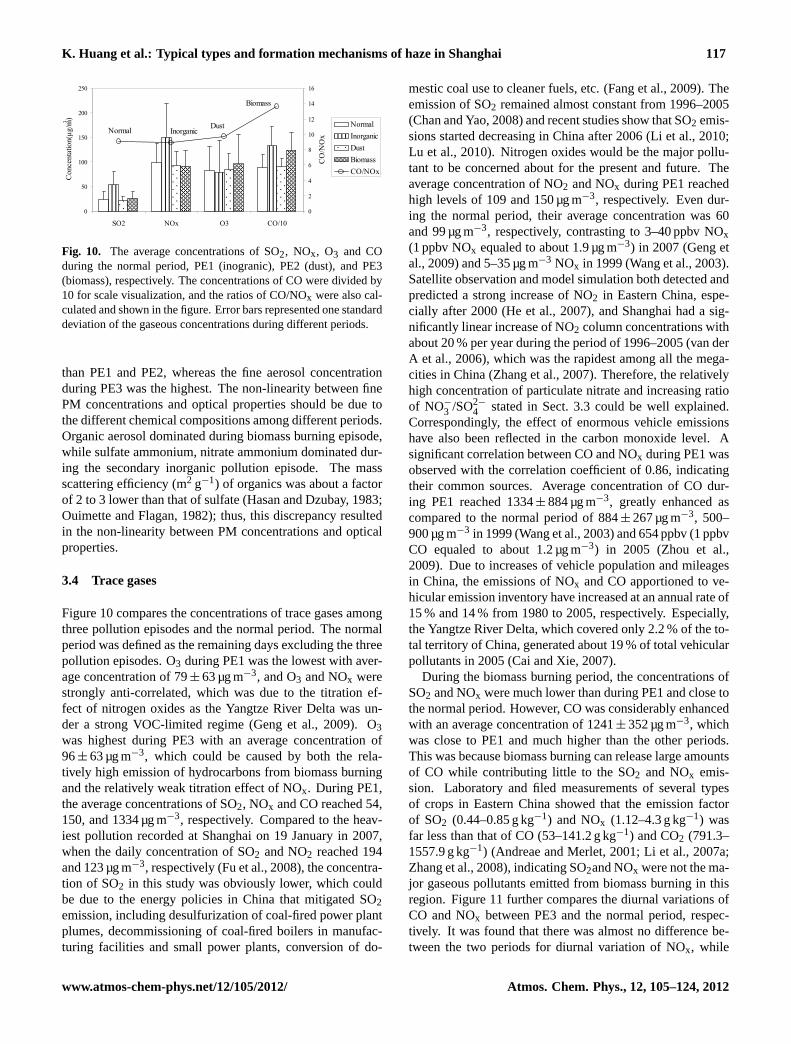
Fig. 10. The average concentrations of SO2, NOx, O3 and CO during the normal period, PE1 (inogranic), PE2 (dust), and PE3 (biomass), respectively. The concentrations of CO were divided by 10 for scale visualization, and the ratios of CO/NOx were also calculated and shown in the figure. Error bars represented one standard deviation of the gaseous concentrations during different periods.
Biomass
DustInorganicNormal
0
50
100
150
200
250
SO2 NOx O3 CO/10
Con
cent
atio
n(μg
/m3 )
0
2
4
6
8
10
12
14
16
CO
/NO
x
NormalInorganicDustBiomassCO/NOx
Fig. 10. The average concentrations of SO2, NOx, O3 and COduring the normal period, PE1 (inogranic), PE2 (dust), and PE3(biomass), respectively. The concentrations of CO were divided by10 for scale visualization, and the ratios of CO/NOx were also cal-culated and shown in the figure. Error bars represented one standarddeviation of the gaseous concentrations during different periods.
than PE1 and PE2, whereas the fine aerosol concentrationduring PE3 was the highest. The non-linearity between finePM concentrations and optical properties should be due tothe different chemical compositions among different periods.Organic aerosol dominated during biomass burning episode,while sulfate ammonium, nitrate ammonium dominated dur-ing the secondary inorganic pollution episode. The massscattering efficiency (m2 g−1) of organics was about a factorof 2 to 3 lower than that of sulfate (Hasan and Dzubay, 1983;Ouimette and Flagan, 1982); thus, this discrepancy resultedin the non-linearity between PM concentrations and opticalproperties.
3.4 Trace gases
Figure 10 compares the concentrations of trace gases amongthree pollution episodes and the normal period. The normalperiod was defined as the remaining days excluding the threepollution episodes. O3 during PE1 was the lowest with aver-age concentration of 79± 63 µg m−3, and O3 and NOx werestrongly anti-correlated, which was due to the titration ef-fect of nitrogen oxides as the Yangtze River Delta was un-der a strong VOC-limited regime (Geng et al., 2009). O3was highest during PE3 with an average concentration of96± 63 µg m−3, which could be caused by both the rela-tively high emission of hydrocarbons from biomass burningand the relatively weak titration effect of NOx. During PE1,the average concentrations of SO2, NOx and CO reached 54,150, and 1334 µg m−3, respectively. Compared to the heav-iest pollution recorded at Shanghai on 19 January in 2007,when the daily concentration of SO2 and NO2 reached 194and 123 µg m−3, respectively (Fu et al., 2008), the concentra-tion of SO2 in this study was obviously lower, which couldbe due to the energy policies in China that mitigated SO2emission, including desulfurization of coal-fired power plantplumes, decommissioning of coal-fired boilers in manufac-turing facilities and small power plants, conversion of do-
mestic coal use to cleaner fuels, etc. (Fang et al., 2009). Theemission of SO2 remained almost constant from 1996–2005(Chan and Yao, 2008) and recent studies show that SO2 emis-sions started decreasing in China after 2006 (Li et al., 2010;Lu et al., 2010). Nitrogen oxides would be the major pollu-tant to be concerned about for the present and future. Theaverage concentration of NO2 and NOx during PE1 reachedhigh levels of 109 and 150 µg m−3, respectively. Even dur-ing the normal period, their average concentration was 60and 99 µg m−3, respectively, contrasting to 3–40 ppbv NOx(1 ppbv NOx equaled to about 1.9 µg m−3) in 2007 (Geng etal., 2009) and 5–35 µg m−3 NOx in 1999 (Wang et al., 2003).Satellite observation and model simulation both detected andpredicted a strong increase of NO2 in Eastern China, espe-cially after 2000 (He et al., 2007), and Shanghai had a sig-nificantly linear increase of NO2 column concentrations withabout 20 % per year during the period of 1996–2005 (van derA et al., 2006), which was the rapidest among all the mega-cities in China (Zhang et al., 2007). Therefore, the relativelyhigh concentration of particulate nitrate and increasing ratioof NO−
3 /SO2−
4 stated in Sect. 3.3 could be well explained.Correspondingly, the effect of enormous vehicle emissionshave also been reflected in the carbon monoxide level. Asignificant correlation between CO and NOx during PE1 wasobserved with the correlation coefficient of 0.86, indicatingtheir common sources. Average concentration of CO dur-ing PE1 reached 1334± 884 µg m−3, greatly enhanced ascompared to the normal period of 884± 267 µg m−3, 500–900 µg m−3 in 1999 (Wang et al., 2003) and 654 ppbv (1 ppbvCO equaled to about 1.2 µg m−3) in 2005 (Zhou et al.,2009). Due to increases of vehicle population and mileagesin China, the emissions of NOx and CO apportioned to ve-hicular emission inventory have increased at an annual rate of15 % and 14 % from 1980 to 2005, respectively. Especially,the Yangtze River Delta, which covered only 2.2 % of the to-tal territory of China, generated about 19 % of total vehicularpollutants in 2005 (Cai and Xie, 2007).
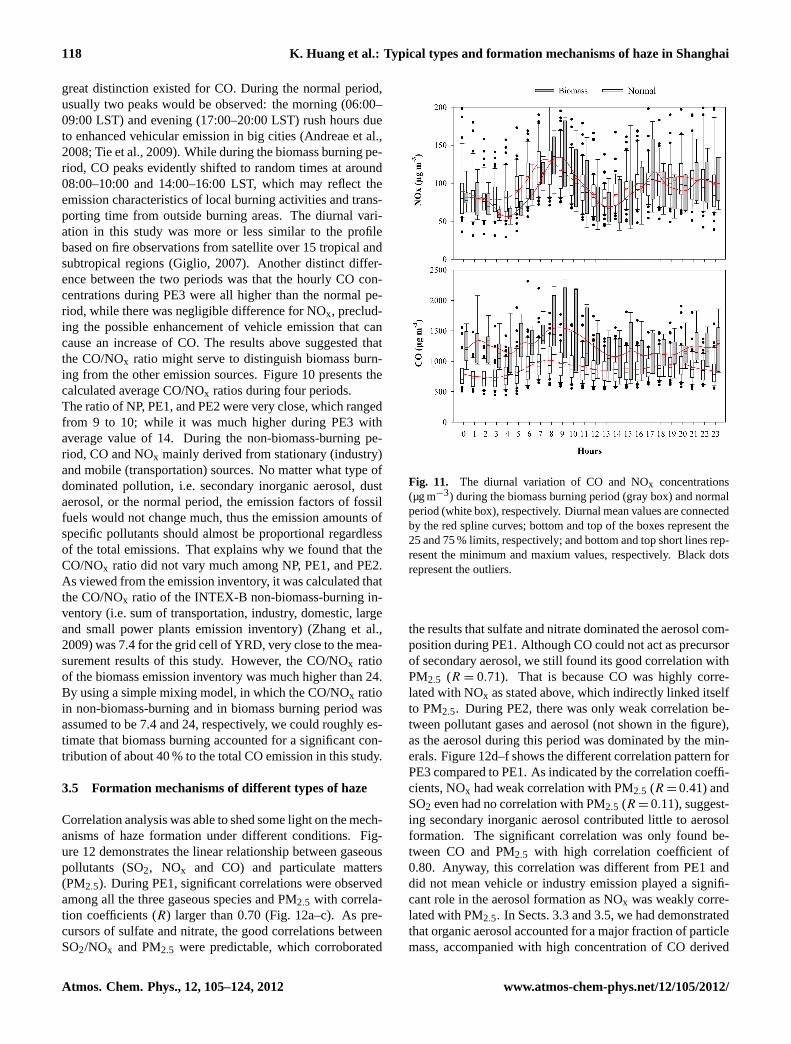
During the biomass burning period, the concentrations ofSO2 and NOx were much lower than during PE1 and close tothe normal period. However, CO was considerably enhancedwith an average concentration of 1241± 352 µg m−3, whichwas close to PE1 and much higher than the other periods.This was because biomass burning can release large amountsof CO while contributing little to the SO2 and NOx emis-sion. Laboratory and filed measurements of several typesof crops in Eastern China showed that the emission factorof SO2 (0.44–0.85 g kg−1) and NOx (1.12–4.3 g kg−1) wasfar less than that of CO (53–141.2 g kg−1) and CO2 (791.3–1557.9 g kg−1) (Andreae and Merlet, 2001; Li et al., 2007a;Zhang et al., 2008), indicating SO2and NOx were not the ma-jor gaseous pollutants emitted from biomass burning in thisregion. Figure 11 further compares the diurnal variations ofCO and NOx between PE3 and the normal period, respec-tively. It was found that there was almost no difference be-tween the two periods for diurnal variation of NOx, while
www.atmos-chem-phys.net/12/105/2012/ Atmos. Chem. Phys., 12, 105–124, 2012
118 K. Huang et al.: Typical types and formation mechanisms of haze in Shanghai
great distinction existed for CO. During the normal period,usually two peaks would be observed: the morning (06:00–09:00 LST) and evening (17:00–20:00 LST) rush hours dueto enhanced vehicular emission in big cities (Andreae et al.,2008; Tie et al., 2009). While during the biomass burning pe-riod, CO peaks evidently shifted to random times at around08:00–10:00 and 14:00–16:00 LST, which may reflect theemission characteristics of local burning activities and trans-porting time from outside burning areas. The diurnal vari-ation in this study was more or less similar to the profilebased on fire observations from satellite over 15 tropical andsubtropical regions (Giglio, 2007). Another distinct differ-ence between the two periods was that the hourly CO con-centrations during PE3 were all higher than the normal pe-riod, while there was negligible difference for NOx, preclud-ing the possible enhancement of vehicle emission that cancause an increase of CO. The results above suggested thatthe CO/NOx ratio might serve to distinguish biomass burn-ing from the other emission sources. Figure 10 presents thecalculated average CO/NOx ratios during four periods.The ratio of NP, PE1, and PE2 were very close, which rangedfrom 9 to 10; while it was much higher during PE3 withaverage value of 14. During the non-biomass-burning pe-riod, CO and NOx mainly derived from stationary (industry)and mobile (transportation) sources. No matter what type ofdominated pollution, i.e. secondary inorganic aerosol, dustaerosol, or the normal period, the emission factors of fossilfuels would not change much, thus the emission amounts ofspecific pollutants should almost be proportional regardlessof the total emissions. That explains why we found that theCO/NOx ratio did not vary much among NP, PE1, and PE2.As viewed from the emission inventory, it was calculated thatthe CO/NOx ratio of the INTEX-B non-biomass-burning in-ventory (i.e. sum of transportation, industry, domestic, largeand small power plants emission inventory) (Zhang et al.,2009) was 7.4 for the grid cell of YRD, very close to the mea-surement results of this study. However, the CO/NOx ratioof the biomass emission inventory was much higher than 24.By using a simple mixing model, in which the CO/NOx ratioin non-biomass-burning and in biomass burning period wasassumed to be 7.4 and 24, respectively, we could roughly es-timate that biomass burning accounted for a significant con-tribution of about 40 % to the total CO emission in this study.
3.5 Formation mechanisms of different types of haze
Correlation analysis was able to shed some light on the mech-anisms of haze formation under different conditions. Fig-ure 12 demonstrates the linear relationship between gaseouspollutants (SO2, NOx and CO) and particulate matters(PM2.5). During PE1, significant correlations were observedamong all the three gaseous species and PM2.5 with correla-tion coefficients (R) larger than 0.70 (Fig. 12a–c). As pre-cursors of sulfate and nitrate, the good correlations betweenSO2/NOx and PM2.5 were predictable, which corroborated
Fig. 11. The diurnal variation of CO and NOx concentrations (μgm-3) during the biomass burning period (gray box) and normal period (white box), respectively. Diurnal mean values are connected by the red spline curves; bottom and top of the boxes represent the 25 and 75% limits, respectively; and bottom and top short lines represent the minimum and maxium values, respectively; Black dots represent the outliers.
Fig. 11. The diurnal variation of CO and NOx concentrations(µg m−3) during the biomass burning period (gray box) and normalperiod (white box), respectively. Diurnal mean values are connectedby the red spline curves; bottom and top of the boxes represent the25 and 75 % limits, respectively; and bottom and top short lines rep-resent the minimum and maxium values, respectively. Black dotsrepresent the outliers.
the results that sulfate and nitrate dominated the aerosol com-position during PE1. Although CO could not act as precursorof secondary aerosol, we still found its good correlation withPM2.5 (R = 0.71). That is because CO was highly corre-lated with NOx as stated above, which indirectly linked itselfto PM2.5. During PE2, there was only weak correlation be-tween pollutant gases and aerosol (not shown in the figure),as the aerosol during this period was dominated by the min-erals. Figure 12d–f shows the different correlation pattern forPE3 compared to PE1. As indicated by the correlation coeffi-cients, NOx had weak correlation with PM2.5 (R = 0.41) andSO2 even had no correlation with PM2.5 (R = 0.11), suggest-ing secondary inorganic aerosol contributed little to aerosolformation. The significant correlation was only found be-tween CO and PM2.5 with high correlation coefficient of0.80. Anyway, this correlation was different from PE1 anddid not mean vehicle or industry emission played a signifi-cant role in the aerosol formation as NOx was weakly corre-lated with PM2.5. In Sects. 3.3 and 3.5, we had demonstratedthat organic aerosol accounted for a major fraction of particlemass, accompanied with high concentration of CO derived
Atmos. Chem. Phys., 12, 105–124, 2012 www.atmos-chem-phys.net/12/105/2012/

K. Huang et al.: Typical types and formation mechanisms of haze in Shanghai 119 Fig. 12. The linear correlation between gaseous pollutants (SO2, NOx and CO) and PM2.5, with correlation coefficients (R) shown in the figure. (a) - (c) denote PE1 and (d) - (f) denote PE3. The black dots denote the hourly data and the square symbols denote the daily average data, all units are in μgm-3.
(a)
X Data
0 30 60 90 120 150 180
SO2
0
40
80
120
160
2D Graph 2
X Data
0 30 60 90 120 150 180
NO
x
0
50
100
150
200
250
300
350
PM2.5
0 30 60 90 120 150 180
CO
0
500
1000
1500
2000
2500
3000
X Data
0 50 100 150 200 250
0
20
40
60
80
0 50 100 150 200 250
0
50
100
150
200
0 50 100 150 200 250
0
500
1000
1500
2000
2500
(d)
R = 0.11
(e)
R = 0.41
(f)
R = 0.80
R = 0.71
(b)
R = 0.72
(c)
R = 0.71
Fig. 12. The linear correlation between gaseous pollutants (SO2,NOx and CO) and PM2.5, with correlation coefficients (R) shownin the figure. Figure(a–c)denote PE1 and(d–f) denote PE3. Theblack dots denote the hourly data and the square symbols denote thedaily average data, all units are in µg m−3.
from biomass burning. Correlation between CO columns andAOD from many varied forest fire episodes overall the dif-ferent time periods were found (Paton-Walsh et al., 2004).Sun et al. (2009) had observed that CO highly correlatedwith OA (organic aerosol) (R : 0.7−0.9) in several OA dom-inated events by using an Aerodyne High Resolution Time-of-Flight Aerosol Mass Spectrometer (HR-ToF-AMS). Al-though there were no OC data of high time resolution avail-able due to restrictions of instruments in this study, the exclu-sive correlation between CO and PM2.5 during the biomassburning events mirrored the dominance of organic aerosol inthe particle formation. CO could be regarded as the proxy oforganic aerosol when biomass burning dominated. As visu-alized in Fig. 12c–f, it was found that the CO/PM2.5 slopewas higher in PE1 than in PE3. The CO level was simi-lar between PE1 and PE3 as shown in Fig. 10. Thus, thelower CO/PM2.5 slope in PE3 was due to higher PM2.5 con-centrations as discussed in Sect. 3.1. This probably meantthat biomass burning could produce higher aerosol mass than
the industrial/traffic emission as most of the biomass burningevents were incomplete combustion, which could not effec-tively oxidize the hydrocarbon to CO2 or CO.
4 Conclusions
An intensive aerosol and trace gases campaign was carriedout over the Yangtze River Delta region in Eastern Chinafrom April to June, 2009. Three pollution episodes wereidentified based on the atmospheric visibility, aerosol massconcentrations in different sizes, mass fraction of fine par-ticles, and modeled air trajectories. Distinct characteristicswere observed among the three pollution episodes by usinga synergy of ground-based measurement, satellite and lidarobservation. Three typical types of air pollution causing thehaze weather in Eastern China were identified, i.e. secondaryinorganic pollution, dust invasion and biomass burning.
1. During the secondary inorganic pollution episode, highAOD (>1.2) and relatively high Angstrom exponent(0.8–1.2) over the Eastern China region was detectedby MODIS. The major components of PM2.5 were sul-fate, nitrate and ammonium. The sum of these threespecies reached 48.86± 5.01 µg m−3 and accounted fora dominant mass fraction of 77 % in PM2.5. High con-centrations of SO2, NOx and CO and good correlationsamong these trace gases and PM2.5 indicated that an-thropogenic sources (coal burning, vehicle emission,etc.) were the major causes.
2. During the dust pollution episode, high AOD (>1.2)and low Angstrom exponent (0.5–0.6) were observedin Northern and Eastern China, indicating the exis-tence of considerable coarse particles. Mineral aerosolaccounted for 76.8 % of the total suspended particles(TSP) and the Ca/Al elemental ratio dropped to a rela-tively low value of 0.75, which indicated its dust sourceregion in Gobi Desert.
3. The biomass burning pollution episode was character-ized of high column concentrations of CO, HCHO andAOD, which were observed over the regions with densefire spots. Particulate components such as K+, OC andEC were greatly enhanced as well as the ratio of OC/EC.The organic aerosol was estimated to account for over50 % to PM10. The significant correlation between COand PM2.5, in addition to the weak correlations betweenSO2, NOx and PM2.5, corroborated that organic aerosolwas the major species during biomass burning.
4. The enrichment factor analysis demonstrated that mostelements were the least enriched during dust pollution,while the most enriched during the secondary inorganicpollution. One exception is arsenic (As), of which theconcentration and enrichment degree were highest dur-ing the biomass burning period. We speculated that the
www.atmos-chem-phys.net/12/105/2012/ Atmos. Chem. Phys., 12, 105–124, 2012

120 K. Huang et al.: Typical types and formation mechanisms of haze in Shanghai
biomass burning emission could be a more significantsource of As other than its usual source of coal burn-ing. This finding highlights the potential threat of ar-senic polluted water and soil to the contamination ofcrops in East Asia.
5. Lidar measurement revealed that aerosol were mainlycomposed of spheric particles (deplorization ratioδ532 <5 %) during the secondary inorganic pollutionand biomass burning episodes, while the averageδ532value of the boundary layer was 0.122± 0.023 duringthe dust episode, indicating existence of considerablecoarse particles. The profile of backscattering coeffi-cient had a sharp decrease with altitudes in the sec-ondary inorganic and biomass pollution episodes. Dur-ing the dust episode, the dust layer contributed about51–57 % to the total aerosol extinction at the altitude of0.7–1.0 km, which compensated the decrease of sphericaerosol extinction and resulted in a different profilefrom the other two episodes.
Appendix A
In order to compare with the recorded visibility data, wecalculated the near-surface extinction coefficient caused byaerosol (σep) by averaging the lidar measured aerosol extinc-tion coefficient from the ground to an altitude of 300 m. Ab-sorption of visible light by gases was considered to be essen-tially due to NO2 and the absorption coefficient (σag) couldbe estimated using the formulaσag= 0.33× [NO2] (Grob-licki et al., 1981). Here, NO2 was in units of× 10−9 V/V.Rayleigh scattering coefficient (σsg) was assumed to be aconstant of 0.013 km−1 at sea level (Chan et al., 1999; Peun-dorf, 1957). The scattering coefficient of light due to mois-ture in the air (bsw) could be neglected when relatively hu-midity (RH) was lower than 70 % (Cass, 1979; Chan et al.,1999). In this study, the average relative humidity was about60 %. Consequently, the total light extinction by particlesand gases (σext= σep+σag+σsg) was calculated and the vis-ibility could be estimated.
Supplementary material related to thisarticle is available online at:http://www.atmos-chem-phys.net/12/105/2012/acp-12-105-2012-supplement.pdf.
Acknowledgements.Many thanks to the MODIS, OMI and AIRSdata processing team members. We thank Sugimoto Nobuo andShimizu Atsushi of National Institute for Environmental Studies,Japan, for the lidar setup and data inversion. This work wassupported by the great international collaboration project of MOST,China (2010DFA92230), National Natural Science Foundation ofChina (Grant Nos. 41128005 (fund for collaboration with oversea
scholars), 20877020, 20977017), and Shanghai environmentalprotection science developing funding (No. 2010-003, 2011-55).
Edited by: T. Wang
References
Amato, F., Pandolfi, M., Viana, M., Querol, X., Alastuey, A., andMoreno, T.: Spatial and chemical patterns of PM10 in road dustdeposited in urban environment, Atmos. Environ., 43, 1650–1659, 2009.
Andreae, M. O.: Soot Carbon and Excess Fine Potassium – Long-Range Transport of Combustion-Derived Aerosols, Science, 220,4602, 1148–1151, 1983.
Andreae, M. O. and Merlet, P.: Emission of trace gases and aerosolsfrom biomass burning, Global Biogeochem. Cy., 15, 955–966,2001.
Andreae, M. O., Schmid, O., Yang, H., Chand, D., Yu, J. Z., Zeng,L. M., and Zhang, Y. H.: Optical properties and chemical com-position of the atmospheric aerosol in urban Guangzhou, China,Atmos. Environ., 42, 6335–6350, 2008.
Arimoto, R., Duce, R. A., Savoie, D. L., Prospero, J. M., Talbot,R., Cullen, J. D., Tomza, U., Lewis, N. F., and Jay, B. J.: Re-lationships among aerosol constituents from Asia and the NorthPacific during PEM-West A, J. Geophys. Res., 101, 2011–2023,1996.
Boian, C. and Kirchhoff, V. W. J. H.: Measurements of CO in an air-craft experiment and their correlation with biomass burning andair mass origin in South America, Atmos. Environ., 38, 6337–6347, 2004.
Brammer, H. and Ravenscroft, P.: Arsenic in groundwater: A threatto sustainable agriculture in South and South-East Asia, Environ.Int., 35, 647–654, 2009.
Cai, H. and Xie, S. D.: Estimation of vehicular emission inventoriesin China from 1980 to 2005, Atmos. Environ., 41, 8963–8979,2007.
Cao, T., An, L., Wang, M., Lou, Y. X., Yu, Y. H., Wu, J. M., Zhu,Z. R., Qing, Y. K., and Glime, J.: Spatial and temporal changesof heavy metal concentrations in mosses and its indication to theenvironments in the past 40 yr in the city of Shanghai, China,Atmos. Environ., 42, 5390–5402, 2008.
Cass, G. R.: On the relationship between sulfate air quality and vis-ibility with examples in los angeles, Atmos. Environ., 13, 1069–1084, 1979.
Chakrabarty, R. K., Moosmuller, H., Garro, M. A., Arnott, W. P.,Walker, J., Susott, R. A., Babbitt, R. E., Wold, C. E., Lincoln,E. N., and Hao, W. M.: Emissions from the laboratory combus-tion of wildland fuels: Particle morphology and size, J. Geophys.Res., 111, D07204,doi:10.1029/2005JD006659, 2006.
Chan, C. K., and Yao, X.: Air pollution in mega cities in China,Atmos. Environ., 42, 1–42, 2008.
Chan, Y. C., Simpson, R. W., McTainsh, G. H., Vowles, P. D., Co-hen, D. D., and Bailey, G. M.: Source apportionment of visibilitydegradation problems in Brisbane (Australia) using the multiplelinear regression techniques, Atmos. Environ., 33, 3237–3250,1999.
Chang, D. and Song, Y.: Estimates of biomass burning emissionsin tropical Asia based on satellite-derived data, Atmos. Chem.Phys., 10, 2335–2351,doi:10.5194/acp-10-2335-2010, 2010.
Atmos. Chem. Phys., 12, 105–124, 2012 www.atmos-chem-phys.net/12/105/2012/

K. Huang et al.: Typical types and formation mechanisms of haze in Shanghai 121
Chang, D., Song, Y., and Liu, B.: Visibility trends in six megacitiesin China 1973–2007, Atmos. Res., 94, 161–167, 2009.
Che, H. Z., Shi, G. Y., Zhang, X. Y., Arimoto, R., Zhao, J. Q.,Xu, L., Wang, B., and Chen, Z. H.: Analysis of 40 yr of solarradiation data from China, 1961–2000, Geophys. Res. Lett., 32,L06803,doi:10.1029/2004GL022322, 2005.
Che, H. Z., Zhang, X. Y., Li, Y., Zhou, Z. J., and Qu, J. J.: Hori-zontal visibility trends in China 1981–2005, Geophys. Res. Lett.,34, L24706,doi:10.1029/2007GL031450, 2007.
Chen, C. H., Wang, B. Y., Fu, Q. Y., Green, C., and Streets, D. G.:Reductions in emissions of local air pollutants and co-benefits ofChinese energy policy: a Shanghai case study, Energ. Policy, 34,754–762, 2006.
Chen, J. M., Tan, M. G., Li, Y. L., Zhang, Y. M., Lu, W. W., Tong,Y. P., Zhang, G. L., and Li, Y.: A lead isotope record of shanghaiatmospheric lead emissions in total suspended particles duringthe period of phasing out of leaded gasoline, Atmos. Environ.,39, 1245–1253, 2005.
Choi, S. D. and Chang, Y. S.: Carbon monoxide monitoring inNortheast Asia using MOPITT: Effects of biomass burning andregional pollution in April 2000, Atmos. Environ., 40, 686–697,2006.
Chow, J. C. and Watson, J. G.: PM2.5 carbonate concentra-tions at regionally representative Interagency Monitoring of Pro-tected Visual Environment sites, J. Geophys. Res., 107, 8344doi:10.1029/2001JD000574, 2002.
Chu, D. A., Kaufman, Y. J., Zibordi, G., Chern, J. D., Mao, J.,Li, C. C., and Holben, B. N.: Global monitoring of air pollutionover land from the Earth Observing System-Terra Moderate Res-olution Imaging Spectroradiometer (MODIS), J. Geophys. Res.,108, 4661,doi:10.1029/2002JD003179, 2003.
Deng, C., Zhuang, G., Huang, K., Li, J., Zhang, R., Wang, Q., Liu,T., Sun, Y., Guo, Z., Fu, J. S., and Wang, Z.: Chemical character-ization of aerosols at the summit of Mountain Tai in Central EastChina, Atmos. Chem. Phys., 11, 7319–7332,doi:10.5194/acp-11-7319-2011, 2011.
Fang, M., Chan, C. K., and Yao, X. H.: Managing air quality in arapidly developing nation: China, Atmos. Environ., 43, 79–86,2009.
Feng, J. L., Hu, M., Chan, C. K., Lau, P. S., Fang, M., He, L. Y., andTang, X. Y.: A comparative study of the organic matter in PM2.5from three Chinese megacities in three different climatic zones,Atmos. Environ., 40, 3983–3994, 2006.
Feng, Y. L., Chen, Y. J., Guo, H., Zhi, G. R., Xiong, S. C., Li,J., Sheng, G. Y., and Fu, J. M.: Characteristics of organic andelemental carbon in PM2.5 samples in Shanghai, China, Atmos.Res., 92, 434–442, 2009.
Fernald, F. G.: Analysis of Atmospheric Lidar Observations – SomeComments, Appl. Opt., 23, 652–653, 1984.
Fu, Q. Y., Zhuang, G. S., Wang, J., Xu, C., Huang, K., Li, J., Hou,B., Lu, T., and Streets, D. G.: Mechanism of formation of theheaviest pollution episode ever recorded in the Yangtze RiverDelta, China, Atmos. Environ., 42, 2023–2036, 2008.
Gao, J., Wang, T., Zhou, X. H., Wu, W. S., and Wang, W. X.:Measurement of aerosol number size distributions in the YangtzeRiver delta in China: Formation and growth of particles underpolluted conditions, Atmos. Environ., 43, 829–836, 2009.
Garland, R. M., Yang, H., Schmid, O., Rose, D., Nowak, A.,Achtert, P., Wiedensohler, A., Takegawa, N., Kita, K., Miyazaki,
Y., Kondo, Y., Hu, M., Shao, M., Zeng, L. M., Zhang, Y. H.,Andreae, M. O., and Poschl, U.: Aerosol optical properties ina rural environment near the mega-city Guangzhou, China: im-plications for regional air pollution, radiative forcing and remotesensing, Atmos. Chem. Phys., 8, 5161–5186,doi:10.5194/acp-8-5161-2008, 2008.
Geng, F. H., Zhang, Q., Tie, X. X., Huang, M. Y., Ma, X. C., Deng,Z. Z., Yu, Q., Quan, J. N., and Zhao, C. S.: Aircraft measure-ments of O3, NOx, CO, VOCs, and SO2 in the Yangtze RiverDelta region, Atmos. Environ., 43, 584–593, 2009.
Giglio, L.: Characterization of the tropical diurnal fire cycle usingVIRS and MODIS observations, Remote Sens. Environ., 108,407–421, 2007.
Groblicki, P. J., Wolff, G. T., and Countess, R. J.: Visibility-Reducing Species in the Denver Brown Cloud 1, Relationshipsbetween Extinction and Chemical-Composition, Atmos. Envi-ron., 15, 2473–2484, 1981.
Hasan, H. and Dzubay, T. G.: Apportioning Light Extinction Co-efficients to Chemical-Species in Atmospheric Aerosol, Atmos.Environ., 17, 1573–1581, 1983.
He, Y., Uno, I., Wang, Z., Ohara, T., Sugirnoto, N., Shimizu, A.,Richter, A., and Burrows, J. P.: Variations of the increasingtrend of tropospheric NO2 over central east China during the pastdecade, Atmos. Environ., 41, 4865–4876, 2007.
Huang, K., Zhuang, G. S., Xu, C., Wang, Y., and Tang, A. H.: Thechemistry of the severe acidic precipitation in Shanghai, China,Atmos. Res., 89, 149–160, 2008.
Huang, K., Zhuang, G. S., Li, J. A., Wang, Q. Z., Sun, Y. L., Lin,Y. F., and Fu, J. S.: Mixing of Asian dust with pollution aerosoland the transformation of aerosol components during the duststorm over China in spring 2007, J. Geophys. Res., 115, D00K13,doi:10.1029/2009JD013145, 2010.
Kaiser, D. P. and Qian, Y.: Decreasing trends in sun-shine duration over China for 1954–1998: Indication ofincreased haze pollution?, Geophys. Res. Lett., 29, 2042,doi:10.1029/2002GL016057, 2002.
Kan, H. D. and Chen, B. H.: Particulate air pollution in urban ar-eas of Shanghai, China: health-based economic assessment, Sci.Total Environ., 322, 71–79, 2004.
Kan, H. D., London, S. J., Chen, G. H., Zhang, Y. H., Song, G. X.,Zhao, N. Q., Jiang, L. L., and Chen, B. H.: Differentiating theeffects of fine and coarse particles on daily mortality in Shanghai,China, Environ. Int., 33, 376–384, 2007.
Kato, S., Akimoto, H., Rockmann, T., Braunlich, M., and Bren-ninkmeijer, C. A. M.: Stable isotopic compositions of carbonmonoxide from biomass burning experiments, Atmos. Environ.,33, 4357–4362, 1999.
Kato, S., Pochanart, P., Hlrokawa, J., Kajii, Y., Akimoto, H., Ozaki,Y., Obi, K., Katsuno, T., Streets, D. G., and Minko, N. P.: Theinfluence of Siberian forest fires on carbon monoxide concentra-tions at Happo, Japan, Atmos. Environ., 36, 385–390, 2002.
Kaufman, Y. J., Wald, A. E., Remer, L. A., Gao, B. C., Li, R. R.,and Flynn, L.: The MODIS 2.1 µm channel – Correlation withvisible reflectance for use in remote sensing of aerosol, IEEE T.Geosci. Remote, 35, 1286–1298, 1997.
Kim, S. W., Yoon, S. C., Kim, J., Kang, J. Y., and Sugimoto, N.:Asian dust event observed in Seoul, Korea, during 29–31 May2008: Analysis of transport and vertical distribution of dust par-ticles from lidar and surface measurements, Sci. Total Environ.,
www.atmos-chem-phys.net/12/105/2012/ Atmos. Chem. Phys., 12, 105–124, 2012

122 K. Huang et al.: Typical types and formation mechanisms of haze in Shanghai
408, 1707–1718, 2010.Kurosu, T. P., Chance, K., and Sioris, C. E.: Preliminary Results for
HCHO and BrO from the EOS-Aura Ozone Monitoring Instru-ment, Proc. of SPIE in: Passive Optical Remote Sensing of theAtmosphere and Clouds IV, edited by: Tsay, S. C., Yokota, T.,and Ahn, M.-H., 5652, 2004.
Lee, S., Ghim, Y. S., Kim, S. W., and Yoon, S. C.: Seasonal char-acteristics of chemically apportioned aerosol optical properties atSeoul and Gosan, Korea, Atmos. Environ., 43, 1320–1328, 2009.
Levelt, P. F., Van den Oord, G. H. J., Dobber, M. R., Malkki, A.,Visser, H., de Vries, J., Stammes, P., Lundell, J. O. V., and Saari,H.: The Ozone Monitoring Instrument, IEEE T. Geosci. Remote,44, 1093–1101, 2006.
Levy, R. C., Remer, L. A., Kleidman, R. G., Mattoo, S., Ichoku,C., Kahn, R., and Eck, T. F.: Global evaluation of the Collection5 MODIS dark-target aerosol products over land, Atmos. Chem.Phys., 10, 10399–10420,doi:10.5194/acp-10-10399-2010, 2010.
Li, C., Zhang, Q., Krotkov, N. A., Streets, D. G., He, K. B.,Tsay, S. C., and Gleason, J. F.: Recent large reduction in sulfurdioxide emissions from Chinese power plants observed by theOzone Monitoring Instrument, Geophys. Res. Lett., 37, L08807,doi:10.1029/2010GL042594, 2010.
Li, J., Posfai, M., Hobbs, P. V., and Buseck, P. R.: Individual aerosolparticles from biomass burning in southern Africa – Part 2: Com-positions and aging of inorganic particles, J. Geophys. Res., 108,8484doi:10.1029/2002JD002310, 2003.
Li, P. F., Li, X., Yang, C. Y., Wang, X. J., Chen, J. M., and Collett,J. L.: Fog water chemistry in Shanghai, Atmos. Environ., 45,4034–4041, 2011.
Li, X. G., Wang, S. X., Duan, L., Hao, J., Li, C., Chen, Y. S., andYang, L.: Particulate and trace gas emissions from open burningof wheat straw and corn stover in China, Environ. Sci. Technol.,41, 6052–6058, 2007.
Li, Z. Q., Chen, H., Cribb, M., Dickerson, R., Holben, B., Li, C.,Lu, D., Luo, Y., Maring, H., Shi, G., Tsay, S. C., Wang, P., Wang,Y., Xia, X., Zheng, Y., Yuan, T., and Zhao, F.: Preface to specialsection on East Asian studies of tropospheric aerosols: An inter-national regional experiment (EAST-AIRE), J. Geophys. Res.,112, D22S00,doi:10.1029/2007JD008853, 2007.
Liu, F., Wang, X. K., and Zhu, Y. G.: Assessing current and fu-ture ozone-induced yield reductions for rice and winter wheat inChongqing and the Yangtze River Delta of China, Environ. Pol-lut., 157, 707–709, 2009.
Liu, Z., Liu, D., Huang, J., Vaughan, M., Uno, I., Sugimoto, N., Kit-taka, C., Trepte, C., Wang, Z., Hostetler, C., and Winker, D.: Air-borne dust distributions over the Tibetan Plateau and surround-ing areas derived from the first year of CALIPSO lidar obser-vations, Atmos. Chem. Phys., 8, 5045–5060,doi:10.5194/acp-8-5045-2008, 2008.
Liu, Z. Y., Sugimoto, N., and Murayama, T.: Extinction-to-backscatter ratio of Asian dust observed with high-spectral-resolution lidar and Raman lidar, Appl. Opt., 41, 2760–2767,2002.
Lu, Z., Streets, D. G., Zhang, Q., Wang, S., Carmichael, G. R.,Cheng, Y. F., Wei, C., Chin, M., Diehl, T., and Tan, Q.: Sulfurdioxide emissions in China and sulfur trends in East Asia since2000, Atmos. Chem. Phys., 10, 6311–6331,doi:10.5194/acp-10-6311-2010, 2010.
Malm, W. C., Sisler, J. F., Huffman, D., Eldred, R. A., and Cahill,
T. A.: Spatial and Seasonal Trends in Particle Concentrationand Optical Extinction in the United-States, J. Geophys. Res.-Atmos., 99, 1347–1370, 1994.
Mandal, B. K. and Suzuki, K. T.: Arsenic round the world: a review,Talanta, 58, 201–235, 2002.
Mari, C. H., Cailley, G., Corre, L., Saunois, M., Attie, J.L., Thouret, V., and Stohl, A.: Tracing biomass burningplumes from the Southern Hemisphere during the AMMA 2006wet season experiment, Atmos. Chem. Phys., 8, 3951–3961,doi:10.5194/acp-8-3951-2008, 2008.
McMillan, W. W., Barnet, C., Strow, L., Chahine, M. T., McCourt,M. L., Warner, J. X., Novelli, P. C., Korontzi, S., Maddy, E.S., and Datta, S.: Daily global maps of carbon monoxide fromNASA’s Atmospheric Infrared Sounder, Geophys. Res. Lett., 32,L11801,doi:10.1029/2004GL021821, 2005.
Mcneil, W. R. and Carswell, A. I.: Lidar Polarization Studies ofTroposphere, Appl. Opt., 14, 2158–2168, 1975.
Noh, Y. M., Kim, Y. J., Choi, B. C., and Murayama, T.: Aerosol li-dar ratio characteristics measured by a multi-wavelength Ramanlidar system at Anmyeon Island, Korea, Atmos. Res., 86, 76–87,2007.
Nriagu, J. O.: A Global Assessment of Natural Sources of Atmo-spheric Trace-Metals, Nature, 338, 6210, 47–49, 1989.
Ouimette, J. R. and Flagan, R. C.: The Extinction Coefficientof Multicomponent Aerosols, Atmos. Environ., 16, 2405–2419,1982.
Pan, L. A., Che, H. Z., Geng, F. H., Xia, X. G., Wang, Y. Q., Zhu, C.Z., Chen, M., Gao, W., and Guo, J. P.: Aerosol optical propertiesbased on ground measurements over the Chinese Yangtze DeltaRegion, Atmos. Environ., 44, 2587–2596, 2010.
Parrish, D. D. and Zhu, T.: Clean Air for Megacities, Science, 326,674–675, 5953,doi:10.1126/science.1176064, 2009.
Pathak, R. K., Wu, W. S., and Wang, T.: Summertime PM2.5 ionicspecies in four major cities of China: nitrate formation in anammonia-deficient atmosphere, Atmos. Chem. Phys., 9, 1711–1722,doi:10.5194/acp-9-1711-2009, 2009.
Paton-Walsh, C., Jones, N., Wilson, S., Meier, A., Deutscher, N.,Griffith, D., Mitchell, R., and Campbell, S.: Trace gas emissionsfrom biomass burning inferred from aerosol optical depth, Geo-phys. Res. Lett., 31, L05116,doi:10.1029/2003GL018973, 2004.
Peundorf, R.: Tables of the refractive index for standard and theRayleigh scattering coefficient for the spectral region between0.2 and 20.0 microns and their application to atmospheric optics,J. Opt. Soc. Am., 47, 176–182, 1957.
Shi, G. T., Chen, Z. L., Xu, S. Y., Zhang, J., Wang, L., Bi, C. J.,and Teng, J. Y.: Potentially toxic metal contamination of urbansoils and roadside dust in Shanghai, China, Environ. Pollut., 156,251–260, 2008.
Shimizu, A., Sugimoto, N., Matsui, I., Arao, K., Uno, I., Mu-rayama, T., Kagawa, N., Aoki, K., Uchiyama, A., and Yamazaki,A.: Continuous observations of Asian dust and other aerosols bypolarization lidars in China and Japan during ACE-Asia, J. Geo-phys. Res., 109, D19S17,doi:10.1029/2002JD003253, 2004.
SMSB: Shanghai Municipal Statistics Bureau, Shanghai sixth na-tional census in 2010 Communique on Major Data, 2011, (inChinese).
Sugimoto, N., Matsui, I., Shimizu, A., Uno, I., Asai, K., Endoh, T.,and Nakajima, T.: Observation of dust and anthropogenic aerosolplumes in the Northwest Pacific with a two-wavelength polariza-
Atmos. Chem. Phys., 12, 105–124, 2012 www.atmos-chem-phys.net/12/105/2012/

K. Huang et al.: Typical types and formation mechanisms of haze in Shanghai 123
tion lidar on board the research vessel Mirai, Geophys. Res. Lett.,29, 1901,doi:10.1029/2002GL015112, 2002.
Sun, Y., Zhang, Q., Macdonald, A. M., Hayden, K., Li, S. M., Lig-gio, J., Liu, P. S. K., Anlauf, K. G., Leaitch, W. R., Steffen, A.,Cubison, M., Worsnop, D. R., van Donkelaar, A., and Martin,R. V.: Size-resolved aerosol chemistry on Whistler Mountain,Canada with a high-resolution aerosol mass spectrometer duringINTEX-B, Atmos. Chem. Phys., 9, 3095–3111,doi:10.5194/acp-9-3095-2009, 2009.
Sun, Y. L., Zhuang, G. S., Ying, W., Han, L. H., Guo, J. H., Mo, D.,Zhang, W. J., Wang, Z. F., and Hao, Z. P.: The air-borne partic-ulate pollution in Beijing – concentration, composition, distribu-tion and sources, Atmos. Environ., 38, 5991–6004, 2004.
Tan, M. G., Zhang, G. L., Li, X. L., Zhang, Y. X., Yue, W. S., Chen,J. M., Wang, Y. S., Li, A. G., Li, Y., Zhang, Y. M., and Shan,Z. C.: Comprehensive study of lead pollution in Shanghai bymultiple techniques, Anal. Chem., 78, 8044–8050, 2006.
Tie, X. X., Geng, F. H., Peng, L., Gao, W., and Zhao, C. S.: Mea-surement and modeling of O3 variability in Shanghai, China:Application of the WRF-Chem model, Atmos. Environ., 43,4289–4302, 2009.
Turpin, B. J. and Lim, H. J.: Species contributions to PM2.5 massconcentrations: Revisiting common assumptions for estimatingorganic mass, Aerosol Sci. Technol., 35, 602–610, 2001.
US Environmental Protection Agency (EPA): Quality assurancehandbook for air pollution measurement systems, EPA454/R98-004, Research Triangle Park, NC, US, 1998.
van der A, R. J., Peters, D. H. M. U., Eskes, H., Boersma, K. F., VanRoozendael, M., De Smedt, I., and Kelder, H. M.: Detection ofthe trend and seasonal variation in tropospheric NO2 over China,J. Geophys. Res., 111, D12317,doi:10.1029/2005JD006594,2006.
Xia, X. G., Li, Z. Q., Holben, B., Wang, P., Eck, T., Chen, H. B.,Cribb, M., and Zhao, Y. X.: Aerosol optical properties and ra-diative effects in the Yangtze Delta region of China, J. Geophys.Res., 112, D22S12,doi:10.1029/2007JD008859, 2007.
Xu, J., Bergin, M. H., Yu, X., Liu, G., Zhao, J., Carrico, C. M., andBaumann, K.: Measurement of aerosol chemical, physical andradiative properties in the Yangtze delta region of China, Atmos.Environ., 36, 161–173, 2002.
Yamaji, K., Li, J., Uno, I., Kanaya, Y., Irie, H., Takigawa, M.,Komazaki, Y., Pochanart, P., Liu, Y., Tanimoto, H., Ohara, T.,Yan, X., Wang, Z., and Akimoto, H.: Impact of open crop resid-ual burning on air quality over Central Eastern China during theMount Tai Experiment 2006 (MTX2006), Atmos. Chem. Phys.,10, 7353–7368,doi:10.5194/acp-10-7353-2010, 2010.
Yan, X. Y., Ohara, T., and Akimoto, H.: Bottom-up estimate ofbiomass burning in mainland China, Atmos. Environ., 40, 5262–5273, 2006.
Yang, F., He, K., Ye, B., Chen, X., Cha, L., Cadle, S. H., Chan,T., and Mulawa, P. A.: One-year record of organic and elementalcarbon in fine particles in downtown Beijing and Shanghai, At-mos. Chem. Phys., 5, 1449–1457,doi:10.5194/acp-5-1449-2005,2005a.
Yang, F. M., Ye, B. M., He, K. B., Ma, Y. L., Cadle, S. H., Chan,T., and Mulawa, P. A.: Characterization of atmospheric mineralcomponents of PM2.5 in Beijing and Shanghai, China, Sci. TotalEnviron., 343, 221–230, 2005b.
Yao, X. H., Chan, C. K., Fang, M., Cadle, S., Chan, T., Mulawa, P.,
He, K. B., and Ye, B. M.: The water-soluble ionic compositionof PM2.5 in Shanghai and Beijing, China, Atmos. Environ., 36,4223–4234, 2002.
Ye, B. M., Ji, X. L., Yang, H. Z., Yao, X. H., Chan, C. K., Cadle,S. H., Chan, T., and Mulawa, P. A.: Concentration and chemi-cal composition of PM2.5 in Shanghai for a 1 yr period, Atmos.Environ., 37, 499–510, 2003.
Ye, S. H., Zhou, W., Song, J., Peng, B. C., Yuan, D., Lu, Y. M.,and Qi, P. P.: Toxicity and health effects of vehicle emissions inShanghai, Atmos. Environ., 34, 419–429, 2000.
Yuan, H., Wang, Y., and Zhuang, G. S.: Simultaneous determinationof organic acids, methanesulfonic acid and inorganic anions inaerosol and precipitation samples by ion chromatography, Jour-nal of Instrumental Analysis, 22, 11–44, 2003.
Wang, H. X., Tang, X. Y., Wang, M. L., Yan, P., Wang, T., Shao,K. S., Zeng, L. M., Du, H. F., and Chen, L. M.: Characteristicsof observed trace gaseous pollutants in the Yangtze Delta, Sci.China. Ser. D., 46, 397–404, 2003.
Wang, K. C., Dickinson, R. E., and Liang, S. L.: Clear Sky Vis-ibility Has Decreased over Land Globally from 1973 to 2007,Science, 323, 1468–1470, 2009.
Wang, T., Cheung, T. F., Li, Y. S., Yu, X. M., and Blake, D. R.:Emission characteristics of CO, NOx, SO2 and indications ofbiomass burning observed at a rural site in Eastern China, J. Geo-phys. Res., 107, 4157,doi:10.1029/2001JD000724, 2002.
Wang, T., Nie, W., Gao, J., Xue, L. K., Gao, X. M., Wang, X.F., Qiu, J., Poon, C. N., Meinardi, S., Blake, D., Wang, S.L., Ding, A. J., Chai, F. H., Zhang, Q. Z., and Wang, W. X.:Air quality during the 2008 Beijing Olympics: secondary pollu-tants and regional impact, Atmos. Chem. Phys., 10, 7603–7615,doi:10.5194/acp-10-7603-2010, 2010.
Wang, Y., Zhuang, G. S., Tang, A. H., Zhang, W. J., Sun, Y. L.,Wang, Z. F., and An, Z. S.: The evolution of chemical compo-nents of aerosols at five monitoring sites of China during duststorms, Atmos. Environ., 41, 1091–1106, 2007.
Wang, Y., Zhuang, G. S., Zhang, X. Y., Huang, K., Xu, C., Tang, A.H., Chen, J. M., and An, Z. S.: The ion chemistry, seasonal cy-cle, and sources of PM2.5 and TSP aerosol in Shanghai, Atmos.Environ., 40, 2935–2952, 2006.
Zhang, H. F., Ye, X. N., Cheng, T. T., Chen, J. M., Yang, X., Wang,L., and Zhang, R. Y.: A laboratory study of agricultural cropresidue combustion in China: Emission factors and emission in-ventory, Atmos. Environ., 42, 8432–8441, 2008.
Zhang, Q., Streets, D. G., Carmichael, G. R., He, K. B., Huo, H.,Kannari, A., Klimont, Z., Park, I. S., Reddy, S., Fu, J. S., Chen,D., Duan, L., Lei, Y., Wang, L. T., and Yao, Z. L.: Asian emis-sions in 2006 for the NASA INTEX-B mission, Atmos. Chem.Phys., 9, 5131–5153,doi:10.5194/acp-9-5131-2009, 2009.
Zhang, W. J., Zhuang, G. S., Huang, K., Li, J. A., Zhang, R., Wang,Q. Z., Sun, Y. L., Fu, J. S., Chen, Y., Xu, D. Q., and Wang,W.: Mixing and transformation of Asian dust with pollution inthe two dust storms over the northern China in 2006, Atmos.Environ., 44, 3394–3403, 2010.
Zhang, X. Y., Zhuang, G. Y., Zhu, G. H., Zhang, D., An, Z. S.,Chen, T., and Huang, X. P.: Element tracers for Chinese sourcedust, Sci. China Ser. D, 39, 512–521, 1996.
Zhang, X. Y., Gong, S. L., Shen, Z. X., Mei, F. M., Xi, X. X., Liu,L. C., Zhou, Z. J., Wang, D., Wang, Y. Q., and Cheng, Y.: Char-acterization of soil dust aerosol in China and its transport and
www.atmos-chem-phys.net/12/105/2012/ Atmos. Chem. Phys., 12, 105–124, 2012

124 K. Huang et al.: Typical types and formation mechanisms of haze in Shanghai
distribution during 2001 ACE-Asia: 1. Network observations, J.Geophys. Res.-Atmos., 108, 4261,doi:10.1029/2002JD002632,2003.
Zhang, X. Y., Zhang, P., Zhang, Y., Li, X. J., and Qiu, H.: The trend,seasonal cycle, and sources of tropospheric NO2 over China dur-ing 1997–2006 based on satellite measurement, Sci. China. Ser.D., 50, 1877–1884, 2007.
Zhang, X. Y., Wang, Y. Q., Zhang, X. C., Guo, W., and Gong,S. L.: Carbonaceous aerosol composition over various re-gions of China during 2006, J. Geophys. Res., 113, D14111,doi:10.1029/2007JD009525, 2008.
Zhang, Y. H., Hu, M., Zhong, L. J., Wiedensohler, A., Liu, S.C., Andreae, M. O., Wang, W., and Fan, S. J.: Regional Inte-grated Experiments on Air Quality over Pearl River Delta 2004(PRIDE-PRD2004): Overview, Atmos. Environ., 42, 6157–6173, 2008.
Zhang, Y. P., Wang, X. F., Chen, H., Yang, X., Chen, J. M., andAllen, J. O.: Source apportionment of lead-containing aerosolparticles in Shanghai using single particle mass spectrometry,Chemosphere, 74, 501–507, 2009.
Zhao, X. S., Wan, Z., Zhu, H. G., and Chen, R. P.: The carcino-genic potential of extractable organic matter from urban airborneparticles in Shanghai, China, Mutat. Res.-Gen. Tox. En., 540,107–117, 2003.
Zhou, X. H., Cao, J., Wang, T., Wu, W. S., and Wang, W. X.: Mea-surement of black carbon aerosols near two Chinese megacitiesand the implications for improving emission inventories, Atmos.Environ., 43, 3918–3924, 2009.
Zhou, Y., Fu, J. S., Zhuang, G. S., and Levy, J. I.: Risk-Based Prior-itization among Air Pollution Control Strategies in the YangtzeRiver Delta, China, Environ. Health Perspect., 118, 1204–1210,2010.
Zhuang, G. S., Guo, J. H., Yuan, H., and Zhao, C. Y.: The composi-tions, sources, and size distribution of the dust storm from Chinain spring of 2000 and its impact on the global environment, Chi-nese Sci. Bull., 46, 89–901, 2001.
Atmos. Chem. Phys., 12, 105–124, 2012 www.atmos-chem-phys.net/12/105/2012/