Embed Size (px)
Citation preview


Types of Sensory Tests

Types of Sensory Tests Discriminative tests Affective Tests (Simple Like-Dislike –
Consumer panels) Descriptive tests (Involved –
qualitative/quantitative –recognition, discrimination, intensity)

Types of Sensory Tests Discriminative tests (are products
different?) Three levels of questioning Does a difference exist? How would you describe the
difference? How large is the difference?

Discrimination Tests-Variations & Normal Distributions
In looking at different tests available we are seeking stimulus differences:
Two stimulus conditions – rated as different? Where stimulus condition is a single odorant,
tastant chemical or a food or beer. Apparent changes in sensory magnitude or
quality. Real? What is the allowed amount of variation?

Perception Variability
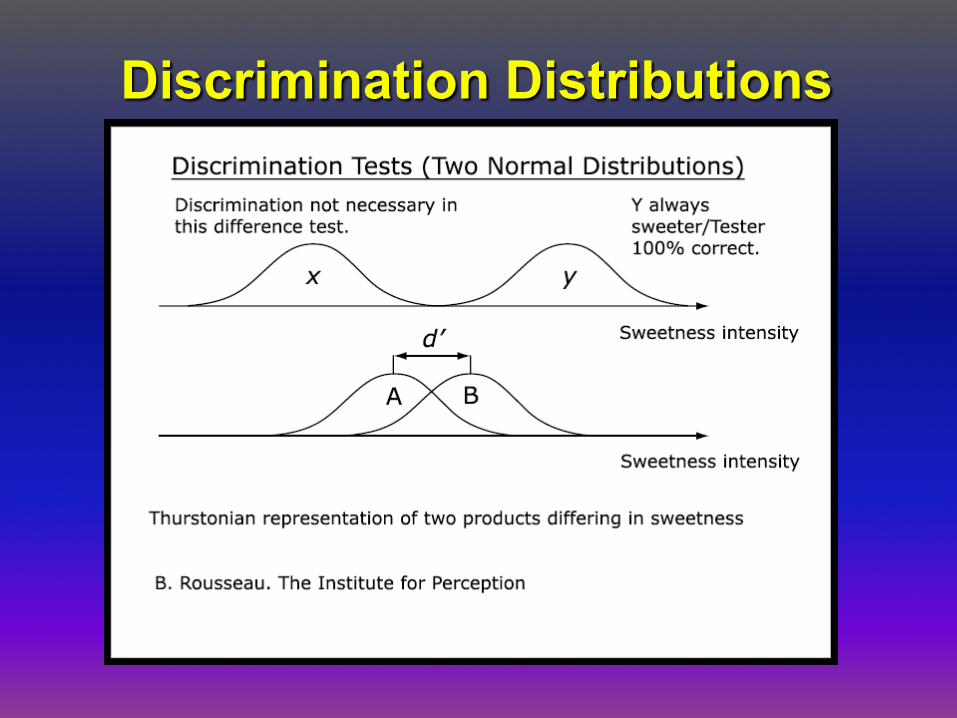
Discrimination Distributions

Types of Sensory Tests
Discriminative Tests: Many types – compare two to five
products at a time: Paired comparison A - Not A Difference from a control Duo-trio Triangle Two out of five Ranking test

Directional difference tests Directional difference tests (often paired
comparisons) are tests in which samples are compared with regard to the intensity of a single (specified in the instructions) attribute.
The chance probability represents the probability of getting the answer right if the subject cannot discriminate between the products.
Regarded by some as best suited to textural and visual investigations.
Statistical power very good.

Directional difference tests

Non-directional difference tests
Non-directional difference tests are the most commonly used methods in sensory discrimination testing.
Two examples will be considered (in further detail) by us today.

Non-directional difference tests

Types of Sensory Tests
Discriminative Tests: Simple to perform Training simple/brief instructions
needed. Statistics straightforward/tables
available Minimum number panelists

Simplest – Paired Comparison Paired Comparison (Difference Test) A pair of samples presented to assessors (one
sample may be a control). Taste order should be specified and test designed to
ensure both possible orders are tasted an equal number of times.
Panel size minimum of 20 members. Significance looked up by a table of one-tailed
paired difference tests. [Same Table used for Duo Trio.] See ASBC Sensory -6.

Duo-Trio Tests Duo-Trio (Difference Test) Measure whether any unspecified differences exist
between samples One sample A as reference, other a pair of coded
samples (X and Y) Which of the pair matches the first (i.e. which is
identical to the ref)? Statistical chance of obtaining the correct answer
by guessing is the same as that for the paired comparison (difference) test. Same Table. [See ASBC Sensory-8]

Duo Trio Ballot

Difference/Duo-Trio Taste Test Statistical Chart


Triangle Tests - I Triangle Test (Forced Choice Difference Test) Test used to determine whether an unspecified
difference exists between two treatments Useful when:
reformulating brands integrating supply changes retesting of established panel thresholds
Assessor presented with 3 samples, advised that one is different from the other two and asked to identify which is the different or odd sample

Triangle Tests - II Tasting order is specified Two possible presentations, 2 X’s and one Y or 2 Y’s
and one X Six possible orders:
YXX XYY XYX YXY XXY YYX
Sequences should be used an equal number of times. The number of assessors should be divisible by 6 for at least 3 receptions making the minimum number of panelist 18

Triangle Tests - III Panelists are obliged to identify the odd sample and
must guess if they perceive no evident difference If 18 panelists are not available, having 9 panelists
taste two different sequences is an option to consider with a bit of trepidation
Count the # of correct responses and consult appropriate standard table

Triangle Tests - IV The 1:3 possibility of correctly selecting the odd
sample by guessing is designed into the tables The math behind tables is a bit complex (binomial
distribution) but well documented For doing simple product alterations or assessing a
sensory panels’ established thresholds the tables are perfect
Major product changes based on a forced choice testing warrant a better understanding of the details of the calculations

Forced Choice Discrimination Testing – Triangle Pour Layout
Y
Y
X
Configuration
YYX
Dominate Type
Y
Odd Location
3
Tray ID
673

Forced Choice Discrimination Testing – Triangle Panelist’s Ballot
Tray ID 673

Triangle Taste Statistical Chart n 95% 90% 6 5 5 7 5 5 8 6 5 9 6 6 10 7 6 11 7 7 12 8 7 13 8 8 14 9 8 15 9 8 16 9 9 17 10 9 18 10 10 19 11 10 20 11 10 21 12 11 22 12 11 23 12 12 24 13 12 25 13 12 30 15 14 60 27 26 90 38 37 120 50 48
http://beersensoryscience.wordpress.com/2011/05/02/overall-difference-tests/

Example Results of a Triangle Test
A - Control
B - 200 ppm Lactic acid (group threshold)
Results: 9 correct out of 17 panelists
Is there a Significant Difference with a 95% confidence level? [Check your tables].

Duo-Trio vs Triangular?
For the Duo-Trio need 7 as the minimum number of panelists.
For the Triangular need 6 (requires 5 correct to say “yes there is a difference” at 95% confidence level). If one out of five “rejects” go to a 9 or a 15 panelist group.

Descriptive Taste Tests - Statistics
Collect and tabulate descriptors Histogram or Spider Plots useful for comparing
beverage sample descriptors Statistical analysis can become complex in
comparing which descriptor(s) might be significantly different between beverage samples

Descriptive Taste Tests: A – not A
Homework exercise: Provided, an exercise for you to work on at your
leisure Worksheet adapted from: Sensory Evaluation, A
practical handbook, Kemp, Hollowood and Hort, 2009

Gary Spedding and Tony Aiken for the
American Brewers Guild Brewing School - 2014