Embed Size (px)
Citation preview
Types of Relationships
• Social scientists are interested in discovering functional relationships between variables.
• In particular, researchers look for:– correlations (association,
covariation) among vaariables– differences between groups or
conditions
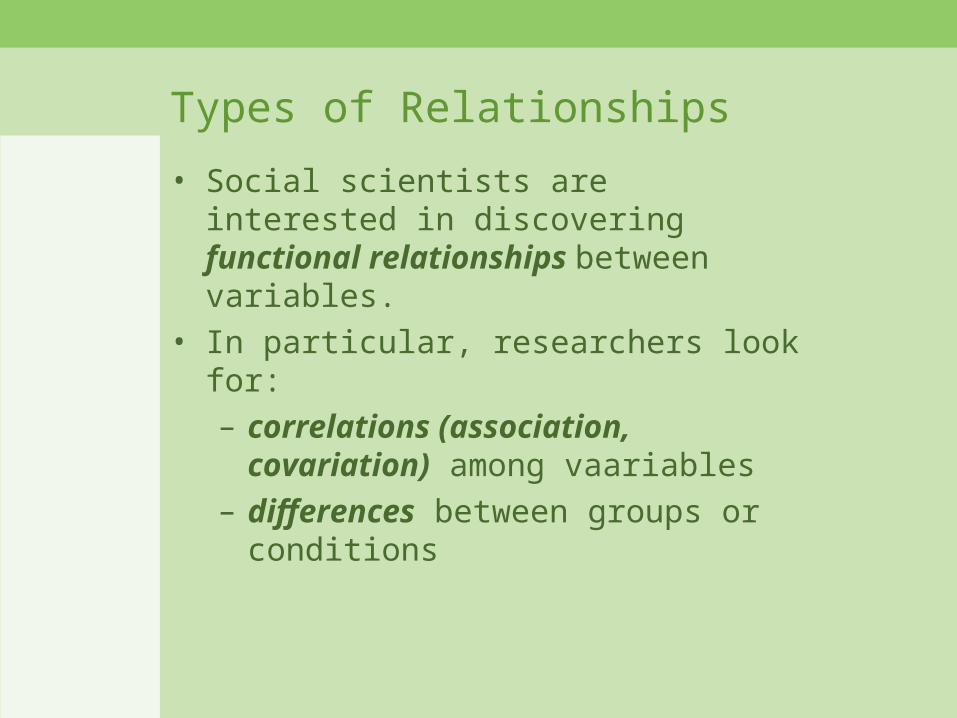
The nature of causation
• Cause-effect relationships--causation is always inferred, never directly observed
• “functional” relationships– one thing correlates with, or is associated with
another (correlation)– one thing predicts or explains the amount of
variance in another (analysis of variance)– one thing has a direct effect on another (path
analysis, multiple regression)
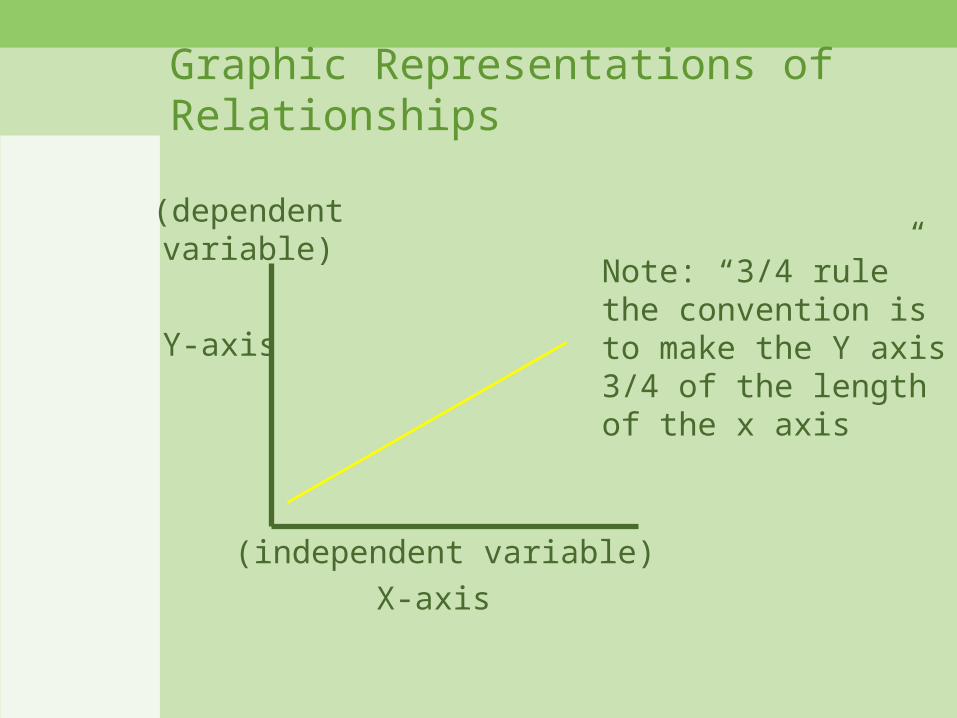
Graphic Representations of Relationships
X-axis
Y-axis
(independent variable)
(dependentvariable)
Note: “3/4 rule”the convention is to make the Y axis3/4 of the lengthof the x axis
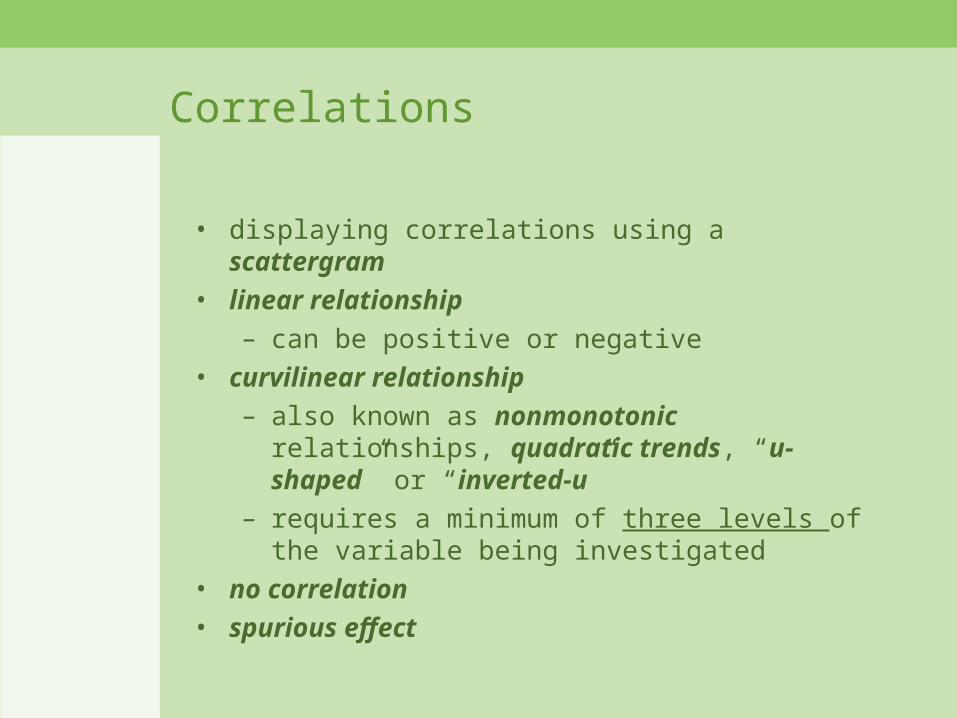
Correlations
• displaying correlations using a scattergram• linear relationship
– can be positive or negative• curvilinear relationship
– also known as nonmonotonic relationships, quadratic trends, “u-shaped” or “inverted-u”
– requires a minimum of three levels of the variable being investigated
• no correlation• spurious effect
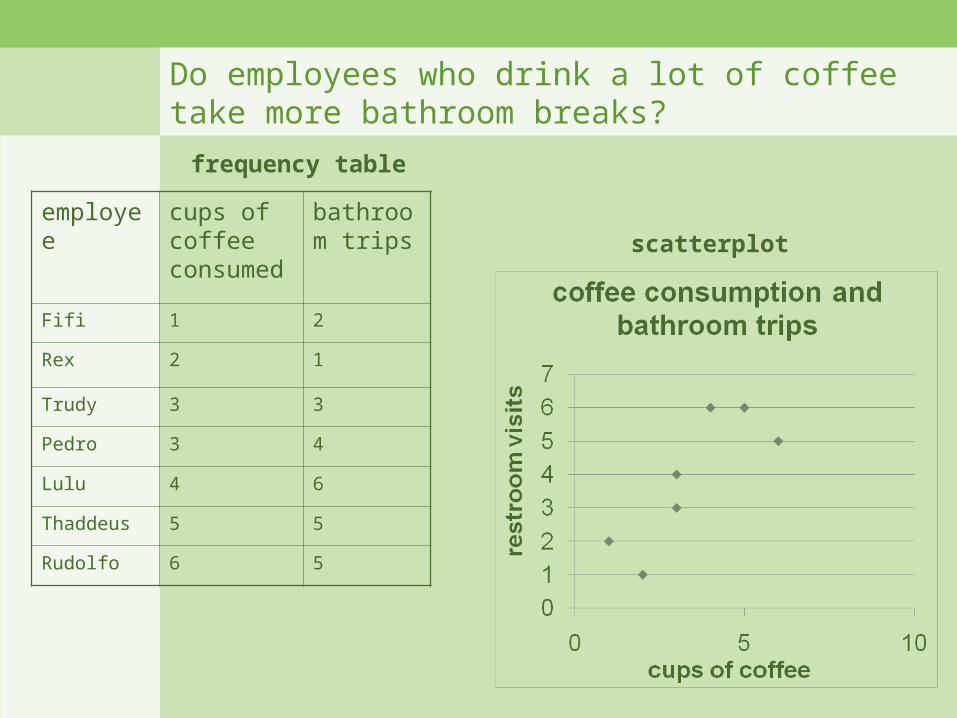
Do employees who drink a lot of coffee take more bathroom breaks?
employee cups of coffee consumed
bathroom trips
Fifi 1 2
Rex 2 1
Trudy 3 3
Pedro 3 4
Lulu 4 6
Thaddeus 5 5
Rudolfo 6 5
frequency table
scatterplot
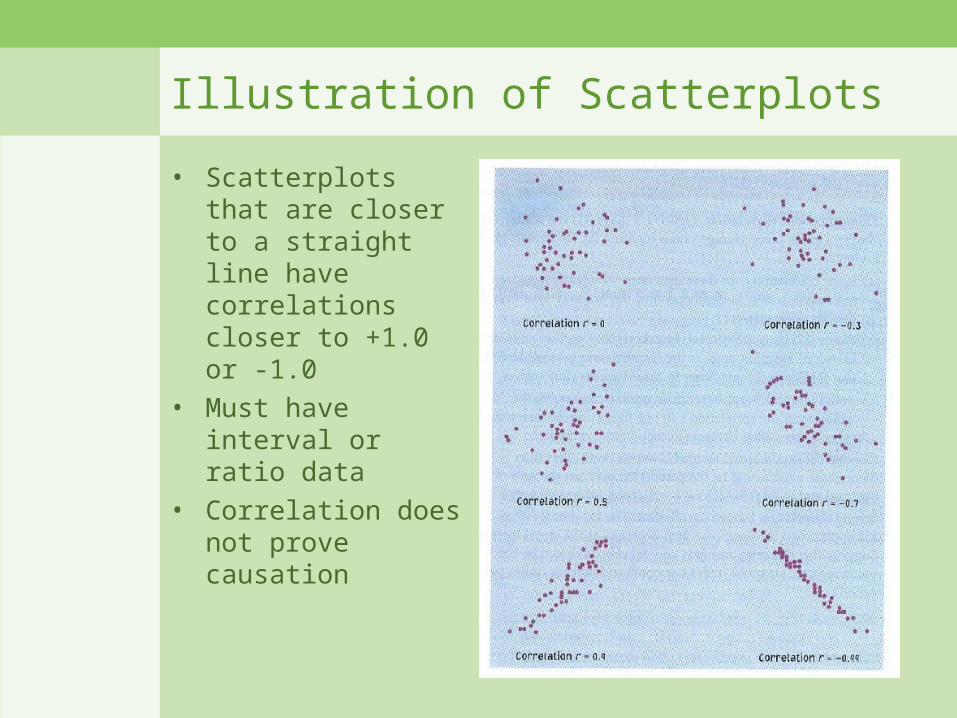
Illustration of Scatterplots
• Scatterplots that are closer to a straight line have correlations closer to +1.0 or -1.0
• Must have interval or ratio data
• Correlation does not prove causation
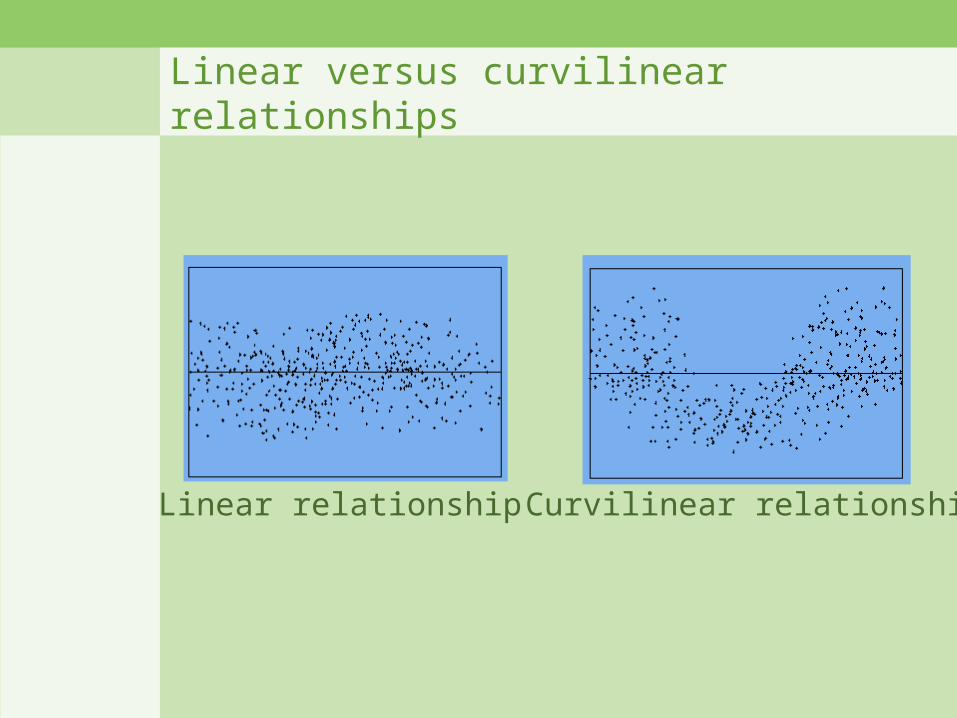
Linear versus curvilinear relationships
Linear relationship Curvilinear relationship
Differences Between Groupsor Conditions• main effect (changes produced by one
independent variable alone)– one-way interaction
• interaction effect (changes produces by independent variables acting together, or in concert– two-way interaction– three-way interaction
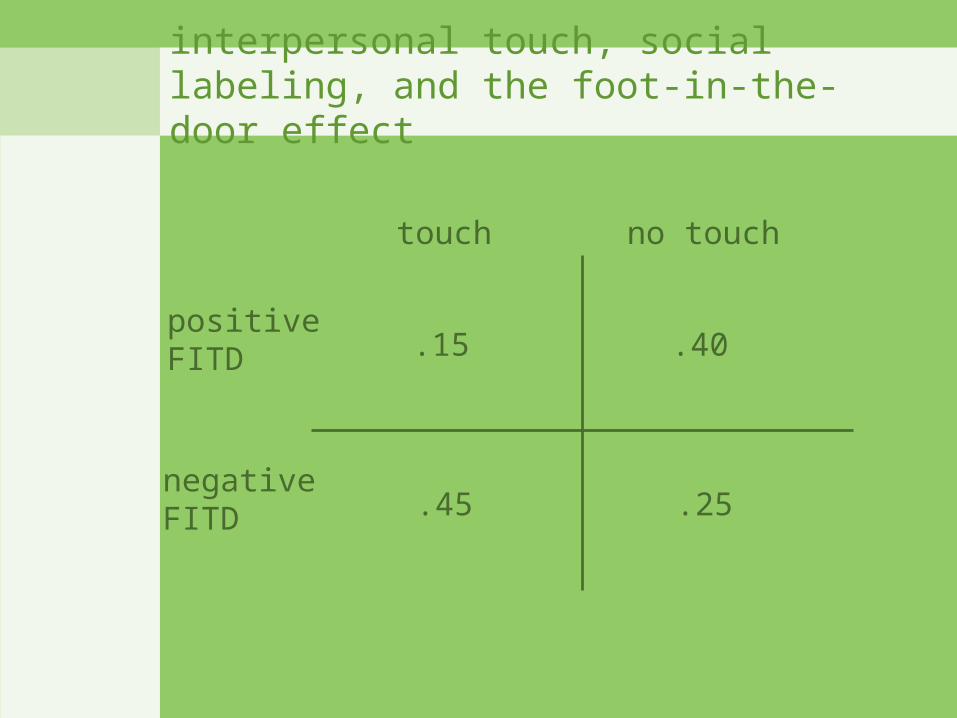
interpersonal touch, social labeling, and the foot-in-the-door effect
touch no touch
positiveFITD
negativeFITD
.15 .40
.45 .25
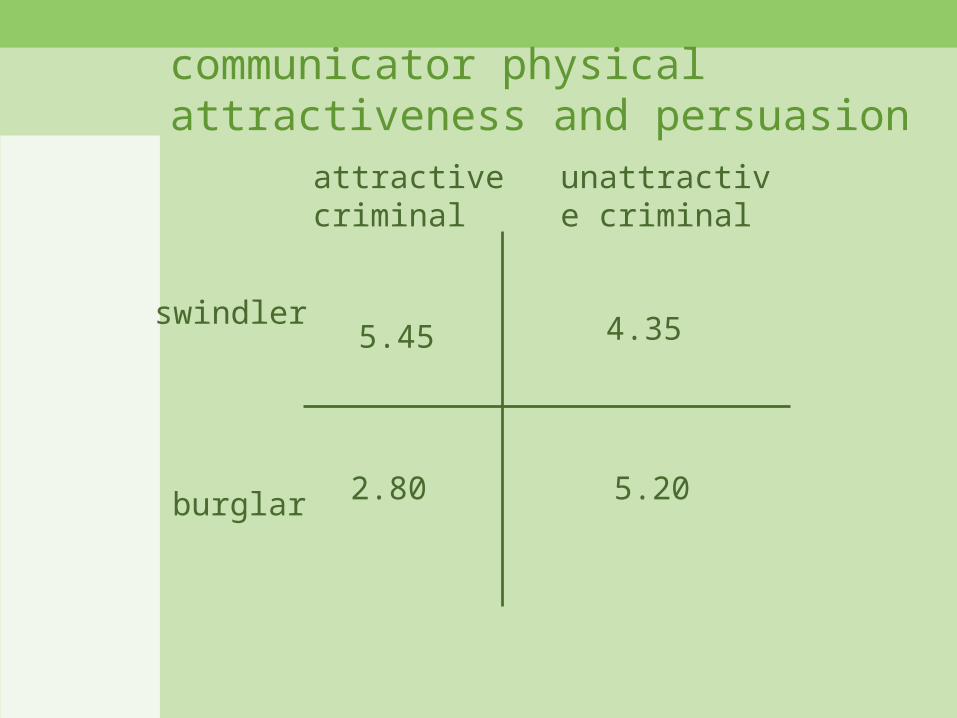
communicator physical attractiveness and persuasion
attractive criminal
unattractive criminal
swindler
burglar
5.45 4.35
2.80 5.20
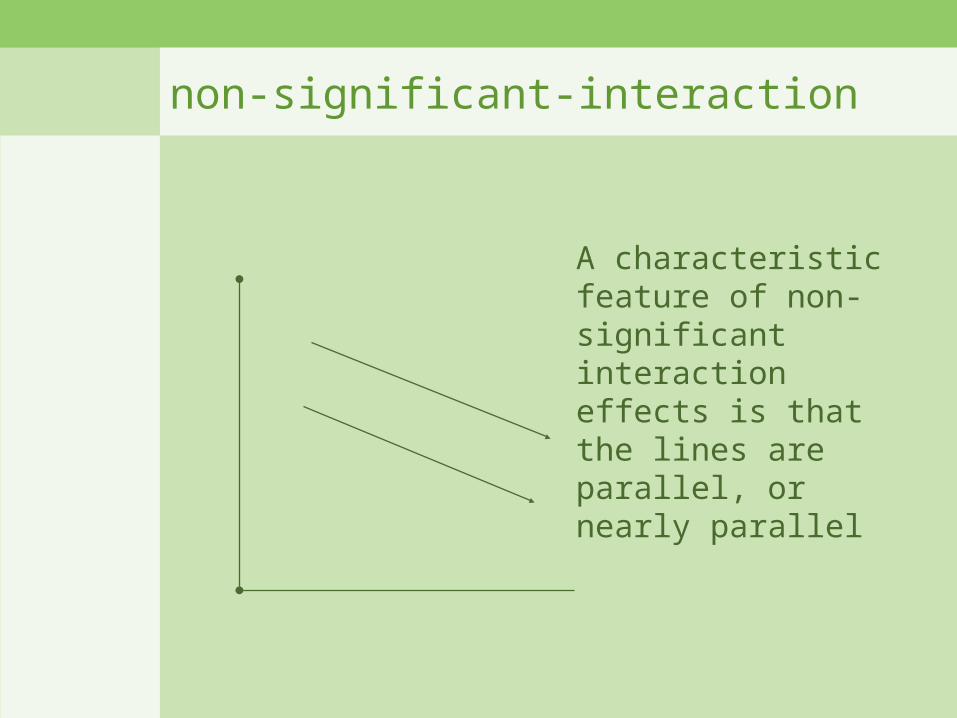
non-significant-interaction
A characteristic feature of non-significant interaction effects is that the lines are parallel, or nearly parallel
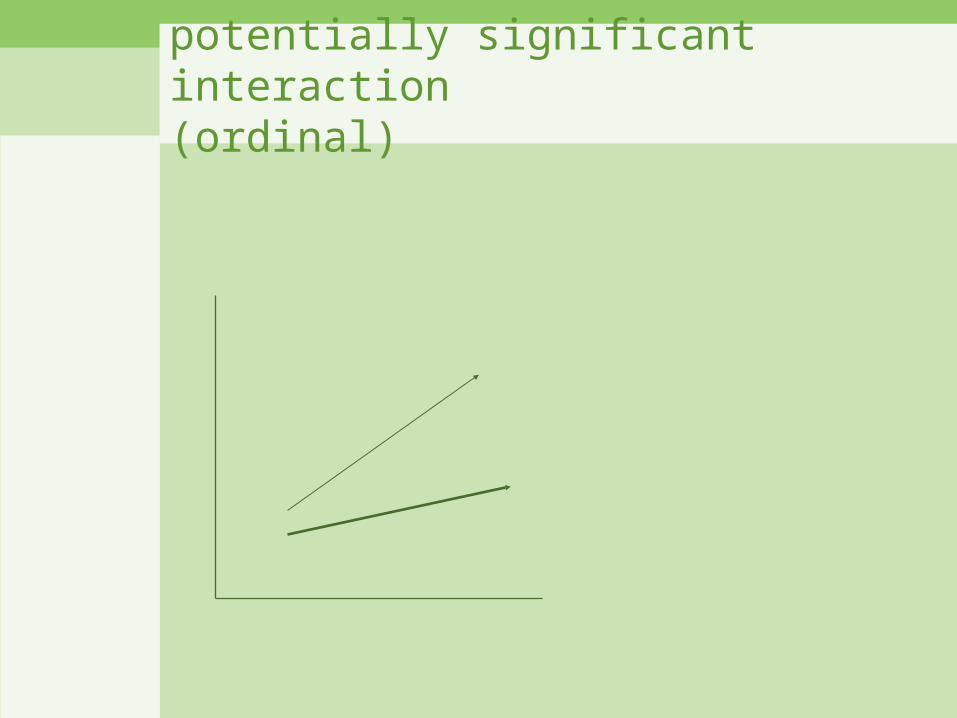
potentially significant interaction(ordinal)
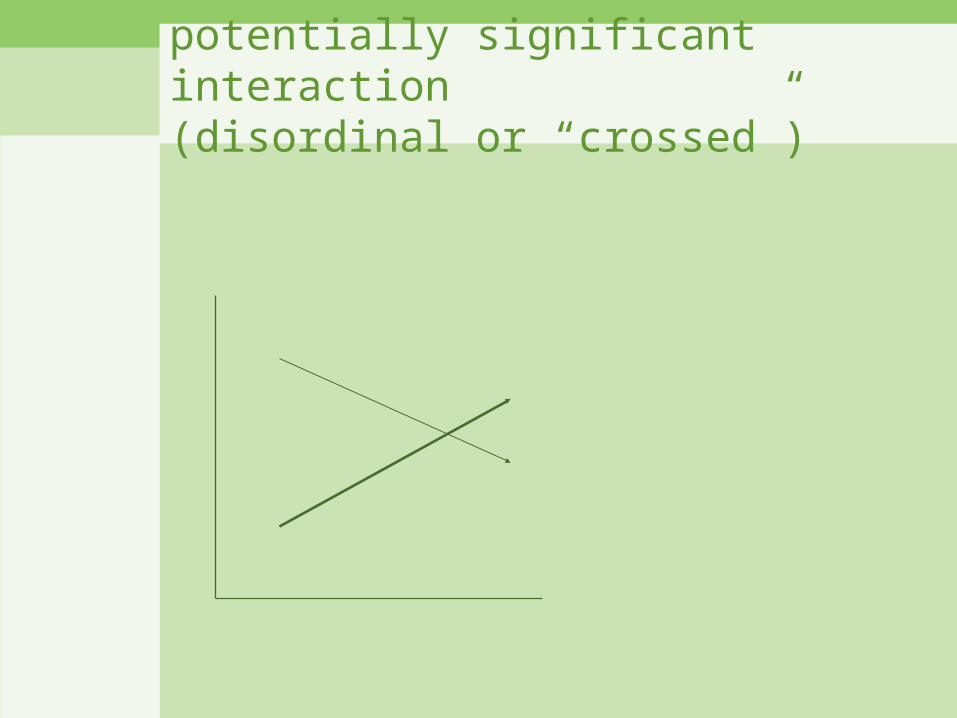
potentially significant interaction(disordinal or “crossed”)
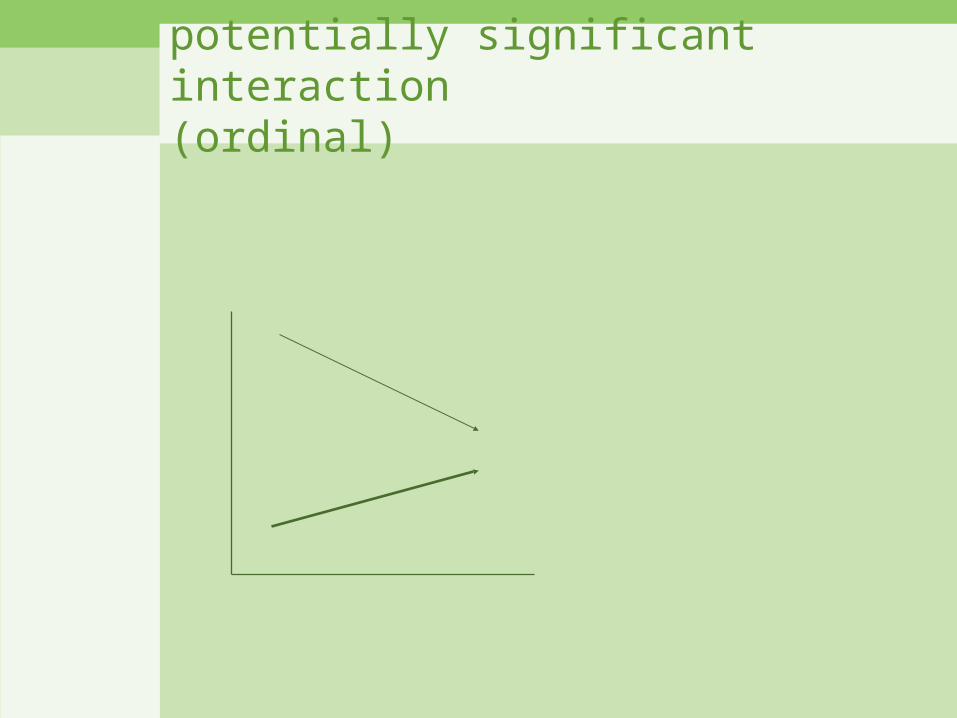
potentially significant interaction(ordinal)
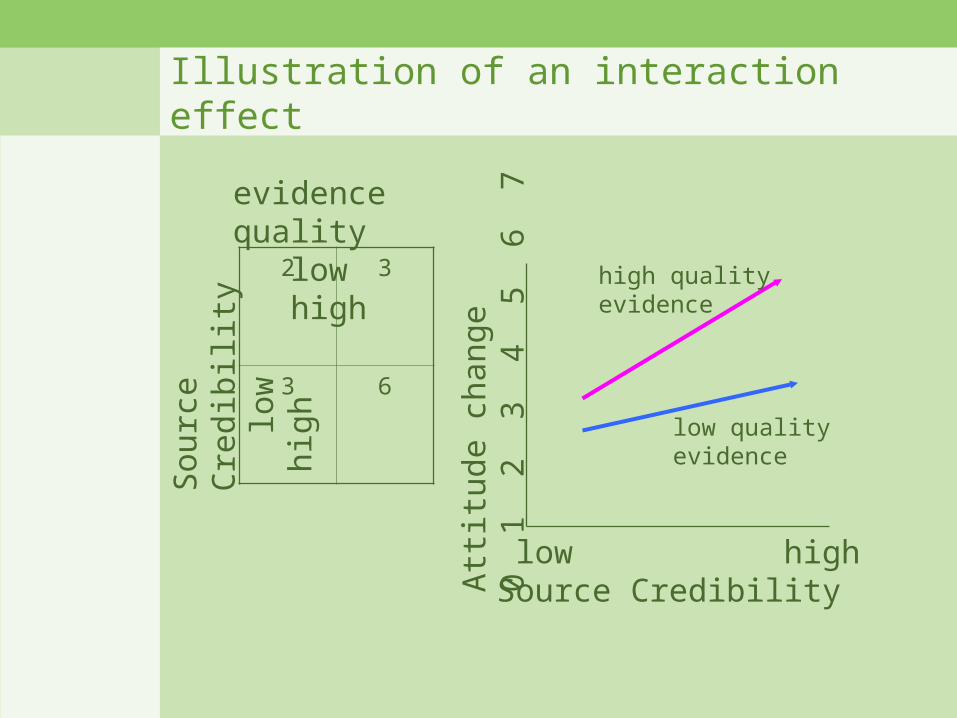
Illustration of an interaction effect
2 3
3 6
evidence quality low high
Att
itude
cha
nge
0 1
2
3
4 5
6
7
Sou
rce
Cre
dibi
lity
lo
w
h
igh
low highSource Credibility
low qualityevidence
high qualityevidence
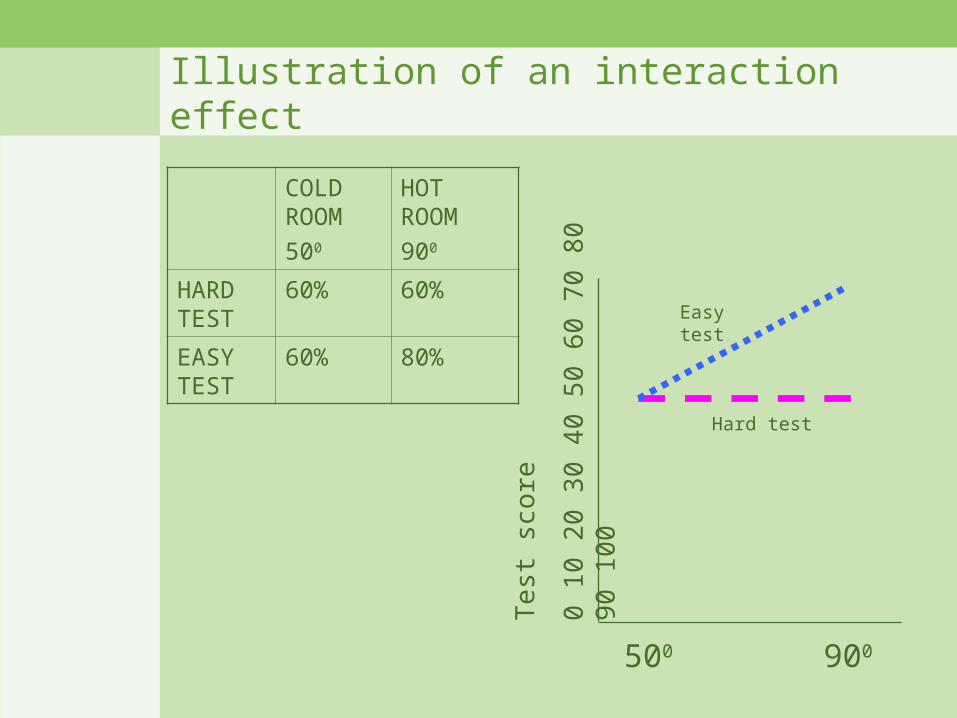
Illustration of an interaction effect
COLD ROOM
500
HOT ROOM
900
HARD TEST
60% 60%
EASY TEST
60% 80%
Te
st s
core
0 1
0 2
0 3
0 4
0 5
0 6
0 7
0 8
0 9
0 1
00
500 900
Hard test
Easy test
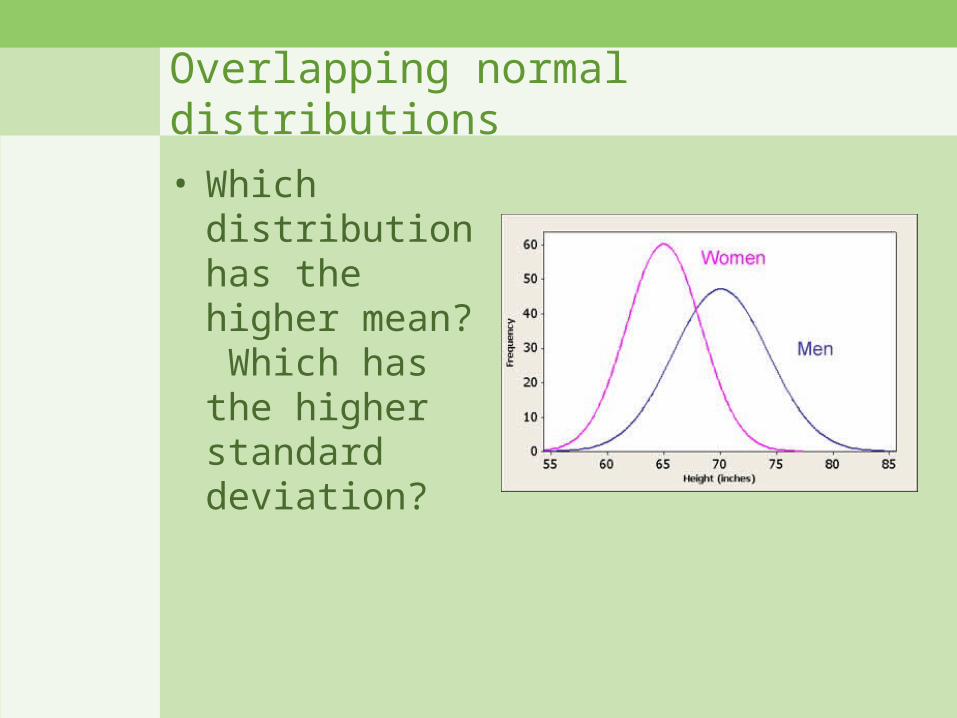
Overlapping normal distributions
• Which distribution has the higher mean? Which has the higher standard deviation?
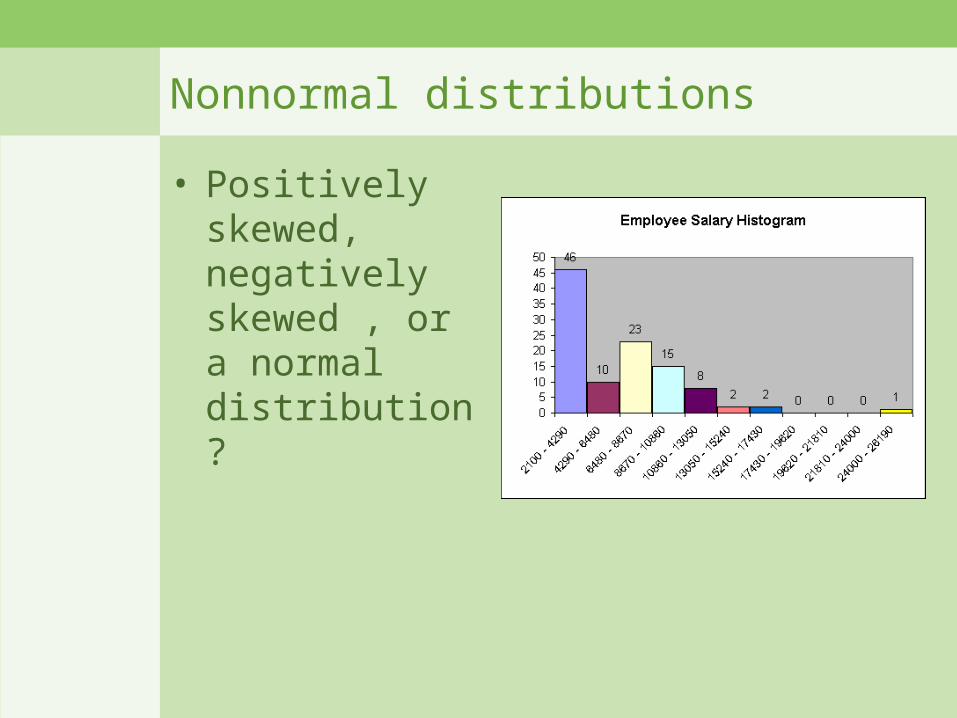
Nonnormal distributions
• Positively skewed, negatively skewed , or a normal distribution?
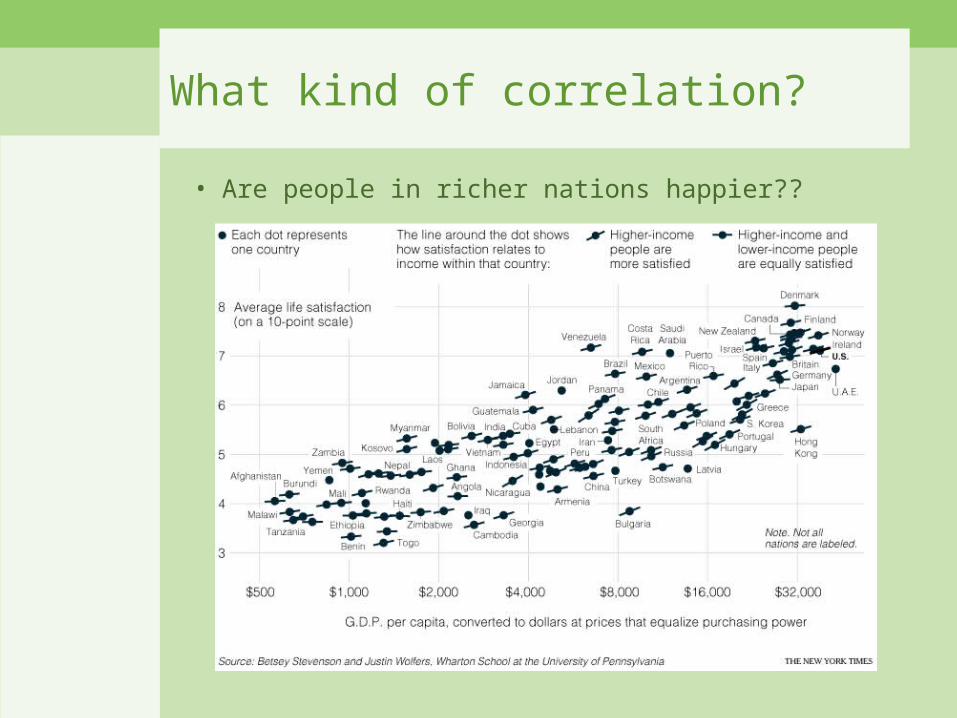
What kind of correlation?
• Are people in richer nations happier??