Embed Size (px)
Citation preview
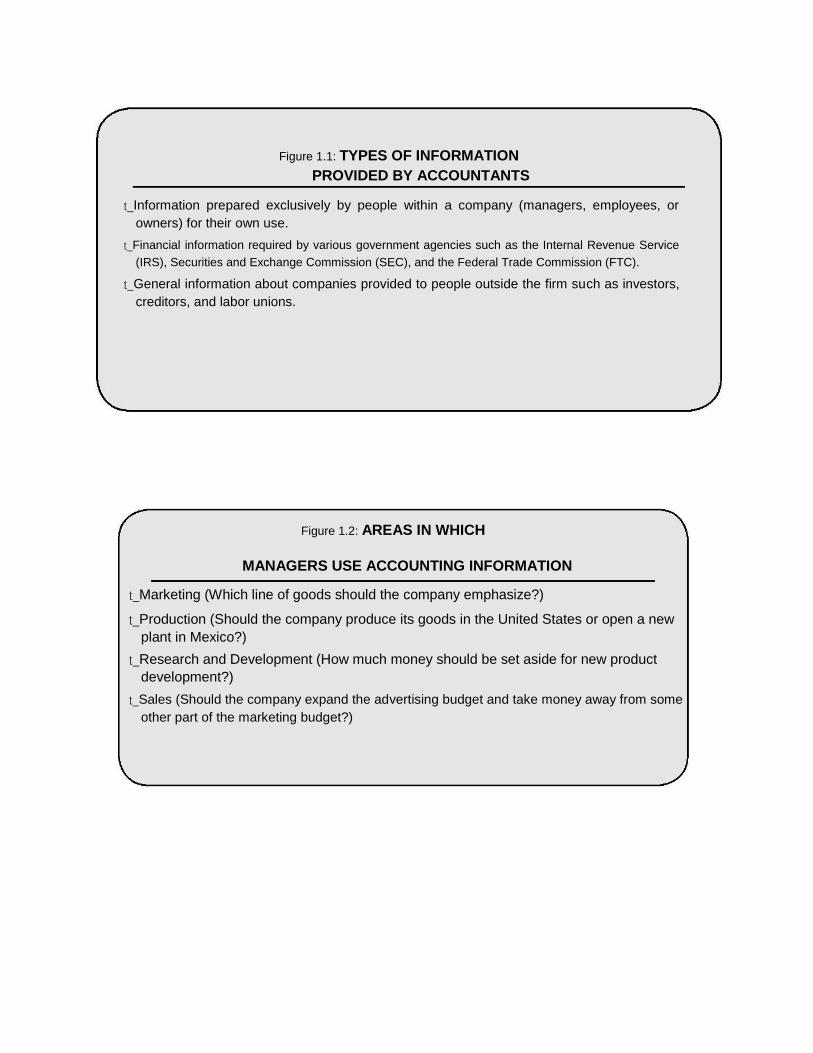
Figure 1.1: TYPES OF INFORMATION PROVIDED BY ACCOUNTANTS
t_Information prepared exclusively by people within a company (managers, employees, or
owners) for their own use. t_Financial information required by various government agencies such as the Internal Revenue Service
(IRS), Securities and Exchange Commission (SEC), and the Federal Trade Commission (FTC). t_General information about companies provided to people outside the firm such as investors,
creditors, and labor unions.
Figure 1.2: AREAS IN WHICH
MANAGERS USE ACCOUNTING INFORMATION
t_Marketing (Which line of goods should the company emphasize?)
t_Production (Should the company produce its goods in the United States or open a new
plant in Mexico?) t_Research and Development (How much money should be set aside for new product
development?) t_Sales (Should the company expand the advertising budget and take money away from some
other part of the marketing budget?)

Figure 1.3: AREAS IN WHICH BANKERS USE ACCOUNTING INFORMATION
t_Granting loans to individuals and companies
t_Investing clients’ money
t_Setting interest rates
t_Meeting federal regulations for protecting your money
E
Figure 1.4: DIFFERENCES IN THE THREE TYPES OF BUSINESSES
Business Type Proprietorship Partnership Corporation
Number of One Two or more One or more
Owners
Accounting Maintained Maintained Maintained
separately separately separately
Records from owner’s from owner’s from owner’s
records records records
Owner Has
Managerial Yes Usually not Usually not
Responsibilities
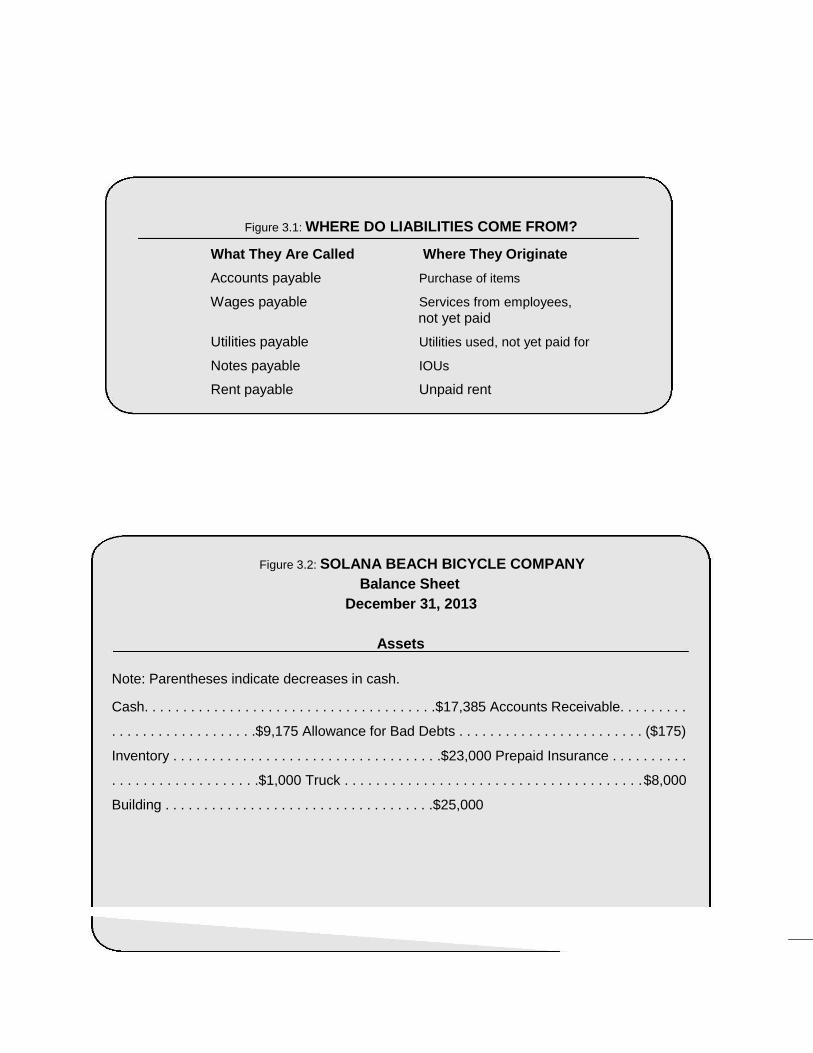
Figure 3.1: WHERE DO LIABILITIES COME FROM?
What They Are Called Where They Originate
Accounts payable Purchase of items
Wages payable Services from employees, not yet paid
Utilities payable Utilities used, not yet paid for
Notes payable IOUs
Rent payable Unpaid rent
Figure 3.2: SOLANA BEACH BICYCLE COMPANY
Balance Sheet December 31, 2013
Assets
Note: Parentheses indicate decreases in cash.
Cash. . . . . . . . . . . . . . . . . . . . . . . . . . . . . . . . . . . . . .$17,385 Accounts Receivable. . . . . . . . .
. . . . . . . . . . . . . . . . . . .$9,175 Allowance for Bad Debts . . . . . . . . . . . . . . . . . . . . . . . . ($175)
Inventory . . . . . . . . . . . . . . . . . . . . . . . . . . . . . . . . . . .$23,000 Prepaid Insurance . . . . . . . . . .
. . . . . . . . . . . . . . . . . . .$1,000 Truck . . . . . . . . . . . . . . . . . . . . . . . . . . . . . . . . . . . . . .$8,000
Building . . . . . . . . . . . . . . . . . . . . . . . . . . . . . . . . . . .$25,000
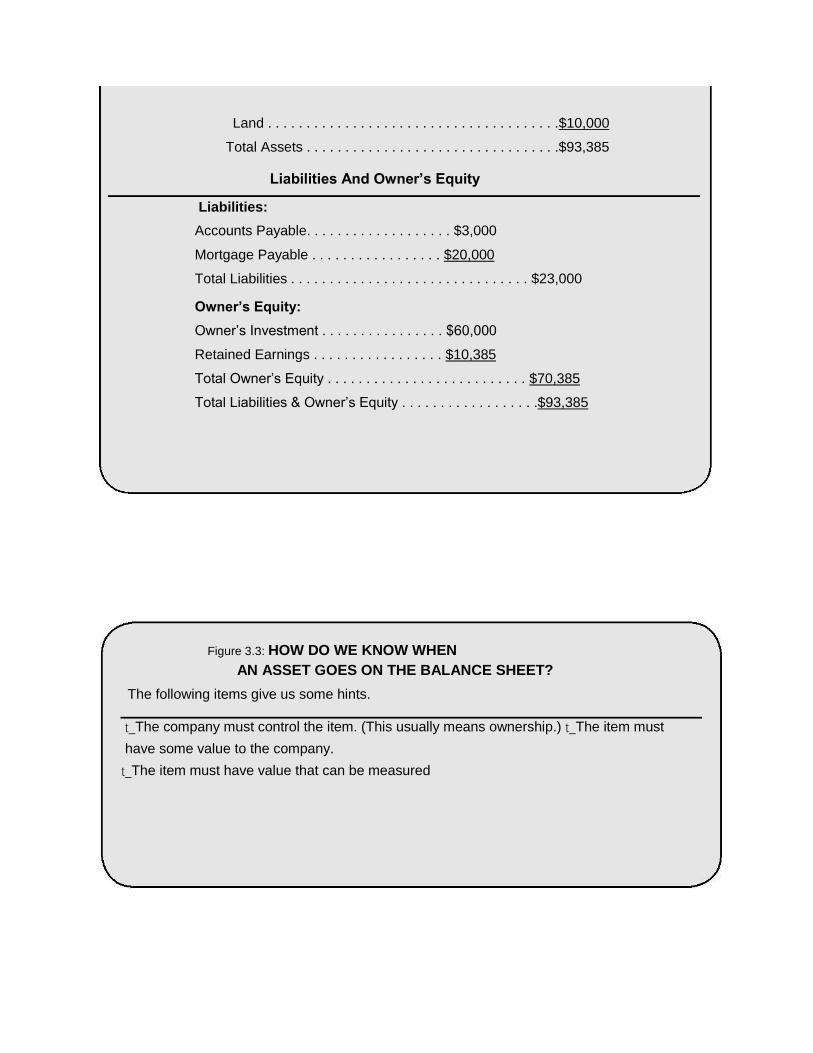
Land . . . . . . . . . . . . . . . . . . . . . . . . . . . . . . . . . . . . . .$10,000
Total Assets . . . . . . . . . . . . . . . . . . . . . . . . . . . . . . . . .$93,385
Liabilities And Owner’s Equity
Liabilities:
Accounts Payable. . . . . . . . . . . . . . . . . . . $3,000
Mortgage Payable . . . . . . . . . . . . . . . . . $20,000
Total Liabilities . . . . . . . . . . . . . . . . . . . . . . . . . . . . . . . $23,000
Owner’s Equity:
Owner’s Investment . . . . . . . . . . . . . . . . $60,000
Retained Earnings . . . . . . . . . . . . . . . . . $10,385
Total Owner’s Equity . . . . . . . . . . . . . . . . . . . . . . . . . . $70,385
Total Liabilities & Owner’s Equity . . . . . . . . . . . . . . . . . .$93,385
Figure 3.3: HOW DO WE KNOW WHEN
AN ASSET GOES ON THE BALANCE SHEET?
The following items give us some hints.
t_The company must control the item. (This usually means ownership.) t_The item must
have some value to the company. t_The item must have value that can be measured
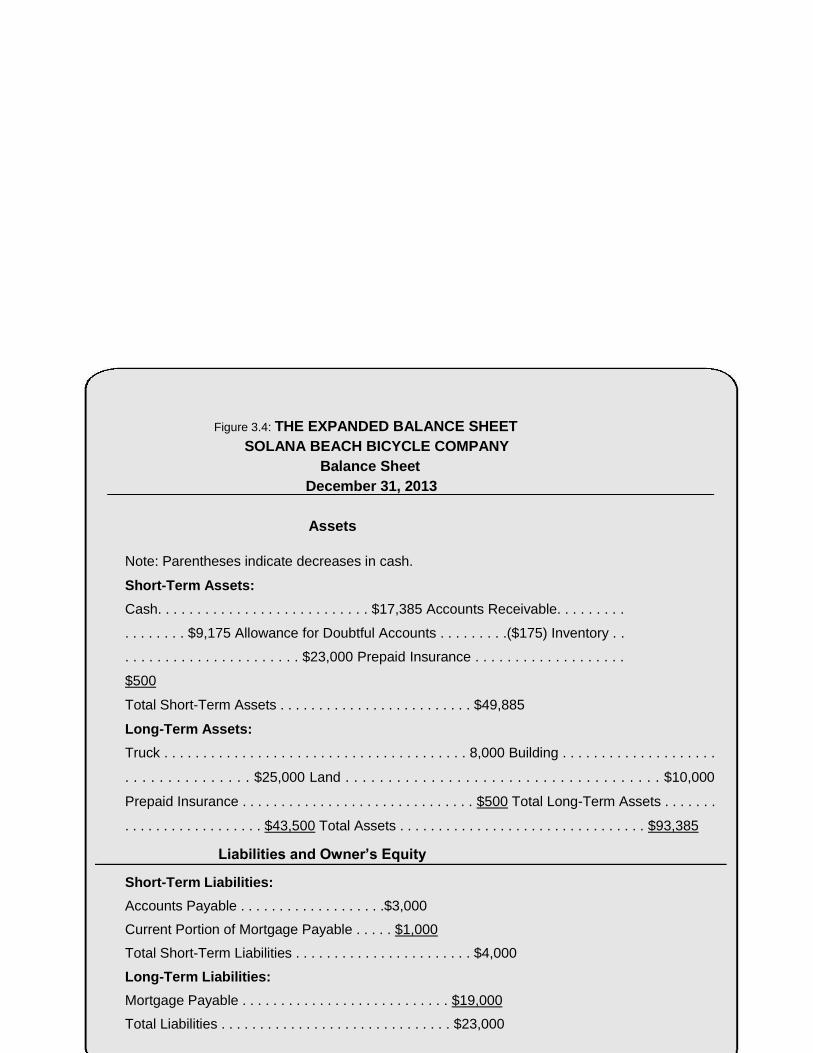
Figure 3.4: THE EXPANDED BALANCE SHEET SOLANA BEACH BICYCLE COMPANY
Balance Sheet December 31, 2013
Assets
Note: Parentheses indicate decreases in cash.
Short-Term Assets:
Cash. . . . . . . . . . . . . . . . . . . . . . . . . . . $17,385 Accounts Receivable. . . . . . . . .
. . . . . . . . $9,175 Allowance for Doubtful Accounts . . . . . . . . .($175) Inventory . .
. . . . . . . . . . . . . . . . . . . . . . $23,000 Prepaid Insurance . . . . . . . . . . . . . . . . . . .
$500
Total Short-Term Assets . . . . . . . . . . . . . . . . . . . . . . . . . $49,885
Long-Term Assets:
Truck . . . . . . . . . . . . . . . . . . . . . . . . . . . . . . . . . . . . . . . 8,000 Building . . . . . . . . . . . . . . . . . . . .
. . . . . . . . . . . . . . . $25,000 Land . . . . . . . . . . . . . . . . . . . . . . . . . . . . . . . . . . . . . $10,000
Prepaid Insurance . . . . . . . . . . . . . . . . . . . . . . . . . . . . . . $500 Total Long-Term Assets . . . . . . .
. . . . . . . . . . . . . . . . . . $43,500 Total Assets . . . . . . . . . . . . . . . . . . . . . . . . . . . . . . . . $93,385
Liabilities and Owner’s Equity
Short-Term Liabilities:
Accounts Payable . . . . . . . . . . . . . . . . . . .$3,000
Current Portion of Mortgage Payable . . . . . $1,000
Total Short-Term Liabilities . . . . . . . . . . . . . . . . . . . . . . . $4,000
Long-Term Liabilities:
Mortgage Payable . . . . . . . . . . . . . . . . . . . . . . . . . . . $19,000
Total Liabilities . . . . . . . . . . . . . . . . . . . . . . . . . . . . . . $23,000
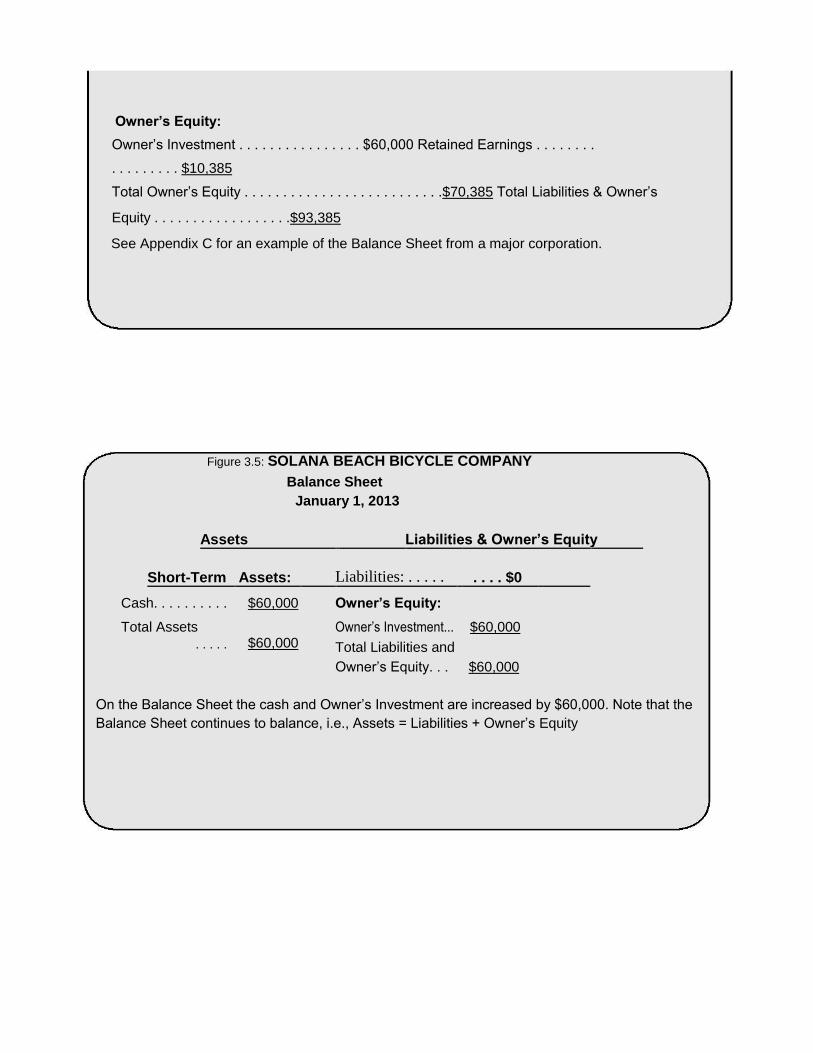
Owner’s Equity:
Owner’s Investment . . . . . . . . . . . . . . . . $60,000 Retained Earnings . . . . . . . .
. . . . . . . . . $10,385
Total Owner’s Equity . . . . . . . . . . . . . . . . . . . . . . . . . .$70,385 Total Liabilities & Owner’s
Equity . . . . . . . . . . . . . . . . . .$93,385
See Appendix C for an example of the Balance Sheet from a major corporation.
Figure 3.5: SOLANA BEACH BICYCLE COMPANY Balance Sheet
January 1, 2013
Assets Liabilities & Owner’s Equity
Short-Term Assets:
Liabilities: . . . . . . . . . $0
Cash. . . . . . . . . . $60,000 Owner’s Equity:
Total Assets $60,000
Owner’s Investment... $60,000
. . . . . Total Liabilities and
Owner’s Equity. . . $60,000
On the Balance Sheet the cash and Owner’s Investment are increased by $60,000. Note that the
Balance Sheet continues to balance, i.e., Assets = Liabilities + Owner’s Equity
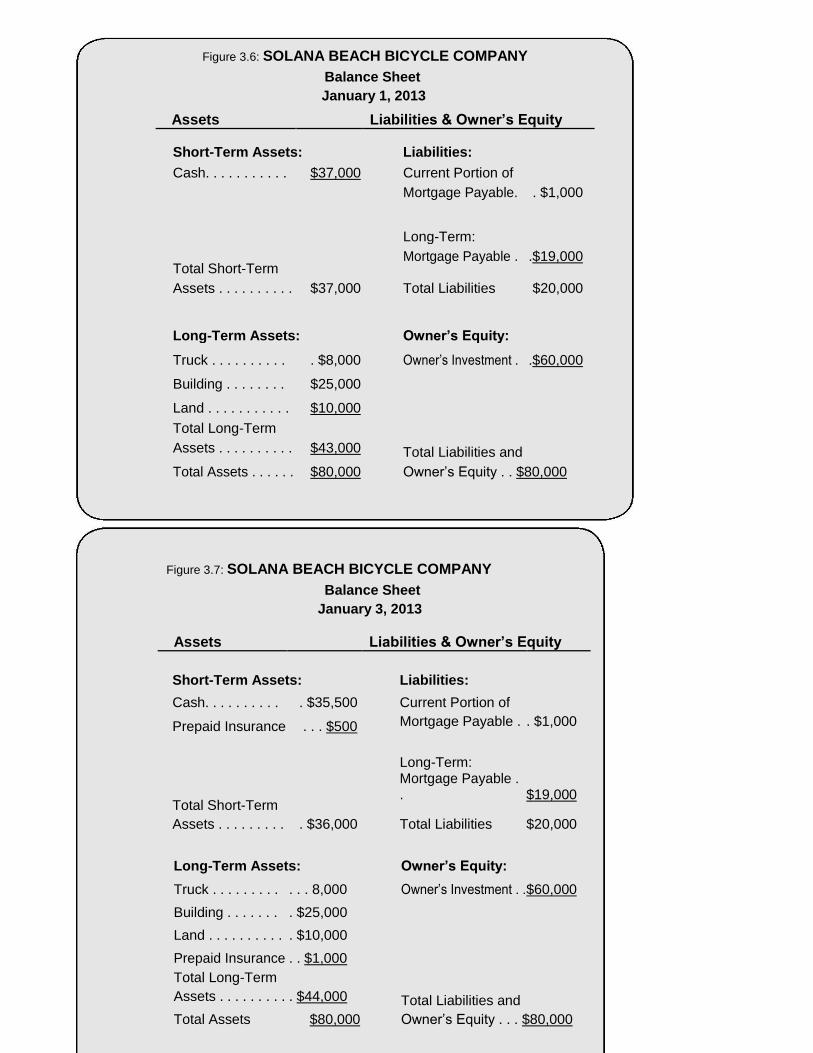
Figure 3.6: SOLANA BEACH BICYCLE COMPANY
Balance Sheet January 1, 2013
Figure 3.7: SOLANA BEACH BICYCLE COMPANY
Balance Sheet January 3, 2013
Assets Liabilities & Owner’s Equity
Short-Term Assets: Liabilities:
Cash. . . . . . . . . . . $35,500 Current Portion of
Prepaid Insurance . . . $500 Mortgage Payable . . $1,000
Long-Term:
Total Short-Term
Mortgage Payable . . $19,000
Total Liabilities $20,000
Assets . . . . . . . . . . $36,000
Long-Term Assets: Owner’s Equity:
Truck . . . . . . . . . . . . 8,000 Owner’s Investment . . $60,000
Building . . . . . . . . $25,000
Land . . . . . . . . . . . $10,000
Prepaid Insurance . . $1,000
Total Long-Term
Assets . . . . . . . . . . $44,000 Total Liabilities and
Total Assets $80,000
Owner’s Equity . . . $80,000
Assets Liabilities & Owner’s Equity
Short-Term Assets: Liabilities:
Cash. . . . . . . . . . . $37,000 Current Portion of
Mortgage Payable. . $1,000
Long-Term:
Total Short-Term Mortgage Payable . .$19,000
Total Liabilities $20,000
Assets . . . . . . . . . . $37,000
Long-Term Assets: Owner’s Equity:
Truck . . . . . . . . . . . $8,000 Owner’s Investment . .$60,000
Building . . . . . . . . $25,000
Land . . . . . . . . . . . $10,000
Total Long-Term
Assets . . . . . . . . . . $43,000 Total Liabilities and
Total Assets . . . . . . $80,000 Owner’s Equity . . $80,000
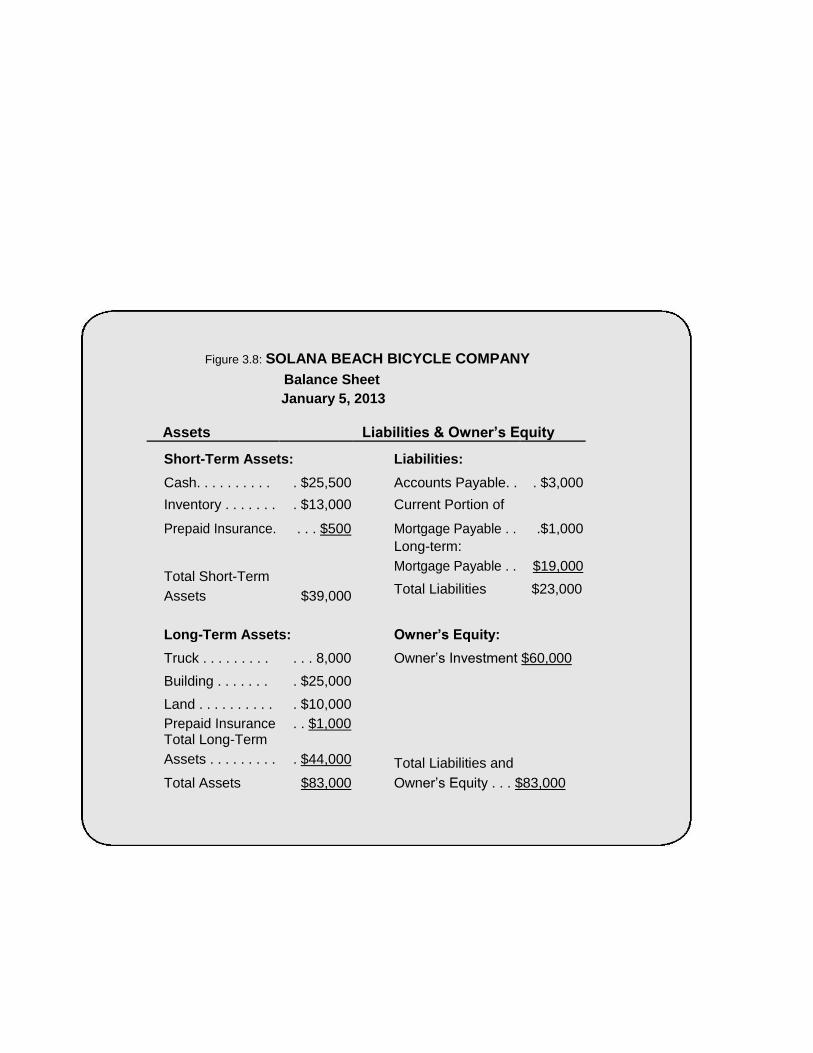
Figure 3.8: SOLANA BEACH BICYCLE COMPANY Balance Sheet
January 5, 2013
Assets Liabilities & Owner’s Equity
Short-Term Assets: Liabilities:
Cash. . . . . . . . . . . $25,500 Accounts Payable. . . $3,000
Inventory . . . . . . . . $13,000 Current Portion of
Prepaid Insurance. . . . $500 Mortgage Payable . . .$1,000
Long-term:
Total Short-Term Mortgage Payable . . $19,000
Total Liabilities $23,000
Assets $39,000
Long-Term Assets: Owner’s Equity:
Truck . . . . . . . . . . . . 8,000 Owner’s Investment $60,000
Building . . . . . . . . $25,000
Land . . . . . . . . . . . $10,000
Prepaid Insurance . . $1,000
Total Long-Term
Assets . . . . . . . . . . $44,000 Total Liabilities and
Total Assets $83,000
Owner’s Equity . . . $83,000
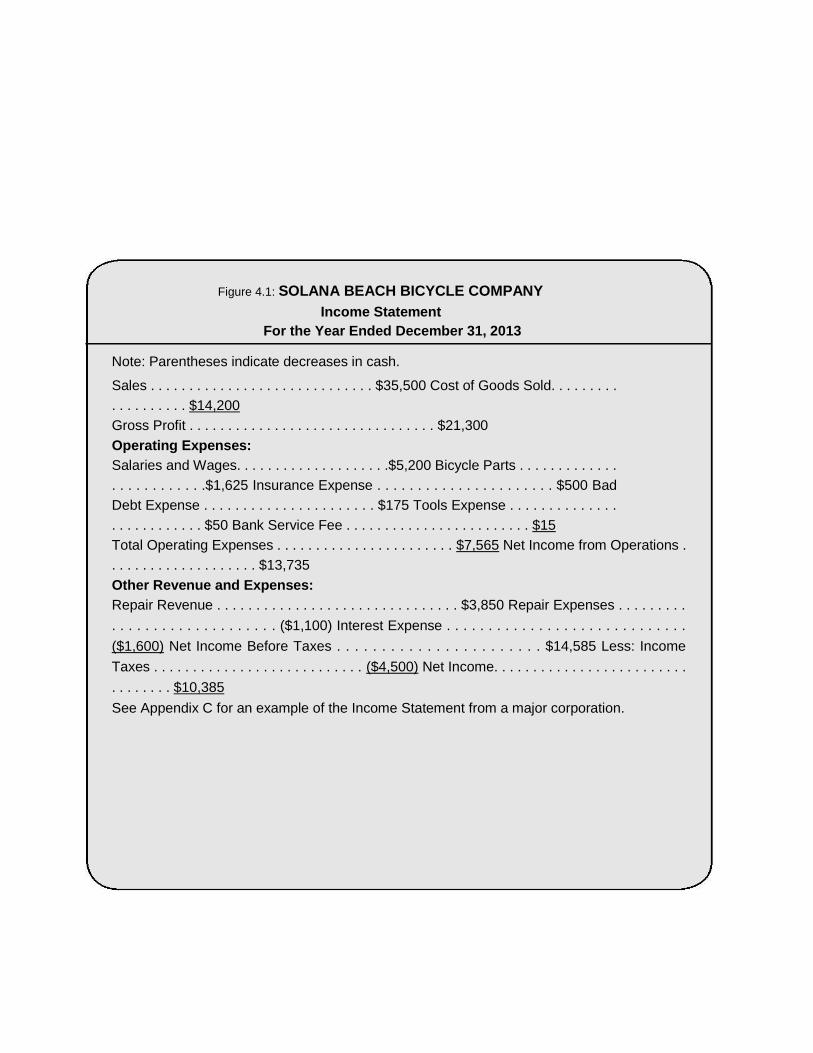
Figure 4.1: SOLANA BEACH BICYCLE COMPANY Income Statement
For the Year Ended December 31, 2013
Note: Parentheses indicate decreases in cash.
Sales . . . . . . . . . . . . . . . . . . . . . . . . . . . . . $35,500 Cost of Goods Sold. . . . . . . . .
. . . . . . . . . . $14,200
Gross Profit . . . . . . . . . . . . . . . . . . . . . . . . . . . . . . . . $21,300 Operating Expenses: Salaries and Wages. . . . . . . . . . . . . . . . . . . .$5,200 Bicycle Parts . . . . . . . . . . . . .
. . . . . . . . . . . .$1,625 Insurance Expense . . . . . . . . . . . . . . . . . . . . . . $500 Bad
Debt Expense . . . . . . . . . . . . . . . . . . . . . . $175 Tools Expense . . . . . . . . . . . . . .
. . . . . . . . . . . . $50 Bank Service Fee . . . . . . . . . . . . . . . . . . . . . . . . $15 Total Operating Expenses . . . . . . . . . . . . . . . . . . . . . . . $7,565 Net Income from Operations .
. . . . . . . . . . . . . . . . . . . $13,735
Other Revenue and Expenses: Repair Revenue . . . . . . . . . . . . . . . . . . . . . . . . . . . . . . . $3,850 Repair Expenses . . . . . . . . .
. . . . . . . . . . . . . . . . . . . . ($1,100) Interest Expense . . . . . . . . . . . . . . . . . . . . . . . . . . . . .
($1,600) Net Income Before Taxes . . . . . . . . . . . . . . . . . . . . . . . $14,585 Less: Income
Taxes . . . . . . . . . . . . . . . . . . . . . . . . . . . ($4,500) Net Income. . . . . . . . . . . . . . . . . . . . . . . . .
. . . . . . . . $10,385
See Appendix C for an example of the Income Statement from a major corporation.
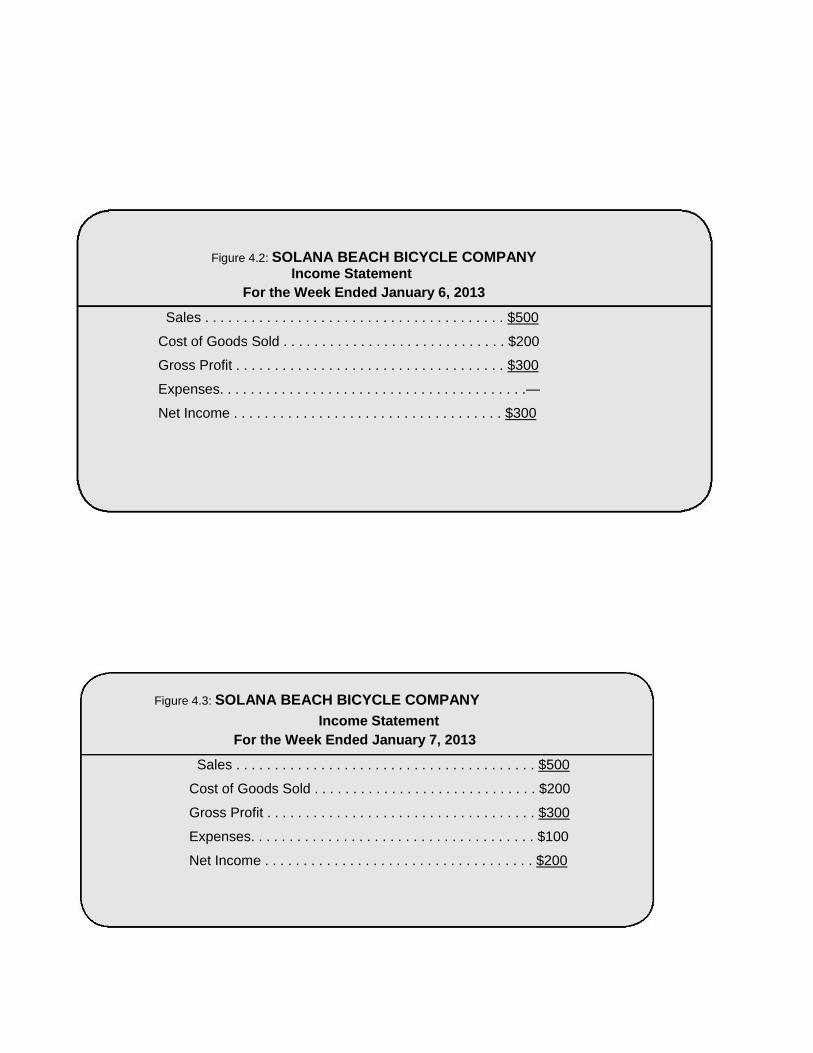
Figure 4.2: SOLANA BEACH BICYCLE COMPANY Income Statement
For the Week Ended January 6, 2013
Sales . . . . . . . . . . . . . . . . . . . . . . . . . . . . . . . . . . . . . . . $500
Cost of Goods Sold . . . . . . . . . . . . . . . . . . . . . . . . . . . . . $200
Gross Profit . . . . . . . . . . . . . . . . . . . . . . . . . . . . . . . . . . . $300
Expenses. . . . . . . . . . . . . . . . . . . . . . . . . . . . . . . . . . . . . . . .—
Net Income . . . . . . . . . . . . . . . . . . . . . . . . . . . . . . . . . . . $300
Figure 4.3: SOLANA BEACH BICYCLE COMPANY
Income Statement For the Week Ended January 7, 2013
Sales . . . . . . . . . . . . . . . . . . . . . . . . . . . . . . . . . . . . . . . $500
Cost of Goods Sold . . . . . . . . . . . . . . . . . . . . . . . . . . . . . $200
Gross Profit . . . . . . . . . . . . . . . . . . . . . . . . . . . . . . . . . . . $300
Expenses. . . . . . . . . . . . . . . . . . . . . . . . . . . . . . . . . . . . . $100
Net Income . . . . . . . . . . . . . . . . . . . . . . . . . . . . . . . . . . . $200
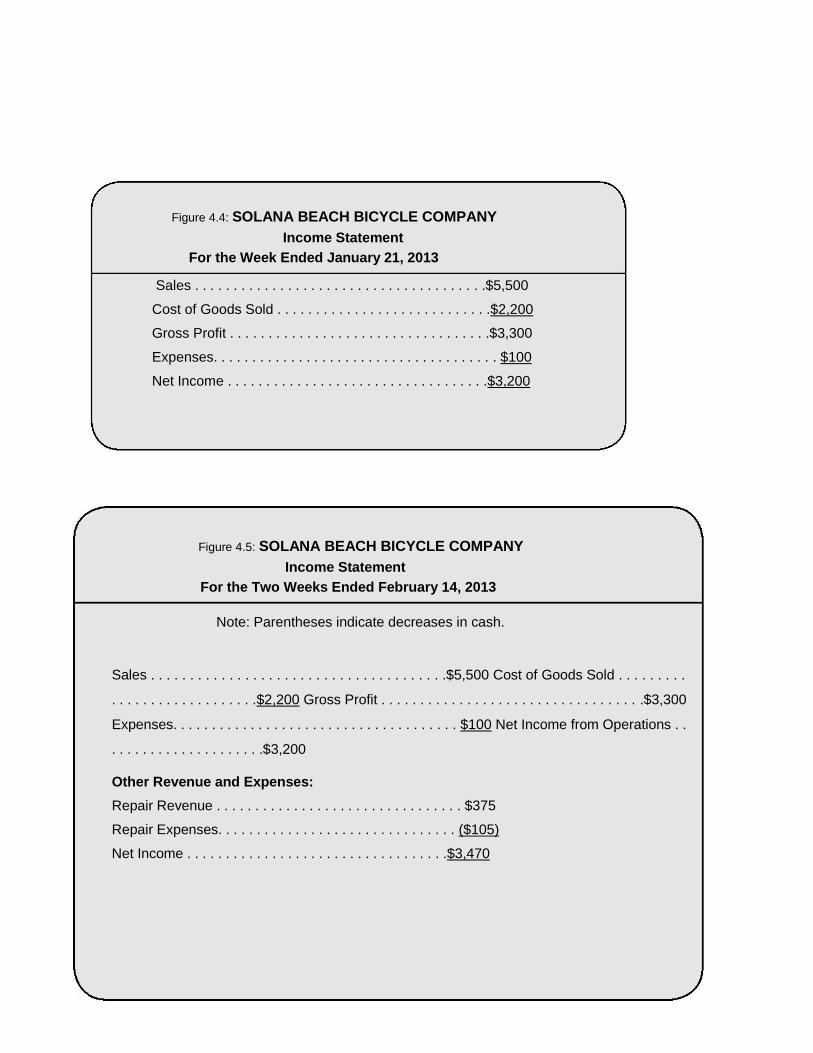
Figure 4.4: SOLANA BEACH BICYCLE COMPANY
Income Statement For the Week Ended January 21, 2013
Sales . . . . . . . . . . . . . . . . . . . . . . . . . . . . . . . . . . . . . .$5,500
Cost of Goods Sold . . . . . . . . . . . . . . . . . . . . . . . . . . . .$2,200
Gross Profit . . . . . . . . . . . . . . . . . . . . . . . . . . . . . . . . . .$3,300
Expenses. . . . . . . . . . . . . . . . . . . . . . . . . . . . . . . . . . . . . $100
Net Income . . . . . . . . . . . . . . . . . . . . . . . . . . . . . . . . . .$3,200
Figure 4.5: SOLANA BEACH BICYCLE COMPANY Income Statement
For the Two Weeks Ended February 14, 2013
Note: Parentheses indicate decreases in cash.
Sales . . . . . . . . . . . . . . . . . . . . . . . . . . . . . . . . . . . . . .$5,500 Cost of Goods Sold . . . . . . . . .
. . . . . . . . . . . . . . . . . . .$2,200 Gross Profit . . . . . . . . . . . . . . . . . . . . . . . . . . . . . . . . . .$3,300
Expenses. . . . . . . . . . . . . . . . . . . . . . . . . . . . . . . . . . . . . $100 Net Income from Operations . .
. . . . . . . . . . . . . . . . . . . .$3,200
Other Revenue and Expenses:
Repair Revenue . . . . . . . . . . . . . . . . . . . . . . . . . . . . . . . . $375
Repair Expenses. . . . . . . . . . . . . . . . . . . . . . . . . . . . . . . ($105)
Net Income . . . . . . . . . . . . . . . . . . . . . . . . . . . . . . . . . .$3,470
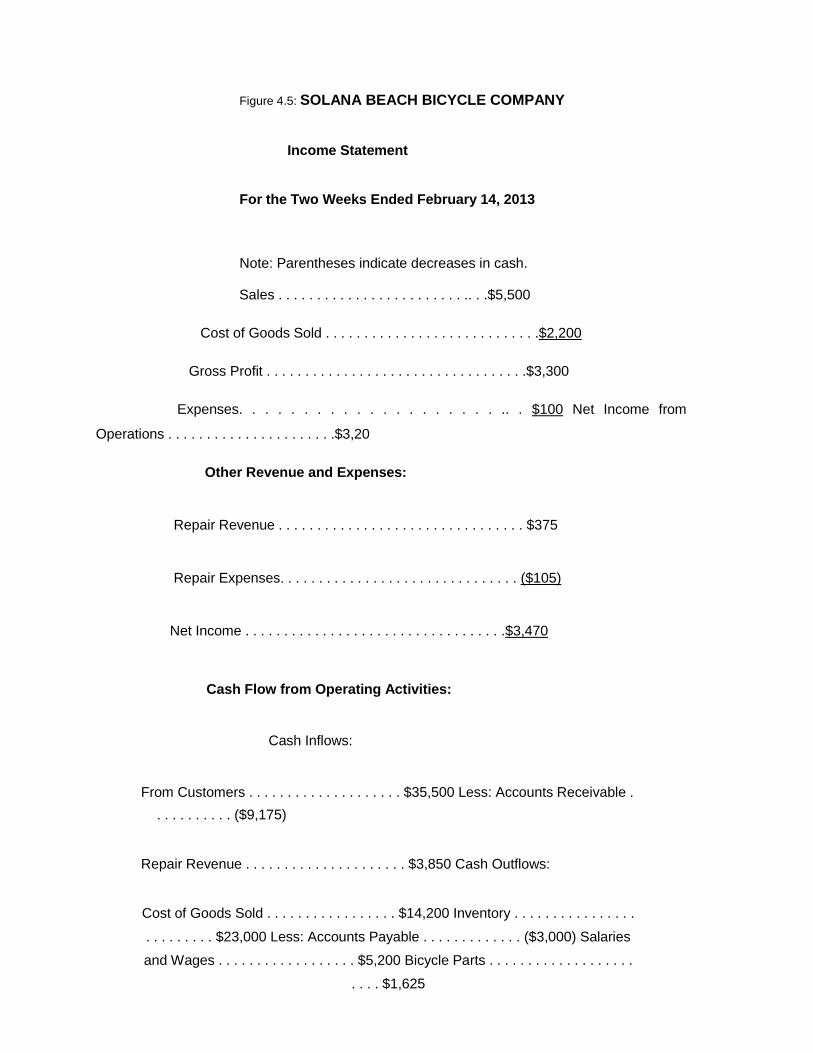
Figure 4.5: SOLANA BEACH BICYCLE COMPANY
Income Statement
For the Two Weeks Ended February 14, 2013
Note: Parentheses indicate decreases in cash.
Sales . . . . . . . . . . . . . . . . . . . . . . . . .. . .$5,500
Cost of Goods Sold . . . . . . . . . . . . . . . . . . . . . . . . . . . .$2,200
Gross Profit . . . . . . . . . . . . . . . . . . . . . . . . . . . . . . . . . .$3,300
Expenses. . . . . . . . . . . . . . . . . . . . .. . $100 Net Income from
Operations . . . . . . . . . . . . . . . . . . . . . .$3,20
Other Revenue and Expenses:
Repair Revenue . . . . . . . . . . . . . . . . . . . . . . . . . . . . . . . . $375
Repair Expenses. . . . . . . . . . . . . . . . . . . . . . . . . . . . . . . ($105)
Net Income . . . . . . . . . . . . . . . . . . . . . . . . . . . . . . . . . .$3,470
Cash Flow from Operating Activities:
Cash Inflows:
From Customers . . . . . . . . . . . . . . . . . . . . $35,500 Less: Accounts Receivable .
. . . . . . . . . . ($9,175)
Repair Revenue . . . . . . . . . . . . . . . . . . . . . $3,850 Cash Outflows:
Cost of Goods Sold . . . . . . . . . . . . . . . . . $14,200 Inventory . . . . . . . . . . . . . . . .
. . . . . . . . . $23,000 Less: Accounts Payable . . . . . . . . . . . . . ($3,000) Salaries
and Wages . . . . . . . . . . . . . . . . . . $5,200 Bicycle Parts . . . . . . . . . . . . . . . . . . .
. . . . $1,625
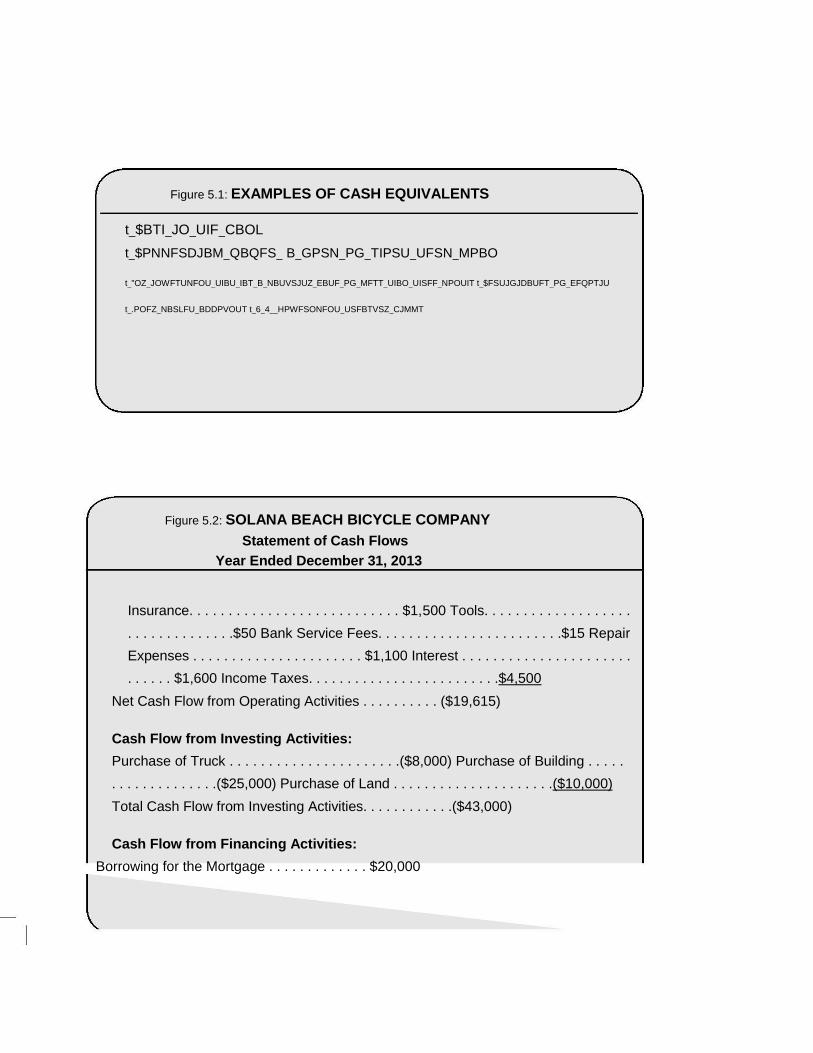
Figure 5.1: EXAMPLES OF CASH EQUIVALENTS
t_$BTI_JO_UIF_CBOL
t_$PNNFSDJBM_QBQFS_ B_GPSN_PG_TIPSU_UFSN_MPBO
t_"OZ_JOWFTUNFOU_UIBU_IBT_B_NBUVSJUZ_EBUF_PG_MFTT_UIBO_UISFF_NPOUIT t_$FSUJGJDBUFT_PG_EFQPTJU
t_.POFZ_NBSLFU_BDDPVOUT t_6_4__HPWFSONFOU_USFBTVSZ_CJMMT
Figure 5.2: SOLANA BEACH BICYCLE COMPANY
Statement of Cash Flows Year Ended December 31, 2013
Insurance. . . . . . . . . . . . . . . . . . . . . . . . . . . $1,500 Tools. . . . . . . . . . . . . . . . . . .
. . . . . . . . . . . . . .$50 Bank Service Fees. . . . . . . . . . . . . . . . . . . . . . . .$15 Repair
Expenses . . . . . . . . . . . . . . . . . . . . . . $1,100 Interest . . . . . . . . . . . . . . . . . . . . . .
. . . . . . $1,600 Income Taxes. . . . . . . . . . . . . . . . . . . . . . . . .$4,500
Net Cash Flow from Operating Activities . . . . . . . . . . ($19,615)
Cash Flow from Investing Activities:
Purchase of Truck . . . . . . . . . . . . . . . . . . . . . .($8,000) Purchase of Building . . . . .
. . . . . . . . . . . . . .($25,000) Purchase of Land . . . . . . . . . . . . . . . . . . . . .($10,000)
Total Cash Flow from Investing Activities. . . . . . . . . . . .($43,000)
Cash Flow from Financing Activities:
Borrowing for the Mortgage . . . . . . . . . . . . . $20,000
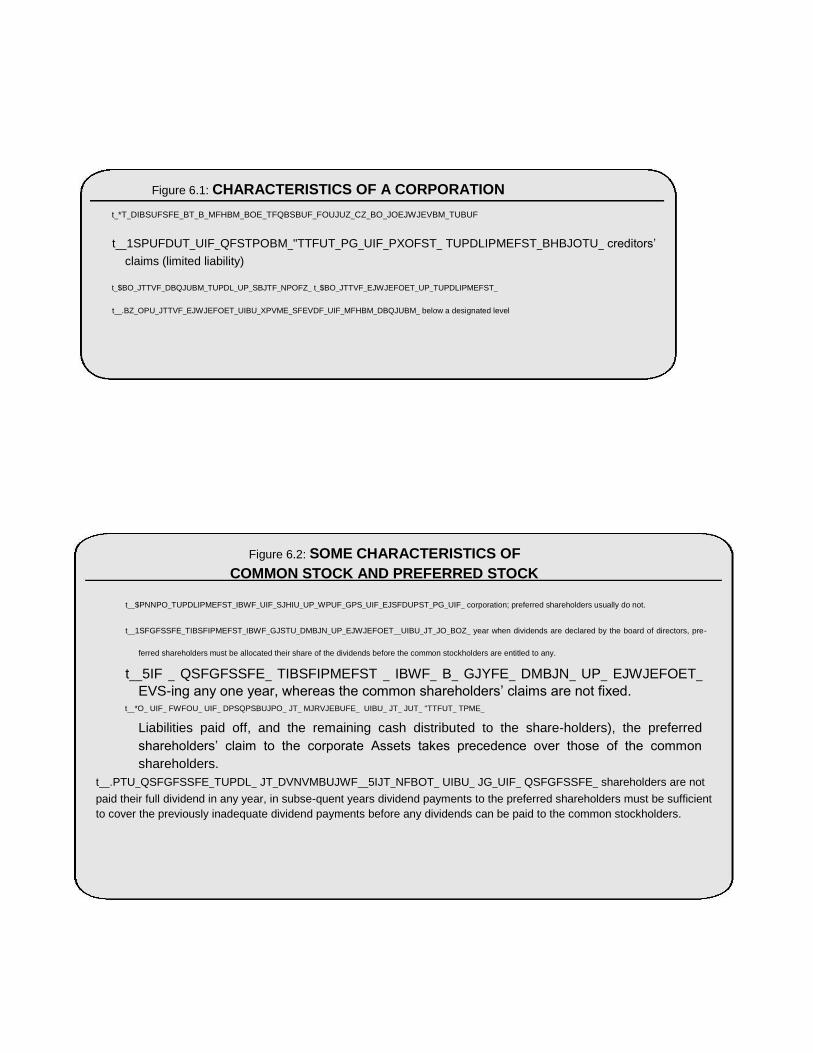
Figure 6.1: CHARACTERISTICS OF A CORPORATION
t_*T_DIBSUFSFE_BT_B_MFHBM_BOE_TFQBSBUF_FOUJUZ_CZ_BO_JOEJWJEVBM_TUBUF
t__1SPUFDUT_UIF_QFSTPOBM_"TTFUT_PG_UIF_PXOFST_ TUPDLIPMEFST_BHBJOTU_ creditors’
claims (limited liability)
t_$BO_JTTVF_DBQJUBM_TUPDL_UP_SBJTF_NPOFZ_ t_$BO_JTTVF_EJWJEFOET_UP_TUPDLIPMEFST_
t__.BZ_OPU_JTTVF_EJWJEFOET_UIBU_XPVME_SFEVDF_UIF_MFHBM_DBQJUBM_ below a designated level
Figure 6.2: SOME CHARACTERISTICS OF COMMON STOCK AND PREFERRED STOCK
t__$PNNPO_TUPDLIPMEFST_IBWF_UIF_SJHIU_UP_WPUF_GPS_UIF_EJSFDUPST_PG_UIF_ corporation; preferred shareholders usually do not.
t__1SFGFSSFE_TIBSFIPMEFST_IBWF_GJSTU_DMBJN_UP_EJWJEFOET__UIBU_JT_JO_BOZ_ year when dividends are declared by the board of directors, pre-
ferred shareholders must be allocated their share of the dividends before the common stockholders are entitled to any.
t__5IF _ QSFGFSSFE_ TIBSFIPMEFST _ IBWF_ B_ GJYFE_ DMBJN_ UP_ EJWJEFOET_
EVS-ing any one year, whereas the common shareholders’ claims are not fixed. t__*O_ UIF_ FWFOU_ UIF_ DPSQPSBUJPO_ JT_ MJRVJEBUFE_ UIBU_ JT_ JUT_ "TTFUT_ TPME_
Liabilities paid off, and the remaining cash distributed to the share-holders), the preferred
shareholders’ claim to the corporate Assets takes precedence over those of the common
shareholders. t__.PTU_QSFGFSSFE_TUPDL_ JT_DVNVMBUJWF__5IJT_NFBOT_ UIBU_ JG_UIF_ QSFGFSSFE_ shareholders are not
paid their full dividend in any year, in subse-quent years dividend payments to the preferred shareholders must be sufficient
to cover the previously inadequate dividend payments before any dividends can be paid to the common stockholders.
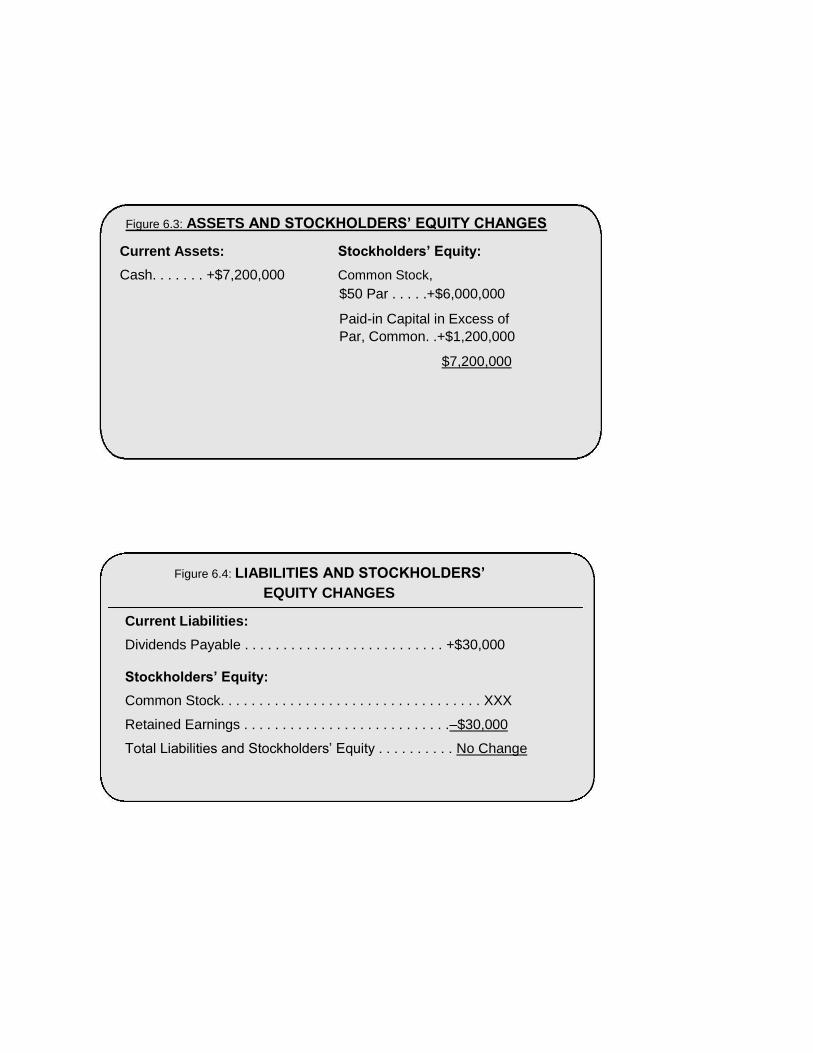
Figure 6.3: ASSETS AND STOCKHOLDERS’ EQUITY CHANGES
Current Assets: Stockholders’ Equity:
Cash. . . . . . . +$7,200,000 Common Stock, $50 Par . . . . .+$6,000,000
Paid-in Capital in Excess of Par, Common. .+$1,200,000
$7,200,000
Figure 6.4: LIABILITIES AND STOCKHOLDERS’
EQUITY CHANGES
Current Liabilities:
Dividends Payable . . . . . . . . . . . . . . . . . . . . . . . . . . +$30,000
Stockholders’ Equity:
Common Stock. . . . . . . . . . . . . . . . . . . . . . . . . . . . . . . . . . XXX
Retained Earnings . . . . . . . . . . . . . . . . . . . . . . . . . . .–$30,000
Total Liabilities and Stockholders’ Equity . . . . . . . . . . No Change
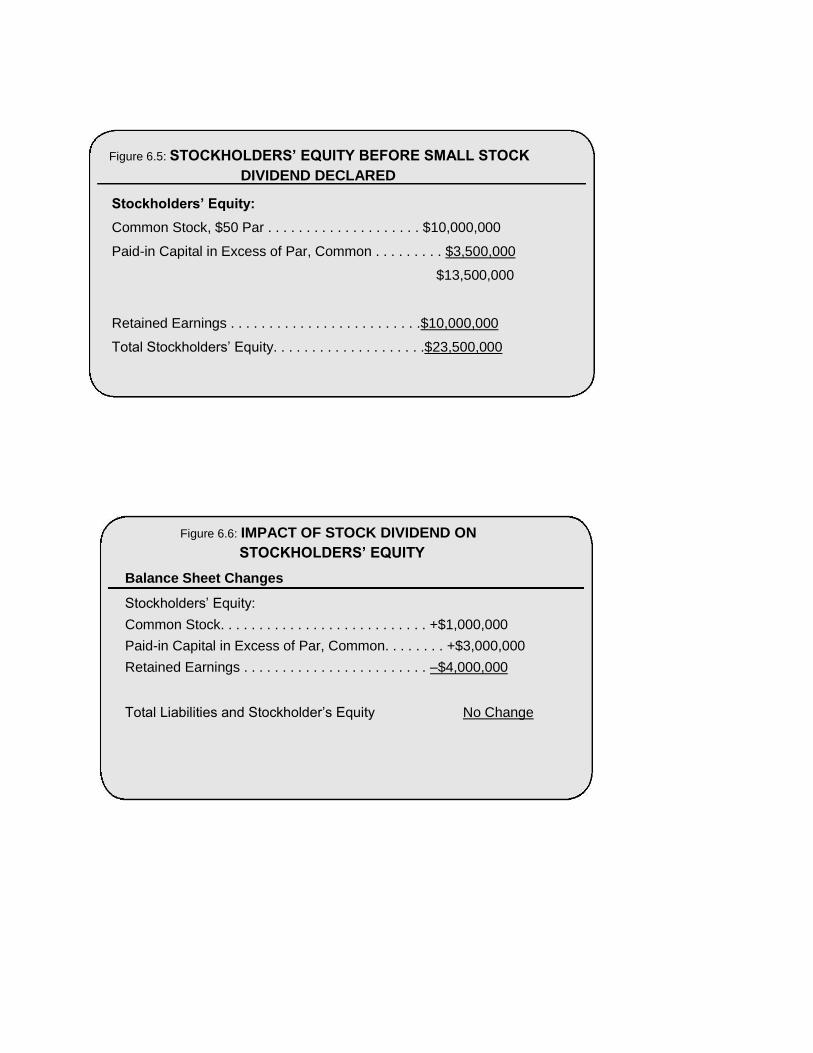
Figure 6.5: STOCKHOLDERS’ EQUITY BEFORE SMALL STOCK DIVIDEND DECLARED
Stockholders’ Equity:
Common Stock, $50 Par . . . . . . . . . . . . . . . . . . . . $10,000,000
Paid-in Capital in Excess of Par, Common . . . . . . . . . $3,500,000
$13,500,000
Retained Earnings . . . . . . . . . . . . . . . . . . . . . . . . .$10,000,000
Total Stockholders’ Equity. . . . . . . . . . . . . . . . . . . .$23,500,000
Figure 6.6: IMPACT OF STOCK DIVIDEND ON STOCKHOLDERS’ EQUITY
Balance Sheet Changes
Stockholders’ Equity:
Common Stock. . . . . . . . . . . . . . . . . . . . . . . . . . . +$1,000,000
Paid-in Capital in Excess of Par, Common. . . . . . . . +$3,000,000
Retained Earnings . . . . . . . . . . . . . . . . . . . . . . . . –$4,000,000
Total Liabilities and Stockholder’s Equity No Change
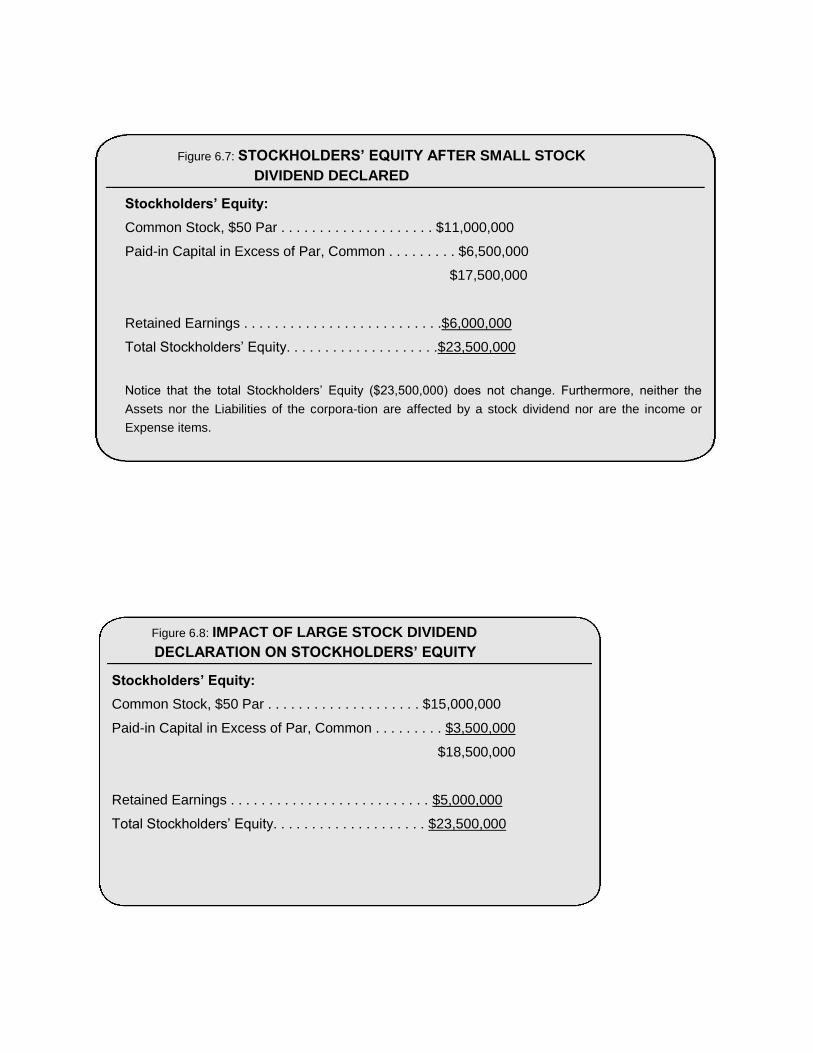
Figure 6.7: STOCKHOLDERS’ EQUITY AFTER SMALL STOCK DIVIDEND DECLARED
Stockholders’ Equity:
Common Stock, $50 Par . . . . . . . . . . . . . . . . . . . . $11,000,000
Paid-in Capital in Excess of Par, Common . . . . . . . . . $6,500,000
$17,500,000
Retained Earnings . . . . . . . . . . . . . . . . . . . . . . . . . .$6,000,000
Total Stockholders’ Equity. . . . . . . . . . . . . . . . . . . .$23,500,000
Notice that the total Stockholders’ Equity ($23,500,000) does not change. Furthermore, neither the
Assets nor the Liabilities of the corpora-tion are affected by a stock dividend nor are the income or
Expense items.
Figure 6.8: IMPACT OF LARGE STOCK DIVIDEND DECLARATION ON STOCKHOLDERS’ EQUITY
Stockholders’ Equity:
Common Stock, $50 Par . . . . . . . . . . . . . . . . . . . . $15,000,000
Paid-in Capital in Excess of Par, Common . . . . . . . . . $3,500,000
$18,500,000
Retained Earnings . . . . . . . . . . . . . . . . . . . . . . . . . . $5,000,000
Total Stockholders’ Equity. . . . . . . . . . . . . . . . . . . . $23,500,000
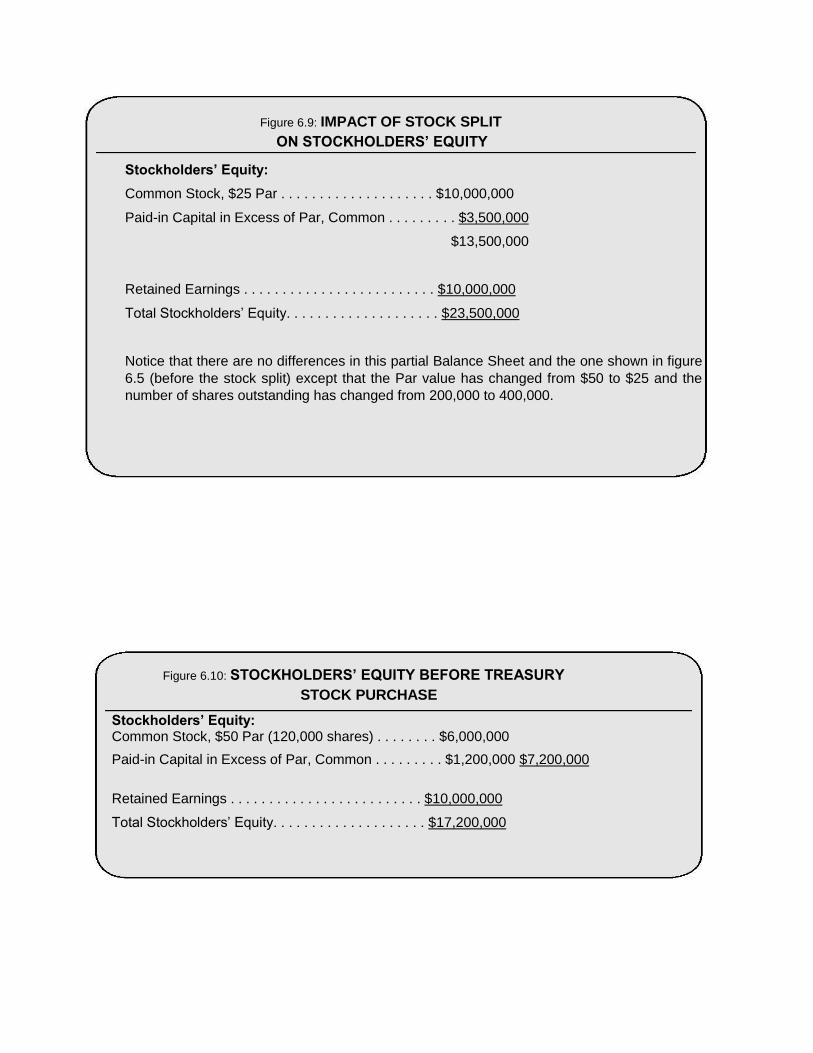
Figure 6.9: IMPACT OF STOCK SPLIT ON STOCKHOLDERS’ EQUITY
Stockholders’ Equity:
Common Stock, $25 Par . . . . . . . . . . . . . . . . . . . . $10,000,000
Paid-in Capital in Excess of Par, Common . . . . . . . . . $3,500,000
$13,500,000
Retained Earnings . . . . . . . . . . . . . . . . . . . . . . . . . $10,000,000
Total Stockholders’ Equity. . . . . . . . . . . . . . . . . . . . $23,500,000
Notice that there are no differences in this partial Balance Sheet and the one shown in figure
6.5 (before the stock split) except that the Par value has changed from $50 to $25 and the
number of shares outstanding has changed from 200,000 to 400,000.
Figure 6.10: STOCKHOLDERS’ EQUITY BEFORE TREASURY STOCK PURCHASE
Stockholders’ Equity: Common Stock, $50 Par (120,000 shares) . . . . . . . . $6,000,000
Paid-in Capital in Excess of Par, Common . . . . . . . . . $1,200,000 $7,200,000
Retained Earnings . . . . . . . . . . . . . . . . . . . . . . . . . $10,000,000
Total Stockholders’ Equity. . . . . . . . . . . . . . . . . . . . $17,200,000
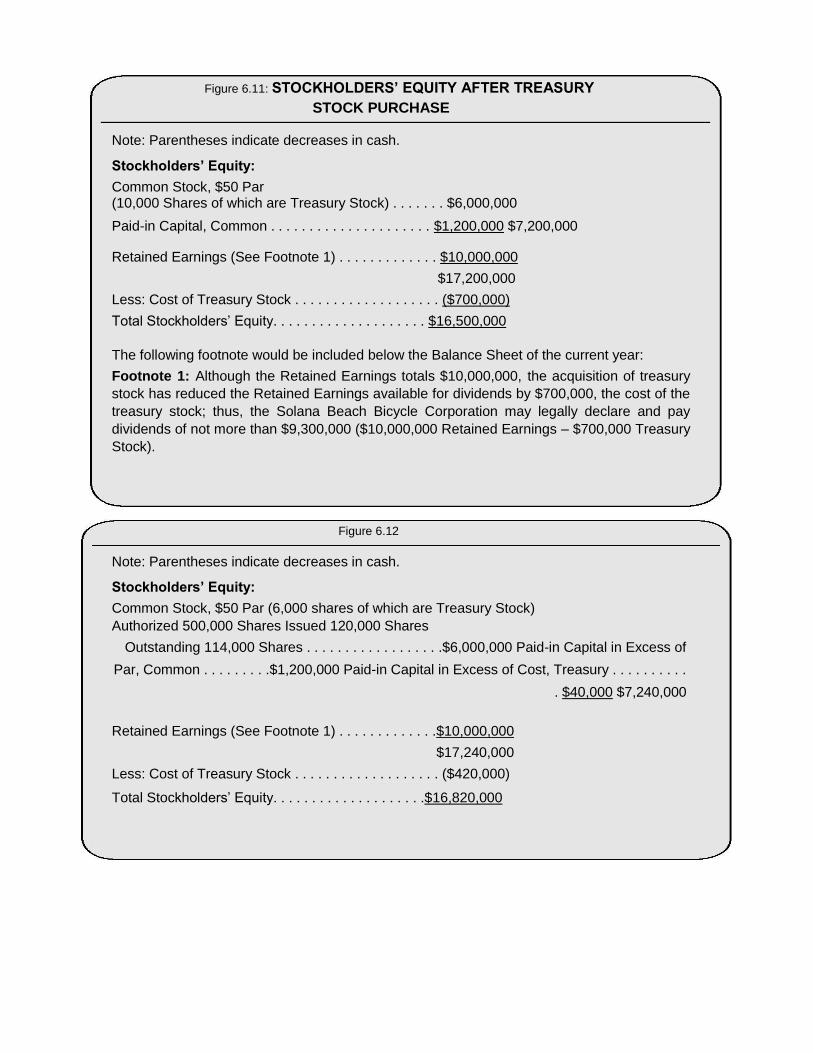
Figure 6.11: STOCKHOLDERS’ EQUITY AFTER TREASURY STOCK PURCHASE
Note: Parentheses indicate decreases in cash.
Stockholders’ Equity:
Common Stock, $50 Par (10,000 Shares of which are Treasury Stock) . . . . . . . $6,000,000
Paid-in Capital, Common . . . . . . . . . . . . . . . . . . . . . $1,200,000 $7,200,000
Retained Earnings (See Footnote 1) . . . . . . . . . . . . . $10,000,000
$17,200,000
Less: Cost of Treasury Stock . . . . . . . . . . . . . . . . . . . ($700,000)
Total Stockholders’ Equity. . . . . . . . . . . . . . . . . . . . $16,500,000
The following footnote would be included below the Balance Sheet of the current year:
Footnote 1: Although the Retained Earnings totals $10,000,000, the acquisition of treasury
stock has reduced the Retained Earnings available for dividends by $700,000, the cost of the
treasury stock; thus, the Solana Beach Bicycle Corporation may legally declare and pay
dividends of not more than $9,300,000 ($10,000,000 Retained Earnings – $700,000 Treasury
Stock).
Figure 6.12
Note: Parentheses indicate decreases in cash.
Stockholders’ Equity:
Common Stock, $50 Par (6,000 shares of which are Treasury Stock) Authorized 500,000 Shares Issued 120,000 Shares
Outstanding 114,000 Shares . . . . . . . . . . . . . . . . . .$6,000,000 Paid-in Capital in Excess of
Par, Common . . . . . . . . .$1,200,000 Paid-in Capital in Excess of Cost, Treasury . . . . . . . . . .
. $40,000 $7,240,000
Retained Earnings (See Footnote 1) . . . . . . . . . . . . .$10,000,000
$17,240,000
Less: Cost of Treasury Stock . . . . . . . . . . . . . . . . . . . ($420,000)
Total Stockholders’ Equity. . . . . . . . . . . . . . . . . . . .$16,820,000
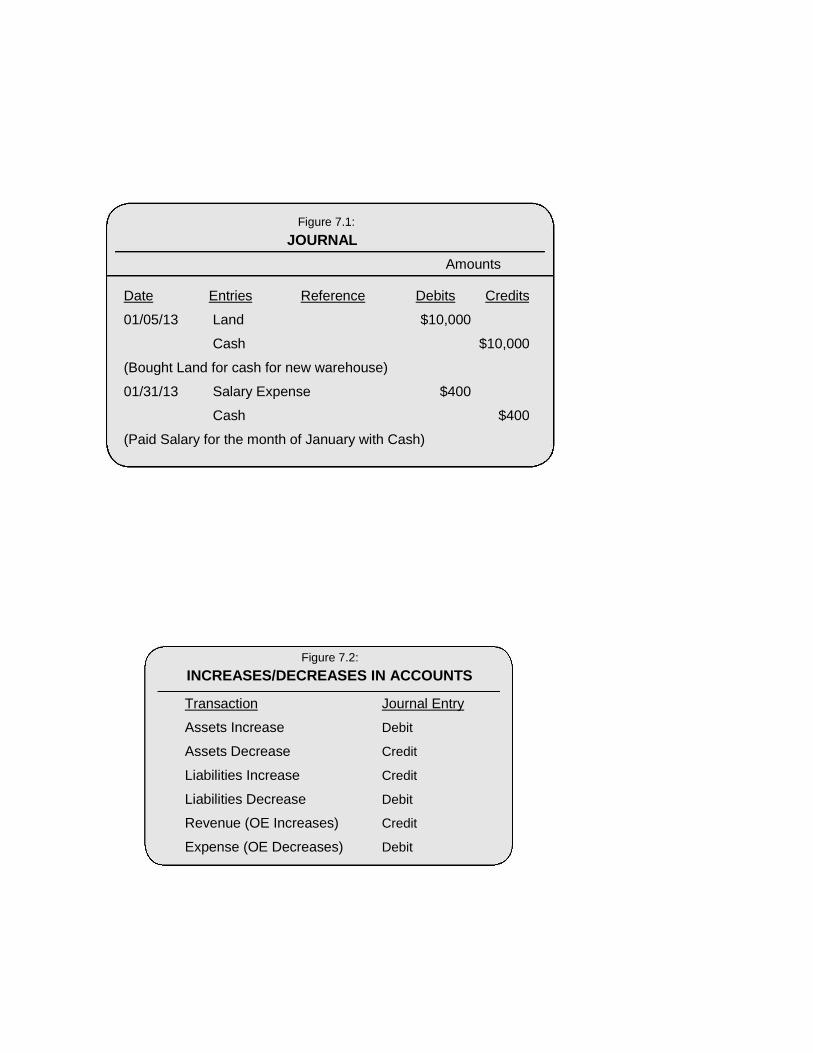
Figure 7.1: JOURNAL
Amounts
Date Entries Reference Debits Credits
01/05/13 Land $10,000
Cash $10,000
(Bought Land for cash for new warehouse)
01/31/13 Salary Expense $400
Cash $400
(Paid Salary for the month of January with Cash)
Figure 7.2: INCREASES/DECREASES IN ACCOUNTS
Transaction Journal Entry
Assets Increase Debit
Assets Decrease Credit
Liabilities Increase Credit
Liabilities Decrease Debit
Revenue (OE Increases) Credit
Expense (OE Decreases) Debit
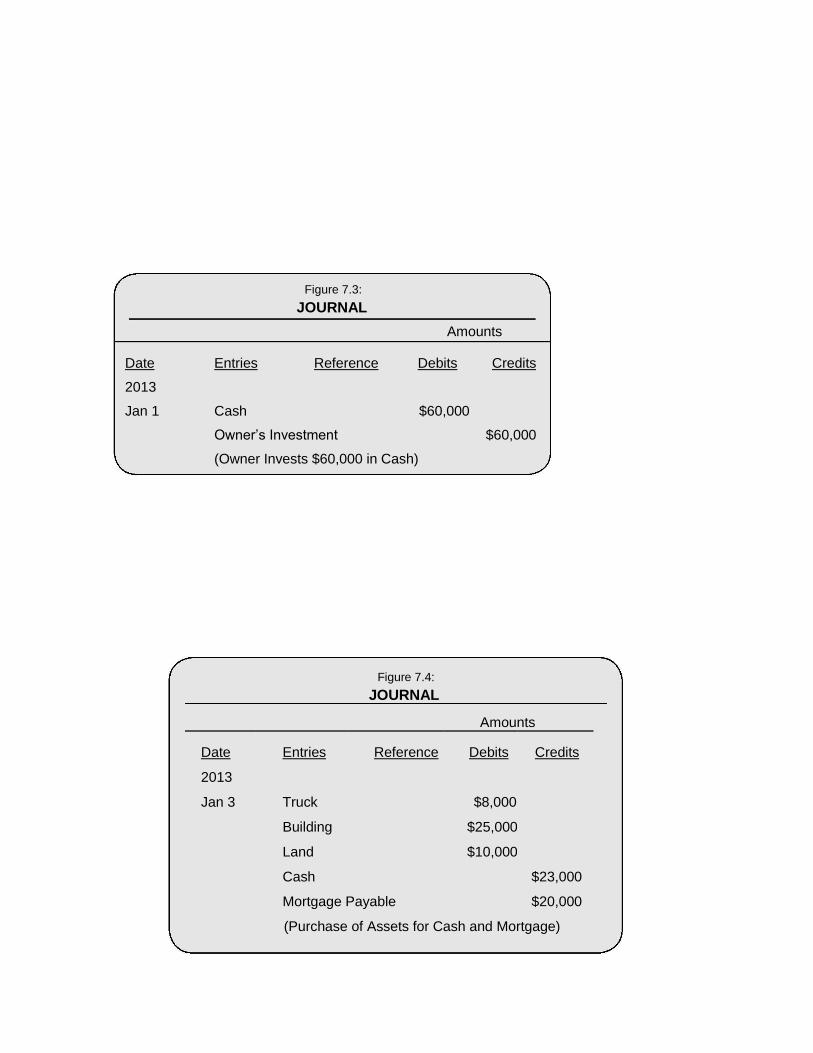
Figure 7.3: JOURNAL
Amounts
Date Entries Reference Debits Credits
2013
Jan 1 Cash $60,000
Owner’s Investment $60,000
(Owner Invests $60,000 in Cash)
Figure 7.4: JOURNAL
Amounts
Date Entries Reference Debits Credits
2013
Jan 3 Truck $8,000
Building $25,000
Land $10,000
Cash $23,000
Mortgage Payable $20,000
(Purchase of Assets for Cash and Mortgage)
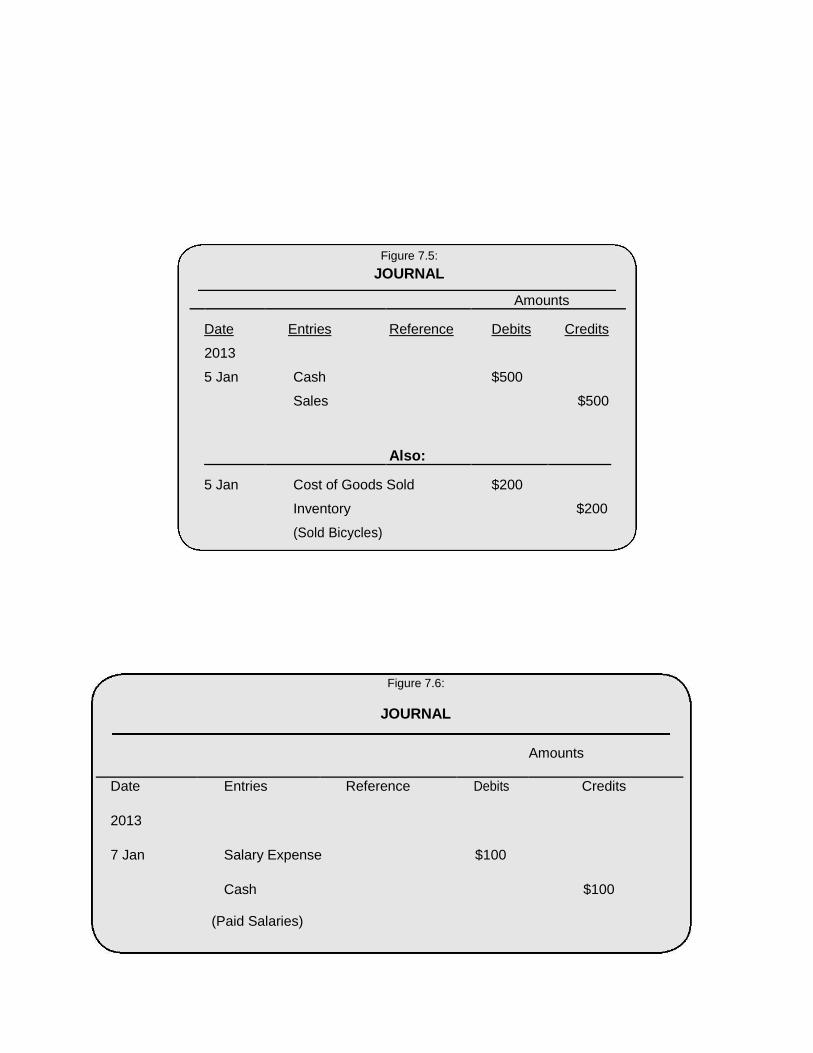
Figure 7.5: JOURNAL
Amounts
Date Entries Reference Debits Credits
2013
5 Jan Cash $500
Sales $500
Also:
5 Jan Cost of Goods Sold $200
Inventory $200
(Sold Bicycles)
Figure 7.6:
JOURNAL
(Paid Salaries)
Amounts
Date Entries Reference Debits Credits
2013
7 Jan Salary Expense $100
Cash $100
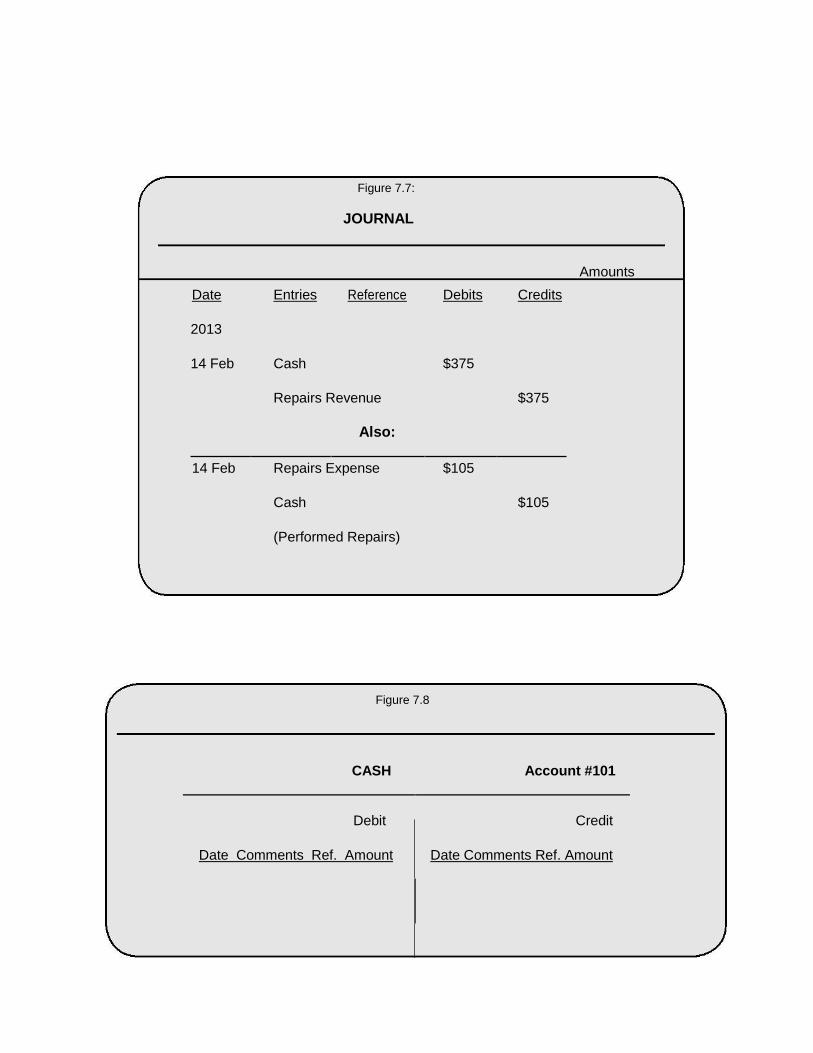
Figure 7.7:
JOURNAL
Amounts
Figure 7.8
Date Entries Reference Debits Credits
2013
14 Feb Cash $375
Repairs Revenue $375
Also:
14 Feb Repairs Expense $105
Cash $105
(Performed Repairs)
CASH Account #101
Debit
Credit
Date Comments Ref. Amount Date Comments Ref. Amount
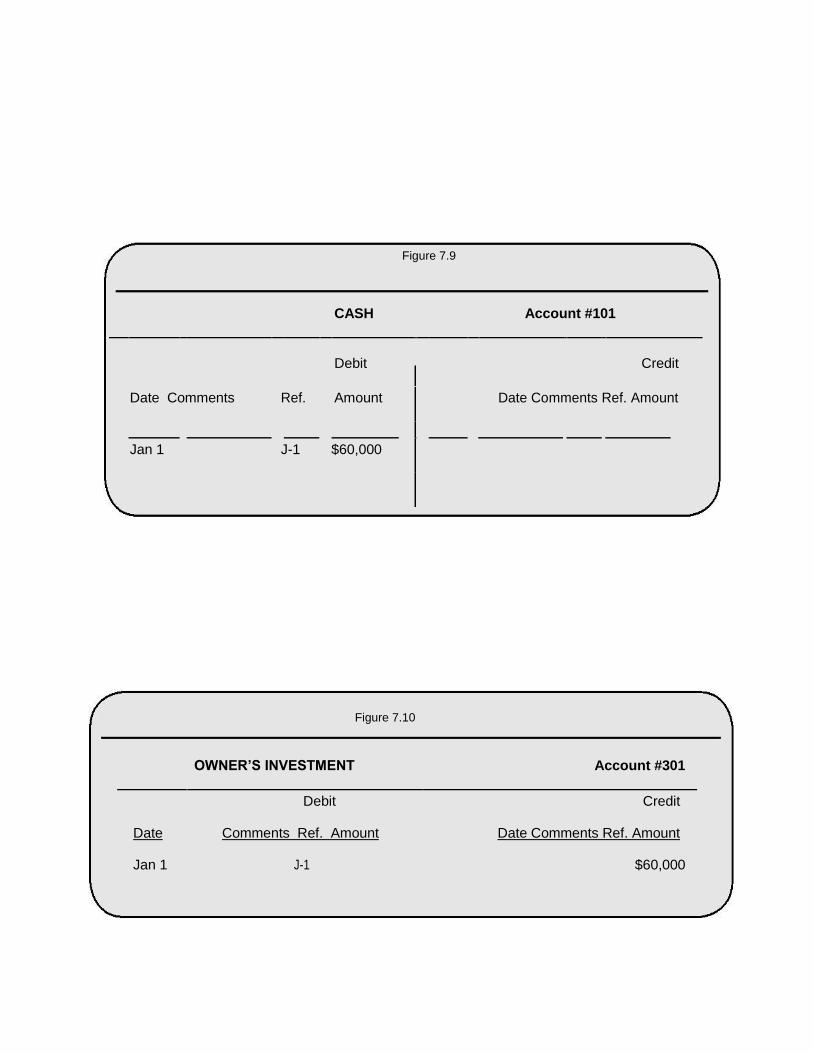
Figure 7.9
CASH Account #101
Debit
Credit
Date Comments Ref. Amount Date Comments Ref. Amount
Jan 1 J-1 $60,000
Figure 7.10
OWNER’S INVESTMENT Account #301
Debit Credit
Date Comments Ref. Amount Date Comments Ref. Amount
Jan 1 J-1 $60,000
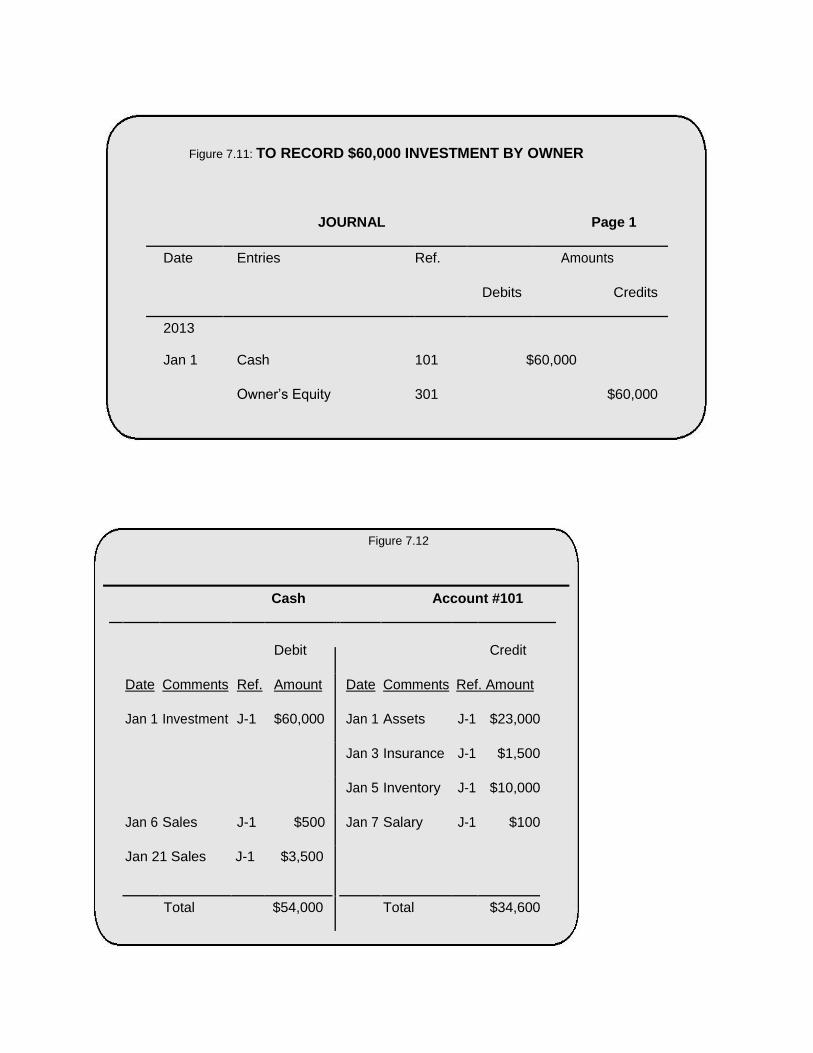
Figure 7.11: TO RECORD $60,000 INVESTMENT BY OWNER
Figure 7.12
Cash Account #101
Debit
Credit
Date Comments Ref. Amount Date Comments Ref. Amount
Jan 1 Investment J-1 $60,000 Jan 1 Assets J-1 $23,000
Jan 3 Insurance J-1 $1,500
Jan 5 Inventory J-1 $10,000
Jan 6 Sales J-1 $500 Jan 7 Salary J-1 $100
Jan 21 Sales J-1 $3,500
Total $54,000 Total $34,600
JOURNAL Page 1
Date Entries Ref. Amounts
Debits Credits
2013
Jan 1 Cash 101 $60,000
Owner’s Equity 301 $60,000
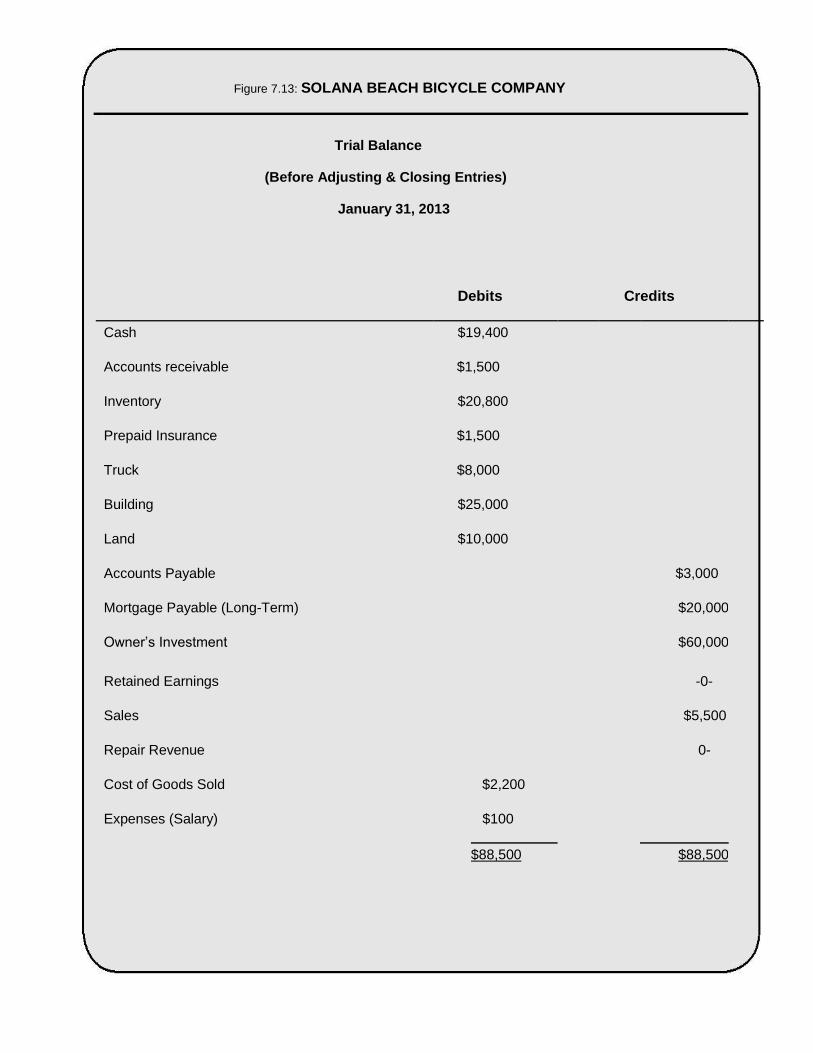
Figure 7.13: SOLANA BEACH BICYCLE COMPANY
Trial Balance
(Before Adjusting & Closing Entries)
January 31, 2013
Debits Credits
Cash $19,400
Accounts receivable $1,500
Inventory $20,800
Prepaid Insurance $1,500
Truck $8,000
Building $25,000
Land $10,000
Accounts Payable $3,000
Mortgage Payable (Long-Term) $20,000
Owner’s Investment $60,000
Retained Earnings -0-
Sales $5,500
Repair Revenue 0-
Cost of Goods Sold $2,200
Expenses (Salary) $100
$88,500 $88,500
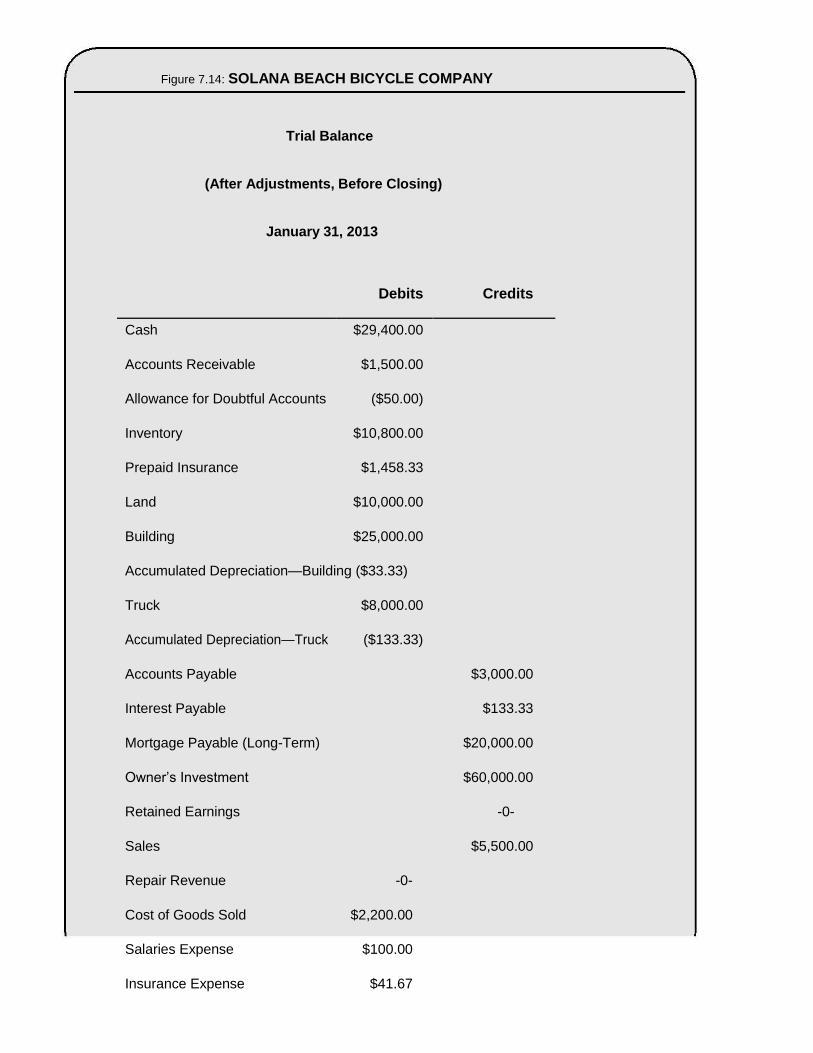
Figure 7.14: SOLANA BEACH BICYCLE COMPANY
Trial Balance
(After Adjustments, Before Closing)
January 31, 2013
Debits Credits
Cash $29,400.00
Accounts Receivable $1,500.00
Allowance for Doubtful Accounts ($50.00)
Inventory $10,800.00
Prepaid Insurance $1,458.33
Land $10,000.00
Building $25,000.00
Accumulated Depreciation—Building ($33.33)
Truck $8,000.00
Accumulated Depreciation—Truck ($133.33)
Accounts Payable $3,000.00
Interest Payable $133.33
Mortgage Payable (Long-Term) $20,000.00
Owner’s Investment $60,000.00
Retained Earnings -0-
Sales $5,500.00
Repair Revenue -0-
Cost of Goods Sold $2,200.00
Salaries Expense $100.00
Insurance Expense $41.67
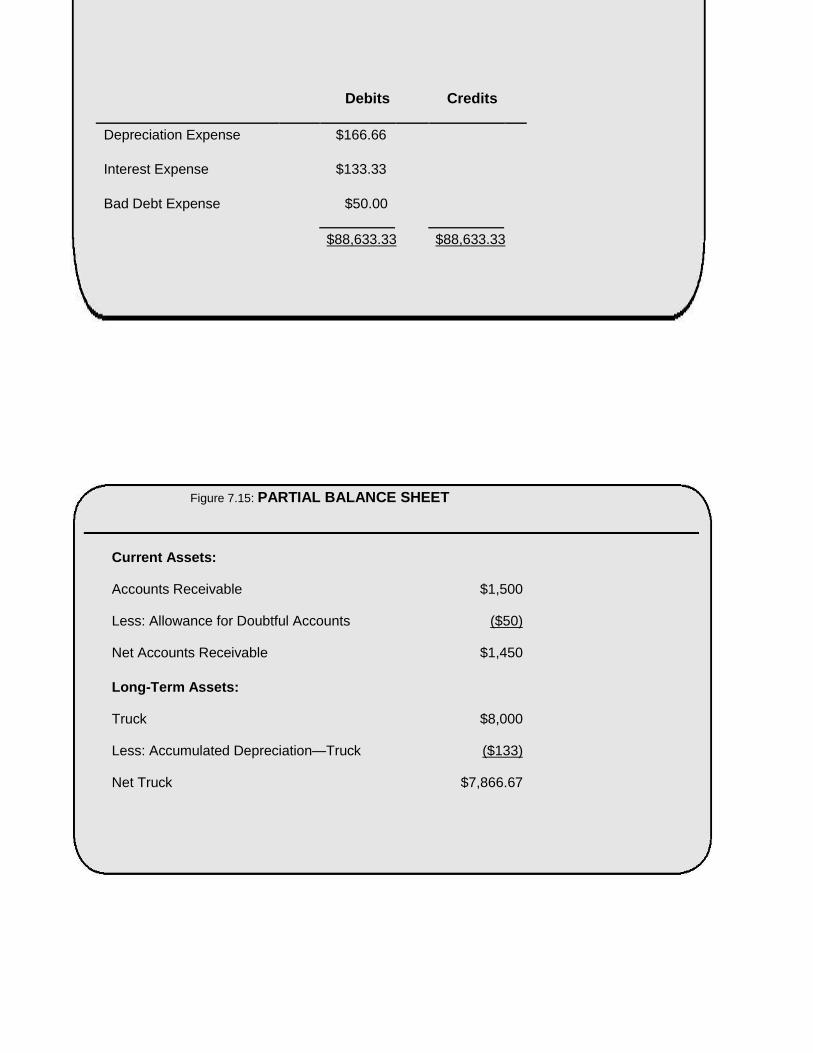
Debits Credits
Depreciation Expense $166.66
Interest Expense $133.33
Bad Debt Expense $50.00
$88,633.33 $88,633.33
Figure 7.15: PARTIAL BALANCE SHEET
Current Assets:
Accounts Receivable $1,500
Less: Allowance for Doubtful Accounts ($50)
Net Accounts Receivable $1,450
Long-Term Assets:
Truck $8,000
Less: Accumulated Depreciation—Truck ($133)
Net Truck $7,866.67
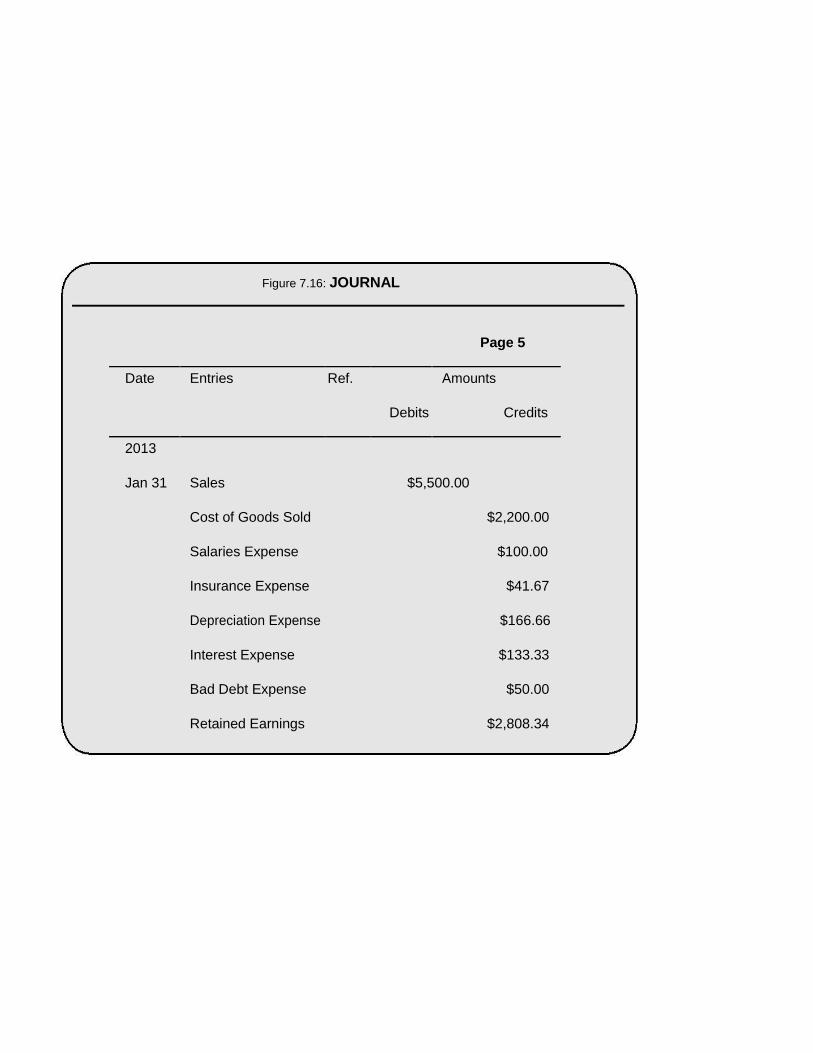
Figure 7.16: JOURNAL
Page 5
Date Entries Ref. Amounts
Debits Credits
2013
Jan 31 Sales $5,500.00
Cost of Goods Sold $2,200.00
Salaries Expense $100.00
Insurance Expense $41.67
Depreciation Expense $166.66
Interest Expense $133.33
Bad Debt Expense $50.00
Retained Earnings $2,808.34
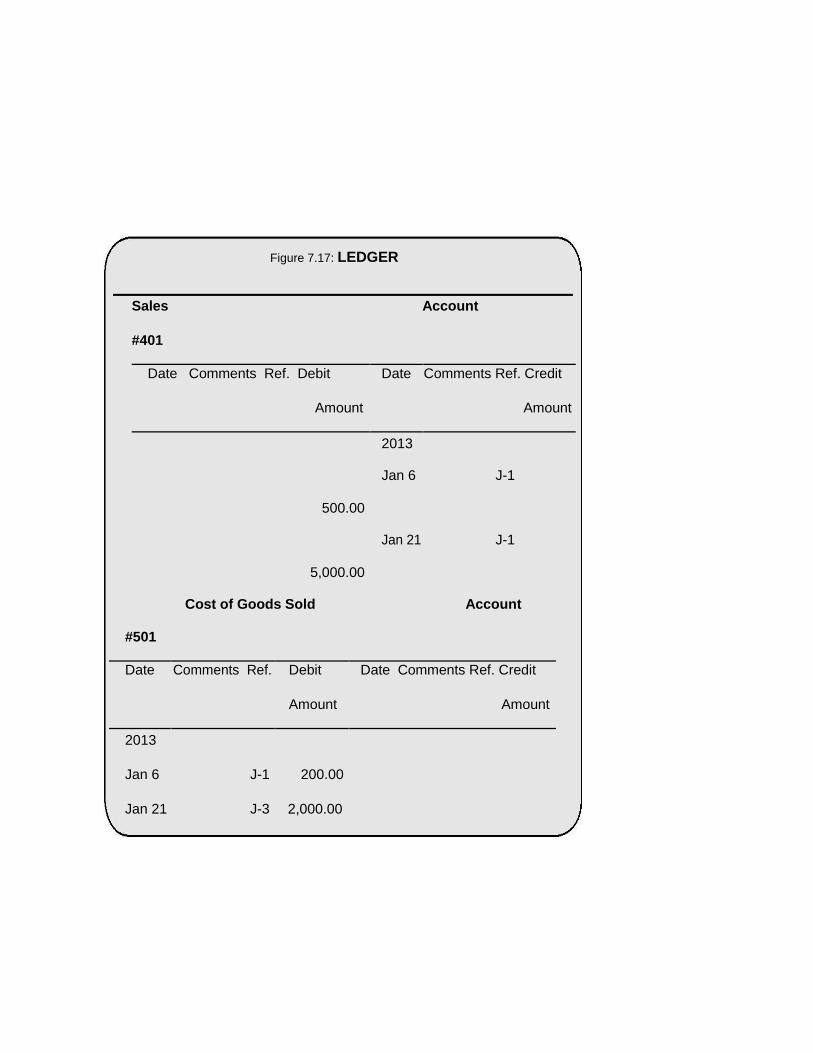
Figure 7.17: LEDGER
#501
Cost of Goods Sold Account
Date Comments Ref. Debit Date Comments Ref. Credit
Amount Amount
2013
Jan 6 J-1 200.00
Jan 21 J-3 2,000.00
Sales Account
#401
Date Comments Ref. Debit Date Comments Ref. Credit
Amount Amount
2013
500.00
Jan 6 J-1
5,000.00
Jan 21 J-1
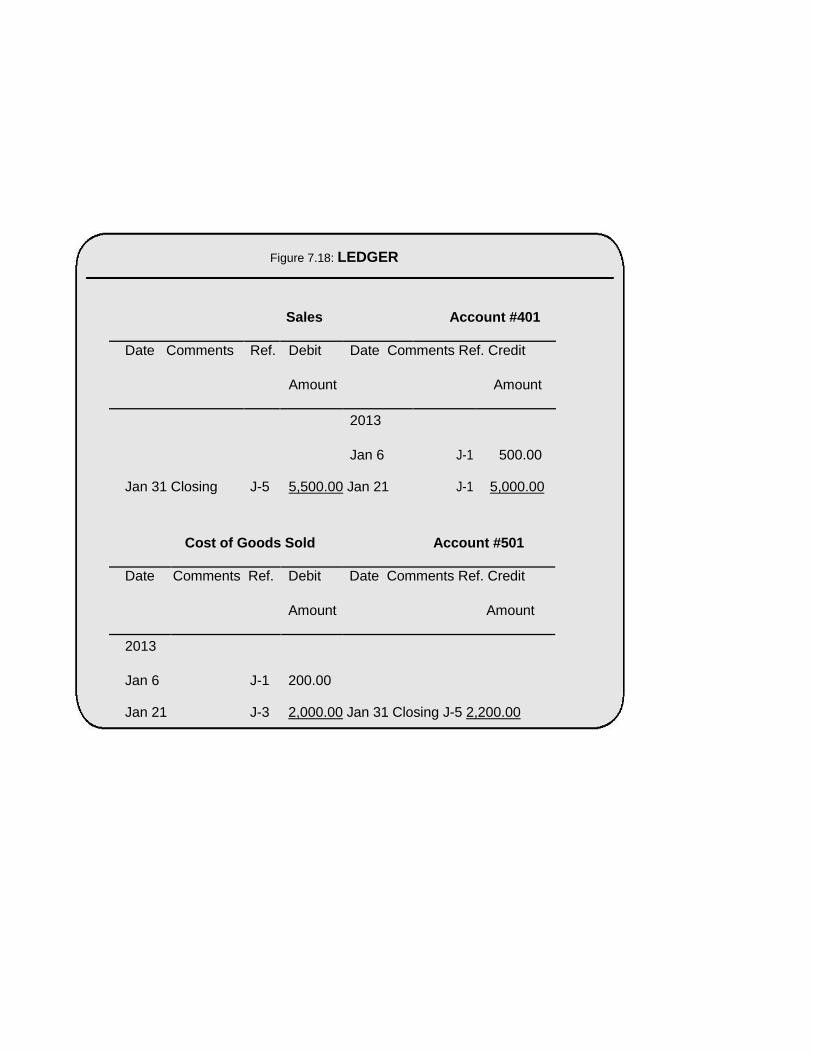
Figure 7.18: LEDGER
Sales Account #401
Date Comments Ref. Debit Date Comments Ref. Credit
Amount Amount
2013
Jan 6 J-1 500.00
Jan 31 Closing J-5 5,500.00 Jan 21 J-1 5,000.00
Cost of Goods Sold Account #501
Date Comments Ref. Debit Date Comments Ref. Credit
Amount Amount
2013
Jan 6 J-1 200.00
Jan 21 J-3 2,000.00 Jan 31 Closing J-5 2,200.00
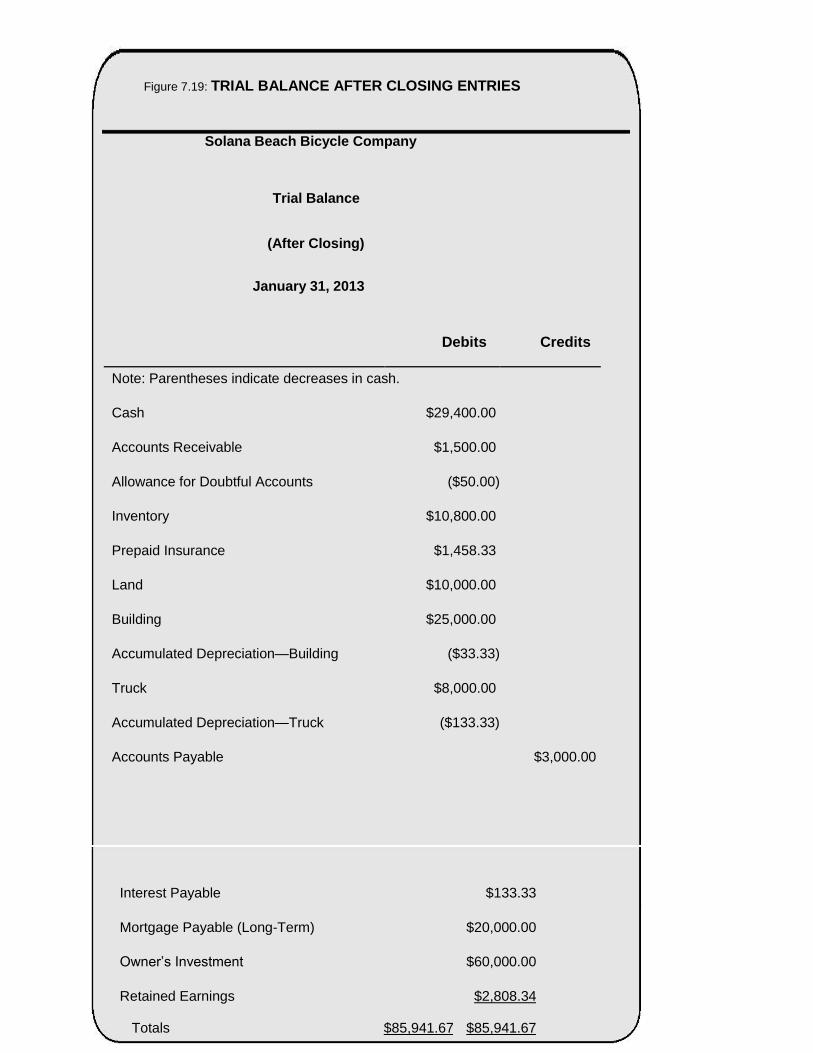
Figure 7.19: TRIAL BALANCE AFTER CLOSING ENTRIES
Solana Beach Bicycle Company
Trial Balance
(After Closing)
January 31, 2013
Debits Credits
Note: Parentheses indicate decreases in cash.
Cash $29,400.00
Accounts Receivable $1,500.00
Allowance for Doubtful Accounts ($50.00)
Inventory $10,800.00
Prepaid Insurance $1,458.33
Land $10,000.00
Building $25,000.00
Accumulated Depreciation—Building ($33.33)
Truck $8,000.00
Accumulated Depreciation—Truck ($133.33)
Accounts Payable $3,000.00
Interest Payable $133.33
Mortgage Payable (Long-Term) $20,000.00
Owner’s Investment $60,000.00
Retained Earnings $2,808.34
Totals $85,941.67 $85,941.67
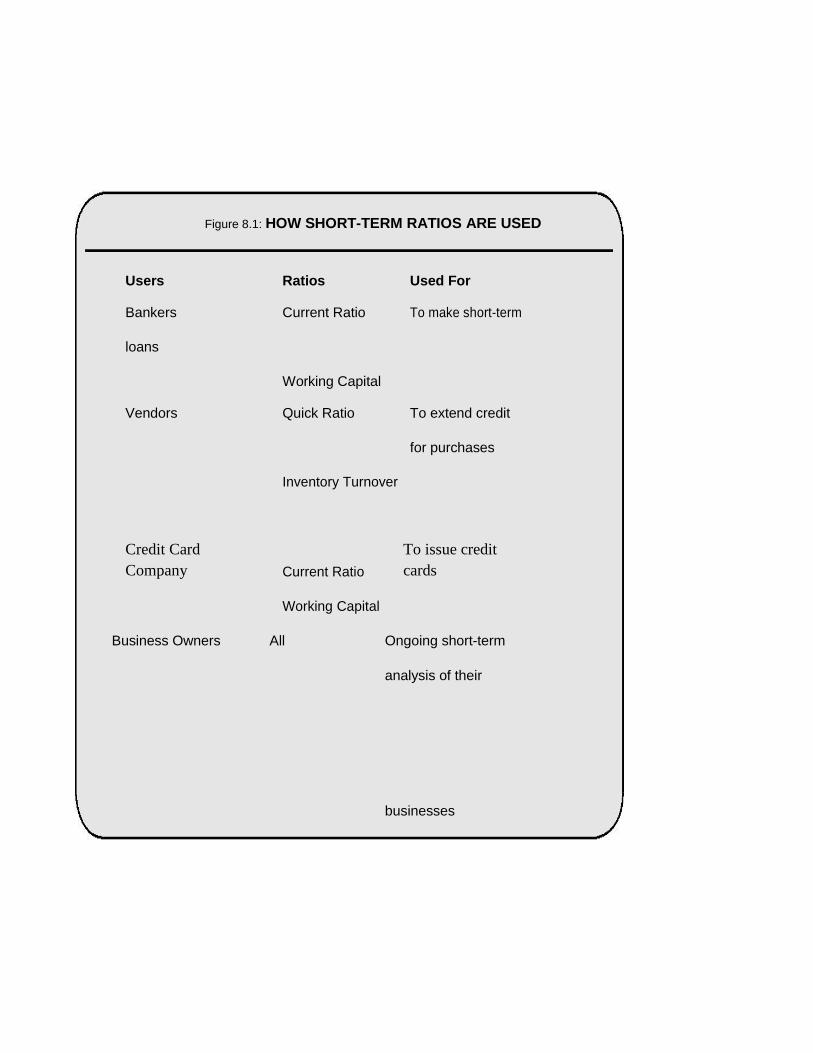
Figure 8.1: HOW SHORT-TERM RATIOS ARE USED
Users Ratios Used For
Bankers Current Ratio To make short-term
loans
Working Capital
Vendors Quick Ratio To extend credit
for purchases
Inventory Turnover
Credit Card
Company Current Ratio
To issue credit
cards
Working Capital
Business Owners All Ongoing short-term
analysis of their
businesses
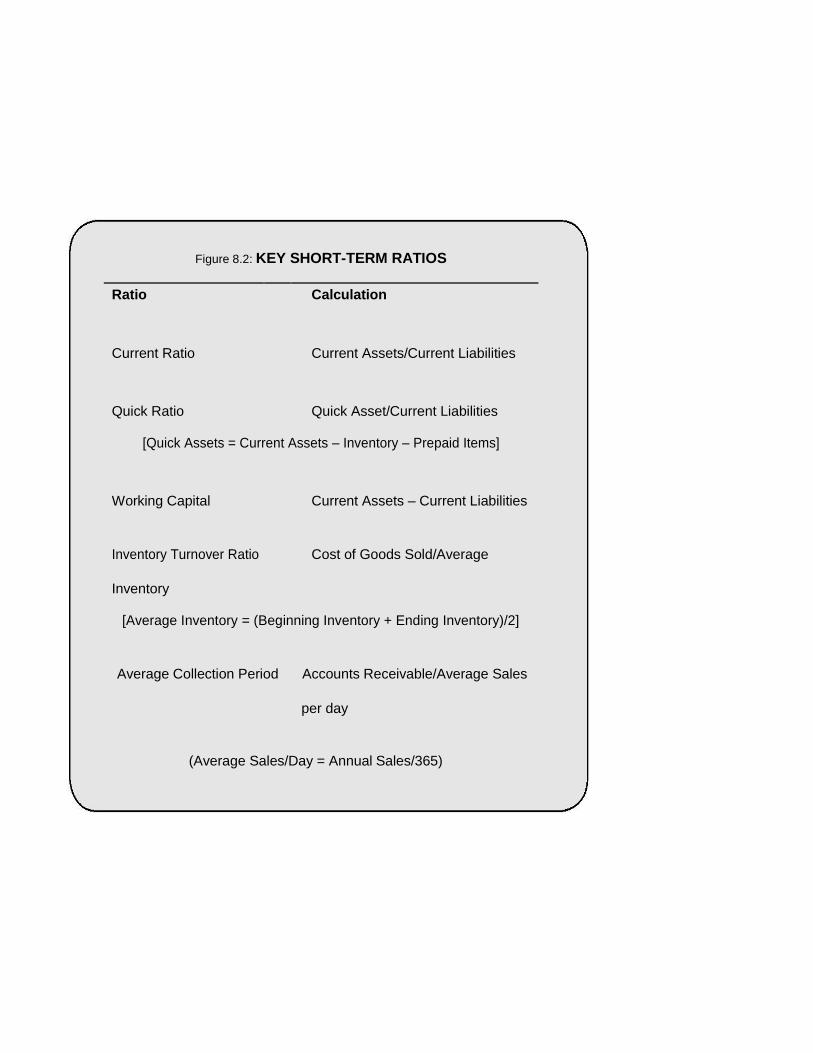
Figure 8.2: KEY SHORT-TERM RATIOS
Ratio Calculation
Current Ratio Current Assets/Current Liabilities
Quick Ratio Quick Asset/Current Liabilities
[Quick Assets = Current Assets – Inventory – Prepaid Items]
Working Capital Current Assets – Current Liabilities
Inventory Turnover Ratio Cost of Goods Sold/Average
Inventory
[Average Inventory = (Beginning Inventory + Ending Inventory)/2]
Average Collection Period Accounts Receivable/Average Sales
per day
(Average Sales/Day = Annual Sales/365)
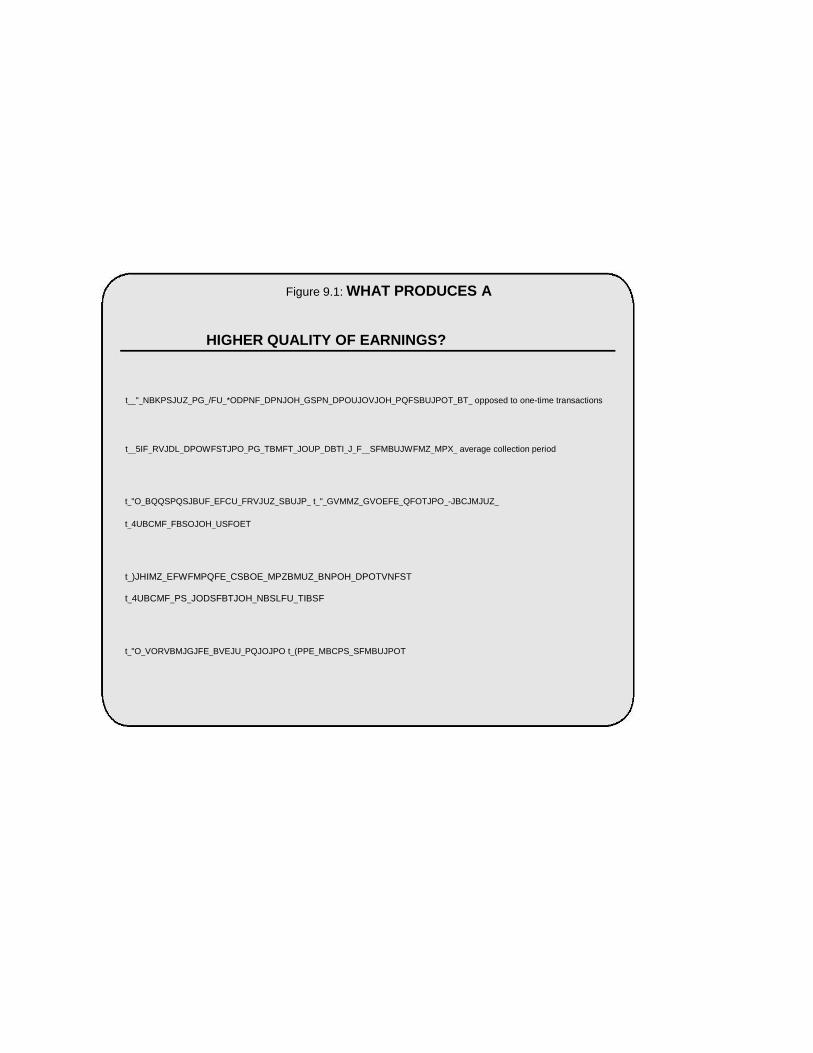
Figure 9.1: WHAT PRODUCES A
HIGHER QUALITY OF EARNINGS?
t__"_NBKPSJUZ_PG_/FU_*ODPNF_DPNJOH_GSPN_DPOUJOVJOH_PQFSBUJPOT_BT_ opposed to one-time transactions
t__5IF_RVJDL_DPOWFSTJPO_PG_TBMFT_JOUP_DBTI_J_F__SFMBUJWFMZ_MPX_ average collection period
t_"O_BQQSPQSJBUF_EFCU_FRVJUZ_SBUJP_ t_"_GVMMZ_GVOEFE_QFOTJPO_-JBCJMJUZ_
t_4UBCMF_FBSOJOH_USFOET
t_)JHIMZ_EFWFMPQFE_CSBOE_MPZBMUZ_BNPOH_DPOTVNFST
t_4UBCMF_PS_JODSFBTJOH_NBSLFU_TIBSF
t_"O_VORVBMJGJFE_BVEJU_PQJOJPO t_(PPE_MBCPS_SFMBUJPOT
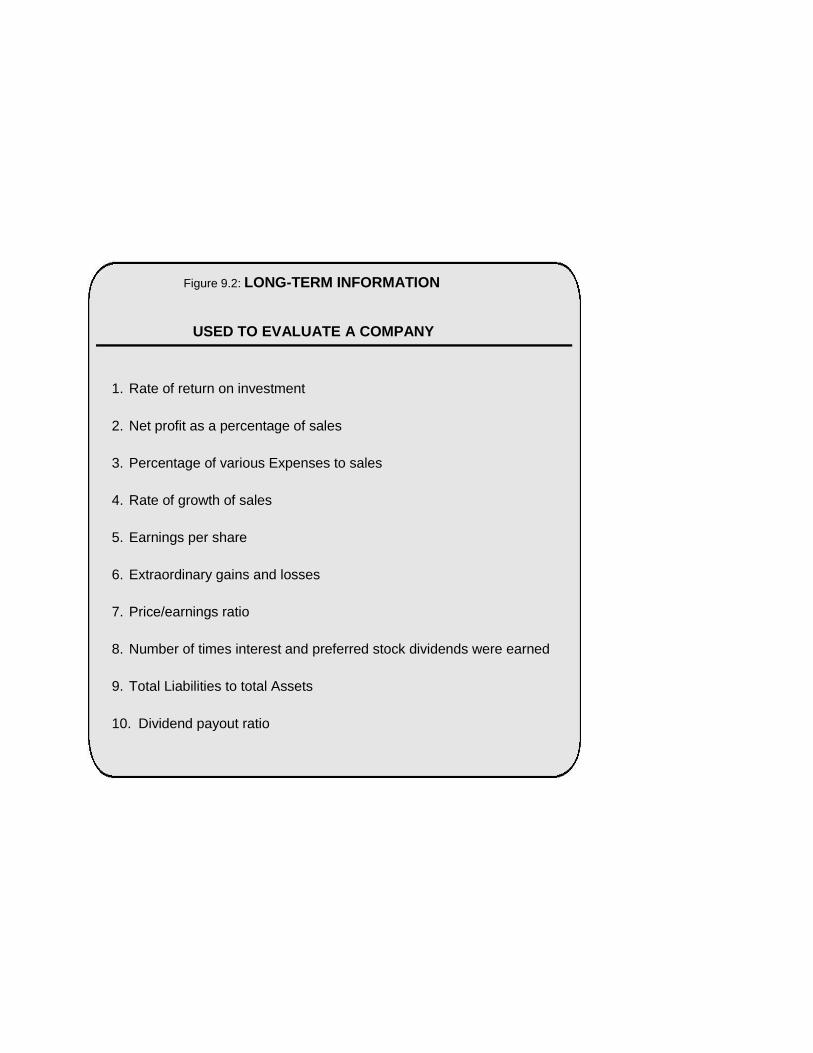
Figure 9.2: LONG-TERM INFORMATION
USED TO EVALUATE A COMPANY
1. Rate of return on investment
2. Net profit as a percentage of sales
3. Percentage of various Expenses to sales
4. Rate of growth of sales
5. Earnings per share
6. Extraordinary gains and losses
7. Price/earnings ratio
8. Number of times interest and preferred stock dividends were earned
9. Total Liabilities to total Assets
10. Dividend payout ratio
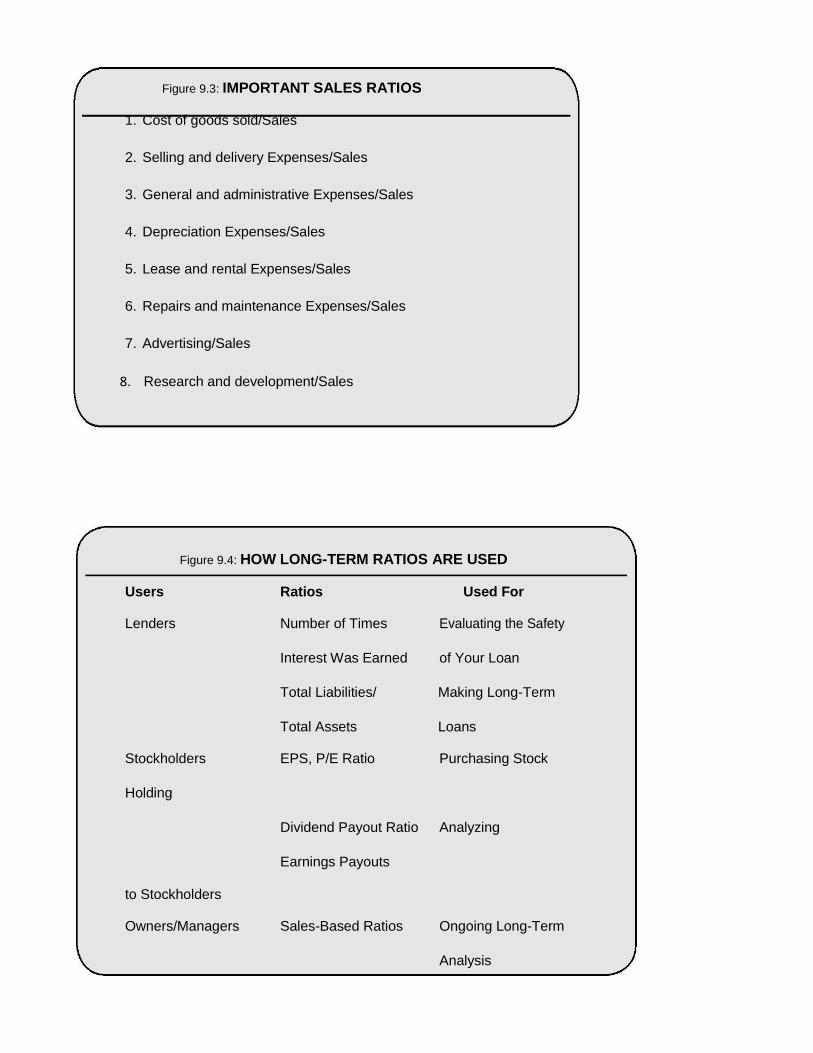
Figure 9.3: IMPORTANT SALES RATIOS
1. Cost of goods sold/Sales
2. Selling and delivery Expenses/Sales
3. General and administrative Expenses/Sales
4. Depreciation Expenses/Sales
5. Lease and rental Expenses/Sales
6. Repairs and maintenance Expenses/Sales
7. Advertising/Sales
8. Research and development/Sales
Figure 9.4: HOW LONG-TERM RATIOS ARE USED
Users Ratios Used For
Lenders Number of Times Evaluating the Safety
Interest Was Earned of Your Loan
Total Liabilities/ Making Long-Term
Total Assets Loans
Stockholders EPS, P/E Ratio Purchasing Stock
Holding
Dividend Payout Ratio Analyzing
to Stockholders
Earnings Payouts
Owners/Managers Sales-Based Ratios Ongoing Long-Term
Analysis
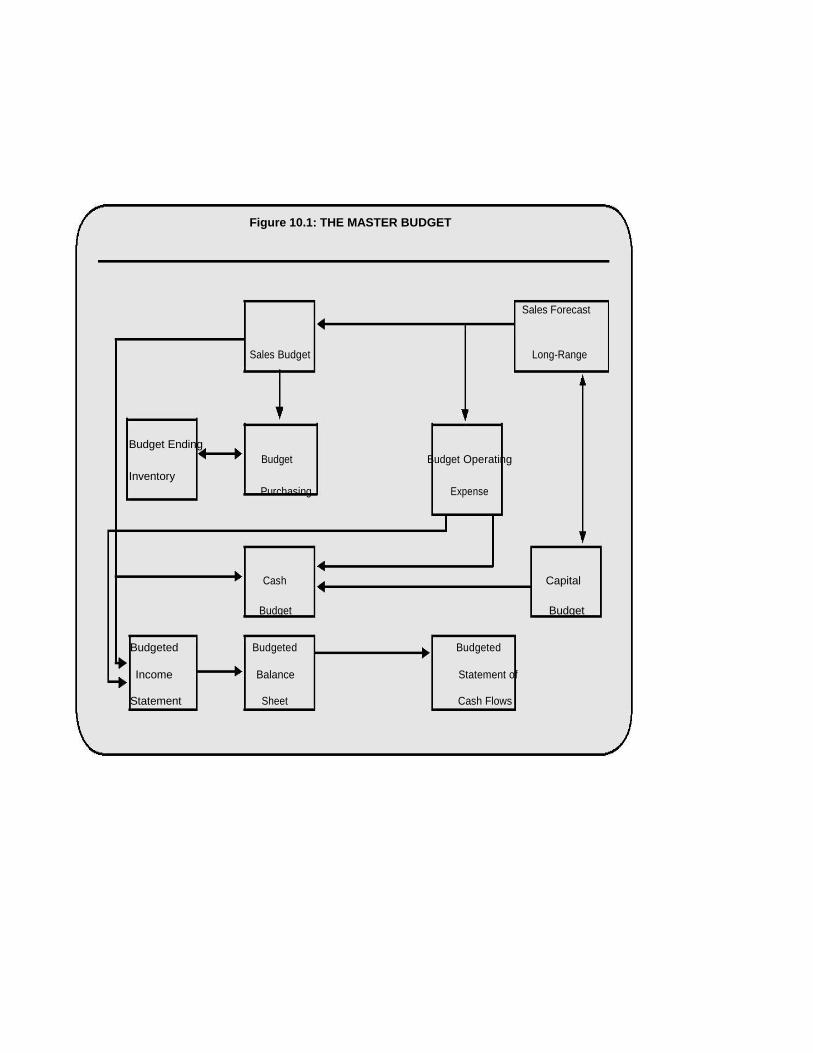
Figure 10.1: THE MASTER BUDGET
Sales Forecast
Sales Budget Long-Range
Budget Ending Budget Budget Operating
Inventory
Purchasing Expense
Cash Capital
Budget Budget
Budgeted Budgeted Budgeted
Income Balance Statement of
Statement Sheet Cash Flows
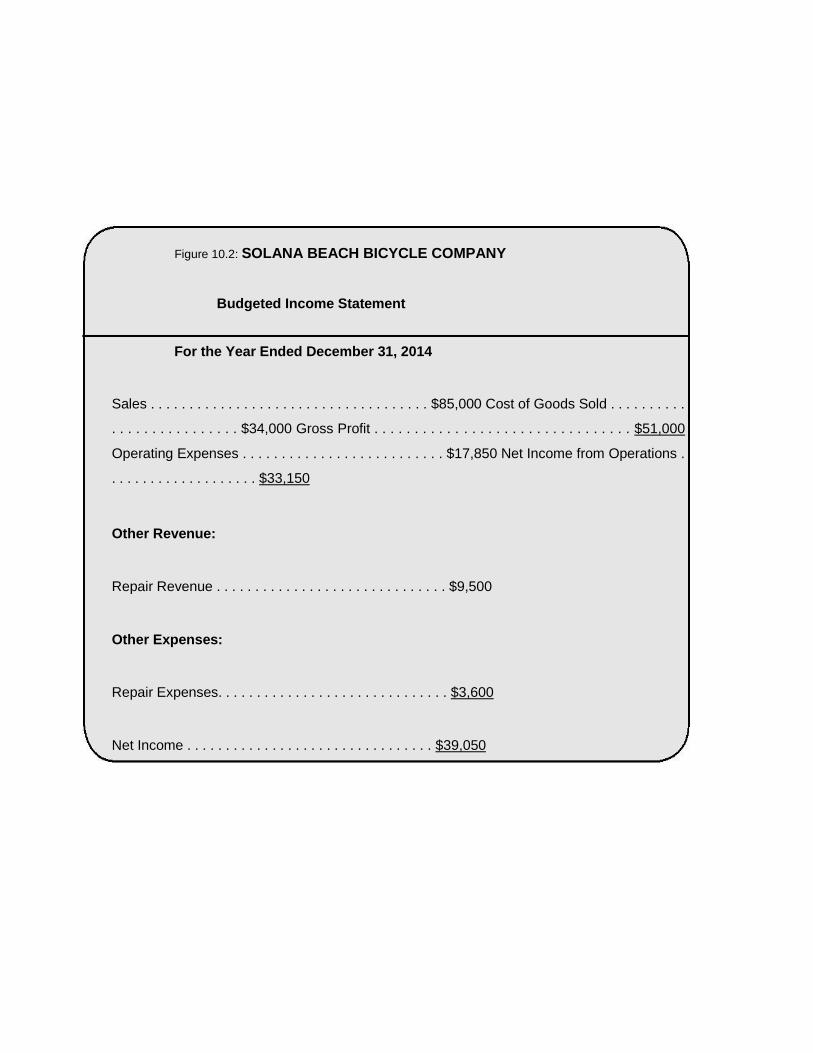
Figure 10.2: SOLANA BEACH BICYCLE COMPANY
Budgeted Income Statement
For the Year Ended December 31, 2014
Sales . . . . . . . . . . . . . . . . . . . . . . . . . . . . . . . . . . . . $85,000 Cost of Goods Sold . . . . . . . . . .
. . . . . . . . . . . . . . . . $34,000 Gross Profit . . . . . . . . . . . . . . . . . . . . . . . . . . . . . . . . $51,000
Operating Expenses . . . . . . . . . . . . . . . . . . . . . . . . . . $17,850 Net Income from Operations .
. . . . . . . . . . . . . . . . . . . $33,150
Other Revenue:
Repair Revenue . . . . . . . . . . . . . . . . . . . . . . . . . . . . . . $9,500
Other Expenses:
Repair Expenses. . . . . . . . . . . . . . . . . . . . . . . . . . . . . . $3,600
Net Income . . . . . . . . . . . . . . . . . . . . . . . . . . . . . . . . $39,050
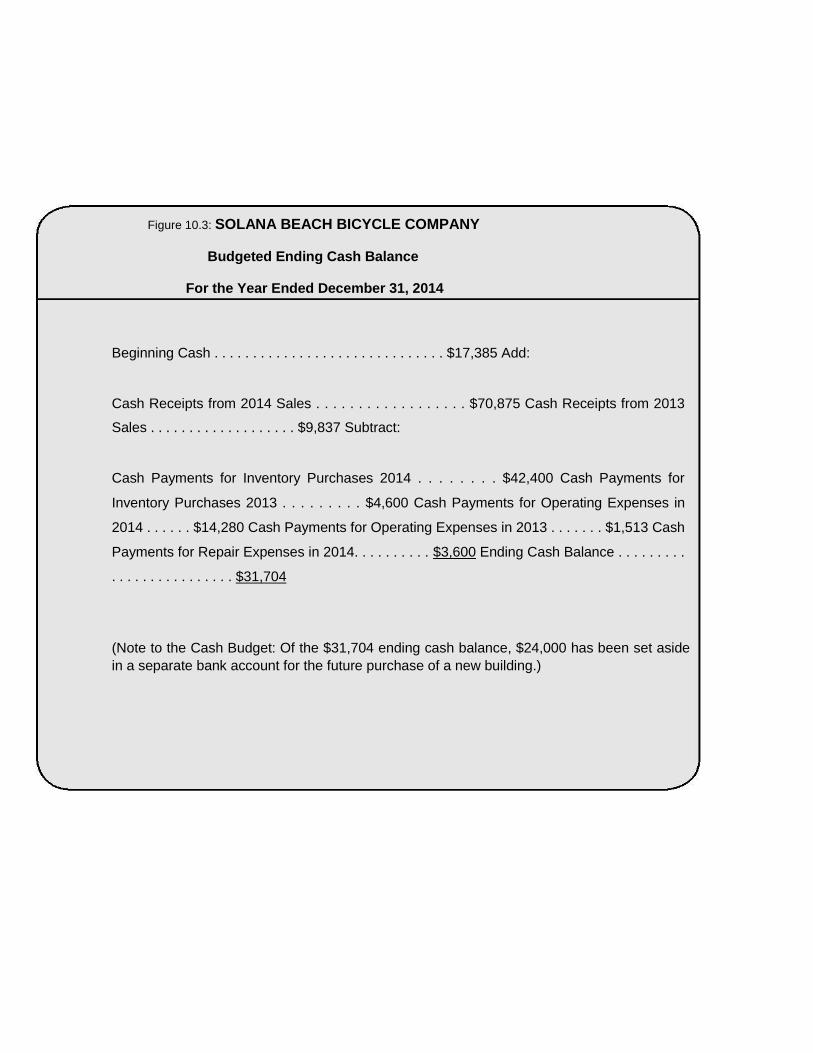
Figure 10.3: SOLANA BEACH BICYCLE COMPANY
Budgeted Ending Cash Balance
For the Year Ended December 31, 2014
Beginning Cash . . . . . . . . . . . . . . . . . . . . . . . . . . . . . . $17,385 Add:
Cash Receipts from 2014 Sales . . . . . . . . . . . . . . . . . . $70,875 Cash Receipts from 2013
Sales . . . . . . . . . . . . . . . . . . . $9,837 Subtract:
Cash Payments for Inventory Purchases 2014 . . . . . . . . $42,400 Cash Payments for
Inventory Purchases 2013 . . . . . . . . . $4,600 Cash Payments for Operating Expenses in
2014 . . . . . . $14,280 Cash Payments for Operating Expenses in 2013 . . . . . . . $1,513 Cash
Payments for Repair Expenses in 2014. . . . . . . . . . $3,600 Ending Cash Balance . . . . . . . . .
. . . . . . . . . . . . . . . . $31,704
(Note to the Cash Budget: Of the $31,704 ending cash balance, $24,000 has been set aside
in a separate bank account for the future purchase of a new building.)
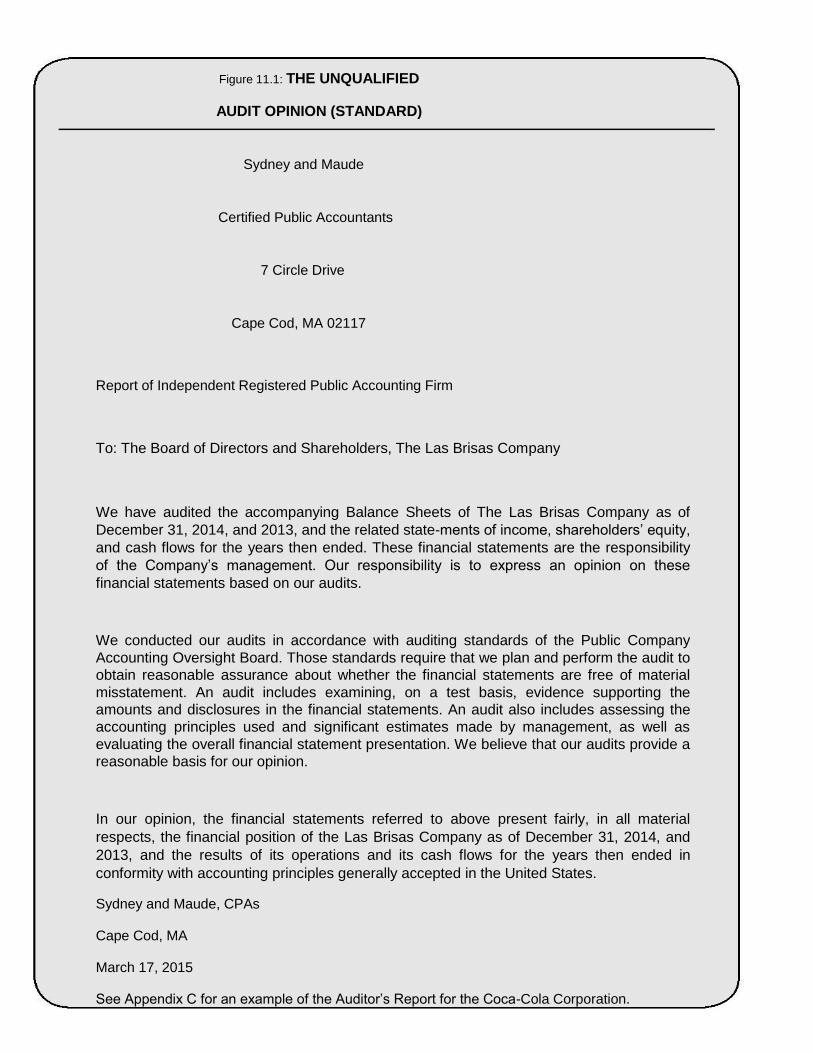
Figure 11.1: THE UNQUALIFIED
AUDIT OPINION (STANDARD)
Sydney and Maude
Certified Public Accountants
7 Circle Drive
Cape Cod, MA 02117
Report of Independent Registered Public Accounting Firm
To: The Board of Directors and Shareholders, The Las Brisas Company
We have audited the accompanying Balance Sheets of The Las Brisas Company as of
December 31, 2014, and 2013, and the related state-ments of income, shareholders’ equity,
and cash flows for the years then ended. These financial statements are the responsibility
of the Company’s management. Our responsibility is to express an opinion on these
financial statements based on our audits.
We conducted our audits in accordance with auditing standards of the Public Company
Accounting Oversight Board. Those standards require that we plan and perform the audit to
obtain reasonable assurance about whether the financial statements are free of material
misstatement. An audit includes examining, on a test basis, evidence supporting the
amounts and disclosures in the financial statements. An audit also includes assessing the
accounting principles used and significant estimates made by management, as well as
evaluating the overall financial statement presentation. We believe that our audits provide a
reasonable basis for our opinion.
In our opinion, the financial statements referred to above present fairly, in all material
respects, the financial position of the Las Brisas Company as of December 31, 2014, and
2013, and the results of its operations and its cash flows for the years then ended in
conformity with accounting principles generally accepted in the United States.
Sydney and Maude, CPAs
Cape Cod, MA
March 17, 2015
See Appendix C for an example of the Auditor’s Report for the Coca-Cola Corporation.
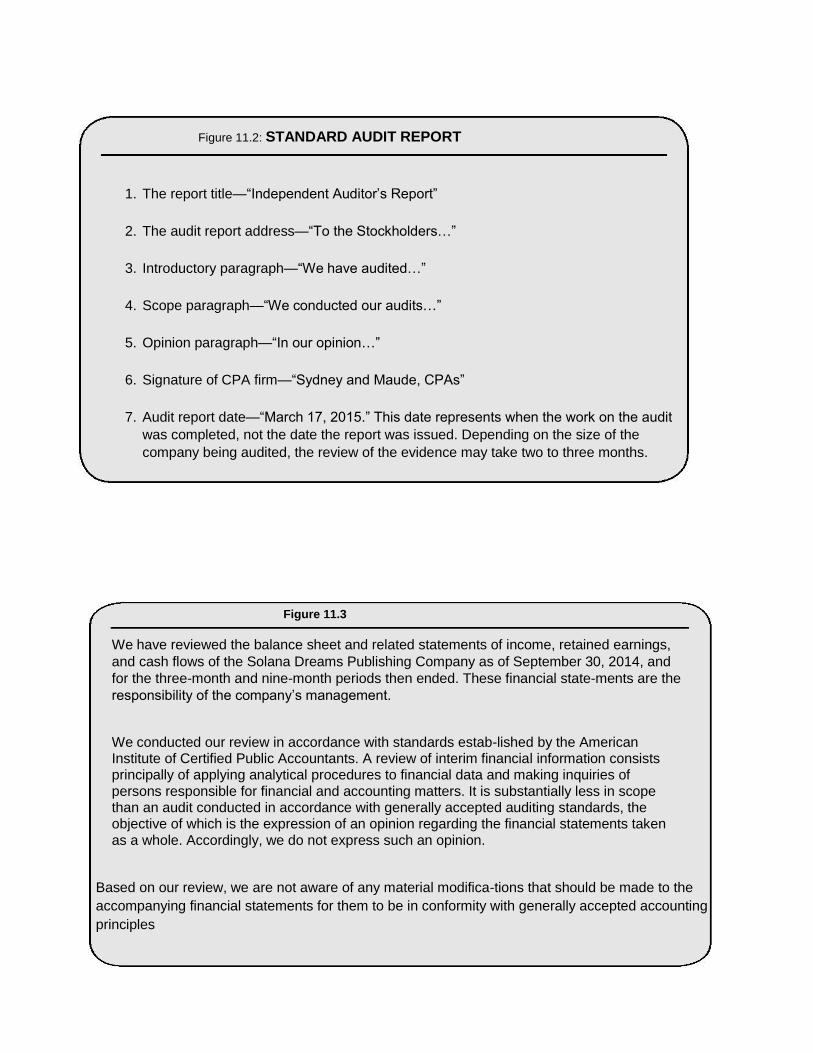
Figure 11.2: STANDARD AUDIT REPORT
1. The report title—―Independent Auditor’s Report‖
2. The audit report address—―To the Stockholders…‖
3. Introductory paragraph—―We have audited…‖
4. Scope paragraph—―We conducted our audits…‖
5. Opinion paragraph—―In our opinion…‖
6. Signature of CPA firm—―Sydney and Maude, CPAs‖
7. Audit report date—―March 17, 2015.‖ This date represents when the work on the audit
was completed, not the date the report was issued. Depending on the size of the
company being audited, the review of the evidence may take two to three months.
Figure 11.3
We have reviewed the balance sheet and related statements of income, retained earnings,
and cash flows of the Solana Dreams Publishing Company as of September 30, 2014, and
for the three-month and nine-month periods then ended. These financial state-ments are the
responsibility of the company’s management.
We conducted our review in accordance with standards estab-lished by the American Institute of Certified Public Accountants. A review of interim financial information consists principally of applying analytical procedures to financial data and making inquiries of persons responsible for financial and accounting matters. It is substantially less in scope than an audit conducted in accordance with generally accepted auditing standards, the objective of which is the expression of an opinion regarding the financial statements taken as a whole. Accordingly, we do not express such an opinion.
Based on our review, we are not aware of any material modifica-tions that should be made to the
accompanying financial statements for them to be in conformity with generally accepted accounting
principles
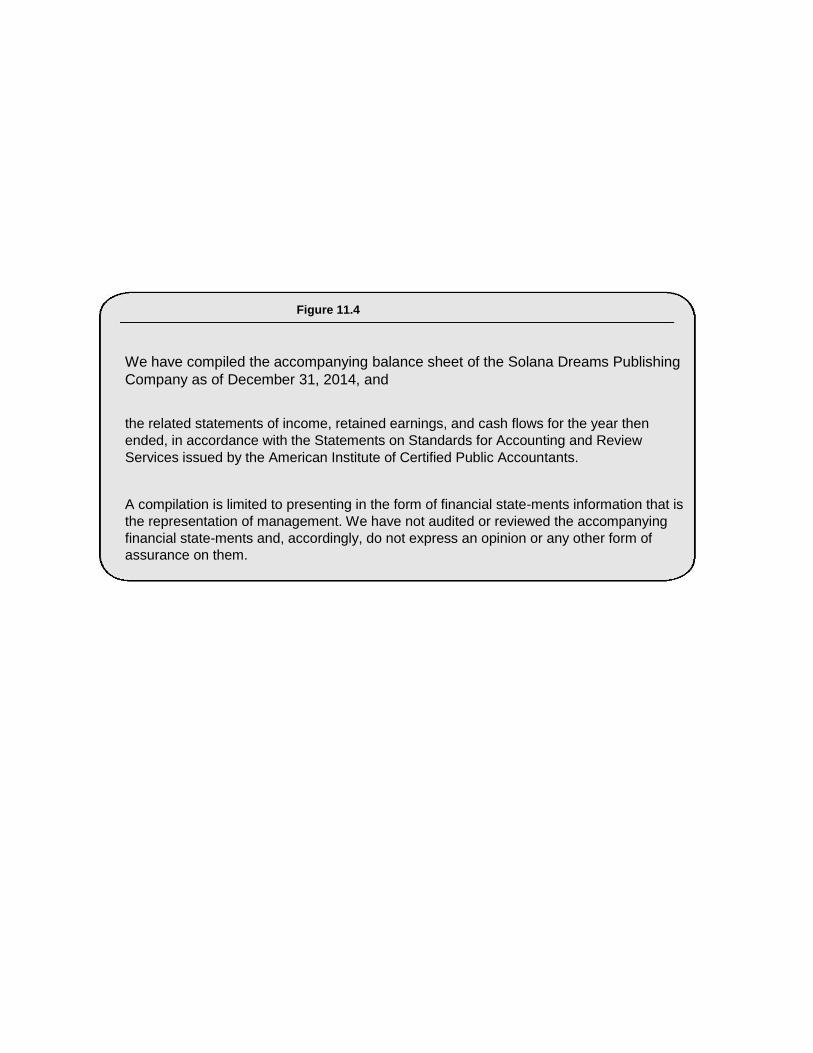
Figure 11.4
We have compiled the accompanying balance sheet of the Solana Dreams Publishing
Company as of December 31, 2014, and
the related statements of income, retained earnings, and cash flows for the year then
ended, in accordance with the Statements on Standards for Accounting and Review
Services issued by the American Institute of Certified Public Accountants.
A compilation is limited to presenting in the form of financial state-ments information that is
the representation of management. We have not audited or reviewed the accompanying
financial state-ments and, accordingly, do not express an opinion or any other form of
assurance on them.
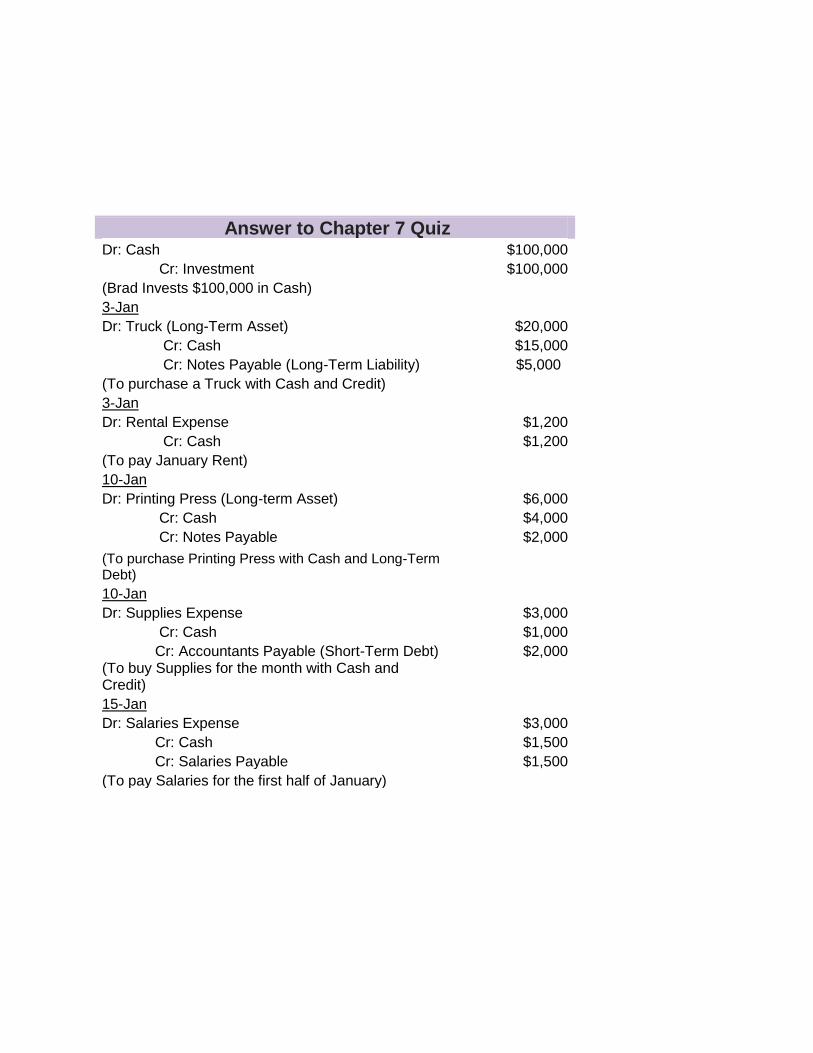
Answer to Chapter 7 Quiz Dr: Cash $100,000
Cr: Investment $100,000
(Brad Invests $100,000 in Cash) 3-Jan Dr: Truck (Long-Term Asset) $20,000
Cr: Cash $15,000
Cr: Notes Payable (Long-Term Liability) $5,000
(To purchase a Truck with Cash and Credit)
3-Jan
Dr: Rental Expense $1,200
Cr: Cash $1,200
(To pay January Rent) 10-Jan Dr: Printing Press (Long-term Asset) $6,000
Cr: Cash $4,000
Cr: Notes Payable $2,000
(To purchase Printing Press with Cash and Long-Term Debt)
10-Jan Dr: Supplies Expense $3,000
Cr: Cash $1,000
Cr: Accountants Payable (Short-Term Debt) $2,000 (To buy Supplies for the month with Cash and Credit)
15-Jan Dr: Salaries Expense $3,000
Cr: Cash $1,500
Cr: Salaries Payable $1,500
(To pay Salaries for the first half of January)