Embed Size (px)
Citation preview
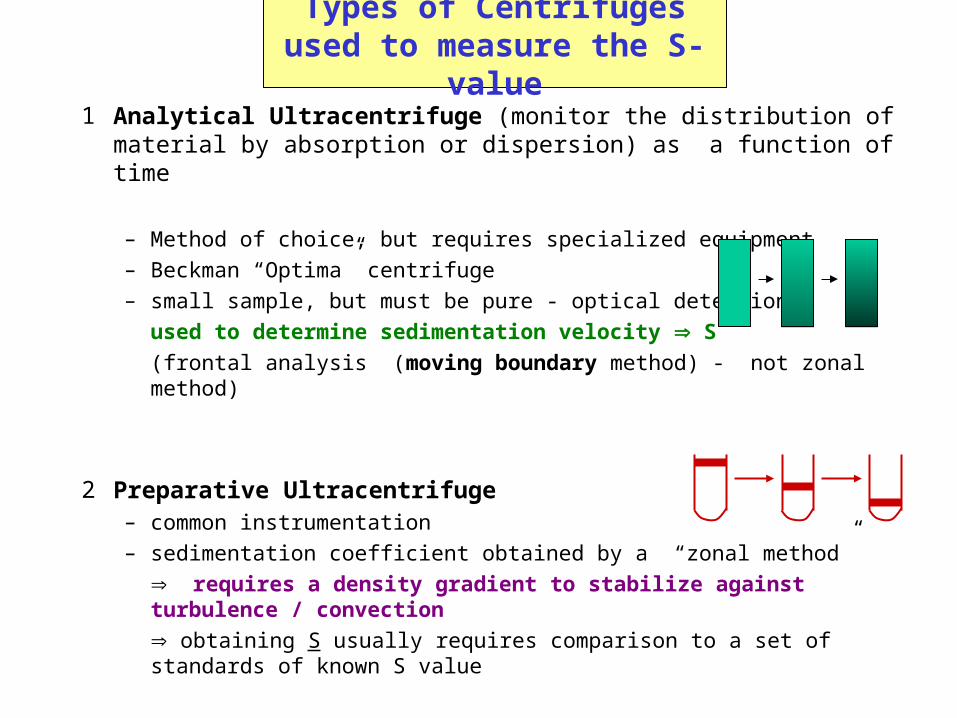
Types of Centrifuges used to measure the S-value
1 Analytical Ultracentrifuge (monitor the distribution of material by absorption or dispersion) as a function of time
– Method of choice, but requires specialized equipment
– Beckman “Optima” centrifuge
– small sample, but must be pure - optical detection
used to determine sedimentation velocity S
(frontal analysis (moving boundary method) - not zonal method)
2 Preparative Ultracentrifuge– common instrumentation
– sedimentation coefficient obtained by a “zonal method”
requires a density gradient to stabilize against turbulence / convection
obtaining S usually requires comparison to a set of standards of known S value

Measuring the sedimentation coefficient with an analytical ultracentrifuge
The sedimentation coefficient is usually measured in an analytical ultracentrifuge. Currently the Beckman “Optima” is the only commercial machine available. This is a relatively specialized piece of equipment.
In this centrifuge, the sample is located in a centrifuge tube that allows the absorbance to be measured as a function of location in the tube. One starts with the protein distributed evenly through the tube and as the centrifuge spins, the material sediments towards the bottom of the tube. The speed with which the boundary moves is measured by monitoring the midpoint of the absorbance changes. The velocity of this moving boundary yields the sedimentation coefficient of the protein.

ln rb(t) = ln rb(to) + 2 S (t-to)
plot ln rb(t) vs time
slope S for known
time
ln (rb)
[C]
t = 0
0top r bottom
t1 t2
velocity = drb
dt
rb = boundary position
1 drb rb(t)
rb2 dt rb(to)• = S ln = 2 S (t-to)
Measuring S using an analytical ultracentrifuge
Moving boundary

The sedimentation coefficient of DNA and a protein (bovine serum albumin)
as a function of concentration.
Note the very large concentration dependence of S for DNA, which makes this a very impractical method for studying DNA.

But the gradient makes computation of the S-value very difficult because in the sucrose density gradient,
is not constant and is not constant (f = 6Rs)
A set of “standards” of known S-value is used to get S for the unknown.
Using the Preparative UltracentrifugeFinding the S-value
typically a sucrose gradient is used to prevent turbulence due to convection
M (1-V2)Nf
S =

there are 3 unknowns : S =
1 measure, calculate or estimate V2 (inverse density)
for proteins: V2 0.75 mL/g
-can compute from amino acid composition
2 f can be obtained from another experiment: gel filtration, diffusion (Stokes radius f)
combination of sedimentation and gel filtration can yield M.
M (1 - V2)Nf
Using the Sedimentation Coefficientto get molecular parameters
Once you measure it
Practical strategy to get M f = 6Rs

Combining Sedimentation and Diffusion
D = =
S =
( ) =
kT kT f 6Rs
M (1 - V2)Nf
Any method yielding Rs can be used.
This is now most frequently obtained by
gel filtration chromatography
S M(1-V2 )D RT
The frictional coefficient drops out ofthe equation
The value of the specific volume of the anhydrous particle, V2, can be a sticking point when the sedimenting species is not a simple protein, but is a complex of components with different densities. Typical difficult systems would be membrane proteins with bound lipids or detergent molecules, or glycoproteins with sugarsattached to the protein. In this case, one cannot just make an estimate of the value of V2, which will be a weighted average of the densities of the components of the complex particle.

This used to be one of the standard methods to obtain protein molecular weight
To obtain the molecular weight of the native form of an enzyme (subunit association), the combination of
sedimentation - gel filtration (RS) is very useful
(from Tanford)
infinite dilution
So20,w
20oC
in water (correct for viscosity and temperature from conditions of actual measurement)

Examples of Combining Sedimentation plus Stokes radius to get M.
The following is illustrative of how molecular weight (M), size and shape combine determine the values of the sedimentation coefficient and Stokes radius. Classically, the value of Rs would come from the translational diffusion coefficient, but this would be rare today. Instead, gel filtration or molecular sieve chromatography would be used to obtain Rs.
Let’s compare the effect of lowering the pH of solutions of two proteins, hemoglobin and serum albumin. In the former case, the protein dissociates from a tetramer to monomers (or perhaps a mixture containing dimers), whereas in the latter case, the protein expands.

Example 1: Hemoglobin Dissociation at low pH
4 x
D(Rs)
S
M Rs
S D
kT6Rs
D =M (1 - V2)
N 6Rs
S =
S M(1-V2 )D RT
=
The protein dissociates from a tetramer to monomers (or perhaps a mixture containing dimers).
Whereas the diffusion constant varies as the inverse of Rs, the sedimentation coefficient varies as the ratio of M/Rs. The ratio of S/D depends on molecular weight, M, only if V2 is constant.
The effect of lower pH on hemoglobin: the sedimentation coefficient decreases and the diffusion coefficient goes up (Stokes radius goes down).

Example 2: Expansion of BSA at low pH
D (Rs )
S
M Rs
S constantD
kT6Rs
D = M (1 - V2)N 6Rs
S =
S M(1-V2 )D RT
=
In contrast to hemoglobin, the protein bovine serum albumin expands during acidification.

Conclusionsfrom the two proteins
Note that in both the examples of hemoglobin and serum albumin, the sedimentation coefficient gets smaller at acid pH, i.e., the protein moves more slowly in the centrifuge tube.
But the causes are totally different, and cannot be distinguished without the additional information from another experiment to yield the Stokes radius independently. In the case of serum albumin, the increase in radius is not accompanied by any change in the molecular weight, so the ratio of S/D remains constant as a function of pH.
Also note that this information is not available from X-ray crystallography but requires these solution techniques.

Using set of “Standards” of known S-value toestimate molecular weight of an unknown from S values
1 The best method to obtain M from a measured S-value is to independently get V2 and f, and then obtain M in the equation below:
S =
2 Can convert S M if you compare with known standards.However: M must be the only independent parameter
Example stands set of “spherical” proteins
same V2
increasing M f Rs M1/3 In general (for spherical compact proteins)
S M2/3 increasing
But: if unknown is ellipsoid f > fsphere (then f and M are not correlated)S > Ssphere, get wrong M
M (1 - V2)Nf
unknown
f = 6Rs

The key to using a comparison to standards to obtain M is that molecular weight be the only independent parameter. (Also true for electrophoresis
and for gel filtration chromatography)
S =
If all standards and the unknown are same shape and have the same V2 , then S will be a smooth and predictable function of Molecular weight.
S
You will get the wrong value of M if the shape of the unknown is not the same as the shape of the standards to which it is compared.You will get the wrong value of M if the value of V2 is incorrect. Glycoproteins, proteins with lipids and/or detergents bound to them are examples where the anhydrous volume per gram of the particle is not a trivial matter to obtain.
M (1 - V2 )Nf
M Mf f (M)
f = 6Rs
Using standards to get M from the S-value

Example: determination of the S-value of GlpFthe glycerol transport facilitator protein from E. coli
Empirical correlation of the S-value of soluble proteinstandards using sedimentation velocity in a 5-20%sucrose density (neither nor f are constant!)
M (1-V2)Nf
S =
PNAS (2001) 98, 2888-2893
Native tetramer
rela
tive
dis
tanc
e m
oved

Using the Preparative Ultracentrifugeto obtain an S-value
Most biochemical laboratories are equipped with a preparative ultracentrifuge. These instruments do not have optics needed to measure the distribution of protein or any other substance in a tube. Instead, if one wants to determine the distribution of the material after a centrifuge run, it is necessary to remove the tube after a specified time and take out the sample drop by drop from top to bottom (or vice versa). Bio-assays can then be used to determine the contents of each fraction. It is necessary to use a zonal method with a preparative ultracentrifuge rather than the boundary method. In the zonal method, the material is layered in a zone at the top of the tube at the beginning of the experiment, and then this zone of material migrates down the tube:

Because of the size of the tubes (several ml), one of the major problems to obtain quantitative information on sedimentation velocity from a preparative ultracentrifuge is the disturbance of the material distribution by turbulence from physical vibrations or due to convection from thermal differences in different parts of the tube. This is partly overcome by the use of a sucrose gradient, in which sucrose is added to the sample with a dense solution on the bottom. If there is a local place in the tube that is slightly warmer than the surrounding sample, this would normally become less dense and rise in the solution, thus causing mixing. The sucrose density prevents this mixing.
However, other problems are introduced that complicate determination of the S-value. Two of the factors that must be known to determine the S-value are now different in each level of the tube, and they are not constants: ρ (the solution density) and f (6πηRs), which depends on the solution viscosity (η).
In practice this makes it very difficult to convert a distance migrated down the tube into a meaningful S-value. In order to do this, it is necessary to use a set of known samples where the S-value is known and make the measurements along with that of the unknown. This is not the best way to determine an S-value.
fN
VMS
21

Separations in the Preparative Centrifuge: Differential Sedimentation
The three parameters that determine the sedimentation coefficient are all important in allowing the separation of molecules, complexes, organelles or other particles from each other. This technique is called differential sedimentation. In the extreme case, particles with a large S-value will migrate rapidly to the bottom of the centrifuge tube and form a pellet, and those with smaller S-values will remain in the supernatant. Separating on the basis of zonal migration, as is the case with DNA species of varying supercoil density, requires a stabilizing sucrose gradient.
fN
VMS
21
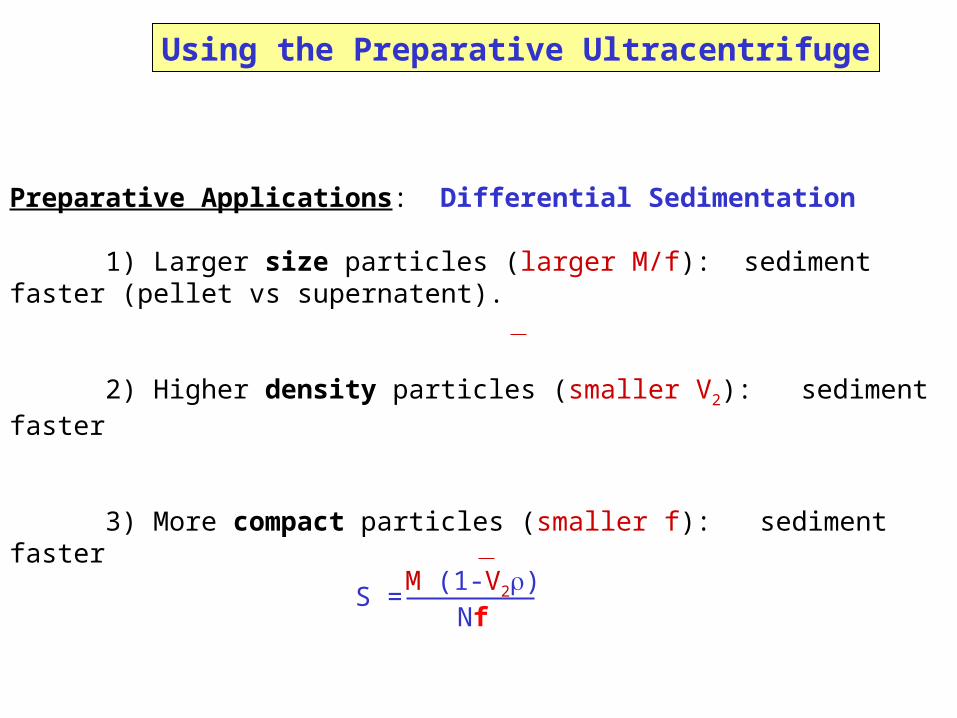
Preparative Applications: Differential Sedimentation
1) Larger size particles (larger M/f): sediment faster (pellet vs supernatent).
2) Higher density particles (smaller V2): sediment faster
3) More compact particles (smaller f): sediment faster
Using the Preparative Ultracentrifuge
M (1-V2)Nf
S =

Examples: 1. lipoproteins ( separate on the basis of density)
2.protein - nucleic acid complexes (separated from protein and DNA by density differences)
3. RNA: usually must denature to eliminate 3o structure to separate on the basis of size
4 .DNA forms - differ in shape/size from each other
closed circular plasmid linear concatented supercoiled
Using the Preparative Ultracentrifuge

DNA Supercoiling: induced by binding intercalating molecules (such as ethidium bromide)
that insert between basepairs and unwind the double helix
more supercoils makes the DNA more compact
change in shape results in a change in S-value
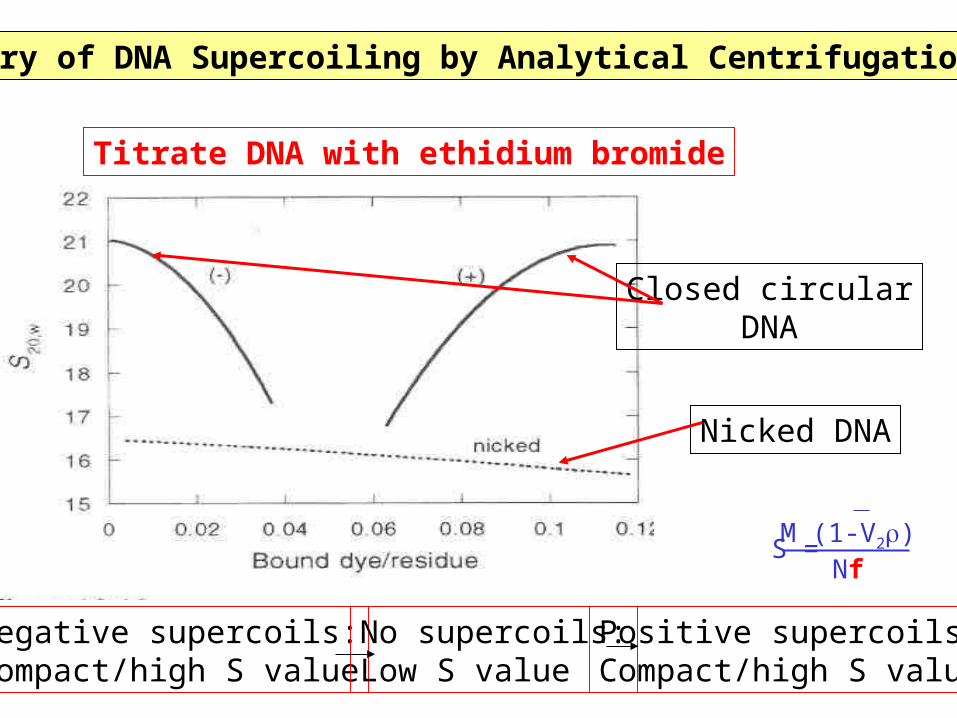
Discovery of DNA Supercoiling by Analytical Centrifugation (1968)
Closed circularDNA
Nicked DNA
Titrate DNA with ethidium bromide
Negative supercoils:Compact/high S value
Positive supercoils:Compact/high S value
No supercoils:Low S value
M (1-V2)Nf
S =

Some particles cannot be separated based on differences in S value
The technique of sedimentation equilibrium is used to separate species on the basis of density, thus extending the versatility of centrifugation in biomolecular separations.

Sedimentation Equilibrium
= 0 + RT ln c - M (1-V2)2r2
2
= radial velocity = partial molar free energy
top r bottom
C
= 1 dC 2rM (1-V2) c dr RT
integrate: ln C(r) = (r2 - a2) 2M (1-V2) 2RT
= 0 at equilibrium 0 = RT - 2rM(1-Vp)d 1 dcdr c dr
ln C
r2 - a2 Note: f is not in the equation
get M from the slope-must know and V2 and
at the top of thesample (meniscus, r = a),C = Co
meniscus
ra
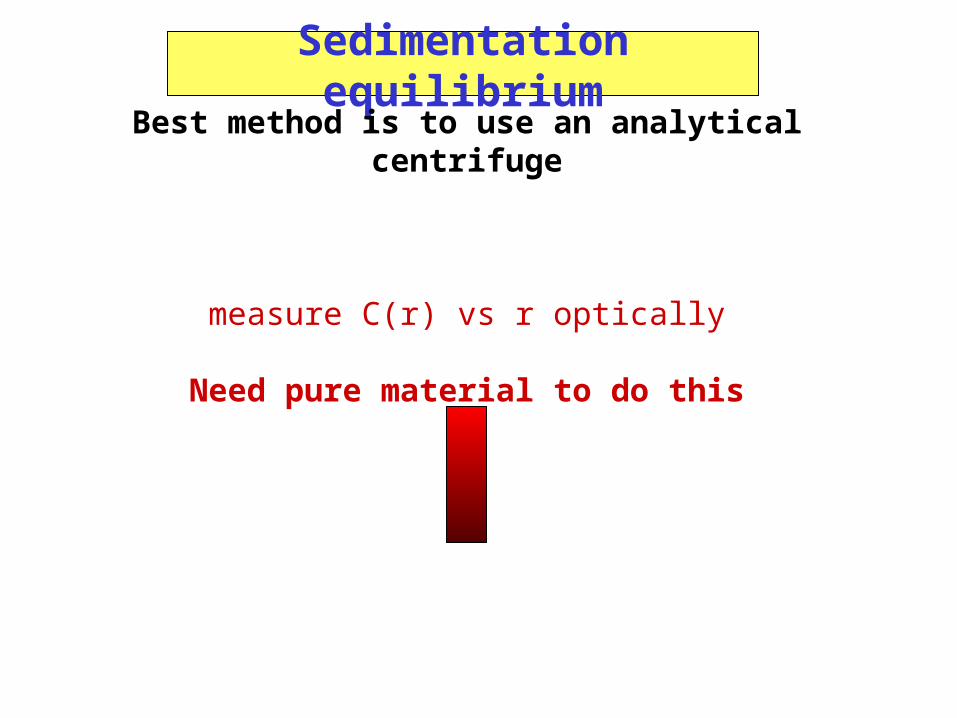
Sedimentation equilibriumBest method is to use an analytical centrifuge
measure C(r) vs r optically
Need pure material to do this
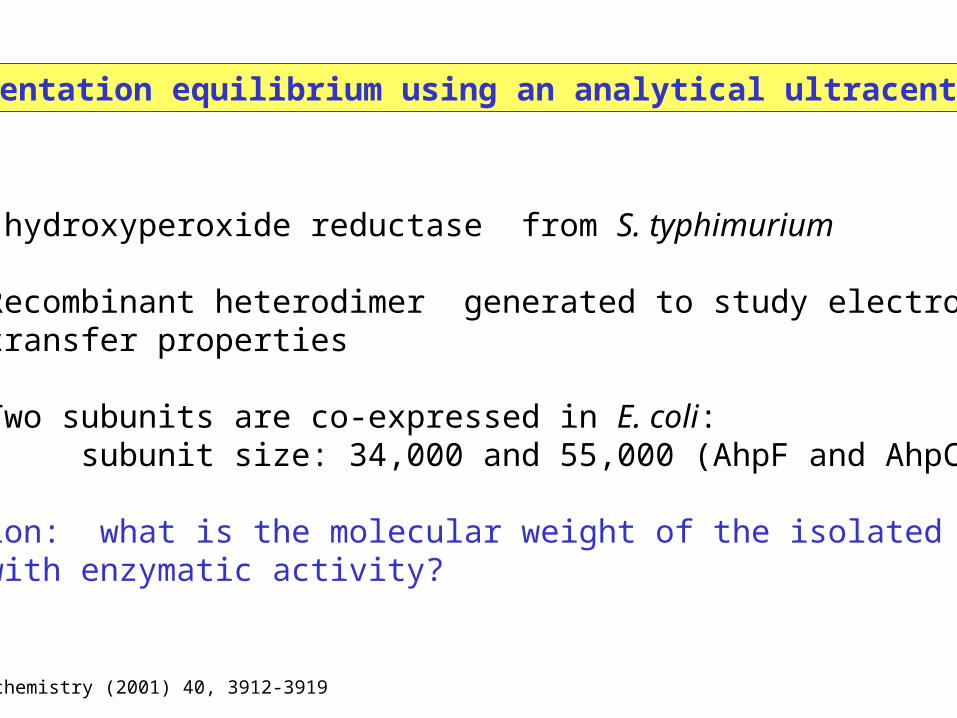
Sedimentation equilibrium using an analytical ultracentrifuge
Alkyl hydroxyperoxide reductase from S. typhimurium
Recombinant heterodimer generated to study electrontransfer properties
Two subunits are co-expressed in E. coli:subunit size: 34,000 and 55,000 (AhpF and AhpC)
Question: what is the molecular weight of the isolated complexwith enzymatic activity?
Biochemistry (2001) 40, 3912-3919
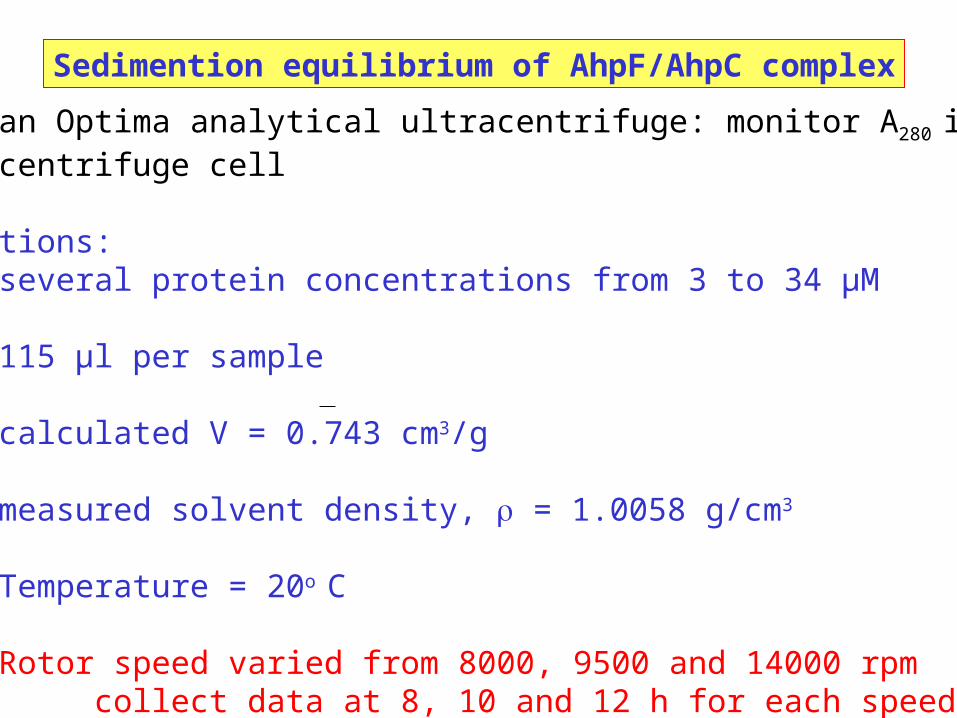
Sedimention equilibrium of AhpF/AhpC complex
Beckman Optima analytical ultracentrifuge: monitor A280 in the centrifuge cell
Conditions: several protein concentrations from 3 to 34 µM
115 µl per sample
calculated V = 0.743 cm3/g
measured solvent density, = 1.0058 g/cm3
Temperature = 20o C
Rotor speed varied from 8000, 9500 and 14000 rpmcollect data at 8, 10 and 12 h for each speed

Sedimentation equilibrium data ofAlkyl hydroxyperoxide reductase
8000 rpm
9500 rpm 14000 rpm
M = d ln C/dr2(2 R T/(2(1 - V)))
Result: M = 86,200 ± 200 Conclusion: Enzyme containsone copy of each subunit

Alternatives to the analytical ultracentrifuge
1) the airfuge
2) the preparative ultracentrifuge
Sedimentation Equilibrium without an analytical ultracentrifuge

enables you to measure the distribution of material in a centrifuge tube qusing biochemical techniques
- small, high speed (desktop)- sample solution for biochemical assays- get ln c(r) vs r2 from impure material
- enzyme assays- binding assays- antibody detection
1. Can use like the airfuge and remove sample to measure material distribution
2. Can use a density gradient centrifugation to separate particles on the basis of V2
take samplesvs
depth
Airfuge
Preparative Ultracentrifuge
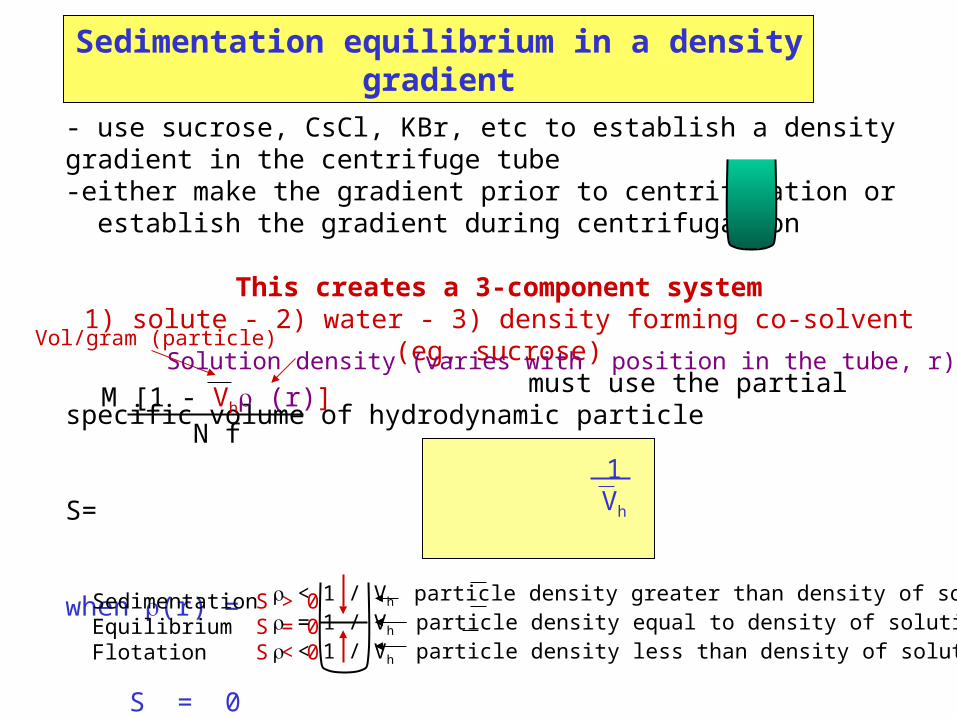
Sedimentation equilibrium in a density gradient
- use sucrose, CsCl, KBr, etc to establish a density gradient in the centrifuge tube-either make the gradient prior to centrifugation or establish the gradient during centrifugation
This creates a 3-component system1) solute - 2) water - 3) density forming co-solvent (eg, sucrose)
must use the partial specific volume of hydrodynamic particle
S=
when (r) =
S = 0
S > 0S = 0S < 0
< 1 / Vh particle density greater than density of solution = 1 / Vh particle density equal to density of solution < 1 / Vh particle density less than density of solution
M [1 - Vh (r)]N f
1Vh
Vol/gram (particle)Solution density (varies with position in the tube, r)
SedimentationEquilibriumFlotation

(r) = o + (r - ro) ( )
where ro is where =
at equilibrium d dr
1 dc 2 M [1 - Vh (r)] c dr RT
c(r) = c(ro) e
Gaussian Distribution about r = ro
Note: Width of the distribution depends on Molecular weight
At ro: = Vh =
ddr
1Vh
= 0
=
substitute
- 2 ro M Vh( ) (r - ro)2 / 2 R Tddr
gradient
ro
r
1o
at the peak (this does not take into account any salt or ions)
V2 + H2O
1 + H2O
For a linear density gradient:

1 Different membranes or organelles can be separated on the basis of density
E.coli: inner + outer membraneseukaryotic: rough + smooth ER
2 Serum lipoproteins: LDL, HDL etc
3 DNA with different GC content
= 1 = 1.66 + 0.09 • fGC
Vh
4 Single vs double-strand DNA
5 15N vs 14N containing DNA (or DNA with Br-U instead of T)
6 Supercoils with different amounts of bound ethidium bromide - have different Vh values
Applications of sedimentation equilibrium in a density gradient foranalysis and for preparative purposes

Some particles cannot be separated based on differences in S value
Differential Sedimentation
pellet
Density gradient Sedimentation Equilibrium

Case Study: Actin-binding Nebulin Fragments
Nebulin binds to the actin/tropomyosin/troponin thin filamentof skeletal muscle
Multiples of repeated sequences arranged in modules
Fragments containing 2 - 15 modules retain actin bindingfunction
Two fragments: NA3 and NA4
Question: Are NA3 and NA4 aggregated in solution?
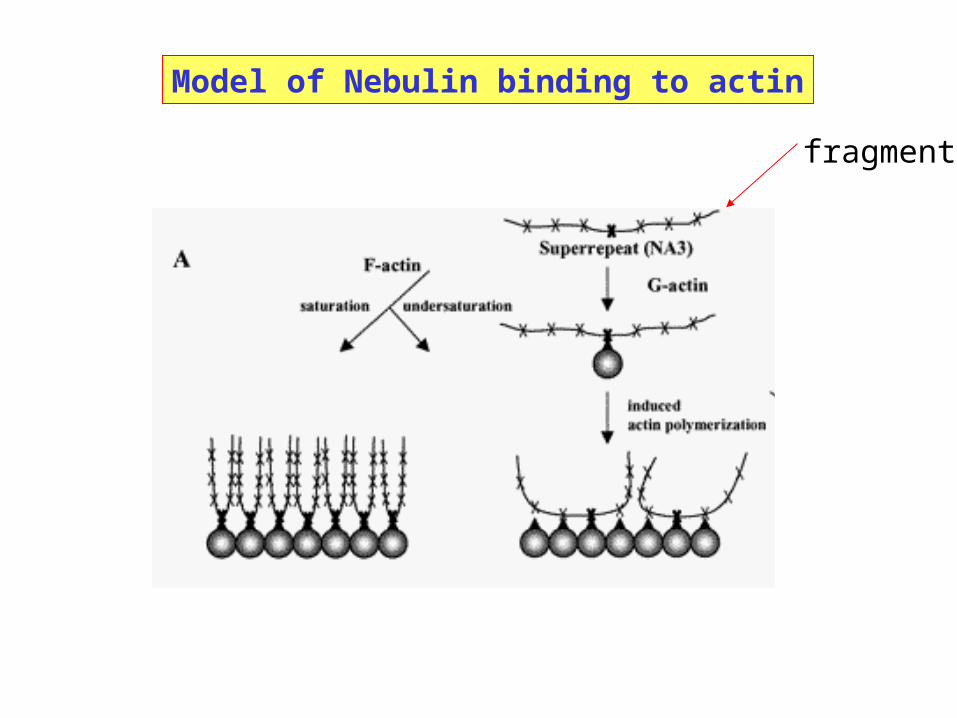
Model of Nebulin binding to actin
fragment

Sedimentation equilibrium of nebulin fragmentsUsing the Beckman Airfuge
Conditions:0.1 mg/ml protein1 mM Ca++, pH 7 buffer20% sucrose to stabilize the protein distribution
during rotor deceleration
Spin solution for 80 h at 54,000 rpm ( = 5700 s-1)

Using a syringe, remove liquid from the top of thetube and measure protein concentrationfor each fraction

M = d ln C/dr2(2 R T/(2(1 - V)))
R (gas constant) = 8.3 x 10⁷ g cm2 s-2mol-1K-1
= 5700 s-1
= 1.08 g cm-3 density of 20% sucroseV = partial specific volume of nebulin
fragments in 20% sucrose. Calculated from amino acid sequence0.739 for NA30.745 for NA4
T = 300 oK
NA3: M = 37 kDa (monomer = 31kDa)NA4: M = 35 kDa (monomer = 25 kDa)
Conclusion:Nebulin fragmentsAre not aggregated

What is the shape of the nebulin fragment?
Sedimentation velocity in a Beckman L5-50 preparativeultracentrifuge: SW41 swinging bucket rotor
Conditions:0.05 mg/ml protein concentration1 mM Ca++, pH 7 buffer20% sucrose
Remove sample from the topand measure protein todetermine the profile of the trailing boundary.
Spin for 18 h at 35,000 rpm at 20o C

Sedimentation Velocity of Nebulin Fragments
trailing boundary
top ofCentrifuge tube
So = (ln rb - ln rm)/2t
t = 64,800 sec = 3665 s-1
rb = boundary positionrm = meniscus position

Sedimentation velocity of nebulin fragments
Must correct for the fact that the measurement is done in 20% sucrose:
1. Density is 1.08 (+sucrose) instead of 1.00 g/cm3
2. Viscosity is 0.0195 P (+ sucrose) instead of 0.01 P
3. Partial specific volumes are different V = 0.739 (+ sucrose) instead of 0.728 cm3/g for NA3V = 0.745 (+ sucrose) instead of 0.733 cm3/g for NA4
Sw,20 = So (1 - Vww) w(1 - V)
Measured in 20% sucrose
Results:Sw,20 = 1.1 S for both NA3 and NA4
QuickTime™ and aTIFF (LZW) decompressor
are needed to see this picture.

Interpretation of the Sedimentation of nebulin fragments
1. We can now calculate the Diffusion coefficients:
Dw,20 = Sw,20 RT/(M(1 - V)
2. From this, calculate f/fmin:
f/fmin = (kT/Dw,20)(6(3MV/4No)1/3)
(Note: use values of , and V that apply to the protein in water)
Results: NA3 Dw,20 = 3.2 x 10⁻⁷ cm2s-1 f/fmin = 3.27
NA4 Dw,20 = 3.6 x 10⁻⁷ cm2s-1 f/fmin = 2.96
From sedimentation equilibrium

Define: fmin = 6Rmin
Rs f Rmin fmin
=
anhydrous sphere
Rminvol = [V2 • ]
= R3min
MN
43
:
D = =kT kT f 6RS
since f = 6Rs
RS = (kT/Dw,20)/6
Rmin = (3V2M/4N) 1/3
f/fmin
measured
= (kT/Dw,20)/6(3V2M/4N)1/3
experimental
Anhydroussphere

Nebulin fragments are highly asymmetric
NA3 f/fmin = 3.27
NA4 f/fmin = 2.96
If anhydrous prolate ellipsoids: a/b = 50/1 to 60/1
about 600 Å long