Embed Size (px)
Citation preview

Type II DiabetesType II Diabetes
Heidi Chamberlain Shea, MDHeidi Chamberlain Shea, MD
Endocrine Associates of Endocrine Associates of DallasDallas

Points of DiscussionPoints of DiscussionType II DiabetesType II Diabetes
BackgroundBackground DiagnosisDiagnosis PathophysiologyPathophysiology Oral treatmentsOral treatments Office visitsOffice visits

Type II DiabetesType II Diabetes Epidemic Epidemic
Increase intakeIncrease intake Decreased activityDecreased activity
Parallels the rise in Parallels the rise in obesityobesity
GeneticsGenetics Obesity causes earlier Obesity causes earlier
diseasedisease High risk ethnic groupsHigh risk ethnic groups
Indian, African American Indian, African American and Hispanicand Hispanic

19961991
2003
Obesity Trends* Among U.S. Adults(*BMI 30, or about 30 lbs overweight for 5’4” person)
No Data <10% 10%–14% 15%–19% 20%–24% ≥25%

Insulin resistance Insulin resistance ß-Cell secretory ß-Cell secretory
dysfunctiondysfunction Relative insulin Relative insulin
deficiencydeficiency Onset in pubertyOnset in puberty Acanthosis Acanthosis
NigricansNigricans FemaleFemale
Type II DiabetesType II Diabetes

Diagnosis of DiabetesDiagnosis of DiabetesADA Expert CommitteeADA Expert Committee
NORMALNORMAL IMPAIREDIMPAIRED DIABETESDIABETES
FASTING FASTING (8 hrs)(8 hrs)
< < 110110 mg/dlmg/dl
(6.1 mM)(6.1 mM)
110-125 110-125 mg/dlmg/dl
>= >= 126126 mg/dlmg/dl
(7 mM)(7 mM)
ORAL ORAL GTT*GTT*
< < 140140 mg/dlmg/dl
(7.8 mM)(7.8 mM)
140-199 140-199 mg/dlmg/dl
>=>=200200 mg/dlmg/dl
(11.1 mM)(11.1 mM)
*Not recommended for routine clinical useExpert Committee on the Diagnosis and Classification of Diabetes Mellitus. Diabetes Care. 2002;25 Suppl 1
Symptoms of diabetes plus a random plasma glucose concentration of 200 mg/dL, regardless of the timesince last meal

Impaired insulin Impaired insulin secretionsecretion
IncreasedIncreased HepaticHepatic
Glucose ProductionGlucose Production
Decreased Decreased Muscle Muscle Glucose Glucose uptakeuptake
Insulin Resistanc
e
Metabolic Consequences in Type 2 DM

Etiology of Type 2 DiabetesEtiology of Type 2 Diabetes Impaired Insulin Secretion and Impaired Insulin Secretion and
Insulin ResistanceInsulin ResistanceGenes and environment
Type 2 diabetes
Impaired glucose tolerance
Impaired insulin secretion
Insulin resistance+

Weyer C et al. Diabetes Care. 2001;24:89-94
0
10
20
30
40
Low HighHigh
Low
Early-phase insulin secretion
Cumulative diabetes incidenceover 4 years
Low Insulin Secretion and Sensitivity Low Insulin Secretion and Sensitivity
Both Predict Progression from IGT Both Predict Progression from IGT to Type 2 Diabetesto Type 2 Diabetes
IGT=impaired glucose tolerance
Insulin sensitiv
ity

-cell function(% of normal by HOMA)
Adapted from Holman RR. Diab Res Clin Pract. 1998;40(suppl):S21-S25;UKPDS. Diabetes. 1995;44:1249-1258
Years
0
20
40
60
80
100
10 9 8 7 6 5 4 3 2 1 0 1 2 3 4 5 6
Time of diagnosis
?
HOMA=homeostasis model assessment
Decline of Decline of -Cell Function in -Cell Function in the UKPDS Illustrates the UKPDS Illustrates
Progressive Nature of DiabetesProgressive Nature of Diabetes
Pancreatic function= 50% of normal

InsulinInsulin + fat infusion
Glucose Measurements During High Insulin Levels
0
100
Glucose uptake or output (mg/dL fat-free mass/min)
Peripheral glucose uptake
Hepatic glucose output
*
*
High FFA Levels CauseHigh FFA Levels CausePeripheral and Hepatic Insulin Peripheral and Hepatic Insulin
ResistanceResistance
*P<0.05200
300
400
500
Boden G, Chen X. J Clin Invest. 1995;96:1261-1268
FFA=free fatty acid

Glucose FFA
FFA
Increasedglucosamine
Otherpathways
Otherpathways
Glucose
Impaired insulinsecretion from -cell
Insulin resistancein muscle and fat
Mechanism of Glucotoxicity and Mechanism of Glucotoxicity and Lipotoxicity Lipotoxicity
The Glucosamine HypothesisThe Glucosamine Hypothesis
Hawkins M et al. J Clin Invest. 1997;99:2173-2182; Rossetti L. Endocrinology. 2000;141:1922-1925
FFA=free fatty acid

Etiology of Type 2 DiabetesEtiology of Type 2 Diabetes Impaired Insulin Secretion and Impaired Insulin Secretion and
Insulin ResistanceInsulin Resistance
Type 2 diabetes
Genes and environment
Impaired insulin secretion
Insulin resistance
Impaired glucose tolerance
Progressive hyperglycemiaand high free fatty acids

Kosaka K et al. Diabetologia. 1980;18:23-28
Plasma insulin(U/mL)
0
50
25
Dietn=17
0 1 2 3
Sulfonylureasn=26
0 1 2 3
After
Before
0
Insulinn=7
*
**
*
**
* *
*
*
*
***
*
*
*
1 2 3
*P<0.05
Better Insulin SecretionBetter Insulin SecretionAfter Improved Metabolic After Improved Metabolic
ControlControlResponse to Oral Glucose Before and After 3 Therapies
Hours
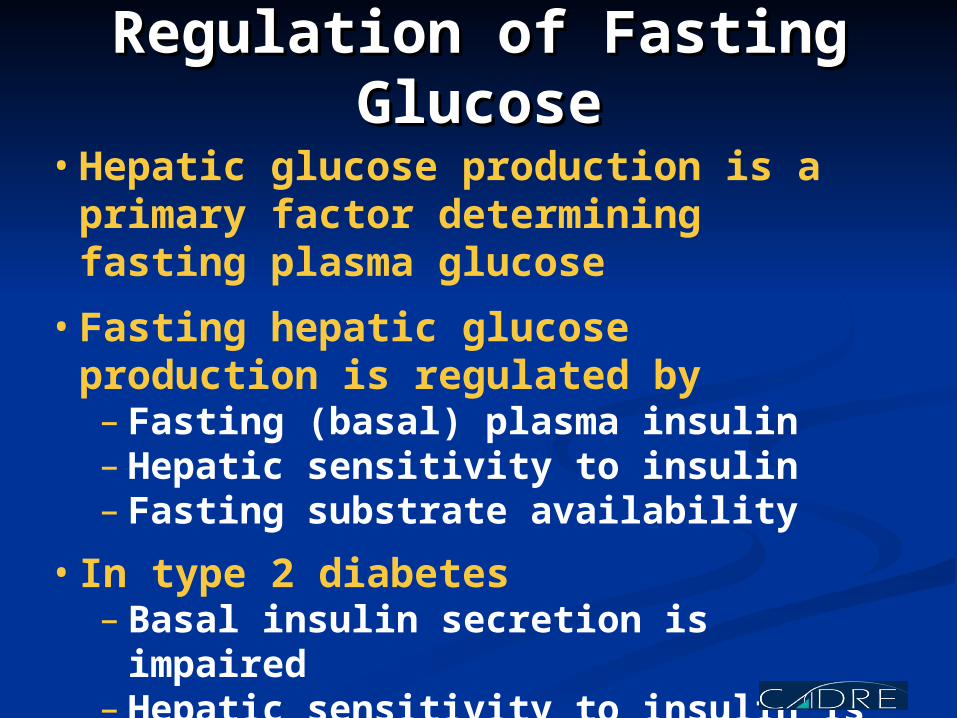
• Hepatic glucose production is a primary factor determining fasting plasma glucose
• Fasting hepatic glucose production is regulated by– Fasting (basal) plasma insulin – Hepatic sensitivity to insulin– Fasting substrate availability
• In type 2 diabetes– Basal insulin secretion is impaired – Hepatic sensitivity to insulin is decreased
Regulation of Fasting Regulation of Fasting GlucoseGlucose

*
0
50
100
0 50 100 150
*
*
Groop LC et al. J Clin Invest. 1989;84:205-213
Calculated portal plasma insulin (U/mL)
Glucose output (mg/m2/min)
*
NormalType 2 diabetes
*P<0.05
Hepatic Resistance to Hepatic Resistance to InsulinInsulin
in Type 2 Diabetesin Type 2 Diabetes
•
•
••
• •
Hepatic Glucose Output During Graded Insulin Infusion
•
•
•
• ••

Byrne MM et al. Am J Physiol. 1996;270(4 pt 1):E572-E579
Plasma glucose (mg/dL)
NormalIGTType 2 diabetes
100 150 200 250 300
30
25
20
15
10
5
0
Secretion/BMIpmol x m2/(min x kg)
Insulin Secretion Rate During Graded Glucose Infusion
Impaired Basal Insulin Impaired Basal Insulin Secretion in Secretion in
Type 2 DiabetesType 2 Diabetes
IGT=impaired glucose toleranceBMI=body mass index

• A meal contains 6 to 20 times the glucose content of the blood
• Normally, postprandial hyperglycemia is regulated by– Clearance of ingested glucose by the liver– Suppression of hepatic glucose production– Peripheral clearance of glucose
Regulation of Postprandial Regulation of Postprandial GlucoseGlucose

• In impaired glucose tolerance or diabetes, glucose regulation is impaired by – Delayed and reduced insulin secretion– Lack of suppression of glucagon – Hepatic and peripheral insulin resistance
Impaired Regulation ofImpaired Regulation ofPostprandial GlucosePostprandial Glucose

Abnormal Acute Insulin Response Abnormal Acute Insulin Response to to
Intravenous Glucose in Type 2 Intravenous Glucose in Type 2 DiabetesDiabetes
Robertson RP, Porte D Jr. J Clin Invest. 1973;52:870-876
Plasma insulin(U/mL)
Minutes
300– 300
40
20
60
80
100
0
40
20
60
80
100
Normal Type 2 Diabetes
GlucoseGlucose
300– 30

Insulin release(IR/G [pM/mM])
Kahn SE et al. Diabetes. 1998;47:640-645
OGTT-Stimulated Insulin OGTT-Stimulated Insulin Release in IGT and Type 2 Release in IGT and Type 2
DiabetesDiabetes
0
20
40
60
80
100
120
NGTn=56
IGTn=10
Type 2 diabetesn=28
OGTT=oral glucose tolerance testNGT=normal glucose toleranceIGT=impaired glucose tolerance

Patterns of Glucose, Insulin, and Patterns of Glucose, Insulin, and Glucagon Glucagon
After Oral Glucose in Type 2 After Oral Glucose in Type 2 DiabetesDiabetes
–60 0 60 120 180 240 300
60
30
45
400
Type 2 Diabetes
Normal
0
120
240
360
–60 0 60 120 180 240 300
Delayed and reducedHigh and not suppressed
Postprandial hyperglycemia
Minutes Minutes
–60 0 60 120 180 240 300
Minutes
300
200
100
Mitrakou A et al. Diabetes. 1990;39:1381-1390
Insu
lin (p
mol
/L)
Glu
cago
n (fm
ol/L
)
Glu
cose
(mg/
dL)

Kolterman OG et al. J Clin Invest. 1981;68:957-969
Glucosedisposal rate(mg/m2/min)
Insulin Resistance in IGT Insulin Resistance in IGT and and
Type 2 DiabetesType 2 Diabetes
IGT=impaired glucose tolerance
360
270
180
90
0Normal IGT Type 2 diabetes
0 1 2 3 4 5 6 7 8 9 1011
300
250
200
150
100
50
0
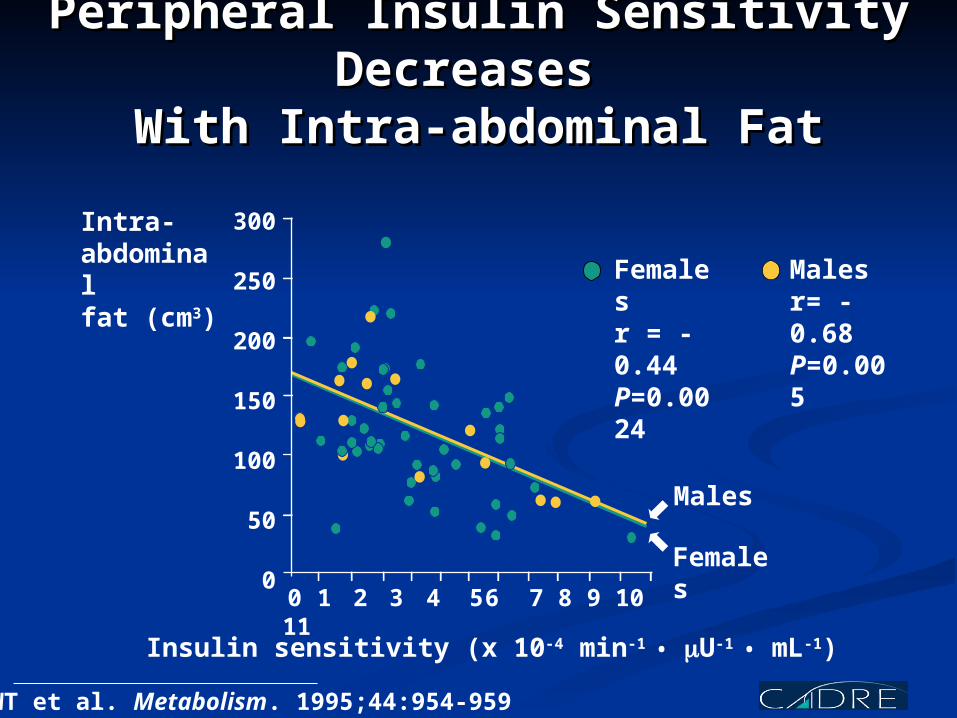
Peripheral Insulin Sensitivity Peripheral Insulin Sensitivity Decreases Decreases
With Intra-abdominal FatWith Intra-abdominal Fat
Cefalu WT et al. Metabolism. 1995;44:954-959
Insulin sensitivity (x 10-4 min-1 • U-1 • mL-1)
Femalesr = -0.44P=0.0024
Malesr= -0.68P=0.005
Males
Females
Intra-abdominalfat (cm3)
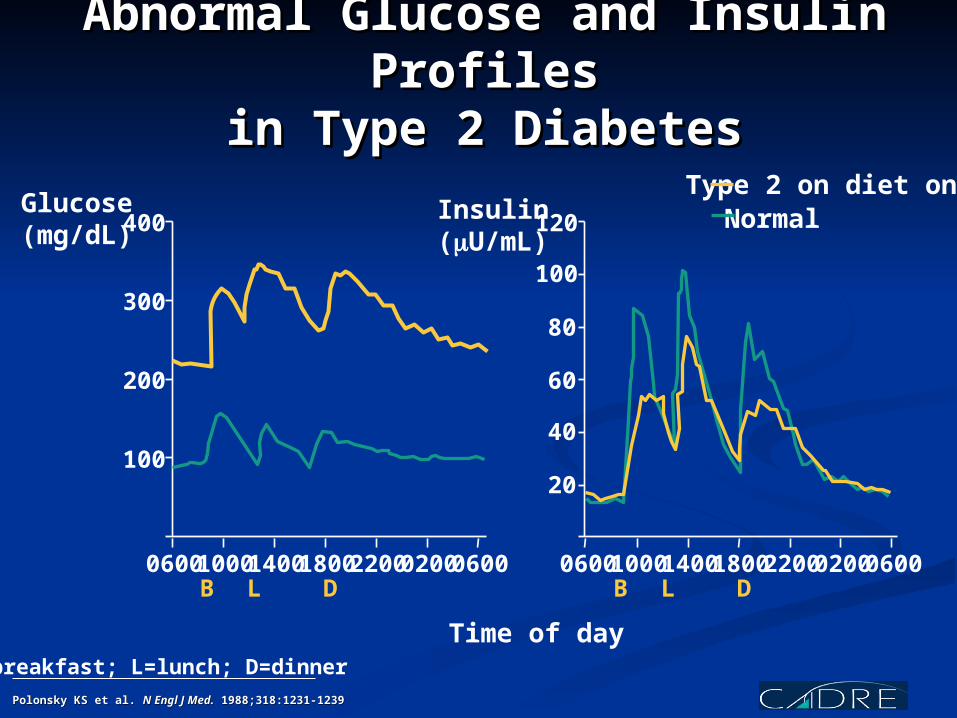
Polonsky KS et al. Polonsky KS et al. N Engl J Med.N Engl J Med. 1988;318:1231-1239 1988;318:1231-1239
NormalType 2 on diet only
Glucose(mg/dL)
Insulin(U/mL)
Abnormal Glucose and Insulin Abnormal Glucose and Insulin ProfilesProfiles
in Type 2 Diabetesin Type 2 Diabetes
100
200
300
400
0600 1000 18001400 02002200 0600 0600 1000 18001400 02002200 0600
Time of day
20
40
60
80
100
120
B L D B L D
B=breakfast; L=lunch; D=dinner

• Type 1 diabetes– The main abnormality is insulin deficiency
• Type 2 diabetes– Both insulin deficiency and insulin resistance
contribute–Free Fatty Acids–Increased Glucagon
• Glucotoxicity and lipotoxicity– Poor metabolic control worsens insulin
deficiency and insulin resistance
Summary of Summary of PathophysiologyPathophysiology

Basal hyperglycemiaBasal hyperglycemia Basal insulin levels Basal insulin levels Hepatic response determine fasting plasma glucoseHepatic response determine fasting plasma glucose
Postprandial hyperglycemiaPostprandial hyperglycemia Early insulin release Early insulin release Glucagon suppressionGlucagon suppression Hepatic and muscle responses to insulin determine Hepatic and muscle responses to insulin determine
postprandial glucosepostprandial glucose
Summary of Summary of PathophysiologyPathophysiology

Pharmacologic Pharmacologic TreatmentTreatment
Insulin Insulin SecretagoguesSecretagogues SulfonylureasSulfonylureas MeglitanidesMeglitanides
Insulin SensitizersInsulin Sensitizers MetforminMetformin ThiazolidinedionesThiazolidinediones
α-Glucosidase inhibitorα-Glucosidase inhibitor Acarbose, miglitolAcarbose, miglitol
InsulinInsulin

SulfonylureasSulfonylureas
Glyburide Glyburide Micronase, DiabetaMicronase, Diabeta
Glyburide Glyburide GlynaseGlynase
Glipizide Glipizide GlucotrolGlucotrol Glucotrol XLGlucotrol XL
Glimepiride Glimepiride AmarylAmaryl
ChlorpropamideChlorpropamide DiabenaseDiabenase
TolazamideTolazamide AcetohexamideAcetohexamide
DymelorDymelor TolbutamideTolbutamide
Newer Older
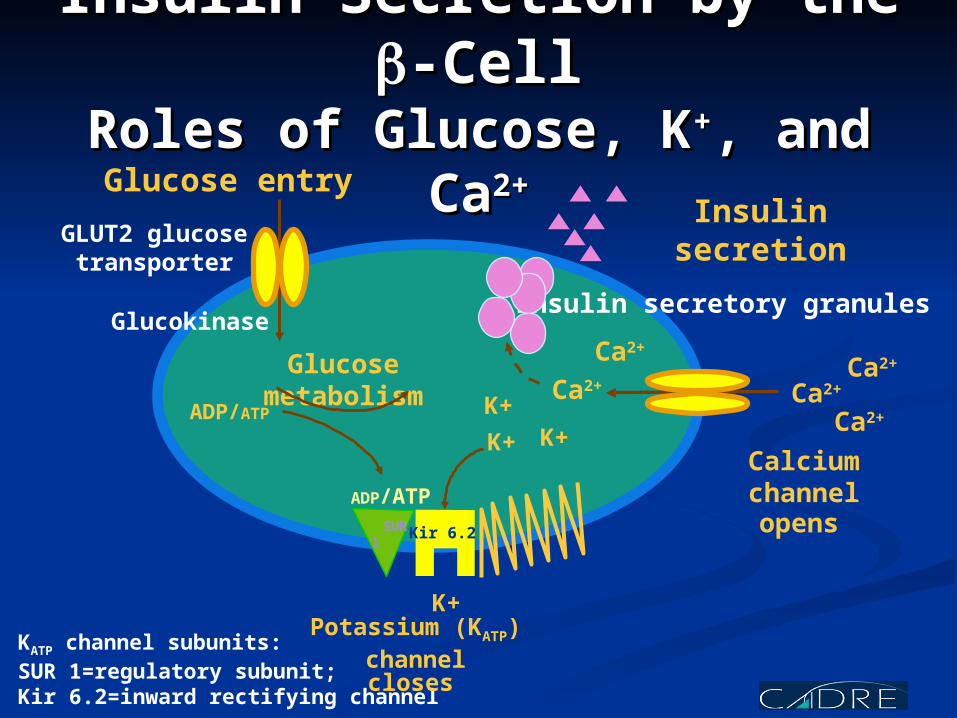
Glucose entry
GLUT2 glucosetransporter
Glucokinase
ADP/ATP
Potassium (KATP) channel
K+
Ca2+
Calcium channel
SUR 1
Insulin Secretion by the Insulin Secretion by the -Cell-Cell
Roles of Glucose, KRoles of Glucose, K++, and , and CaCa2+2+
Glucose metabolism
ADP/ATP
K+K+
Ca2+
Ca2+
Kir 6.2
Insulin secretory granules
opens
Ca2+
Ca2+
Insulin secretion
K+
KATP channel subunits:SUR 1=regulatory subunit;Kir 6.2=inward rectifying channel
closes

Insulin SecretagoguesInsulin Secretagogues Sulfonylureas, Repaglinide, and Sulfonylureas, Repaglinide, and
NateglinideNateglinide
Riddle MC. Am Fam Physician. 1999;60:2613-2620; Wolffenbuttel et al. Drugs. 1995;50:263-288; Horton ES et al. Diabetes Care. 2000;23:1660-1665; Hanefeld M et al. Diabetes Care. 2000;23:202-207;Medical Management of Type 2 Diabetes. 4th ed. Alexandria, Va: ADA; 1998
Mechanism of actionMechanism of action Increase basal and/or postprandialIncrease basal and/or postprandialinsulin secretioninsulin secretion
Efficacy depends uponEfficacy depends upon Functioning Functioning -cells-cells
PowerPower Sulfonylureas, repaglinide: decrease A1C Sulfonylureas, repaglinide: decrease A1C 1%–2%1%–2% Nateglinide: decreases A1C 0.5%–1%Nateglinide: decreases A1C 0.5%–1%
DosingDosing Sulfonylureas: 1 or 2 times dailySulfonylureas: 1 or 2 times daily Repaglinide, nateglinide: Repaglinide, nateglinide:
3 or 4 times daily with meals3 or 4 times daily with meals
Side effectsSide effects Weight gain, allergy (rare)Weight gain, allergy (rare)
Main riskMain risk HypoglycemiaHypoglycemia

BiguanidesBiguanidesMetforminMetformin
Riddle MC. Am Fam Physician. 1999;60:2613-2620; Cusi K et al. Diabetes Rev. 1998;6:89-131
Primary mechanismPrimary mechanism Decreases hepatic glucoseDecreases hepatic glucose of actionof action productionproduction
Efficacy depends uponEfficacy depends upon Presence of insulinPresence of insulin
PowerPower Decreases A1C 1%–2%Decreases A1C 1%–2%DosingDosing 2 or 3 times daily 2 or 3 times daily
(metformin)(metformin)1 or 2 times daily 1 or 2 times daily
(metformin XR)(metformin XR)
Side effectsSide effects Diarrhea, nauseaDiarrhea, nausea
Main riskMain risk Lactic acidosisLactic acidosis

αα-Glucosidase Inhibitors-Glucosidase InhibitorsAcarbose and MiglitolAcarbose and Miglitol
Mechanism of actionMechanism of action Delay carbohydrate Delay carbohydrate absorptionabsorption
Efficacy depends uponEfficacy depends upon Postprandial hyperglycemiaPostprandial hyperglycemia
PowerPower Decrease A1C 0.5%–1%Decrease A1C 0.5%–1%
Dosing Dosing 3 times daily3 times daily
Side effectsSide effects FlatulenceFlatulence
Main riskMain risk Liver enzyme elevation (rare)Liver enzyme elevation (rare)
Riddle MC. Am Fam Physician. 1999;60:2613-2620; Lebovitz HE. Endocrinol Metab Clin North Am. 1997;26:539-551

Glitazones (TZDs)Glitazones (TZDs)Pioglitazone and RosiglitazonePioglitazone and Rosiglitazone
Mechanism of actionMechanism of action Enhance tissue response to Enhance tissue response to
insulininsulinEfficacy depends uponEfficacy depends upon Presence of insulin and Presence of insulin and resistanceresistance
to its actionto its action
PowerPower Decrease A1C 0.9%–1.6%Decrease A1C 0.9%–1.6%
DosingDosing Once dailyOnce daily
Side effectsSide effects Edema, weight gain, anemiaEdema, weight gain, anemia
Main riskMain risk Congestive heart failureCongestive heart failure
Riddle MC. Am Fam Physician. 1999;60:2613-2620; Zinman B. Diabetes Obesity Metab. 2001;3(suppl 1):S34-S43; Actos (pioglitazone hydrochloride) package insert; Avandia (rosiglitazone maleate) package insert
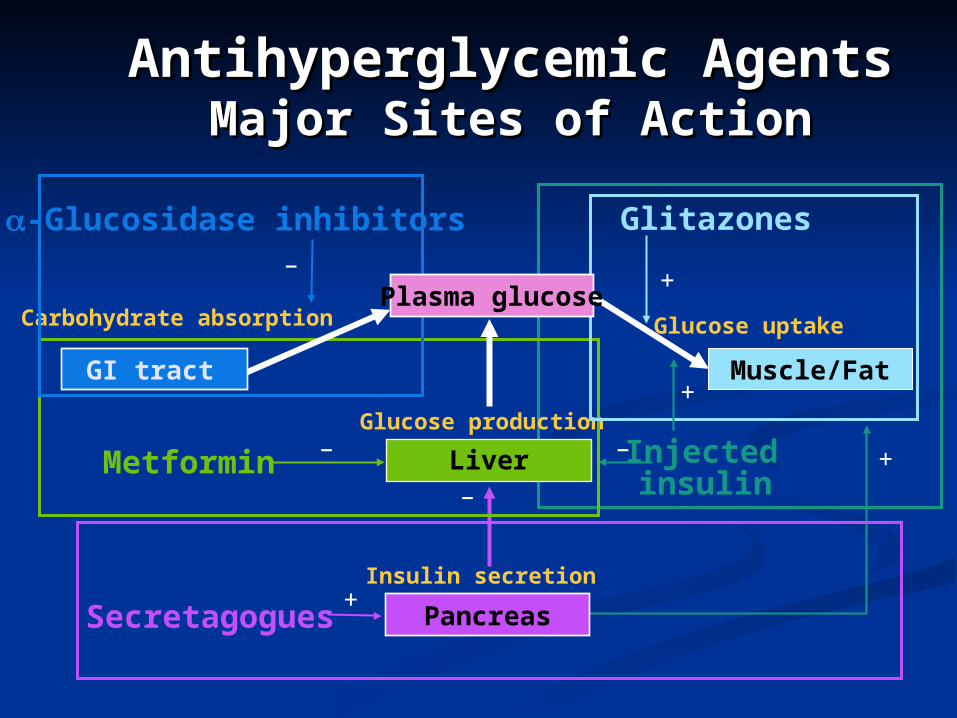
Antihyperglycemic AgentsAntihyperglycemic AgentsMajor Sites of ActionMajor Sites of Action
Carbohydrate absorption
Glucose production
Insulin secretion
Secretagogues
Glucose uptake
Injected insulin
Glitazones-Glucosidase inhibitors
–
+
+
+
Pancreas
Metformin
Muscle/Fat
–
–
–
+
GI tract
Liver
Plasma glucose

Glucose Profiles in Type 2 Glucose Profiles in Type 2 DiabetesDiabetes
Effects of Correcting Effects of Correcting Basal vs Postprandial Basal vs Postprandial
HyperglycemiaHyperglycemia
100
200
300
Normal—A1C 5%
Plasma glucose(mg/dL)
0800 1200 1800 0800
Time of day
A1C 7%
A1C 9%
A1C 6%

Jeppesen J et al. Diabetes Care. 1994;17:1093-1099
Glipizide aloneGlipizide + metformin
Effects of Metformin Added to a Effects of Metformin Added to a SulfonylureaSulfonylurea
Glucose and Insulin ProfilesGlucose and Insulin Profiles
Insulinpmol/L
0
100
200
300
400
0800 1200 1800 2400
500Glucose
Time of day
mg/dL
0
100
200
300
0800 1200 1800 2400
Meal Meal Meal Meal

Oral Antihyperglycemic Oral Antihyperglycemic MonotherapyMonotherapy
Maximum Therapeutic Effect Maximum Therapeutic Effect on A1Con A1C
-0.50 -1.0 -1.5 -2.0
Nateglinide
Reduction in A1C (%)
Glipizide GITS
Glimepiride
Repaglinide
Pioglitazone
Acarbose
Metformin
Rosiglitazone
Diabetes Care. 2000;23:202-207; Precose (acarbose) package insert; Drugs. 1995;50:263-288; J Clin Endocrinol Metab. 2001;86:280-288; Diabetes Care. 2000;23:1605-1611; Diabetes Care. 1996;19:849-856; Diabetes Care. 1997;20:597-606; Am J Med. 1997;102:491-497

Treatment of Postprandial Treatment of Postprandial GlycemiaGlycemia
Conclusions From StudiesConclusions From Studies
Most oral agents control mainly fasting Most oral agents control mainly fasting
(basal) hyperglycemia(basal) hyperglycemia
Acarbose, miglitol, and nateglinide have the Acarbose, miglitol, and nateglinide have the
greatest effect on postprandial increments greatest effect on postprandial increments
and the least ability and the least ability
to reduce A1Cto reduce A1C

Time Course of Action ofTime Course of Action ofOral AntihyperglycemicsOral AntihyperglycemicsEffect on Fasting Plasma Effect on Fasting Plasma
GlucoseGlucose
DeFronzo RA et al. N Engl J Med. 1995;333:541-549; Fonseca V et al. JAMA. 2000;283:1695-1702; Goldberg RB et al. Diabetes Care. 1996;19:849-856
0 4 8 12 16
Weeks of treatment
0
-20
-40
-60
2
FPG(mg/dL) Glimepiride (4 mg)
Rosiglitazone (8 mg) added to metformin
Metformin (up to 2550 mg)

Selected Insulin Selected Insulin SecretagoguesSecretagogues
Dosing InformationDosing InformationRecommendedRecommended Usual Usual
Generic NameGeneric Name Dose StrengthsDose Strengths Dose RangeDose Range Maximal Maximal EffectEffect
GlimepirideGlimepiride 1, 2, or 4 mg1, 2, or 4 mg 1–8 mg1–8 mg 4 mg qd4 mg qd
Glipizide GITSGlipizide GITS 2.5, 5, or 10 mg2.5, 5, or 10 mg 2.5–20 mg2.5–20 mg 5 or 10 mg qd5 or 10 mg qd
GlyburideGlyburide 1.25, 2.5, or 5 mg1.25, 2.5, or 5 mg 1.25–20 mg1.25–20 mg 5 or 10 mg bid5 or 10 mg bid
NateglinideNateglinide 60 or 120 mg60 or 120 mg 180–360 mg180–360 mg 120 mg tid120 mg tid
RepaglinideRepaglinide 0.5, 1, or 2 mg0.5, 1, or 2 mg 1–16 mg1–16 mg 4 mg qid4 mg qid

Metformin, Metformin, -Glucosidase -Glucosidase Inhibitors, Inhibitors, GlitazonesGlitazones
Dosing InformationDosing InformationRecommendedRecommended UsualUsual
Generic NameGeneric Name Dose StrengthsDose Strengths Dose RangeDose Range Maximal EffectMaximal EffectMetforminMetformin 500, 850, or500, 850, or 500 mg qd to 1000 mg bid500 mg qd to 1000 mg bid
1000 mg1000 mg 850 mg tid850 mg tid
Metformin XRMetformin XR 500 mg500 mg 500 mg qd to 1000 mg bid500 mg qd to 1000 mg bid1000 mg bid1000 mg bid
AcarboseAcarbose 25, 50, or 100 mg25, 50, or 100 mg 25–100 mg tid25–100 mg tid 50 mg tid50 mg tid
MiglitolMiglitol 25, 50, or 100 mg25, 50, or 100 mg 25–100 mg tid25–100 mg tid 50 mg tid50 mg tid
PioglitazonePioglitazone 15, 30, or 45 mg 15, 30, or 45 mg 15–45 mg qd15–45 mg qd 45 mg qd45 mg qd
RosiglitazoneRosiglitazone 2, 4, or 8 mg2, 4, or 8 mg 4–8 mg daily4–8 mg daily 4 mg bid4 mg bid

Metabolic Effects of Metabolic Effects of Oral AntihyperglycemicsOral Antihyperglycemics
Sulfonylureas Acarbose Pioglitazone Meglitinides Metformin MiglitolRosiglitazone
Weight or
LDL cholesterol or
HDL cholesterol or
Triglycerides or

Medical BenefitsMedical BenefitsSubstantiated in Published Substantiated in Published
Clinical TrialsClinical TrialsMicrovascular Cardiovascular
Insulin Yes Yes?
Sulfonylureas Yes No
Metformin Yes Yes?
-Glucosidase inhibitors No No
Glitazones (TZDs) No No
Repaglinide, nateglinide* No No
* Recently available agents with few trials documenting long-term outcomes

Severe Adverse EffectsSevere Adverse Effects
Hypoglycemia CV
Insulin Yes No No
Sulfonylureas Yes No No
Metformin No No Yes
Lactic acidosis
-Glucosidase inhibitors No No No
Glitazones (TZDs) No Yes (CHF) No
Repaglinide, nateglinide* Yes No No
* Recently available agents with few trials documenting long-term outcomes CV=cardiovascular; CHF=congestive heart failure

Efficacy of Oral Efficacy of Oral AntihyperglycemicsAntihyperglycemicsDeclines With TimeDeclines With Time
A1C rises at ~0.2% to 0.3% yearly on stable therapyA1C rises at ~0.2% to 0.3% yearly on stable therapy This rate is the same as for diet alone, sulfonylureas, This rate is the same as for diet alone, sulfonylureas,
and metforminand metformin -Cell function declines at the same rate with all -Cell function declines at the same rate with all
these treatmentsthese treatments Combination treatments are routinely neededCombination treatments are routinely needed
UKPDS Group. Diabetes. 1995;44:1249-1258; Turner RC et al. JAMA. 1999;281:2005-2012

Secondary Failure of Secondary Failure of MonotherapyMonotherapy
Overweight Patients in the Overweight Patients in the UKPDSUKPDS
Turner RC et al. UKPDS 49. JAMA. 1999;281:2005-2012
Percent with A1C <7% on monotherapy
Diet 23 12 11
Sulfonylureas 45 28 21
Metformin 44 34 13
3 years 6 years 9 years

Insulin TherapyInsulin Therapy Who should be on Who should be on
insulin?insulin? Insulin DeficientInsulin Deficient
DKADKA Weight lossWeight loss
Patient on maximal Patient on maximal oral therapy oral therapy A1c not at goalA1c not at goal

Insulin TherapyInsulin Therapy
Basal insulin plus Basal insulin plus secretagoguesecretagogue Lantus HS (10 units)Lantus HS (10 units) NPH HS (10 units)NPH HS (10 units)
Bolus and BasalBolus and Basal 75/2575/25
Novolog or Humalog Novolog or Humalog with NPHwith NPH
70/3070/30 Regular with NPH Regular with NPH

New TherapiesNew Therapies Fat absorption blocker─orlistat (XenicalFat absorption blocker─orlistat (Xenical®®))
Oral intestinal lipase inhibitorOral intestinal lipase inhibitor Approved for obesity, proposed for diabetesApproved for obesity, proposed for diabetes
Amylin analogue─pramlintide (Symlin™)Amylin analogue─pramlintide (Symlin™) Slows gastric emptying, suppresses glucagon, increases Slows gastric emptying, suppresses glucagon, increases
satietysatiety Requires injectionRequires injection
GLP-1 analogues/agonists─exendin-4 (ByettaGLP-1 analogues/agonists─exendin-4 (ByettaTMTM) ) Potentiate insulin secretion, suppress glucagonPotentiate insulin secretion, suppress glucagon May promote May promote -cell neogenesis-cell neogenesis Require injectionRequire injection
GLP-1=glucagon-like peptide

Summary ofSummary ofOral Antihyperglycemic AgentsOral Antihyperglycemic Agents
Four major classesFour major classes of oral agents acting at different sites of oral agents acting at different sites
are availableare available Fasting and preprandial glucoseFasting and preprandial glucose are reduced by are reduced by
sulfonylureas, repaglinide, metformin, and glitazones sulfonylureas, repaglinide, metformin, and glitazones (TZDs), with lesser effects on postprandial increments(TZDs), with lesser effects on postprandial increments
Postprandial glucosePostprandial glucose increments are reduced best by increments are reduced best by -glucosidase inhibitors and nateglinide-glucosidase inhibitors and nateglinide
A1C reductionsA1C reductions are similar using sulfonylureas, are similar using sulfonylureas, metformin, and glitazonesmetformin, and glitazones
Secondary failureSecondary failure to monotherapy and oral therapies to monotherapy and oral therapies routinely occursroutinely occurs

Complications of Complications of DiabetesDiabetes
Type I and IIType I and II AtherosclerosisAtherosclerosis
StrokeStroke Heart diseaseHeart disease
RetinopathyRetinopathy Leading cause of Leading cause of
blindnessblindness NeuropathyNeuropathy
Peripheral Peripheral AutonomicAutonomic
NephropathyNephropathy Leading cause of end Leading cause of end
stage renal diseasestage renal disease One out of every 3 One out of every 3
patients on dialysis or patients on dialysis or transplant programtransplant program

Relative Risk
15
13
11
9
7
5
3
1
HbA1c %7 8 9 10 11 12
Diabetic retinopathyNephropathyNeuropathyMicroalbuminuria
Risk of Progression of Risk of Progression of Complications: DCCT Complications: DCCT
StudyStudy
Skyler JF. Endocrinol Metab Clin North Am. 1996;25:243-254.

Treatment of DiabetesTreatment of Diabetes
Treatment goalsTreatment goals Type I A1c < 7.0Type I A1c < 7.0 Type II A1c < 6.0Type II A1c < 6.0
Minimize hypoglycemiaMinimize hypoglycemia Maximize participation Maximize participation
in usual activitiesin usual activities

Goals of Diabetes Goals of Diabetes TreatmentTreatment
Early detection of Early detection of complications:complications: Annual retinal examAnnual retinal exam Annual renal examAnnual renal exam
(microalbuminuria, (microalbuminuria, Creatinine)Creatinine)
Frequent lower extremity Frequent lower extremity examinationsexaminations

Diabetes ManagementDiabetes Management
Home blood glucose Home blood glucose monitoringmonitoring 4 times daily4 times daily Periodically check at 3 AMPeriodically check at 3 AM
PM insulinPM insulin
Every yearEvery year TSH TSH Lipid panelLipid panel
Office visit Q3-4 Office visit Q3-4 monthsmonths Monitor HgbAMonitor HgbA1c1c Adjustment of Adjustment of
medicationmedication Examine injection sites Examine injection sites
HypertrophyHypertrophy LipoatrophyLipoatrophy
Blood pressureBlood pressure WeightWeight

ConclusionsConclusions Type II Diabetes is Type II Diabetes is
multifactorialmultifactorial Metabolic syndromeMetabolic syndrome Fatty acid excessFatty acid excess
TherapyTherapy Multiple agents neededMultiple agents needed With time insulin is neededWith time insulin is needed
Tight control prevents Tight control prevents complicationscomplications Silent diseaseSilent disease Assume 10 years of disease Assume 10 years of disease
and vascular damage at and vascular damage at time of diagnosistime of diagnosis

ConclusionsConclusions TherapyTherapy
Multiple agents neededMultiple agents needed With time insulin is neededWith time insulin is needed
Diet therapyDiet therapy Exercise Exercise Medical therapyMedical therapy
InsulinInsulin Oral agentsOral agents Adjunctive therapiesAdjunctive therapies
EducationEducation Diabetes Team Diabetes Team MD, RN CDE, Dietitian, Social MD, RN CDE, Dietitian, Social
work and Psychiatrywork and Psychiatry


Diet Therapy Lose weightLose weight
1 pound per week1 pound per week Decreased intake of 500-Decreased intake of 500-
1000 calories per day1000 calories per day 3500-7000 calories per 3500-7000 calories per
weekweek Decrease portion sizeDecrease portion size
Decrease carbohydrate Decrease carbohydrate intakeintake
Lower fat intakeLower fat intake Increase activityIncrease activity
Walk the dog Walk the dog (even if you don’t have (even if you don’t have one)one)

Pramlintide Reduces A1C and Pramlintide Reduces A1C and WeightWeight
Combination With Insulin for Type Combination With Insulin for Type 2 Diabetes2 Diabetes
Placebo + insulinPramlintide 150 g tid + insulin
Ratner RE et al. Diabetes Technol Ther. 2002;4:51-61
Week
A1C Placebo-subtracted difference 0.4%
WeightPlacebo-subtracted difference 2.5 kg
kg
-1.5
-1.0
-0.5
0
0.5
1.0
1.5
0 13 26 39 52
-0.8
-1.0
-0.6
-0.4
-0.2
0
0 13 26 39 52
A1C %
**PP<0.01<0.01
**PP<0.01<0.01
****
**
****
****
**
**

Synthetic Exendin-4 Reduces A1C Synthetic Exendin-4 Reduces A1C and Weightand Weight
28-Day Treatment of Type 2 Diabetes28-Day Treatment of Type 2 Diabetes
Fineman MS et al. Diabetes 2002;51:A85
A1C % 0
-0.2
-0.4
-0.6
-0.8
-1.0
-1.2
P0.006
-1.1%
-0.3%
-1.0
0
1.0
2.0
lb
-2.0
3.0
A1CPlacebo-subtracted difference -0.8%
WeightPlacebo-subtracted difference -2.9 lb
PlaceboAC2993 bid
109 Patients With Continued Treatment on Sulfonylurea, Metformin, or Both
-0.9
2.0

Orlistat Reduces A1C and Orlistat Reduces A1C and WeightWeight
Treatment of Patients With Treatment of Patients With Type 2 DiabetesType 2 Diabetes
A1C (%)
Week
-4 0 12 24 3648
0
-2
-4
-6
Hanefeld M et al. Diabetes Obes Metab. 2002;4:415-423
% bodyweightchange
-4 0 12 24 3648
9.0
8.5
8.0
7.5
7.0
PlaceboOrlistat 120 mg tid
P=P=0.0060.006PP=0.0003=0.0003
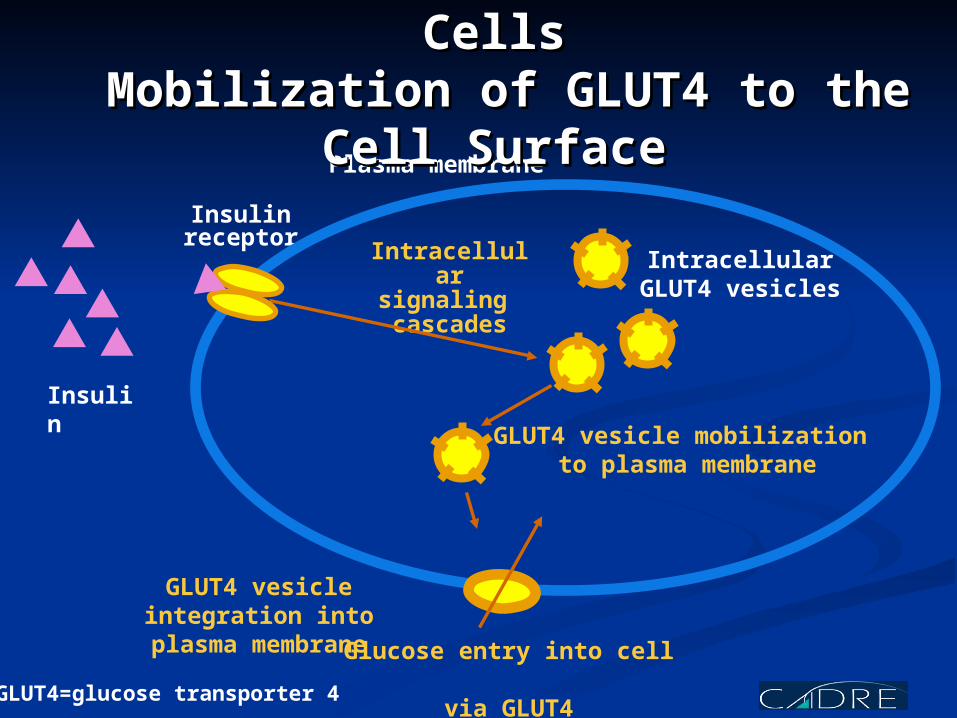
Insulin receptor
Plasma membrane
GLUT4 vesicle mobilization to plasma membrane
Insulin
Intracellular signaling cascades
Insulin Action in Muscle and Fat Insulin Action in Muscle and Fat CellsCells
Mobilization of GLUT4 to the Cell Mobilization of GLUT4 to the Cell SurfaceSurface
GLUT4 vesicle integration into plasma
membrane Glucose entry into cell via GLUT4
IntracellularGLUT4 vesicles
GLUT4=glucose transporter 4