Embed Size (px)
Citation preview

Potential of VLF PD measurements for diagnosis of stator insulation of large hydro generators
T. Brügger Fachkommission für Hochspannungsfragen
Switzerland
U. Ranninger, F. Öttl, M. Krüger OMICRON electronics GmbH
Austria
SUMMARY
As early as in the 1960s, VLF tests (VLF, very low frequency, commonly meaning a frequency of 0.1 Hz) were studied as an alternative to the DC tests previously used on stators of large synchronous generators. VLF tests presented themselves as an interesting alternative to DC tests, since the voltage distribution in the insulation at VLF corresponds significantly better to the operating conditions. Due to the significantly lower reactive power requirement for tests with VLF compared to tests with operating frequency, VLF sources are potentially also smaller and thus more mobile. The focus of the present study is on the applicability of the partial discharge (PD) diagnosis of stators at VLF test frequency. For this purpose, typical stator insulation faults are simulated numerically in order to investigate frequency-related differences in PD behaviour. The implications of these simulations match well with PD measurements on a complete stator as well as single test bars. It is shown that the VLF-PD measurement is of substantially less sensitivity than the measurement at operating frequency for practically significant insulation problems (slot or end corona protection damages). For the currently used mica/synthetic resin stator insulation systems, PD measurements close to the operating frequency will therefore remain the main diagnostic tool.
KEYWORDS
hydro generators, asset management, stator insulation, PD diagnosis, VLF tests
Paris 2020
A1-212

2
1. INTRODUCTION 1.1 Development of hydrogenator stator insulation Since the introduction of large rotating hydro generators, there has been a need to avoid unplanned outages as much as possible. The stator winding insulation system plays a central role in this, as it must withstand the electrical and mechanical stresses in decades of operation. The core component of winding insulation has not changed in the past hundred years, it still consists of an inorganic and partial discharge resistant mica barrier. What has changed are the filler and carrier materials (from shellac to asphalt and epoxy resin), the manufacturing technology (from pure manual winding to fully automatic winding machines) and in particular the field strengths from less than 1 kV / mm to about 3 kV / mm with mica/epoxy resin systems used today (see Figure 1).
Figure 1: Development of field strengths in hydro generator stator insulation [1]
1.2 Development of DC/VLF stator test technology As a result of reduced safety margins in the insulation system due to improved design methods, the importance of testing and diagnostic methods has grown steadily. Simple DC tests were already available in the first half of the last century, but it was known from the beginning that the voltage distribution in the layered machine insulation at operating frequency (50/60 Hz) was largely determined capacitively. The DC tests were therefore limited to rough diagnostic statements on the moisture content and the degree of surface contamination in the winding head. The demand for an AC test source that is as mobile as possible for periodic on-site tests was always hampered by the high capacities of stator windings, the resulting high reactive power requirement and thus the weight and volume of the test source. For this reason, around 1960, General Electric Co. began to research on the possibility of tests with a test frequency between zero (DC) and the operating frequency [2]. 1.3 Past studies on the ratio of DC / VLF test voltages Of particular note with regard to the subsequent investigation of VLF PD measurements is an experiment described in [3], in which the number of PD events in an artificial cavity in polyethylene was optically determined and correlated with the test voltage frequency. At 0.1 Hz, the number of PD per test voltage period was about a factor 10 lower than at 60 Hz. In DC tests with a voltage of the 0.1 Hz peak value, the number of PD per unit of

3
time was another order of magnitude smaller. In [3], also breakdown tests were carried out with service aged generator stator bars. The results are summarized in Table 1.
Table 1: Breakdown tests on service aged generator stator bars [3] DC [kV] 0.1 Hz [kVrms] 60 Hz [kVrms]
Maximum breakdown voltage 225 120 93
Minimum breakdown voltage 50 35 48
Average breakdown voltage 120 85 73
Number of tests 29 33 33
It can be seen that the average breakdown voltages at 60 Hz and 0.1 Hz are closer together compared to DC. In addition, the breakdown paths for DC often ran at the interfaces of insulation layers, whereas only short paths perpendicular to the layers were observed at 60 Hz and 0.1 Hz, which confirms that the breakdown mechanisms at 60 Hz and 0.1 Hz are fundamentally different compared to DC. An important result of this test (and other similar tests) is the relationship between the average breakdown voltage at 60 Hz and. at 0.1 Hz of approx. 1.2. The IEEE 433 [4] standard published in 1974 and revised in 2009 recommends a test voltage that is 1.15 times higher than at 60 Hz for tests with 0.1 Hz (VLF) and is based on the tests in [3]. 1.4 Investigation of PD diagnosis with VLF for specific insulation faults In [5] the behaviour of PD with a variation of the test voltage frequency from 1 mHz to 400 Hz is investigated experimentally with phase-resolved PD pattern analysis (PRPDA). It was found that the PD activity of cavities and delaminations in service aged generator bars decreased at test frequencies below 1 Hz. This has been attributed to the influence of surface conductivity in the cavities. Since the surface conductivity is supposed to have an influence also on the VLF PD diagnosis of other insulation faults, this is examined in more detail in this publication. In order to prevent PD due to an excessive potential increase at the slot exit, a resistive end winding corona protection with non-linear semiconducting properties is used in this area. In Figure 2, the influence of frequency on the potential rise is shown qualitatively. At lower frequencies, the longitudinal currents in the end winding corona protection caused by the stray capacitances decrease, which leads to an even flatter rise in potential [6].
Figure 2: Influence of the end winding corona protection on potential rise at operating and VLF frequency

4
The transition from the slot to the end winding corona protection is one of the critical points in the insulation of stator bars, which is why the influence of the test frequency on the PD diagnosis of faults in this area is also examined in detail. 2. INFLUENCE OF SURFACE CONDUCTIVITY ON VLF PD DIAGNOSIS The influence of surface conductivity on the behaviour of PD was first examined using an artificial slot corona protection fault. In contrast to the unknown number of PD sources in cavities and delaminations in the interior of the insulation, an artificial slot corona protection fault represents a single PD source that is easily accessible on the one hand and also of considerable importance on the other hand because this type of fault is a common problem in operation due to abrasion on the laminated core due to vibrations. For the experimental investigation, a square piece the slot corona protection was removed on a test bar (Figure 3) and the mica insulation underneath thus exposed.
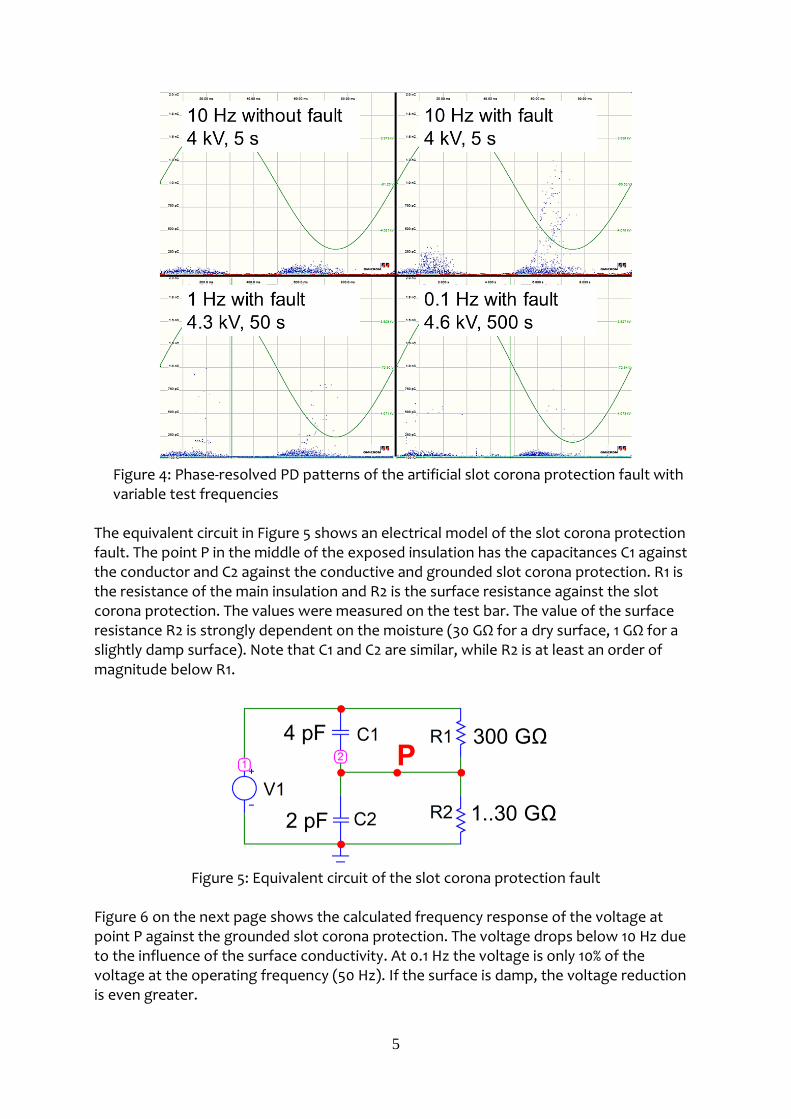
Figure 3: Test bar with artificial slot corona protection fault Subsequently, PD measurements were carried out with test frequencies of 10 Hz, 1 Hz and 0.1 Hz. In order to obtain an equal number of test voltage periods, the PD patterns were recorded at 10 Hz for five seconds and for 500 seconds at 0.1 Hz. In the 0.1 Hz (VLF) test the factor of 1.15 proposed in the IEEE standard [4] was used. Figure 4 shows the results. At 10 Hz and a test voltage of 4 kV, the insulation fault can already be clearly seen after 5 s of measurement in the phase-resolved PD pattern (Figure 4, top right). At 1 Hz (4.3 kV), significantly fewer PD events were registered in the same number of voltage periods. At 0.1 Hz (4.6 kV) virtually no PD were detected.
5
Figure 4: Phase-resolved PD patterns of the artificial slot corona protection fault with variable test frequencies
The equivalent circuit in Figure 5 shows an electrical model of the slot corona protection fault. The point P in the middle of the exposed insulation has the capacitances C1 against the conductor and C2 against the conductive and grounded slot corona protection. R1 is the resistance of the main insulation and R2 is the surface resistance against the slot corona protection. The values were measured on the test bar. The value of the surface resistance R2 is strongly dependent on the moisture (30 GΩ for a dry surface, 1 GΩ for a slightly damp surface). Note that C1 and C2 are similar, while R2 is at least an order of magnitude below R1.
Figure 5: Equivalent circuit of the slot corona protection fault
Figure 6 on the next page shows the calculated frequency response of the voltage at point P against the grounded slot corona protection. The voltage drops below 10 Hz due to the influence of the surface conductivity. At 0.1 Hz the voltage is only 10% of the voltage at the operating frequency (50 Hz). If the surface is damp, the voltage reduction is even greater.

6
Figure 6: Frequency dependence of the voltage P (see Figure 5) against the grounded slot corona protection For the measured capacitance and resistance values, the simulation coincides with the experimental observation of decreasing PD activity with decreasing test frequency. At frequencies below 1 Hz, the voltage on the insulating surface (point P) is mainly determined resistively. Since the surface resistance is small compared to the resistance of the main insulation, the voltage falls below the PD inception voltage at lower frequencies. The quantitative influence of surface conductivity in cavities and delaminations on the PD behaviour at VLF test frequency is not examined in more detail here. However, if one looks at a cavity inside the main insulation, it can be assumed that the surface conductivity of the cavity is also significantly greater than the conductivity of the surrounding main insulation. In contrast, the capacity of the cavity is larger than the capacities between the cavity and the conductor and grounded slot corona protection. As the frequency drops, the voltage across the cavity will also decrease and fall below the PD inception voltage. This assumption is corroborated by the results of the work mentioned in the introduction [6]. 3. PD BEHAVIOUR OF THE END WINDING CORONA PROTECTION AT VLF TEST FREQUENCY The resistive resp. semiconducting end winding corona protection controls, as mentioned above, the potential rise at the slot exit. It is a highly stressed element of the insulation system, since stronger vibrations occur in the winding head than in the slot part. A poor (electrical) connection to the slot corona protection or vibration-related abrasion on the edges of the laminated core or support elements can cause damage that result in PD. Figure 7 on the following page shows equivalent circuit diagrams of the winding head section with and without end winding corona protection. The end winding corona protection is modelled with non-linearly decreasing shunt resistances. The other elements are the ground stray capacities as well as capacities and resistances of the main insulation.

7
Figure 7: Equivalent circuits for the winding head with and without resistive/semi-conducting end winding corona protection
Figure 8 shows the simulated potential curves at the slot exit with and without end winding corona protection, and with end winding corona protection at a variable test frequency.
Figure 8: Potential over length L at the slot exit depending on the test frequency
With decreasing frequency, the potential is increasingly determined by the resistive elements and continues to flatten. This means that the tangential voltage component in the area after the slot exit becomes smaller.
8
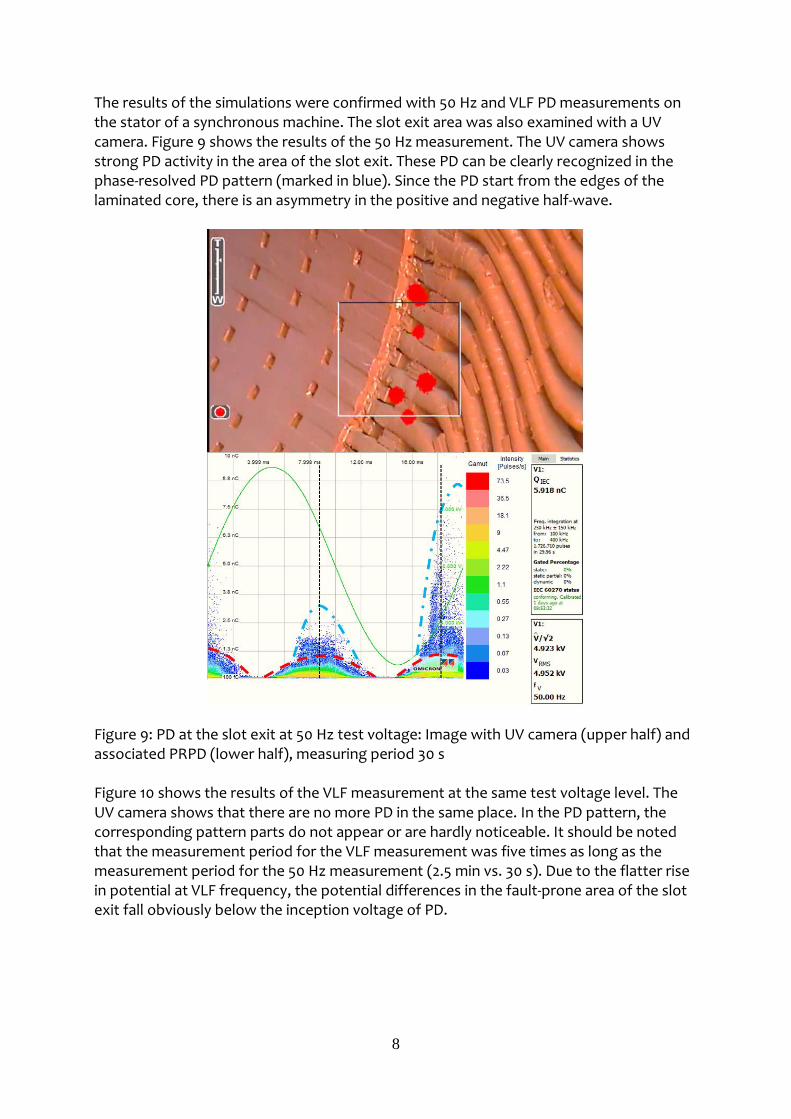
The results of the simulations were confirmed with 50 Hz and VLF PD measurements on the stator of a synchronous machine. The slot exit area was also examined with a UV camera. Figure 9 shows the results of the 50 Hz measurement. The UV camera shows strong PD activity in the area of the slot exit. These PD can be clearly recognized in the phase-resolved PD pattern (marked in blue). Since the PD start from the edges of the laminated core, there is an asymmetry in the positive and negative half-wave.
Figure 9: PD at the slot exit at 50 Hz test voltage: Image with UV camera (upper half) and associated PRPD (lower half), measuring period 30 s Figure 10 shows the results of the VLF measurement at the same test voltage level. The UV camera shows that there are no more PD in the same place. In the PD pattern, the corresponding pattern parts do not appear or are hardly noticeable. It should be noted that the measurement period for the VLF measurement was five times as long as the measurement period for the 50 Hz measurement (2.5 min vs. 30 s). Due to the flatter rise in potential at VLF frequency, the potential differences in the fault-prone area of the slot exit fall obviously below the inception voltage of PD.

9
Figure 10: Slot exit with VLF test voltage: Image with UV camera (upper half) and associated PRPD (lower half), measuring period 2 min 30 s
4. CONCLUSION Since PD measurements with VLF test frequency (0.1 Hz) can potentially be carried out with smaller test sources and thus more efficiently than operating frequency tests, the influence of the test frequency on the PD diagnosis of faults in the slot corona protection and end winding corona protection was examined, since these are common faults in the stator insulation system. For this purpose, slot corona protection faults and the resistive (semi-conductive) end winding protection were numerically simulated in order to determine the presumed influence of surface conductivities on the PD behaviour with decreasing test frequency. With typical (surface) resistance and capacitance values of a mica/epoxy resin insulation it could be shown that the potential distribution at the operating frequency is mainly determined capacitively, but resistively with VLF. With the VLF test frequency, this leads to significantly lower potential differences in the area of common insulation faults as a result of which the voltages that occur may fall below the inception voltage of PD. The PD activity at VLF test frequency is thus not only reduced by the number of voltage periods, which, with measurement periods of the same length, is two orders of magnitude smaller than in the operating frequency test, but also by the transition between 50 Hz and 0.1 Hz to a resistive potential distribution. In the experimental PD measurements on a test stator

10
bar, the PD of an artificial slot corona protection fault could no longer be measured at 0.1 Hz, which is in line with the results of the simulation. The fault-prone end winding protection in the area of the slot exit was also simulated. Here, too, the potential distribution between the operating and VLF frequencies changes significantly. The increasing influence of the resistive elements at lower frequencies causes a flatter rise in potential at the slot exit. The voltage stress on insulation defects in this area at VLF test frequency is so low that the PD inception voltage is no longer reached, which makes diagnosis difficult or impossible. For these reasons, the PD measurement with test frequencies in the range of the operating frequency (> approx. 10 Hz) remains indispensable for a meaningful diagnosis of the insulation systems currently used.
BIBLIOGRAPHY
[1] Sumereder, C.: Statistical Lifetime of Hydro Generators and Failure Analysis, IEEE Trans. on Dielectrics and El. Insulation, Vol. 15, No. 3, Juni 2008.
[2] Virsberg, L. G.: Spannungsprüfung grosser elektrischer Maschinen mit 0.1 Hz, Asea-Zeitschrift, Heft 3, Jahrgang 12, 1967.
[3] Bhimani, B. V.: Very-Low-Frequency High-Potential Testing, AIEE Trans. Pt. III, Vol. 80, Juni 1961.
[4] IEEE 433-2009: IEEE Recommended Practice for Insulation Testing of Large AC Rotating Machinery with High Voltage at Very Low Frequency, Revision of IEEE Std 433-1974.
[5] Edin, H.: Partial Discharges Studied with Variable Frequency of the Applied Voltage, PhD dissertation, KTH, Stockholm, 2001.
[6] Virsberg, L. G.; Kelen, A.: Some Observations on the Very-Low-Frequency Testing of High-Voltage Machine Insulation, Proceedings of the 20th Int. Conf. on Large Electric Systems (Cigré), Paper 108, June 1964.
![CSD Paraprofessional Handbook - Home - · Web viewCSD Paraprofessional Handbook Page 13 of 13 [Type here][Type here][Type here] Chamberlain School District Paraprofessional Handbook](https://img.pdfslide.us/doc/110x75/5aa3aaf67f8b9ab4208e8de9/csd-paraprofessional-handbook-home-viewcsd-paraprofessional-handbook-page.jpg)
![[Type here] [Type here] [Type here] · 2020-01-01 · [Type here] [Type here] [Type here] Travis Labrum . Ama Nyame-Mensah . TABLE OF CONTENTS . Greetings from the ... We look forward](https://img.pdfslide.us/doc/110x75/5f0583317e708231d41354b2/type-here-type-here-type-here-2020-01-01-type-here-type-here-type-here.jpg)
![christspringfield.orgchristspringfield.org/.../sites/53/...New-10-am-final-bulleti… · Web view[Type here][Type here][Type here] Fourth](https://img.pdfslide.us/doc/110x75/5f0484717e708231d40e5cdc/-web-view-type-heretype-heretype-here-fourth.jpg)


![public Finance Management boardd10k7k7mywg42z.cloudfront.net/assets/5aac29a340780805c...[Type here] [Type here] [Type here] PUBLIC FINANCE MANAGEMENT BOARD Fiscal Year 2016 Annual](https://img.pdfslide.us/doc/110x75/5e78350fc178aa42025e850e/public-finance-management-type-here-type-here-type-here-public-finance.jpg)

![School-Based Leadership Team (SBLT) Toolkit 2017-2018 · [Type here] [Type here] [Type here] School-Based Leadership Team (SBLT) Toolkit 2017-2018 mmsd.org/sblttoolkit](https://img.pdfslide.us/doc/110x75/5b360b767f8b9a6b548dee66/school-based-leadership-team-sblt-toolkit-2017-2018-type-here-type-here.jpg)


![[ TYPE THESIS TITLE HERE ]](https://img.pdfslide.us/doc/110x75/588b11101a28ab090d8bc2fc/-type-thesis-title-here-.jpg)

![[Type Client Here]](https://img.pdfslide.us/doc/110x75/62680d71277ff5675d1a0960/type-client-here.jpg)