Embed Size (px)
Citation preview
TYPE 2 DIABETES MELLITUS IN THE ARUMERU DISTRICT OF NORTHERN
TANZANIA: EVALUATION OF THE PREVALENCE AND ASSOCIATED
RISK FACTORS IN RURAL COMMUNITIES
By
BENJAMIN JOHN MILLER
A dissertation submitted in partial fulfillment of
the requirements for the degree of
DOCTOR OF PHILOSOPHY
WASHINGTON STATE UNIVERSITY
College of Nursing
May 2013
© Copyright by Benjamin J Miller, 2013
All Rights Reserved

© Copyright by Benjamin J Miller, 2013
All Rights Reserved
ii
To the Faculty of Washington State University:
The members of the Committee appointed to examine the dissertation of BENJAMIN
JOHN MILLER find it satisfactory and recommend it be accepted.
________________________________________
Lorna L Schumann, Ph.D., Chair
________________________________________
John Roll, Ph.D.
________________________________________
Robert Short Ph.D.
________________________________________
Cynthia Corbett, Ph.D.
iii
Acknowledgement
I would like to thank my family for their continued support. Spending summers in Tanzania,
learning about the community and culture has required patience and understanding. To my wife,
thank you for everything. To my children, the times I was not home, the sacrifices you have
made, helped this dream to come true.
I wish to thank my committee members for the endless time spent reading
and offering insight and wisdom into this dissertation.
Dr. Leonard Mboera, with the National Institute for Medical Research in Dar es Salaam. Thank
you for working with me these past several years. Your role as my local collaborator on this
research project was invaluable. Your patience in helping me navigate the
research regulations cannot really be acknowledged by words alone.
During the summer of 2012, I could not have tested 709 people in Tanzania without the help of
Tyler Ellis, Summer Carney, and Sarah Berg. Taking time out of your life helped me accomplish
this goal. Because of your commitment and the work of the other members of our group, this
project came to life. The information we collected will make a difference in the
lives in this region. This could not have occurred without your help.
Asante Sana!
Askofu Eliud Issangya: Asante sana kwa urafiki na mchango wenu mkubwa. Ushirikiano
mlionipa umewezesha kukamilisha utafiti huu katika muda uliokusudiwa. Maneno yangu
hayawezi kuonesha hisia za shukrani nilizonazo kwa watu wote wa Sakila na Arumeru
kwa ujumla. Shukrani zangu za kipekee ni kwa International Evangelism Centre na
wafanyakazi wake wote ambao wamenisaidia kufanikisha utafiti huu.
iv
TYPE 2 DIABETES MELLITUS IN THE ARUMERU DISTRICT OF NORTHERN
TANZANIA: EVALUATION OF THE PREVALENCE AND ASSOCIATED
RISK FACTORS IN RURAL COMMUNITIES
Abstract
by Benjamin John Miller, Ph.D.
Washington State University
May 2013
Chair: Lorna L. Schumann
Purpose: Describe the prevalence of diabetes in rural northern Tanzania and the association
between biometric markers and lifestyle indicators with diabetes, hypertension, and obesity.
Background: Diabetes in sub-Sahara Africa is expected to increase by 161% in the next 15
years. Estimates suggest the prevalence of diabetes is 4.8% in east Africa and 1.4% in rural
Tanzania. The cost of health care is high when compared to average household income.
Understanding prevalence rates as well as increased risk factors will help develop preventative
interventions.
Methods: Cross-sectional observational study was used to estimate the indirect the age-adjusted
prevalence rates of pre-diabetes and diabetes in rural Tanzania. Data regarding socioeconomic
status (SES), past medical history, behavioral lifestyle factors, and anthropometric measurements
described the association and odds ratio for the development of impaired glucose metabolism
(IGM), hypertension (HTN) and excessive adiposity.
Findings: The age adjusted rates for pre-diabetes and T2DM are 2.55% (95% CI [0.06; 0.1]) and
2.81% (95% CI [0.07; 0.12]), respectively. Impaired glucose metabolism (IGM) was associated
with excessive adiposity (p=.003) and hypertension (p=.001). Advancing age was significantly
associated with IGM (p=.004), HTN (p=.001) and excess adiposity (p<.001). Higher glucose
v
levels were associated with an increased risk of developing hypertension (p=.001) and excessive
adiposity (p=.006). Factors associated with excess adiposity included advancing age, female
gender (p<.001) and wooden or concrete household flooring (p=.001). When regressed, higher
frequency of sweet drink consumption was associated with higher fasting plasma glucose levels
(p=.012).
Significance: The prevalence of pre-diabetes and diabetes has been established in the rural
AruMeru district Tanzania. Socioeconomic development increased the risk of developing
hypertension, diabetes, and adiposity. Understanding the prevalence rates for diabetes and factors
with IGM will guide in the planning intervention strategies and health policy.
vi
Table of Contents
Acknowledgement ......................................................................................................................... iii
Abstract .......................................................................................................................................... iv
Table of Contents ........................................................................................................................... vi
List of Tables .................................................................................................................................. x
List of Figures ............................................................................................................................... xii
Chapter 1 ......................................................................................................................................... 1
Background ................................................................................................................................. 2
Globalization and urbanization. .............................................................................................. 2
Type 2 diabetes mellitus. ........................................................................................................ 3
Economics. .............................................................................................................................. 5
Complications. ........................................................................................................................ 7
Tanzania ...................................................................................................................................... 7
Research Questions ................................................................................................................... 10
Specific aims. ........................................................................................................................ 10
Theoretical Model ..................................................................................................................... 10
Conclusions ............................................................................................................................... 11
Chapter 2 ....................................................................................................................................... 12
Diagnosis of Type 2 Diabetes Mellitus ..................................................................................... 14
Type 2 Diabetes in Sub-Sahara Africa and Tanzania ............................................................... 16
Diabetes in Tanzania. ............................................................................................................ 22
Type I diabetes in sub-Sahara Africa. ................................................................................... 24
Tropical diabetes. .................................................................................................................. 25
vii
Risk Factors for Diabetes in Tanzania ...................................................................................... 25
Wealth. .................................................................................................................................. 27
Body Mass Index. ................................................................................................................. 28
Obesity in Sub-Sahara Africa. .............................................................................................. 29
Conclusions ............................................................................................................................... 30
Chapter 3 ....................................................................................................................................... 31
Research Design........................................................................................................................ 31
Participants ................................................................................................................................ 33
Participant recruitment. ......................................................................................................... 33
Inclusion criteria. .................................................................................................................. 34
Exclusion criteria. ................................................................................................................. 35
Human Subjects Protection. .................................................................................................. 35
Data Collection ......................................................................................................................... 36
Variables ................................................................................................................................... 37
Demographic variables. ........................................................................................................ 37
Socioeconomic variables. ..................................................................................................... 37
Lifestyle variables. ................................................................................................................ 38
Glucose. ................................................................................................................................ 38
Blood Pressure. ..................................................................................................................... 40
Body Mass Index. ................................................................................................................. 40
Waist-to-Hip Ratio. ............................................................................................................... 41
Medical follow-up ..................................................................................................................... 41
Analysis Plan ............................................................................................................................ 42
viii
Aim 1. ................................................................................................................................... 42
Aim 2. ................................................................................................................................... 43
Aim 3. ................................................................................................................................... 44
Conclusions ............................................................................................................................... 44
Chapter 4 ....................................................................................................................................... 45
Descriptive analysis .................................................................................................................. 45
Prevalence ................................................................................................................................. 47
Anthropometric findings ........................................................................................................... 48
Impaired glucose metabolism and demographic/biometric indicators. .................................... 48
Hypertension and demographic/biometric indicators. .......................................................... 50
Adiposity and demographic/biometric indicators. ................................................................ 51
Impaired glucose metabolism and globalization................................................................... 53
Hypertension and globalization. ........................................................................................... 55
Adiposity and globalization. ................................................................................................. 56
Conclusions ............................................................................................................................... 57
Chapter 5 ....................................................................................................................................... 59
Prevalence of diabetes............................................................................................................... 59
Biometric indicators of health ................................................................................................... 61
Globalization and Wealth ......................................................................................................... 63
Habits. ................................................................................................................................... 63
Lifestyle/wealth..................................................................................................................... 64
Limitations of the study ............................................................................................................ 67
Conclusions ............................................................................................................................... 70
ix
References ..................................................................................................................................... 72
Appendix A ................................................................................................................................... 92
Human subject’s protection certificates .................................................................................... 92
Washington State University Institutional Review Board. ................................................... 92
National Institute for Medical Research, Ethical Clearance Certificate. .............................. 93
Appendix B ................................................................................................................................... 94
Research Protocol Forms .......................................................................................................... 94
IRB approved consent: English version. ............................................................................... 96
IRB approved consent. ........................................................................................................ 100
Data collection form: English version. ............................................................................... 104
Data collection form: Swahili with English subtitles. ........................................................ 106
Results sheet provided to participant. ................................................................................. 108
Appendix C ................................................................................................................................. 110
Individual village results ......................................................................................................... 110
Meru Central. ...................................................................................................................... 110
Leguruki. ............................................................................................................................. 111
Mareu. ................................................................................................................................. 112
Maga Ya Chai. .................................................................................................................... 113
Ngurdoto. ............................................................................................................................ 114
Kikititi. ................................................................................................................................ 115
Kingori. ............................................................................................................................... 116
x
List of Tables
TABLE 1 DISTRIBUTION OF DIABETES AND IMPAIRED GLUCOSE TOLERANCE PREVALENCE .......... 117
TABLE 2 GLOBAL HEALTHCARE EXPENDITURE FOR DIABETES IN 2010 ........................................ 118
TABLE 3 HISTORICAL DIAGNOSTIC CRITERIA OF TYPE 2 DIAEBTES MELLITUS .............................. 119
TABLE 4 SUMMARY OF EPIDEMIOLOGY STUDIES IN SUB-SAHARA AFRICA ................................... 120
TABLE 5 SELECTED VILLAGES FOR RESEARCH LOCATIONS ........................................................... 123
TABLE 6 INCLUSION AND EXCLUSION CRITERIA .......................................................................... 124
TABLE 7 RECODING OF DEMOGAPHIC AND BIOMETRIC VARIABLES .............................................. 125
TABLE 8 RECODING OF SOCIOECONOMIC VARIABLES ................................................................... 126
TABLE 9 RECODING OF LIFESTYLE VARIABLES ............................................................................. 127
TABLE 10 DESCRIPTION OF VILLAGE STATISTICS ......................................................................... 128
TABLE 11 CRUDE AND AGE-ADJUSTED PREVELENCE RATES OF PRE-DIABETES AND DIABETES ..... 129
TABLE 12 EXAMINING THE ASSOCIATION BETWEEN IGM, HTN, AND ADIPOSITY ........................ 130
TABLE 13 STRENGTH OF ASSOCIATION OF BIOMETRIC INDICES ON FPG, SBP, AND BMI ............. 131
TABLE 14 ODDS ASSESSMENT OF BIOMETRIC VARIABLES ASSOCIATED WITH THE DEVELOPMENT
OF IMPAIRED GLUCOSE TOLERANCE ............................................................................ 132
TABLE 15 ODDS ASSESSMENT OF BIOMETRIC VARIABLES ASSOCIATED WITH THE DEVELOPMENT
OF HYPERTENSION ....................................................................................................... 133
TABLE 16 ODDS ASSESSMENT OF BIOMETRIC VARIABLES ASSOCIATED WITH THE DEVELOPMENT
OF EXCESSIVE ADIPOSITY ............................................................................................. 134
TABLE 17 ASSOCIATION BETWEEN LIFESTULE INDICATORS AND IGM, HTN, AND ADIPOSITY ..... 135
TABLE 18 ASSOCIATION OF LIFESTYLE BEHAVIORS N FPG, SBP, AND BMI ................................ 136
xi
TABLE 19 ASSOCIATED SOCIOECONOMIC FACTORS AND THE DEVELOPMENT OF ELEVATED
FPG, SBP, AND BMI ................................................................................................... 137
TABLE 20 ODDS ASSESSMENT OF LIFESTYLE AND ECONOMIC VARIABLES AND THE DEVELOPMENT
OF IMPAIRED GLUCOSE METABOLISM ........................................................................... 138
TABLE 21 ODDS ASSESSMENT ON LIFESTULE AND ECONOMIC VARIABLES AND THE DEVELOPMENT
OF HYPERTENSION ....................................................................................................... 139
TABLE 22 ODDS ASSESSMENT OF LIFESTYLE AND ECONOMIC VARIABLES AND THE DEVELOPMENT
OF EXCESSIVE ADIPOSITY ............................................................................................. 140
xii
List of Figures
FIGURE 1 GLOBAL LIFE EXPCTANCE BY INCOME STATUS ............................................................. 141
FIGURE 2 FACTORS CONTRIBUTING TO THE DEVELOPMENT OF CHRONIC DISEASE ....................... 142
FIGURE 2 FACTORS CONTRIBUTING TO THE DEVELOPMENT OF CHRONIC DISEASE ....................... 142
FIGURE 3 GLOBAL PERSPECTIVE OF THE AFRICIAN CONTINENT ................................................... 143
FIGURE 4 MAP OF TANZANIA ...................................................................................................... 144
FIGURE 5 MAP OF ARUSHA REGION IN TANZANIA ....................................................................... 145
FIGURE 6 CAPILLARY BLOOD SAMPLE SIZE ................................................................................. 146
FIGURE 7 PARTICIPANT SCREENING RESULTS .............................................................................. 147
FIGURE 8 AVERAGE NUMBER OF SWEET DRINKS CONSUMED PER WEEK ...................................... 148
1
Chapter 1
Diabetes is a chronic health condition that is becoming a global epidemic. In developing
countries, traditional tribal societies are adopting a modern lifestyle, while developing chronic
health conditions typically associated with developed nations (Assah, Ekelund, Brage, Mbanya,
& Wareham, 2011). The direct and indirect disease burden exceeds the financial and human
resources of the healthcare system in sub-Sahara Africa (SSA) (Kirigia, Sambo, Sambo, &
Barry, 2009). Currently, hypertension, diabetes, and coronary artery disease are the leading
chronic health conditions observed in sub-Sahara Africa (Dalal et al., 2011; Habib & Saha, 2010;
Kapiga, 2011). Infectious diseases such as human immunodeficiency virus (HIV), tuberculosis
(TB), and malaria are the leading cause of death in sub-Sahara Africa; however, with
international attention to these conditions, treatment options are improving and the mortality
rates are decreasing (Dalal et al., 2011; Joint United Nations Programme on HIV/AIDS WHO,
2006). Treatment of infectious disease has led to increased life expectancy, as well as an
increased prevalence of non-communicable diseases (Levitt, Steyn, Dave, & Bradshaw, 2011).
The combination of communicable and non-communicable diseases, referred to as double
disease burden, has increased (de-Graft Aikins et al., 2010; Levitt et al., 2011). According to
Unwin (1999), the prevalence of non-infectious diseases in developing countries will soon
outpace infectious diseases. The magnitude of these predictions were echoed by others (Dalal et
al., 2011; Habib & Saha, 2010; Lopez, Mathers, Ezzati, Jamison, & Murray, 2006), suggesting
chronic health conditions are becoming a significant concern. Currently, mortality from
communicable diseases accounts for 69% of the overall mortality in SSA, but the age specific
chronic disease mortality is sevenfold higher in low income versus high income countries (de-
Graft Aikins et al., 2010) (see Figure 1). The reason for this change is not entirely clear;
2
however, migratory patterns from rural to urban communities, adoption of a western lifestyle,
and longer life expectancy seem to contribute to the prevalence of chronic disease morbidity and
mortality (Assah et al., 2011). Products and services once available in developed countries, such
as cellular phones, motorized vehicles, and soda beverages are now easily accessible in low-
income countries. Access to western products is part of globalization and a significant
contributor to the adoption of a western lifestyle.
Background
Globalization and urbanization.
Globalization is a process where villages, regions, countries, and continents are becoming
interconnected through the movement of people, products, capital, and ideas (Maher, Smeeth, &
Sekajugo, 2010). Advancements in transportation, telecommunications, economic development,
and global awareness are contributing to development and urbanization around the world. The
United Nations Populations Division estimates that more than 50% of the world’s population
resides in urban settings. The population in Tanzania is currently 75-80% rural dwellers,
however this number is expected to change significantly by 2045; estimates predict more than
50% of the population will reside in urban communities (United Nations, 2007). The forecasted
urban growth in Tanzania will be in part of natural population growth--estimated at 60%--while
migration and spatial expansion will account for the remainder (Montgomery, 2008).
Globalization and urbanization present significant changes to dietary and lifestyle
behaviors not only in the urban setting, but in the neighboring cities and villages with urban
expansion (Montgomery, 2008; Seto, Fragkias, Güneralp, & Reilly, 2011). Access to processed
foods, sweetened drinks, refined sugars, animal products, changes in edible cooking oils, and a
decrease in daily activity has resulted in increasing rates of obesity, cardiovascular disease, and
3
diabetes (Assah et al., 2011; Maher et al., 2010; Maruapula et al., 2011; Nesto, Nelinson, &
Pagotto, 2009) (see Figures 1 and 2). Studies have identified a higher prevalence rate of T2DM
in the urban communities compared to rural dwellers in Tanzania, Mozambique, Cameroon, and
Kenya (Aspray et al., 2000; Christensen et al., 2009; Silva-Matos et al., 2011; Sobngwi et al.,
2004).
Type 2 diabetes mellitus.
T2DM is a significant global problem around the world and has health authorities
concerned (Danaei et al., 2011; Hall, Thomsen, Henriksen, & Lohse, 2011). According to the
International Diabetes Federation Atlas (2011), there are more than 366 million people
worldwide with diabetes and this number is expected to exceed 500 million people by the year
2030 (Whiting, Guariguata, Weil, & Shaw, 2011). The Middle East and Northern Africa
(MENA) region have the highest prevalence of diabetes (11.0%) followed by North America and
Caribbean (NAC) region (10.7%) and South and Central America region (9.2%).
The WHO Africa region, which consist of all of sub-Sahara Africa, currently has the
lowest prevalence of diabetes at 4.5% (Whiting et al., 2011) (see Table 1). The highest change in
T2DM prevalence rates over the next 25 years will involve the Arab crescent countries (83-166%
increase) and sub-Sahara Africa (90-161% increase) (Whiting et al., 2011; Wild, Roglic, Green,
Sicree, & King, 2004). These predictions were made from regional estimates using data collected
from the 1990 and 2000 global burden of disease study. When data was not available for a
specific country, prevalence estimates from neighboring countries provided regional estimates
for the country. A follow-up study by Whiting et al. (2011) predicted that the prevalence of
diabetes in sub-Sahara Africa will increase by 90% by the year 2030 (Whiting et al., 2011).
Whiting’s data compared the regional increases in diabetes prevalence from the International
4
Diabetes Federation’s 2011 Atlas and suggested these data were a conservative estimate of the
diabetes prevalence, noting that more than 80% of people with diabetes are undiagnosed
(Whiting et al., 2011).
An accurate description of diabetes prevalence and associated risk factors can lead to
behavior modification and other preventative interventions to decrease the burden of diabetes, as
well as associated chronic conditions, such as coronary artery disease, cerebrovascular disease,
chronic kidney disease, retinopathy, and tropic diabetic limb (Abbas, Lutale, Game, & Jeffcoate,
2008; Huffman et al., 2011). Prevention is an essential component in disease management in
economically constrained low-income countries. Available evidence suggests that in sub-Sahara
Africa, T2DM is primarily related to obesity resulting from dietary and lifestyle changes,
suggesting it can be a preventable condition (Idemyor, 2010; Travers & McCarthy, 2011). A
dietary change from high fiber diet with complex carbohydrates and fruits to a diet that includes
edible oils, processed goods, refined sugars, and non-alcoholic ready to drink beverages (NRTD)
has resulted in a pandemic of obesity in urban dwellers (Maruapula et al., 2011; Popkin, Adair,
& Ng, 2012).
T2DM is one aspect of glucose metabolic disorders, which has numerous etiologic
origins including genetic, epigenetic, and lifestyle (Bonnefond, Froguel, & Vaxillaire, 2010;
Cruickshank et al., 2001; Travers & McCarthy, 2011). Recent advances demonstrated that
several loci associated with obesity, pancreatic β-cell dysfunction, decrease in β-cell mass, and
environmental mutations are also associated with an increased risk of developing T2DM
(Malecki, 2005; McCarthy, 2010; Stitzel et al., 2010; Travers & McCarthy, 2011). Many
different genes are implicated in the pathogenesis of T2DM. Interestingly, in the genome wide
scans, the genes associated with diabetes in northern European populations did not have the same
5
association in west African populations (McCarthy, 2010). There is evidence that maternal and
childhood epigenetic exposure may increase the risk of T2DM in later life (Chen et al., 2007;
Prokopenko, McCarthy, & Lindgren, 2008) (see Figure 2). While more knowledge about genetic
factors associated with T2DM continue to be discovered, the presence of obesity and sedentary
lifestyle continue to overshadow genetic causes (Cruickshank et al., 2001; Malecki, 2005; Osei,
Schuster, Amoah, & Owusu, 2003; Travers & McCarthy, 2011).
Obesity has positive connotations in low-income countries representing wealth and
health. Residents in rural communities engage in activities to promote obesity by consuming
sweet drinks and increasing fat consumption to have a visual appearance of wealth (Selembo,
2009). The desire to become overweight has a strong association with the development of
diabetes; however, undernourishment is representative of disease and illness (Renzaho, 2004).
The pathophysiology of T2DM is complex, but closely associated with obesity. Adipose cells
function as endocrine cells releasing resistin and leptin, which suppress adiopenectin, an insulin
synthesizer, resulting in insulin resistance. Chronic hyperglycemia down regulates the GLUT3
transport molecules resulting in apoptosis of the pancreatic β-cells and decreasing insulin
production (Gallagher, Leroith, & Karnieli, 2011; Leroith, 2012; Miller, 2013). Often times these
pathophysiologic changes with obesity remain unrecognized until diabetes has progressed to end
organ damage. In an attempt to provide the visual appearance of health, some people in
developing countries unknowingly contribute to health risks (Renzaho, 2004; Selembo, 2009).
Economics.
According to the World Bank, most of the 47 countries in SSA are considered low
income countries with a Gross National Income (GNI) per capita of less than $1,005 per year
(n=26). Lower middle income and upper middle-income countries have GNI per capita with a
6
range of $1,006 - $3,975 (n=14) and $3,976-$12,275 (n=7), respectively. According to the
United Nations, life expectancy increases as the country’s economic status improves (United
Nations, 2010) (See Figure 1). Low and Middle income countries are collectively referred to as
“developing counties” (The World Bank, 2011). In 1990, the Tanzania GNI per capita was
$190.00 per year increasing to $290.00 per year (53% increase) in the year 2000 and $490.00 per
year (69% increase) in the year 2010. The average GNI per capita for the other SSA countries is
$1,130 per capita per year. These data indicate modest growth despite mean population growth
of 2.8% (range 2.5-3.2%) since 1990 (Mungi, 2011). Tanzania spends 5.1% of its Gross
Domestic Product (GDP)(CIA, 2009) on healthcare compared to the United States spending
17.4% (Centers for Medicare and Medicaid Services, 2009).
The cost to diagnose and treat T2DM is significant and failure to recognize and treat has
a considerable effect on morbidity and mortality. In conservative estimates, the global
expenditure for management of diabetes exceeded $370 billion in 2010 corresponding to 12% of
all healthcare spending. These numbers were based on prevalence studies, total population, and
total healthcare spending (Narayan, Echouffo-Tcheugui, Mohan, & Ali, 2012; Zhang et al.,
2010). In the WHO Africa region and Tanzania, the expenditures for diabetes account for 7%
and 5% or an average of $112 or $30.73 per year, respectively (Zhang et al., 2010) (see Table 2).
In low-income countries, management of diabetes can exceed more than 50% of the monthly
household income limiting access to proper treatment (Justin-Temu, Nondo, Wiedenmayer,
Ramaiya, & Teuscher, 2009; Khan, Hotchkiss, Berruti, & Hutchinson, 2006; Kolling, Winkley,
& von Deden, 2010). In a study comparing economic status, geographic location, and health care
services, the poor rural communities had the least access to medical care and services
7
emphasizing the need to understand the prevalence of chronic health conditions in developing
countries (Khan et al., 2006).
Complications.
Inadequate treatment of diabetes can have profound effects on morbidity and mortality.
Chronic hyperglycemia from untreated diabetes is a well-known risk factor for cardiovascular
disease, cerebrovascular disease, retinopathy, cataracts, chronic kidney disease, neuropathy, and
opportunistic infections, such as Tuberculosis. (Abbas & Archibald, 2007; Ikem & Sumpio,
2011; Lutale, Thordarson, Abbas, & Vetvik, 2007; Neuhann, Warter-Neuhann, Lyaruu, &
Msuya, 2002; Tesfaye & Gill, 2011; Unwin et al., 2010; Viswanathan et al., 2010).
Global age adjusted mortality from diabetes is 6.8%, which was derived from five large
cohort studies and applied to WHO region populations (Roglic & Unwin, 2010). In the WHO
Africa region, mortality from diabetes was 5%, with more than 300,000 deaths attributed to
diabetes in the age group of 20-79 (Roglic & Unwin, 2010). Coronary heart disease accounts for
29.2% of the worldwide mortality, with 80% of these deaths occurring in residents of low and
lower-middle income countries (Ikem & Sumpio, 2011). Infected diabetic foot ulcers, also
known as tropic diabetic limb has a corresponding mortality rate greater than 50% (Abbas &
Archibald, 2007).
Tanzania
The Tanzanian health care system has changed from socialized medicine to a private free
enterprise (Benson, 2001). There is a tier system with villages having access to inconsistent
health services through a community health aid at a village dispensary (Masalu, Kikwilu,
Kahabuka, Senkoro, & Kida, 2009; Munga, Songstad, Blystad, & Maestad, 2009). Within each
region, there are district clinics and hospitals, however depending on the size of the region; these
8
services may be 10-15 kilometers from a village (Benson, 2001; Whole Village Project, 2011).
There are four tertiary medical centers within Tanzania (National Bureau of Statistics, 2011).
Most clinical services are located in the densely populated urban cities with understaffed
dispensaries located in the rural communities (Khan et al., 2006; Munga et al., 2009). For rural
dwellers, the travel distance to seek healthcare services creates a geographical/financial barrier.
In a study of care seeking patterns of rural Tanzanian women with pregnancy, more than
51% of the cost to receive care was spent in transportation (Kruk, Mbaruku, Rockers, & Galea,
2008). According to the World Diabetes Foundation, there are six diabetologists and twenty
diabetic clinics in Tanzania, all located in urban settings, to provide care for the more than two
million people with T2DM. In contrast, Kenya has 490 specialty trained doctors to manage the
estimated 1.3 million people with diabetes (Chege, 2009; Lugongo, 2010; World Diabetes
Foundation, 2008).
Understanding the true prevalence of diabetes in SSA continues to be a significant
challenge. Epidemiologic studies in Africa report the prevalence rates to be between 3% and
8%, with the most significant prevalence occurring in the urban settings (Amoah, Owusu, &
Adjei, 2002; Aspray et al., 2000; Baldé et al., 2007; Christensen et al., 2009; Mbanya, Ngogang,
Salah, Minkoulou, & Balkau, 1997; Silva-Matos et al., 2011). In Tanzania, the prevalence of
T2DM is about 6% representing more than 2.4 million people and doubling by 2020 (Lugongo,
2010).
Treatment of T2DM remains inconsistent depending on the economic status and urban
versus rural residency within the country (Neuhann et al., 2002). For the affluent, who seek care
at private clinics, the availability of recognized treatment options including metformin
($0.10/tablet), glipizide ($0.10/tablet), and humulin insulin ($36.00/vial) are consistently
9
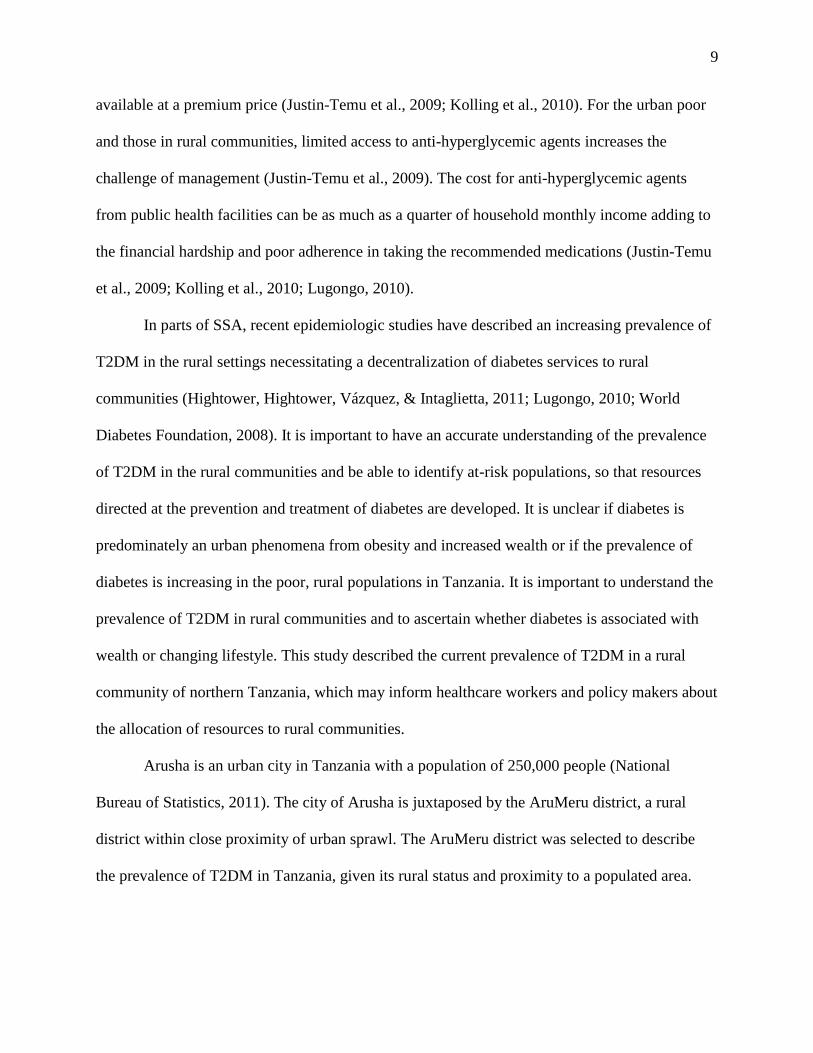
available at a premium price (Justin-Temu et al., 2009; Kolling et al., 2010). For the urban poor
and those in rural communities, limited access to anti-hyperglycemic agents increases the
challenge of management (Justin-Temu et al., 2009). The cost for anti-hyperglycemic agents
from public health facilities can be as much as a quarter of household monthly income adding to
the financial hardship and poor adherence in taking the recommended medications (Justin-Temu
et al., 2009; Kolling et al., 2010; Lugongo, 2010).
In parts of SSA, recent epidemiologic studies have described an increasing prevalence of
T2DM in the rural settings necessitating a decentralization of diabetes services to rural
communities (Hightower, Hightower, Vázquez, & Intaglietta, 2011; Lugongo, 2010; World
Diabetes Foundation, 2008). It is important to have an accurate understanding of the prevalence
of T2DM in the rural communities and be able to identify at-risk populations, so that resources
directed at the prevention and treatment of diabetes are developed. It is unclear if diabetes is
predominately an urban phenomena from obesity and increased wealth or if the prevalence of
diabetes is increasing in the poor, rural populations in Tanzania. It is important to understand the
prevalence of T2DM in rural communities and to ascertain whether diabetes is associated with
wealth or changing lifestyle. This study described the current prevalence of T2DM in a rural
community of northern Tanzania, which may inform healthcare workers and policy makers about
the allocation of resources to rural communities.
Arusha is an urban city in Tanzania with a population of 250,000 people (National
Bureau of Statistics, 2011). The city of Arusha is juxtaposed by the AruMeru district, a rural
district within close proximity of urban sprawl. The AruMeru district was selected to describe
the prevalence of T2DM in Tanzania, given its rural status and proximity to a populated area.
10
The investigator has been a volunteer in this region and is familiar with local customs and
culture.
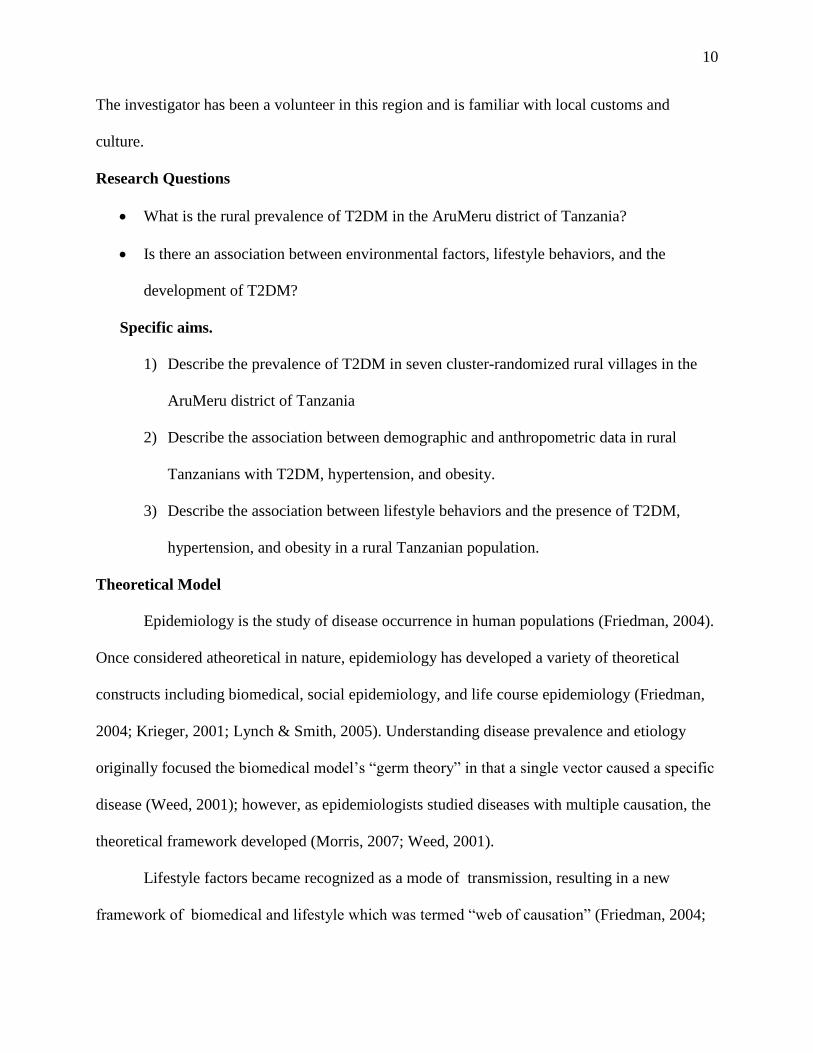
Research Questions
What is the rural prevalence of T2DM in the AruMeru district of Tanzania?
Is there an association between environmental factors, lifestyle behaviors, and the
development of T2DM?
Specific aims.
1) Describe the prevalence of T2DM in seven cluster-randomized rural villages in the
AruMeru district of Tanzania
2) Describe the association between demographic and anthropometric data in rural
Tanzanians with T2DM, hypertension, and obesity.
3) Describe the association between lifestyle behaviors and the presence of T2DM,
hypertension, and obesity in a rural Tanzanian population.
Theoretical Model
Epidemiology is the study of disease occurrence in human populations (Friedman, 2004).
Once considered atheoretical in nature, epidemiology has developed a variety of theoretical
constructs including biomedical, social epidemiology, and life course epidemiology (Friedman,
2004; Krieger, 2001; Lynch & Smith, 2005). Understanding disease prevalence and etiology
originally focused the biomedical model’s “germ theory” in that a single vector caused a specific
disease (Weed, 2001); however, as epidemiologists studied diseases with multiple causation, the
theoretical framework developed (Morris, 2007; Weed, 2001).
Lifestyle factors became recognized as a mode of transmission, resulting in a new
framework of biomedical and lifestyle which was termed “web of causation” (Friedman, 2004;
11
Krieger, 2011). The biomedical and the biomedical-lifestyle framework reduced the number of
confounding variables in an attempt to isolate causative risk factors of disease. Elimination of
potential factors narrows the application to various populations and is considered reductionist
(Hartge, 2001; Krieger, 1994).
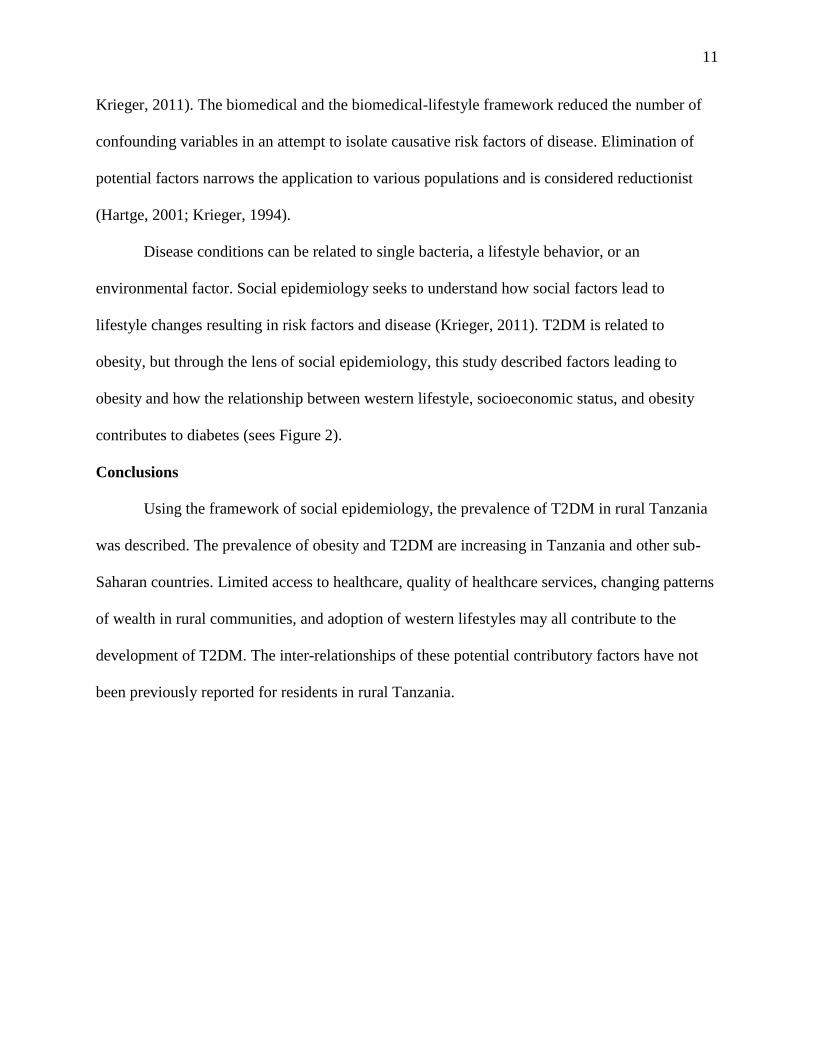
Disease conditions can be related to single bacteria, a lifestyle behavior, or an
environmental factor. Social epidemiology seeks to understand how social factors lead to
lifestyle changes resulting in risk factors and disease (Krieger, 2011). T2DM is related to
obesity, but through the lens of social epidemiology, this study described factors leading to
obesity and how the relationship between western lifestyle, socioeconomic status, and obesity
contributes to diabetes (sees Figure 2).
Conclusions
Using the framework of social epidemiology, the prevalence of T2DM in rural Tanzania
was described. The prevalence of obesity and T2DM are increasing in Tanzania and other sub-
Saharan countries. Limited access to healthcare, quality of healthcare services, changing patterns
of wealth in rural communities, and adoption of western lifestyles may all contribute to the
development of T2DM. The inter-relationships of these potential contributory factors have not
been previously reported for residents in rural Tanzania.
12
Chapter 2
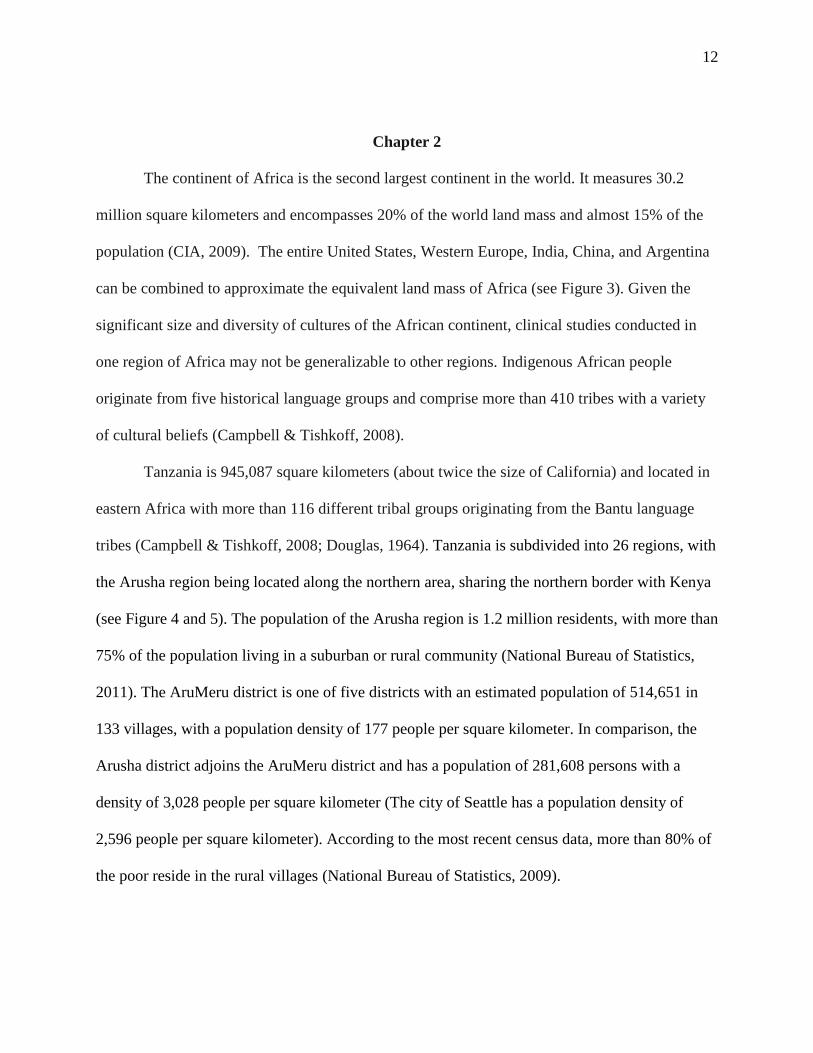
The continent of Africa is the second largest continent in the world. It measures 30.2
million square kilometers and encompasses 20% of the world land mass and almost 15% of the
population (CIA, 2009). The entire United States, Western Europe, India, China, and Argentina
can be combined to approximate the equivalent land mass of Africa (see Figure 3). Given the
significant size and diversity of cultures of the African continent, clinical studies conducted in
one region of Africa may not be generalizable to other regions. Indigenous African people
originate from five historical language groups and comprise more than 410 tribes with a variety
of cultural beliefs (Campbell & Tishkoff, 2008).
Tanzania is 945,087 square kilometers (about twice the size of California) and located in
eastern Africa with more than 116 different tribal groups originating from the Bantu language
tribes (Campbell & Tishkoff, 2008; Douglas, 1964). Tanzania is subdivided into 26 regions, with
the Arusha region being located along the northern area, sharing the northern border with Kenya
(see Figure 4 and 5). The population of the Arusha region is 1.2 million residents, with more than
75% of the population living in a suburban or rural community (National Bureau of Statistics,
2011). The AruMeru district is one of five districts with an estimated population of 514,651 in
133 villages, with a population density of 177 people per square kilometer. In comparison, the
Arusha district adjoins the AruMeru district and has a population of 281,608 persons with a
density of 3,028 people per square kilometer (The city of Seattle has a population density of
2,596 people per square kilometer). According to the most recent census data, more than 80% of
the poor reside in the rural villages (National Bureau of Statistics, 2009).
13
The AruMeru district primarily consists of the Meru tribal members who own property
and have a stationary lifestyle compared to nomadic tribes like the Massai who also live in this
district (Aspray et al., 2000; National Bureau of Statistics, 2011; Whole Village Project, 2011).
Historically, Meru people depend on agricultural sustenance compared to the Massai, which are
considered hunters and gatherers. Most residents of the AruMeru district are farmers and grow a
variety of crops including coffee, bananas, corn, rice, and an assortment of vegetables (Hillbom,
2010). This region has been classified as an optimal environment for agriculture with high
humidity and fertile soil, providing moderate economic benefit compared to other regions of
Tanzania (Hillbom, 2010).
Globalization has transformed the cultural landscape of the region with access to cellular
phones, non-traditional diets, processed foods and sweetened beverages (Popkin, 1999; Zimmet,
2000). Across SSA and in Tanzania, there has been a migratory pattern from a traditional
lifestyle to an urban lifestyle with a resultant increase in chronic diseases, because of changes in
excessive caloric intake and a decrease in energy expenditure (Maruapula et al., 2011;
Montgomery, 2008; Popkin et al., 2012). National and international attention towards the
diagnosis and treatment infectious diseases such as HIV, malaria, and TB have decreased the
mortality rates, while allowing people to age and develop chronic diseases. The changing
migratory patterns and increasing life expectancy contribute to the difficulty in chronic disease
surveillance (Assah et al., 2011).
Understanding the prevalence rates of Type 2 diabetes mellitus (T2DM) in sub-Sahara
Africa (SSA) and Tanzania is important because of the significant financial burden associated
with the diagnoses and treatment of diabetic complications, which include retinopathy,
neuropathy, nephropathy, coronary artery disease, and cerebrovascular disease. End organ
14
damage and complications associated with untreated diabetes has a high mortality rate resulting
in increased financial burden on families from lost financial productivity (Ikem & Sumpio, 2011;
Neuhann et al., 2002; Sobngwi et al., 2012). Epidemiologic studies have been conducted over the
past 20 years, during which time there has been a rural to urban migratory pattern of residents,
several changes in the diagnostic criteria for T2DM, and industrialization of low-income
countries, which has promoted a western lifestyle. Consequently, it has been difficult to track the
incidence or prevalence of T2DM.
Diagnosis of Type 2 Diabetes Mellitus
Investigating the prevalence and the change in prevalence of diabetes requires
comparison of historic data. The definition of T2DM has changed multiple times between 1979
and 2012. There are two dominate consensus groups, which have developed diagnostic criteria
for diabetes. The American Diabetes Association (ADA) and the World Health Organization
(WHO) definitions are predominate; however, most of the African epidemiology studies have
used the 1985 WHO screening criteria. A PubMed literature search from 1979 to 2012 using the
terms type-2 diabetes, diabetes classification, diagnosis, and diagnostic criteria identified 162
articles. There were ten published consensus reports from four different organizations describing
the diagnostic criteria for diabetes. The National Diabetes Data Group (NDDG) established the
original diagnostic criteria for T2DM, setting the diagnostic threshold as a fasting plasma
glucose (FPG) greater than 140 mg/dl or a 2-hour oral glucose tolerance test (OGTT) glucose
level greater than 200 mg/dl (National Diabetes Data Group, 1979). This criteria was adopted by
the World Health Organization (WHO) in 1980 and then revised in 1985 to advocate for the 2-
hour oral glucose tolerance test (2-h OGTT) to be the primary diagnostic assessment for T2DM,
15
because of increased accuracy with minimal venipuncture’s (Harbuwono, 2011; Harris, Hadden,
Knowler, & Bennett, 1985).
Few changes were made to these criteria until 1997, when the American Diabetes
Association (ADA) advocated to lower the fasting plasma level cut point from 140 mg/dl to 126
mg/dl. The changes in diagnostic criteria were based on three landmark epidemiologic studies
using the presence of common macro- and micro-vascular complications to establish the cut
point for the diagnosis of diabetes (Harbuwono, 2011). Despite the pathologic changes related to
chronic hyperglycemia, there was a group of people with elevated glucose levels and did not
have diabetes. This group is at high risk for the development of diabetes; therefore, a new
classification labeled “pre-diabetes” was developed for people with elevated glucose levels (110
and 125 mg/dl) who did not meet the diagnostic threshold for diabetes. The Expert Committee on
the Diagnosis and Classification of Diabetes Mellitus developed the terms “Impaired Fasting
Glucose” (IFG) and “Impaired Glucose Tolerance” (IGT) in 1997. IFG and IGT were classified
as a glucose level between fasting serum glucose of 110-125 mg/dl and post prandial 2-h OGTT
serum glucose level of 140-199 mg/dl, respectively (Gavin, Davidson, & DeFronzo, 1997;
Harbuwono, 2011). People with pre-diabetes have either impaired fasting glucose tolerance or an
aberrant metabolism of post-prandial glucose. In the spectrum of glucose metabolism disorders,
people with pre-diabetes are at a substantial risk for developing diabetes, but have not developed
target organ damage, which is associated with T2DM. People with pre-diabetes are a target
population to prevent diabetes through lifestyle modification (Miller, 2013).
In 2007, the ADA lowered the cut point for the diagnosis of IFG to a fasting glucose level
between 100-126 mg/dl because of observed micro-vascular complications (American Diabetes
Association, 2007), while the WHO disagreed with the ADA and maintained that the fasting
16
glucose level between 110-126 mg/dl would be considered diagnostic for IFG (WHO, 2003).
Finally in 2012, the diagnostic criteria for T2DM was redefined as a fasting plasma glucose
greater than 125 mg/dl, a 2-hour OGTT equal to or greater than 200 mg/dl, a random glucose
level equal to or greater than 200 mg/dl, or a glycated A1c of 6.5% or higher (American Diabetes
Association, 2012). The addition of glycated hemoglobin for the diagnosis of T2DM was a
significant change in criteria. In previous recommendations, confirmation of the diagnosis
required repeat testing on two separate days, however the use of glycated hemoglobin provided
diagnostic confirmation at the time of screening (American Diabetes Association, 2012).
Despite the changes in diagnostic criteria from the ADA, the WHO and the International
Diabetes Federation (IDF) maintained the screening recommendations of a 2-hour OGTT to
screen and diagnose diabetes. In 2003 the joint WHO/IDF consensus guidelines changed
allowing fasting whole blood or capillary blood sample to screen for pre-diabetes and diabetes
with a confirmatory 2-hour OGTT to confirm the diagnosis of these conditions (WHO, 2003).
The most recent changes to the classification of diabetes have been glycated hemoglobin levels.
Currently, the ADA and the WHO recommend a fasting blood glucose level for screening of
T2DM, but urge the use of a 2-hour OGTT or glycated hemoglobin for confirmation (American
Diabetes Association, 2012; WHO, 2003, 2011). The single difference between the 2003 and the
2011 WHO guidelines is recognition that a glycated hemoglobin greater than 6.5% is diagnostic
for T2DM (WHO, 2011) (See Table 3).
Type 2 Diabetes in Sub-Sahara Africa and Tanzania
Epidemiologic studies in SSA have used different diagnostic criteria between studies,
with a number using the 1985 WHO criteria, the 1999 WHO criteria, and one study using the
1997 ADA criteria. In a retrospective review by Levitt et al. (2000), the 1997 ADA criteria were
17
applied to African studies using the older WHO criteria. The results suggested a slightly higher
prevalence of T2DM. This study used the 2003 WHO guidelines to screen for people with
T2DM and pre-diabetic conditions in the AruMeru district of northern Tanzania. The 2003 WHO
guidelines were selected because capillary blood glucose screening provided easy access to
screen large numbers of people, while performing a confirmatory 2-hour OGTT for people with
abnormal fasting glucose values. There are few African studies using the WHO 2003 criteria for
the classification of diabetes. Access to glycated hemoglobin analysis is limited in rural Tanzania
and point of care A1c monitors are controversial because of inaccurate results for people with
hemoglobinopathies and thalassemia’s (WHO, 2011). Consequently, this study is significant
because it used the 2003 WHO guidelines to classify people with pre-diabetes and diabetes in a
region of Tanzania that had not been previously examined. As will be reported, this study
provided baseline a prevalence rate of T2DM and pre-diabetes in the AruMeru district and, when
compared to other prevalence studies in different parts of Tanzania, suggested an increase in age-
adjusted prevalence rate.
A literature search of PubMed using the key words: Africa, Diabetes, Type 2 Diabetes,
Prevalence, and Epidemiology between the years of 1979 and 2012, resulted in 402 citations.
After screening the abstracts, four meta-analyses regarding prevalence of T2DM in Africa, 16
epidemiologic studies describing the prevalence of T2DM in Africa, and 4 Tanzania specific
epidemiologic studies were identified as pertinent to the study and critically reviewed.
Impaired glucose metabolism, hypertension, and other chronic diseases are increasing at
alarming rates around the world and across the continent of Africa (Kapiga, 2011). Once
considered rare in Africa, T2DM is expected to increase by 161% in the next 15 years (Hall et
al., 2011; Wild et al., 2004). Several studies describing the prevalence of T2DM in SSA have
18
mixed findings. There have been four meta-analyses conducted with T2DM prevalence ranging
between 1% in rural Uganda to 12% in urban Kenya (Hall et al., 2011; Levitt et al., 2000). In a
review by Levitt et al. (2000), a retrospective analysis was conducted of SSA prevalence studies
using the 1985 WHO diagnostic criteria and compared the original data to the new 1997 ADA
criteria. The change in diagnosis of T2DM and pre-diabetes (IGT or IFG) was slightly higher
with the 1997 ADA criteria by 1-2%. These differences may have been related to the age, with
older adults having a greater degree of glucose intolerance (Levitt et al., 2000).
In an analysis by Danaei et al. (2011), the authors compared studies of global prevalence
of diabetes to forecast changes in diabetes. The authors standardized fasting plasma glucose
levels, fasting capillary glucose levels and glycated hemoglobin levels to determine global mean
fasting glucose level. These data were used to estimate prevalence changes per decade per year
on a global and regional level. A limitation of these analyses was the exclusion of studies using a
2-hour OGTT as the screening method (1985 WHO criteria). The prevalence of T2DM was
lowest in SSA, as most of the prevalence studies have used the 1985 WHO criteria (Danaei et al.,
2011). However, differing diagnostic criteria were used to diagnose T2DM and IGT in these
meta-analyses, making the prevalence rates difficult to compare across studies.
The meta-analysis conducted by Whiting and colleagues (2011) reviewed all diabetes
prevalence studies regardless of the diagnostic criteria. The focus of the analysis was to assess
global and regional trends in diabetes prevalence. A logistic regression analyses model
controlled for age and economic status by country. Predictions were forecasted based on
prevalence change and estimated regional population growth. The model’s estimates were
similar to Danaei et al.’s findings (2011). Whiting reported that SSA would have the greatest
proportional increase in diabetes by the year 2030, compared to all other IDF regions. In
19
Tanzania, the number of adults with diabetes will increase annually by 33,000 per year whereas,
Kenya will increase by 48,000, Malawi will increase by 21,000, and the Democratic Republic of
Congo will increase by 36,000 (Whiting et al., 2011). The findings provide the best available
data of T2DM prevalence in SSA and suggest that the age-adjusted prevalence of T2DM in SSA
is currently 5% and will increase to 5.9% by the year 2030 (Whiting et al., 2011). The limitations
of this analysis in SSA were the lack of recent prevalence studies and the absence of national
diabetes registries to obtain a true prevalence of diabetes.
A systematic review by Hall et al. (2011) examined published reports between 1999 and
2010, which described the incidence, prevalence, morbidity, and mortality of T2DM in SSA. In
determining prevalence, the authors considered 16 studies from nine countries using multiple
diagnostic criteria including a 2-hour OGTT, fasting plasma glucose (FPG), or random plasma
glucose level (RPG). The primary aim of the review was to examine the impact of diabetes in the
past 12 years. The authors were unable to generalize the prevalence rate between regions or even
in countries given the wide prevalence variation. The prevalence rates were higher in urban
dwellers (2-10%) compared to rural dwellers (0.8-5.3%). The wide variance may be attributed, at
least in part, to the differing diagnostic criterion, different geographic locations, access to
saturated cooking oils, and high fructose, non-alcohol ready to drink beverages (soda). In
contrast to Danaei’s and Whiting’s review, there was not an age adjustment for the prevalence.
Authors described diabetes complications with a prevalence of neuropathy ranging from 27-66%,
retinopathy 7-63%, nephropathy 9.8-83% (Hall et al., 2011).
The 1985 WHO criteria for the diagnosis of diabetes are dependent on a 75-gm, 2-hour
OGTT glucose level equal to or greater than 140 mg/dl. In SSA there were eight published
studies between 1989 and 2010 using the 1985 WHO criteria to diagnose diabetes (Ceesay,
20
Morgan, Kamanda, Willoughby, & Lisk, 1997; Mathenge, Foster, & Kuper, 2010; Mbanya et al.,
1999; Mbanya et al., 1997; McLarty et al., 1989; Swai, Lutale, & McLarty, 1990; Van Der Sande
et al., 1997). The prevalence of diabetes in these eight studies demonstrated a higher rate of
diabetes and impaired glucose tolerance in the urban dwellers (1.1-2.1%; 1.4-7.5%) compared to
rural dwellers (0.0-7.6%; 2.6-7.7%). These studies were conducted in Tanzania, Cameroon,
Sierra Leone, The Gambia, and Kenya. The varying rates of diabetes and IGT can be related to
the age distribution of the study population, three studies enrolled participants starting at 15
years of age (Ceesay et al., 1997; McLarty et al., 1989; Van Der Sande et al., 1997), while 2
studies examined diabetes in people between 26 and 74 years of age (Mbanya et al., 1999;
Mbanya et al., 1997), and one study limited enrollees to 50 years of age or older (Mathenge et
al., 2010). Although most of these studies used the 2-hour OGTT, one study limited data
collection to a single random glucose level for the diagnosis of diabetes. Using a random glucose
level, there were no reported cases of diabetes in the rural population (Ceesay et al., 1997) (see
Table 4).
The 1997 ADA criteria and the 1998 WHO criteria are similar, using a FPG level equal
to or greater than 126 mg/dl, a 2-hour OGTT equal to or greater than 200 mg/dl, or random
plasma glucose (RPG) level equal to or greater than 200 mg/dl, as the criteria for diabetes. The
addition of pre-diabetic classification with having IFG or IGT allows for risk stratification of
high-risk groups. Between the year 2000 and 2011, the 1997 ADA and the 1998 WHO criteria
were used in nine SSA diabetes epidemiology studies (Amoah et al., 2002; Aspray et al., 2000;
Baldé et al., 2007; Christensen et al., 2009; Motala, Esterhuizen, Gouws, Pirie, & Omar, 2008;
Nyenwe, Odia, Ihekwaba, Ojule, & Babatunde, 2003; Silva-Matos et al., 2011; Sobngwi et al.,
2004; Sobngwi, Mbanya, et al., 2002). These studies examined the prevalence of diabetes and
21
pre-diabetes in East Africa (Tanzania, Kenya, & Mozambique), West Africa (Cameroon,
Nigeria, Ghana, & Guinea), and South Africa. The prevalence of diabetes and pre-diabetes in
urban dwellers compared to rural dwellers is higher, although there was some variability. Some
studies reported crude prevalence rates, while others reported age adjusted prevalence rates
(Amoah et al., 2002; Nyenwe et al., 2003). Some studies combined the presence of diabetes and
pre-diabetes into a single value increasing the difficulty in determining prevalence (Nyenwe et
al., 2003; Sobngwi et al., 2004). These studies identified a higher rate of diabetes and pre-
diabetes in the urban participants with an increasing trend in prevalence rates. This trend appears
to be related to chronicity. The study by Aspray et al. (2000) identified the rural age-adjusted
prevalence of diabetes/IGT to be 1.1 and 6.5%, respectively, whereas a study by Christensen et
al. (2009) identified the age-adjusted prevalence of diabetes/IGT to be 4.2 and 12%, respectively.
Both of these studies were conducted in rural east Africa, used the same diagnostic criteria, used
the world population to standardize the sample for age adjustments, and represent a marked
increase in diabetes and pre-diabetes over the span of a decade (Aspray et al., 2000; Christensen
et al., 2009). A study by Nyenwe et al. (2003) investigated the prevalence T2DM in Nigerian
residents over the age of 40 years, reporting a combined age-adjusted rate of diabetes and IFG of
7.9% (Nyenwe et al., 2003).
The 2007 ADA decreased the lower diagnostic limit of IFG to 100-126 mg/dl. The other
criteria remained consistent with the 2003 ADA and 2003 WHO classification. The reduction of
IFG threshold increases the probability to diagnosis pre-diabetes (see Table 3). The WHO did
not adopt the lower threshold level of IFG, maintaining the 2003 guidelines. Between 2010 and
2011, there were four epidemiology studies which used the 2007 ADA diagnostic criteria
(Evaristo-Neto, Foss-Freitas, & Foss, 2010; Hightower et al., 2011; Oladapo et al., 2010; Solet et
22
al., 2011). Three of the studies investigated rural populations, while the study by Hightower et al.
(2011) investigated the crude prevalence of combined diabetes/IFG in traditional, transitional,
and modern communities. Africa is globalizing with telecommunication advancements,
development of electrical grids, and modern amenities. Traditional communities are rural
communities who have little exposure to telecommunications, and modern advancements, the
transitional communities are rural communities in close proximity to urban centers. They have
access to public transportation, some households are attached to an electrical grid, and many
people have access to cellular phones. People living in urban centers are classified as modern
communities (Hightower et al., 2011). The results of the study demonstrated a high crude rate of
combined diabetes/IFG of 47%, 88%, and 91% for the traditional, transitional, and modern
community, respectively. The participants in all three groups were older with a mean age of 36,
43, and 44 years, respectively. These crude prevalence rates are high and most likely represent
the combination of older age group, the 2007 ADA’s lower threshold level of IFG, and the
effects of globalization.
Diabetes in Tanzania.
The true prevalence of T2DM and IGT in Tanzania is unknown. There have been four
studies published since 1984 describing an increasing prevalence of diabetes in Tanzania. When
Aherns and Corrigan studied the prevalence of T2DM in 1984, using the 1979 National Diabetes
Data Group (NDDG) criteria, they reported rates of 0.5 and 2.5% among rural villages in the
same region. In the urban area of Mwanza, the estimated prevalence was 1.9%. These data
suggest prevalence rates of diabetes vary depending on the geographic distribution of the
population (Ahren & Corrigan, 1984). The study was limited by the age of the population, more
23
than 60% of the participants were under the age of 20 years, and the authors did not adjust the
prevalence rate to age.
In 1989, McLarty et al. examined the prevalence of T2DM in six rural villages from the
Morogoro and Kilimanjaro regions using the 1985 WHO criteria. These regions are similar
agricultural communities from the northern and southern part of the Tanzania. They estimated an
age adjusted prevalence of diabetes and IGT to be 0.9 and 7.7%, respectively. The authors also
identified a significant correlation between T2DM and both severely undernourished people and
those who were over nourished suggesting that either could be risk factors for diabetes. The
findings of severely undernourished people were observed in all six villages (McLarty et al.,
1989). The Kilimanjaro region of Tanzania is approximately 35 kilometers from the AruMeru
district, sharing some similar characteristics.
In 1992, Swai expanded the work of McLarty and examined characteristics of diabetes in
a prevalence of T2DM in eight villages in the Morogoro and Kilimanjaro regions using the 1985
WHO criteria. These villages were part of a national surveillance program and included some of
the villages reported by McLarty (1989). Swai estimated the crude prevalence of diabetes and
IGT to be 1.2 and 6.7%, respectively for males and 0.7 and 7.4%, respectively for females. In
people who were over the age of 50, the prevalence of diabetes and IGT were similar to people
with a BMI >25 and people with a BMI < 20 (Swai et al., 1992). When examining the
association of obesity and severe undernourishment with diabetes, Swai (1992) did not find
obesity to have a strong positive predictive correlation to diabetes. Based on Swai’s results, it is
unclear if obesity has an association to diabetes in the African population or if an African person
with diabetes have different presenting characteristics.
24
Using the 1999 WHO criteria Aspray et al. compared the prevalence of T2DM between
Dar es Salaam, an urban city, and Shari, a rural village in the Kilimanjaro region of Tanzania.
The T2DM/IGT urban age adjusted prevalence rates were 4.5% and 4.8%, respectively and the
rural age adjusted T2DM/IGT prevalence rates were 1.1% and 1.3%, respectively. The age
adjusted, rates IFG/DM for men were 0.8/1.7 and for women 1.6/1.1, respectively (Aspray et al.,
2000). The authors used the world population figures to control for age variations.
Diabetes and pre-diabetes are increasing in prevalence in SSA, The mean prevalence
rates for diabetes and IGT have increased from 1.74 and 5.44 in the 1990s with the 1985 WHO
criteria to 4.91 and 8.08 in the 2000s with the 1997 ADA/1999 WHO criteria, to 4.08 and 9.16
with the 2007 ADA criteria. These studies used differing criteria and some studies are age-
adjusted while others published crude rates. Never-the-less, all studies indicate that there has
been an increase in diabetes and pre-diabetes in rural east Africa in the last 10 years. The most
recent published epidemiologic study of T2DM in Tanzania was in 2000. Further studies are
needed using an age-adjusted prevalence with standardized diagnostic criteria.
Type I diabetes in sub-Sahara Africa.
Type 1 diabetes is an autoimmune form of diabetes with an onset in childhood or early
adolescence. The body develops an absolute deficiency of insulin, requiring exogenous
administration of insulin. The prevalence for Type 1 diabetes is not entirely clear, but has been
estimated between 0.01 and 0.012% in SSA (Hall et al., 2011; Motala, 2002). The mortality rate
for type 1 diabetes is high and related primarily to metabolic emergencies. Some studies estimate
the 1-year mortality rate is between 60% and 80% (Levitt, 2008; McLarty, Kinabo, & Swai,
1990). Given the high mortality rate and low prevalence of Type 1 diabetes, as well as other
25
forms of diabetes, adults presenting with hyperglycemia were presumed to have T2DM unless
they had a pre-existing medical history of Type 1 diabetes
Tropical diabetes.
Tropical diabetes or malnutrition related diabetes mellitus (MRDM) has been proposed as
a possible cause of diabetes in SSA. Studies have identified people in SSA who have non-ketotic
hyperglycemia with evidence of severe under nutrition (BMI < 20) (Sobngwi, Mauvais-Jarvis,
Vexiau, Mbanya, & Gautier, 2002; Swai et al., 1990). These reports describe a positive response
to insulin, but those affected have periods of remission and are able to stop insulin and other anti-
hyperglycemic agents for extended periods of time (Akanji, 1990). In theory, periods of famine
result in pancreatic β-cell damage with resultant hyperglycemia (Ekow & Shipp, 2001). The
presentations are similar to Type 1 diabetes mellitus (T1DM), with the exception of non-ketone
producing hyperglycemia and intermittent return of insulin production allowing the individual to
discontinue insulin therapy. Additional studies have been unable to identify autoimmune
antibodies in this population (Ducorps et al., 2002). The low body weight and the associated
occurrence in developing countries has resulted in the controversial terminology of “tropical
diabetes” or “malnutrition related diabetes mellitus.” Evidence has demonstrated this subgroup
of diabetes is best classified as idiopathic type 1B diabetes (Ekow & Shipp, 2001; Sobngwi,
Mauvais-Jarvis, et al., 2002). The studies by McLarty (1990), Swai (1992), and Christensen
(2010) suggest obesity and severe undernourishment may be an independent risk factors for
diabetes (Christensen et al., 2009; McLarty et al., 1989; Swai et al., 1992; Swai et al., 1990).
Risk Factors for Diabetes in Tanzania
A literature search of PubMed from 1980 to 2012 using the key words: Risk factors,
diabetes, Type 2 diabetes, Africa, and Tanzania resulted in identification of 211 articles. After
26
reviewing the abstracts, 22 articles were deemed relevant to the study and were critically
reviewed.
Risk factors for T2DM in developed countries have been well established and include
obesity, diet, physical inactivity, and genetic predisposition. In developing countries, the inter-
relationship between the risk factors of T2DM are complicated and include lifestyle changes,
decrease in energy expenditure, changes in types of food and patterns of consumption resulting
in obesity and sedentary lifestyles. Tanzania has undergone moderate infrastructure development
in the last 10 years resulting in a migratory pattern of rural dwellers relocating to urban locations
for employment and globalization of urban services to rural communities (Ngowi, 2009; Unwin
et al., 2010). Development indices include: the distribution of electricity, cellular phones,
protected water sources, and access to public transportation (Popkin, 2002). Residents in the
rural and urban settings have changed lifestyle patterns to mirror diet and exercise patterns of
developed countries, a process called “westernization” (Delisle, Ntandou-Bouzitou, Agueh,
Sodjinou, & Fauomi, 2011; Maletnlema, 2002; Popkin et al., 2012). Adoption of a western
lifestyle which includes changes in diet and exercise patterns leads to a greater prevalence of
obesity, but it is not clear if the western lifestyle leads to the development of T2DM (Jones-
Smith, Gordon-Larsen, Siddiqi, & Popkin, 2011). T2DM has been characterized as an affluent
disease despite the rising prevalence in the rural and poor populations in SSA (Agardh, Allebeck,
Hallqvist, Moradi, & Sidorchuk, 2011). People in SSA use obesity as a surrogate indicator of
wealth, even in poor communities. Knowledge of the association between wealth, obesity, and
diabetes will provide a deeper understanding for planning prevention and treatment
interventions.
27
Wealth.
Wealth in rural Tanzania can be measured by annual income, asset ownership, and body
mass index (BMI). According to the 2007 Household Budget Survey in Tanzania, the average
household income in urban locations is 58,722 to 78,680 Tanzanian Shillings (Tsh) per month
(37.62 to 50.43 US dollars [USD]), while average monthly income in rural Tanzania is about
27,279 Tsh per month (17.48 USD) representing a significant income difference between urban
and rural communities (National Bureau of Statistics, 2009). However, these statistics represent a
93% increase in annual household income in six years (National Bureau of Statistics, 2003,
2009). In the AruMeru district, most residents are dependent on agricultural sales and have a
lower annual income, as compared to other districts (Aspray et al., 2000; National Bureau of
Statistics, 2009; Whole Village Project, 2011). Assessment of wealth is usually conducted by
survey analysis; however, obtaining accurate household income indicators is difficult because of
cultural barriers. Wealth is determined through surrogate indicators, which include education
level and asset ownership such as transportation, cellular phones, and housing construction. In
the 2007 household budget survey, rural communities experienced a 7% increase in bicycle
ownership ( 38.4 - 45.4%), a 16% increase in radio ownership (45.7- 62.2%) and 14% owned
cell phones (this was a new category, so no comparison data available) (National Bureau of
Statistics, 2009). Several surveys have queried indirect economic indicators which are attributed
to the type of home flooring (compacted dirt, wood slats, concrete, tile), type of home building
construction (mud/wood, earthen brick, earthen brick with concrete facing), and household water
source (piped water supply, protected well, unprotected well, river or creek) (Hargreaves et al.,
2007; Khan et al., 2006; Kusumayati & Gross, 1998; National Bureau of Statistics, 2009; Whole
Village Project, 2011).
28
Body Mass Index (BMI) has been suggested as an indicator of wealth. Studies have
suggested higher BMIs relate to a higher socio-economic status (Neuman, Finlay, Davey Smith,
& Subramanian, 2011; Subramanian, Perkins, Özaltin, & Davey Smith, 2011). Using data
extrapolated from the 1996 Tanzania Demographic Health Survey, Kahn et al. (2006) developed
a wealth index for Tanzania demonstrating a statistically significant correlation between higher
household incomes and higher BMI ratios (Khan et al., 2006).
Subramanian et al. (2011) conducted a large cross sectional review of data from 54
demographic and health surveys that had been conducted between 1994 and 2008 in low and
lower middle income countries. Responses of 538,140 women were pooled and after accounting
for national gross domestic product and individual household income, the authors were able to
correlate a 0.54 increase in BMI for every quartile increase in wealth. Overall, those in the
highest quartile of wealth were 33% more likely to be obese, than those in the lowest quartile
(Subramanian et al., 2011).
Body Mass Index.
Body Mass Index (BMI) is an anthropometric indicator used to categorize levels of
adiposity. Higher BMI levels can be used to assess risk for development of T2DM and other
chronic health conditions. According to the World Health Organization, BMI is an effective
indicator of obesity (WHO, 2000). As previously discussed, epidemiology studies conducted in
SSA suggest that low BMI, (<20) is an independent risk factor for development of diabetes
(McLarty et al., 1989; Swai et al., 1990). Several studies have examined the relationship of BMI
as a predictor of T2DM (Barrett-Connor, 1989; Huxley, Mendis, Zheleznyakov, Reddy, & Chan,
2009; Nyamdorj, 2010; Sluik et al., 2011), while others have suggested the waist circumference
(Schulze et al., 2006), waist to hip ratio (Petursson, Sigurdsson, Bengtsson, Nilsen, & Getz,
29
2011), and waist to height ratio (Sluik et al., 2011) may be better predictors of T2DM and
mortality. These studies have limited data in various ethnic populations and have not been
examined in rural sub-Saharan residents. The Sympathetic Activity and Ambulatory Blood
Pressure in Africans (SABPA) study examined a cut point of waist circumference to predict
metabolic syndrome. These data suggest a waist circumference 94 cm (37 inches) as a predictor
of metabolic syndrome (Prinsloo, Malan, de Ridder, Potgieter, & Steyn, 2011); however, these
results are limited to South Africa and have not been repeated.
Historically BMI measures nutritional status, however evidence has suggested other
measures may have greater validity in assessing nutritional status, while predicting risk factors
for T2DM and mortality. In epidemiology studies, in SSA and Tanzania, BMI has been the only
anthropometric measure used. This dissertation examined the relationship between BMI and
waist to hip ratio (WHR) to T2DM and pre-diabetes. Information from the study reported here
will contribute to understanding how body habitus interacts with T2DM in rural SSA.
Obesity in Sub-Sahara Africa.
The increasing prevalence of obesity is complex, with obesity having a different meaning
in developing countries versus developed countries. Residents in developing counties associate
obesity as healthy and opposite of ill. Conditions like tuberculosis (TB) and Acquired Immune
Deficiency Syndrome (AIDS) are associated with cachexia and weight loss (Popkin et al., 2012).
Obesity in SSA has profound cultural implications representing beauty, health, and wealth.
People will strive to achieve a degree of obesity as marker of prosperity within their village
(Renzaho, 2004; Selembo, 2009). Women will eat lard to increase their weight and demonstrate
to the village that their husband is able to take care of them (Selembo, 2009). A phrase used by
men to express wealth in Tanzania is “Chakula ya wazungu” or “food of white people”
30
(Renzaho, 2004). Increasing rates of obesity are being reported across socioeconomic divisions
and are no longer restricted to wealthy (Agardh et al., 2011; Delisle et al., 2011; Jones-Smith et
al., 2011; Nube, Asenso-Okyere, & van den Bloom, 1998; Renzaho, 2004). Access to cheap
cooking oils, processed sugars, and sweetened drinks, such as soda are accessible to all social
classes contributing to the obesity epidemic (Jones-Smith et al., 2011; Popkin et al., 2012;
Renzaho, 2004).
Obesity is a risk factor for T2DM, but obesity has positive perceptions for people in low-
income countries and rural Tanzania. Obesity is associated with wealth, however using it as a
marker may not be a reliable method of determining wealth in rural communities. This study
examined proxy markers of wealth, in addition to assessing the relationship between BMI and
T2DM. In doing so, this study provided current evidence on factors associated with T2DM in the
rural community of northern Tanzania.
Conclusions
Type 2 diabetes mellitus is increasing and will become a significant burden on health
status globally. In developing countries with limited resources, understanding the prevalence and
associated risk factors are needed to prepare and develop preventative strategies. Rural Tanzania
is experiencing many of the global implications of obesity without the resources to address the
consequences. Describing the interaction between BMI, lifestyle behaviors, and the presence of
T2DM or pre-diabetes will help identify high-risk populations. This study adds to the literature
by describing the prevalence of T2DM in rural Tanzania, determining which anthropometric
measurements are most predictive of T2DM in rural Tanzania, and exploring the relationship
between socio-economic factors and obesity and T2DM.
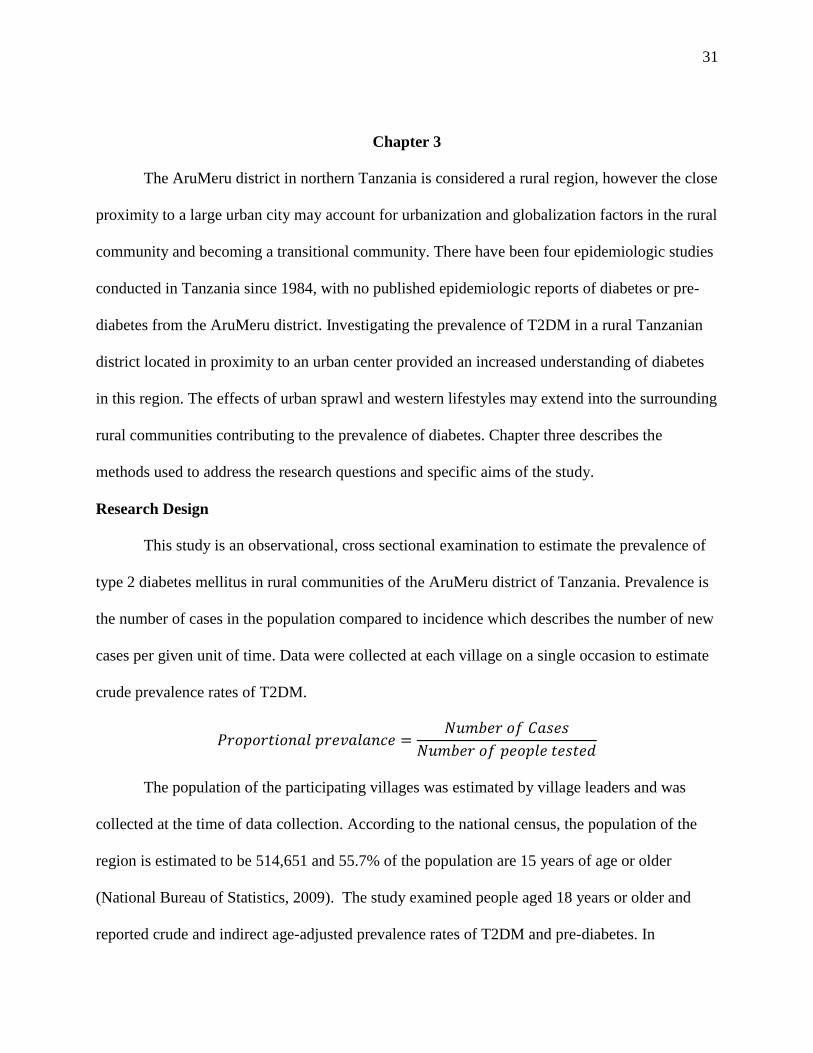
31
Chapter 3
The AruMeru district in northern Tanzania is considered a rural region, however the close
proximity to a large urban city may account for urbanization and globalization factors in the rural
community and becoming a transitional community. There have been four epidemiologic studies
conducted in Tanzania since 1984, with no published epidemiologic reports of diabetes or pre-
diabetes from the AruMeru district. Investigating the prevalence of T2DM in a rural Tanzanian
district located in proximity to an urban center provided an increased understanding of diabetes
in this region. The effects of urban sprawl and western lifestyles may extend into the surrounding
rural communities contributing to the prevalence of diabetes. Chapter three describes the
methods used to address the research questions and specific aims of the study.
Research Design
This study is an observational, cross sectional examination to estimate the prevalence of
type 2 diabetes mellitus in rural communities of the AruMeru district of Tanzania. Prevalence is
the number of cases in the population compared to incidence which describes the number of new
cases per given unit of time. Data were collected at each village on a single occasion to estimate
crude prevalence rates of T2DM.
The population of the participating villages was estimated by village leaders and was
collected at the time of data collection. According to the national census, the population of the
region is estimated to be 514,651 and 55.7% of the population are 15 years of age or older
(National Bureau of Statistics, 2009). The study examined people aged 18 years or older and
reported crude and indirect age-adjusted prevalence rates of T2DM and pre-diabetes. In
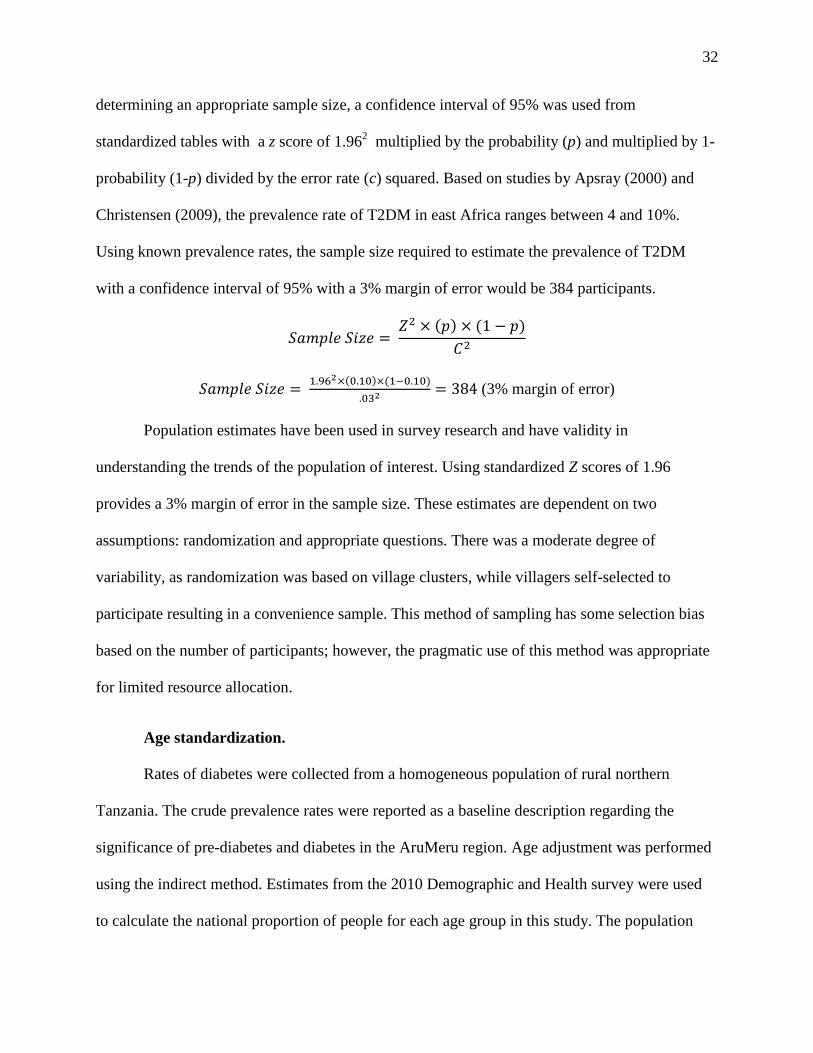
32
determining an appropriate sample size, a confidence interval of 95% was used from
standardized tables with a z score of 1.962 multiplied by the probability (p) and multiplied by 1-
probability (1-p) divided by the error rate (c) squared. Based on studies by Apsray (2000) and
Christensen (2009), the prevalence rate of T2DM in east Africa ranges between 4 and 10%.
Using known prevalence rates, the sample size required to estimate the prevalence of T2DM
with a confidence interval of 95% with a 3% margin of error would be 384 participants.
( ) ( )
( ) ( )
(3% margin of error)
Population estimates have been used in survey research and have validity in
understanding the trends of the population of interest. Using standardized Z scores of 1.96
provides a 3% margin of error in the sample size. These estimates are dependent on two
assumptions: randomization and appropriate questions. There was a moderate degree of
variability, as randomization was based on village clusters, while villagers self-selected to
participate resulting in a convenience sample. This method of sampling has some selection bias
based on the number of participants; however, the pragmatic use of this method was appropriate
for limited resource allocation.
Age standardization.
Rates of diabetes were collected from a homogeneous population of rural northern
Tanzania. The crude prevalence rates were reported as a baseline description regarding the
significance of pre-diabetes and diabetes in the AruMeru region. Age adjustment was performed
using the indirect method. Estimates from the 2010 Demographic and Health survey were used
to calculate the national proportion of people for each age group in this study. The population
33
percentage of each age group was multiplied by the crude prevalence rate for the corresponding
age group to calculate the age-adjusted prevalence rate for each age group. The sum of all age-
adjusted prevalence rates was used to determine the total age-adjusted prevalence rate for pre-
diabetes and diabetes. Data regarding the distribution of ages in each of the villages or from the
AruMeru district were not available, limiting a direct age adjustment.
Participants
The target population was adults, 18 years of age or older who resided in one of the
selected villages. Data were collected from self-selected volunteers at seven cluster-randomized
rural villages, located in the northeast corner of the AruMeru district in northern Tanzania. There
are 133 villages in the AruMeru district encompassing three distinct ethnic groups including
Meru, Chagga, and Massai. Arusha is the largest city located in close proximity to the AruMeru
district, 46 villages were excluded from randomization because of the close proximity to the city
of Arusha. The remaining 87 villages were randomized with a random number generator. The
pool of villages was evaluated and the first seven villages considered rural, maintaining Meru
tribal homogeneity, and separated by at least ten kilometers from each other were selected (see
Appendix C). Although randomization through clustering and not through simple randomization
increases selection bias, using it in this study allowed for a pragmatic approach in terms of data
acquisition and resources.
Participant recruitment.
Recruiting research participants in the selected villages was performed through bulletins
and announcements within a network of churches (see Appendix B). Placing flyers at community
gathering places such as churches, community markets, and water sources disseminated
34
information to a large number of each community. Announcements during church services
communicated the pending screening survey to the largest group of potential participants.
The flyers contained information in Swahili inviting all members of the village who were
at least 18 years to participate in the screening examination. Potential participants were asked to
experience an eight hour calorie-free fast prior to screening. Print media in developing countries
has been effective in participant recruitment (Burgess & Sulzer, 2010); however, access to print
media in rural Tanzania is limited. Posting the flyer at local gathering spots, such as water wells,
public markets, and churches, increased community awareness of the research opportunity
(Yancey, Ortega, & Kumanyika, 2006). The risk of community resentment is a concern in low
socio-economic status (SES) communities. In low-income countries, participants who do not
meet the inclusion criteria or who are excluded may feel resentment if those who do participate
are given any form of compensation. Community retaliation against members of the society for
receiving compensation has negative effects on participation and recruitment. Compensation to
the study participants was avoided to prevent resentment or retaliation (Emanuel, Wendler,
Killen, & Grady, 2004; Molyneux, Kamuya, & Marsh, 2010). All potential participants received
screening; however, data with exclusionary criteria were removed from analysis.
Inclusion criteria.
The prevalence of T2DM is dependent on an adequate representation of the population in
the village. Type 2 diabetes is an age progressive disorder and becomes increasingly prevalent in
adults and older adults, therefore participants were 18 years or older. Participants were fasting
for eight hours prior to screening. Potential participants who indicated that they had not fasted
were offered a random capillary glucose level, if this was equal to or greater than 200 mg/dl,
they were considered positive for diabetes. If their level was between 110 and 199, they were
35
given the opportunity to fast during the day and return in the late afternoon for screening
provided they were able to fast for eight hours (see Table 6).
Exclusion criteria.
Certain medical conditions may artificially elevate serum glucose levels, such as active
infections, use of corticosteroids or pregnancy/lactation (Kauh et al., 2012; Mazze, Yogev, &
Langer; Polito et al., 2011). Participants that had a temperature greater than 101.4 degrees
Fahrenheit or reported that they were currently taking antibiotics, antimalarial, or antivirals
medications were considered to have an active infection, women who were known to be pregnant
or currently lactating, and people taking glucocorticoid steroids were offered screening, but their
data were excluded from analysis (see Table 6).
Human Subjects Protection.
Institutional Review Board (IRB) approval from Washington State University and ethical
clearance from Tanzania’s National Institute for Medical Research (NIMR) was obtained (see
Appendix A). All participants were self-selected and could withdraw at any time. All participants
provided informed consent in Swahili, with both a consent written in Swahili and by having a
Swahili/English interpreter explain the research consent to the participants. Each participant was
assigned a unique identification number which was affixed to their consent and the data
collection form. The consent forms and data collection forms were separated at the collection
site, then each form was scanned into separate password protected Portable Document File
(PDF) files. De-identified data and consents were stored on a password protected external hard
drive and secured in a locked safe inside a locked room. Data were transcribed into a computer-
based data set stored on an external hard drive.
36
Data Collection
Announcements and flyers with the times and location of data collection were
disseminated at least 3 days prior to the date of collection. All adult members of the village were
invited to participate in the study. Data collection commenced at 7:00 a.m. each morning and
concluded between 3:00 and 5:00 p.m. each day.
After written or verbal informed consent was obtained, informants were given a unique
study identification number to de-identify the informants at the point of collection. Participants
completed a brief survey form (see Appendix B) with questions regarding past health history,
socioeconomic status, and western lifestyle behaviors. Part one obtained basic demographic
information including village, age, and gender. Part two collected data associated with SES and
included questions regarding level of education, the construction of their household flooring,
source of cooking water supply, and mode of transportation. Part three described the presence or
absence of health conditions associated with T2DM including prior diagnosis of diabetes,
hypertension, heart disease, and cerebrovascular disease. Part four collected data to describe
lifestyle behaviors, which are surrogate indicators of urbanization and a western lifestyle. These
factors included tobacco use, alcohol use, and consumption of sweet drinks like sweet coffee or
soda. Part five collected data pertaining to biometric and laboratory indicators of health.
Participants who had been fasting overnight were able to complete the screening exam with
minimal discomfort. Non-fasting participants received a random capillary glucose sample
collection and if the capillary blood glucose level was between 110 and 199 mg/dl, they had the
option of returning provided they had been fasting for eight hours prior to having their glucose
level reassessed (see Appendix B).
37
Variables
Demographic variables.
Data were collected regarding the participant’s residential location, gender, and age.
Participants’ village and gender were categorical variables; however, the continuous variable age
was transformed into a categorical variable “age groups” to represent groupings. The age group
variable was derived assigning participants to 18-29 year age group, 30-39 year age group, 40-49
year age group, 50-59 year age group, and 60 years and older age group (see Table 7).
Socioeconomic variables.
Several studies have investigated markers of wealth in developing counties. Factors
associated with ranking of wealth were selected from three studies, because they applied to the
geographic area of interest (Hargreaves et al., 2007; Khan et al., 2006; Kusumayati & Gross,
1998). Level of education, mode of transportation, type of household flooring construction, and
source of cooking water were selected as markers of wealth and were used to compute an income
score.
The income score was derived by assigning a numeric value to each level of sub group,
which included level of education, mode of transportation, source of cooking water, and
household flooring construction. The sum of the sub group scores was used to determine the total
income score. The composite income score was divided into tertiles to represent low, middle,
and high-income groups to represent the socioeconomic status (SES). Once the income score was
calculated, the sub group variables education, household flooring, and source of cooking water
were recoded to create an even distribution for each of the sub groups (see Table 8).
38
Lifestyle variables.
Data were collected regarding the frequency of tobacco use, alcohol use, and sweet
beverage consumption. Tobacco use was categorized as life-long non-tobacco, former tobacco
use, and current tobacco use. The use of alcohol and sweet drinks was assessed from a memory
recall and estimates of how many times a week the participants used these products. Categorical
variables were used to quantify the frequency of alcohol and sweet drink consumption.
Initially, there were six frequency intervals for alcohol; however, to develop an even
distribution, the variable alcohol consumption was recoded to create three categories of alcohol
consumption representing non-drinkers, rare alcohol use, and regular weekly consumers of
alcohol. The number of sweet drinks consumed was assessed by categorical variables, which had
a range of number of sweet drinks. The analyses of this variable identified a bimodal peak with
4-10 sweet drinks and 21-25 sweet drinks per week (see Figure 8). These data were transformed
from six categories to four categories resulting in an even distribution of sweet drink
consumption (see Table 9).
Glucose.
Capillary blood glucose was obtained using the Righttest GM300 TM
series glucose
monitoring system. A 27-gauge solid core lancet was used to access capillary whole blood from
the participant’s finger. According to the manufacture recommendation, the first drop of blood
was discarded and a second drop, approximately 1.4 μl, of blood was used for analysis, which is
the size of the sample well on the test strip (see Figure 6). A single level control calibration of
the Bionine GM 300 TM
was performed daily, whenever a new vial of test strips was being used,
and whenever the meter was dropped (Bionime, 2012).
39
Using the 2003 World Health Organization guidelines, a fasting capillary glucose less
than 110 mg/dl is considered normal. A fasting capillary glucose level greater than 125 mg/dl is
considered positive for diabetes. A fasting capillary glucose level between 110mg/dl and 125
mg/dl is suggestive of impaired fasting glucose and resulted in additional testing with a 75 gram,
2-hour Oral Glucose Tolerance Test (2-h OGTT). A 2-hour OGTT capillary glucose level equal
to or greater than 200 mg/dl was positive for diabetes and a 2-hr OGTT capillary glucose level
between 140 mg/dl and 199 mg/dl was considered diagnostic for impaired glucose tolerance.
Final analysis considers participants as having normal glucose levels, pre-diabetes (the
combination of IGT or IFG) and diabetes (WHO, 2003).
The prevalence of T2DM was determined by counting the number of people who had a
previous diagnosis of diabetes, who were taking anti-hyperglycemic medications, had a fasting
plasma glucose level greater than 125 mg/dl, or random plasma glucose greater than 199 mg/dl.
The prevalence of pre-diabetes was determined by counting the number of people who did not
have a previous history of diabetes, but had a fasting plasma glucose level between 110 and 125
mg/dl, or a 2-hour OGTT capillary glucose level between 140 mg/dl and 199 mg/dl. All other
participants were considered to have a normal glucose metabolism (NGM). To answer the first
aim of this study, the proportion of people with NGM, pre-diabetes, and diabetes were
determined. To answer the remaining aims of the study, the variable “diabetes” was recoded into
a dichotomous variable of impaired glucose metabolism (IGM), which included people with the
criteria of pre-diabetes and diabetes. The other category, normal glucose metabolism (NGM) was
derived from people without evidence of IGM.
40
Blood Pressure.
After resting for five minutes, blood pressure was assessed, using an appropriate sized
blood pressure cuff and aneroid sphygmomanometer, on two occasions separated by 15 minutes.
The two systolic blood pressure (SBP) readings were used to obtain a mean SBP. The
sphygmomanometer was calibrated prior to commencement of the study and as needed according
to manufacture recommendation that the sphygmomanometer be recalibrated whenever the
indicator fell outside the oval/square indicator when zero pressure was applied (Welch Allyn,
2001).
Systolic blood pressure was recoded from a continuous variable into a dichotomous
variable called “hypertension (HTN)” using the Joint National Committee (JNC) cut point of a
SBP of 140 mm/Hg or higher to signify hypertension and a SBP of less than 140 mm/Hg to
blood pressure to represent absence of hypertension (National High Blood Pressure Education
Program, 2004).
Body Mass Index.
Height and weight were assessed to calculate the body mass index (BMI). Using a
balance beam scale with attached height rod, participants’ height, and weight were assessed
twice and recorded to the nearest 0.5 cm and 0.5 kg, respectively. The average of the two
assessments was used to determine height and weight and to calculate BMI using weight (kg)
divided by height (m) 2
. To ensure accuracy, the scale was calibrated daily following the
manufacturer’s guidelines.
BMI is a measurement of body habitus used to represent adiposity. According to the
World Health Organization, a BMI of less than 18.5 is underweight, a BMI between 18.5-24.9 is
normal or healthy, a BMI between 25.0 and 29.9 is considered overweight, and a BMI of 30.0 or
41
greater is considered obese (WHO, 2000). The continuous variable of BMI was recoded into a
dichotomous variable labeled “adiposity” using the cut point of a BMI less than 25 to represent
people with healthy levels of adiposity and a BMI of 25 or greater to represent people with
unhealthy levels of adiposity and referred to as having “excess adiposity” (see Table 7).
Waist-to-Hip ratio.
The waist-to-hip ratio (WHR) is an alternative method of assessing excess adiposity by
dividing the waist circumference by the hip circumference. Waist and hip circumference was
obtained using a stretch resistant tape measure, with the circumference measured to the nearest
0.5 cm. According to the WHO criteria, waist circumference was obtained half way between the
12th
rib and the iliac crest. Waist circumference was measured parallel to the floor with the tape
measure being snug. Participants were allowed to wear light clothing (T-shirt/pants or dress).
The hip circumference was obtained from the widest portion of the buttocks with the tape
measure being snug and parallel to the floor (World Health Organization, 2008). The waist and
hip measurements were repeated and the average was used to determine the circumference. The
WHR is a mathematical calculation dividing the waist circumference by the hip circumference.
The WHR reference ranges for men are ≤ 0.95, 0.96-1.0, and ≥ 1.1 for low risk, moderate risk,
and high risk, respectively. The WHR reference ranges for women are ≤ 0.80, 0.81-0.85, and ≥
0.86 for low risk, moderate risk, and high risk, respectively. The continuous values for WHR
ratio were recoded into discrete variables of low, medium, and high-risk groups.
Medical follow-up
Participants were given documentation of their results (See appendix B). If the
participants had abnormal findings, they were advised to seek confirmation with their primary
provider or seek follow up at the Sakila clinic. These data were not shared with the clinic. The
42
director of the clinic had agreed to see all research participants who wished to have further
evaluation and/or management of their condition according to local treatment protocols.
Diagnosis and treatment were separate from the research protocol and patients were subject to
usual clinic fees.
Analysis Plan
Data were collected and categorized into five groups of data, which included glycemic,
socioeconomic, anthropometric, blood pressure, and lifestyle indicators. These data were
analyzed to identify associations between the glycemic status and each of the variables to
identify risk groups and risk factors for the development of diabetes. The data were screened for
missing data, outliers, and normality. Descriptive analysis was conducted to describe the
frequency distribution of age, gender, SES, tobacco use, alcohol consumption, obesity, and
hypertension.
Aim 1.
The primary aim of this study was to describe the prevalence of type 2 diabetes and pre-
diabetes in the AruMeru district of Tanzania. To accomplish this aim, the estimated T2DM
prevalence was calculated by taking the number of cases of T2DM and pre-diabetes for all
participants and dividing them by the number of participants sampled to determine the crude
prevalence rate by 5-year incremental groups. Second, the indirect age-adjusted prevalence rate
was calculated by determining national population percentages for each the five-year incremental
age groups then multiplying the crude prevalence rate of pre-diabetes and diabetes by the
national percentage of people in each age group to determine the age specific prevalence rate.
The age specific prevalence rates were summed to provide the overall indirect age-adjusted
43
prevalence rate for people in these seven villages. Based on the power analysis, these data have a
3% margin of error.
Aim 2.
The second aim was to describe the association between demographic and
anthropometric data in rural Tanzanians and the presence of impaired glucose metabolism,
hypertension, and obesity. Body mass indices and waist-to-hip ratios were independently
regressed to determine which measurement of obesity had the highest predictive correlation to
the disease states of diabetes and hypertension. The existing literature contains conflicting data
about whether BMI or WHR is a better indicator of obesity in the African population (Barrett-
Connor, 1989; Huxley et al., 2009; Nyamdorj, 2010; Petursson et al., 2011; Sluik et al., 2011).
The chi-square statistic examined the association between people with glucose
metabolism disorders, hypertension, and adiposity with independent demographic and biometric
variables. Analysis of Variance (ANOVA) was used to examine the group and main effects of
the categorical independent variables: age groups, gender, HTN, and adiposity on the continuous
dependent fasting plasma glucose, mean systolic blood pressure, and body mass index.
A binary logistic regression with a forward conditional method was performed to assess
which independent variables (age group, gender, obesity, hypertension, and metabolic group)
could predict the development of IGM, HTN, and excessive adiposity. This study was a cross
sectional observational study and did not test a theory, but rather explored a phenomena. Little
data is available reflecting the predictive characteristics of chronic diseases in sub-Sahara Africa,
a forward conditional method for logistic regression analyses was appropriate for this study to
identify variables which may predict the presence of chronic disease conditions in rural northern
Tanzania (Field, 2009). The forward conditional method enters each predictor variable to the
44
model one at a time and then removes the variable to assess the observed interaction. If a
significant change is observed, the variable is retained in the model as a predictor of the
dependent variable. To avoid multicollinearity, similar variables were not analyzed together.
Aim 3.
The third aim of this study was to describe the association between socioeconomic
indicators and lifestyle behaviors and the presence of impaired glucose metabolism,
hypertension, and obesity in rural Tanzanians. Khan et al. (2006) suggested diabetes is a disease
of the wealthy; hence, these data were analyzed using a chi-square statistic to determine if the
SES is associated with the development of IGM, HTN, and excessive adiposity.
Analysis of Variance (ANOVA) was used to examine the main and individual effects of
the categorical independent variables of lifestyle and socioeconomic status on the continuous
dependent variables of fasting plasma glucose, mean systolic blood pressure, and body mass
index. A binary logistic regression using a forward conditional method was performed to assess
which independent variables could predict the development of IGM, HTN, and excessive
adiposity.
Conclusions
An observational study describing the prevalence of T2DM in Tanzania was completed
as outlined in this chapter. The last published prevalence study in Tanzania was conducted more
than 10 years ago. There has been a global increase in prevalence of obesity and T2DM.
Describing the current rate of diabetes and the relationship between T2DM and SES, lifestyle,
and anthropometric levels will inform healthcare workers of the significance of diabetes while
recognizing the risk factors of diabetes. These data may allow for the development of culturally
appropriate interventions to prevent or reduce diabetic disease burden.
45
Chapter 4
Diabetes is increasing at alarming rates worldwide. The aims of this study were to
describe the prevalence of diabetes in rural Tanzania, as well as explore factors associated with
the increasing prevalence including, biometric indicators of diabetes and effects of globalization.
Data were collected during June and July of 2012 to address the study aims.
After recruitment, 709 people were screened as potential participants in this prevalence
study, 64 of whom were excluded from data analysis because of predefined criteria (see Table 6)
leaving 645 participants for analysis (see Figure 7). One participant was able to provide a fasting
plasma glucose sample; however, she had previously had a traumatic injury with fractured
pelvis, hip, and bilateral femur fractures with rotational mal-union. She was confined to a
wheelbarrow preventing the ability to obtain her weight, height, waist circumference and her hip
circumference with accuracy. Two participants had missing height and weight data limiting the
ability to obtain a BMI and one participant was unable to recall her age. Fasting plasma glucose
levels were obtained in 635 participants, random plasma glucose levels were obtained in 41
participants with nine participants receiving a 2-hour oral glucose tolerance test (2hr OGTT).
The 2hr OGTT procedure was abandoned after nine tests because of inconsistency of the glucose
solution. In all nine tests, the 2-hour glucose level was less than 100 mg/dl indicating they did
not have impaired glucose tolerance. In subsequent analyses, missing data were handled using a
pairwise deletion approach.
Descriptive analysis
The majority of the participants were cash crop farmers, who had a primary school
education (70%), while a moderate number of people had no formal education (20%). The most
46
common type of flooring in participants’ homes was a concrete slab for a floor (49%), with 31%
of participants having homes with dirt floors. Most of the participants walked or used some form
of public transportation (87%) and obtained their water from a protected water source (73%).
The nearest hospital was located in the township of Tengeru, with a distance of 35-55 kilometers
depending on the village location. Two villages were regional centers for trade and transportation
(village 6 and 7) and both had local access to formal health clinic services (see Table 10).
The participants without diabetes ranged in age from 18 to 103 (n = 540, Mean = 49.9, sd
= 17.3). The participants with pre-diabetes ranged in age from 23 to 92 (n = 46, Mean 53.5, sd =
16.5) and the participants with diabetes ranged in age from 23 to 90 (n = 58, Mean 57.8, sd =
14.8). Participants with diabetes were statistically older than those without diabetes (F (2,641) =
6.37, p =.002); however, using Bonferroni contrasts, no statistically significant age difference
between those with normal glucose metabolism and those with impaired glucose metabolism was
observed. The participation of women compared to men was not statistically significant, with
64% of the participants being female. The proportion of participants with pre-diabetes and
diabetes was higher in males than females, 26.1% v. 8.3% and 12.6% v. 7.8%, respectively;
however, these differences were not statistically significant (χ2 (2) = 5.33, p = .07). Hypertension
and excessive adiposity was observed in 25% of the participants while there was an increased
association between people who had higher income scores and excessive adiposity, (χ2 (2) =
10.95, p = .004).
The preexisting prevalence of participants with diabetes was 3.1% (n = 20) resulting in
66% of participants having met the diagnostic criteria of diabetes and therefore having a new
diagnoses. A previous history of hypertension was self-reported in 5.3% of the participants (n =
47
34), a history of cardiovascular heart disease was reported in 2.9% of the participants (n = 19),
and cerebrovascular disease was reported in 0.5% of the participants (n = 3).
Prevalence
The first aim of this study was to estimate the prevalence of type 2 diabetes and pre-
diabetes in the rural communities of the AruMeru district. The overall mean fasting plasma
glucose was 100.8 (sd = 23.6), with a mean range of 94.1-117.3 across the seven villages. There
were 46 (7.1%) people who had fasting plasma glucose levels consistent with pre-diabetes and
58 (9.0%) people who fulfilled the diagnostic criteria for having diabetes (see Table 11). Using
the rural Tanzanian national population estimates, the indirect age-adjusted prevalence rate for
pre-diabetes and diabetes was 2.54% (95% CI [0.06; 0.1]) and 2.84% (95% CI [0.07; 0.12]),
respectively. When standardizing the crude rates of diabetes and pre-diabetes to the world
population estimates, the indirect age-adjusted prevalence rates for pre-diabetes and diabetes
increased to 4.71% (95% CI [0.06; 0.1]) and 5.13% (95% CI [0.07; 0.12]), respectively. The
increase in prevalence using the world population as a standard measure, is related to the older
world population compared to the Tanzanians, thus a higher statistical weight. The mean age of
people living in Tanzania is 19 years and the life expectancy is 53 years of age (CIA, 2009),
using the Tanzanian rural national statistics provides a more accurate estimation of the
prevalence rates. More than 50% of the participants of this study were older than 50 years
(n=339) and the proportion of people with pre-diabetes and diabetes increased significantly in
people with advancing age (χ2 (8) = 21.19, p = .007). Univariate ANOVA was performed
demonstrating a statistically significant difference in mean fasting plasma glucose between
villages (F (6,628) = 8.94, p <.001). A post hoc Bonferroni correction confirmed that village
48
seven had a higher mean fasting plasma glucose as well as higher counts of pre-diabetes and
diabetes compared to villages one, three, four, and five (see Appendix C).
Anthropometric findings
The second aim of the study was to determine which anthropometric and demographic
variables were associated with health status with respect to impaired glucose metabolism,
hypertension, and excess adiposity.
Measurements of adiposity were collected to calculate body mass index (BMI) and waist-
to-hip ratio (WHR). Each measure was regressed separately on fasting plasma glucose (FPG) and
mean systolic blood pressure (SBP) to examine the relative strength of association. BMI (F
(1,630) = 7.96, p = .005; R = 0.11) had a stronger association with fasting plasma glucose than
WHR (F (1,632) = 4.85, p = .028; R = 0.09), suggesting a stronger association between BMI and
glucose levels. BMI (F (1,640) = 30.31, p <.001; R = 0.21) and WHR (F (1,642) = 25.64, p
<.001; R = 0.2) were both significantly associated with systolic blood pressure; however, BMI
had a stronger association and accounted for more variance in SBP than did WHR. Because in
both the case of fasting plasma glucose level and systolic blood pressure a stronger association
was noted with BMI than with WHR, BMI was chosen to represent adiposity in subsequent
analyses.
Impaired glucose metabolism and demographic/biometric indicators.
An exploratory analysis using the chi-square statistic was conducted to describe the
association between IGM, hypertension, excess adiposity, age groups, and gender. There was a
statistically significant association between IGM and hypertension (χ2
= 10.86, p = .001) and
between IGM and adiposity (χ2
= 8.67, p = .003). There was a significant association between
IGM and age groups (χ 2(4) = 15.5, p = .004), HTN and age groups (χ
2(4) = 43.43, p <.001), and
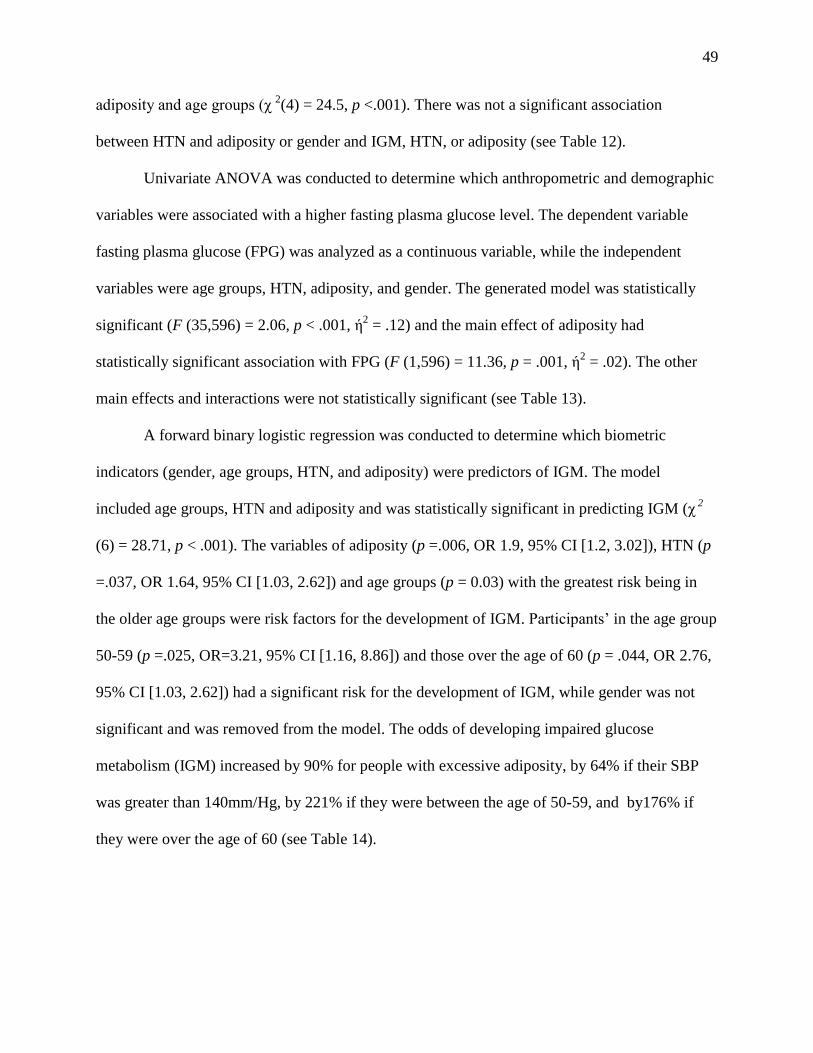
49
adiposity and age groups (χ 2(4) = 24.5, p <.001). There was not a significant association
between HTN and adiposity or gender and IGM, HTN, or adiposity (see Table 12).
Univariate ANOVA was conducted to determine which anthropometric and demographic
variables were associated with a higher fasting plasma glucose level. The dependent variable
fasting plasma glucose (FPG) was analyzed as a continuous variable, while the independent
variables were age groups, HTN, adiposity, and gender. The generated model was statistically
significant (F (35,596) = 2.06, p < .001, ή2 = .12) and the main effect of adiposity had
statistically significant association with FPG (F (1,596) = 11.36, p = .001, ή2 = .02). The other
main effects and interactions were not statistically significant (see Table 13).
A forward binary logistic regression was conducted to determine which biometric
indicators (gender, age groups, HTN, and adiposity) were predictors of IGM. The model
included age groups, HTN and adiposity and was statistically significant in predicting IGM (χ 2
(6) = 28.71, p < .001). The variables of adiposity (p =.006, OR 1.9, 95% CI [1.2, 3.02]), HTN (p
=.037, OR 1.64, 95% CI [1.03, 2.62]) and age groups (p = 0.03) with the greatest risk being in
the older age groups were risk factors for the development of IGM. Participants’ in the age group
50-59 (p =.025, OR=3.21, 95% CI [1.16, 8.86]) and those over the age of 60 (p = .044, OR 2.76,
95% CI [1.03, 2.62]) had a significant risk for the development of IGM, while gender was not
significant and was removed from the model. The odds of developing impaired glucose
metabolism (IGM) increased by 90% for people with excessive adiposity, by 64% if their SBP
was greater than 140mm/Hg, by 221% if they were between the age of 50-59, and by176% if
they were over the age of 60 (see Table 14).
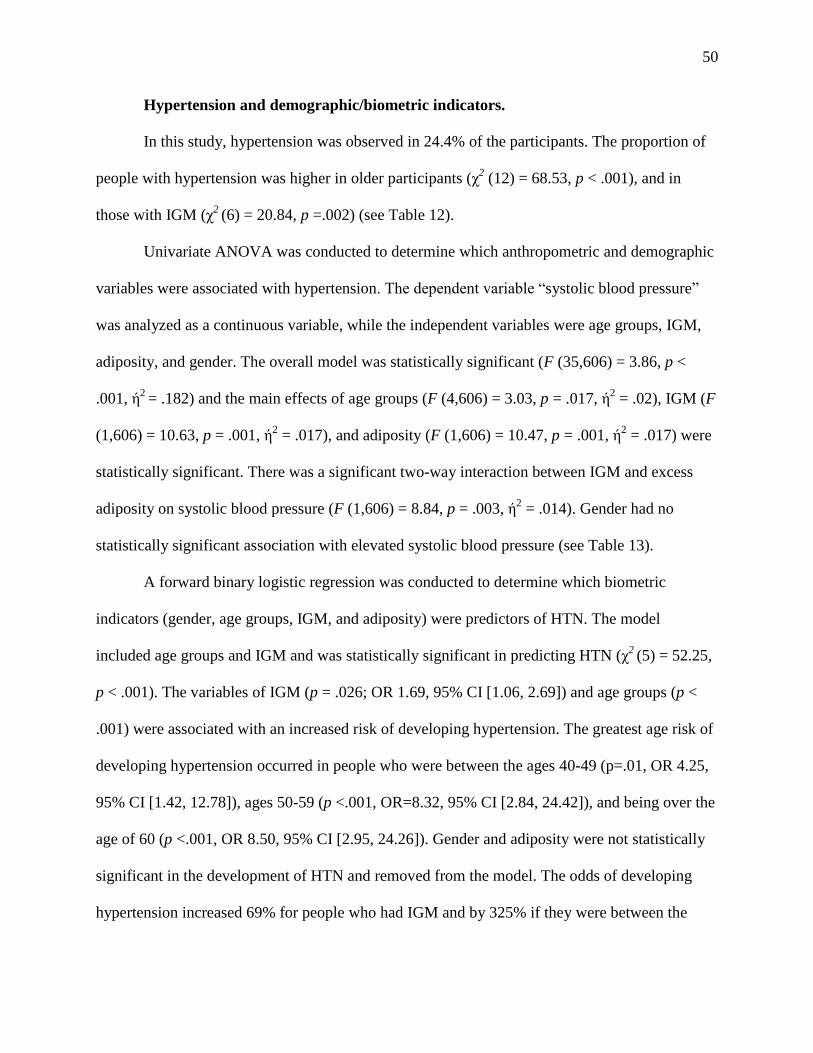
50
Hypertension and demographic/biometric indicators.
In this study, hypertension was observed in 24.4% of the participants. The proportion of
people with hypertension was higher in older participants (χ2 (12) = 68.53, p < .001), and in
those with IGM (χ2
(6) = 20.84, p =.002) (see Table 12).
Univariate ANOVA was conducted to determine which anthropometric and demographic
variables were associated with hypertension. The dependent variable “systolic blood pressure”
was analyzed as a continuous variable, while the independent variables were age groups, IGM,
adiposity, and gender. The overall model was statistically significant (F (35,606) = 3.86, p <
.001, ή2
= .182) and the main effects of age groups (F (4,606) = 3.03, p = .017, ή2 = .02), IGM (F
(1,606) = 10.63, p = .001, ή2 = .017), and adiposity (F (1,606) = 10.47, p = .001, ή
2 = .017) were
statistically significant. There was a significant two-way interaction between IGM and excess
adiposity on systolic blood pressure (F (1,606) = 8.84, p = .003, ή2 = .014). Gender had no
statistically significant association with elevated systolic blood pressure (see Table 13).
A forward binary logistic regression was conducted to determine which biometric
indicators (gender, age groups, IGM, and adiposity) were predictors of HTN. The model
included age groups and IGM and was statistically significant in predicting HTN (χ2
(5) = 52.25,
p < .001). The variables of IGM (p = .026; OR 1.69, 95% CI [1.06, 2.69]) and age groups (p <
.001) were associated with an increased risk of developing hypertension. The greatest age risk of
developing hypertension occurred in people who were between the ages 40-49 (p=.01, OR 4.25,
95% CI [1.42, 12.78]), ages 50-59 (p <.001, OR=8.32, 95% CI [2.84, 24.42]), and being over the
age of 60 (p <.001, OR 8.50, 95% CI [2.95, 24.26]). Gender and adiposity were not statistically
significant in the development of HTN and removed from the model. The odds of developing
hypertension increased 69% for people who had IGM and by 325% if they were between the
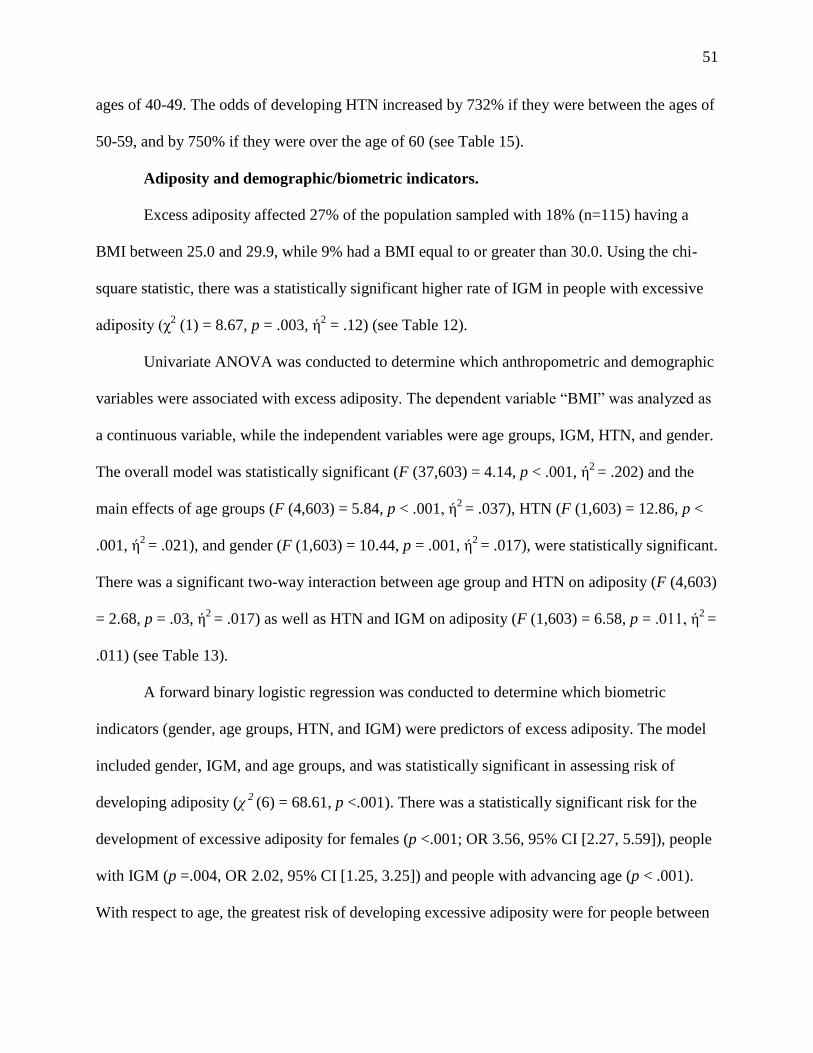
51
ages of 40-49. The odds of developing HTN increased by 732% if they were between the ages of
50-59, and by 750% if they were over the age of 60 (see Table 15).
Adiposity and demographic/biometric indicators.
Excess adiposity affected 27% of the population sampled with 18% (n=115) having a
BMI between 25.0 and 29.9, while 9% had a BMI equal to or greater than 30.0. Using the chi-
square statistic, there was a statistically significant higher rate of IGM in people with excessive
adiposity (χ2 (1) = 8.67, p = .003, ή
2 = .12) (see Table 12).
Univariate ANOVA was conducted to determine which anthropometric and demographic
variables were associated with excess adiposity. The dependent variable “BMI” was analyzed as
a continuous variable, while the independent variables were age groups, IGM, HTN, and gender.
The overall model was statistically significant (F (37,603) = 4.14, p < .001, ή2
= .202) and the
main effects of age groups (F (4,603) = 5.84, p < .001, ή2
= .037), HTN (F (1,603) = 12.86, p <
.001, ή2
= .021), and gender (F (1,603) = 10.44, p = .001, ή2
= .017), were statistically significant.
There was a significant two-way interaction between age group and HTN on adiposity (F (4,603)
= 2.68, p = .03, ή2
= .017) as well as HTN and IGM on adiposity (F (1,603) = 6.58, p = .011, ή2
=
.011) (see Table 13).
A forward binary logistic regression was conducted to determine which biometric
indicators (gender, age groups, HTN, and IGM) were predictors of excess adiposity. The model
included gender, IGM, and age groups, and was statistically significant in assessing risk of
developing adiposity (χ 2
(6) = 68.61, p <.001). There was a statistically significant risk for the
development of excessive adiposity for females (p <.001; OR 3.56, 95% CI [2.27, 5.59]), people
with IGM (p =.004, OR 2.02, 95% CI [1.25, 3.25]) and people with advancing age (p < .001).
With respect to age, the greatest risk of developing excessive adiposity were for people between
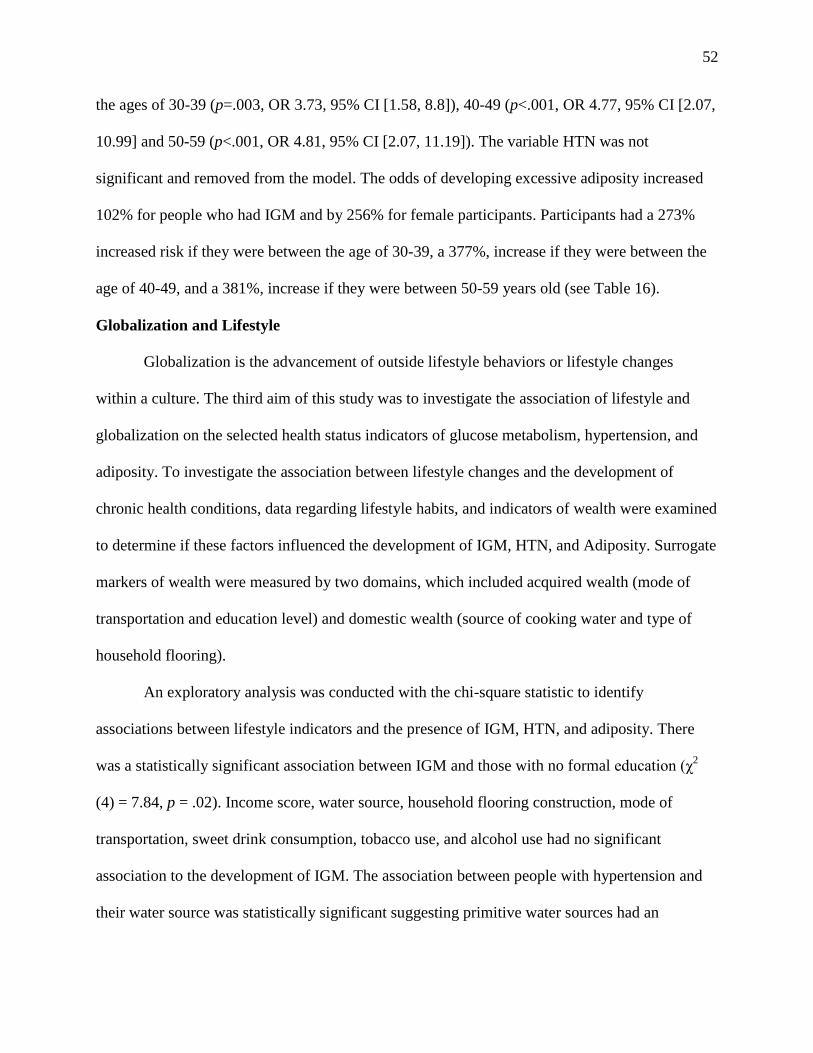
52
the ages of 30-39 (p=.003, OR 3.73, 95% CI [1.58, 8.8]), 40-49 (p<.001, OR 4.77, 95% CI [2.07,
10.99] and 50-59 (p<.001, OR 4.81, 95% CI [2.07, 11.19]). The variable HTN was not
significant and removed from the model. The odds of developing excessive adiposity increased
102% for people who had IGM and by 256% for female participants. Participants had a 273%
increased risk if they were between the age of 30-39, a 377%, increase if they were between the
age of 40-49, and a 381%, increase if they were between 50-59 years old (see Table 16).
Globalization and Lifestyle
Globalization is the advancement of outside lifestyle behaviors or lifestyle changes
within a culture. The third aim of this study was to investigate the association of lifestyle and
globalization on the selected health status indicators of glucose metabolism, hypertension, and
adiposity. To investigate the association between lifestyle changes and the development of
chronic health conditions, data regarding lifestyle habits, and indicators of wealth were examined
to determine if these factors influenced the development of IGM, HTN, and Adiposity. Surrogate
markers of wealth were measured by two domains, which included acquired wealth (mode of
transportation and education level) and domestic wealth (source of cooking water and type of
household flooring).
An exploratory analysis was conducted with the chi-square statistic to identify
associations between lifestyle indicators and the presence of IGM, HTN, and adiposity. There
was a statistically significant association between IGM and those with no formal education (χ2
(4) = 7.84, p = .02). Income score, water source, household flooring construction, mode of
transportation, sweet drink consumption, tobacco use, and alcohol use had no significant
association to the development of IGM. The association between people with hypertension and
their water source was statistically significant suggesting primitive water sources had an
53
increased association with the development of hypertension (χ2
(3) = 8.11, p = .044). Tobacco
use was associated with a higher rate of hypertension, as compared to non-tobacco users (χ2
(2) =
13.63, p= .001); however, there was an inverse relationship between tobacco use and obesity
with a statistically significant number of non-tobacco users having excess adiposity (χ2
(4) =
16.4, p < .001). The type of household flooring construction and mode of transportation had a
statistically significant association to excess adiposity. Participants having concrete or tile floors
were more likely to have excess adiposity compared to those with dirt and wooden household
floors (χ2
(4) =15.99, p < .001). Participants with motorized transportation were more likely to
have excess adiposity compared to those who walk or ride bicycles (χ2
(4) = 10.44, p = .034). In
terms of education, those with secondary school education and beyond had a higher rate of
excess adiposity compared to those that had no education or primary school education (χ2(4) =
9.28, p = .01). Participants with higher composite income scores were more likely to have excess
adiposity (χ2
(4) =10.95, p = .004) (see Table 17).
Impaired glucose metabolism and globalization.
Univariate ANOVA was conducted to determine which lifestyle variables were
associated with elevated FPG levels. The dependent variable FPG was analyzed as a continuous
variable, while the independent variables were tobacco use, alcohol use, and sweet drink
consumption. The overall model was not statistically significant and there were no significant
main effects observed. A Bonferroni correction was performed demonstrating a significant
association between people who consumed more than four sweet drinks per week having a
higher FPG level (p = .007) (see Table 18).
Univariate ANOVA was conducted to determine which socioeconomic variables were
associated with elevated glucose levels. The dependent variable FPG was analyzed as a
54
continuous variable, while the independent variables were level of education, type of household
flooring, source of cooking water, and mode of transportation. The overall model was
statistically significant (F (54,580) = 5.82, p < .001, ή2 = 0.352) and there were significant main
effects between FPG and level of education (F (2,580) = 3.43, p = .033, ή2 = .012), type of
household flooring (F (2,580) = 17.23, p < .001, ή2 = .056), source of cooking water (F (3,580) =
33.36, p < .001, ή2 =.147), and mode of transportation (F (2,580) = 23.21, p < .001, ή
2 = .074).
There was a two-way interaction noted between education level and source of cooking water, (F
(2,580) = 23.21, p < .001, ή2 = .02) and mode of transportation and source of cooking water (F
(3,580) = 67.72, p < .001, ή2 = .26) (see Table 19).
A forward binary logistic regression was conducted to determine which lifestyle variables
(tobacco, alcohol, and sweet drink) and socioeconomic indicators (education, flooring
construction, water source, and mode of transportation) were predictors of IGM. The model
included level of education and was statistically significant in predicting IGM (χ 2
(2) = 7.26, p =
.027). The variables tobacco use, sweet drink consumption, alcohol use, household flooring
construction, water source, and mode of transportation were not statistically significant and were
removed from the model. The higher level of education appeared to be protective for the
development of IGM compared to people with no formal education. For participants who
completed primary school, there was a 60% risk reduction of developing IGM (p = .009; β -
0.641, OR 0.58, 95% CI [0.33, 0.85]) and for people who completed secondary school or higher
had a 44% risk reduction of developing IGM (p = .058, β -0.82, OR 0.44, 95% CI [0.19, 1.03])
(see Table 20).
55
Hypertension and globalization.
Univariate ANOVA was conducted to determine which lifestyle variables were
associated with HTN. The dependent variable systolic blood pressure was analyzed as a
continuous variable, while the independent variables were tobacco use, alcohol use, and sweet
drink consumption. The overall model was statistically significant, (F (33,611) = 1.83, p = .004,
ή2= .09) and a significant main effect was observed with tobacco use (F (2,611) = 6.99, p = .001,
ή2= .022). A Bonferroni correction was performed identifying people who were former tobacco
users having higher systolic blood pressure readings compared to life-long non-tobacco users (p
< .001) (see Table 18).
Univariate ANOVA was conducted to determine which socioeconomic variables were
associated with HTN. The dependent variable systolic blood pressure was analyzed as a
continuous variable, while the independent variables were level of education, type of household
flooring, source of cooking water, and mode of transportation. The overall model was not
statistically significant (p = .06); however, there was a significant main effect between education
level and elevated systolic blood pressure (F (2,590) = 7.35, p = .001, ή2 =.024). A post hoc
Bonferroni correction was performed demonstrating a significant association between levels of
education and SBP, (p = .021), indicating those without formal education were more likely to
develop hypertension compared to those who completed primary or secondary school (see Table
19).
A forward binary logistic regression was conducted to determine which lifestyle variables
(tobacco, alcohol, and sweet drink) and socioeconomic indicators (education, flooring
construction, water source, and mode of transportation) were predictors of HTN. The model
included tobacco use and source of cooking water and was statistically significant in predicting
56
the development of HTN, (χ2 (5) = 20.75, p =.047). The variables sweet drink consumption,
alcohol use, flooring construction, education, and mode of transportation were not statistically
significant and removed from the model. Being a former smoker had a significant increase risk
of developing hypertension, (p < .001, OR 2.26, 95% CI [1.46, 3.50]). For participants who were
former smokers, there was a 126% increased risk of developing HTN (see Table 21).
Adiposity and globalization.
Univariate ANOVA was conducted to determine which lifestyle variables were
associated with excess adiposity. The dependent variable body mass index was analyzed as a
continuous variable, while the independent variables were tobacco use, alcohol use, and sweet
drink consumption. The overall model was statistically significant, (F (33,608) = 1.93, p = .002,
ή2= .095) and there was a significant main effect observed with tobacco use (F (2,611) = 7.65, p
= .001, ή2= .025). A Bonferroni correction was performed demonstrating that people who were
current and former tobacco users had a significantly lower BMI compared to non- tobacco users
(p < .001) (see Table 18).
Univariate ANOVA was conducted to determine which socioeconomic variables were
associated with excessive adiposity. The dependent variable body mass index was analyzed as a
continuous variable, while the independent variables were level of education, type of household
flooring, source of cooking water, and mode of transportation. The overall model was
statistically significant (F (54,587) = 2.05, p < .001, ή2= .158) and there was a significant two-
way interaction between level of education and mode of transportation to higher BMI levels (F
(2,587) = 3.78, p = .023, ή2= .013). A post hoc Bonferroni correction was performed
demonstrating a significant association on flooring type suggesting those with concrete
household floors were more likely to develop excess adiposity compared to those with dirt floors
57
(p < .001) and wooden household floors (p = .02). Those who used a motorized means of
transportation were more likely to develop excess adiposity compared to those who used bicycles
(p = .008) but not those who walked. Participants who completed primary school (p < .001) or
higher levels of education (secondary school or higher) (p = .006) were more likely to develop
excess adiposity compared to those without formal education (see Table 19).
A forward binary logistic regression was conducted to determine which lifestyle variables
(tobacco, alcohol, and sweet drink) and socioeconomic indicators (education, flooring
construction, water source, and mode of transportation) were predictors of developing excessive
adiposity. The model included tobacco use and household flooring construction and was
statistically significant in predicting the development of excessive adiposity, (χ2 (5) = 32.77, p <
.001). The variables sweet drink consumption, alcohol use, education level, mode of
transportation, and education level were not statistically significant and removed from the model.
Being a former tobacco user (p = .002, β -0.873, OR 0.42, 95% CI [0.24, 0.73]) and a current
tobacco user (p = .032, β -1.32, OR 0.27, 95% CI [0.08, 0.89]) appeared to have a significant risk
reduction for the development of excessive adiposity. The type of household flooring
construction has a significant effect on the development of excessive adiposity: compared to
people with earthen floors, people who had wooden plank floors have a 98% increase risk of
developing excessive adiposity (p = .015, OR 1.98, 95% CI [1.14, 3.44]) and people who had
concrete floors have a 131% increased risk of developing excessive adiposity, (p < .001, OR
2.32, 95% CI [1.46-3.66]) (see Table 22).
Conclusions
The first aim of this study was to describe the prevalence of pre-diabetes and diabetes in
rural AruMeru district of Tanzania. The crude prevalence rate for pre-diabetes and diabetes is
58
7.1% and 9% respectively, while the age-adjusted prevalence rates for pre-diabetes and diabetes
are 2.52% and 2.84% respectively. This is the first prevalence study of diabetes in the AruMeru
district and will provide a baseline prevalence rate for diabetes and pre-diabetes among people
who live in the AruMeru district.
The second aim of this study examined demographic and biometric indicators on the
development of impaired glucose metabolism, hypertension, and excessive adiposity. Systolic
blood pressure, age, and body mass index were identified as being significantly associated with
the development of IGM. The third aim of the study examined identified lifestyle factors that
contributed to the development of IGM, HTN, and excess adiposity. IGM was associated with all
wealth indicators suggesting people with higher levels of education, better household flooring,
indoor plumbing and owners of automobiles were more likely to develop IGM. Hypertension
was associated with improved water sources and the use of tobacco products while the
development of excessive adiposity was associated with motorized means of transportation,
higher levels of education, improvement of household flooring, and the presence of indoor
plumbing.
The effects of urbanization may result in improved quality of life for people in rural
Tanzania; however, the changes warrant consideration of two factors. Asset acquisition such as
improved flooring, vehicular ownership, education level, and indoor plumbing may represent
increasing wealth and are all associated with the development of IGM and excessive adiposity.
Second, these variables may be individually associated with the development of IGM, HTN and
excessive adiposity and concomitant changes in lifestyle patterns, which by themselves may alter
the balance between caloric consumption and metabolic energy expenditure.
59
Chapter 5
Diabetes and other chronic diseases are present with increasing prevalence in developing
counties and specifically in sub-Sahara Africa. Once thought of as a rare occurrence in sub-
Sahara Africa, diabetes will soon become a significant health challenge. Recent studies have
estimated the prevalence of type 2 diabetes in sub-Sahara Africa to range from 4.5% in Kenya to
47% in the Democratic Republic of Congo (Christensen et al., 2009; Hightower et al., 2011).
According to the International Diabetes Federation, the prevalence of diabetes is close to 4% on
the African continent compared to 10.2% in North America (Whiting et al., 2011). The primary
aim of this study was to describe the prevalence of type 2 diabetes mellitus for residents in rural
northern Tanzania.
Prevalence of diabetes
Crude prevalence estimates for pre-diabetes and diabetes in this study were 7.1% and
9.0%, respectively, while the indirect age-adjusted prevalence rates were 2.79% and 2.84%
respectively, in AruMeru district of northern Tanzania. This was the first prevalence study
reporting diabetes prevalence rates for the AruMeru district; however, changes in prevalence are
determined by comparing regional estimates. Aspray et al. (2000) examined the prevalence of
pre-diabetes and diabetes in a rural village in the Kilimanjaro region of northern Tanzania, which
is about 50 kilometers from where this study site. Aspray and colleagues reported the prevalence
of diabetes to be 1.1%, while in 2009 Christenson reported the estimated prevalence of diabetes
in southern Kenya to be 4.2%. Both Aspray and Christenson used the world population, rather
than national or district level population, to adjust their findings for the age standardization.
When standardizing the results from this study to the world population, the estimated prevalence
rates for pre-diabetes and diabetes increase from 2.52/2.84% to 4.71/5.13% respectively because
60
of the older age of the participants. Comparing the results of this study to Aspray’s estimates, it
appears there may be modest increase in the prevalence of pre-diabetes and diabetes in northern
Tanzania. The AruMeru district and the Kilimanjaro region consist of different tribal groups;
however, both areas are located in high mountainous, fertile regions with economic advantages
from agriculture.
The WHO/IDF criteria were used in this study to assess both pre-diabetes and diabetes;
however, the American Diabetes Association (ADA) 2012 criteria have a lower diagnostic
threshold for impaired fasting glucose. Applying the 2012 criteria to these data, the age-adjusted
rate of pre-diabetes would have increased from 2.52% to 11.89% in the AruMeru district.
Alarming concerns from this study are the advanced age of participants and the
prevalence of pre-diabetes and diabetes in the aged. The Tanzanian government estimates life
expectancy to be 53 years of age (Masalu et al., 2009); however, The mean age of this study was
50.1 years of age, with more than 212 (33%) people over the age of 60 years including one
person reporting being more than 100 years old. There is a statistically significant association
between advancing age and the development of diabetes, the number of people who are at
significant risk for developing diabetes. Considering previous reports by Whiting (Whiting et al.,
2011) and Christenson (Christensen et al., 2009) evidence suggests between 60-85% of new
cases diabetes are identified during prevalence studies in SSA, corresponding to the 66% of
people in this study had unrecognized diabetes. Understanding that significant numbers of people
may indeed have unrecognized diabetes, the burden of diabetes and diabetic related
complications may increase significantly in the future.
The reported prevalence rates of pre-diabetes and diabetes are higher than expected,
based on previous reports. Despite promoting, the study in Swahili and requesting an 8-hour
61
caloric free fast, it is possible some of the participants will not have been fasting, thus skewing
the results. However, based on the preexisting prevalence of people known to have diabetes and
the ratio of known and unknown rate, the prevalence of diabetes is consistent with previous
reports.
These data suggest a moderate burden of diabetes in this region and poses serious
financial implications for people with diabetes who wish to seek healthcare. The diabetes clinics
and specialty diabetes providers are limited to urban centers (National Bureau of Statistics,
2011). Previous reports have described people in Tanzania spending as much as 50% of their
household income on anti-hyperglycemic agents and transportation to receive medical care
(Justin-Temu et al., 2009; Kolling et al., 2010; Lugongo, 2010).
Diabetes is a well-known risk factor for the development of coronary artery disease
(Wamala, Merlo, & Bostrom, 2006); however, a history of heart disease was reported with low
frequency. Participants that reported a previous history of diabetes were 20 (3.1%) while those
participants reporting a history of coronary artery disease were similar (n=19, 2.9%) with an
association between people with a history of diabetes and coronary disease. It is possible with the
limited number of healthcare facilities; people with coronary disease with or without diabetes
could succumb to their health condition prior to receiving care.
Biometric indicators of health
The second aim of the study examined the association between anthropometric and
demographic indicators and the presence of selected health conditions. An association between
IGM, hypertension, and excessive adiposity was detected. Examining the interaction between
biometric variables and the presence of IGM, HTN, and adiposity provided insight regarding the
interrelationship between these variables in residents in this rural community. Advancing age has
62
a significant association with the development with each of these chronic conditions. BMI and
WHR have been used to categorize obesity and some reports have suggested that WHR or waist
circumference is better for people in developing countries (Petursson et al., 2011; Schulze et al.,
2006). This study demonstrated that BMI is a better measurement of adiposity and is more
sensitive for detecting associations between adiposity, hypertension, and IGM for people living
in the AruMeru district. The combination of HTN, IGM and adiposity are inter-connected and
can be predicted based on body habitus. It is not clear if obesity is the sentinel event or whether
the combination of the characteristics, which could be classified as metabolic syndrome, has an
underlying pathophysiologic implication.
According to previous studies by Swai et al. (1992), there was no association with obesity
and diabetes, but rather with malnourishment. The results from the present study clearly showed
an increased risk of developing diabetes for overweight and obese participants. Studies by
McLarty, Swai, and Christenson suggested that being underweight might be a predictor of
diabetes, which is contradictory to the results of this study. There was a 1.6 fold reduction in pre-
diabetes/diabetes for people with a BMI less than 18.5, compared to people with a normal BMI.
This study excluded people with evidence of an active infection or who were taking antiviral
medications. There is evidence to suggest that antiviral medications can increase the risk for
diabetes leading to a relative increase in diabetes for those who are malnourished from AIDS
(Field, 2009; Masalu et al., 2009). The results of this study suggested that the risk of developing
diabetes is associated with being overweight (6.8 fold increase) and obese (15.9 fold increase)
compared to people with normal body mass indices.
Advancing age was common predictor variable for the development of IGM, HTN, and
excessive adiposity. Females were more likely to become obese compared to males; however,
63
there was no effect of gender and the development of diabetes or hypertension. The paradigm of
obesity is complex in developing countries, as health and wealth can be associated with excess
adiposity (Neuman et al., 2011; Subramanian et al., 2011). People with disease conditions such
as HIV, tuberculosis, and severe malnutrition often have emaciated and cachectic physical
appearance owing to the physical observation of disease (Popkin et al., 2012). The visual
appearances of obesity demonstrates to community members that people with excess adiposity
can afford to purchase food and are free of serious disease conditions.
Globalization and Wealth
The third aim of the study examined selective lifestyle factors and implications of
globalization and the presence of selected health conditions including glucose metabolism,
hypertension, and excess adiposity.
Habits.
Lifestyle habits are reflective of western influence in terms of tobacco use and soda
beverages. The public display of participation in these behaviors may offer a demonstration of
pseudo-wealth as soda and tobacco products are inexpensive in rural Tanzania. Consumption of
these products may not be representative of a higher SES, but rather habitual or a public display.
These data suggest that tobacco use is low in rural Tanzania and current smokers account for
5.4% of the sample (n=35) with the majority of current smokers being over the age of 60.
Tobacco use had implications on health as smokers had lower BMI compared to non-smokers,
but were more prone to having hypertension. The number of participants who admitted to using
tobacco was low and it is hard to make inferences based on 6% of the participants. This study
examined tobacco use as current, former, and non-smokers. Future studies should quantify the
amount of tobacco use by smokers.
64
The consumption of sweet drinks, which included sweet coffee, sweet tea, and soda, was
not associated with IGM and excess adiposity, but it was associated with higher fasting plasma
glucose levels. The distribution of sweet drink consumption was multi-modal and may have
skewed the results with peak levels of consumption being recorded at 4-10 sweet drinks per
week and more than 21 sweet drinks per week. The bimodal distribution of sweet drinks was not
associated with wealth or village location and the factors associated with this phenomenon were
not well understood. One explanation for this variance could be the translation of this question to
the participant. There is a wide categorical interval in determining how many sweet drinks a day
were consumed. Perhaps a two-week dietary log would provide additional data to answer these
questions. Although these numbers are limited, there was a significant association between FPG
and participants who consumed three or less sweet drinks per week compared to those who
consumed four or more sweet drinks per week.
The reported frequency of alcohol consumption was low, which is contrary to other
reports (Cubbins, Kasprzyk, Montano, Jordan, & Woelk, 2012; Masalu et al., 2009; Selembo,
2009). Most people reported a status of non-drinker, which may be associated with the
community stigma associated with alcohol use. The screening locations were inside community
churches and people may not have felt comfortable admitting to alcohol use.
Lifestyle/wealth.
Globalization is transference of goods and technology from developed countries to
developing countries. Some aspects of globalization become wealth indicators, while others
become status symbols. Four surrogate indicators of wealth were examined, as part of this study.
These could be described as domestic wealth, which included the type of household flooring
construction and source of water for cooking, or acquired wealth, which included the mode of
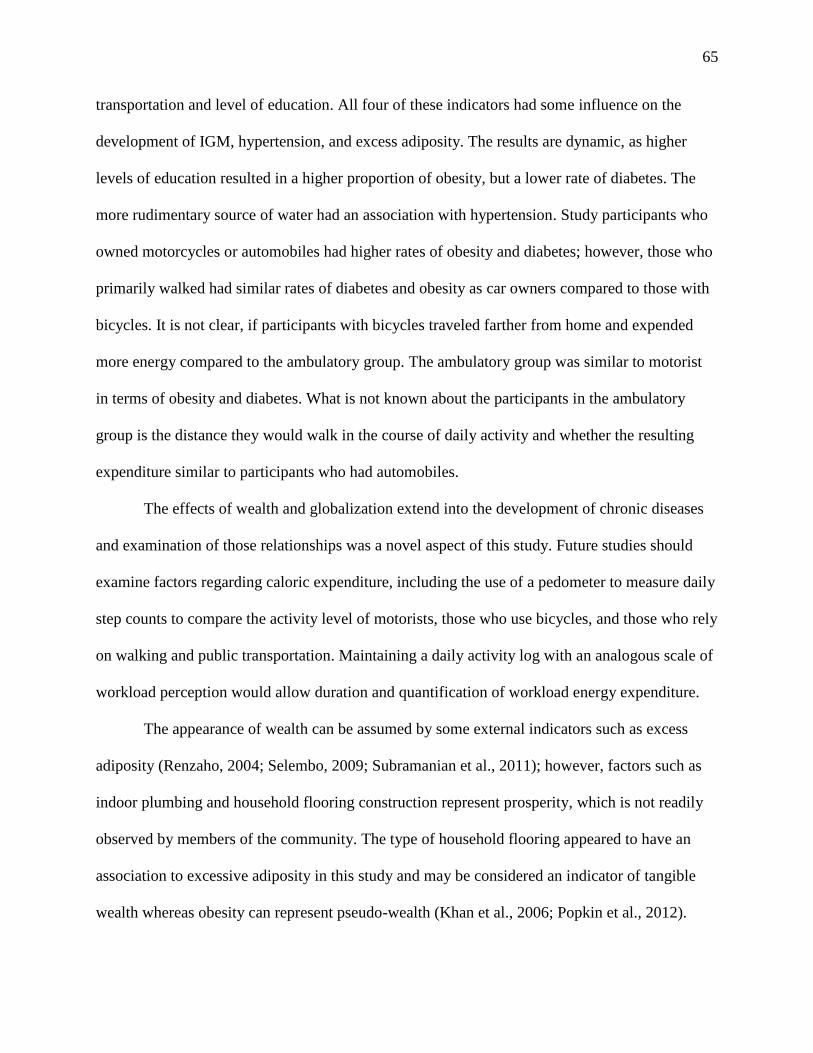
65
transportation and level of education. All four of these indicators had some influence on the
development of IGM, hypertension, and excess adiposity. The results are dynamic, as higher
levels of education resulted in a higher proportion of obesity, but a lower rate of diabetes. The
more rudimentary source of water had an association with hypertension. Study participants who
owned motorcycles or automobiles had higher rates of obesity and diabetes; however, those who
primarily walked had similar rates of diabetes and obesity as car owners compared to those with
bicycles. It is not clear, if participants with bicycles traveled farther from home and expended
more energy compared to the ambulatory group. The ambulatory group was similar to motorist
in terms of obesity and diabetes. What is not known about the participants in the ambulatory
group is the distance they would walk in the course of daily activity and whether the resulting
expenditure similar to participants who had automobiles.
The effects of wealth and globalization extend into the development of chronic diseases
and examination of those relationships was a novel aspect of this study. Future studies should
examine factors regarding caloric expenditure, including the use of a pedometer to measure daily
step counts to compare the activity level of motorists, those who use bicycles, and those who rely
on walking and public transportation. Maintaining a daily activity log with an analogous scale of
workload perception would allow duration and quantification of workload energy expenditure.
The appearance of wealth can be assumed by some external indicators such as excess
adiposity (Renzaho, 2004; Selembo, 2009; Subramanian et al., 2011); however, factors such as
indoor plumbing and household flooring construction represent prosperity, which is not readily
observed by members of the community. The type of household flooring appeared to have an
association to excessive adiposity in this study and may be considered an indicator of tangible
wealth whereas obesity can represent pseudo-wealth (Khan et al., 2006; Popkin et al., 2012).
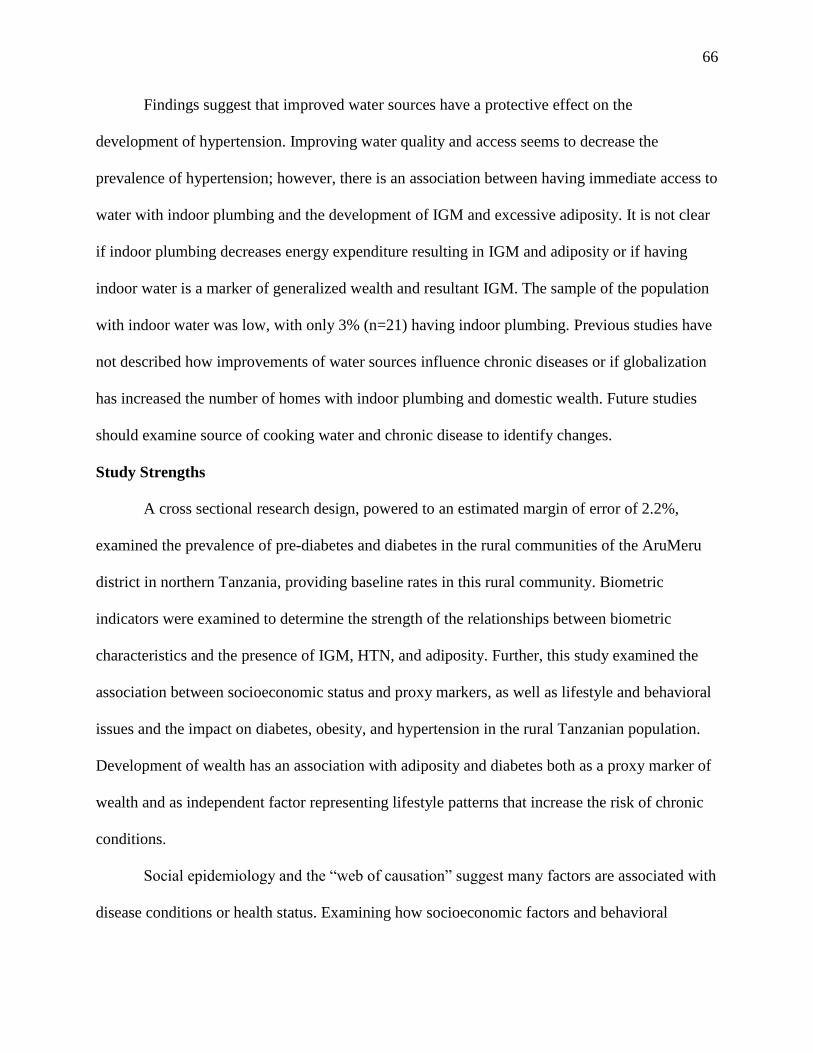
66
Findings suggest that improved water sources have a protective effect on the
development of hypertension. Improving water quality and access seems to decrease the
prevalence of hypertension; however, there is an association between having immediate access to
water with indoor plumbing and the development of IGM and excessive adiposity. It is not clear
if indoor plumbing decreases energy expenditure resulting in IGM and adiposity or if having
indoor water is a marker of generalized wealth and resultant IGM. The sample of the population
with indoor water was low, with only 3% (n=21) having indoor plumbing. Previous studies have
not described how improvements of water sources influence chronic diseases or if globalization
has increased the number of homes with indoor plumbing and domestic wealth. Future studies
should examine source of cooking water and chronic disease to identify changes.
Study Strengths
A cross sectional research design, powered to an estimated margin of error of 2.2%,
examined the prevalence of pre-diabetes and diabetes in the rural communities of the AruMeru
district in northern Tanzania, providing baseline rates in this rural community. Biometric
indicators were examined to determine the strength of the relationships between biometric
characteristics and the presence of IGM, HTN, and adiposity. Further, this study examined the
association between socioeconomic status and proxy markers, as well as lifestyle and behavioral
issues and the impact on diabetes, obesity, and hypertension in the rural Tanzanian population.
Development of wealth has an association with adiposity and diabetes both as a proxy marker of
wealth and as independent factor representing lifestyle patterns that increase the risk of chronic
conditions.
Social epidemiology and the “web of causation” suggest many factors are associated with
disease conditions or health status. Examining how socioeconomic factors and behavioral
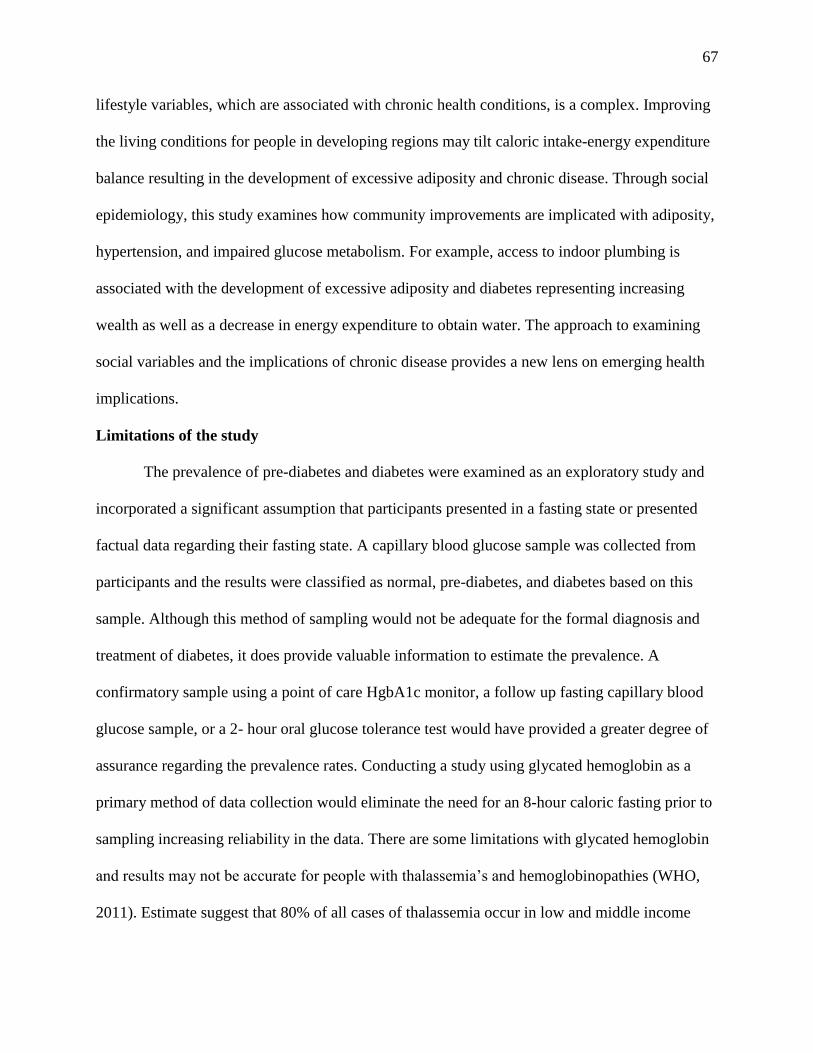
67
lifestyle variables, which are associated with chronic health conditions, is a complex. Improving
the living conditions for people in developing regions may tilt caloric intake-energy expenditure
balance resulting in the development of excessive adiposity and chronic disease. Through social
epidemiology, this study examines how community improvements are implicated with adiposity,
hypertension, and impaired glucose metabolism. For example, access to indoor plumbing is
associated with the development of excessive adiposity and diabetes representing increasing
wealth as well as a decrease in energy expenditure to obtain water. The approach to examining
social variables and the implications of chronic disease provides a new lens on emerging health
implications.
Limitations of the study
The prevalence of pre-diabetes and diabetes were examined as an exploratory study and
incorporated a significant assumption that participants presented in a fasting state or presented
factual data regarding their fasting state. A capillary blood glucose sample was collected from
participants and the results were classified as normal, pre-diabetes, and diabetes based on this
sample. Although this method of sampling would not be adequate for the formal diagnosis and
treatment of diabetes, it does provide valuable information to estimate the prevalence. A
confirmatory sample using a point of care HgbA1c monitor, a follow up fasting capillary blood
glucose sample, or a 2- hour oral glucose tolerance test would have provided a greater degree of
assurance regarding the prevalence rates. Conducting a study using glycated hemoglobin as a
primary method of data collection would eliminate the need for an 8-hour caloric fasting prior to
sampling increasing reliability in the data. There are some limitations with glycated hemoglobin
and results may not be accurate for people with thalassemia’s and hemoglobinopathies (WHO,
2011). Estimate suggest that 80% of all cases of thalassemia occur in low and middle income
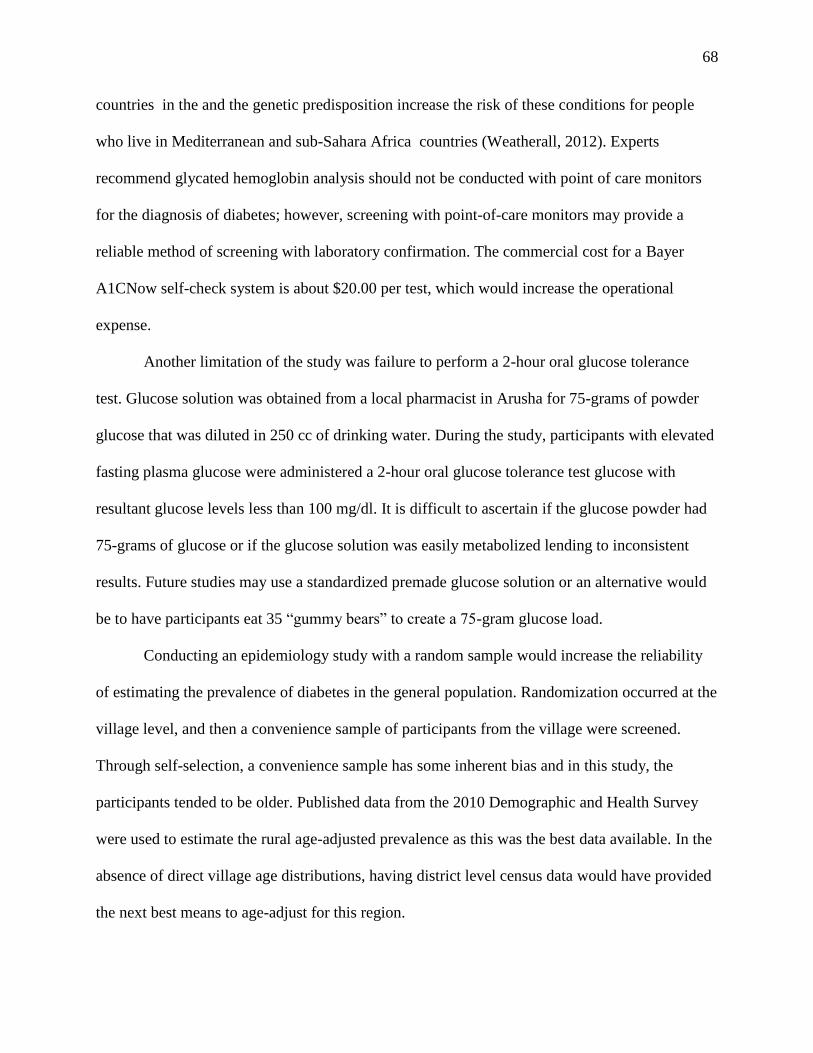
68
countries in the and the genetic predisposition increase the risk of these conditions for people
who live in Mediterranean and sub-Sahara Africa countries (Weatherall, 2012). Experts
recommend glycated hemoglobin analysis should not be conducted with point of care monitors
for the diagnosis of diabetes; however, screening with point-of-care monitors may provide a
reliable method of screening with laboratory confirmation. The commercial cost for a Bayer
A1CNow self-check system is about $20.00 per test, which would increase the operational
expense.
Another limitation of the study was failure to perform a 2-hour oral glucose tolerance
test. Glucose solution was obtained from a local pharmacist in Arusha for 75-grams of powder
glucose that was diluted in 250 cc of drinking water. During the study, participants with elevated
fasting plasma glucose were administered a 2-hour oral glucose tolerance test glucose with
resultant glucose levels less than 100 mg/dl. It is difficult to ascertain if the glucose powder had
75-grams of glucose or if the glucose solution was easily metabolized lending to inconsistent
results. Future studies may use a standardized premade glucose solution or an alternative would
be to have participants eat 35 “gummy bears” to create a 75-gram glucose load.
Conducting an epidemiology study with a random sample would increase the reliability
of estimating the prevalence of diabetes in the general population. Randomization occurred at the
village level, and then a convenience sample of participants from the village were screened.
Through self-selection, a convenience sample has some inherent bias and in this study, the
participants tended to be older. Published data from the 2010 Demographic and Health Survey
were used to estimate the rural age-adjusted prevalence as this was the best data available. In the
absence of direct village age distributions, having district level census data would have provided
the next best means to age-adjust for this region.
69
Data regarding wealth indicators were based on limited reports from previously published
papers in developing countries. From the time, the research protocol was developed to data
collection, the use of cellular phones, internet services, and television access had increased
significantly in the AruMeru district of northern Tanzania. The factors examined in this study
accounted for a small to moderate amount of the variance for people who have impaired glucose
metabolism, hypertension, and excess adiposity suggesting other factors may be involved with
the progression of these conditions. The increased prevalence in diabetes may be related to
factors not examined in this study.
The possibility of having both type I and type II errors in these analyses is present.
Despite having a moderate number of participants, many participants did not own vehicles, have
indoor plumbing, or attend higher levels of education. These variables may indeed have more
significance than detected and should be examined in future studies. A significant number of
participants obtained their cooking water from a protected water source and may contribute to a
type II error because of the large number of participants in the category and smaller numbers
who obtain their cooking water from a river or unprotected well.
Future studies
Future studies to confirm the prevalence as well as the incidence of pre-diabetes and
diabetes in the AruMeru district as well as other rural regions of Tanzania should be conducted.
These studies should consider comparing point of care glycated hemoglobin to standard capillary
blood glucose levels to determine the efficacy of this modality for screening purposes.
Examining the association between biometric indices added to the current literature;
however, investigating the effects of globalization and culture changes and the development of
IGM, HTN, and adiposity was a novel exploration and should be repeated.
70
Access to clinical services are limited in rural Tanzania and people who have pre-
diabetes and diabetes need both medical and nursing care in order to manage their health
condition while preventing complications. Additional studies should examine healthcare seeking
patterns for people who are at risk for diabetes, as well as people who have diabetes.
Understanding the patterns and barriers to seeking care may help the Ministry of Health as well
as local non-governmental organizations (NGO) develop treatment protocols, which are
appropriate for both individuals with diabetes who have varying levels of education and health
literacy.
Coronary disease has an association to diabetes but was reported with low frequency in
these data. Future studies should examine the association between coronary artery disease and
diabetes in the rural community to confirm this association in the AruMeru district and gain an
increased understanding of prevalence and implications of coronary disease in the AruMeru
district.
Conclusions
The findings of this study provide initial data on the prevalence of diabetes in the
AruMeru district and suggest the prevalence of diabetes may be increasing in northern Tanzania.
In a society where access to healthcare is limited and resources to pay for healthcare are scarce,
these conditions have devastating effects. The study findings indicate a significant association
between IGM and excess adiposity suggesting that additional studies investigating these chronic
diseases would be beneficial. Additional studies are needed to evaluate the prevalence of
diabetes in other parts of Tanzania as well as prevalence of hypertension and obesity.
Globalization and technology are apparent in the urban areas in Tanzania and these
technologies are increasing in availability for people living in rural communities. Access to safe
71
water, improvements in household construction, and access to modern transportation are
interacting with the lifestyle and health of people in the AruMeru district. Advancements to
improve quality of life are potentially decreasing energy expenditures resulting in excessive
adiposity and potentially contributing to the prevalence of diabetes. Understanding the health
implications of these advancements is paramount to prevent unnecessary morbidity and
mortality.
The results of this study provide some information about the association between lifestyle
changes and the development of diabetes, hypertension, and excessive adiposity for residents
living in rural northern Tanzania. Future studies should investigate other factors of globalization
including the use of the internet, cellular phones, and the impact of food preparation including
the use of cooking oils and the interaction with chronic health conditions
72
References
Abbas, Z. G., & Archibald, L. K. (2007). Challenges for management of the diabetic foot in
Africa: doing more with less. International Wound Journal, 4(4), 305-313. doi:
10.1111/j.1742-481X.2007.00376.x
Abbas, Z. G., Lutale, J. K., Game, F. L., & Jeffcoate, W. J. (2008). Comparison of four systems
of classification of diabetic foot ulcers in Tanzania. Diabetic Medicine, 25(2), 134-137.
doi: 10.1111/j.1464-5491.2007.02308.x
Agardh, E., Allebeck, P., Hallqvist, J., Moradi, T., & Sidorchuk, A. (2011). Type 2 diabetes
incidence and socio-economic position: a systematic review and meta-analysis.
International Journal of Epidemiology, 40(3), 804-818. doi: 10.1093/ije/dyr029
Akanji, A. O. (1990). Malnutrition-related diabetes mellitus in your adult diabetic patietns
attending a Nigerian diabetic clinic. Journal of Tripical Medicince and Hygiene, 93(1),
35-38.
American Diabetes Association. (2007). Diagnosis and Classification of Diabetes Mellitus.
Diabetes Care, 30(suppl 1), S42-S47. doi: 10.2337/dc07-S042
American Diabetes Association. (2012). Diagnosis and Classification of Diabetes Mellitus.
Diabetes Care, 35(Supplement 1), S64-S71. doi: 10.2337/dc12-s064
Amoah, A. G. B., Owusu, S. K., & Adjei, S. (2002). Diabetes in Ghana: a community based
prevalence study in Greater Accra. Diabetes Research and Clinical Practice, 56(3), 197-
205. doi: 10.1016/s0168-8227(01)00374-6
Aspray, T. J., Mugusi, F., Rashid, S., Whiting, D., Edwards, R., Alberti, K. G., & Unwin, N. C.
(2000). Rural and urban differences in diabetes prevalence in Tanzania: the role of
73
obesity, physical inactivity and urban living. Transactions of the Royal Society of
Tropical Medicine and Hygiene, 94(6), 637-644.
Assah, F. K., Ekelund, U., Brage, S., Mbanya, J. C., & Wareham, N. J. (2011). Urbanization,
Physical Activity, and Metabolic Health in Sub-Saharan Africa. Diabetes Care, 34(2),
491-496. doi: 10.2337/dc10-0990
Baldé, N. M., Diallo, I., Baldé, M. D., Barry, I. S., Kaba, L., Diallo, M. M., . . . Maugendre, D.
(2007). Diabetes and impaired fasting glucose in rural and urban populations in Futa
Jallon (Guinea): prevalence and associated risk factors. Diabetes & Metabolism,
33(2), 114-120. doi: 10.1016/j.diabet.2006.10.001
Barrett-Connor, E. (1989). Epidemiology, obesity, and non-insulin dependent diabetes mellitus.
Epidemiologic Reviews, 11(1), 172-181.
Benson, J. S. (2001). The impact of privatization on access in Tanzania. Social Science &
Medicine, 52(12), 1903-1915.
Bionime. (2012). Users manual Righttest GM300 101-3GM300-701 EN. Retrieved March 25,
2012, from
http://data.bionime.com/Manual_download/GM300/Users_Manual/GM300_Users_Manu
al-EN%28101-3GM300-701%29.pdf
Bonnefond, A., Froguel, P., & Vaxillaire, M. (2010). The emerging genetics of type 2 diabetes.
Trends in Molecular Medicine, 16(9), 407-416. doi: 10.1016/j.molmed.2010.06.004
Burgess, L. J., & Sulzer, N. U. (2010). The role of print advertising in clinic trial recruitement:
Lessons from a South African site. Open Access Journal of Clinical Trials, 2010(2), 83-
87. doi: 10.2147/OAJCT.S10027
74
Campbell, M. C., & Tishkoff, S. A. (2008). African Genetic Diversity: Implications for Human
Demographic History, Modern Human Origins, and Complex Disease Mapping. Annual
Review of Genomics and Human Genetics, 9(1), 403-433. doi:
doi:10.1146/annurev.genom.9.081307.164258
Ceesay, M. M., Morgan, M. W., Kamanda, M. O., Willoughby, V. R., & Lisk, D. R. (1997).
Prevalence of diabetes in rural and urban populations in southern Sierra Leone: a
preliminary survey. Tropical Medicine & International Health, 2(3), 272-277. doi:
10.1046/j.1365-3156.1997.d01-265.x
Centers for Medicare and Medicaid Services. (2009). National Health Expenditure Fact Sheet
Retrieved March 19, 2012, from
https://www.cms.gov/NationalHealthExpendData/25_NHE_Fact_Sheet.asp#TopOfPage
Chege, P., M. (2009). Diabetes Mellitus: An overview. CHAK Times, May-August.
Chen, G., Adeyemo, A., Zhou, J., Chen, Y., Huang, H., Doumatey, A., . . . Rotimi, C. (2007).
Genome-wide search for susceptibility genes to type 2 diabetes in West Africans:
Potential role of C-peptide. Diabetes Research and Clinical Practice, 78(3), e1-e6. doi:
10.1016/j.diabres.2007.04.010
Christensen, D. L., Friis, H., Mwaniki, D. L., Kilonzo, B., Tetens, I., Boit, M. K., . . . Borch-
Johnsen, K. (2009). Prevalence of glucose intolerance and associated risk factors in rural
and urban populations of different ethnic groups in Kenya. Diabetes Research and
Clinical Practice, 84(3), 303-310. doi: 10.1016/j.diabres.2009.03.007
CIA. (2009). The world factbook. Washington DC: Central Intelligence Agency Retrieved from
https://www.cia.gov/library/publications/the-world-factbook/index.html.
75
Cruickshank, J., Mbanya, J., Wilks, R., Balkau, B., McFarlane-Anderson, N., & Forrester, T.
(2001). Sick genes, sick individuals or sick populations with chronic disease? The
emergence of diabetes and high blood pressure in African-origin populations.
International Journal of Epidemiology, 30(1), 111-117. doi: 10.1093/ije/30.1.111
Cubbins, L. A., Kasprzyk, D., Montano, D., Jordan, L. P., & Woelk, G. (2012). Alcohol use and
abuse among rural Zimbabwean adults: A test of a community-level intervention. Drug
and Alcohol Dependence, 124(3), 333-339. doi:
http://dx.doi.org/10.1016/j.drugalcdep.2012.02.002
Dalal, S., Beunza, J. J., Volmink, J., Adebamowo, C., Bajunirwe, F., Njelekela, M., . . . Holmes,
M. D. (2011). Non-communicable diseases in sub-Saharan Africa: what we know now.
International Journal of Epidemiology, 40(4), 885-901. doi: 10.1093/ije/dyr050
Danaei, G., Finucane, M. M., Lu, Y., Singh, G. M., Cowan, M. J., Paciorek, C. J., . . . Ezzati, M.
(2011). National, regional, and global trends in fasting plasma glucose and diabetes
prevalence since 1980: systematic analysis of health examination surveys and
epidemiological studies with 370 country-years and 2·7 million participants. The Lancet,
378(9785), 31-40. doi: 10.1016/s0140-6736(11)60679-x
de-Graft Aikins, A., Unwin, N., Agyemang, C., Allotey, P., Campbell, C., & Arhinful, D. (2010).
Tackling Africa's chronic disease burden: from the local to the global. Globalization and
Health, 6(1), 5.
Delisle, H., Ntandou-Bouzitou, G., Agueh, V., Sodjinou, R., & Fauomi, B. (2011). Urbanization,
nutrition transition and cardiometabolic risk: The Benin study. British Journal of
Nutrition, 25, 1-11.
76
Douglas, M. (1964). P. H. Gulliver: Social control in an African society. A study of the Arusha:
agricultural Masai of northern Tanganyika. (International Library of Sociology and
Social Reconstruction.) xiv, 306 pp., 8 plates. London: Routledge and Kegan Paul, 1963.
35s. Bulletin of the School of Oriental and African Studies, 27(03), 676-677. doi:
doi:10.1017/S0041977X00118877
Ducorps, M., Ndong, W., Jupkwo, B., Poirier, J. M., Mayaudon, H., & Bauduceau, B. (2002).
Epidemiological aspects of diabetes in Cameroon: what is the role of tropical diabetes?
Diabetes & Metabolism, 23(1), 61-67.
Ekow, J.-M., & Shipp, J. (2001). Malnutrition-related Diabetes Mellitus: Myth or Reality. In J.-
M. Ekoe, P. Zimmet & R. Williams (Eds.), The Epidemiology of Diabetes Mellitus an
International Perspective (1 ed., pp. 263-272). Chichester: John Wiley & Sons Ltd.
Emanuel, Ezekiel J., Wendler, D., Killen, J., & Grady, C. (2004). What Makes Clinical Research
in Developing Countries Ethical? The Benchmarks of Ethical Research. The Journal of
Infectious Diseases, 189(5), 930-937. doi: doi:10.1086/381709
Evaristo-Neto, A., Foss-Freitas, M., & Foss, M. (2010). Prevalence of diabetes mellitus and
impaired glucose tolerance in a rural community of Angola. Diabetology & Metabolic
Syndrome, 2(1), 63.
Field, A. (2009). Discovering statistics using SPSS (3rd Eds ed.). London: Sage.
Friedman, G. D. (2004). Primer of Epidemiology (5 ed.). New York: McGraw-Hill.
Gallagher, E. J., Leroith, D., & Karnieli, E. (2011). The Metabolic Syndrome- from insulin
resistance to obesity and diabetes. Medical Clinic of North America, 95(5), 855-873.
77
Gavin, J. R., III, Davidson, M. B., & DeFronzo, R. A. (1997). Report of the Expert Committee
on the Diagnosis and Classification of Diabetes Mellitus. Diabetes Care, 20(7), 1183-
1197.
Habib, S. H., & Saha, S. (2010). Burden of non-communicable disease: Global Review. Diabetes
& Metabolic Syndrome: Clinical Research& Reviews, 4(1), 41-47.
Hall, V., Thomsen, R. W., Henriksen, O., & Lohse, N. (2011). Diabetes in Sub Saharan Africa
1999-2011: epidemiology and public health implications. A systematic review. BMC
Public Health, 11, 564-564.
Harbuwono, D. S. (2011). Redefining diabetes: Is it really necessary. Acta Medica Indonesia,
43(2), 79-81.
Hargreaves, J., Morison, L., Gear, J., Kim, J., Makhubele, M., Porter, J., . . . Pronyk, P. (2007).
Assessing household wealth in health studies in developing countries: a comparison of
participatory wealth ranking and survey techniques from rural South Africa. Emerging
Themes in Epidemiology, 4(1), 4.
Harris, M. I., Hadden, W. C., Knowler, W. C., & Bennett, P. H. (1985). International criteria for
the diagnosis of diabetes and impaired glucose tolerance. Diabetes Care, 8(6), 562-567.
Hartge, P. (2001). Epidemiologic Tools for Today and Tomorrow. Annals of the New York
Academy of Sciences, 954(1), 295-310. doi: 10.1111/j.1749-6632.2001.tb02757.x
Hightower, J. D., Hightower, C. M., Vázquez, B. Y., & Intaglietta, M. (2011). Incident
prediabetes/diabetes and blood pressure in urban and rural communities in the
Democratic Republic of Congo Vascular Health and Risk Management, 7(1), 483-489.
doi: : http://dx.doi.org/10.2147/VHRMS22707
78
Hillbom, E. (2010). From Millet to Tomatoes: Productivity Increase by Means of Introducing
High Value Agricultural Products in Meru, Tanzania. Paper presented at the
Development Research Day, Lund Sweden.
Huffman, M. D., Rao, K. D., Pichon-Riviere, A., Zhao, D., Harikrishnan, S., Ramaiya, K., . . .
Prabhakaran, D. (2011). A Cross-Sectional Study of the Microeconomic Impact of
Cardiovascular Disease Hospitalization in Four Low- and Middle-Income Countries.
PLoS ONE, 6(6), e20821. doi: 10.1371/journal.pone.0020821
Huxley, R., Mendis, S., Zheleznyakov, E., Reddy, S., & Chan, J. (2009). Body mass index, waist
circumference and waist:hip ratio as predictors of cardiovascular risk-a review of the
literature. Eur J Clin Nutr, 64(1), 16-22.
Idemyor, V. (2010). Diabetes in Sub-Saharan Africa: Health care perspectives, challenges, and
the economic burden of disease. Journal of the national Medical Associations, 102(7),
650-653.
Ikem, I., & Sumpio, B. E. (2011). Cardiovascular disease: the new epidemic in sub-Saharan
Africa. Vascular, 19(6), 301-307. doi: 10.1258/vasc.2011.ra0049
Joint United Nations Programme on HIV/AIDS WHO. (2006). AIDS epidemic update. UNAIDS
2006.
Jones-Smith, J. C., Gordon-Larsen, P., Siddiqi, A., & Popkin, B. (2011). Is the burden of
overweight shifting to the poor across the globe[quest] Time trends among women in 39
low- and middle-income countries (1991-2008). Int J Obes. doi:
http://www.nature.com/ijo/journal/vaop/ncurrent/suppinfo/ijo2011179s1.html
79
Justin-Temu, M., Nondo, R. S. O., Wiedenmayer, K., Ramaiya, K. L., & Teuscher, A. (2009).
Anti-diabetic drugs in the private and public sector in Dar Es Salaam, Tanzania. East
African Medical Journal, 85(3), 110-114.
Kapiga, S. (2011). Commentary: Non-communicable diseases in sub-Saharan Africa: a new
global health priority and opportunity. International Journal of Epidemiology, 40(4),
902-903. doi: 10.1093/ije/dyr098
Kauh, E., Mixson, L., Malice, M.-P., Mesens, S., Ramael, S., Burke, J., . . . Ruddy, M. (2012).
Prednisone affects inflammation, glucose tolerance, and bone turnover within hours of
treatment in healthy individuals. European Journal of Endocrinology, 166(3), 459-467.
doi: 10.1530/eje-11-0751
Khan, M. M., Hotchkiss, D. R., Berruti, A. A., & Hutchinson, P. L. (2006). Geographic aspects
of poverty and health in Tanzania: does living in a poor area matter? Health Policy Plan.,
21(2), 110-122. doi: 10.1093/heapol/czj008
Kirigia, J., Sambo, H., Sambo, L., & Barry, S. (2009). Economic burden of diabetes mellitus in
the WHO African region. BMC International Health and Human Rights, 9(1), 6.
Kolling, M., Winkley, K., & von Deden, M. (2010). "For someone who's rich, it's not a
problem". Insights from Tanzania on diabetes health-seeking and medical pluralism
among Dar es Salaam's urban poor. Globalization and Health, 6(1), 8.
Krieger, N. (1994). Epidemiology and the web of causation: Has anyone seen the spider? Social
Science Medicine, 39(7), 887-903.
Krieger, N. (2001). Theories for social epidemiology in the 21st century: an ecosocial
perspective. International Journal of Epidemiology, 30(4), 668-677. doi:
10.1093/ije/30.4.668
80
Krieger, N. (2011). Epidemiology and the peoples health: Theory and Context. Oxford: Oxford
press.
Kruk, M. E., Mbaruku, G., Rockers, P. C., & Galea, S. (2008). User fee exemptions are not
enough: Out-of-pocket payments for "free" delievery services in rural Tanzania. Tropical
Medicine & International Health, 13(12), 1442-1451. doi: 10.1111/j1365-
3156.2008.02173.x
Kusumayati, A., & Gross, R. (1998). Ecological and geographical characteristics predict
nutritional status of cummunities: Rapid assessment for poor villages. Health Policy and
Planning, 13(4), 408-416.
Leroith, D. (2012). Pathophysiology of metabolic syndrome: Implications for the
cardiometabolic risks associated with Type 2 Diabetes. American Journal of Medical
Sciences, 343(1), 13-16.
Levitt, N. S. (2008). Diabetes in Africa: epidemiology, management and healthcare challenges.
Heart, 94(11), 1376-1382. doi: 10.1136/hrt.2008.147306
Levitt, N. S., Steyn, K., Dave, J., & Bradshaw, D. (2011). Chronic noncommunicable diseases
and HIV-AIDS on a collision course: relevance for health care delivery, particularly in
low-resource settings—insights from South Africa. The American Journal of Clinical
Nutrition, 94(6), 1690S-1696S. doi: 10.3945/ajcn.111.019075
Levitt, N. S., Unwin, N. C., Bradshaw, D., Kitange, H. M., Mbanya, J.-C. N., Mollentze, W. F., .
. . Machibya, H. (2000). Application of the new ADA criteria for the diagnosis of
diabetes to population studies in sub-Saharan Africa. Diabetic Medicine, 17(5), 381-385.
Lopez, A. D., Mathers, C. D., Ezzati, M., Jamison, D., T., & Murray, C. J. L. (2006). Global
Burden of Disease and Risk Factors. Washington DC: The World Bank
81
Oxford Press.
Lugongo, B. (2010). Prevalence of diabetes in tanzania worrisome, say experts. The Citizen
Retrieved 11/26, 2010, from http://thecitizen.co.tz/business/-/5540-preference-of-
diabetes-in-tanzania-worrisome-say-experts
Lutale, J., Thordarson, H., Abbas, Z., & Vetvik, K. (2007). Microalbuminuria among Type 1 and
Type 2 diabetic patients of African origin in Dar Es Salaam, Tanzania. BMC Nephrology,
8(1), 2.
Lynch, J., & Smith, G. D. (2005). A life course approach to chronic disease. Annual Review of
Public Health, 26(1), 1-35. doi: 10.1146/annurev.publhealth.26.021304.144505
Maher, D., Smeeth, L., & Sekajugo, J. (2010). Health transition in Africa: practical policy
proposals for primary care. Bulletin of the World helath Organization, 88(12), 943-948.
Malecki, M. T. (2005). Genetics of type 2 diabetes mellitus. Diabetes Research and Clinical
Practice, 68, Supplement 1(0), S10-S21. doi: 10.1016/j.diabres.2005.03.003
Maletnlema, T. (2002). A Tanzanian perspective on the nutrition transition and its implications
for health. Public Health Nutrition, 5(1a), 163-168. doi: doi:10.1079/PHN2001289
Maruapula, S. D., Jackson, J. C., Holsten, J., Shaibu, S., Malete, L., Wrotniak, B., . . . Compher,
C. (2011). Socio-economic status and urbanization are linked to snacks and obesity in
adolescents in Botswana. Public Health Nutrition, 14(12), 2260-2267. doi:
doi:10.1017/S1368980011001339
Masalu, J., Kikwilu, E., Kahabuka, F., Senkoro, A., & Kida, I. (2009). Oral health related
behaviors among adult Tanzanians: a national pathfinder survey. BMC Oral Health, 9(1),
22.
82
Mathenge, W., Foster, A., & Kuper, H. (2010). Urbanization, ethnicity and cardiovascular risk in
a population in transition in Nakuru, Kenya: a population-based survey. BMC Public
Health, 10(1), 569.
Mazze, R., Yogev, Y., & Langer, O. Measuring glucose exposure and variability using
continuous glucose monitoring in normal and abnormal glucose metabolism in
pregnancy. Journal of Maternal-Fetal and Neonatal Medicine, 0(ja), 1-17. doi:
doi:10.3109/14767058.2012.670413
Mbanya, J. C. N., Cruickshank, J. K., Forrester, T., Balkau, B., Ngogang, J. Y., Riste, L., . . .
Wilks, R. (1999). Standardized comparison of glucose intolerance in west African-origin
populations of rural and urban Cameroon, Jamaica, and Caribbean migrants to Britain.
Diabetes Care, 22(3), 434-440. doi: 10.2337/diacare.22.3.434
Mbanya, J. C. N., Ngogang, J., Salah, J. N., Minkoulou, E., & Balkau, B. (1997). Prevalence of
NIDDM and impaired glucose tolerance in a rural and an urban population in Cameroon.
Diabetologia, 40(7), 824-829. doi: 10.1007/s001250050755
McCarthy, M. I. (2010). Genomics, Type 2 Diabetes, and Obesity. New England Journal of
Medicine, 363(24), 2339-2350. doi: doi:10.1056/NEJMra0906948
McLarty, D. G., Kinabo, L., & Swai, A. B. M. (1990). Diabetes in tropical Africa: a prospective
study, 1981-7. II. Course and prognosis. British Medical Journal, 300(6732), 1107-1110.
McLarty, D. G., Kitange, H. M., Mtinangi, B. L., Makene, W. J., Swai, A. B. M., Masuki, G., . . .
Alberti, K. G. (1989). Prevalence of diabetes and impaired glucose tolerance in rural
Tanzania. The Lancet, 333(8643), 871-875.
Miller, B. J. (2013). Diabetes Mellitus. In L. C. Copstead & J. Banasik (Eds.), Pathophysiology
(5 ed.). St Louis Missouri: Sauders.
83
Molyneux, S., Kamuya, D., & Marsh, V. (2010). Community Members Employed on Research
Projects Face Crucial, Often Under-Recognized, Ethical Dilemmas. The American
Journal of Bioethics, 10(3), 24 - 26.
Montgomery, M. R. (2008). The Urban Transformation of the Developing World. Science,
319(5864), 761-764. doi: 10.1126/science.1153012
Morris, J. N. (2007). Uses of epidemiology. International Journal of Epidemiology, 36(6), 1165-
1172. doi: 10.1093/ije/dym227
Motala, A. A. (2002). Diabetes trends in Africa. Diabetes/Metabolism Research and Reviews,
18(S3), S14-S20. doi: 10.1002/dmrr.284
Motala, A. A., Esterhuizen, T., Gouws, E., Pirie, F. J., & Omar, M. A. K. (2008). Diabetes and
Other Disorders of Glycemia in a Rural South African Community. Diabetes Care, 31(9),
1783-1788. doi: 10.2337/dc08-0212
Munga, M. A., Songstad, N., Blystad, A., & Maestad, O. (2009). The decentralisation-
centralisation dilemma: recruitment and distribution of health workers in remote districts
of Tanzania. BMC International Health and Human Rights, 9(1), 9.
Mungi, R. (2011). The Little Data book on Africa
Narayan, K. M. V., Echouffo-Tcheugui, J. B., Mohan, V., & Ali, M. K. (2012). Global
Prevention And Control Of Type 2 Diabetes Will Require Paradigm Shifts In Policies
Within And Among Countries. Health Affairs, 31(1), 84-92. doi:
10.1377/hlthaff.2011.1040
National Bureau of Statistics. (2003). Household Budget Survey 2000/01. Dar es Salaam.
National Bureau of Statistics. (2009). Household Budget Survey 2007. Dar es Salaam.
84
National Bureau of Statistics. (2011). Tanzania in Figures: 2010. Dar es Salaam: Ministry of
Finance.
National Diabetes Data Group. (1979). Classification and diagnosis of diabetes mellitus and
other categories of glucose intolerance. Diaebtes, 28, 1039-1057.
National High Blood Pressure Education Program. (2004). The Seventh Report of the Joint
National Committee on Prevention, Detection, Evaluation, and Treatment of High Blood
Pressure. Bethesda MD.
Nesto, R., Nelinson, D., & Pagotto, U. (2009). Obesity as a disease state: Guiding clinic
decisions on abdominal obesity and cardiometabolic risk. Clinical Cornerstone, 9(4), 43-
52.
Neuhann, H. F., Warter-Neuhann, C., Lyaruu, I., & Msuya, L. (2002). Diabetes care in
Kilimanjaro region: clinical presentation and problems of patients of the diabetes clinic at
the regional referral hospital—an inventory before structured intervention. Diabetic
Medicine, 19(6), 509-513. doi: 10.1046/j.1464-5491.2002.00673.x
Neuman, M., Finlay, J. E., Davey Smith, G., & Subramanian, S. (2011). The poor stay thinner:
stable socioeconomic gradients in BMI among women in lower- and middle-income
countries. The American Journal of Clinical Nutrition. doi: 10.3945/ajcn.111.018127
Ngowi, H. P. (2009). Economic development and change in Tanzania since independence: The
political leadership factor. African Journal of Political Science and International
Relations, 3(4), 259-267.
Nube, M., Asenso-Okyere, W. K., & van den Bloom, G. J. M. (1998). Body mass index as
indicator of standard of living in developing countries. European Journal of Clinical
Nutrition, 52(2), 136-144.
85
Nyamdorj, R. (2010). Anthropometric measures of obesity-their association with type 2 diabetes
and hypertension across ethnic groups. Ph.D., University of Helsinki, Helsinki Finland.
Nyenwe, E. A., Odia, O. J., Ihekwaba, A. E., Ojule, A., & Babatunde, S. (2003). Type 2 diabetes
in adult Nigerians: a study of its prevalence and risk factors in Port Harcourt, Nigeria.
Diabetes Research and Clinical Practice, 62(3), 177-185. doi:
10.1016/j.diabres.2003.07.002
Oladapo, O. O., Salako, L., Sodiq, O., Shoyinka, K., Adedapo, K., & Falase, A. O. (2010). A
prevalence of cardiometabolic risk factors amoung a rural Yoruba south-western Nigerian
population: A population -based survey. Cardiovascular Journal of Africa, 21(1), 26-31.
Osei, K., Schuster, D., Amoah, A. G. B., & Owusu, S. K. (2003). Pathogensis of type 1 and type
2 diabetes millitus in sub-Saharan Africa: Implications for transitional populations.
Journal of Cardiovascular Risk, 10(1), 85-96.
Petursson, H., Sigurdsson, J. A., Bengtsson, C., Nilsen, T. I. L., & Getz, L. (2011). Body
Configuration as a Predictor of Mortality: Comparison of Five Anthropometric Measures
in a 12 Year Follow-Up of the Norwegian HUNT 2 Study. PLoS ONE, 6(10), e26621.
doi: 10.1371/journal.pone.0026621
Polito, A., Brouland, J.-P., Porcher, R., Sonneville, R., Siami, S., Stevens, R., . . . Sharshar, T.
(2011). Hyperglycaemia and apoptosis of microglial cells in human septic shock. Critical
Care, 15(3), R131.
Popkin, B. (1999). Urbanization, lifestyle changes, and the nutritional transition. World
Development, 27(1), 1905-1916.
86
Popkin, B. (2002). Part II. What is unique about the experience in lower-and middle-income less-
industrialised countries compared with the very-highincome industrialised countries?
Public Health Nutrition, 5(1a), 205-214. doi: doi:10.1079/PHN2001295
Popkin, B., Adair, L. S., & Ng, S. W. (2012). Global nutrition transition and the pandemic of
obesity in developing countries. Nutrition Reviews, 70(1), 3-21. doi: 10.1111/j.1753-
4887.2011.00456.x
Prinsloo, J., Malan, L., de Ridder, J. H., Potgieter, J. C., & Steyn, H. S. (2011). Determining the
Waist Circumference Cut off which Best Predicts the Metabolic Syndrome components
in urban Africans: The SABPA study. Exp Clin Endocrinol Diabetes, 119(10), 599,603.
doi: 10.1055/s-0031-1280801
Prokopenko, I., McCarthy, M. I., & Lindgren, C. M. (2008). Type 2 diabetes: new genes, new
understanding. Trends in Genetics, 24(12), 613-621. doi: 10.1016/j.tig.2008.09.004
Renzaho, A., M. N. (2004). Fat, rich and beautiful: changing socio-cultural paradigms associated
with obesity risk, nutritional status and refugee children from sub-Saharan Africa. Health
and Place, 10, 105-113. doi: 10.1016/S1353-8292(03)00051-0
Roglic, G., & Unwin, N. (2010). Mortality attributable to diabetes: Estimates for the year 2010.
Diabetes Research and Clinical Practice, 87(1), 15-19. doi:
10.1016/j.diabres.2009.10.006
Schulze, M. B., Heidemann, C., Schienkiewitz, A., Bergmann, M. M., Hoffmann, K., & Boeing,
H. (2006). Comparison of Anthropometric Characteristics in Predicting the Incidence of
Type 2 Diabetes in the EPIC-Potsdam Study. Diabetes Care, 29(8), 1921-1923. doi:
10.2337/dc06-0895
Selembo, G. (2009). [Obesity in Sakila Village].
87
Seto, K. C., Fragkias, M., Güneralp, B., & Reilly, M. K. (2011). A Meta-Analysis of Global
Urban Land Expansion. PLoS ONE, 6(8), e23777. doi: 10.1371/journal.pone.0023777
Silva-Matos, C., Gomes, A., Azevedo, A., Damasceno, A., Prista, A., & Lunet, N. (2011).
Diabetes in Mozambique: Prevalence, management and healthcare challenges. Diabetes
& Metabolism, 37(3), 237-244. doi: 10.1016/j.diabet.2010.10.006
Sluik, D., Boeing, H., Montonen, J., Pischon, T., Kaaks, R., Teucher, B., . . . Nöthlings, U.
(2011). Associations Between General and Abdominal Adiposity and Mortality in
Individuals With Diabetes Mellitus. American Journal of Epidemiology, 174(1), 22-34.
doi: 10.1093/aje/kwr048
Sobngwi, E., Mauvais-Jarvis, F., Vexiau, P., Mbanya, J. C., & Gautier, J.-F. (2002). Diabetes in
Africans. Part 2: Ketosis-prone atypical diabetes mellitus. Diabetes & Metabolism, 28(1),
5-12.
Sobngwi, E., Mbanya, J.-C., Unwin, N. C., Porcher, R., Kengne, A.-P., Fezeu, L., . . . Alberti, K.
G. (2004). Exposure over the life course to an urban environment and its relation with
obesity, diabetes, and hypertension in rural and urban Cameroon. International Journal of
Epidemiology, 33(4), 769-776. doi: 10.1093/ije/dyh044
Sobngwi, E., Mbanya, J. C., Unwin, N., Kengne, A.-P., fezeu, L., Minkoulou, E., . . . Alberti, K.
G. (2002). Physical activity and its relationship with obesity, hypertension and diabetes in
urban and rural Cameroon. International Journal of Obesity, 26(7), 1009-1016.
Sobngwi, E., Ndour-Mbaye, M., Boateng, K. A., Ramaiya, K. L., Njenga, E. W., Diop, S. N., . . .
Ohwovoriole, A. E. (2012). Type 2 diabetes control and complications in specialised
diabetes care centres of six sub-Saharan African countries: The Diabcare Africa study.
88
Diabetes Research and Clinical Practice, 95(1), 30-36. doi:
10.1016/j.diabres.2011.10.018
Solet, J. L., Baroux, N., Pochet, M., Benoit-Cattin, T., De Montera, A. M., Sissoko, D., . . .
Fagot-Campagna, A. (2011). Prevalence of type 2 diabetes and other cardiovascular risk
factors in Mayotte in 2008: The MAYDIA study. Diabetes & Metabolism, 37(3),
201-207. doi: 10.1016/j.diabet.2010.09.007
Stitzel, M., Sethupathy, P., Pearson, D., Chines, P. S., Song, L., Erdos, M. R., . . . Collins, F. S.
(2010). Global Epigenomic Analysis of Primary Human Pancreatic Islets Provides
Insights into Type 2 Diabetes Susceptibility Loci. Cell Metabolism, 12(5), 443-455.
Subramanian, S., Perkins, J. M., Özaltin, E., & Davey Smith, G. (2011). Weight of nations: a
socioeconomic analysis of women in low- to middle-income countries. The American
Journal of Clinical Nutrition, 93(2), 413-421. doi: 10.3945/ajcn.110.004820
Swai, A. B. M., Kitange, H. M., Masuki, G., Kilima, P. M., Alberti, K. G., & McLarty, D. G.
(1992). Is diabetes mellitus related to undernutrition in rural Tanzania? British Medical
Journal, 305(6861), 1057-1062.
Swai, A. B. M., Lutale, J., & McLarty, D. G. (1990). Diabetes in tropical Africa: a prospective
study, 1981-7. Characteristics of newly presenting patients in Dar es Salaam, Tanzania,
1981-7. BMJ: British Medical Journal, 300(6732), 1103-1106.
Tesfaye, S., & Gill, G. (2011). Chronic diabetic complications in Africa. African Journal of
Diabetes Medicine, 19(1), 4-8.
The World Bank. (2011). 2011 World Development Indicators
Travers, M., & McCarthy, M. (2011). Type 2 diabetes and obesity: genomics and the clinic.
Human Genetics, 130(1), 41-58. doi: 10.1007/s00439-011-1023-8
89
United Nations. (2007). World Urbanization Prospects: The 2007 revision population database
Retrieved March 18, 2012, from http://esa.un.org/unup,
United Nations. (2010). World Population Prospects, the 2010 revision. In P. D. o. t. U. n. D. o.
E. a. S. Affairs (Ed.). New York.
Unwin, N., James, P., McLarty, D., Machybia, H., Nkulila, P., Tamin, B., . . . McNally, R.
(2010). Rural to urban migration and changes in cardiovascular risk factors in Tanzania: a
prospective cohort study. BMC Public Health, 10(1), 272.
Van Der Sande, M. A. B., Bailey, R., Faal, H., Banya, W. A. S., Dolin, P., Nyan, O. A., . . .
McAdam, K. P. W. J. (1997). Nationwide prevalence study of hypertension and related
non-communicable diseases in The Gambia. Tropical Medicine & International Health,
2(11), 1039-1048. doi: 10.1046/j.1365-3156.1997.d01-184.x
Viswanathan, V., Wadud, J. R., Madhavan, S., Rajasekar, S., Kumpatla, S., Lutale, J. K., &
Abbas, Z. G. (2010). Comparison of post amputation outcome in patients with type 2
diabetes from specialized foot care centres in three developing countries. Diabetes
Research and Clinical Practice, 88(2), 146-150.
Wamala, S., Merlo, J., & Bostrom, G. (2006). Inequity in access to dental care services explains
current socioeconomic disparities in oral health: the Swedish national Surveys of Public
health 2004-2005. J Epidemiol Community Health, 60, 1027 - 1033.
Weatherall, D. J. (2012). The definition and epidemiology of non-transfusion-dependent
thalassemia. Blood Reviews, 26, Supplement 1(0), S3-S6. doi:
http://dx.doi.org/10.1016/S0268-960X(12)70003-6
Weed, D. L. (2001). Theory and Practice in Epidemiology. Annals of the New York Academy of
Sciences, 954(1), 52-62. doi: 10.1111/j.1749-6632.2001.tb02746.x
90
Welch Allyn. (2001). Service Manual: Aneroid Sphygmomanometers (Vol. Service Manual
95P504Rev. D).
Whiting, D. R., Guariguata, L., Weil, C., & Shaw, J. (2011). IDF Diabetes Atlas: Global
estimates of the prevalence of diabetes for 2011 and 2030. Diabetes Research and
Clinical Practice, 94(3), 311-321. doi: 10.1016/j.diabres.2011.10.029
WHO. (2000). Obesity: Preventing and managing the global epidemic. Report of a WHO
consultation (Vol. WHO Technical Report Series 894,). Geneva: World Health
Organziation.
WHO. (2003). Screening for Type 2 Diabetes: Report of the World Health Organization and the
International Diabetes Federation. In Department of Noncommunicable Disease
Management (Ed.): World Health Organization.
WHO. (2011). Use of Glycated Haemoglobin (HbA1c) in the diagnosis of diabetes mellitus.
Geneva: World Health Organization.
Whole Village Project. (2011). Village reports for Leguruki, Kingori, Malula, Samaria and Njoro
in AruMeru District: University of Minnesota.
Wild, S., Roglic, G., Green, A., Sicree, R., & King, H. (2004). Global Prevalence of Diabetes:
Estimates for the year 2000 and projections for 2030. Diabtes Care, 27(5), 1047-1053.
World Diabetes Foundation. (2008). Diabetes Clinics in Tanzania Retrieved February 2, 2012,
from http://www.worlddiabetesfoundation.org/composite-127.htm
World Health Organization. (2008). Waist circumference and waist–hip ratio: report of a WHO
expert consultation (pp. 1-47). Geneva.
91
Yancey, A. K., Ortega, A. N., & Kumanyika, S. K. (2006). Effective recruitement and retention
of minority research particpants. . Annual Review of Public Health, 27(1), 1-28. doi:
doi:10.1146/annurev.publhealth.27.021405.102113
Zhang, P., Zhang, X., Brown, J., Vistisen, D., Sicree, R., Shaw, J., & Nichols, G. (2010). Global
healthcare expenditure on diabetes for 2010 and 2030. Diabetes Research and Clinical
Practice, 87(3), 293-301. doi: 10.1016/j.diabres.2010.01.026
Zimmet, P. (2000). Globalization, coca-colonization and the chronic disease epidemic: can the
Doomsday scenario be averted? Journal of Internal Medicine, 247(3), 301-310. doi:
10.1046/j.1365-2796.2000.00625.x
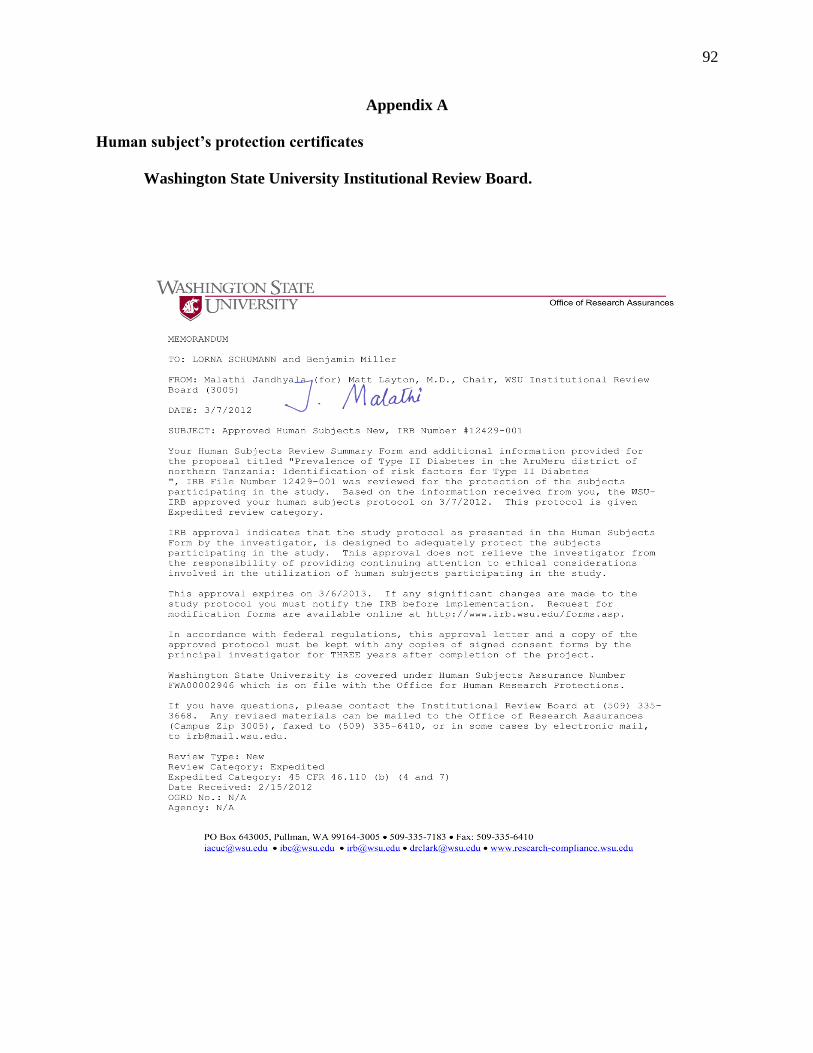
92
Appendix A
Human subject’s protection certificates
Washington State University Institutional Review Board.
93
National Institute for Medical Research, Ethical Clearance Certificate.
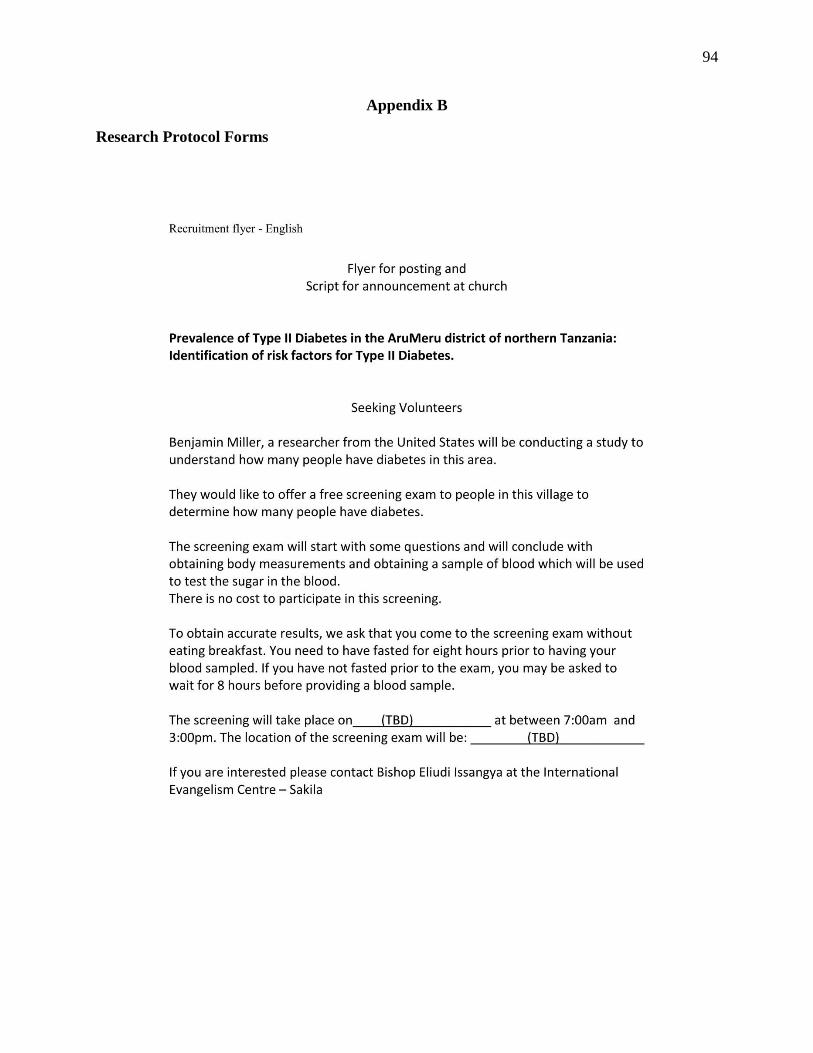
94
Appendix B
Research Protocol Forms
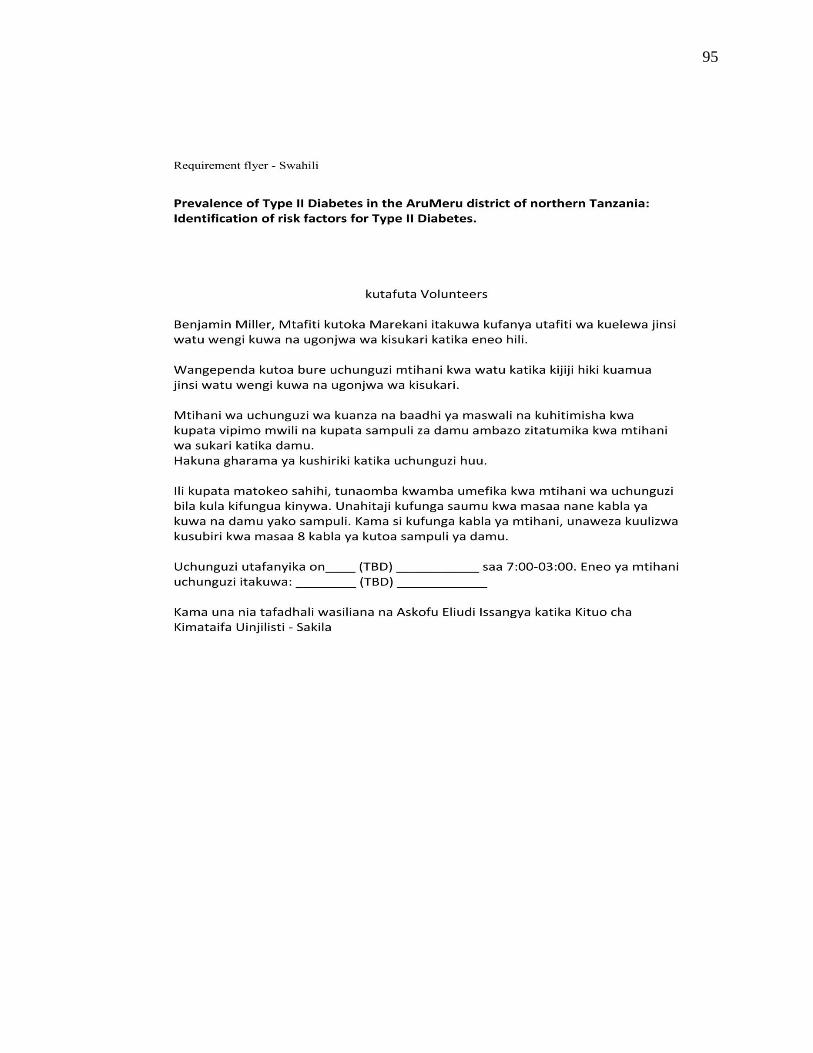
95
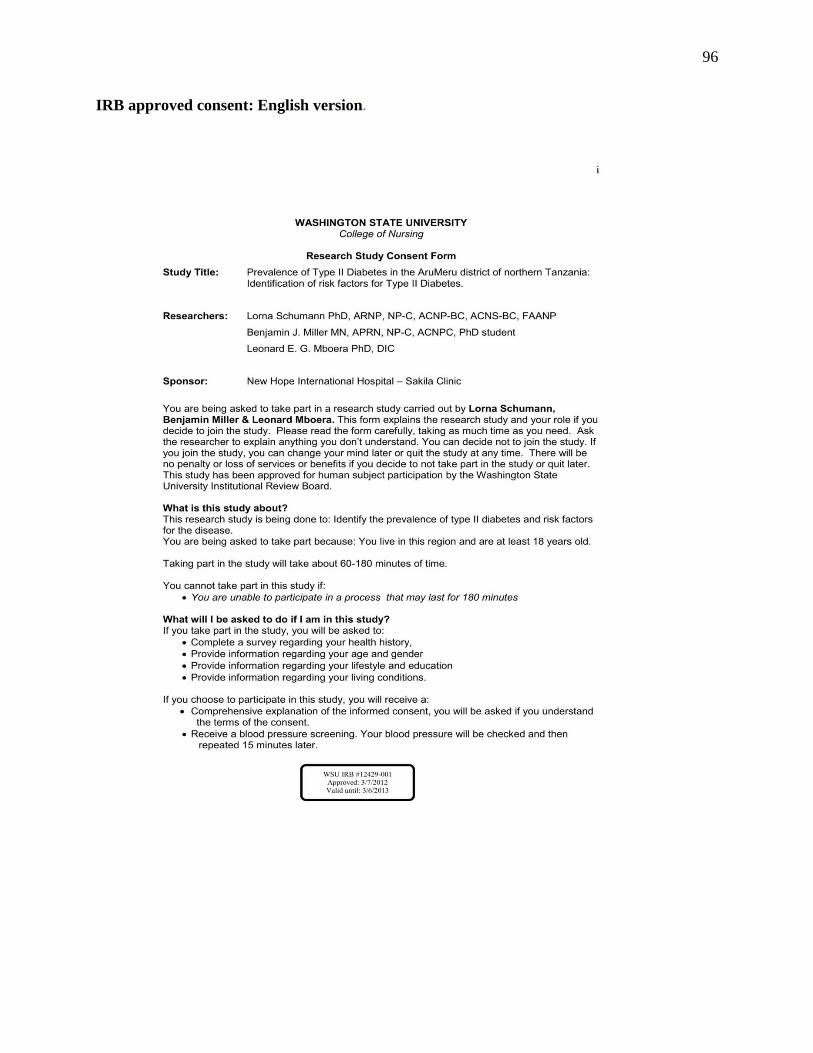
96
IRB approved consent: English version.
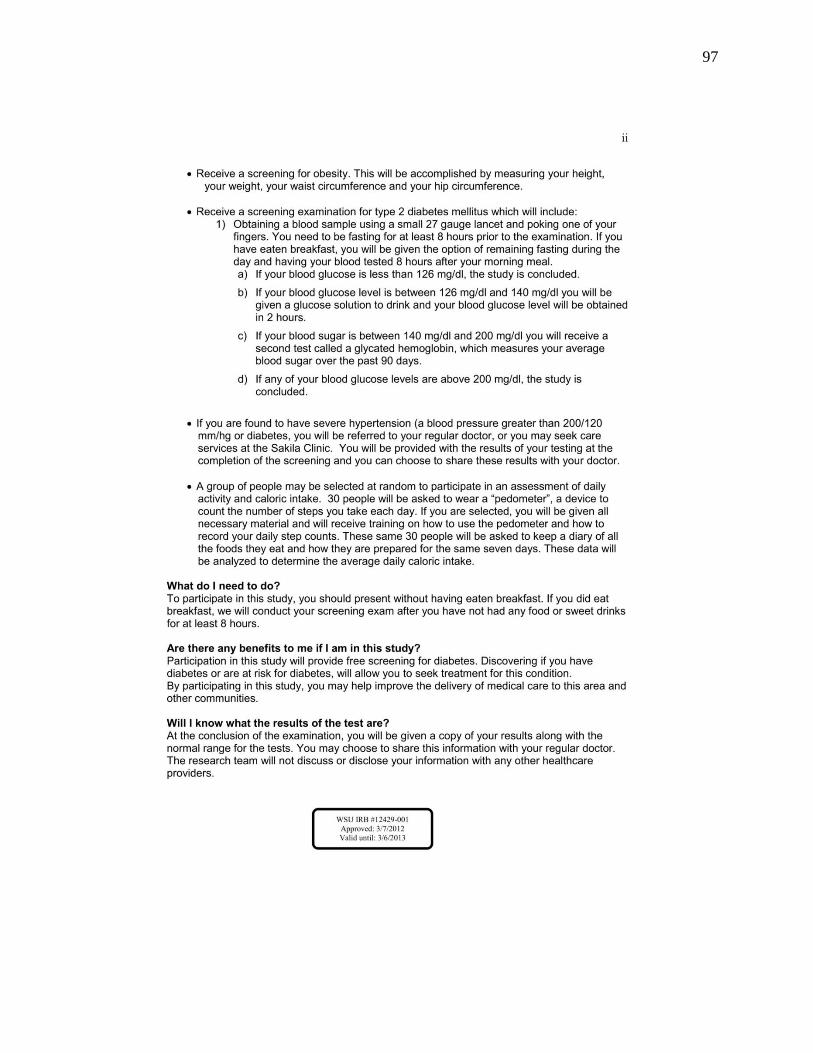
97
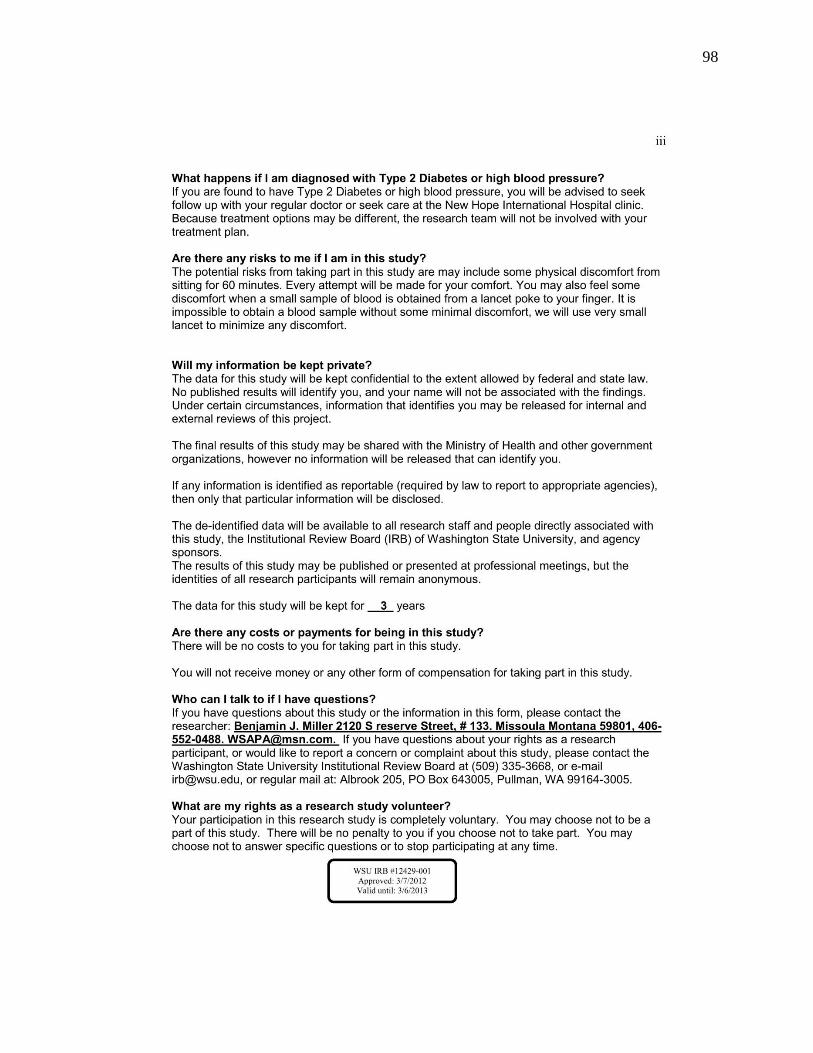
98
99
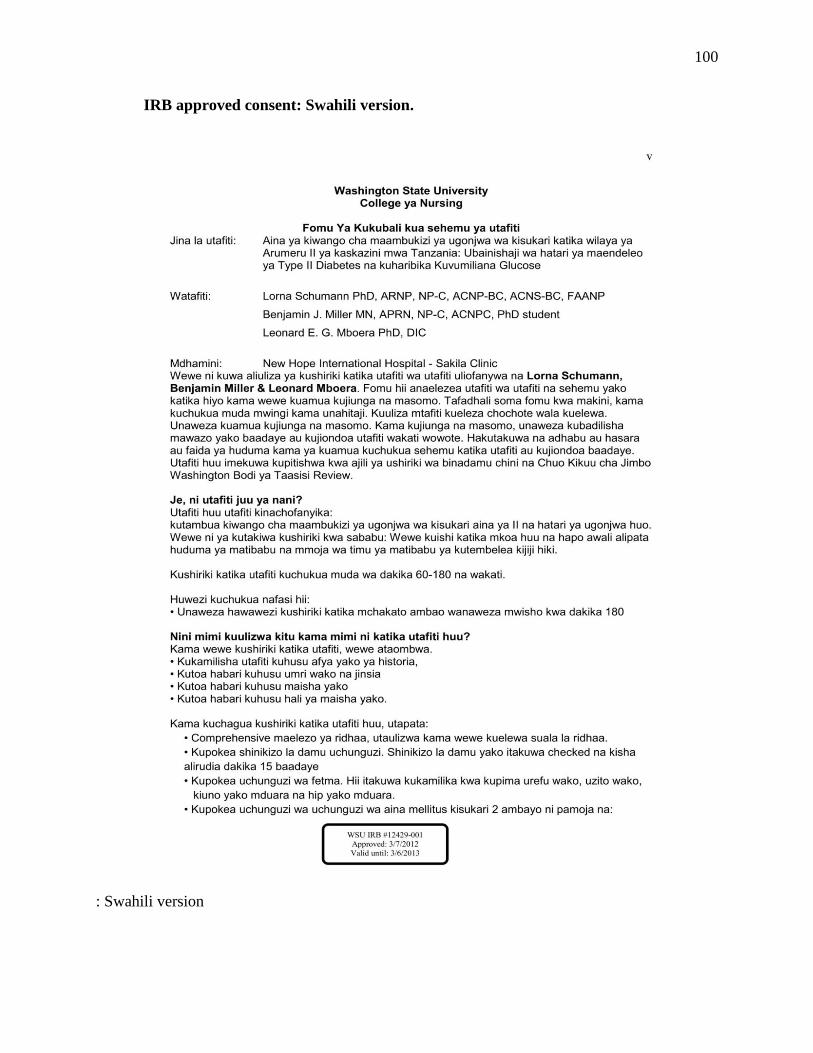
100
IRB approved consent: Swahili version.
: Swahili version
101
102
103
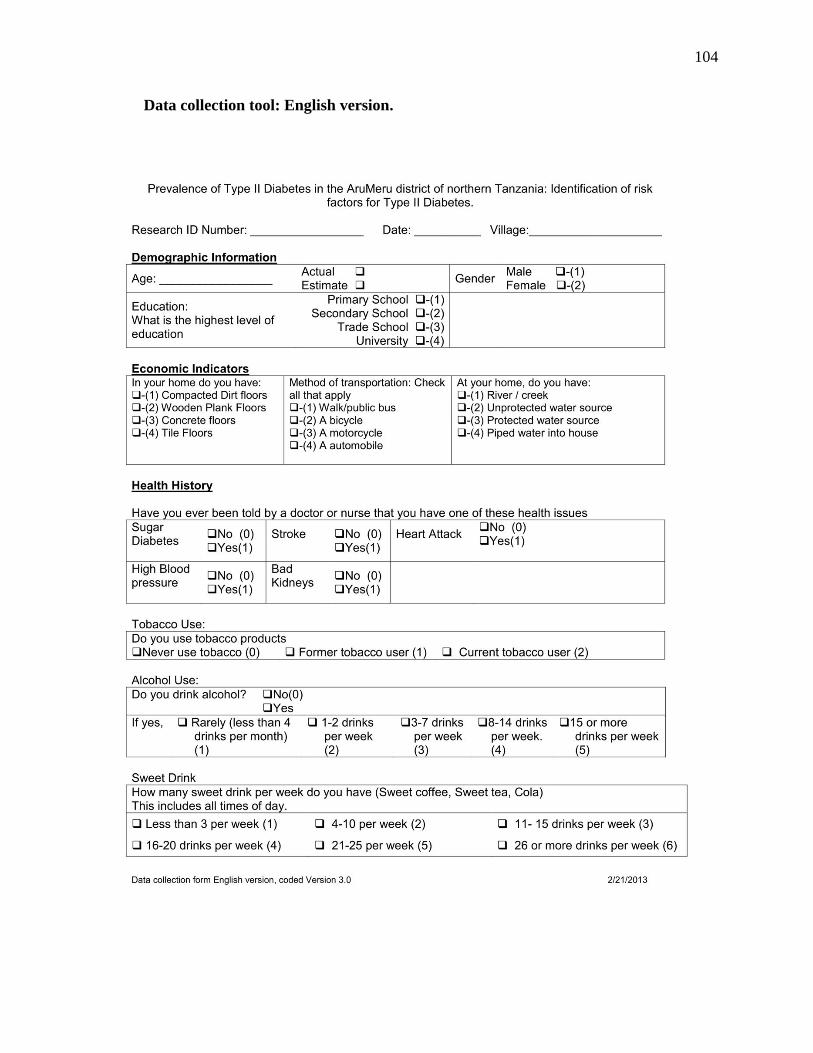
104
Data collection tool: English version.
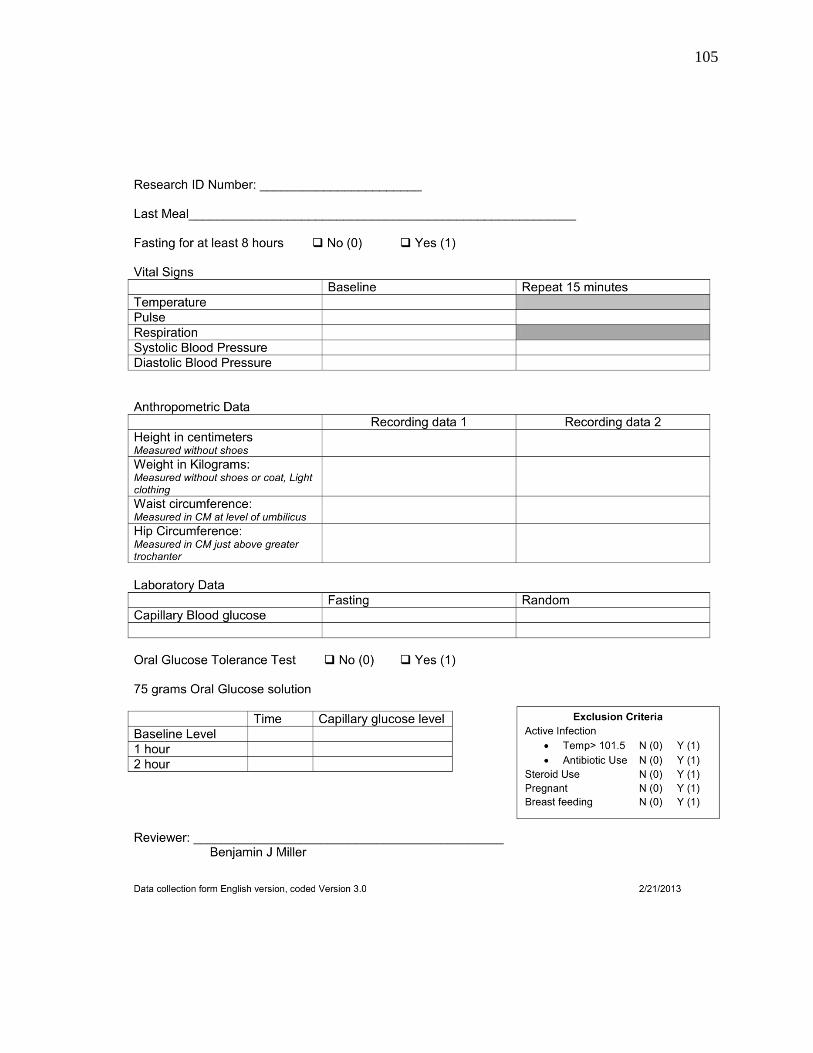
105
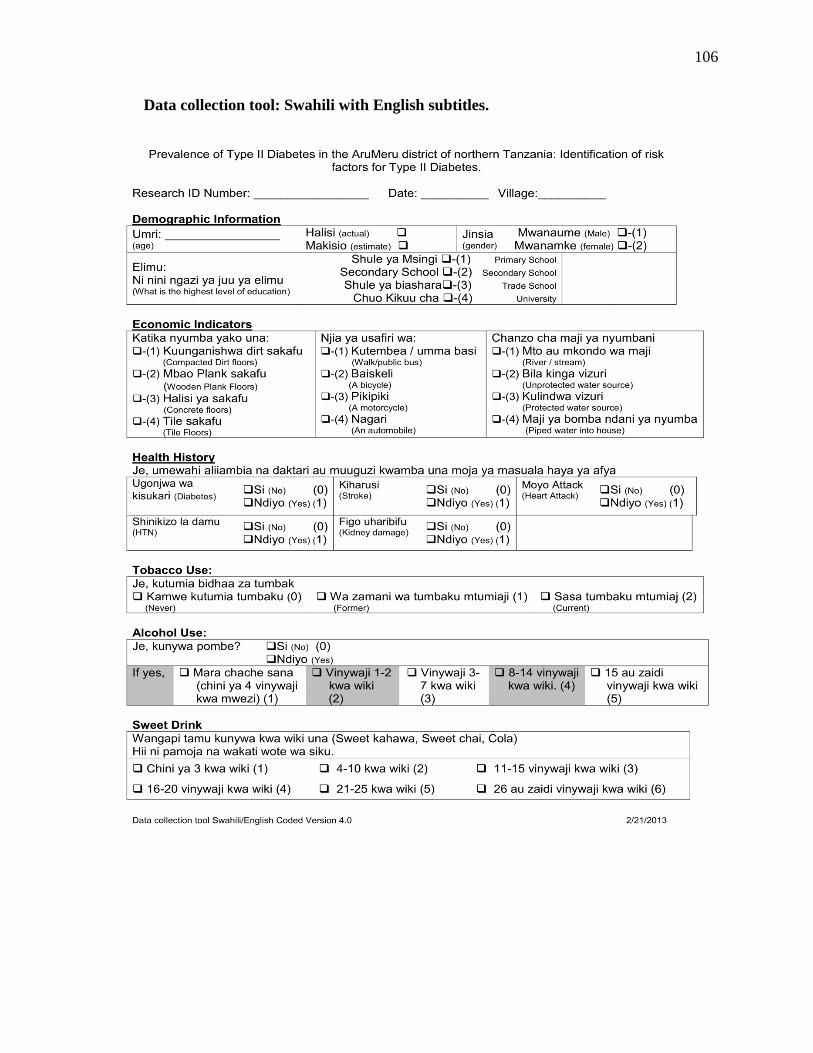
106
Data collection tool: Swahili with English subtitles.
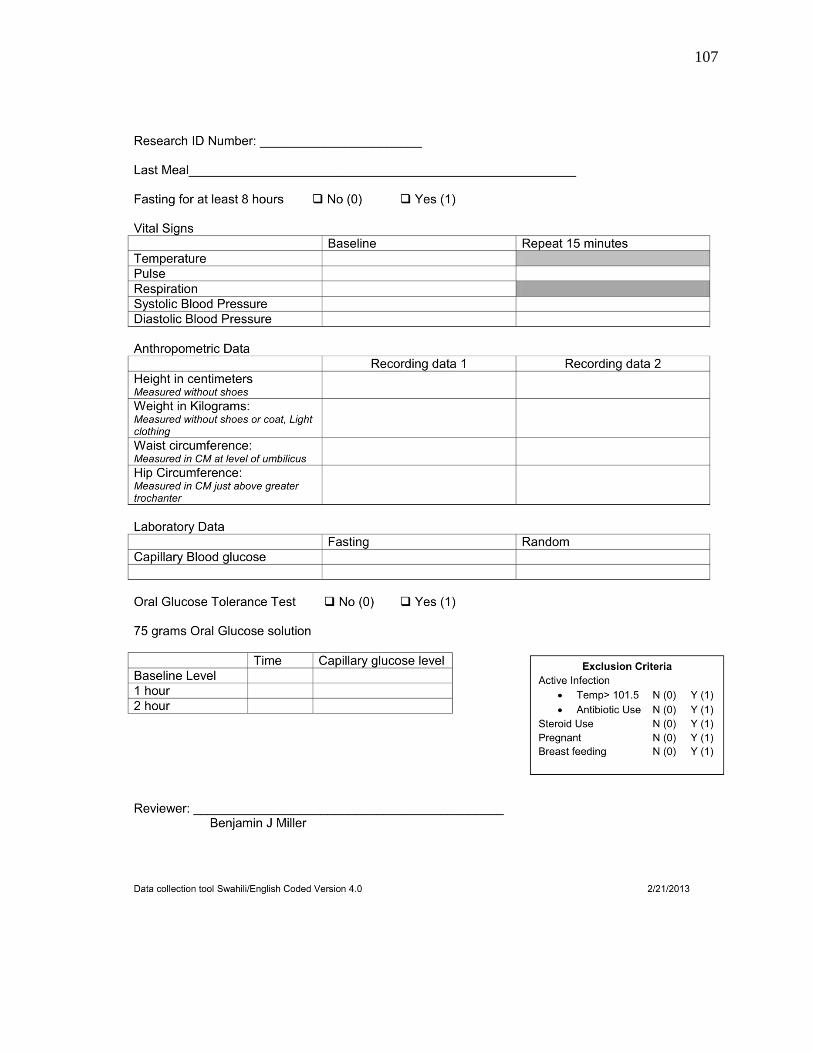
107
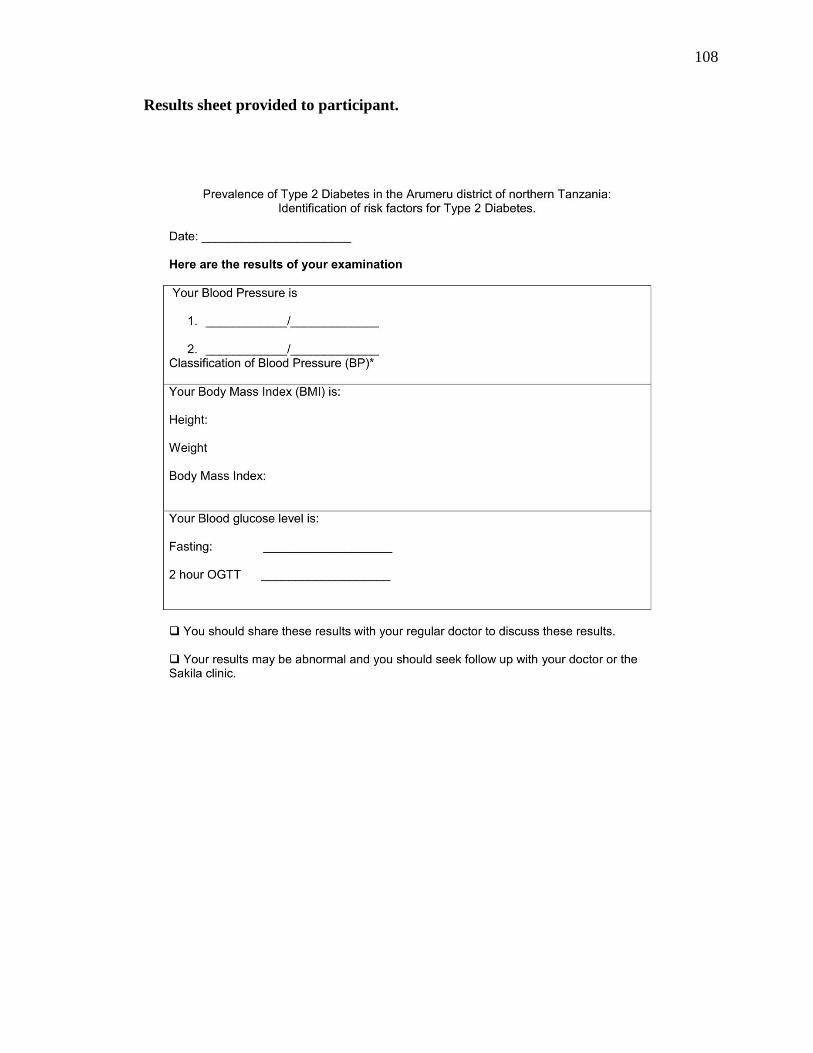
108
Results sheet provided to participant.
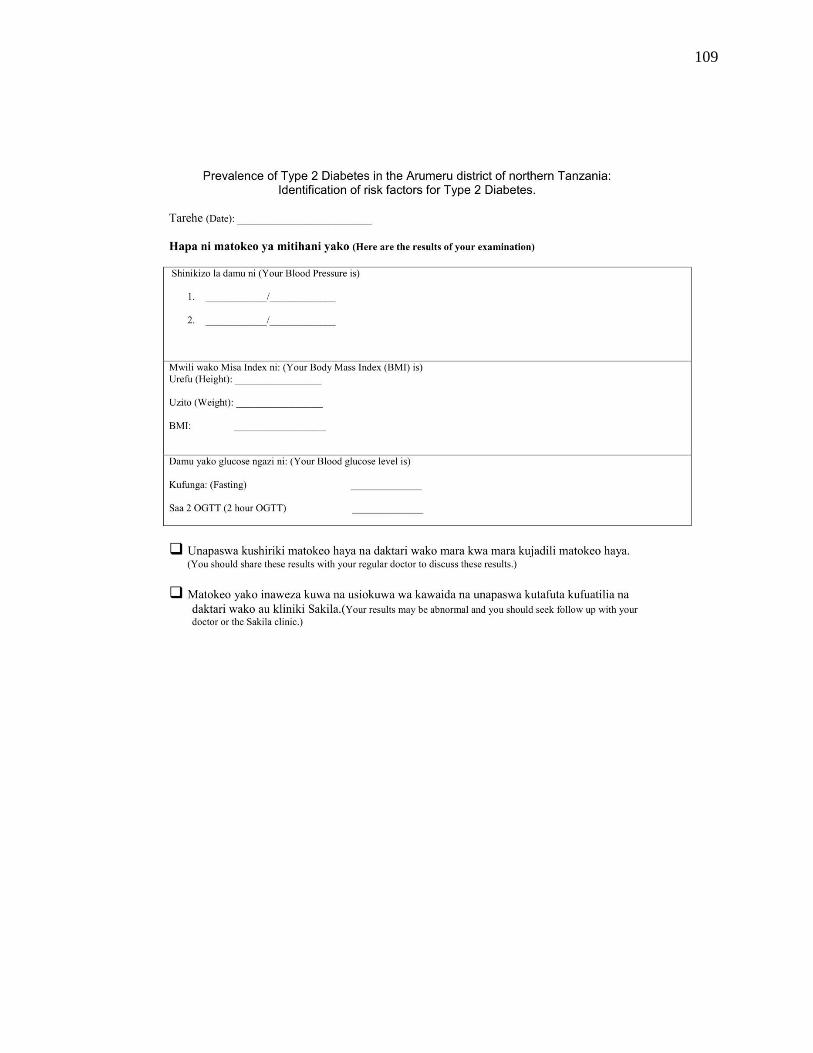
109
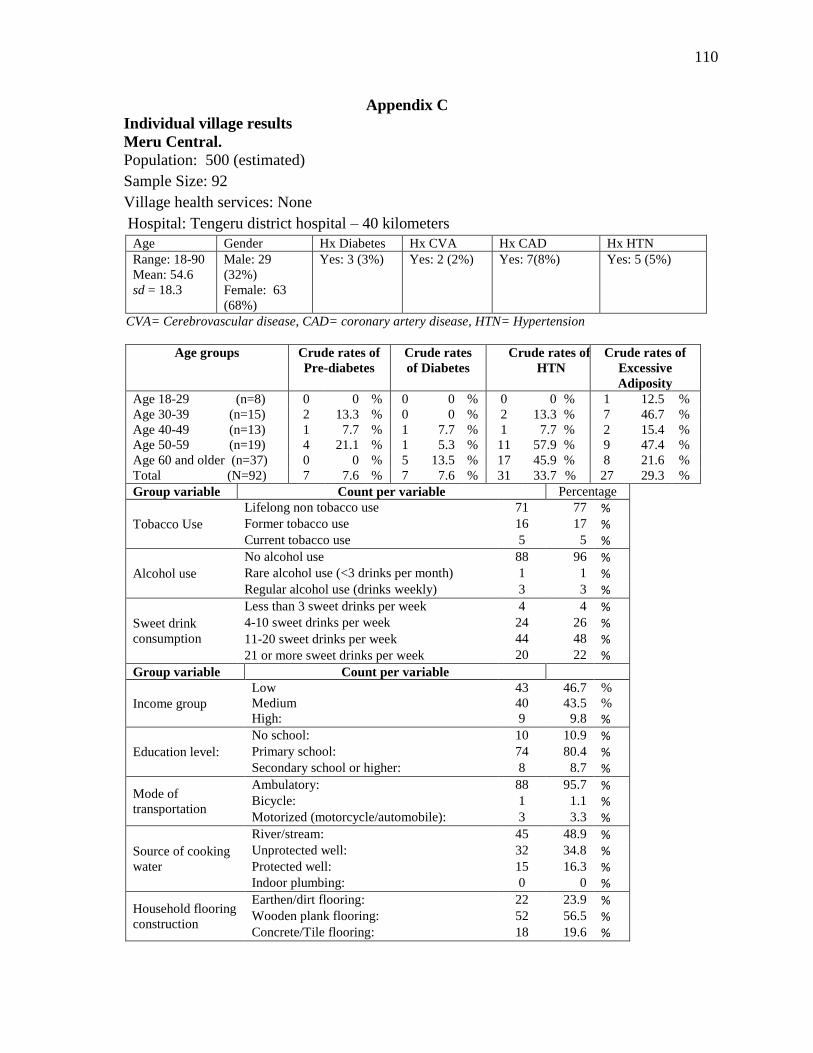
110
Appendix C
Individual village results
Meru Central.
Population: 500 (estimated)
Sample Size: 92
Village health services: None
Hospital: Tengeru district hospital – 40 kilometers
Age Gender Hx Diabetes Hx CVA Hx CAD Hx HTN
Range: 18-90
Mean: 54.6
sd = 18.3
Male: 29
(32%)
Female: 63
(68%)
Yes: 3 (3%) Yes: 2 (2%) Yes: 7(8%) Yes: 5 (5%)
CVA= Cerebrovascular disease, CAD= coronary artery disease, HTN= Hypertension
Age groups Crude rates of
Pre-diabetes
Crude rates
of Diabetes
Crude rates of
HTN
Crude rates of
Excessive
Adiposity
Age 18-29 (n=8) 0 0 % 0 0 % 0 0 % 1 12.5 %
Age 30-39 (n=15) 2 13.3 % 0 0 % 2 13.3 % 7 46.7 %
Age 40-49 (n=13) 1 7.7 % 1 7.7 % 1 7.7 % 2 15.4 %
Age 50-59 (n=19) 4 21.1 % 1 5.3 % 11 57.9 % 9 47.4 %
Age 60 and older (n=37) 0 0 % 5 13.5 % 17 45.9 % 8 21.6 %
Total (N=92) 7 7.6 % 7 7.6 % 31 33.7 % 27 29.3 %
Group variable Count per variable Percentage
Tobacco Use
Lifelong non tobacco use 71 77 % Former tobacco use 16 17 % Current tobacco use 5 5 %
Alcohol use
No alcohol use 88 96 % Rare alcohol use (<3 drinks per month) 1 1 % Regular alcohol use (drinks weekly) 3 3 %
Sweet drink
consumption
Less than 3 sweet drinks per week 4 4 % 4-10 sweet drinks per week 24 26 % 11-20 sweet drinks per week 44 48 % 21 or more sweet drinks per week 20 22 %
Group variable Count per variable
Income group
Low 43 46.7 %
Medium 40 43.5 %
High: 9 9.8 %
Education level:
No school: 10 10.9 % Primary school: 74 80.4 % Secondary school or higher: 8 8.7 %
Mode of
transportation
Ambulatory: 88 95.7 % Bicycle: 1 1.1 % Motorized (motorcycle/automobile): 3 3.3 %
Source of cooking
water
River/stream: 45 48.9 % Unprotected well: 32 34.8 % Protected well: 15 16.3 % Indoor plumbing: 0 0 %
Household flooring
construction
Earthen/dirt flooring: 22 23.9 % Wooden plank flooring: 52 56.5 % Concrete/Tile flooring: 18 19.6 %
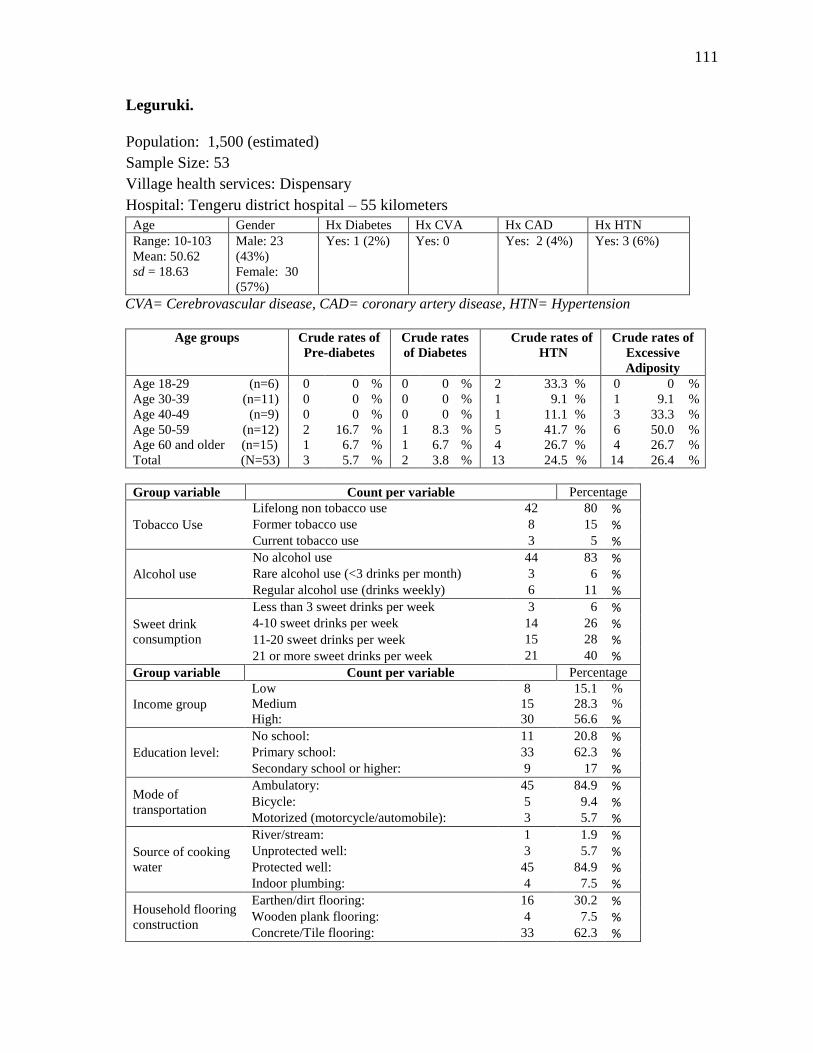
111
Leguruki.
Population: 1,500 (estimated)
Sample Size: 53
Village health services: Dispensary
Hospital: Tengeru district hospital – 55 kilometers
Age Gender Hx Diabetes Hx CVA Hx CAD Hx HTN
Range: 10-103
Mean: 50.62
sd = 18.63
Male: 23
(43%)
Female: 30
(57%)
Yes: 1 (2%) Yes: 0 Yes: 2 (4%) Yes: 3 (6%)
CVA= Cerebrovascular disease, CAD= coronary artery disease, HTN= Hypertension
Age groups Crude rates of
Pre-diabetes
Crude rates
of Diabetes
Crude rates of
HTN
Crude rates of
Excessive
Adiposity
Age 18-29 (n=6) 0 0 % 0 0 % 2 33.3 % 0 0 %
Age 30-39 (n=11) 0 0 % 0 0 % 1 9.1 % 1 9.1 %
Age 40-49 (n=9) 0 0 % 0 0 % 1 11.1 % 3 33.3 %
Age 50-59 (n=12) 2 16.7 % 1 8.3 % 5 41.7 % 6 50.0 %
Age 60 and older (n=15) 1 6.7 % 1 6.7 % 4 26.7 % 4 26.7 %
Total (N=53) 3 5.7 % 2 3.8 % 13 24.5 % 14 26.4 %
Group variable Count per variable Percentage
Tobacco Use
Lifelong non tobacco use 42 80 % Former tobacco use 8 15 % Current tobacco use 3 5 %
Alcohol use
No alcohol use 44 83 % Rare alcohol use (<3 drinks per month) 3 6 % Regular alcohol use (drinks weekly) 6 11 %
Sweet drink
consumption
Less than 3 sweet drinks per week 3 6 % 4-10 sweet drinks per week 14 26 % 11-20 sweet drinks per week 15 28 % 21 or more sweet drinks per week 21 40 %
Group variable Count per variable Percentage
Income group
Low 8 15.1 %
Medium 15 28.3 %
High: 30 56.6 %
Education level:
No school: 11 20.8 % Primary school: 33 62.3 % Secondary school or higher: 9 17 %
Mode of
transportation
Ambulatory: 45 84.9 % Bicycle: 5 9.4 % Motorized (motorcycle/automobile): 3 5.7 %
Source of cooking
water
River/stream: 1 1.9 % Unprotected well: 3 5.7 % Protected well: 45 84.9 % Indoor plumbing: 4 7.5 %
Household flooring
construction
Earthen/dirt flooring: 16 30.2 % Wooden plank flooring: 4 7.5 % Concrete/Tile flooring: 33 62.3 %
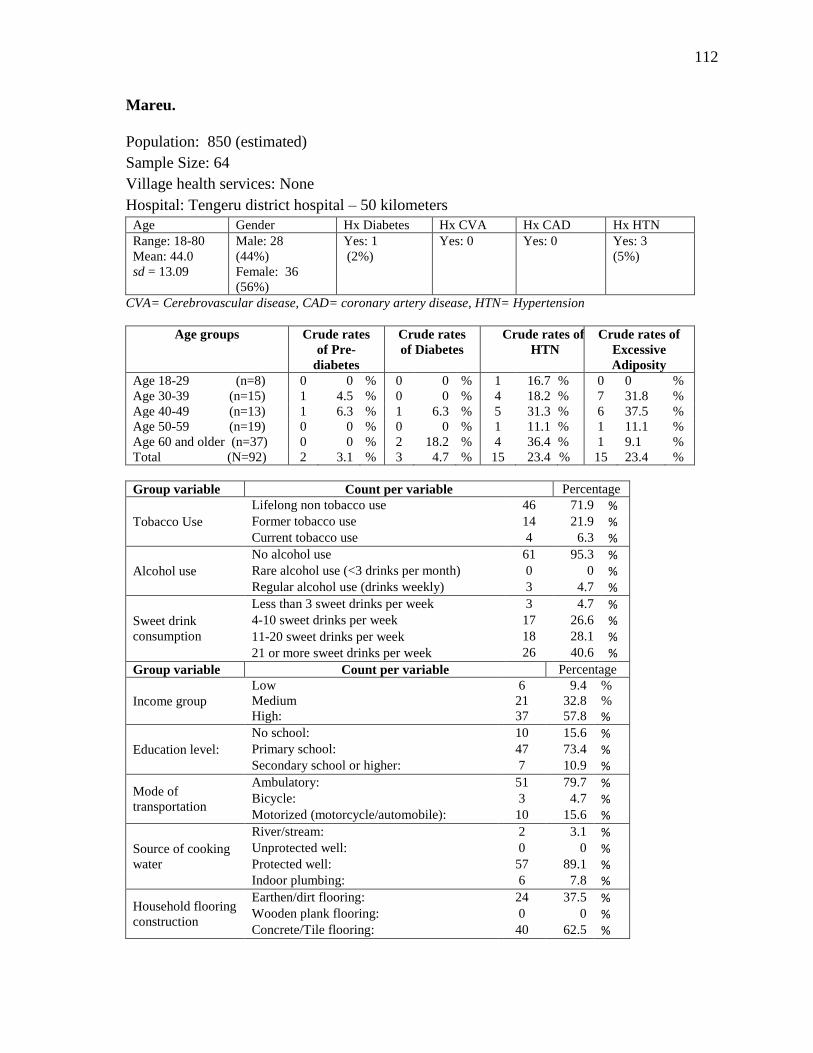
112
Mareu.
Population: 850 (estimated)
Sample Size: 64
Village health services: None
Hospital: Tengeru district hospital – 50 kilometers
Age Gender Hx Diabetes Hx CVA Hx CAD Hx HTN
Range: 18-80
Mean: 44.0
sd = 13.09
Male: 28
(44%)
Female: 36
(56%)
Yes: 1
(2%)
Yes: 0 Yes: 0 Yes: 3
(5%)
CVA= Cerebrovascular disease, CAD= coronary artery disease, HTN= Hypertension
Age groups Crude rates
of Pre-
diabetes
Crude rates
of Diabetes
Crude rates of
HTN
Crude rates of
Excessive
Adiposity
Age 18-29 (n=8) 0 0 % 0 0 % 1 16.7 % 0 0 %
Age 30-39 (n=15) 1 4.5 % 0 0 % 4 18.2 % 7 31.8 %
Age 40-49 (n=13) 1 6.3 % 1 6.3 % 5 31.3 % 6 37.5 %
Age 50-59 (n=19) 0 0 % 0 0 % 1 11.1 % 1 11.1 %
Age 60 and older (n=37) 0 0 % 2 18.2 % 4 36.4 % 1 9.1 %
Total (N=92) 2 3.1 % 3 4.7 % 15 23.4 % 15 23.4 %
Group variable Count per variable Percentage
Tobacco Use
Lifelong non tobacco use 46 71.9 % Former tobacco use 14 21.9 % Current tobacco use 4 6.3 %
Alcohol use
No alcohol use 61 95.3 % Rare alcohol use (<3 drinks per month) 0 0 % Regular alcohol use (drinks weekly) 3 4.7 %
Sweet drink
consumption
Less than 3 sweet drinks per week 3 4.7 % 4-10 sweet drinks per week 17 26.6 % 11-20 sweet drinks per week 18 28.1 % 21 or more sweet drinks per week 26 40.6 %
Group variable Count per variable Percentage
Income group
Low 6 9.4 %
Medium 21 32.8 %
High: 37 57.8 %
Education level:
No school: 10 15.6 % Primary school: 47 73.4 % Secondary school or higher: 7 10.9 %
Mode of
transportation
Ambulatory: 51 79.7 % Bicycle: 3 4.7 % Motorized (motorcycle/automobile): 10 15.6 %
Source of cooking
water
River/stream: 2 3.1 % Unprotected well: 0 0 % Protected well: 57 89.1 % Indoor plumbing: 6 7.8 %
Household flooring
construction
Earthen/dirt flooring: 24 37.5 % Wooden plank flooring: 0 0 % Concrete/Tile flooring: 40 62.5 %
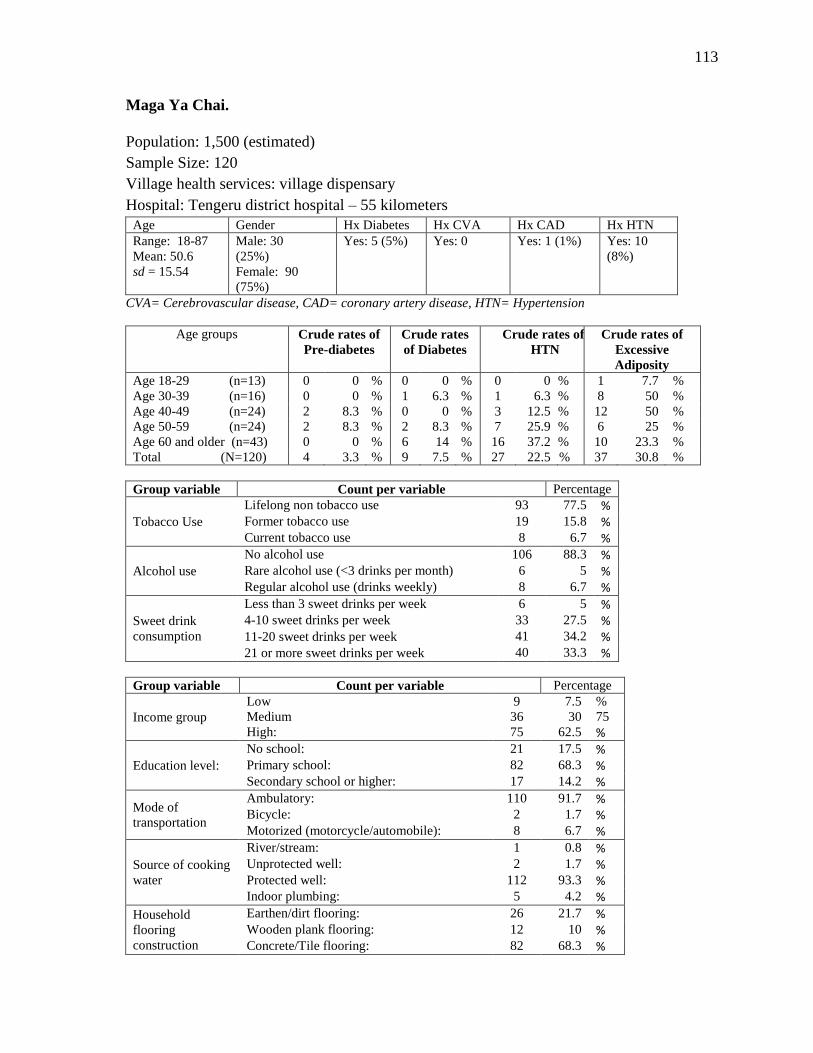
113
Maga Ya Chai.
Population: 1,500 (estimated)
Sample Size: 120
Village health services: village dispensary
Hospital: Tengeru district hospital – 55 kilometers
Age Gender Hx Diabetes Hx CVA Hx CAD Hx HTN
Range: 18-87
Mean: 50.6
sd = 15.54
Male: 30
(25%)
Female: 90
(75%)
Yes: 5 (5%) Yes: 0 Yes: 1 (1%) Yes: 10
(8%)
CVA= Cerebrovascular disease, CAD= coronary artery disease, HTN= Hypertension
Age groups Crude rates of
Pre-diabetes
Crude rates
of Diabetes
Crude rates of
HTN
Crude rates of
Excessive
Adiposity
Age 18-29 (n=13) 0 0 % 0 0 % 0 0 % 1 7.7 %
Age 30-39 (n=16) 0 0 % 1 6.3 % 1 6.3 % 8 50 %
Age 40-49 (n=24) 2 8.3 % 0 0 % 3 12.5 % 12 50 %
Age 50-59 (n=24) 2 8.3 % 2 8.3 % 7 25.9 % 6 25 %
Age 60 and older (n=43) 0 0 % 6 14 % 16 37.2 % 10 23.3 %
Total (N=120) 4 3.3 % 9 7.5 % 27 22.5 % 37 30.8 %
Group variable Count per variable Percentage
Tobacco Use
Lifelong non tobacco use 93 77.5 % Former tobacco use 19 15.8 % Current tobacco use 8 6.7 %
Alcohol use
No alcohol use 106 88.3 % Rare alcohol use (<3 drinks per month) 6 5 % Regular alcohol use (drinks weekly) 8 6.7 %
Sweet drink
consumption
Less than 3 sweet drinks per week 6 5 % 4-10 sweet drinks per week 33 27.5 % 11-20 sweet drinks per week 41 34.2 % 21 or more sweet drinks per week 40 33.3 %
Group variable Count per variable Percentage
Income group
Low 9 7.5 %
Medium 36 30 75
High: 75 62.5 %
Education level:
No school: 21 17.5 % Primary school: 82 68.3 % Secondary school or higher: 17 14.2 %
Mode of
transportation
Ambulatory: 110 91.7 % Bicycle: 2 1.7 % Motorized (motorcycle/automobile): 8 6.7 %
Source of cooking
water
River/stream: 1 0.8 % Unprotected well: 2 1.7 % Protected well: 112 93.3 % Indoor plumbing: 5 4.2 %
Household
flooring
construction
Earthen/dirt flooring: 26 21.7 % Wooden plank flooring: 12 10 % Concrete/Tile flooring: 82 68.3 %
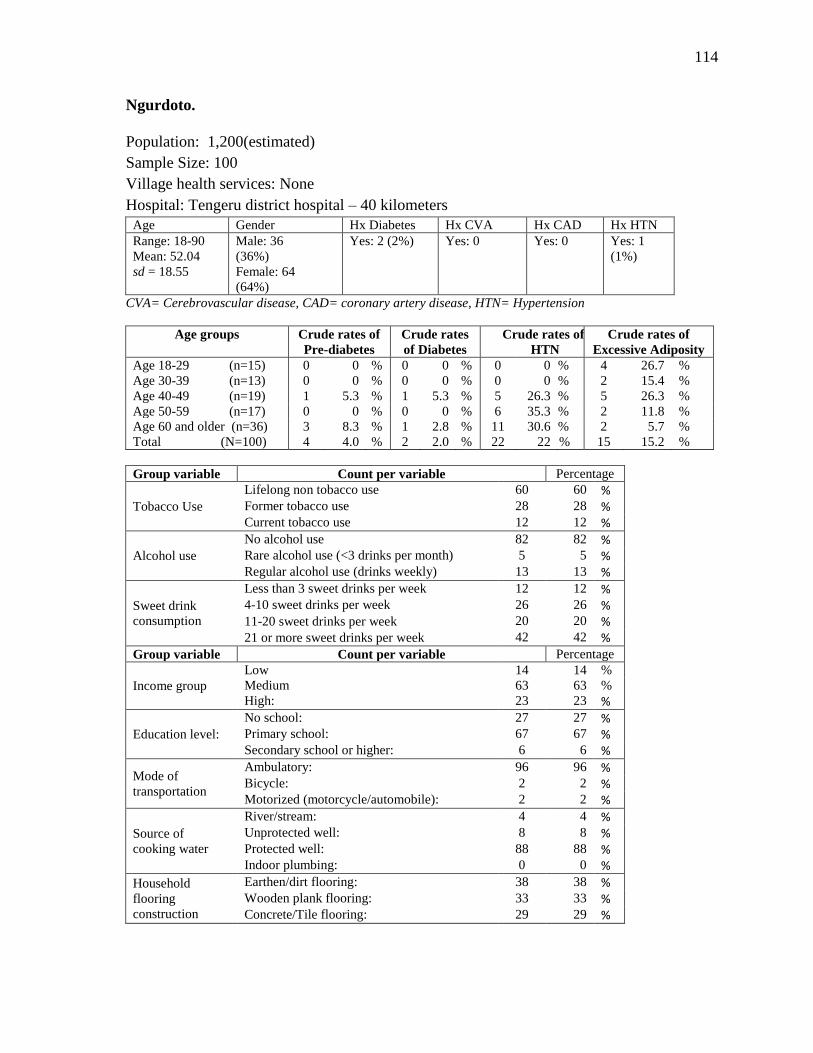
114
Ngurdoto.
Population: 1,200(estimated)
Sample Size: 100
Village health services: None
Hospital: Tengeru district hospital – 40 kilometers
Age Gender Hx Diabetes Hx CVA Hx CAD Hx HTN
Range: 18-90
Mean: 52.04
sd = 18.55
Male: 36
(36%)
Female: 64
(64%)
Yes: 2 (2%) Yes: 0 Yes: 0 Yes: 1
(1%)
CVA= Cerebrovascular disease, CAD= coronary artery disease, HTN= Hypertension
Age groups Crude rates of
Pre-diabetes
Crude rates
of Diabetes
Crude rates of
HTN
Crude rates of
Excessive Adiposity
Age 18-29 (n=15) 0 0 % 0 0 % 0 0 % 4 26.7 %
Age 30-39 (n=13) 0 0 % 0 0 % 0 0 % 2 15.4 %
Age 40-49 (n=19) 1 5.3 % 1 5.3 % 5 26.3 % 5 26.3 %
Age 50-59 (n=17) 0 0 % 0 0 % 6 35.3 % 2 11.8 %
Age 60 and older (n=36) 3 8.3 % 1 2.8 % 11 30.6 % 2 5.7 %
Total (N=100) 4 4.0 % 2 2.0 % 22 22 % 15 15.2 %
Group variable Count per variable Percentage
Tobacco Use
Lifelong non tobacco use 60 60 % Former tobacco use 28 28 % Current tobacco use 12 12 %
Alcohol use
No alcohol use 82 82 % Rare alcohol use (<3 drinks per month) 5 5 % Regular alcohol use (drinks weekly) 13 13 %
Sweet drink
consumption
Less than 3 sweet drinks per week 12 12 % 4-10 sweet drinks per week 26 26 % 11-20 sweet drinks per week 20 20 % 21 or more sweet drinks per week 42 42 %
Group variable Count per variable Percentage
Income group
Low 14 14 %
Medium 63 63 %
High: 23 23 %
Education level:
No school: 27 27 % Primary school: 67 67 % Secondary school or higher: 6 6 %
Mode of
transportation
Ambulatory: 96 96 % Bicycle: 2 2 % Motorized (motorcycle/automobile): 2 2 %
Source of
cooking water
River/stream: 4 4 % Unprotected well: 8 8 % Protected well: 88 88 % Indoor plumbing: 0 0 %
Household
flooring
construction
Earthen/dirt flooring: 38 38 % Wooden plank flooring: 33 33 % Concrete/Tile flooring: 29 29 %
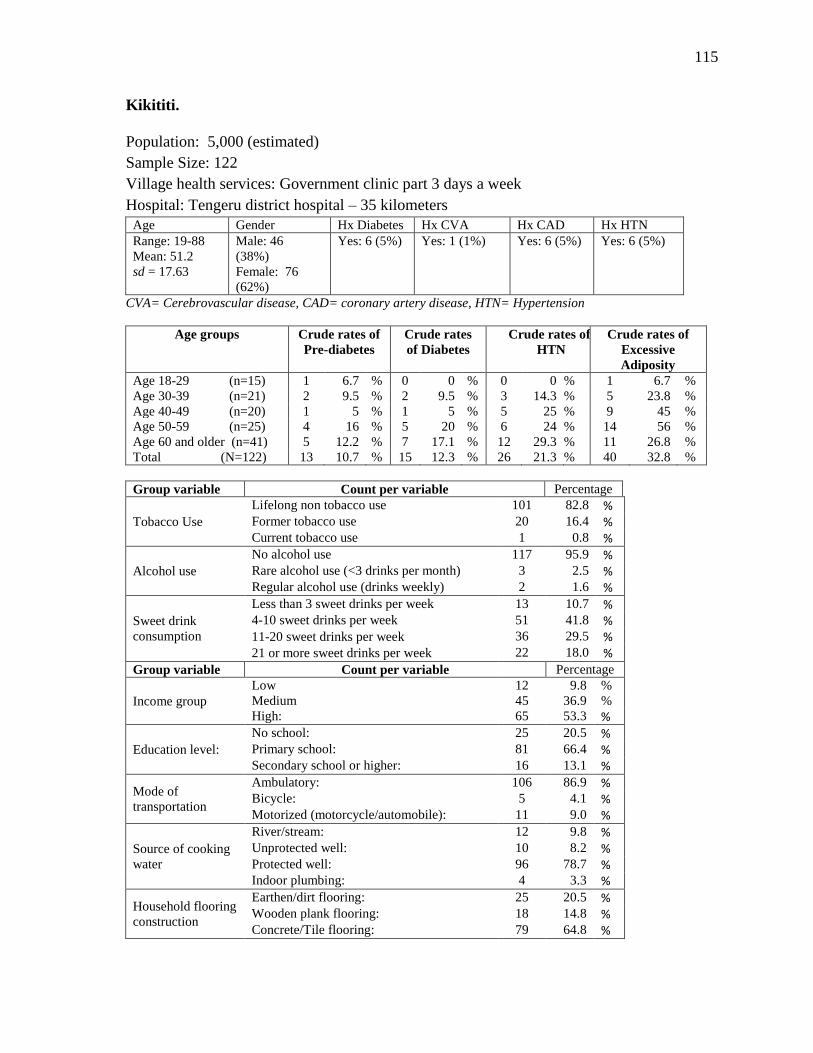
115
Kikititi.
Population: 5,000 (estimated)
Sample Size: 122
Village health services: Government clinic part 3 days a week
Hospital: Tengeru district hospital – 35 kilometers
Age Gender Hx Diabetes Hx CVA Hx CAD Hx HTN
Range: 19-88
Mean: 51.2
sd = 17.63
Male: 46
(38%)
Female: 76
(62%)
Yes: 6 (5%) Yes: 1 (1%) Yes: 6 (5%) Yes: 6 (5%)
CVA= Cerebrovascular disease, CAD= coronary artery disease, HTN= Hypertension
Age groups Crude rates of
Pre-diabetes
Crude rates
of Diabetes
Crude rates of
HTN
Crude rates of
Excessive
Adiposity
Age 18-29 (n=15) 1 6.7 % 0 0 % 0 0 % 1 6.7 %
Age 30-39 (n=21) 2 9.5 % 2 9.5 % 3 14.3 % 5 23.8 %
Age 40-49 (n=20) 1 5 % 1 5 % 5 25 % 9 45 %
Age 50-59 (n=25) 4 16 % 5 20 % 6 24 % 14 56 %
Age 60 and older (n=41) 5 12.2 % 7 17.1 % 12 29.3 % 11 26.8 %
Total (N=122) 13 10.7 % 15 12.3 % 26 21.3 % 40 32.8 %
Group variable Count per variable Percentage
Tobacco Use
Lifelong non tobacco use 101 82.8 % Former tobacco use 20 16.4 % Current tobacco use 1 0.8 %
Alcohol use
No alcohol use 117 95.9 % Rare alcohol use (<3 drinks per month) 3 2.5 % Regular alcohol use (drinks weekly) 2 1.6 %
Sweet drink
consumption
Less than 3 sweet drinks per week 13 10.7 % 4-10 sweet drinks per week 51 41.8 % 11-20 sweet drinks per week 36 29.5 % 21 or more sweet drinks per week 22 18.0 %
Group variable Count per variable Percentage
Income group
Low 12 9.8 %
Medium 45 36.9 %
High: 65 53.3 %
Education level:
No school: 25 20.5 % Primary school: 81 66.4 % Secondary school or higher: 16 13.1 %
Mode of
transportation
Ambulatory: 106 86.9 % Bicycle: 5 4.1 % Motorized (motorcycle/automobile): 11 9.0 %
Source of cooking
water
River/stream: 12 9.8 % Unprotected well: 10 8.2 % Protected well: 96 78.7 % Indoor plumbing: 4 3.3 %
Household flooring
construction
Earthen/dirt flooring: 25 20.5 % Wooden plank flooring: 18 14.8 % Concrete/Tile flooring: 79 64.8 %
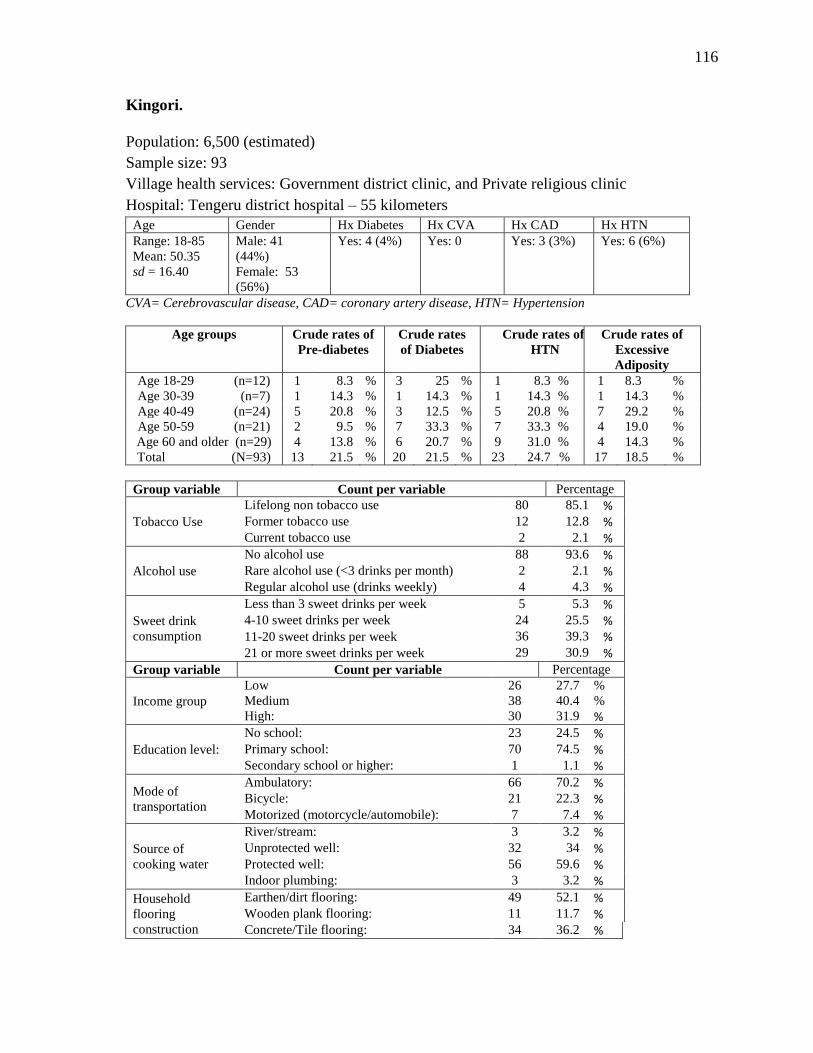
116
Kingori.
Population: 6,500 (estimated)
Sample size: 93
Village health services: Government district clinic, and Private religious clinic
Hospital: Tengeru district hospital – 55 kilometers
Age Gender Hx Diabetes Hx CVA Hx CAD Hx HTN
Range: 18-85
Mean: 50.35
sd = 16.40
Male: 41
(44%)
Female: 53
(56%)
Yes: 4 (4%) Yes: 0 Yes: 3 (3%) Yes: 6 (6%)
CVA= Cerebrovascular disease, CAD= coronary artery disease, HTN= Hypertension
Age groups Crude rates of
Pre-diabetes
Crude rates
of Diabetes
Crude rates of
HTN
Crude rates of
Excessive
Adiposity
Age 18-29 (n=12) 1 8.3 % 3 25 % 1 8.3 % 1 8.3 %
Age 30-39 (n=7) 1 14.3 % 1 14.3 % 1 14.3 % 1 14.3 %
Age 40-49 (n=24) 5 20.8 % 3 12.5 % 5 20.8 % 7 29.2 %
Age 50-59 (n=21) 2 9.5 % 7 33.3 % 7 33.3 % 4 19.0 %
Age 60 and older (n=29) 4 13.8 % 6 20.7 % 9 31.0 % 4 14.3 %
Total (N=93) 13 21.5 % 20 21.5 % 23 24.7 % 17 18.5 %
Group variable Count per variable Percentage
Tobacco Use
Lifelong non tobacco use 80 85.1 % Former tobacco use 12 12.8 % Current tobacco use 2 2.1 %
Alcohol use
No alcohol use 88 93.6 % Rare alcohol use (<3 drinks per month) 2 2.1 % Regular alcohol use (drinks weekly) 4 4.3 %
Sweet drink
consumption
Less than 3 sweet drinks per week 5 5.3 % 4-10 sweet drinks per week 24 25.5 % 11-20 sweet drinks per week 36 39.3 % 21 or more sweet drinks per week 29 30.9 %
Group variable Count per variable Percentage
Income group
Low 26 27.7 %
Medium 38 40.4 %
High: 30 31.9 %
Education level:
No school: 23 24.5 % Primary school: 70 74.5 % Secondary school or higher: 1 1.1 %
Mode of
transportation
Ambulatory: 66 70.2 % Bicycle: 21 22.3 % Motorized (motorcycle/automobile): 7 7.4 %
Source of
cooking water
River/stream: 3 3.2 % Unprotected well: 32 34 % Protected well: 56 59.6 % Indoor plumbing: 3 3.2 %
Household
flooring
construction
Earthen/dirt flooring: 49 52.1 % Wooden plank flooring: 11 11.7 % Concrete/Tile flooring: 34 36.2 %
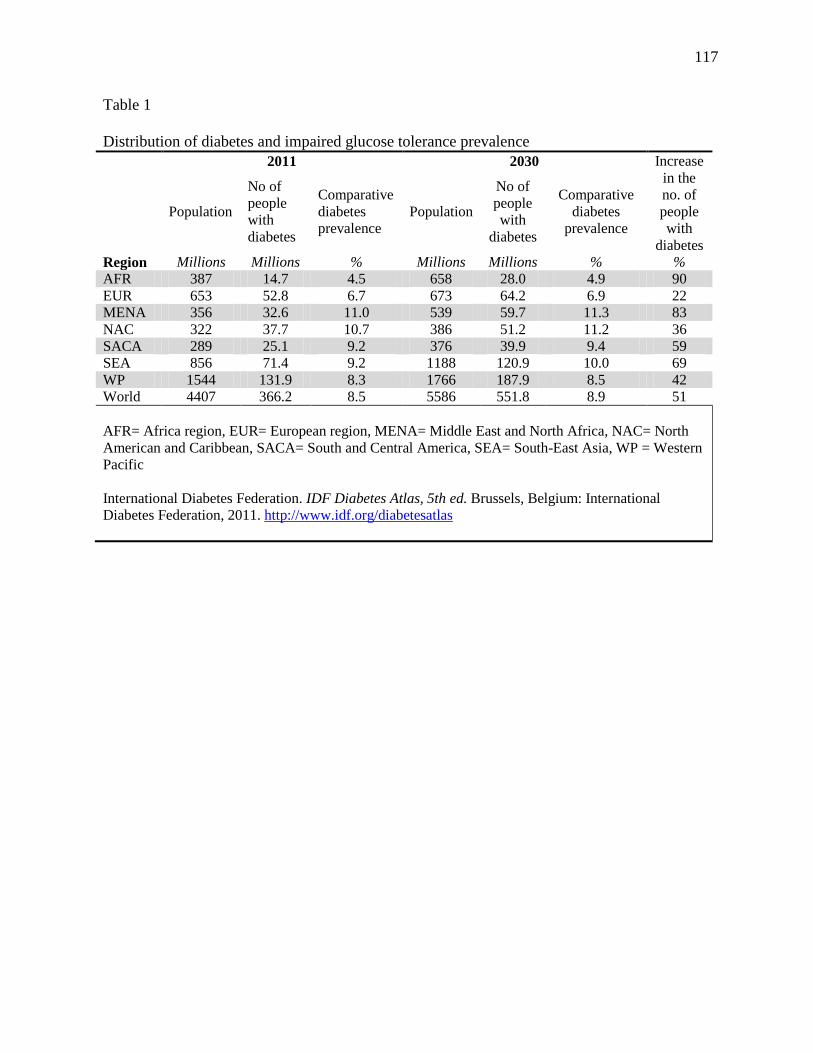
117
Table 1
Distribution of diabetes and impaired glucose tolerance prevalence
2011 2030 Increase
in the
no. of
people
with
diabetes
Population
No of
people
with
diabetes
Comparative
diabetes
prevalence
Population
No of
people
with
diabetes
Comparative
diabetes
prevalence
Region Millions Millions % Millions Millions % %
AFR 387 14.7 4.5 658 28.0 4.9 90
EUR 653 52.8 6.7 673 64.2 6.9 22
MENA 356 32.6 11.0 539 59.7 11.3 83
NAC 322 37.7 10.7 386 51.2 11.2 36
SACA 289 25.1 9.2 376 39.9 9.4 59
SEA 856 71.4 9.2 1188 120.9 10.0 69
WP 1544 131.9 8.3 1766 187.9 8.5 42
World 4407 366.2 8.5 5586 551.8 8.9 51
AFR= Africa region, EUR= European region, MENA= Middle East and North Africa, NAC= North
American and Caribbean, SACA= South and Central America, SEA= South-East Asia, WP = Western
Pacific
International Diabetes Federation. IDF Diabetes Atlas, 5th ed. Brussels, Belgium: International
Diabetes Federation, 2011. http://www.idf.org/diabetesatlas
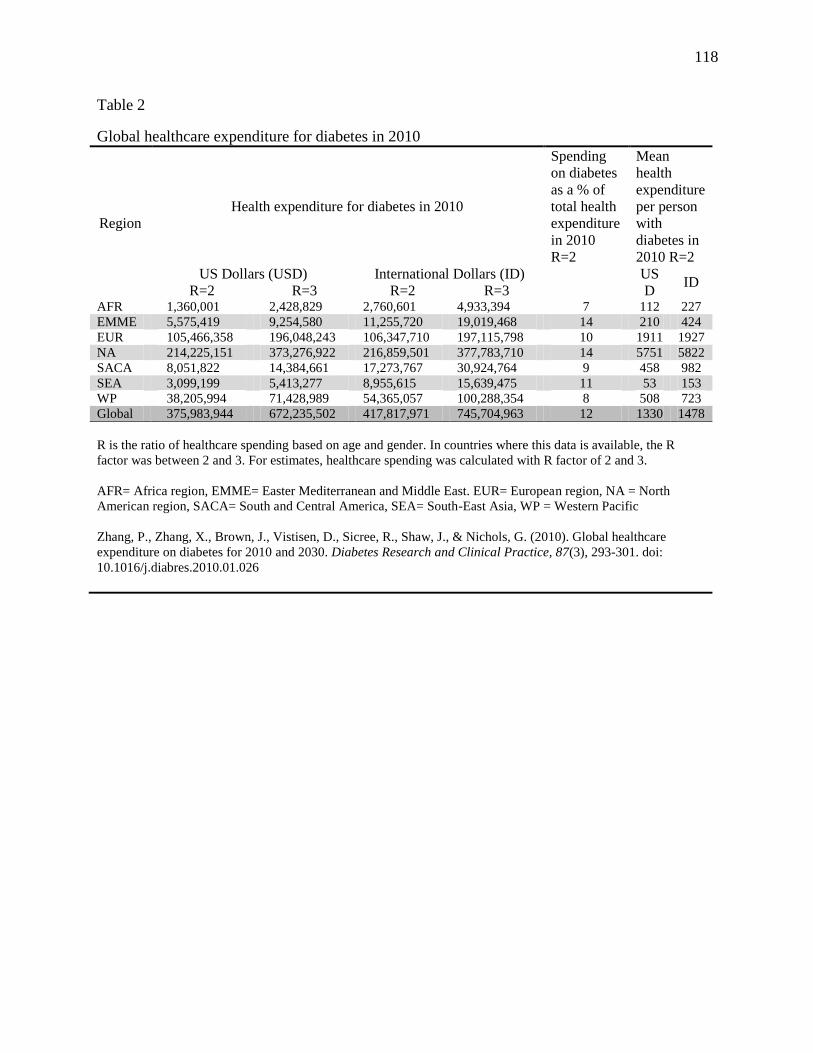
118
Table 2
Global healthcare expenditure for diabetes in 2010
Region
Health expenditure for diabetes in 2010
Spending
on diabetes
as a % of
total health
expenditure
in 2010
R=2
Mean
health
expenditure
per person
with
diabetes in
2010 R=2
US Dollars (USD) International Dollars (ID) US
D ID
R=2 R=3 R=2 R=3 AFR 1,360,001 2,428,829 2,760,601 4,933,394 7 112 227
EMME 5,575,419 9,254,580 11,255,720 19,019,468 14 210 424
EUR 105,466,358 196,048,243 106,347,710 197,115,798 10 1911 1927
NA 214,225,151 373,276,922 216,859,501 377,783,710 14 5751 5822
SACA 8,051,822 14,384,661 17,273,767 30,924,764 9 458 982
SEA 3,099,199 5,413,277 8,955,615 15,639,475 11 53 153
WP 38,205,994 71,428,989 54,365,057 100,288,354 8 508 723
Global 375,983,944 672,235,502 417,817,971 745,704,963 12 1330 1478
R is the ratio of healthcare spending based on age and gender. In countries where this data is available, the R
factor was between 2 and 3. For estimates, healthcare spending was calculated with R factor of 2 and 3.
AFR= Africa region, EMME= Easter Mediterranean and Middle East. EUR= European region, NA = North
American region, SACA= South and Central America, SEA= South-East Asia, WP = Western Pacific
Zhang, P., Zhang, X., Brown, J., Vistisen, D., Sicree, R., Shaw, J., & Nichols, G. (2010). Global healthcare
expenditure on diabetes for 2010 and 2030. Diabetes Research and Clinical Practice, 87(3), 293-301. doi:
10.1016/j.diabres.2010.01.026
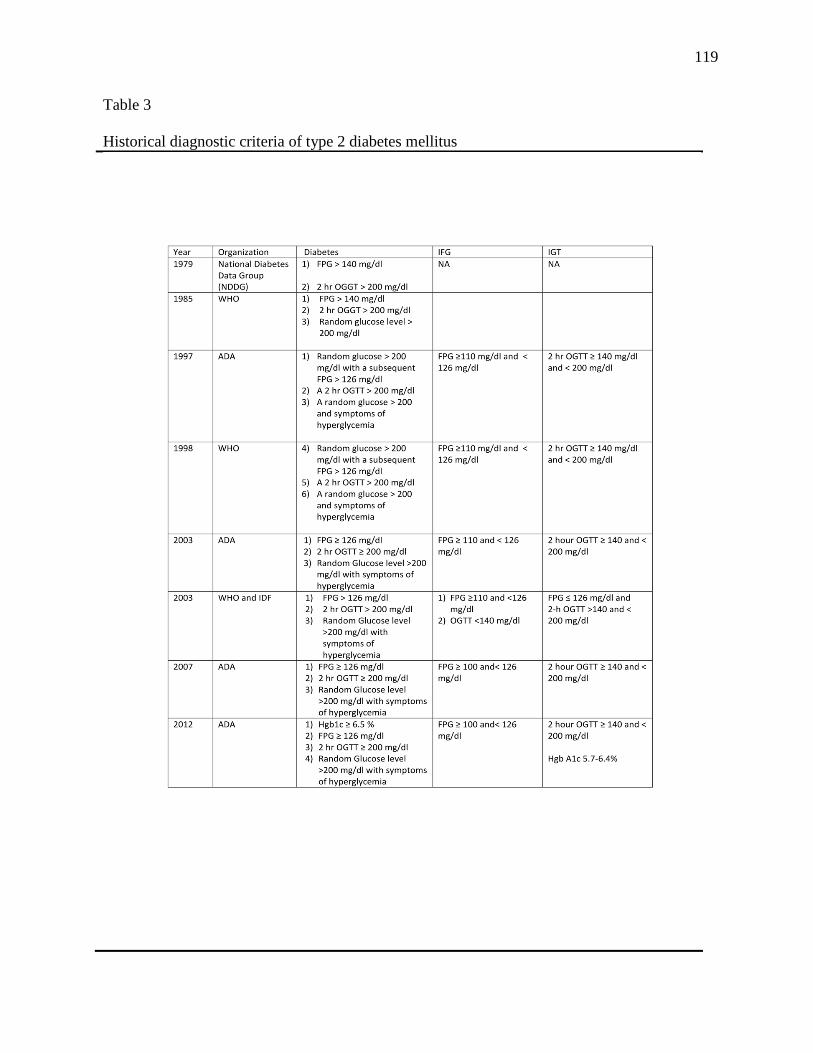
119
Table 3
Historical diagnostic criteria of type 2 diabetes mellitus
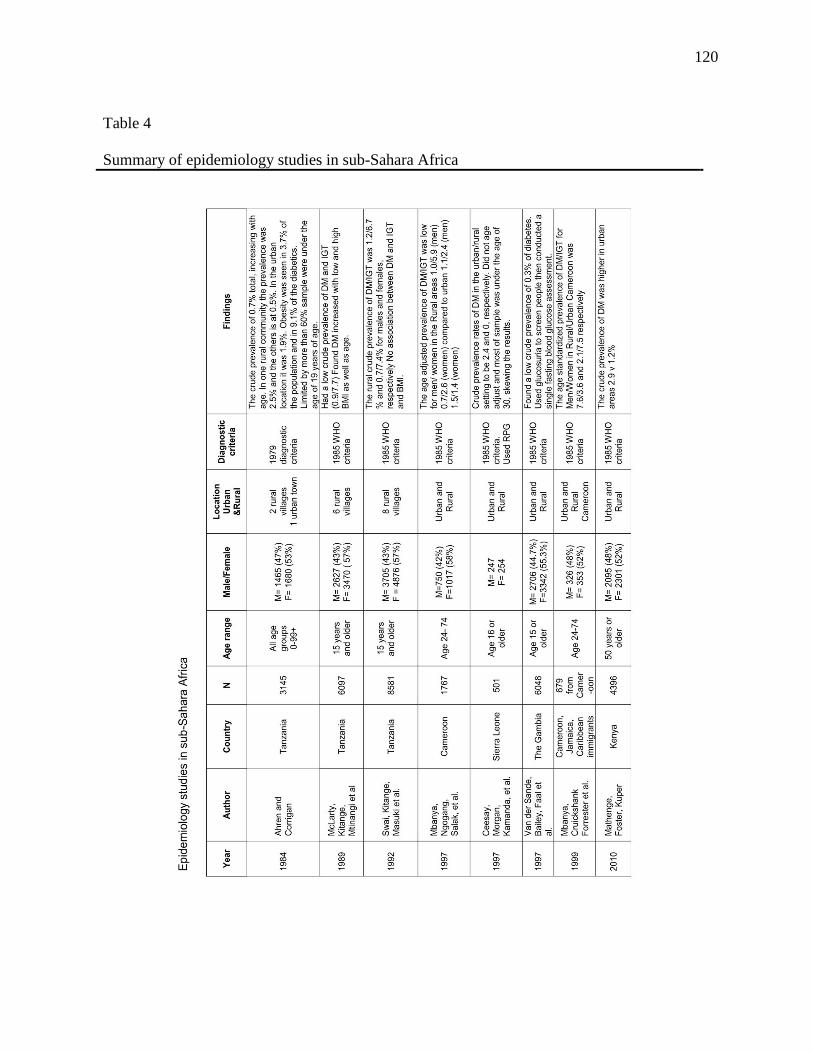
120
Table 4
Summary of epidemiology studies in sub-Sahara Africa
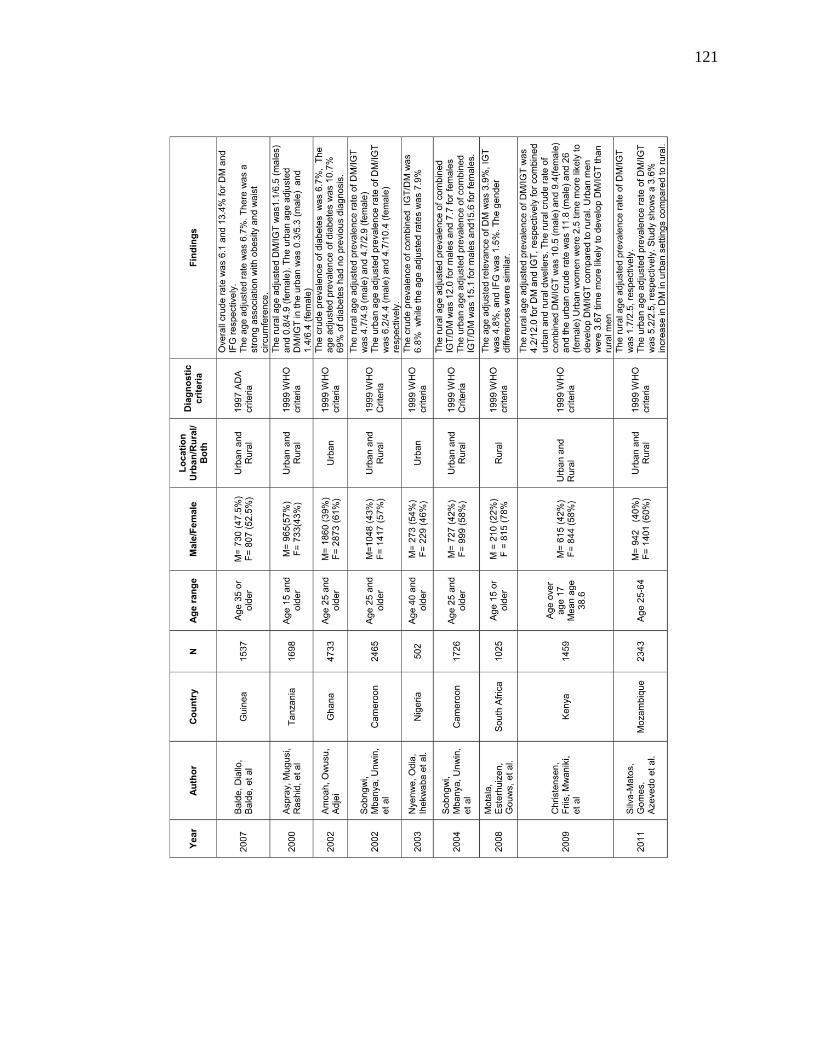
121
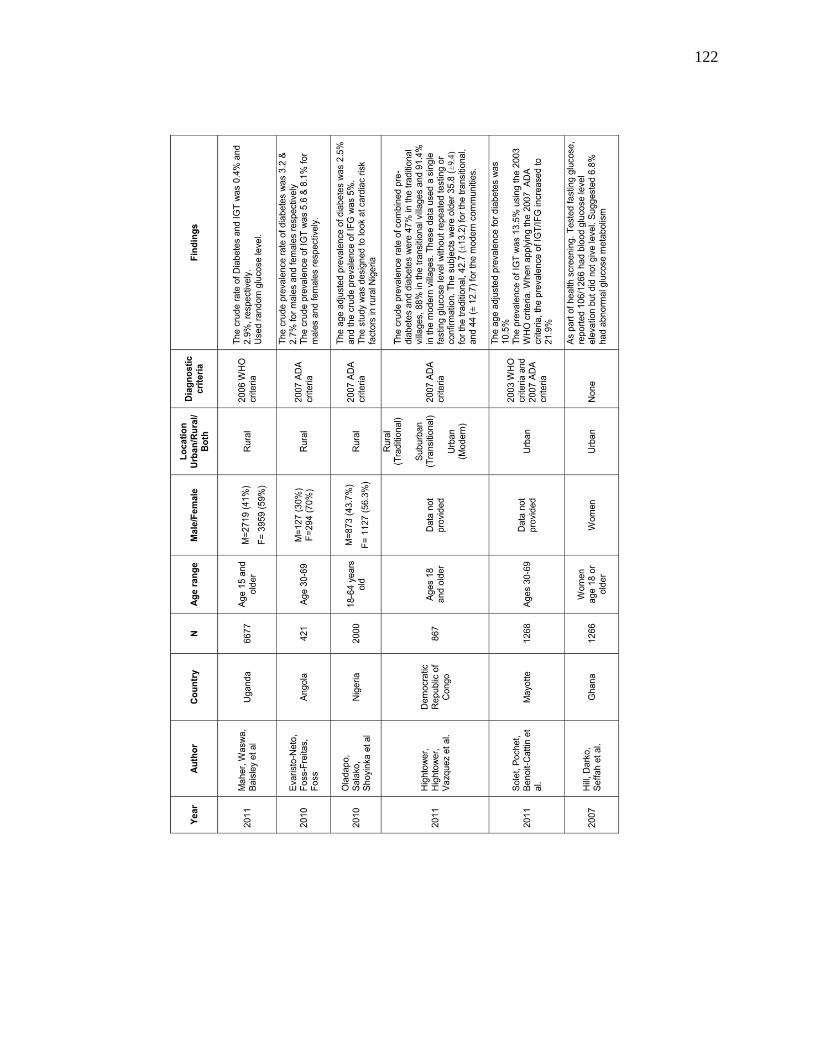
122
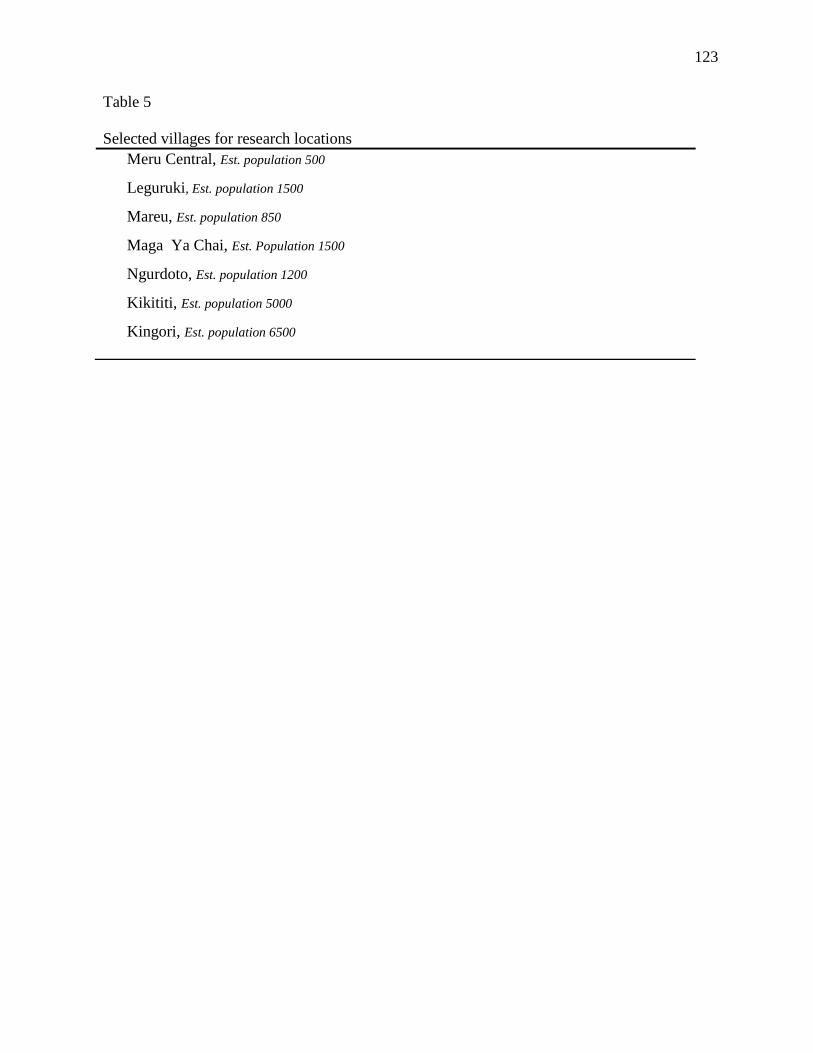
123
Table 5
Selected villages for research locations
Meru Central, Est. population 500
Leguruki, Est. population 1500
Mareu, Est. population 850
Maga Ya Chai, Est. Population 1500
Ngurdoto, Est. population 1200
Kikititi, Est. population 5000
Kingori, Est. population 6500
124
Table 6
Inclusion and exclusion criteria for prevalence study
Inclusion Criteria Exclusion Criteria
18 years of age or older Temperature greater than 101.4 degrees
Fahrenheit
Able to provide informed consent Currently taking antibiotics, anti-
malarial, or anti-viral medications
Willing to provide a sample of blood for
analysis
Women who are pregnant
Women who are currently lactating
People who are currently taking a
glucocorticoid/mineralocorticoid steroid
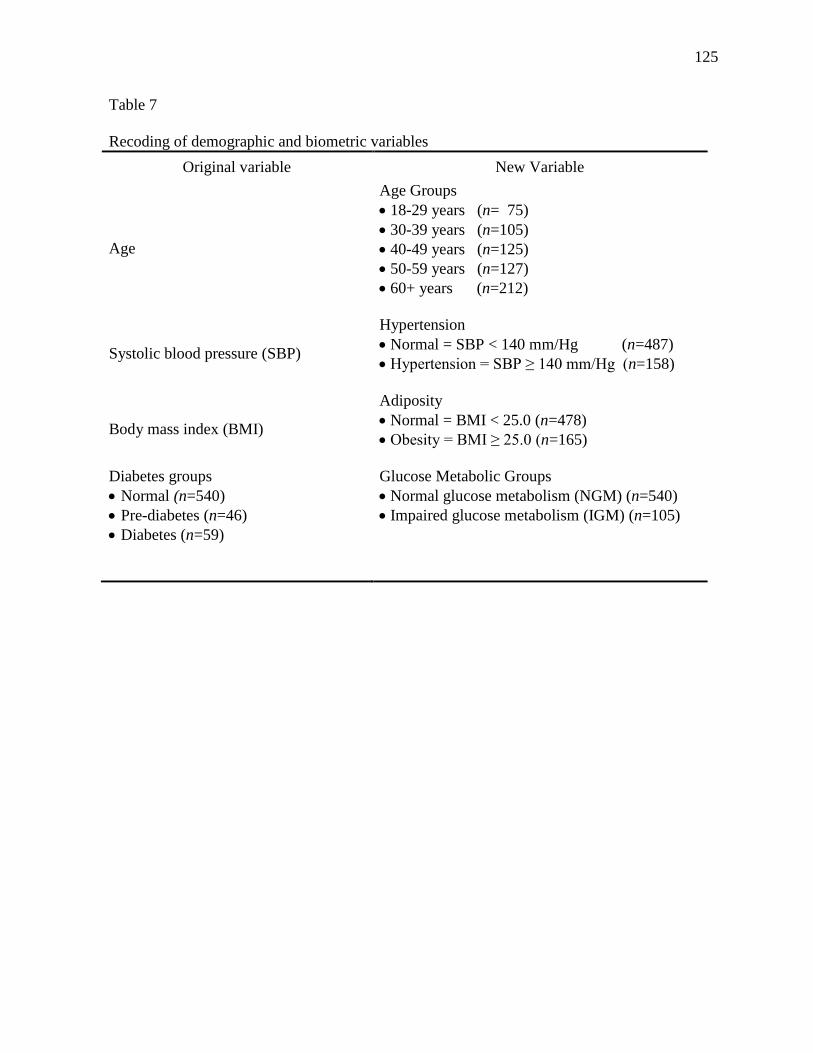
125
Table 7
Recoding of demographic and biometric variables
Original variable New Variable
Age
Age Groups
18-29 years (n= 75)
30-39 years (n=105)
40-49 years (n=125)
50-59 years (n=127)
60+ years (n=212)
Systolic blood pressure (SBP)
Hypertension
Normal = SBP < 140 mm/Hg (n=487)
Hypertension = SBP ≥ 140 mm/Hg (n=158)
Body mass index (BMI)
Adiposity
Normal = BMI < 25.0 (n=478)
Obesity = BMI ≥ 25.0 (n=165)
Diabetes groups
Normal (n=540)
Pre-diabetes (n=46)
Diabetes (n=59)
Glucose Metabolic Groups
Normal glucose metabolism (NGM) (n=540)
Impaired glucose metabolism (IGM) (n=105)
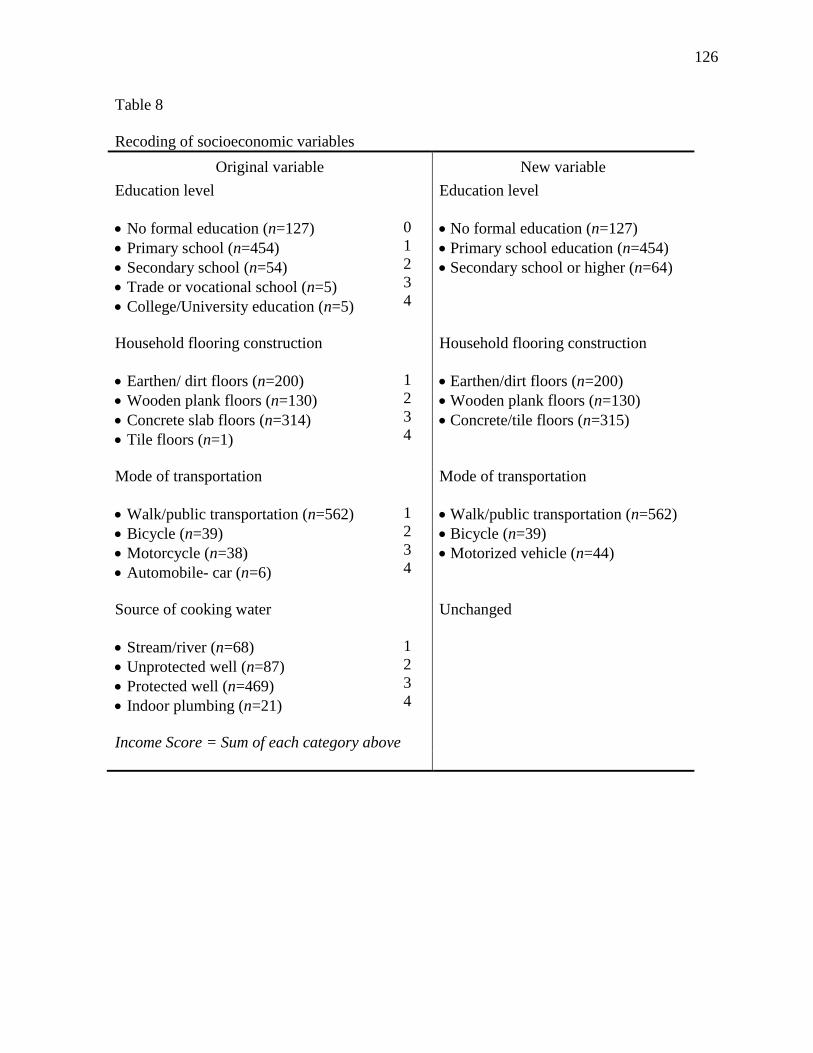
126
Table 8
Recoding of socioeconomic variables
Original variable New variable
Education level
No formal education (n=127)
Primary school (n=454)
Secondary school (n=54)
Trade or vocational school (n=5)
College/University education (n=5)
0
1
2
3
4
Education level
No formal education (n=127)
Primary school education (n=454)
Secondary school or higher (n=64)
Household flooring construction
Earthen/ dirt floors (n=200)
Wooden plank floors (n=130)
Concrete slab floors (n=314)
Tile floors (n=1)
1
2
3
4
Household flooring construction
Earthen/dirt floors (n=200)
Wooden plank floors (n=130)
Concrete/tile floors (n=315)
Mode of transportation
Walk/public transportation (n=562)
Bicycle (n=39)
Motorcycle (n=38)
Automobile- car (n=6)
1
2
3
4
Mode of transportation
Walk/public transportation (n=562)
Bicycle (n=39)
Motorized vehicle (n=44)
Source of cooking water
Stream/river (n=68)
Unprotected well (n=87)
Protected well (n=469)
Indoor plumbing (n=21)
1
2
3
4
Unchanged
Income Score = Sum of each category above
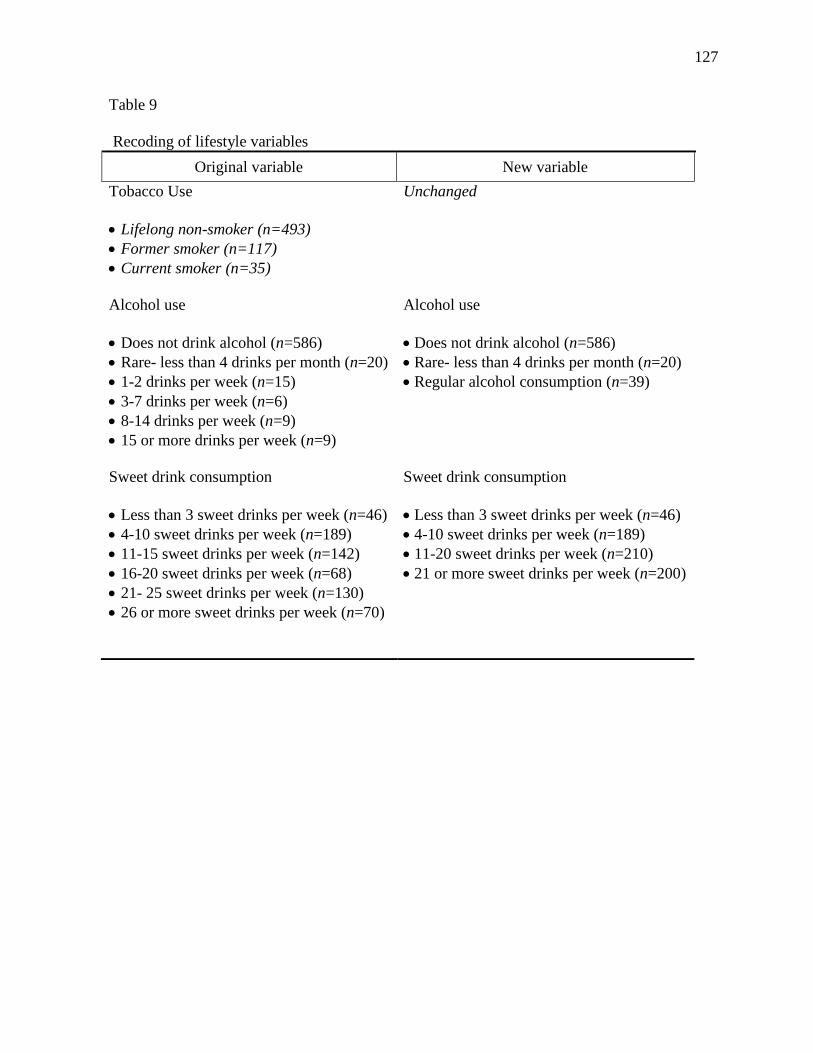
127
Table 9
Recoding of lifestyle variables
Original variable New variable
Tobacco Use
Lifelong non-smoker (n=493)
Former smoker (n=117)
Current smoker (n=35)
Unchanged
Alcohol use
Does not drink alcohol (n=586)
Rare- less than 4 drinks per month (n=20)
1-2 drinks per week (n=15)
3-7 drinks per week (n=6)
8-14 drinks per week (n=9)
15 or more drinks per week (n=9)
Alcohol use
Does not drink alcohol (n=586)
Rare- less than 4 drinks per month (n=20)
Regular alcohol consumption (n=39)
Sweet drink consumption
Less than 3 sweet drinks per week (n=46)
4-10 sweet drinks per week (n=189)
11-15 sweet drinks per week (n=142)
16-20 sweet drinks per week (n=68)
21- 25 sweet drinks per week (n=130)
26 or more sweet drinks per week (n=70)
Sweet drink consumption
Less than 3 sweet drinks per week (n=46)
4-10 sweet drinks per week (n=189)
11-20 sweet drinks per week (n=210)
21 or more sweet drinks per week (n=200)
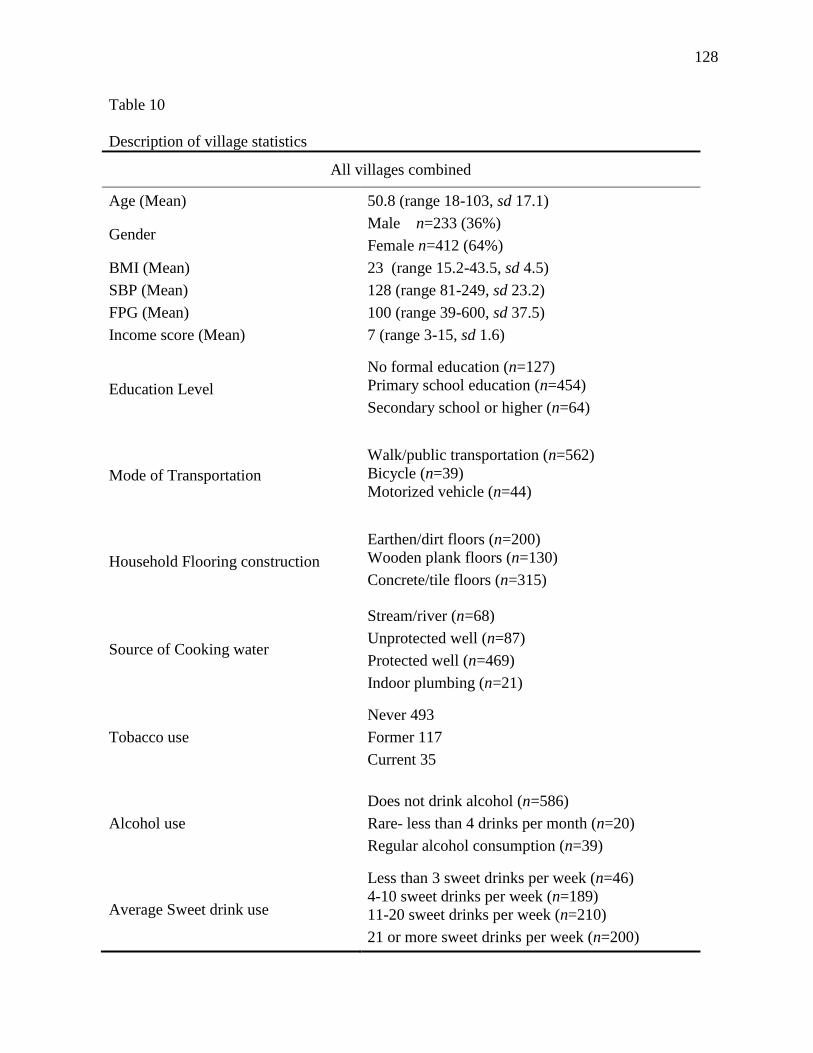
128
Table 10
Description of village statistics
All villages combined
Age (Mean) 50.8 (range 18-103, sd 17.1)
Gender Male n=233 (36%)
Female n=412 (64%)
BMI (Mean) 23 (range 15.2-43.5, sd 4.5)
SBP (Mean) 128 (range 81-249, sd 23.2)
FPG (Mean) 100 (range 39-600, sd 37.5)
Income score (Mean) 7 (range 3-15, sd 1.6)
Education Level
No formal education (n=127)
Primary school education (n=454)
Secondary school or higher (n=64)
Mode of Transportation
Walk/public transportation (n=562)
Bicycle (n=39)
Motorized vehicle (n=44)
Household Flooring construction
Earthen/dirt floors (n=200)
Wooden plank floors (n=130)
Concrete/tile floors (n=315)
Source of Cooking water
Stream/river (n=68)
Unprotected well (n=87)
Protected well (n=469)
Indoor plumbing (n=21)
Tobacco use
Never 493
Former 117
Current 35
Alcohol use
Does not drink alcohol (n=586)
Rare- less than 4 drinks per month (n=20)
Regular alcohol consumption (n=39)
Average Sweet drink use
Less than 3 sweet drinks per week (n=46)
4-10 sweet drinks per week (n=189)
11-20 sweet drinks per week (n=210)
21 or more sweet drinks per week (n=200)
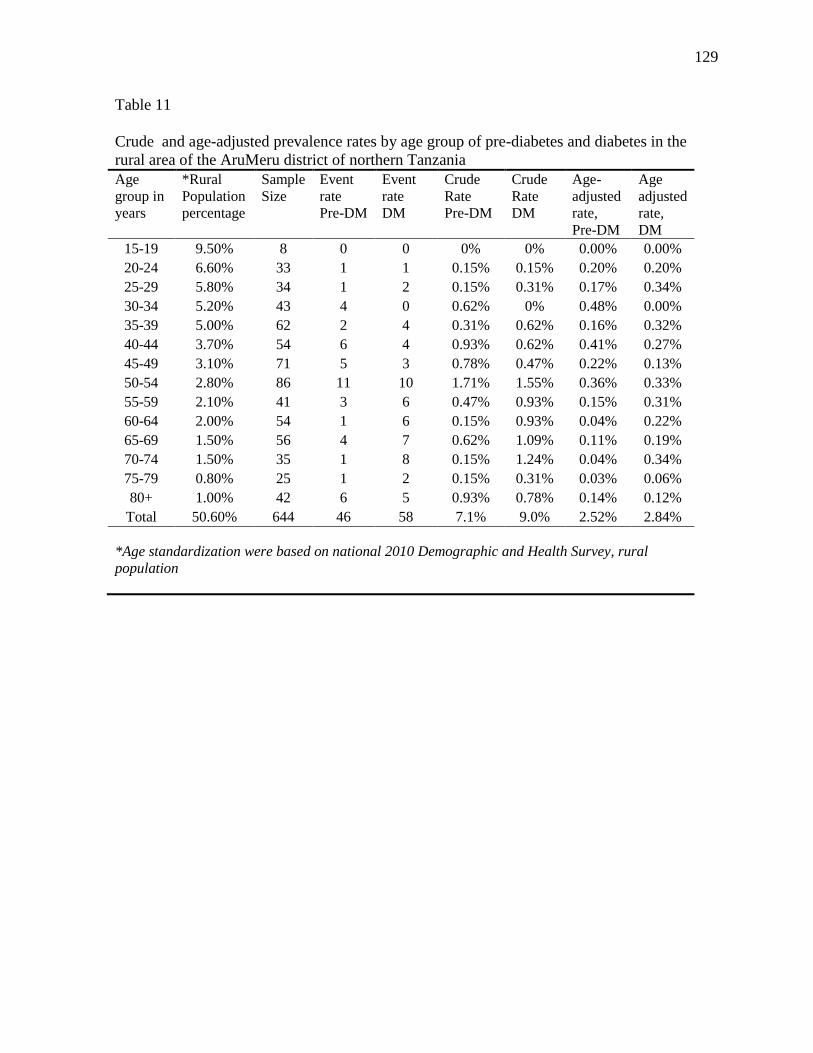
129
Table 11
Crude and age-adjusted prevalence rates by age group of pre-diabetes and diabetes in the
rural area of the AruMeru district of northern Tanzania
Age
group in
years
*Rural
Population
percentage
Sample
Size
Event
rate
Pre-DM
Event
rate
DM
Crude
Rate
Pre-DM
Crude
Rate
DM
Age-
adjusted
rate,
Pre-DM
Age
adjusted
rate,
DM
15-19 9.50% 8 0 0 0% 0% 0.00% 0.00%
20-24 6.60% 33 1 1 0.15% 0.15% 0.20% 0.20%
25-29 5.80% 34 1 2 0.15% 0.31% 0.17% 0.34%
30-34 5.20% 43 4 0 0.62% 0% 0.48% 0.00%
35-39 5.00% 62 2 4 0.31% 0.62% 0.16% 0.32%
40-44 3.70% 54 6 4 0.93% 0.62% 0.41% 0.27%
45-49 3.10% 71 5 3 0.78% 0.47% 0.22% 0.13%
50-54 2.80% 86 11 10 1.71% 1.55% 0.36% 0.33%
55-59 2.10% 41 3 6 0.47% 0.93% 0.15% 0.31%
60-64 2.00% 54 1 6 0.15% 0.93% 0.04% 0.22%
65-69 1.50% 56 4 7 0.62% 1.09% 0.11% 0.19%
70-74 1.50% 35 1 8 0.15% 1.24% 0.04% 0.34%
75-79 0.80% 25 1 2 0.15% 0.31% 0.03% 0.06%
80+ 1.00% 42 6 5 0.93% 0.78% 0.14% 0.12%
Total 50.60% 644 46 58 7.1% 9.0% 2.52% 2.84%
*Age standardization were based on national 2010 Demographic and Health Survey, rural
population
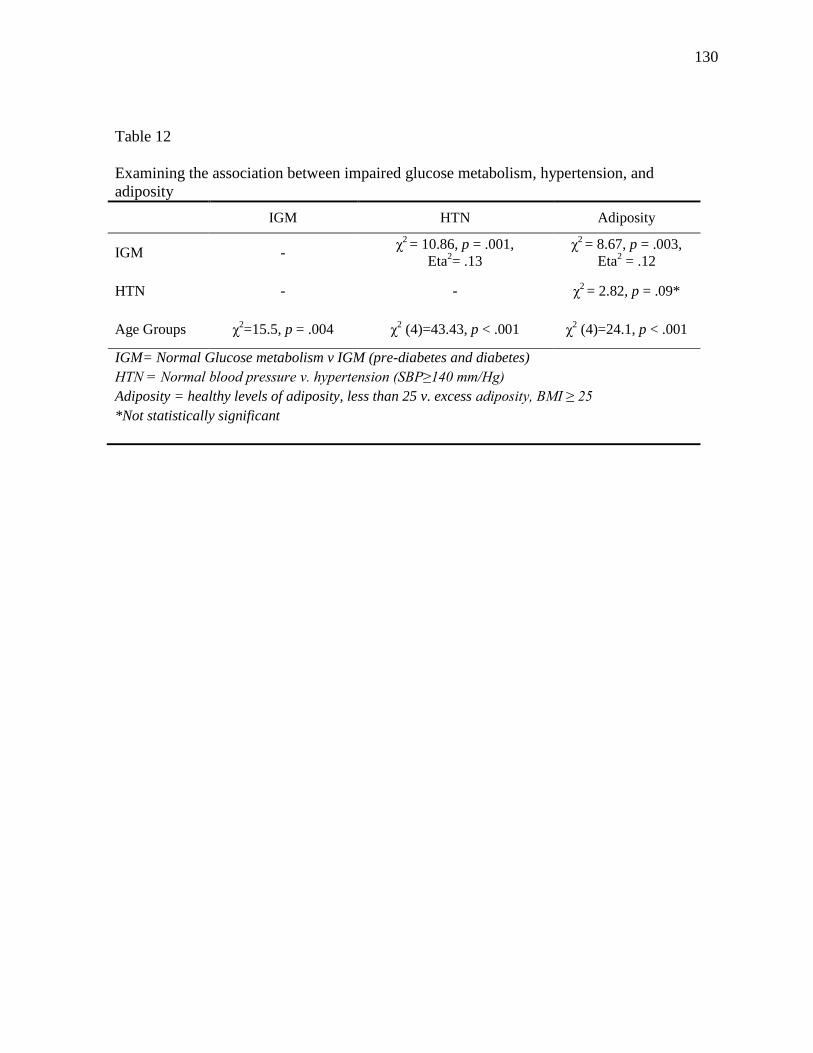
130
Table 12
Examining the association between impaired glucose metabolism, hypertension, and
adiposity
IGM HTN Adiposity
IGM - χ
2 = 10.86, p = .001,
Eta2= .13
χ2 = 8.67, p = .003,
Eta2 = .12
HTN - - χ2 = 2.82, p = .09*
Age Groups χ2=15.5, p = .004 χ
2 (4)=43.43, p < .001 χ
2 (4)=24.1, p < .001
IGM= Normal Glucose metabolism v IGM (pre-diabetes and diabetes)
HTN = Normal blood pressure v. hypertension (SBP≥140 mm/Hg)
Adiposity = healthy levels of adiposity, less than 25 v. excess adiposity, BMI ≥ 25
*Not statistically significant
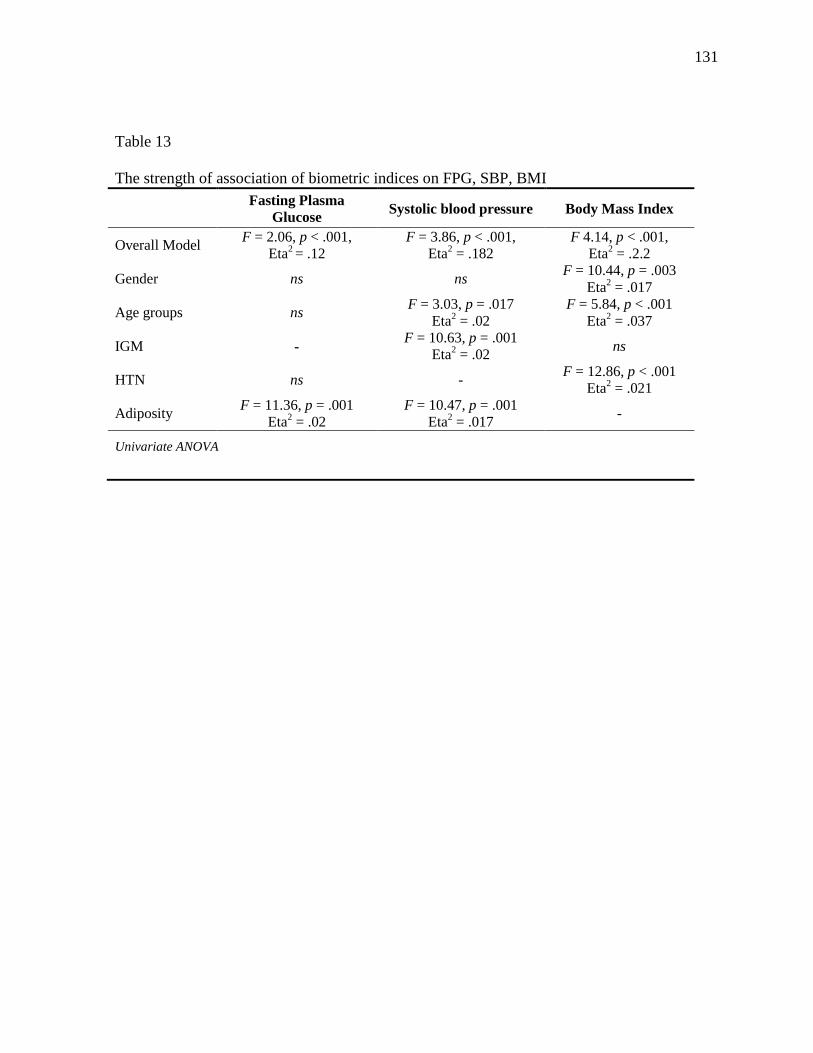
131
Table 13
The strength of association of biometric indices on FPG, SBP, BMI
Fasting Plasma
Glucose Systolic blood pressure Body Mass Index
Overall Model F = 2.06, p < .001,
Eta2 = .12
F = 3.86, p < .001,
Eta2 = .182
F 4.14, p < .001,
Eta2 = .2.2
Gender ns ns F = 10.44, p = .003
Eta2 = .017
Age groups ns F = 3.03, p = .017
Eta2 = .02
F = 5.84, p < .001
Eta2 = .037
IGM - F = 10.63, p = .001
Eta2 = .02
ns
HTN ns - F = 12.86, p < .001
Eta2 = .021
Adiposity F = 11.36, p = .001
Eta2 = .02
F = 10.47, p = .001
Eta2 = .017
-
Univariate ANOVA
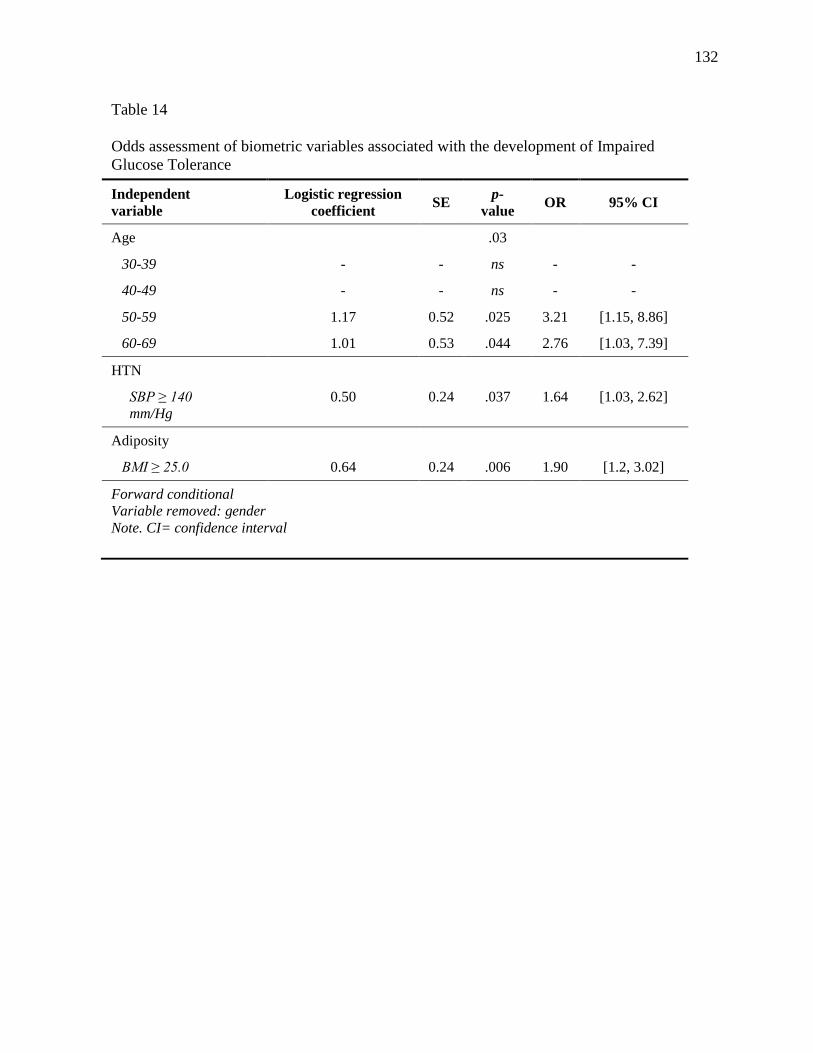
132
Table 14
Odds assessment of biometric variables associated with the development of Impaired
Glucose Tolerance
Independent
variable
Logistic regression
coefficient SE
p-
value OR 95% CI
Age .03
30-39 - - ns - -
40-49 - - ns - -
50-59 1.17 0.52 .025 3.21 [1.15, 8.86]
60-69 1.01 0.53 .044 2.76 [1.03, 7.39]
HTN
SBP ≥ 140
mm/Hg
0.50 0.24 .037 1.64 [1.03, 2.62]
Adiposity
BMI ≥ 25.0 0.64 0.24 .006 1.90 [1.2, 3.02]
Forward conditional
Variable removed: gender
Note. CI= confidence interval
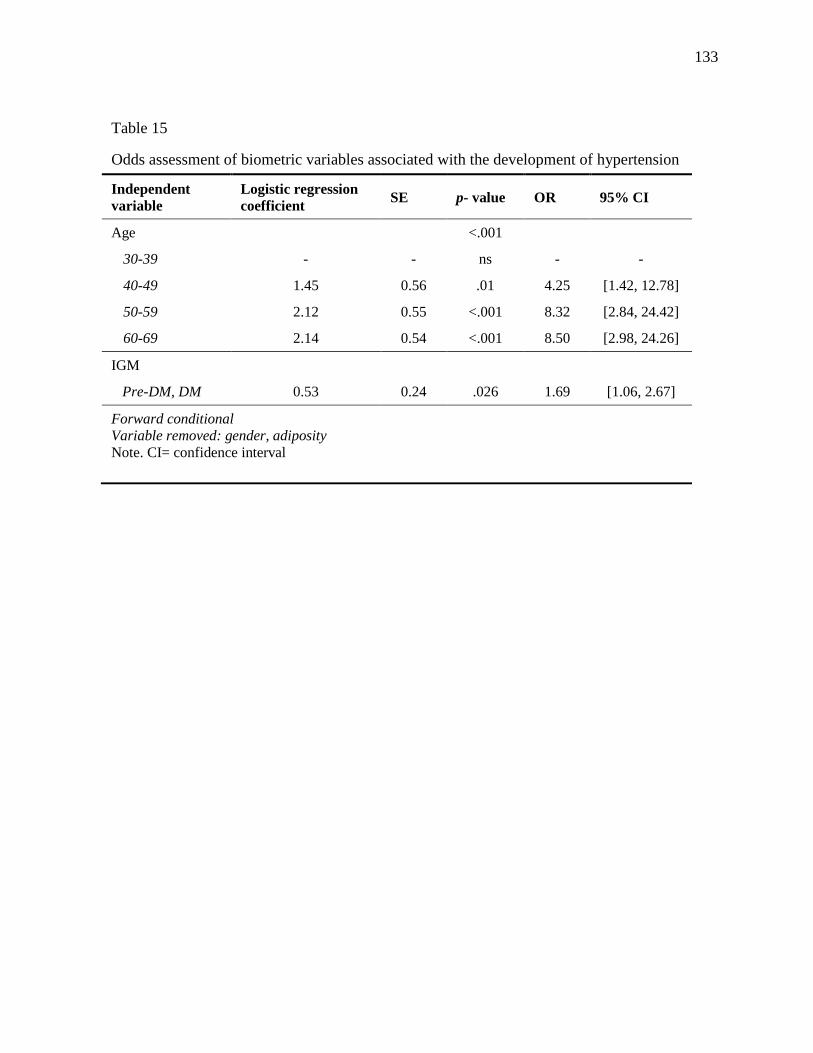
133
Table 15
Odds assessment of biometric variables associated with the development of hypertension
Independent
variable
Logistic regression
coefficient SE p- value OR 95% CI
Age <.001
30-39 - - ns - -
40-49 1.45 0.56 .01 4.25 [1.42, 12.78]
50-59 2.12 0.55 <.001 8.32 [2.84, 24.42]
60-69 2.14 0.54 <.001 8.50 [2.98, 24.26]
IGM
Pre-DM, DM 0.53 0.24 .026 1.69 [1.06, 2.67]
Forward conditional
Variable removed: gender, adiposity
Note. CI= confidence interval
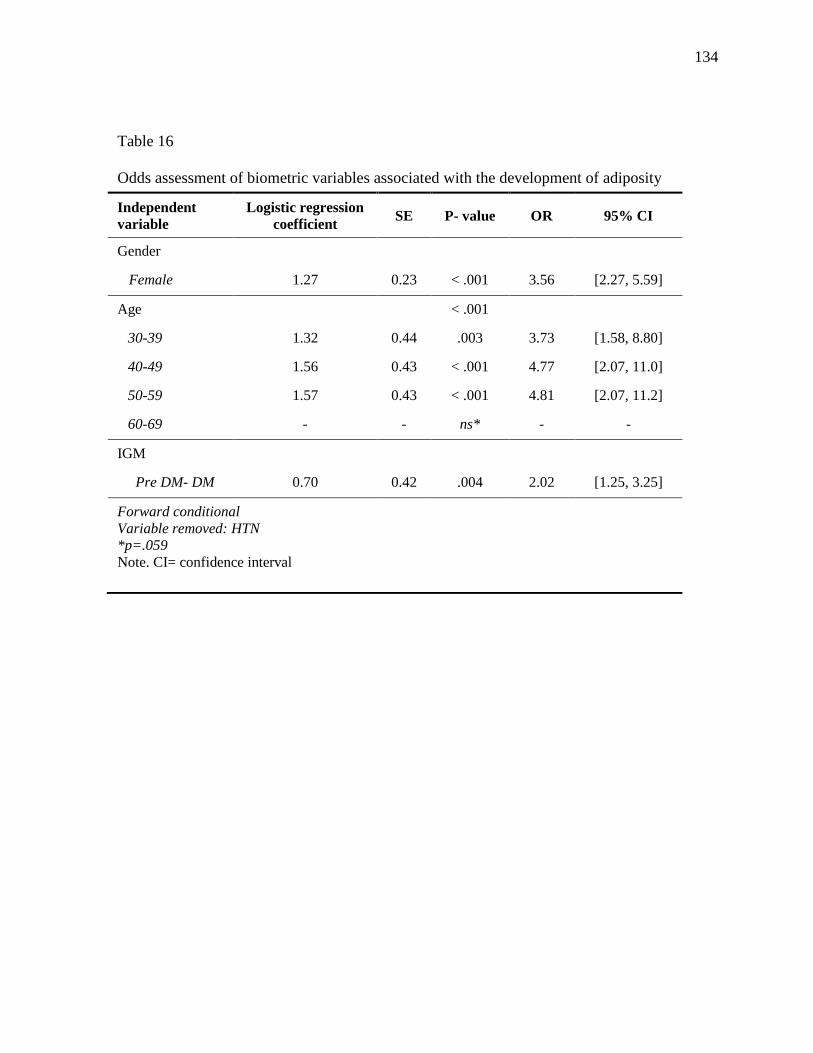
134
Table 16
Odds assessment of biometric variables associated with the development of adiposity
Independent
variable
Logistic regression
coefficient SE P- value OR 95% CI
Gender
Female 1.27 0.23 < .001 3.56 [2.27, 5.59]
Age < .001
30-39 1.32 0.44 .003 3.73 [1.58, 8.80]
40-49 1.56 0.43 < .001 4.77 [2.07, 11.0]
50-59 1.57 0.43 < .001 4.81 [2.07, 11.2]
60-69 - - ns* - -
IGM
Pre DM- DM 0.70 0.42 .004 2.02 [1.25, 3.25]
Forward conditional
Variable removed: HTN
*p=.059
Note. CI= confidence interval
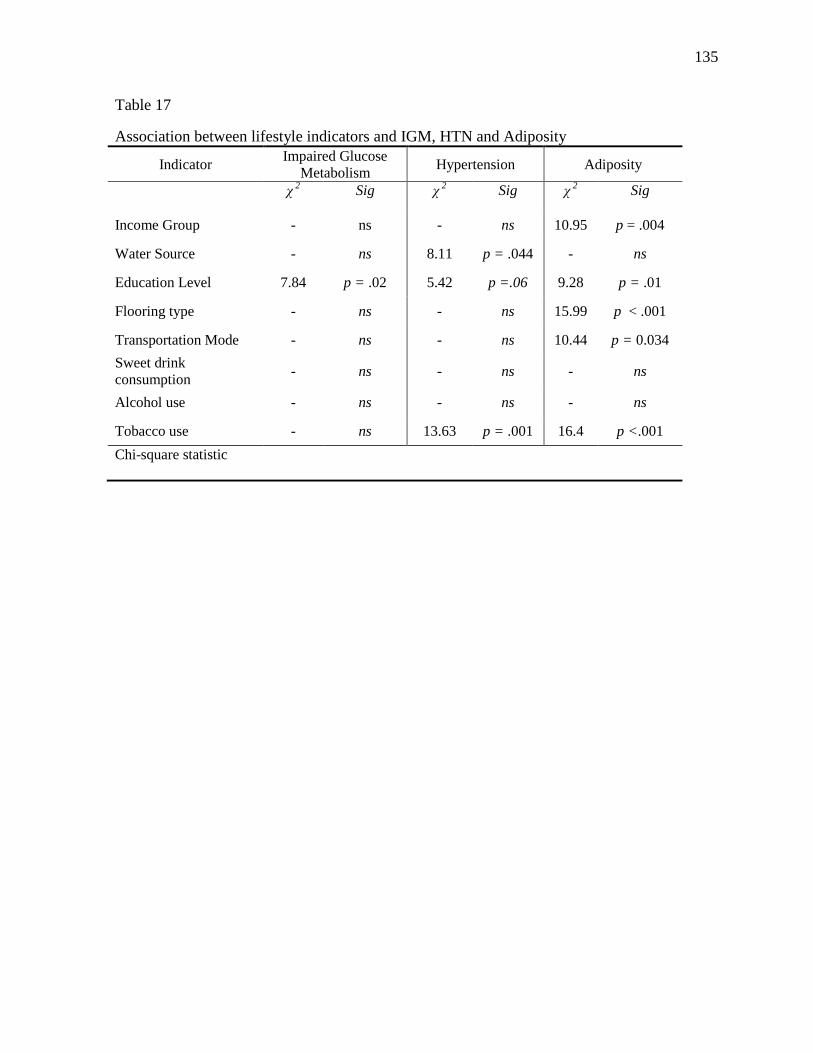
135
Table 17
Association between lifestyle indicators and IGM, HTN and Adiposity
Indicator Impaired Glucose
Metabolism Hypertension Adiposity
χ 2 Sig χ
2 Sig χ
2 Sig
Income Group - ns - ns 10.95 p = .004
Water Source - ns 8.11 p = .044 - ns
Education Level 7.84 p = .02 5.42 p =.06 9.28 p = .01
Flooring type - ns - ns 15.99 p < .001
Transportation Mode - ns - ns 10.44 p = 0.034
Sweet drink
consumption - ns - ns - ns
Alcohol use - ns - ns - ns
Tobacco use - ns 13.63 p = .001 16.4 p <.001
Chi-square statistic
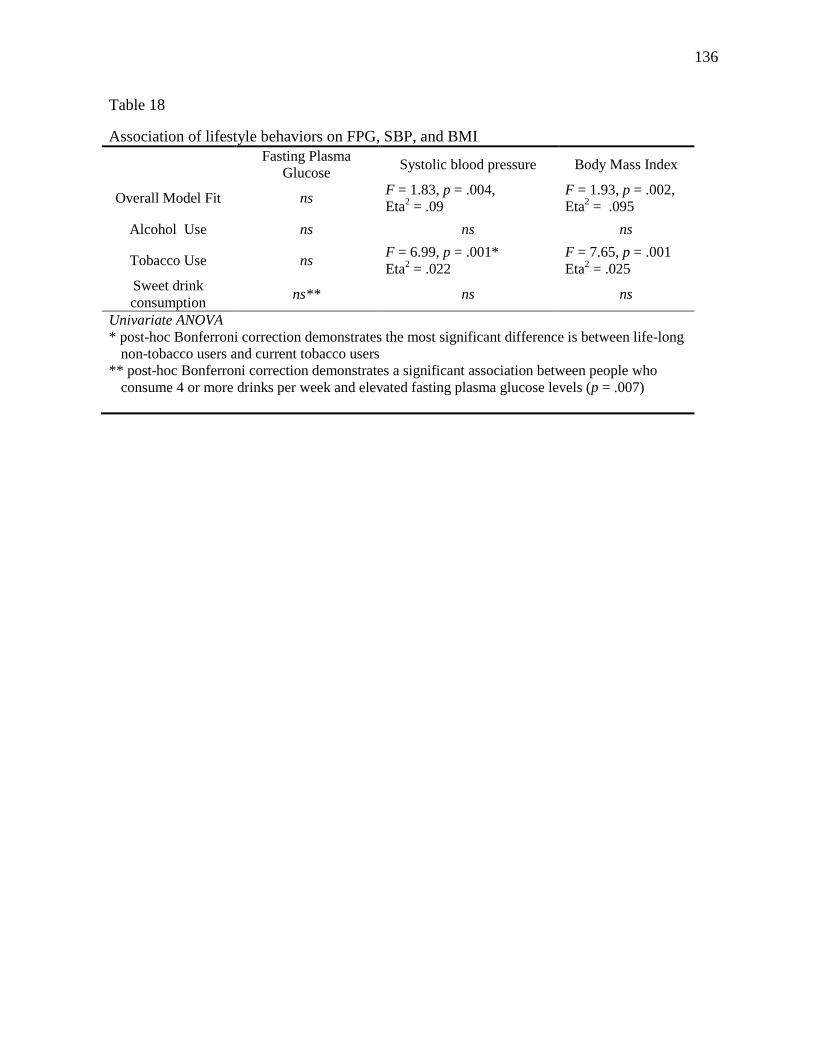
136
Table 18
Association of lifestyle behaviors on FPG, SBP, and BMI
Fasting Plasma
Glucose Systolic blood pressure Body Mass Index
Overall Model Fit ns F = 1.83, p = .004,
Eta2 = .09
F = 1.93, p = .002,
Eta2 = .095
Alcohol Use ns ns ns
Tobacco Use ns F = 6.99, p = .001*
Eta2 = .022
F = 7.65, p = .001
Eta2 = .025
Sweet drink
consumption ns** ns ns
Univariate ANOVA
* post-hoc Bonferroni correction demonstrates the most significant difference is between life-long
non-tobacco users and current tobacco users
** post-hoc Bonferroni correction demonstrates a significant association between people who
consume 4 or more drinks per week and elevated fasting plasma glucose levels (p = .007)
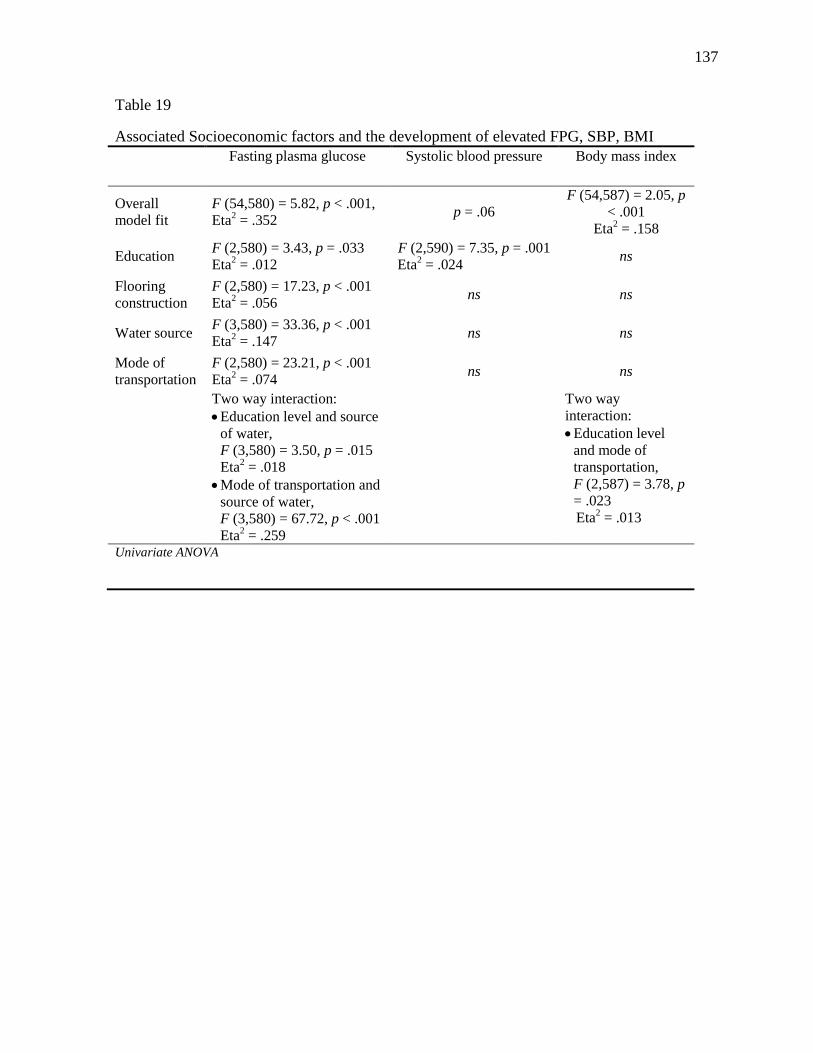
137
Table 19
Associated Socioeconomic factors and the development of elevated FPG, SBP, BMI
Fasting plasma glucose Systolic blood pressure Body mass index
Overall
model fit
F (54,580) = 5.82, p < .001,
Eta2 = .352
p = .06
F (54,587) = 2.05, p
< .001
Eta2 = .158
Education F (2,580) = 3.43, p = .033
Eta2 = .012
F (2,590) = 7.35, p = .001
Eta2 = .024
ns
Flooring
construction
F (2,580) = 17.23, p < .001
Eta2 = .056
ns ns
Water source F (3,580) = 33.36, p < .001
Eta2 = .147
ns ns
Mode of
transportation
F (2,580) = 23.21, p < .001
Eta2 = .074
ns ns
Two way interaction:
Education level and source
of water,
F (3,580) = 3.50, p = .015
Eta2 = .018
Mode of transportation and
source of water,
F (3,580) = 67.72, p < .001
Eta2 = .259
Two way
interaction:
Education level
and mode of
transportation,
F (2,587) = 3.78, p
= .023
Eta2 = .013
Univariate ANOVA
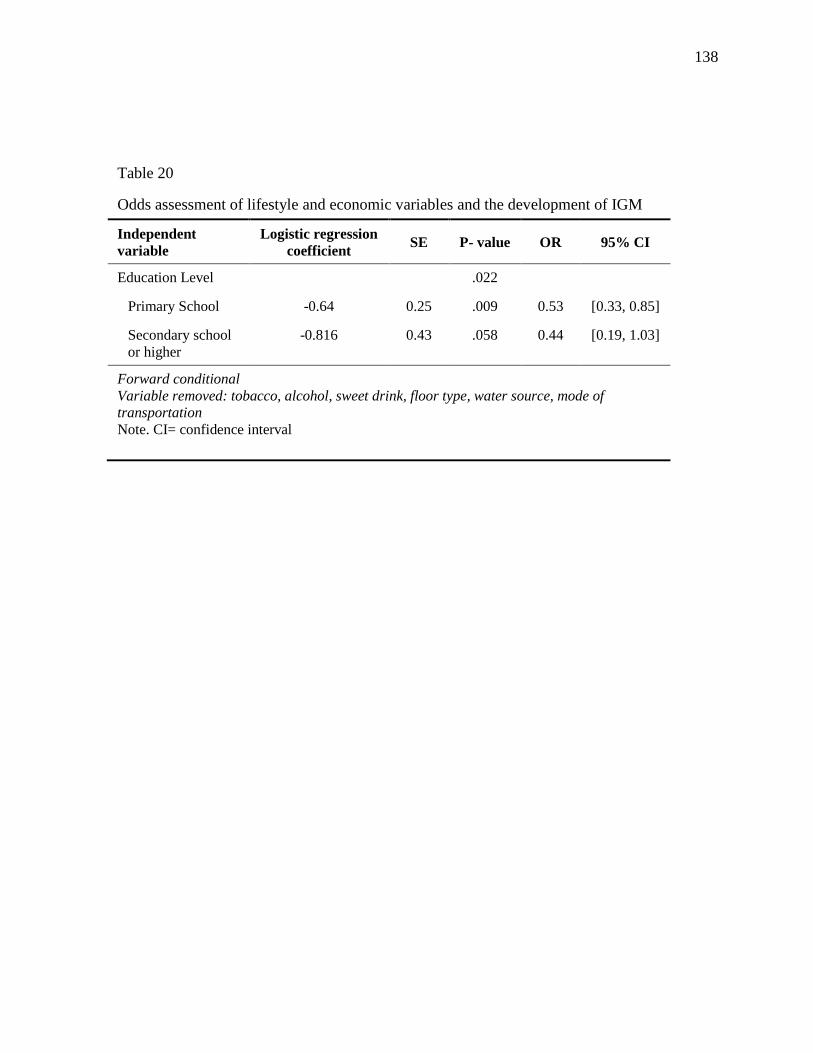
138
Table 20
Odds assessment of lifestyle and economic variables and the development of IGM
Independent
variable
Logistic regression
coefficient SE P- value OR 95% CI
Education Level .022
Primary School -0.64 0.25 .009 0.53 [0.33, 0.85]
Secondary school
or higher
-0.816 0.43 .058 0.44 [0.19, 1.03]
Forward conditional
Variable removed: tobacco, alcohol, sweet drink, floor type, water source, mode of
transportation
Note. CI= confidence interval
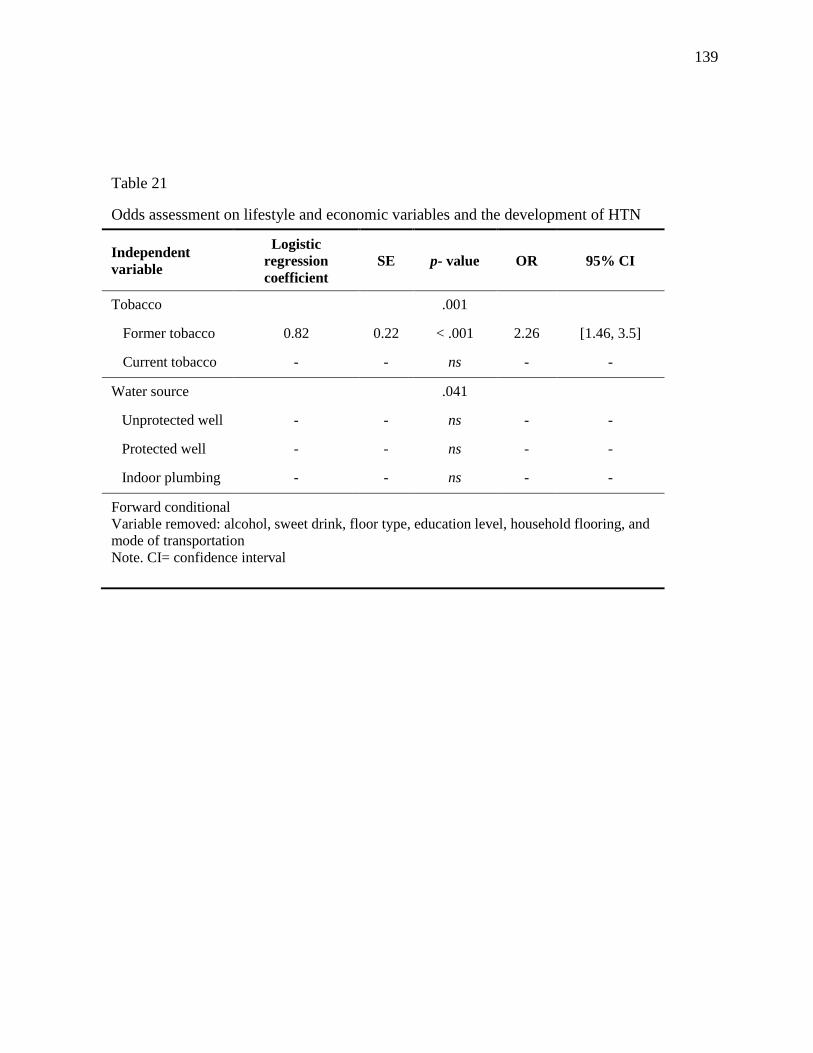
139
Table 21
Odds assessment on lifestyle and economic variables and the development of HTN
Independent
variable
Logistic
regression
coefficient
SE p- value OR 95% CI
Tobacco .001
Former tobacco 0.82 0.22 < .001 2.26 [1.46, 3.5]
Current tobacco - - ns - -
Water source .041
Unprotected well - - ns - -
Protected well - - ns - -
Indoor plumbing - - ns - -
Forward conditional
Variable removed: alcohol, sweet drink, floor type, education level, household flooring, and
mode of transportation
Note. CI= confidence interval
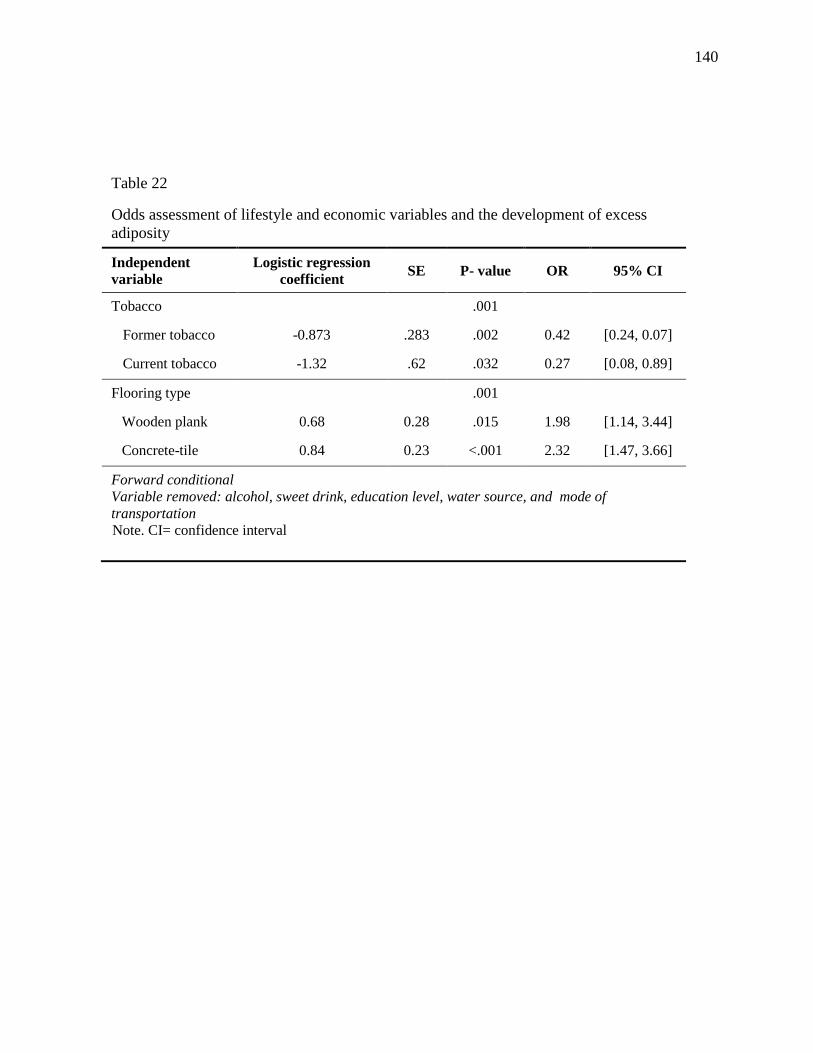
140
Table 22
Odds assessment of lifestyle and economic variables and the development of excess
adiposity
Independent
variable
Logistic regression
coefficient SE P- value OR 95% CI
Tobacco .001
Former tobacco -0.873 .283 .002 0.42 [0.24, 0.07]
Current tobacco -1.32 .62 .032 0.27 [0.08, 0.89]
Flooring type .001
Wooden plank 0.68 0.28 .015 1.98 [1.14, 3.44]
Concrete-tile 0.84 0.23 <.001 2.32 [1.47, 3.66]
Forward conditional
Variable removed: alcohol, sweet drink, education level, water source, and mode of
transportation
Note. CI= confidence interval
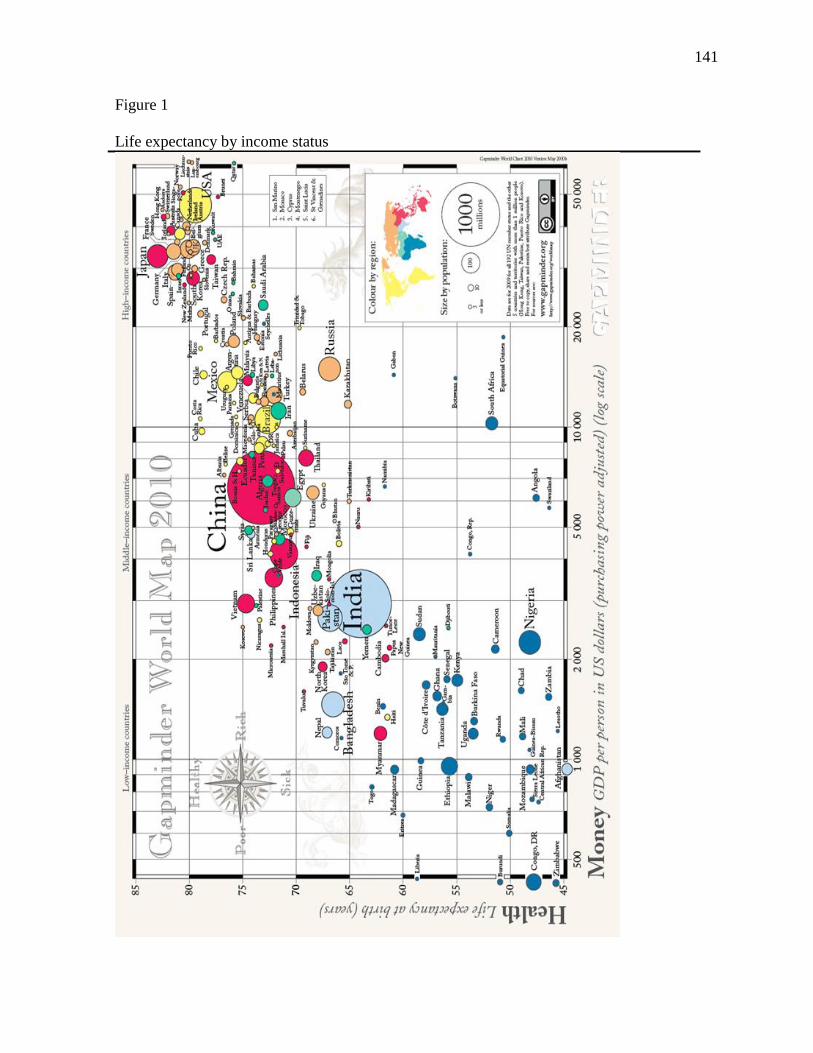
141
Figure 1
Life expectancy by income status
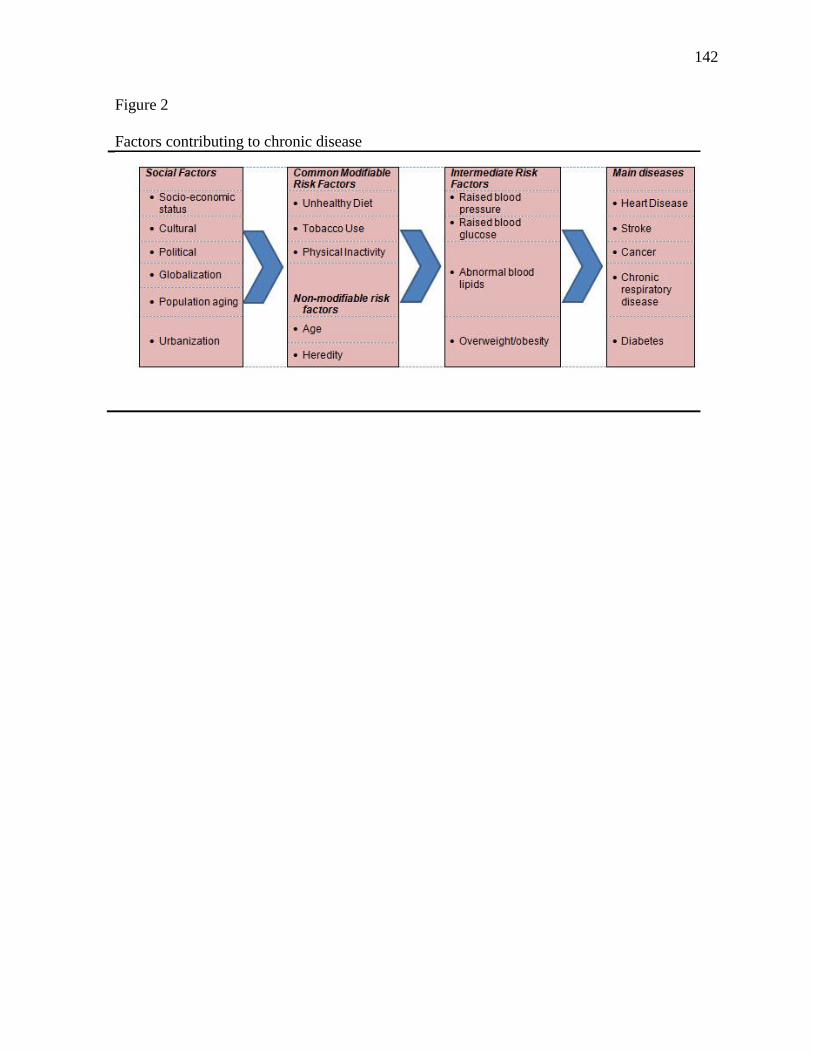
142
Figure 2
Factors contributing to chronic disease
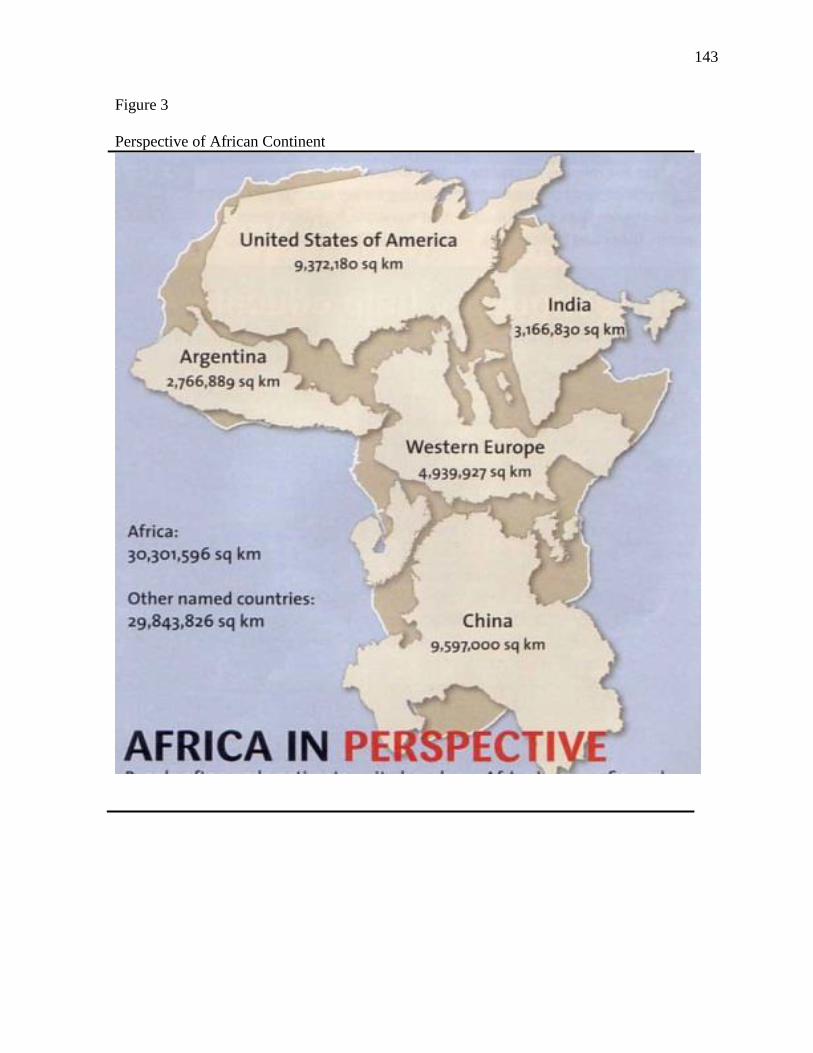
143
Figure 3
Perspective of African Continent
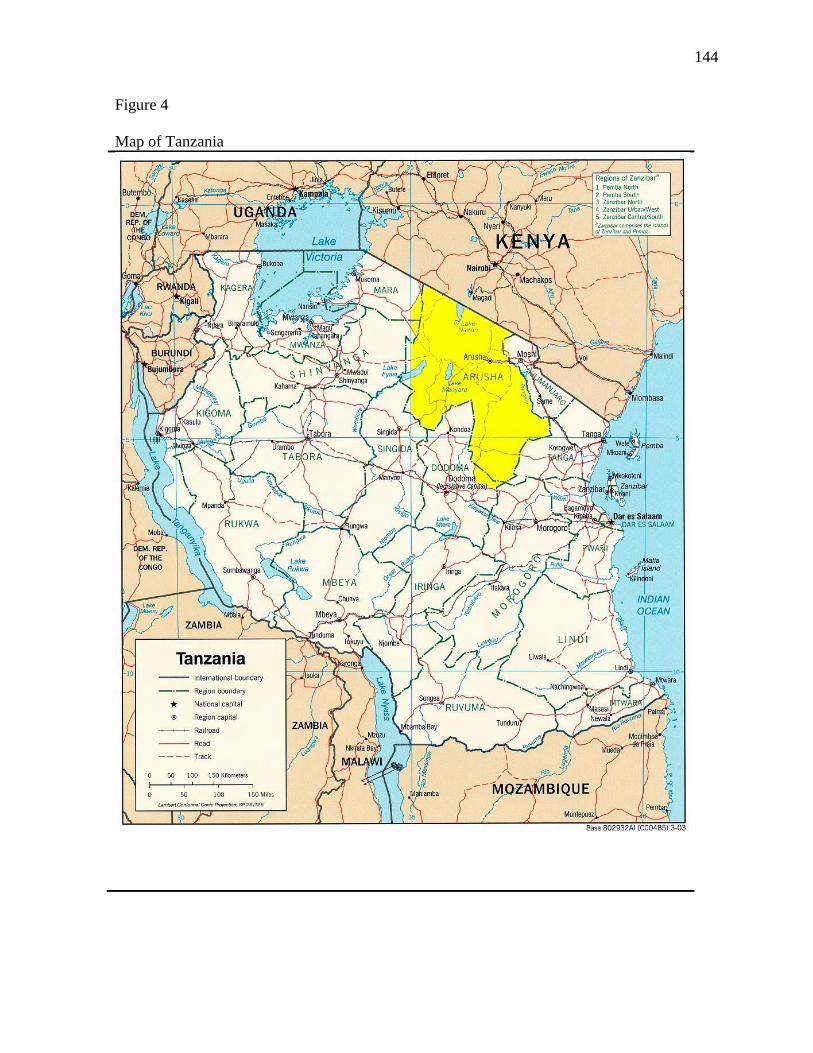
144
Figure 4
Map of Tanzania
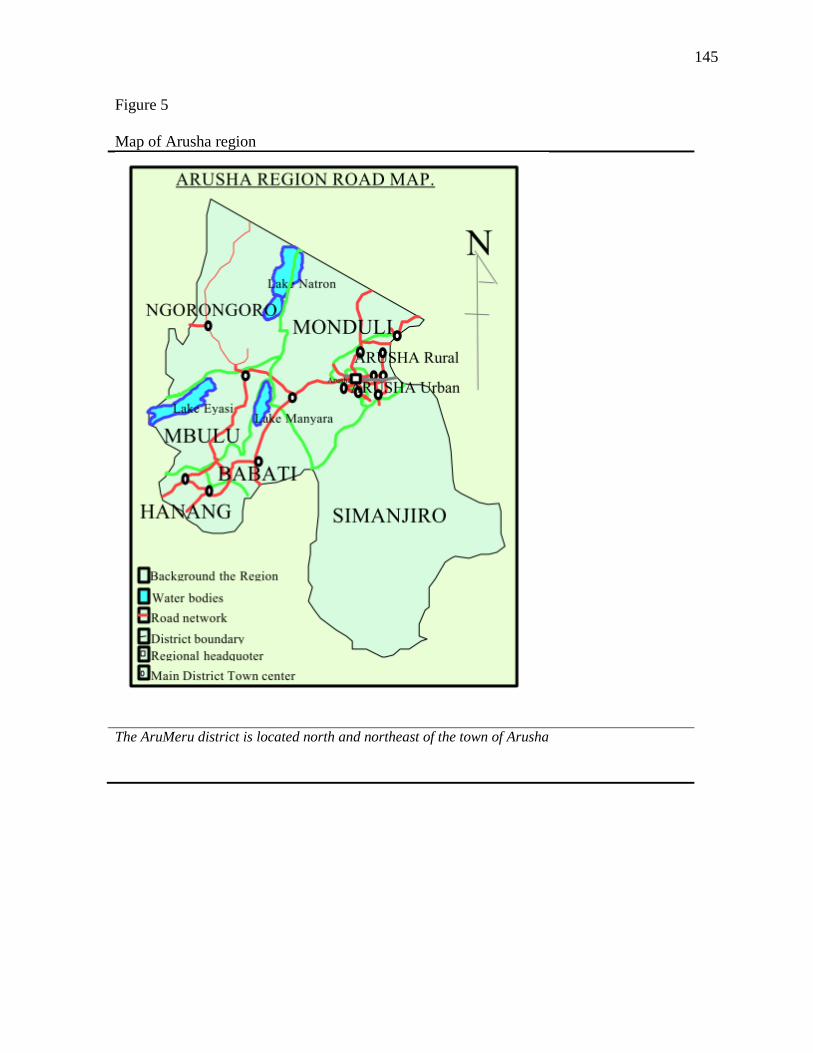
145
Figure 5
Map of Arusha region
The AruMeru district is located north and northeast of the town of Arusha
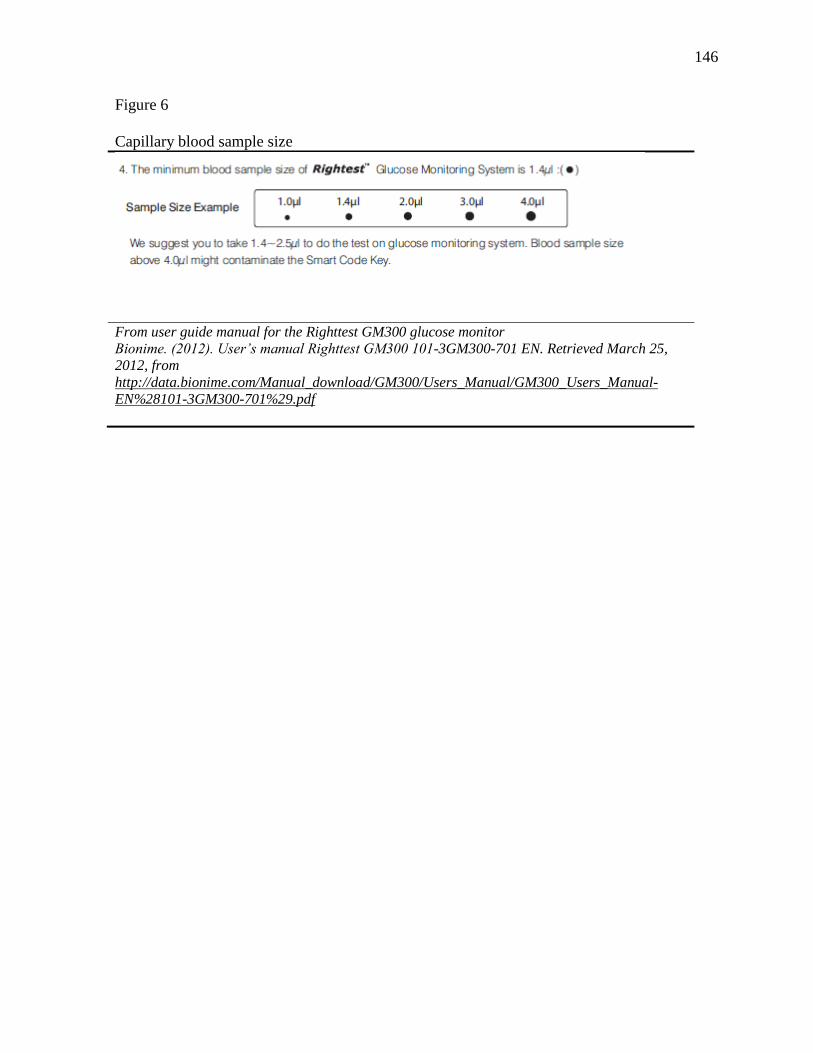
146
Figure 6
Capillary blood sample size
From user guide manual for the Righttest GM300 glucose monitor
Bionime. (2012). User’s manual Righttest GM300 101-3GM300-701 EN. Retrieved March 25,
2012, from
http://data.bionime.com/Manual_download/GM300/Users_Manual/GM300_Users_Manual-
EN%28101-3GM300-701%29.pdf
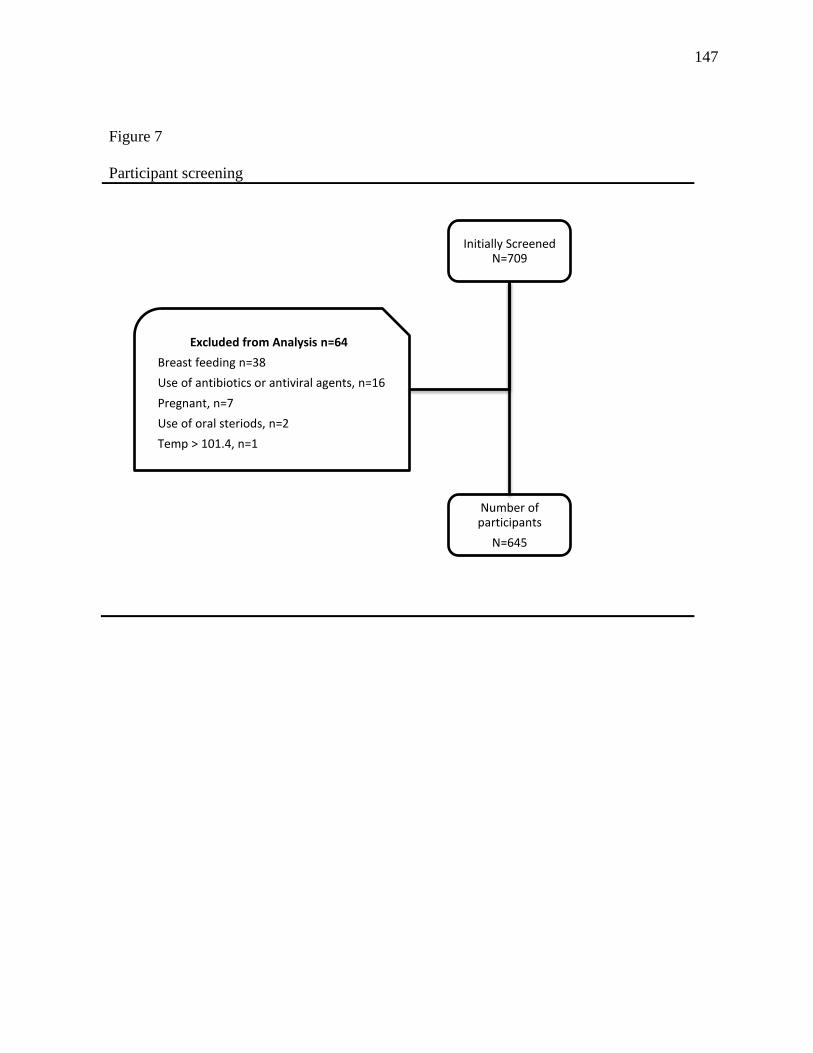
147
Figure 7
Participant screening
Initially Screened N=709
Number of participants
N=645
Excluded from Analysis n=64
Breast feeding n=38
Use of antibiotics or antiviral agents, n=16
Pregnant, n=7
Use of oral steriods, n=2
Temp > 101.4, n=1
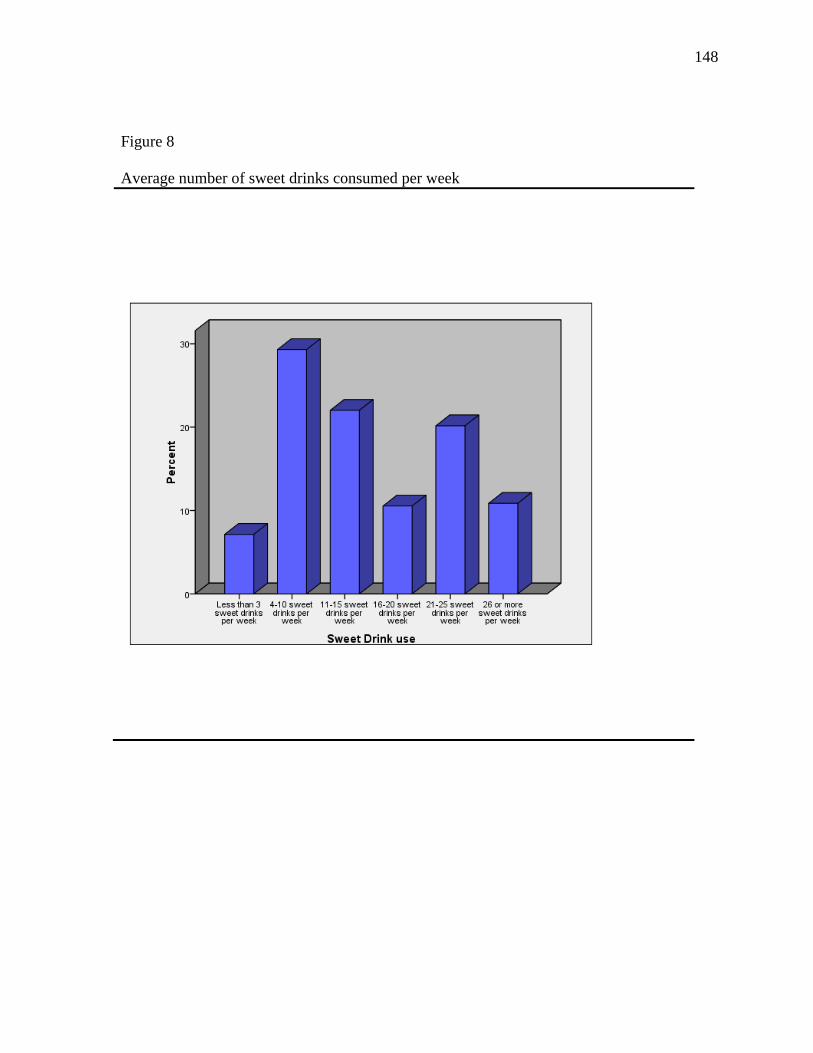
148
Figure 8
Average number of sweet drinks consumed per week