Embed Size (px)
Citation preview

Tyler Technologies
Appraisal & Tax Division
Final Documentation
Town of Sprague
October 30, 2012
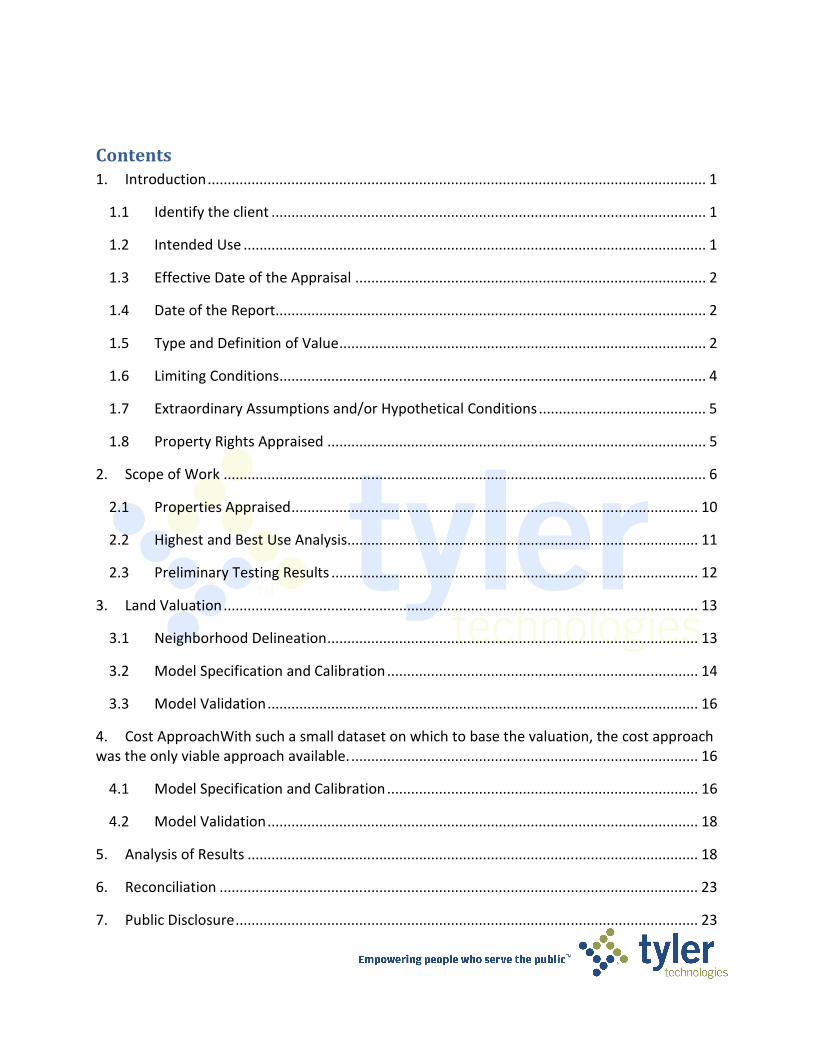
Contents
1. Introduction ............................................................................................................................. 1
1.1 Identify the client ............................................................................................................. 1
1.2 Intended Use .................................................................................................................... 1
1.3 Effective Date of the Appraisal ........................................................................................ 2
1.4 Date of the Report ............................................................................................................ 2
1.5 Type and Definition of Value ............................................................................................ 2
1.6 Limiting Conditions ........................................................................................................... 4
1.7 Extraordinary Assumptions and/or Hypothetical Conditions .......................................... 5
1.8 Property Rights Appraised ............................................................................................... 5
2. Scope of Work ......................................................................................................................... 6
2.1 Properties Appraised ...................................................................................................... 10
2.2 Highest and Best Use Analysis........................................................................................ 11
2.3 Preliminary Testing Results ............................................................................................ 12
3. Land Valuation ....................................................................................................................... 13
3.1 Neighborhood Delineation ............................................................................................. 13
3.2 Model Specification and Calibration .............................................................................. 14
3.3 Model Validation ............................................................................................................ 16
4. Cost ApproachWith such a small dataset on which to base the valuation, the cost approach
was the only viable approach available. ....................................................................................... 16
4.1 Model Specification and Calibration .............................................................................. 16
4.2 Model Validation ............................................................................................................ 18
5. Analysis of Results ................................................................................................................. 18
6. Reconciliation ........................................................................................................................ 23
7. Public Disclosure .................................................................................................................... 23
8. Certification ........................................................................................................................... 24
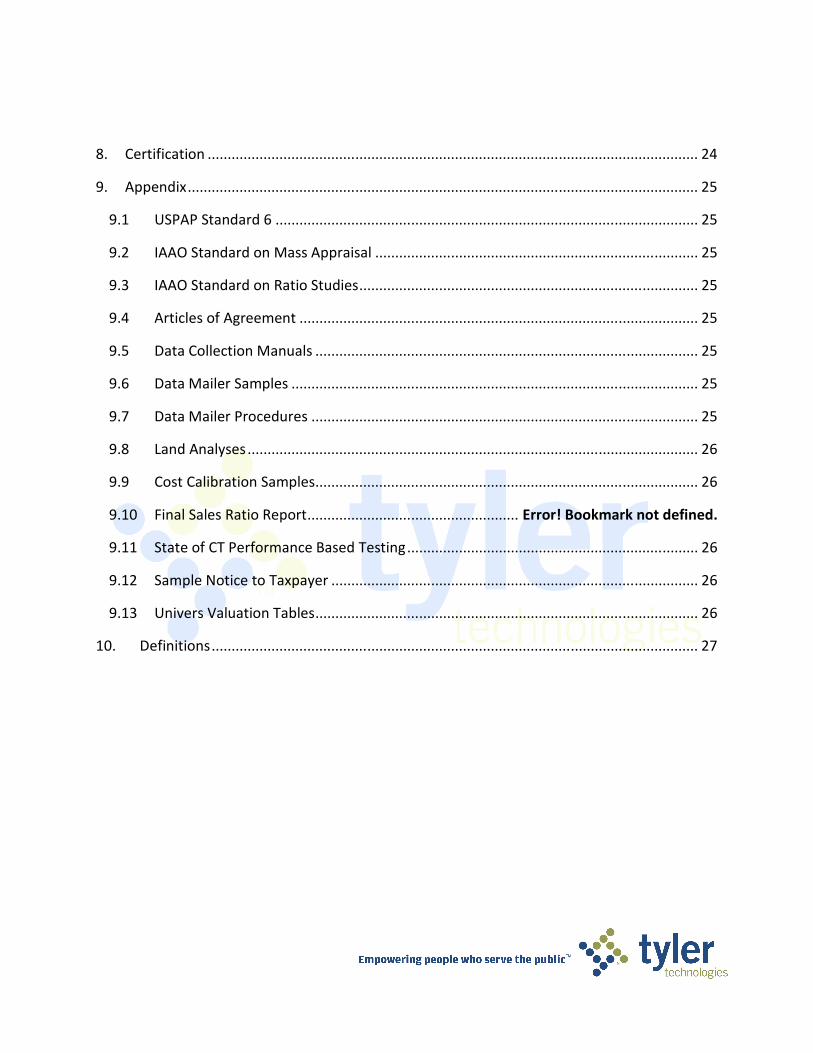
9. Appendix ................................................................................................................................ 25
9.1 USPAP Standard 6 .......................................................................................................... 25
9.2 IAAO Standard on Mass Appraisal ................................................................................. 25
9.3 IAAO Standard on Ratio Studies ..................................................................................... 25
9.4 Articles of Agreement .................................................................................................... 25
9.5 Data Collection Manuals ................................................................................................ 25
9.6 Data Mailer Samples ...................................................................................................... 25
9.7 Data Mailer Procedures ................................................................................................. 25
9.8 Land Analyses ................................................................................................................. 26
9.9 Cost Calibration Samples ................................................................................................ 26
9.10 Final Sales Ratio Report ..................................................... Error! Bookmark not defined.
9.11 State of CT Performance Based Testing ......................................................................... 26
9.12 Sample Notice to Taxpayer ............................................................................................ 26
9.13 Univers Valuation Tables ................................................................................................ 26
10. Definitions .......................................................................................................................... 27
S p r a g u e , C T F i n a l P r o j e c t D o c u m e n t a t i o n
P a g e | 1
1. Introduction The Town of Sprague last revalued properties in 2005. Per Connecticut General Statute,
values have been updated for October 1, 2012, seven years subsequent to the last
valuation. The assessments reflect 70% of fair market or use value in the case of properties
classified under Public Act 490. In addition to the update to values, approximately 50% of
the properties in town were fully inspected. In addition, data mailers were sent to each
property, so the property inventory can be considered current. These assessments will be
the basis for the October 1, 2012 Grand List on which the July, 2013 real estate tax liability
will be based.
The mathematical calculation involved in determining an individual’s tax liability is a
function of three key components: the taxable amount (assessed value less exemptions =
taxable amount), the funding requirement of each taxing jurisdiction in which the property
is located, and most importantly, the proportional taxable value of the property in relation
to the taxable value of all properties (residential, agricultural, commercial, industrial,
utilities, etc.) within each taxing jurisdiction.
While the real estate makes up a good part of the assessed value in the grand list, the
motor vehicle and personal property contribute as well. Once the list is completed, the
budget is set, determining the funding requirements for town services for the coming year,
minus any revenue from sources other than the property tax. The mill rate is a function of
the two:
Remaining Funding Requirement ÷ Net Assessed Value = Mill Rate
1.1 Identify the client
On January 25, 2011, the Northeast Connecticut Council of Governments (NECCOG)
entered into a contract with Tyler Technologies for services relating to the revaluation of
property within the borders of its member towns. On February 17, 2012, the First
Amendment to this agreement was signed admitting the Town of Sprague as a member
town. These articles of agreement are included in the Appendix.
1.2 Intended Use
The “Assessment Law & Procedure, 2008 Edition” advises us regarding a revaluation or
reassessment as follows:
“In general, a countywide reassessment would involve the following action: a
determination of market value including a review of recent transfers of real estate within
the neighboring area, a visual inspection of the exterior appearance of the property in
question, and a correlation of any other unique factors that may affect the valuation of
the real estate. The assessor would correlate these factors and, through the use of his or
S p r a g u e , C T F i n a l P r o j e c t D o c u m e n t a t i o n
P a g e | 2
her expertise and training, arrive at an estimate of what the fair market value of the
property would be.”
Therefore, a reassessment is a systematic analysis of all assessments. This analysis is
intended to assure that assessments are at the stated uniform percentage of value as of
the valuation date of the assessment roll upon which the assessments appear, as
confirmed by statistical testing following mass appraisal industry standards.
The reassessment was undertaken to establish an equitable and scientific system of
assessing property for taxation and has been conducted in compliance with Uniform
Standards of Professional Appraisal Practice (USPAP) Standard 6: Mass Appraisal,
Development and Reporting.
The services and recommendations of value performed for this appraisal assignment are
intended for the exclusive use of the Sprague Assessor in establishing assessments for ad
valorem tax purposes. Any use other than that stated above is not authorized nor
intended. Most specifically excluded is an opinion of value for federally related real estate
transactions or other mortgage lending purposes.
1.3 Effective Date of the Appraisal
The effective date of appraisal as to level of value is October 1, 2012. The effective date of
appraisal as to parcel inventory is also October 1, 2012. The values and inventory are to be
used as the basis for the October 1, 2012 grand list. The final list will reflect changes made
to the assessments as a result of exemptions, new P.A. 490 classifications, and appeals. The
signing of the list will occur in January of 2013.
Parcel inventory refers to the physical characteristics of the real estate as of the effective
date of appraisal. This would include the characteristics of the land such as size, as well as
the improvements to the land – homes, outbuildings, and other structures.
All Sprague real estate was appraised at fair market value at a value level as of October 1,
2012. Sales and other economic activity from April 1, 2010 through September 30, 2012
formed the predominance of market evidence.
1.4 Date of the Report
This report is dated October 30, 2012, in draft form. The final report was completed
January 13, 2013.
1.5 Type and Definition of Value
The goal of the reassessment was to estimate "market value" for all real properties in
Sprague according to Connecticut law. The International Association of Assessing Officers
(IAAO) defines “market value” (IAAO’s “Standard on Ratio Studies,” Assessment Journal,
Sept./Oct. 1999, p. 60) as follows. Market value is defined as "the most probable price
which a property should bring in a competitive and open market under all conditions
S p r a g u e , C T F i n a l P r o j e c t D o c u m e n t a t i o n
P a g e | 3
requisite to a fair sale, the buyer and seller, each acting prudently and knowledgeably, and
assuming the price is not affected by undue stimulus. Implicit in this definition is the
consummation of a sale as of a specified date and the passing of title from seller to buyer
under conditions whereby:
1. Buyer and seller are typically motivated;
2. Both parties are well informed or well advised, and acting in what they consider their
own best interests;
3. A reasonable time is allowed for exposure in the open market;
4. Payment is made in terms of cash in U.S. dollars or in terms of financial arrangements
comparable thereto; and
5. The price represents the normal consideration for the property sold unaffected by
special or creative financing or sales concessions granted by anyone associated with
the sale."
The valuation methods appropriate to the class of property were computed on a property-
by-property basis. Due to a lack of sales and income and expense data available for
analysis, reports were generated that provided the "replacement cost” method only.
The property valuation analyst conducted a number of studies to gain an understanding of
the market dynamics at work in the town. The process began with collecting and verifying
sales price and date for each property sale within a two-year period. Sales that were not
"arms length" or were non-representative were noted and set aside. Valid sales were
analyzed, however a lack of useable, representative sales prevented a meaningful sales
comparison approach from being developed.
The second method used for estimating market value is called the "income approach."
With this method the income and expense stream of a property is examined from an
investor’s point of view. The goal is to achieve a market value estimate by approximating
what an informed investor would pay for the income stream associated with a particular
piece of real estate. The income approach was applied as a supporting approach for
commercial properties such as apartments, restaurants, shopping plazas, etc that
submitted data. It was not used as the primary approach since there was inadequate
supporting data for market rents, vacancy and expense rates upon which to model.
The third method for estimating probable selling price was to consider how much it would
cost to provide a replacement building of similar condition, quality, and utility. Local
construction costs were analyzed along with land sales to develop what is called the
"replacement cost" method. This method is based on the premise that if land value is
added to what it would cost to replace the building new, less an allowance for physical,
functional, and economic depreciations, a rational estimate of market value can be
obtained. Again, a mathematical model of this process was developed and calibrated to
S p r a g u e , C T F i n a l P r o j e c t D o c u m e n t a t i o n
P a g e | 4
market activity in Sprague. The so-called "cost approach" is the primary methodology for
all classes of properties in Sprague.
1.6 Limiting Conditions
• The properties were assumed to be free of any and all liens and encumbrances.
Each property has also been appraised as though under responsible ownership and
competent management.
• Surveys of the assessed properties have not been provided. We have relied upon
tax maps and other materials in the course of estimating physical dimensions and
the acreage associated with assessed properties.
• We assume the utilization of the land and any improvements is located within the
boundaries of the property described. It is assumed that there are no adverse
easements or encroachments for any parcel that have not already been addressed
in the mass appraisal.
• In the preparation of the mass appraisal, inspections have not been made for
approximately 50% or the parcels of property included in this report, per contract.
Inspections of the remaining 50% were for both the exterior and interior, when
permitted. For properties without an interior inspection, it is assumed that the
condition of the interior is similar to its exterior condition, unless the assessor has
received additional information from qualified sources giving more specific detail
about the interior condition.
• Property inspection dates will have ranged in time from both before and after the
appraisal date. It is assumed that there has been no material change in condition
from the latest property inspection, unless otherwise noted on individual property
records retained in the assessor’s office.
• We assume that there are no hidden or unapparent conditions associated with the
properties, subsoil, or structures, which would render the properties (land and/or
improvements) more or less valuable.
• It is assumed that the properties and/or the landowners are in full compliance with
all applicable federal, state, and local environmental regulations and laws.
• It is assumed that all applicable zoning and use regulations have been complied
with.
• It is assumed that all required licenses, certificates of occupancy, consents, or other
instruments of legislative or administrative authority from any private, local, state,
or national government entity have been obtained for any use on which the value
opinions contained within this report are based.
S p r a g u e , C T F i n a l P r o j e c t D o c u m e n t a t i o n
P a g e | 5
• We have not been provided a hazardous condition’s report, nor are we qualified to
detect hazardous materials. Therefore, evidence of hazardous materials, which may
or may not be present on a property, was not observed. As a result, the final
opinion of value is predicated upon the assumption that there is no such material
on any of the properties that might result in a loss, or change in value.
• Information, estimates, and opinions furnished to the appraisers and incorporated
into the analysis and final report were obtained from sources assumed to be
reliable, and a reasonable effort has been made to verify such information.
However, no warranty is given for the reliability of this information.
• The Americans with Disabilities Act (ADA) became effective January 26, 1992. We
have not made compliance surveys nor conducted a specific analysis of any
property to determine if it conforms to the various detailed requirements identified
in the ADA. It is possible that such a survey might identify nonconformity with one
or more ADA requirements, which could lead to a negative impact on the value of
the property(s). Because such a survey has not been requested and is beyond the
scope of this appraisal assignment, we did not take into consideration adherence or
non-adherence to ADA in the valuation of the properties addressed in this report.
• Possession of this report does not carry with it the right of reproduction, and
disclosure of this report is governed by the rules and regulations of the Office and
Policy and Management and is subject to jurisdictional exception and the laws of
the State of Connecticut.
1.7 Extraordinary Assumptions and/or Hypothetical Conditions
No extraordinary assumptions or hypothetical conditions apply.
1.8 Property Rights Appraised
Appraisals are based on fee simple ownership, even when other rights, such as leased-fee,
exist.
S p r a g u e , C T F i n a l P r o j e c t D o c u m e n t a t i o n
P a g e | 6
2. Scope of Work Per the specifications of the Request for Proposal from NECCOG, fifty percent (50%) of the
properties were subject to inspection, not including data mailer or building permit inspections.
The process is described below, and in greater detail in the Data Collection Manuals included in
the Appendix. In addition, data or property inventory mailers were mailed to each property
owner, including those that were not inspected. The data mailer procedures are also described
below and in detail in the Data Mailer Procedures which are included in the Appendix.
In addition to property data, economic data such as sales and income and expense information
was gathered, analyzed and used to formulate valuation models that reflect the current market
in Sprague. Once these models were developed and tested against the known sales, they were
applied to the population of properties and reviewed in the field by a review appraiser certified
by the State of Connecticut for reasonableness and consistency of model application. This
review was done in accordance with the Final Review Procedures which are included in the
Appendix.
Data Collection - Property Data
Data collection cards were printed for selected parcels from the Town’s IAS database. The
computer-generated documents were then organized in work packs by map for field data
collection activity and process control. Parcels within the work packs are sorted by street location.
In order to assign a value to vacant or improved land throughout the town, each parcel had its
land type coded for description purposes. Land was allocated as follows:
o Primary – Buildable lot up to one acre
o Secondary – For parcels with excess road frontage
o Excess – Parcels with no frontage, or the land remaining after the primary lot is extracted
o Waste – Primarily wetlands, ledge or other topography that makes the land unusable for
most purposes
A basic determination for unimproved land was whether or not the parcel was buildable.
Topography, shape, size, road access, and legal permissibility were considered in this
determination. The appraiser reviewed each parcel for these influences and coded the land
accordingly. Zoning restrictions were also considered when valuing vacant parcels.
Influence factors and land grades were used for pond or riverfront, golf course or water views,
location, traffic, minor topography, or access issues.
Per Sprague requirements, data for residential properties was collected on site unless the
property was inaccessible, the occupants refused to cooperate, or the premises or occupants
appeared dangerous or threatening. The following is a summary of collection procedures
followed during the data collection process.
S p r a g u e , C T F i n a l P r o j e c t D o c u m e n t a t i o n
P a g e | 7
1. The data collector visually collected the land data, topographical data, utilities data,
and street or road data.
2. For improved property, the data collector attempted to contact an adult occupant to
seek permission to inspect the interior of the improvement and to measure the
exterior.
3. If an occupant was present and permission granted, an interior inspection was made,
and the improvement measurements were verified. When discrepancies were found,
the exterior was measured.
4. If no interior inspection was possible, exterior data was verified and interior data was
estimated.
5. The data collector also verified any auxiliary buildings and yard improvement data.
6. If an inspection was not allowed or possible, data was estimated on site from existing
assessment records.
7. The data collector double checked all entries for completion and accuracy and
proceeded to the next property.
8. A second call was made, on a different day as the initial call, for any property for
which entry was not gained.
9. Upon completion of a work pack, the data collector pulled any incomplete records
before returning it to the crew chief.
Data collection procedures for commercial and industrial properties were similar to those for
residential properties. Exempt properties were also collected similarly based upon the type of
improvement.
In addition to collecting land data, story height, exterior wall construction, additions, and other
observable property characteristics, the following are examples of types of data that may have
been noted for commercial properties: DBA (e.g. Dunkin’ Donuts), wall height, construction
type and use (purpose of the building).
Callback letters were mailed to property owners for which entry was not gained and
appointments set up to complete the interior inspection.
Tyler conducted comprehensive quality control procedures for all phases of the project,
including field, office, and data entry audits.
The field supervisor performed a quality control audit of randomly selected parcels during data
collection. All noted errors were corrected prior to returning the work pack to the office.
S p r a g u e , C T F i n a l P r o j e c t D o c u m e n t a t i o n
P a g e | 8
As field data collection, quality control, and error resolution were completed, work packs were
then routed to data entry staff for encoding of all property characteristic data that had been
modified or collected.
Data entry audits included omissions of required data elements, correct identification and
mathematical closure of sketch components, and correlation of reasonableness of related
features, such as the presence or absence of a basement or upper floors, if indicated elsewhere on
the record. In other words, audits identified entries that didn’t make sense. All noted computer
generated audit errors were first verified for possible data entry operator error and then returned
to the data collector for error correction.
Quality control checks of the data entry were also performed to ensure the accurate posting of
changes to the database.
Finally, all field data collection activity was subjected to a visual quality control field review
performed by the review appraiser as part of the final review process. This review had the primary
purpose of verifying quality grade, condition ratings, and neighborhood assignments.
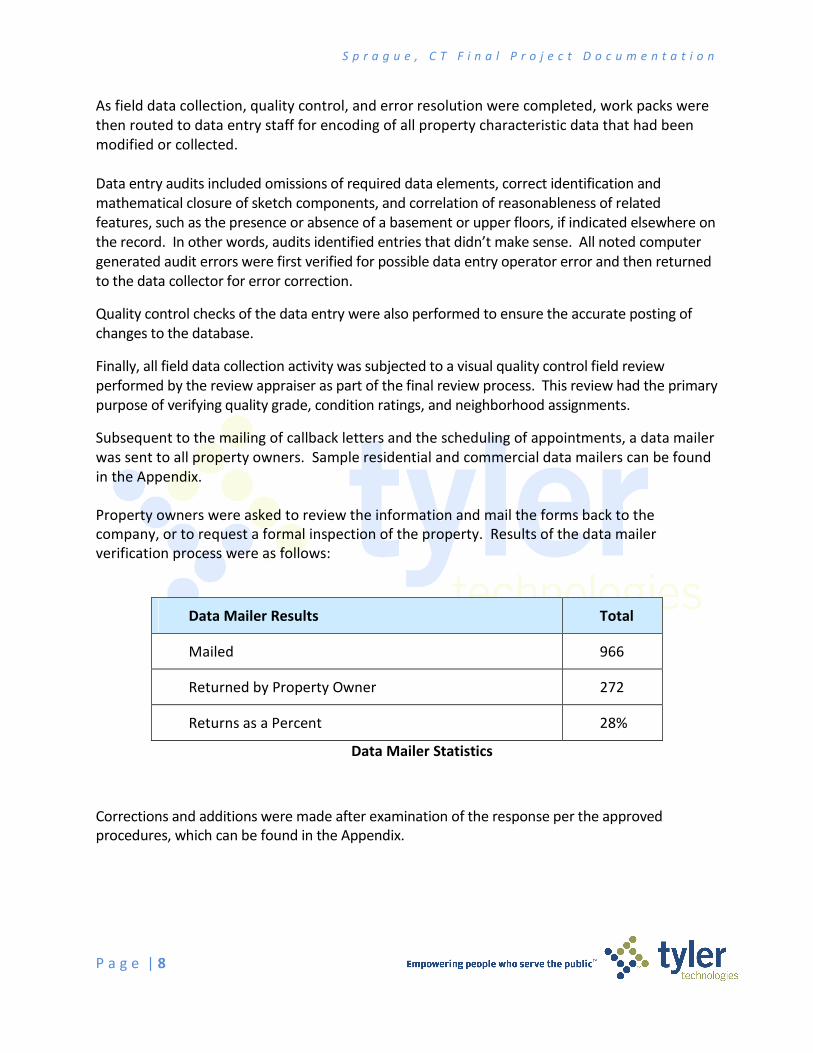
Subsequent to the mailing of callback letters and the scheduling of appointments, a data mailer
was sent to all property owners. Sample residential and commercial data mailers can be found
in the Appendix.
Property owners were asked to review the information and mail the forms back to the
company, or to request a formal inspection of the property. Results of the data mailer
verification process were as follows:
Data Mailer Results Total
Mailed 966
Returned by Property Owner 272
Returns as a Percent 28%
Data Mailer Statistics
Corrections and additions were made after examination of the response per the approved
procedures, which can be found in the Appendix.
S p r a g u e , C T F i n a l P r o j e c t D o c u m e n t a t i o n
P a g e | 9
Data Collection - Economic Data
Economic data to be used in analysis and valuation falls into three major categories: sales,
construction costs, and rental property income and expense. The sales data was used in the
analysis of the local market and in the construction of valuation models for residential property.
Commercial, industrial, and apartment properties also use sales as part of the valuation
process, but rely more heavily on the income approach to value, which utilizes rents and
expenses. All properties are valued by the cost approach as either the primary or secondary
approach and so the cost tables within the CAMA system required calibration to local
construction costs.
Sales Data Collection: Sales were updated as they occurred. Changes included ownership
changes, mailing address changes and splits and merges.
Some sales are not indicative of fair market value and need to be coded as such. For example,
sales may be between relatives or former relatives, related companies or partners in business,
represent a sale of a partial interest in the property, or include significant personal property or
a business. In addition, sales of foreclosed properties are not considered arms-length
transactions and were not included in the sales listing for state certification.
Upon receipt of sales data from the Town, the appraiser continued the review of the data
through a process known as sales validation. Sales were reviewed for validity through field
review, property owner or seller interviews, and the production and review of reports
identifying sales that appeared to be extremes in their areas. Local knowledge provided by the
Assessor was particularly helpful in this activity.
The process was designed to build a database of sales with proper validation codes for use in
analysis at any point in time in the project.
Construction Costs: In order to apply the cost approach to value, the appraiser must estimate
the replacement cost new (RCN) of improvements to the land before considering accrued
depreciation and the addition of the land value. The CAMA system contains base cost tables for
houses, all types of commercial buildings, outbuildings such as sheds and garages, and for
amenities such as fireplaces and bathrooms. These base tables were calibrated to the Sprague
market through a cost study.
Rental Property Income and Expense: Income and Expense statements collected for 2010 and
2011 by the Assessor’s office were reconstructed, stratified by use and the results analyzed to
produce the income models used for this project. As this data is confidential, the analysis is not
included in this documentation and is not available for public inspection.
S p r a g u e , C T F i n a l P r o j e c t D o c u m e n t a t i o n
P a g e | 10
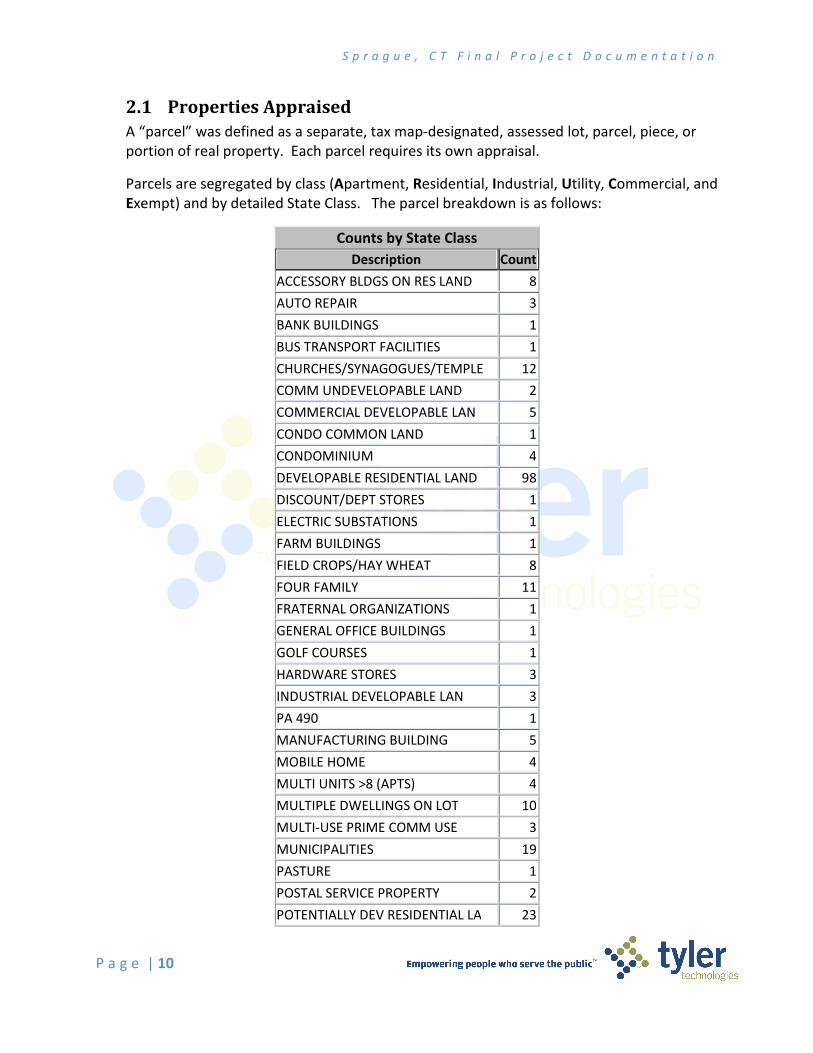
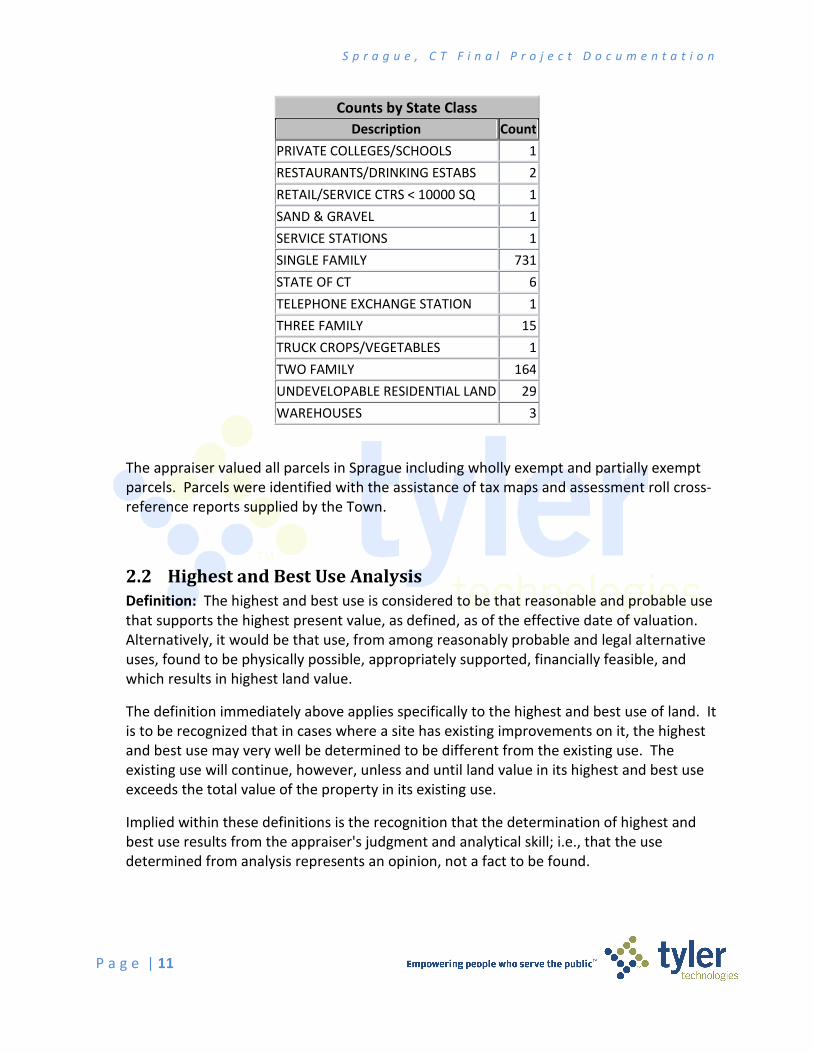
2.1 Properties Appraised
A “parcel” was defined as a separate, tax map-designated, assessed lot, parcel, piece, or
portion of real property. Each parcel requires its own appraisal.
Parcels are segregated by class (Apartment, Residential, Industrial, Utility, Commercial, and
Exempt) and by detailed State Class. The parcel breakdown is as follows:
Counts by State Class
Description Count
ACCESSORY BLDGS ON RES LAND 8
AUTO REPAIR 3
BANK BUILDINGS 1
BUS TRANSPORT FACILITIES 1
CHURCHES/SYNAGOGUES/TEMPLE 12
COMM UNDEVELOPABLE LAND 2
COMMERCIAL DEVELOPABLE LAN 5
CONDO COMMON LAND 1
CONDOMINIUM 4
DEVELOPABLE RESIDENTIAL LAND 98
DISCOUNT/DEPT STORES 1
ELECTRIC SUBSTATIONS 1
FARM BUILDINGS 1
FIELD CROPS/HAY WHEAT 8
FOUR FAMILY 11
FRATERNAL ORGANIZATIONS 1
GENERAL OFFICE BUILDINGS 1
GOLF COURSES 1
HARDWARE STORES 3
INDUSTRIAL DEVELOPABLE LAN 3
PA 490 1
MANUFACTURING BUILDING 5
MOBILE HOME 4
MULTI UNITS >8 (APTS) 4
MULTIPLE DWELLINGS ON LOT 10
MULTI-USE PRIME COMM USE 3
MUNICIPALITIES 19
PASTURE 1
POSTAL SERVICE PROPERTY 2
POTENTIALLY DEV RESIDENTIAL LA 23
S p r a g u e , C T F i n a l P r o j e c t D o c u m e n t a t i o n
P a g e | 11
Counts by State Class
Description Count
PRIVATE COLLEGES/SCHOOLS 1
RESTAURANTS/DRINKING ESTABS 2
RETAIL/SERVICE CTRS < 10000 SQ 1
SAND & GRAVEL 1
SERVICE STATIONS 1
SINGLE FAMILY 731
STATE OF CT 6
TELEPHONE EXCHANGE STATION 1
THREE FAMILY 15
TRUCK CROPS/VEGETABLES 1
TWO FAMILY 164
UNDEVELOPABLE RESIDENTIAL LAND 29
WAREHOUSES 3
The appraiser valued all parcels in Sprague including wholly exempt and partially exempt
parcels. Parcels were identified with the assistance of tax maps and assessment roll cross-
reference reports supplied by the Town.
2.2 Highest and Best Use Analysis
Definition: The highest and best use is considered to be that reasonable and probable use
that supports the highest present value, as defined, as of the effective date of valuation.
Alternatively, it would be that use, from among reasonably probable and legal alternative
uses, found to be physically possible, appropriately supported, financially feasible, and
which results in highest land value.
The definition immediately above applies specifically to the highest and best use of land. It
is to be recognized that in cases where a site has existing improvements on it, the highest
and best use may very well be determined to be different from the existing use. The
existing use will continue, however, unless and until land value in its highest and best use
exceeds the total value of the property in its existing use.
Implied within these definitions is the recognition that the determination of highest and
best use results from the appraiser's judgment and analytical skill; i.e., that the use
determined from analysis represents an opinion, not a fact to be found.
S p r a g u e , C T F i n a l P r o j e c t D o c u m e n t a t i o n
P a g e | 12
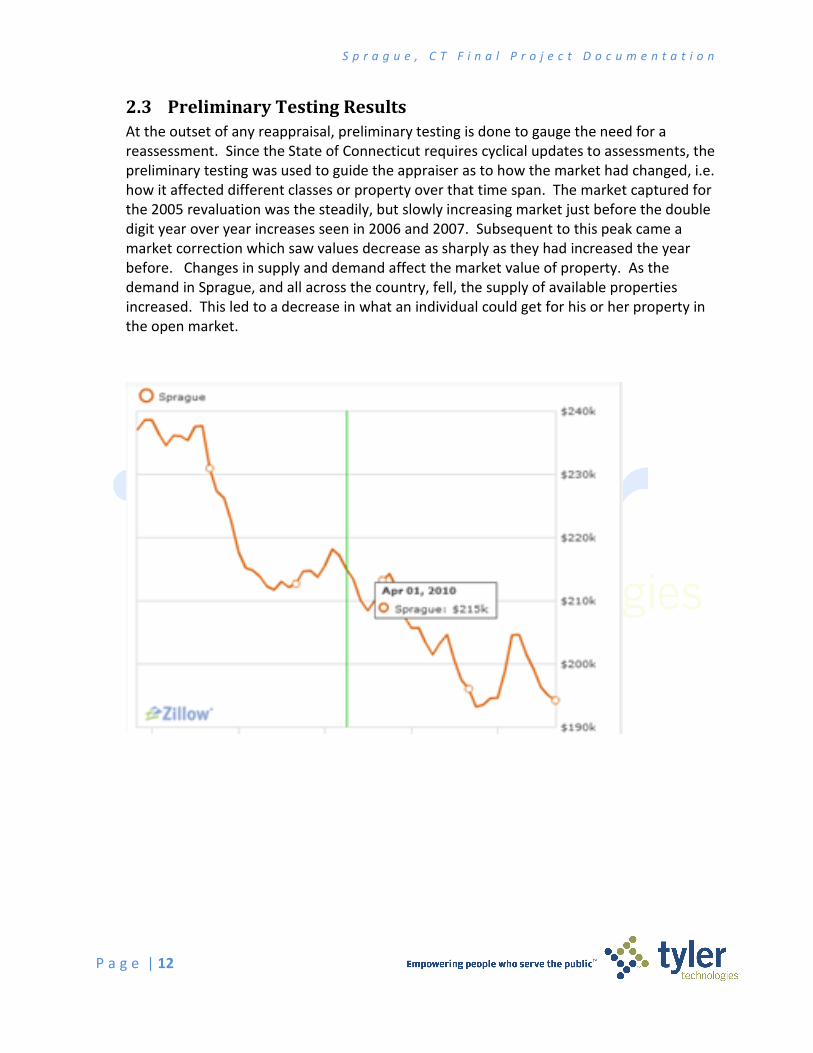
2.3 Preliminary Testing Results
At the outset of any reappraisal, preliminary testing is done to gauge the need for a
reassessment. Since the State of Connecticut requires cyclical updates to assessments, the
preliminary testing was used to guide the appraiser as to how the market had changed, i.e.
how it affected different classes or property over that time span. The market captured for
the 2005 revaluation was the steadily, but slowly increasing market just before the double
digit year over year increases seen in 2006 and 2007. Subsequent to this peak came a
market correction which saw values decrease as sharply as they had increased the year
before. Changes in supply and demand affect the market value of property. As the
demand in Sprague, and all across the country, fell, the supply of available properties
increased. This led to a decrease in what an individual could get for his or her property in
the open market.
S p r a g u e , C T F i n a l P r o j e c t D o c u m e n t a t i o n
P a g e | 13
3. Land Valuation In making appraisals for property tax assessment purposes, it is necessary to establish
separate values for land and for the improvements to the land. In actuality, the two are
not separated and the final estimate of the property as a single unit must be given prime
consideration. However, in arriving at that final estimate of value, aside from contractual
and legal requirements, certain other advantages exist in making a separate estimate of
value for the land.
• An estimate of land value is required in the application of the cost approach.
• An estimate of land value is required to be deducted from the total property selling
price in order to derive indications of depreciation or loss in value through market data
analysis. The equation is as follows:
Depreciation = (Reconstruction Cost New + Land Value) - (Selling Price)
• Since land may or may not be used to its highest potential, the value of land may be
completely independent of the existing improvements on the land. In a situation of
economic misimprovements, the value of the land may be a good indicator of the value of
the entire parcel.
3.1 Neighborhood Delineation
Delineation of valuation neighborhoods for residential and commercial properties is a key
driver in the valuation of land, and can be defined as a study of forces or influences from
outside which could be considered to have an effect on value.
A neighborhood is a geographic area exhibiting a high degree of homogeneity in economic
amenities, land use, economic trends, and property characteristics such as quality, age,
and condition. Neighborhoods are not characterized as good, average, poor, etc. They
stand on their own merits of uniform composition.
Significant characteristics in defining neighborhoods included:
• Physical boundaries
a. Natural – as rivers, streams, woods, etc.
b. Manmade – as roads, railroads, corporations, lines, school district lines, etc.
• Housing characteristics: type, quality, age, and condition.
• Type of occupancy: As percentage of owner occupied, tenant occupied, vacant
dwelling, etc.
• Predominant land use and anticipated changes.
• Typical land size and land valuation.
Neighborhood delineation included the following procedures:
S p r a g u e , C T F i n a l P r o j e c t D o c u m e n t a t i o n
P a g e | 14
1. A map delineating the neighborhoods as defined in 2007 was reviewed.
2. A thorough street-by-street tour of the Town was conducted.
3. Based on physical observation, neighborhood boundaries were confirmed or
revised. The specific boundaries were determined by significant physical and/or
economic changes from adjacent areas.
4. The established boundaries were posted to a master map.
5. Properties were updated using the new neighborhood assignments.
The residential neighborhoods became the basis for creation of values. Land prices were
developed at the neighborhood level for application in the cost approach.
The summary result of this process was the delineation of 4 commercial and 4 residential
valuation neighborhoods. Commercial neighborhoods were primarily delineated according
to zoning (C1, C2, I or R). Residential neighborhoods tie closely to the borough borders:
Baltic, Hanover and Versailles. Downtown Baltic was delineated into its own neighborhood
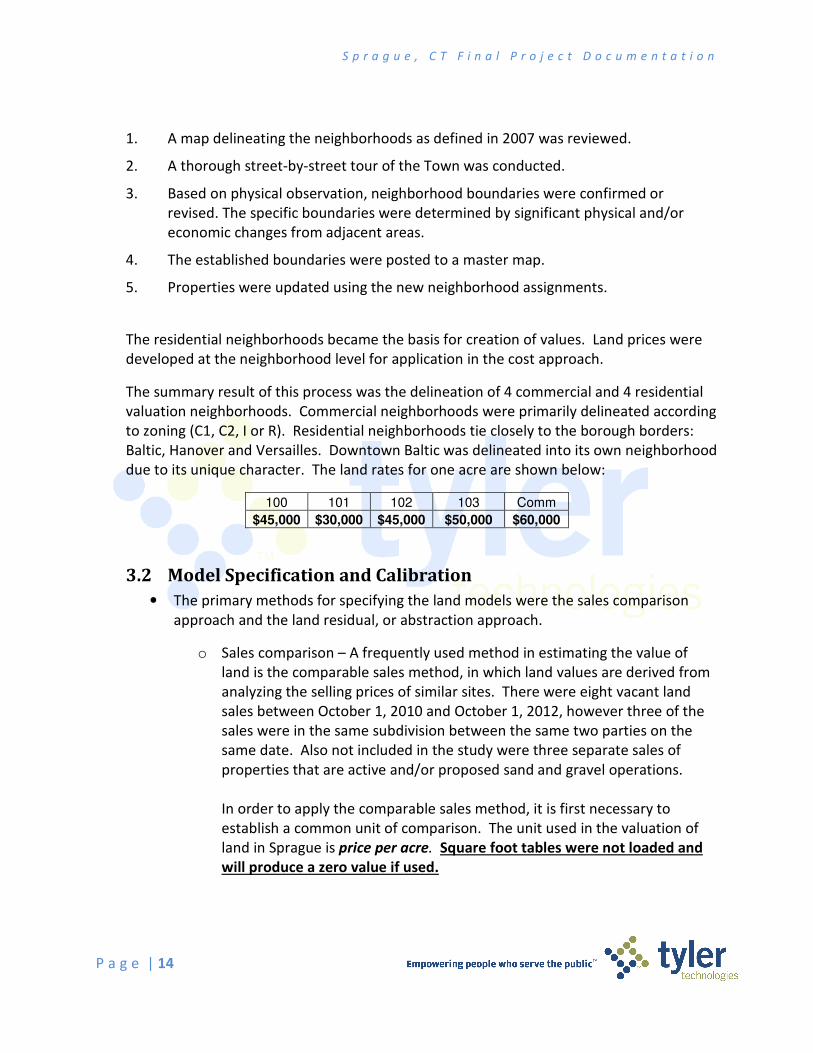
due to its unique character. The land rates for one acre are shown below:
100 101 102 103 Comm
$45,000 $30,000 $45,000 $50,000 $60,000
3.2 Model Specification and Calibration
• The primary methods for specifying the land models were the sales comparison
approach and the land residual, or abstraction approach.
o Sales comparison – A frequently used method in estimating the value of
land is the comparable sales method, in which land values are derived from
analyzing the selling prices of similar sites. There were eight vacant land
sales between October 1, 2010 and October 1, 2012, however three of the
sales were in the same subdivision between the same two parties on the
same date. Also not included in the study were three separate sales of
properties that are active and/or proposed sand and gravel operations.
In order to apply the comparable sales method, it is first necessary to
establish a common unit of comparison. The unit used in the valuation of
land in Sprague is price per acre. Square foot tables were not loaded and
will produce a zero value if used.
S p r a g u e , C T F i n a l P r o j e c t D o c u m e n t a t i o n
P a g e | 15
The next step requires analysis of lot sales. The size of any buildable parcel
of land was determined to be up to the one acre. The remainder of the lot
was assigned as secondary, excess or waste, unless classified under PA490.
Analysis of lot sales were used to determine the proper lot value for each
neighborhood, when such sales were available.
Once the lot value is determined, analysis of sales of larger tracts follows.
While the purpose of a reassessment is to estimate fair market value,
maintaining equity between like properties is of equal importance. Both
sold and unsold properties were formatted using the same procedure.
This is the most recognized approach and should be used if ample sales are
available. The steps in this approach are to gather the pertinent parcel
data for sold properties and stratify them, at minimum, by neighborhood in
order to develop appropriate rates for the area.
A copy of this analysis is included in the Appendix.
o Abstraction (or land residual) - Although it is preferable to use sales of
unimproved lots for comparables, it is not always possible to do so. Older
neighborhoods are not likely to yield a sufficient number of representative
sales of unimproved lots to permit a valid analysis. In such cases, in order to
arrive at an estimate of land values using the comparable sales approach, it
is necessary to consider improved property sales and to estimate the
portion of the selling price applicable to the structures, known as the land
residual technique.
The land residual technique estimates the replacement cost of the buildings
as of the date of the sale, the accrued depreciation, and deducts that
amount from the replacement cost. This will result in the estimated selling
price of the buildings, which can be deducted from the total selling price of
the property to derive the portion of the selling price which can be allocated
to the land. The equation is as follows:
(Selling Price of Property) – (Estimated Depreciated Value of Building) =
Indication of Land Value
Land residual analysis was performed throughout the valuation phase as a
check against the sales comparison approach. In this study, the sale price
was adjusted to reflect the level of value of 95%. This analysis can be found
in the Appendix.
S p r a g u e , C T F i n a l P r o j e c t D o c u m e n t a t i o n
P a g e | 16
3.3 Model Validation
Once the land models have been preliminarily established, they are continually tested
against new sales data. These tests are typically in the form of ratio studies. Copies of the
various ratio studies throughout the project can be found on the Town’s server. The final
sales ratio study is included in the Appendix.
4. Cost Approach
With such a small dataset on which to base the valuation, the cost approach was the only viable
approach available.
4.1 Model Specification and Calibration
In order to apply the cost approach to value, the appraiser must estimate the
replacement cost new (RCN) of improvements to the land before considering accrued
depreciation and the addition of the land value. The CAMA system contains base cost
tables for houses, all types of commercial buildings, outbuildings such as sheds and
garages, and for amenities such as fireplaces and bathrooms. These base tables were
calibrated to the Sprague market through a cost study.
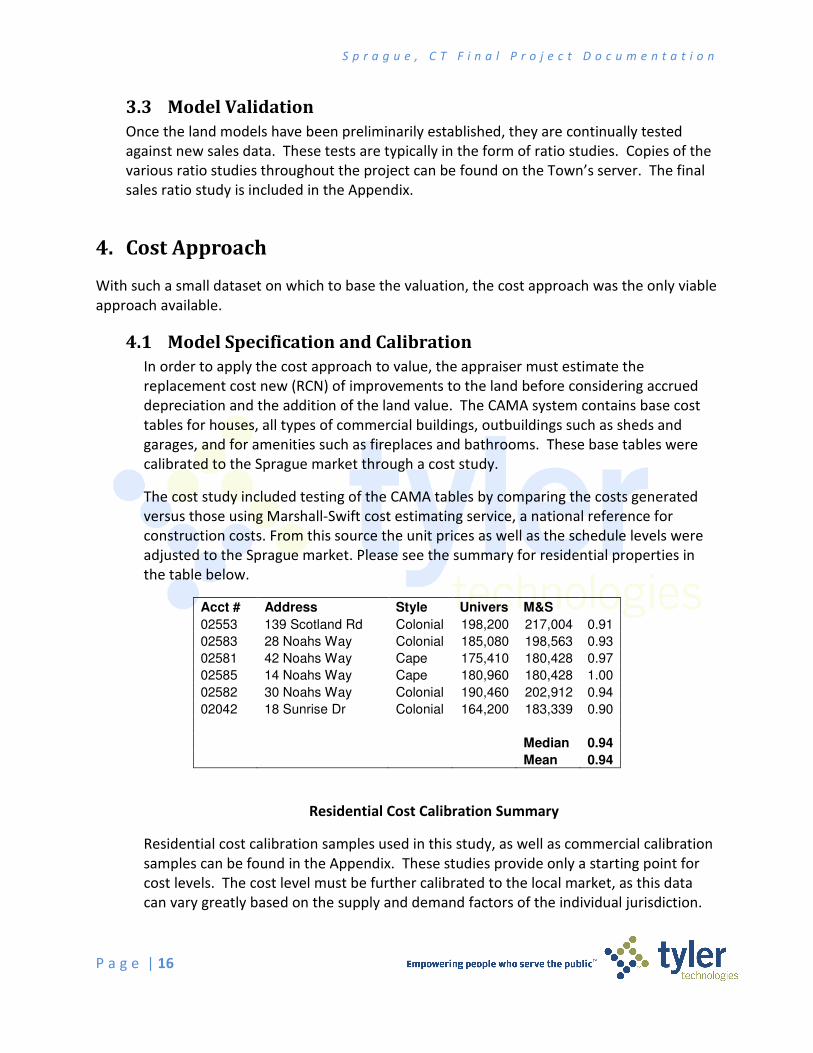
The cost study included testing of the CAMA tables by comparing the costs generated
versus those using Marshall-Swift cost estimating service, a national reference for
construction costs. From this source the unit prices as well as the schedule levels were
adjusted to the Sprague market. Please see the summary for residential properties in
the table below.
Acct # Address Style Univers M&S
02553 139 Scotland Rd Colonial 198,200 217,004 0.91
02583 28 Noahs Way Colonial 185,080 198,563 0.93
02581 42 Noahs Way Cape 175,410 180,428 0.97
02585 14 Noahs Way Cape 180,960 180,428 1.00
02582 30 Noahs Way Colonial 190,460 202,912 0.94
02042 18 Sunrise Dr Colonial 164,200 183,339 0.90
Median 0.94
Mean 0.94
Residential Cost Calibration Summary
Residential cost calibration samples used in this study, as well as commercial calibration
samples can be found in the Appendix. These studies provide only a starting point for
cost levels. The cost level must be further calibrated to the local market, as this data
can vary greatly based on the supply and demand factors of the individual jurisdiction.
S p r a g u e , C T F i n a l P r o j e c t D o c u m e n t a t i o n
P a g e | 17
Once the RCN was determined, the appraiser analyzed the loss in value from
replacement cost due to physical deterioration, economic obsolescence, and functional
obsolescence. This analysis resulted in tables of percent good (the inverse of
depreciation) based upon these factors.
Loss in value, also known as depreciation, is derived from three sources. An
improvement, or building, begins to deteriorate from the day its construction is
completed. Periodic rehabilitation, regular maintenance, and sometimes remodeling to
another use can prolong the economic utility of most buildings. Those that have gotten
more attention have a decreased loss in value from physical deterioration, and those
neglected would have a significant loss in value.
While all buildings suffer some physical deterioration, some may also suffer functional
obsolescence. This form of loss in value comes from a market-perceived defect within
the property itself. An example of a building with functional obsolescence would be a
four-bedroom house with only one bathroom. Functional obsolescence may be further
defined as curable or incurable. In the instance of the four-bedroom house, its
functional obsolescence may be cured by the addition of another bathroom. An
example of incurable functional obsolescence would be a stone house built with walls so
thick that the living area inside the home is significantly diminished.
Economic obsolescence is a loss in value due to factors outside of the property. Typical
instances of economic obsolescence would be a dwelling’s proximity to railroad tracks
and abutting a fast food restaurant. As with functional obsolescence, economic
obsolescence may be curable (the fast food restaurant closes) or incurable (the railroad
is here to stay).
For most residential improvements, loss in value is displayed in a table using the
improvement’s year built and its CDU (condition-desirability-utility) rating. Functional
and economic depreciation was applied, when warranted, as a reduction to this rating.
A house in normal condition for its age in a typical location within a typical
neighborhood would likely get an “average” CDU rating and the corresponding percent
good. A house in the same neighborhood, in the same condition that abutted the
railroad tracks would likely have additional economic obsolescence applied as a result of
its undesirable location by assigning a “fair” or “poor” CDU.
Depreciation tables were calibrated by deducting the estimated land value from the sale
price of sample properties. The difference between the result and the replacement cost
new equated to the loss in value, expressed as a percent good. A simple regression
analysis based on sold properties’ indicated percent good, yielded several formula-
based tables, the one with the most statistically acceptable results was selected. Some
interpretation of the data is required as there are a limited number of sales with few, if
S p r a g u e , C T F i n a l P r o j e c t D o c u m e n t a t i o n
P a g e | 18
any, in excellent, very good, poor and very poor conditions. Consideration of cost to
cure was key to the development of the table for these conditions.
Loss in value on commercial improvements is handled in a similar manner, however the
actual depreciation tables used for commercial properties are based on the expected
life of the structure (i.e. table 50 = 50 year expected life). The physical and functional
ratings matrix indicates what CDU each combination of these two factors represents.
To obtain an indication of value by way of the cost approach, one may add the
replacement cost new, less loss in value for physical, functional, and economic factors to
the value of the land. This can be done upon the completion of the table calibration
process.
4.2 Model Validation
The model is validated through a series of tests, including a ratio study stratified by various
data elements including, living area, year built, neighborhood, style and date of sale. In
addition, consistent application of the model to unsold properties should also be
considered. This is done via an unsold test which measures the percent change from the
previous valuation for sold and unsold properties. Properties that have changed
significantly in the past year, those under use values, and exempts are excluded. Both of
these are included in the Appendix.
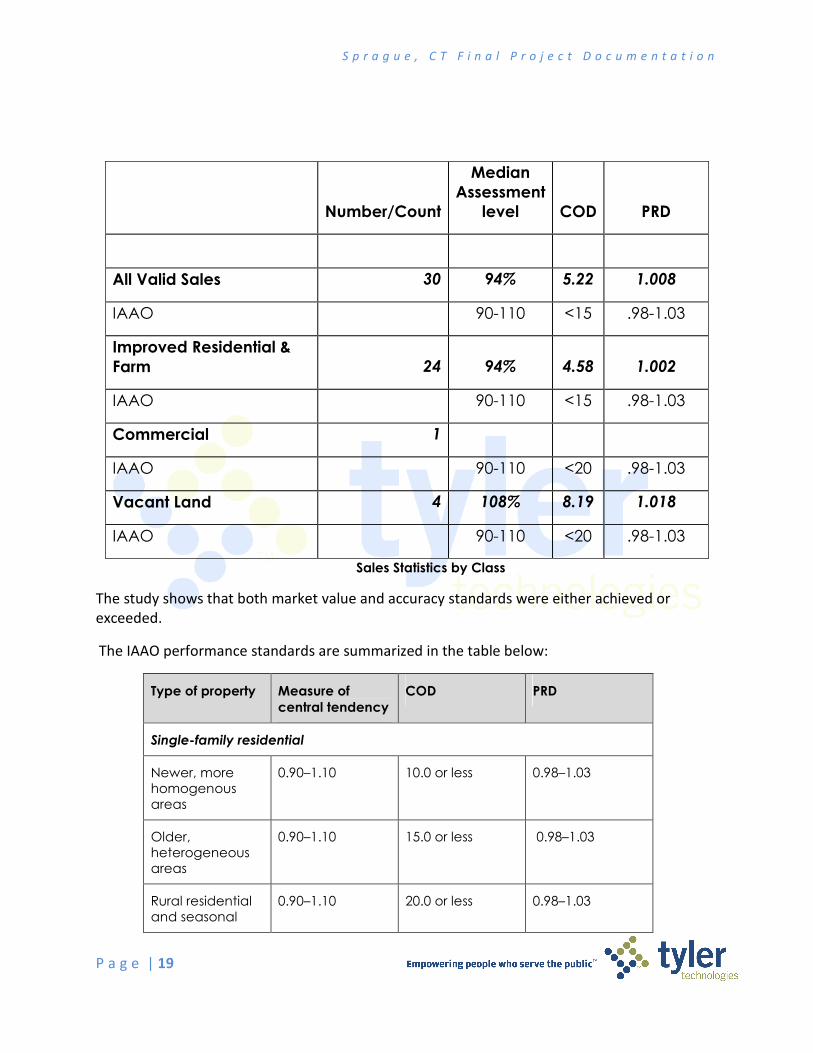
5. Analysis of Results A number of statistics have been computed on the two strata and are presented in this section.
They have been computed according to the definitions and formulae described in the IAAO
standard. In performing the analysis the following factors are relevant:
o The following charts and statistics cover the certification period as required by the State
of Connecticut of April 1, 2010 to October 1, 2012 and are adjusted for time. The time
adjustment supporting documents are included in the Appendix.
o The sales were verified to ensure that they represent open market transactions.
There was no systematic trimming of outliers, although the IAAO standards would have allowed
this. “Trimming” is the arbitrary dropping of sales with extreme ratios on either end of the
spectrum of ratios. The only extreme ratios that were dropped were those sales that could not
be verified as arms-length transactions. In general, if a sale was verified as being an open
market transaction it was included in the study. The statistics are presented in the table below.
S p r a g u e , C T F i n a l P r o j e c t D o c u m e n t a t i o n
P a g e | 19
Number/Count
Median
Assessment
level COD PRD
All Valid Sales 30 94% 5.22 1.008
IAAO 90-110 <15 .98-1.03
Improved Residential &
Farm 24 94% 4.58 1.002
IAAO 90-110 <15 .98-1.03
Commercial 1
IAAO 90-110 <20 .98-1.03
Vacant Land 4 108% 8.19 1.018
IAAO 90-110 <20 .98-1.03
Sales Statistics by Class
The study shows that both market value and accuracy standards were either achieved or
exceeded.
The IAAO performance standards are summarized in the table below:
Type of property Measure of
central tendency
COD PRD
Single-family residential
Newer, more homogenous areas
0.90–1.10 10.0 or less 0.98–1.03
Older, heterogeneous areas
0.90–1.10 15.0 or less 0.98–1.03
Rural residential and seasonal
0.90–1.10 20.0 or less 0.98–1.03
S p r a g u e , C T F i n a l P r o j e c t D o c u m e n t a t i o n
P a g e | 20
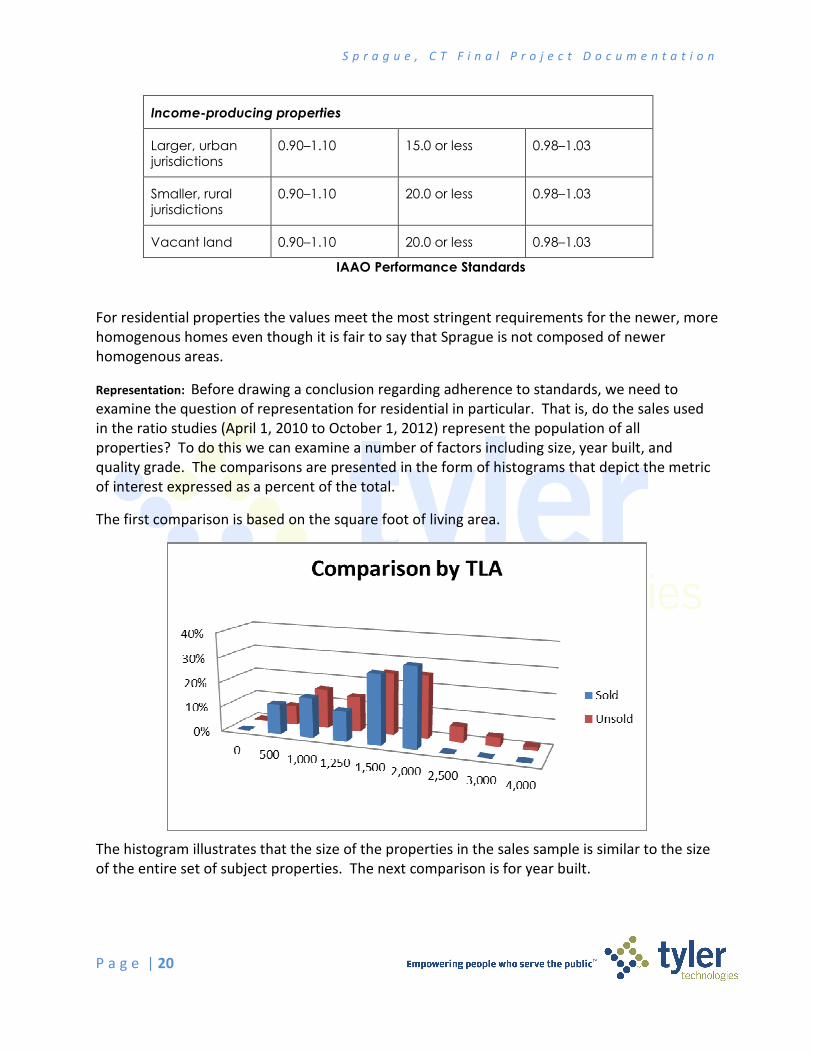
Income-producing properties
Larger, urban jurisdictions
0.90–1.10 15.0 or less 0.98–1.03
Smaller, rural jurisdictions
0.90–1.10 20.0 or less 0.98–1.03
Vacant land 0.90–1.10 20.0 or less 0.98–1.03
IAAO Performance Standards
For residential properties the values meet the most stringent requirements for the newer, more
homogenous homes even though it is fair to say that Sprague is not composed of newer
homogenous areas.
Representation: Before drawing a conclusion regarding adherence to standards, we need to
examine the question of representation for residential in particular. That is, do the sales used
in the ratio studies (April 1, 2010 to October 1, 2012) represent the population of all
properties? To do this we can examine a number of factors including size, year built, and
quality grade. The comparisons are presented in the form of histograms that depict the metric
of interest expressed as a percent of the total.
The first comparison is based on the square foot of living area.
The histogram illustrates that the size of the properties in the sales sample is similar to the size
of the entire set of subject properties. The next comparison is for year built.
S p r a g u e , C T F i n a l P r o j e c t D o c u m e n t a t i o n
P a g e | 21
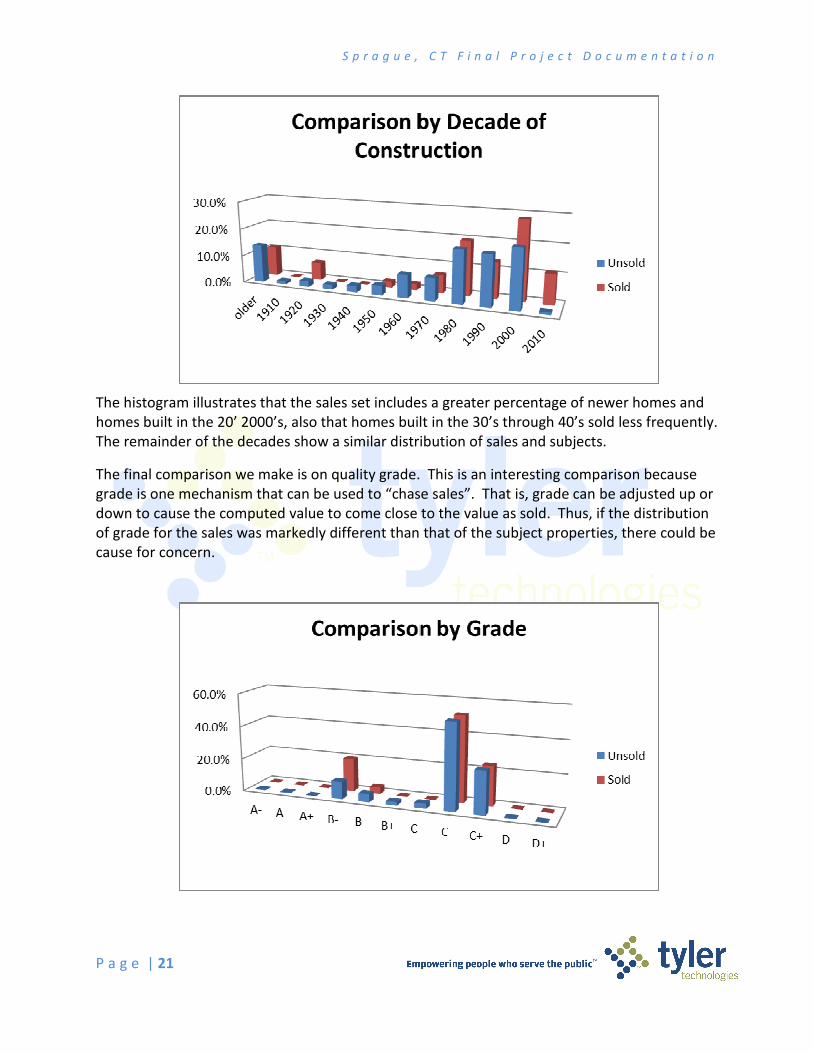
The histogram illustrates that the sales set includes a greater percentage of newer homes and
homes built in the 20’ 2000’s, also that homes built in the 30’s through 40’s sold less frequently.
The remainder of the decades show a similar distribution of sales and subjects.
The final comparison we make is on quality grade. This is an interesting comparison because
grade is one mechanism that can be used to “chase sales”. That is, grade can be adjusted up or
down to cause the computed value to come close to the value as sold. Thus, if the distribution
of grade for the sales was markedly different than that of the subject properties, there could be
cause for concern.
S p r a g u e , C T F i n a l P r o j e c t D o c u m e n t a t i o n
P a g e | 22
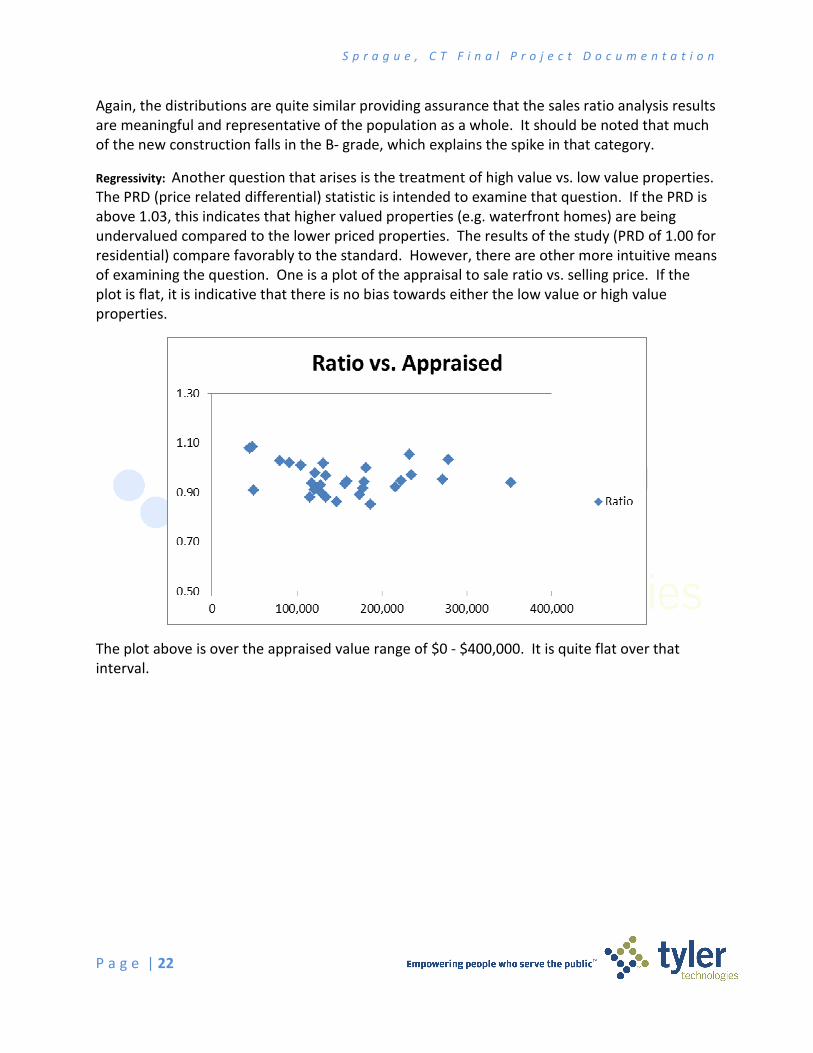
Again, the distributions are quite similar providing assurance that the sales ratio analysis results
are meaningful and representative of the population as a whole. It should be noted that much
of the new construction falls in the B- grade, which explains the spike in that category.
Regressivity: Another question that arises is the treatment of high value vs. low value properties.
The PRD (price related differential) statistic is intended to examine that question. If the PRD is
above 1.03, this indicates that higher valued properties (e.g. waterfront homes) are being
undervalued compared to the lower priced properties. The results of the study (PRD of 1.00 for
residential) compare favorably to the standard. However, there are other more intuitive means
of examining the question. One is a plot of the appraisal to sale ratio vs. selling price. If the
plot is flat, it is indicative that there is no bias towards either the low value or high value
properties.
The plot above is over the appraised value range of $0 - $400,000. It is quite flat over that
interval.
S p r a g u e , C T F i n a l P r o j e c t D o c u m e n t a t i o n
P a g e | 23
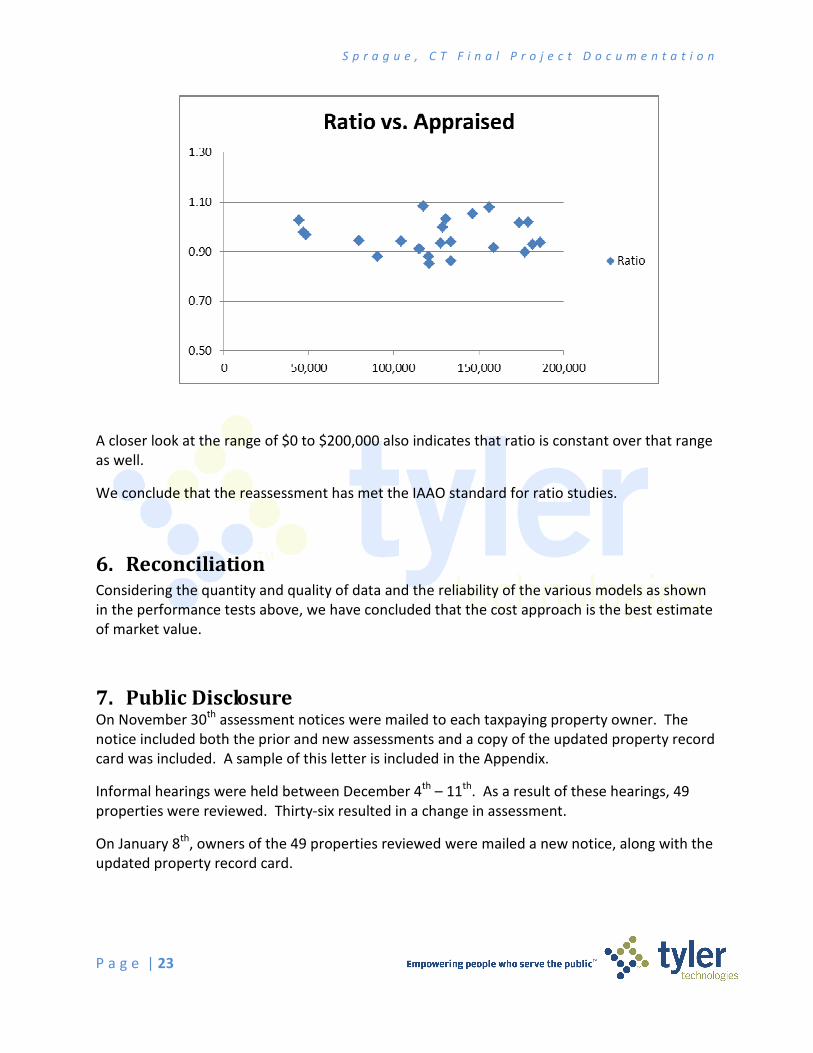
A closer look at the range of $0 to $200,000 also indicates that ratio is constant over that range
as well.
We conclude that the reassessment has met the IAAO standard for ratio studies.
6. Reconciliation Considering the quantity and quality of data and the reliability of the various models as shown
in the performance tests above, we have concluded that the cost approach is the best estimate
of market value.
7. Public Disclosure On November 30th assessment notices were mailed to each taxpaying property owner. The
notice included both the prior and new assessments and a copy of the updated property record
card was included. A sample of this letter is included in the Appendix.
Informal hearings were held between December 4th – 11th. As a result of these hearings, 49
properties were reviewed. Thirty-six resulted in a change in assessment.
On January 8th, owners of the 49 properties reviewed were mailed a new notice, along with the
updated property record card.
S p r a g u e , C T F i n a l P r o j e c t D o c u m e n t a t i o n
P a g e | 24
8. Certification I certify that, to the best of my knowledge and belief:
__ the statements of fact contained in this report are true and correct.
__ the reported analyses, opinions, and conclusions are limited only by the reported
assumptions and limiting conditions, and are my personal, impartial, and unbiased
professionally analyses, opinions, and conclusions.
__ I have no (or the specified) present or prospective interest in the property that is the
subject of this report, and I have no (or the specified) personal interest with respect to
the parties involved.
__ I have no bias with respect to any property that is the subject of this report or to the
parties involved with this assignment.
__ Any services regarding the subject performed by the appraiser within the three year
period immediately preceding acceptance of the assignment, as an appraiser or in any
other capacity is identified in the body of the report.
__ my engagement in this assignment was not contingent upon developing or reporting
predetermined results.
__ my compensation for completing this assignment is not contingent upon the reporting of
a predetermined value or direction in value that favors the cause of the client, the
amount of the value opinion, the attainment of a stipulated result, or the occurrence of a
subsequent event directly related to the intended use of this appraisal.
__ my analyses, opinions, and conclusions were developed, and this report has been
prepared, in conformity with the Uniform Standards of Professional Appraisal Practice.
__ I have (or have not) made a personal inspection of the properties that are the subject of
this report. (If more than one person signs the report, this certification must clearly
specify which individuals did and which individuals did not make a personal inspection of
the appraised property.)
__ no one provided significant mass appraisal assistance to the person signing this
certification.
________________________________________
Melissa L. Baer, CCMAII, CAE
Sr. Project Supervisor
S p r a g u e , C T F i n a l P r o j e c t D o c u m e n t a t i o n
P a g e | 25
9. Appendix
9.1 USPAP Standard 6
Uspap 6.pdf
9.2 IAAO Standard on Mass Appraisal
StandardOnMassAppraisal.pdf
9.3 IAAO Standard on Ratio Studies
Standard_on_Ratio_Studies.pdf
9.4 Articles of Agreement
NECCOG contract 112000_20110128153559.pdf
9.5 Data Collection Manuals
Sprague Data Collection Manual.doc
Sprague Commercial DC manual.doc
9.6 Data Mailer Samples
Res DM.pdf
Comm DM.pdf
9.7 Data Mailer Procedures
NECCOG DM Procedures.doc
S p r a g u e , C T F i n a l P r o j e c t D o c u m e n t a t i o n
P a g e | 26
9.8 Land Analyses
Sprague LAND VALUE CHART.xls
Sprague Residual Analysis.xlsx
9.9 Cost Calibration Samples
Cost Calibration Samples.pdf
9.10 State of CT Performance Based Testing
Sprague PBT.xls
9.11 Sample Notice to Taxpayer
Sample NTP.pdf
9.12 Univers Valuation Tables
Tables.pdf
S p r a g u e , C T F i n a l P r o j e c t D o c u m e n t a t i o n
P a g e | 27
10. Definitions
ad valorem tax - in reference to property, a tax based upon the value of the property.
Adaptive Estimation Procedure (AEP) - A computerized, iterative, self-referential procedure
using properties for which sales prices are known to produce a model that can be used to
value properties for which sales prices are not known. Also called "feedback”.
additive model - A model in which the dependent variable is estimated by multiplying each
independent variable by its coefficient and adding each product to a constant.
adjustments - Modifications in the reported value of a variable, such as sale price. For
example, adjustments can be used to estimate market value in the sales comparison
approach by modifications for differences between comparable and subject properties.
Note: Adjustments are applied to the characteristics of the comparable properties in a
particular sequence that depends on the method of adjustment selected.
algorithm - A computer-oriented, precisely defined set of steps that, if followed exactly, will
produce a pre-specified result, for example, the solution to a problem.
amenities - in reference to property, the intangible benefits arising out of ownership;
amenity value refers to the enhancement of value attributable to such amenities.
appraisal - an estimate, usually in written form, of the value of a specifically described
property as of a specified date; may be used synonymously with valuation or appraised
value.
appraisal schedules - any standardized schedules and tables used in conjunction with a
revaluation program, such as replacement cost pricing schedules, depreciation tables, land
depth tables, etc.
Appraiser - one who estimates value. More specifically, one who posses the expertise to
execute or direct the execution of an appraisal.
assessing - the act of valuing a property for the purpose of establishing a tax base.
assessment - the value of taxable property to which the tax rate is to be applied in order to
compute the amount of taxes, may be used synonymously with assessed value, taxable
value, and tax base.
Assessor - the administrator charged with the assessment of property for ad valorem taxes;
his precise duties differ from state to state depending upon state statutes.
average deviation - in a distribution of values, the average amount of deviation of all the
values from the mean value, equal to the total amount of deviation from the mean divided
by the number of deviations. As applied to an assessment-to-sale ratio distribution, the
average amount which all the ratios within the distribution deviate from the mean ratio.
S p r a g u e , C T F i n a l P r o j e c t D o c u m e n t a t i o n
P a g e | 28
base price - a value or unit rate established for a certain specified model, and subject to
adjustments to account for variations between that particular model and the subject
property under appraisement.
binary variable - (1) Binary variables are qualitative data items that have only two
possibilities-yes or no (for example, corner location). (2) A variable for which only two
values are possible, such as results from a yes-or-no question, for example, Does this
building have any fireplaces? Used in some models to separate the influence of categorical
variables. Also called a dichotomous variable or a dummy variable.
calibration - The process of estimating the coefficients in a mass appraisal model.
coefficient - (1) In a mathematical expression, a number or letter preceding and multiplying
another quantity. For example, in the expression, 5X, 5 is the coefficient of X, and in the
expression aY, a is the coefficient of Y. (2) A dimensionless statistic, useful as a measure of
change or relationship; for example, correlation coefficient. See also coefficient of
dispersion and coefficient of variation.
coefficient of determination – See R squared.
coefficient of dispersion – the average deviation of a group of numbers from the median
expressed as a percentage of the median.
coefficient of variation – a standard statistical measure of the relative dispersion of the
sample data about the mean of the data; the standard deviation expressed as a percentage
of the mean.
confidence interval - a range of values, calculated from the sample observations, that are
believed, with a particular probability, to contain the true population parameter (mean,
median, COD). The confidence interval is not a measure of precision for the sample statistic
or point estimate, but a measure of the precision of the sampling process (see reliability).
confidence level - the required degree of confidence in a statistical test or confidence
interval; commonly 90, 95, or 99 percent. A 95 percent confidence interval would mean, for
example, that one can be 95 percent confident that the population measure (such as the
median or mean appraisal ratio) falls in the indicated range.
continuous variable - A variable for which it is conceivable that, given any two observed
values, a value lying between them may occur. For example, temperature and finished living
area are continuous variables; quality class and number of fireplaces are not.
correlation – A statistical phenomenon (and a technique for estimating its strength)
whereby knowledge of one fact about a thing implies some knowledge of a second fact
about that thing. For example, because the volume and weight of water are correlated,
knowing that a quantity of water is one gallon also means knowing that its weight is eight
and one-third pounds. Linear correlation, the kind most often encountered, means that an
increase in one factor in some proportion (say, a doubling) changes the other in the same
proportion. With curvilinear correlation, as between the radius and the area of a circle, this
S p r a g u e , C T F i n a l P r o j e c t D o c u m e n t a t i o n
P a g e | 29
is not true, despite the fact that the correlation may be very strong in the sense that
knowledge of one fact tells you precisely the other fact. These are examples of variables
perfectly correlated or nearly so; more often, correlation is only partial-for example, the
correlation between the age and height of a child. The correlation coefficient gives the
strength of the linear relationship between the two variables.
correlation coefficient - A statistic that characterizes two or more sets of numbers and,
when squared and multiplied by 100, gives the percentage strength of the (linear)
relationship between the two sets of numbers. For example, if the coefficient of correlation
between measures of the height and weight of a group of people were 0.9, then one would
deduce that knowing the height of someone (loosely speaking) would explain (or account
for) 81 percent of the weight.
correlation matrix - The table of numbers used to display the correlation coefficients for
each pair of variables when three or more variables are thought to be correlated.
cosmetic comps – A term that refers to a method of adjusting comps using the cost
estimate or estimates (e.g. total value or land and building value). Comparability selection
or weighting is done in the same manner as when the adjustments are derived from MRA or
other method. This is not a true market method but can be quite useful when used as
support for the cost approach and when there are an inadequate number of sales to
develop adjustments.
cost approach - one of the three traditional approaches to determination of the value of a
property; arrived at by estimating the value of the land, the replacement or reproduction
cost new of the improvement, and the amount of accrued depreciation to the
improvement. The estimated land value is then added to the estimated depreciated value
of the improvements to arrive at the estimated property value. Also referred to as the
"cost-to-market approach" to indicate that the value estimates are derived from market
data abstraction and analysis.
deed - a written instrument which conveys in interest in real property. A quitclaim deed
conveys the interest described therein without warranty of title. A trust deed conveys
interest described therein to a trustee. A warranty deed conveys the interest described
therein with the provisions that the freehold is guaranteed by the grantor, his heirs, or
successors.
dependent variable - A variable, such as sale price, the value of which is predicted by the
values of other variables, such as location and finished living area. Such a variable may be
said to depend on the other (independent) variables.
discrete variable - A variable for which it is not conceivable that, given any two observed
values, a value lying between them may occur. For example, the number of rooms in a
house is a discrete variable, but the living area of the house is not. See also binary variable
and continuous variable.
S p r a g u e , C T F i n a l P r o j e c t D o c u m e n t a t i o n
P a g e | 30
dispersion - The degree to which data are distributed either tightly or loosely around a
measure of central tendency. Measures of dispersion include the average deviation,
coefficient of dispersion, coefficient of variation, range, and standard deviation.
effective valuation date - in reference to a revaluation program, the date as of which the
value estimate is applicable.
equalization program - a mass appraisal (or reappraisal) of all property within a given taxing
jurisdiction with the goal of equalizing values in order to assure that each taxpayer is
bearing only his fair share of the tax load; may be used synonymously with a revaluation
program.
equity -in reference to property taxes, a condition in which the tax load is distributed fairly
or equitably; opposite of inequity which refers to a condition characterized by an unfair or
inequitable distribution of the tax burden. Inequity is a natural product of changing
economic conditions which can only be effectively cured by periodic equalization programs.
In reference to value, it is that value of the property remaining after deducting all liens and
charges against it.
error - The difference between the actual value of a variable and the expected value of the
variable exclusive of sampling problems. Errors may be positive or negative, although in
common speech taking the absolute value of the errors is sometimes implied. In multiple
regression analysis, the term "error" is often used loosely to mean residual.
Euclidean Distance Metric - A measure of distance between two points “as the crow flies.”
In property valuation, it is used to find the nearest neighbor or similar property based on an
index of dissimilarity between property location or attributes. When using multivariate
selection, the squared difference is divided by the standard deviation of the variable so as
to normalize the differences.
F test - a measure of what we are referring to when we speak of the “statistical
significance” of the coefficient for a factor. The F statistic is a ratio of that part of the sum of
the squares accounted for by the regression equation to the residual (that part of the sum
of the squares not accounted for by the regression equation). The number of factors also is
included in the calculation
Goodness of Fit statistics - Statistics used in multiple regression analysis and other kinds of
statistical modeling to express the amount, and hence the importance, of the errors or
residuals for all the predicted and actual values of a variable.
hybrid model – A model that incorporates both additive and multiplicative components.
See also additive model and multiplicative model.
intercept - Graphically, the point at which a line, such as a regression line, intersects the axis
on which the dependent variable is represented; the value of the predicted variable when
the value of all the other values in the model is zero; the constant.
iteration - One repetition or repeated cycle in a process of estimating values as close as
S p r a g u e , C T F i n a l P r o j e c t D o c u m e n t a t i o n
P a g e | 31
possible to actual values by repeated approximations. The results of each approximation are
used in the next one. linear regression - A kind of statistical analysis used to investigate whether a dependent
variable and a set of one or more independent variables share a linear correlation and, if
they do, to predict the value of the dependent variable on the basis of the values of the
other variables. Regression analysis of one dependent variable and only one independent
variable is called simple linear regression, but it is the word simple (not linear) that
distinguishes it from multiple regression analysis with its multiple independent variables
market approach - one of the three traditional approaches to determination of the value of
a property; arrived at by compiling data on recently sold properties which are comparable
to the subject property and adjusting their selling prices to account for variations in time,
location, and property characteristics between the comps and the subject property.
market value - the price an informed and intelligent buyer, fully aware of the existence of
competing properties, and not compelled to act, would be justified in paying for a particular
property.
mass appraisal - appraisal of property on a mass scale - such as an entire community,
generally for ad valorem tax purposes, using standardized appraisal techniques and
procedures to accomplish uniform equitable valuations with a minimum of detail, within a
limited time period, and at a limited cost...as opposed to a fee appraisal which is generally
used to refer to a rather extensive, detailed appraisal of a single property or singularly used
properties for a specified purpose.
model - For purposes of appraisal, a representation (in words or an equation) that explains
the relationship between value or estimated sale price and variables representing factors of
supply and demand.
model calibration - The development of adjustments, or coefficients based on market
analysis, that identifies specific factors with an actual effect on market value.
model specification - The formal development of a model in a statement or equation, based
on data analysis and appraisal theory.
multicollinearity - The phenomenon of two or more variables being correlated. If the two
correlated variables are both independent variables (note that if they are correlated they
are not truly independent in the relationship sense) used to predict the value of some
other, dependent, variable, then modeling problems will arise. If the multicollinearity is
perfect, the multiple regression algorithms simply will not work; if the multicollinearity is
serious but imperfect, the coefficients generated by the algorithm will be individually
meaningless (although the model as a whole may still be useful).
multiplicative model - A mathematical model in which the coefficients of independent
variables serve as powers (exponents) to which the independent variables are raised or in
S p r a g u e , C T F i n a l P r o j e c t D o c u m e n t a t i o n
P a g e | 32
which independent variables themselves serve as exponents; the results are then multiplied
to estimate the value of the dependent variable.
multiple regression analysis – A particular statistical technique, similar to correlation, used
to analyze data in order to predict the value of one variable (the dependent variable), such
as market value, from the known values of other variables (called "independent variables"),
such as lot size, number of rooms, and so on. If only one independent variable is used, the
procedure is called simple regression analysis and differs from correlation analysis only in
that correlation measures the strength of relationship, whereas regression predicts the
value of one variable from the value of the other.
Neighborhood - a geographical area exhibiting a high degree of homogeneity in residential
amenities, land use, economic and social trends, and housing characteristics.
outliers - Observations that have unusual values, that is, they differ markedly from a
measure of central tendency. Some outliers occur naturally; others are due to data errors.
parcel - piece of land held in one ownership.
partial F test - The partial F test has essentially the same significance as the F test, except
that in this case we are trying to assess the significance of a single term in the model rather
than all the terms taken together. The critical factor here is the difference or increase in the
sum of the squares accounted for by the regression as a consequence of adding one term to
the regression equation.
partial correlation – a measure of how closely the value of the independent variable or
factor (such as number of full baths), is related to the dependent variable (usually the sales
price). The dependent variable is adjusted so that all of the other factors in the model are
“taken out” of the values in order for us to have a measure of how closely this particular
variable is related to the remaining dependent variable. Mathematically, its maximum
absolute value is one.
property class - a division of like properties generally defined by statutes and generally
based upon their present use. The basis for establishing assessment ratios in a classified
property assessment system.
property record card - a document specially designed to record and process specified
property data; may serve as a source document, a processing form, and/or a permanent
property record.
qualitative variable - Something that can be appreciated but not objectively reduced to an
unambiguous scale. For example, view is a qualitative variable.
quantitative variable - Pertaining to the objective nature of some variable of interest, that
is, something that can be measured or counted with little ambiguity. For example, number
of bathrooms is a quantitative variable.
R squared - The R squared statistic (coefficient of determination) is a ratio related to how
well the data (sales prices) are fit by the regression equation. It is equal to the complement
S p r a g u e , C T F i n a l P r o j e c t D o c u m e n t a t i o n
P a g e | 33
of the residual sum of squares divided by the total sum of squares corrected for the mean,
where the total sum of squares is the sum of the squares of the sales prices minus their
mean value, and the residual sum of squares is the sum of the squares of the differences
between the actual sales prices and those predicted by the regression equation. It is
apparent that the closer R squared is to 1, the better we have fit the data.
real estate - the physical land and appurtenances affixed thereto; often used synonymously
with real property.
real property - all the interests, benefits, and rights enjoyed by the ownership of the real
estate.
reconciliation - The final step in the valuation process wherein consideration is given to the
relative strengths and weaknesses of the three approaches to value, the nature of the
property appraised, and the quantity and quality of available data in formation of an overall
opinion of value (either a single point estimate or a range of value). Also termed
"correlation" in some texts.
regression coefficient - The coefficient calculated by the regression algorithm for the data
supplied that, when multiplied by the value of the variable with which it is associated, will
predict (for simple regression) or help to predict (for multiple regression) the value of the
dependent variable. For example, in the equation, Value = $10,000 + $5,000 + number of
rooms, $5,000 is a regression coefficient.
regression line - The line on a graph that represents the relationship defined by the
regression coefficients. For example, the line from the relationship given in the definition of
regression coefficient would cross the y-axis at the value $10,000 and would go up $5,000
for each movement of 1 to the right. This example illustrates one of the subtleties required
in understanding regression analysis: in fact, there is no line, because the independent
variable is not a continuous variable, but it is easier to talk about the relationship by
pretending that the variable is continuous and represent the relationship by a line rather
than the more nearly correct series of vertical bars on a bar chart.
residual - The difference between an observed value and a predicted value for a dependent
variable.
sales file - A file of sales data.
sales ratio study - a statistical analysis of the distribution of assessment or appraisal-to-sale
ratios of a sample of recent sales, made for the purpose of drawing inferences regarding the
entire population of parcels from which the sample was abstracted.
slope - The change in the dependent variable associated with a change of one in the
independent variable of interest. The slope is given by the coefficient of the independent
variable.
standard deviation – the statistic calculated from a set of numbers by subtracting the mean
from each value and squaring the remainders, adding together all the squares, dividing by
S p r a g u e , C T F i n a l P r o j e c t D o c u m e n t a t i o n
P a g e | 34
the size of the sample less one, and taking the square root of the result. When the data are
normally distributed, one can calculate the percentage of observations within any number
of standard deviations of the mean from normal probability tables.
standard error - a measure of the precision of a measure of central tendency; the smaller
the standard error, the more reliable the measure of central tendency. Standard errors are
used in calculating a confidence interval about the arithmetic mean and the weighted
mean.
standard error of the estimate - The square root of the mean square residual gives us the
standard error of the estimate. In this application, this number gives us an idea of the
average amount by which the regression equation “misses” the actual sales prices. In a
somewhat more precise statistical sense, we expect that roughly 2/3 of the regression
estimates should be within one standard error (either high or low) of the actual sales price.
In general, the smaller this number is the better. As we noted, this not only takes account of
how well the data are fit, but also of how efficiently (using the smallest number of factors)
we have performed the fit.
step-wise regression analysis - A kind of multiple regression analysis in which the
independent variables enter the model, and leave it if appropriate, one by one according to
their ability to improve the equation's power to predict the value of the dependent variable.
subjective data - Subjective data are items for which the proper value is a matter of
judgment and more difficult to verify. Examples include construction class, condition,
effective year built, neighborhood desirability, and view.
uniformity - as applied to assessing, A condition wherein all properties are assessed at the
same ratio to market value, or other standard of value depending upon the particular
assessing practices followed.
use value - the actual value of a commodity to a specific owner, as opposed to its value in
exchange or market value.
variable – an item of observation that can assume various values, for example, square feet,
sales price or sales ratios.
variance – a measure of dispersion equal to the standard deviation squared.
view - the scene as viewed from a property.