Embed Size (px)
DESCRIPTION
TXSeries for Multiplatforms Problem Determination Guide Version 6.2 - Erziae02
Citation preview

TXSeries for Multiplatforms
Problem Determination Guide
Version 6.2
SC34-6636-02
���

TXSeries for Multiplatforms
Problem Determination Guide
Version 6.2
SC34-6636-02
���
Note
Before using this information and the product it supports, be sure to read the general information under “Notices” on page
127.
Third Edition (January 2008)
Order publications through your IBM representative or through the IBM branch office serving your locality.
© Copyright International Business Machines Corporation 1999, 2008. All rights reserved.
US Government Users Restricted Rights – Use, duplication or disclosure restricted by GSA ADP Schedule Contract
with IBM Corp.
Contents
Figures . . . . . . . . . . . . . . . . . . . . . . . . . . . . ix
Tables . . . . . . . . . . . . . . . . . . . . . . . . . . . . xi
About this book . . . . . . . . . . . . . . . . . . . . . . . . xiii
Who should read this book . . . . . . . . . . . . . . . . . . . . xiii
Document organization . . . . . . . . . . . . . . . . . . . . . . xiii
Conventions used in this book . . . . . . . . . . . . . . . . . . . xiv
How to send your comments . . . . . . . . . . . . . . . . . . . . xv
Chapter 1. Introduction to problem determination . . . . . . . . . . . 1
Working through a problem . . . . . . . . . . . . . . . . . . . . . 1
Preliminary checks . . . . . . . . . . . . . . . . . . . . . . . . 2
Classifying the problem . . . . . . . . . . . . . . . . . . . . . . 4
Using the symptoms to classify the problem . . . . . . . . . . . . . . . 5
Chapter 2. Sources of information . . . . . . . . . . . . . . . . . 7
Product publications . . . . . . . . . . . . . . . . . . . . . . . 7
Customer forums . . . . . . . . . . . . . . . . . . . . . . . . 7
Abnormal termination codes and error messages . . . . . . . . . . . . . 7
Symptom records file . . . . . . . . . . . . . . . . . . . . . . 9
Toolkit messages and status codes . . . . . . . . . . . . . . . . 10
SNA messages . . . . . . . . . . . . . . . . . . . . . . . . 11
Database messages . . . . . . . . . . . . . . . . . . . . . . 11
Tailing message files . . . . . . . . . . . . . . . . . . . . . . 11
CICS tools . . . . . . . . . . . . . . . . . . . . . . . . . . 12
CICS-supplied transactions . . . . . . . . . . . . . . . . . . . . 13
Command-line utilities . . . . . . . . . . . . . . . . . . . . . . 14
Transaction inputs and outputs . . . . . . . . . . . . . . . . . . . 15
Your own documentation . . . . . . . . . . . . . . . . . . . . . 16
Chapter 3. Dealing with abnormal terminations . . . . . . . . . . . . 17
Using trace-back files . . . . . . . . . . . . . . . . . . . . . . 17
Chapter 4. Distinguishing between waits, loops, and poor performance 19
Is the problem caused by a wait? . . . . . . . . . . . . . . . . . . 19
Is the problem caused by a loop? . . . . . . . . . . . . . . . . . . 19
Is the problem a performance problem? . . . . . . . . . . . . . . . . 20
Chapter 5. Dealing with waits . . . . . . . . . . . . . . . . . . . 21
CICS system waits . . . . . . . . . . . . . . . . . . . . . . . 21
Maximum server condition waits . . . . . . . . . . . . . . . . . . 22
Terminal waits . . . . . . . . . . . . . . . . . . . . . . . . . 22
Intersystem waits . . . . . . . . . . . . . . . . . . . . . . . . 23
Transient data waits . . . . . . . . . . . . . . . . . . . . . . . 23
File control waits . . . . . . . . . . . . . . . . . . . . . . . . 24
Temporary storage queue waits . . . . . . . . . . . . . . . . . . . 24
Not enough storage . . . . . . . . . . . . . . . . . . . . . . 24
Temporary storage queue already in use . . . . . . . . . . . . . . 25
System dump waits . . . . . . . . . . . . . . . . . . . . . . . 25
ENQ and SUSPEND task control waits . . . . . . . . . . . . . . . . 25
Enqueueing a locked resource . . . . . . . . . . . . . . . . . . 25
Suspending a transaction . . . . . . . . . . . . . . . . . . . . 26
© Copyright IBM Corp. 1999, 2008 iii
Journal waits . . . . . . . . . . . . . . . . . . . . . . . . . 26
Syncpoint waits . . . . . . . . . . . . . . . . . . . . . . . . . 26
Non-distributed transactions . . . . . . . . . . . . . . . . . . . 27
Distributed transactions . . . . . . . . . . . . . . . . . . . . . 27
CICS system process waits . . . . . . . . . . . . . . . . . . . . 27
What to do if CICS has stalled . . . . . . . . . . . . . . . . . . . 28
CICS has stalled during initialization . . . . . . . . . . . . . . . . 28
CICS has stalled during a run . . . . . . . . . . . . . . . . . . 28
CICS has stalled during termination . . . . . . . . . . . . . . . . 30
Chapter 6. Dealing with loops . . . . . . . . . . . . . . . . . . . 33
Different types of loop . . . . . . . . . . . . . . . . . . . . . . 33
Classifying loops by their symptoms . . . . . . . . . . . . . . . . 33
Investigating loops . . . . . . . . . . . . . . . . . . . . . . . 33
The documentation you need . . . . . . . . . . . . . . . . . . 34
Identifying the loop . . . . . . . . . . . . . . . . . . . . . . 34
Finding the reason for the loop . . . . . . . . . . . . . . . . . . 34
What to do if you cannot find the cause of a loop . . . . . . . . . . . 35
Chapter 7. Dealing with performance problems . . . . . . . . . . . . 37
Finding the bottleneck in scheduled transactions . . . . . . . . . . . . 37
Tasks not given to the transaction scheduler . . . . . . . . . . . . . 37
Task is not scheduled . . . . . . . . . . . . . . . . . . . . . 37
Terminal definitions not removed from the system . . . . . . . . . . . 37
Why tasks are not given to the scheduler . . . . . . . . . . . . . . . 38
Terminal and remotely initiated tasks . . . . . . . . . . . . . . . . 38
Interval control transactions . . . . . . . . . . . . . . . . . . . 38
Why tasks are not scheduled . . . . . . . . . . . . . . . . . . . . 39
Task is held by class . . . . . . . . . . . . . . . . . . . . . . 39
No application server available . . . . . . . . . . . . . . . . . . 39
Task priority . . . . . . . . . . . . . . . . . . . . . . . . . 40
Why the scheduler refuses to schedule tasks . . . . . . . . . . . . . 40
The scheduler dump information . . . . . . . . . . . . . . . . . 40
Scheduler statistics . . . . . . . . . . . . . . . . . . . . . . 41
Short on storage . . . . . . . . . . . . . . . . . . . . . . . 41
Incorrect settings of region attributes . . . . . . . . . . . . . . . . . 42
Incorrect settings of SFS attributes . . . . . . . . . . . . . . . . . 42
Chapter 8. Dealing with unanticipated output . . . . . . . . . . . . . 45
An output device displays unanticipated data . . . . . . . . . . . . . . 45
Preliminary information . . . . . . . . . . . . . . . . . . . . . 45
Specific types of unanticipated output . . . . . . . . . . . . . . . 45
Unanticipated data is present on a file or user journal . . . . . . . . . . 47
Example . . . . . . . . . . . . . . . . . . . . . . . . . . 47
An application did not work as expected . . . . . . . . . . . . . . . 47
Applications getting forcepurged . . . . . . . . . . . . . . . . . 47
General points to consider . . . . . . . . . . . . . . . . . . . . 48
Using traces and dumps . . . . . . . . . . . . . . . . . . . . 48
Classifying the problem . . . . . . . . . . . . . . . . . . . . . 48
No output at all . . . . . . . . . . . . . . . . . . . . . . . . 48
Incorrect output . . . . . . . . . . . . . . . . . . . . . . . . 51
Chapter 9. Dealing with storage violations . . . . . . . . . . . . . . 55
CICS has detected a storage violation . . . . . . . . . . . . . . . . 55
Task-private pool . . . . . . . . . . . . . . . . . . . . . . . 55
Task-shared pool . . . . . . . . . . . . . . . . . . . . . . . 56
iv TXSeries for Multiplatforms: Problem Determination Guide
||
Region pool . . . . . . . . . . . . . . . . . . . . . . . . . 57
Determining the source of the problem . . . . . . . . . . . . . . . 59
CICS system and transaction dumps . . . . . . . . . . . . . . . . 59
Storage violations that affect innocent transactions . . . . . . . . . . . . 64
Finding the cause of the storage violation . . . . . . . . . . . . . . 64
You cannot find the cause of the storage violation . . . . . . . . . . . 64
Chapter 10. Dealing with memory and file descriptor leaks . . . . . . . 65
Observing memory growth for application server processes . . . . . . . . 65
The debugging information . . . . . . . . . . . . . . . . . . . . 66
Generating debugging reports . . . . . . . . . . . . . . . . . . . 66
Examples . . . . . . . . . . . . . . . . . . . . . . . . . . . 68
Sample output . . . . . . . . . . . . . . . . . . . . . . . . . 68
Chapter 11. Dealing with database problems . . . . . . . . . . . . . 71
Checking CICS and RDBMS configuration . . . . . . . . . . . . . . . 71
Checking application coding . . . . . . . . . . . . . . . . . . . . 72
Checking application building (Open systems only) . . . . . . . . . . . 72
DB2 (Open systems only) . . . . . . . . . . . . . . . . . . . . . 72
Informix . . . . . . . . . . . . . . . . . . . . . . . . . . . 74
Return codes . . . . . . . . . . . . . . . . . . . . . . . . 75
Oracle . . . . . . . . . . . . . . . . . . . . . . . . . . . . 75
Some common problems . . . . . . . . . . . . . . . . . . . . 77
Sybase . . . . . . . . . . . . . . . . . . . . . . . . . . . . 78
Chapter 12. Resolving problems with CICS clients . . . . . . . . . . 81
Dealing with problems involving cicslterm . . . . . . . . . . . . . . . 81
The cicslterm command does not work . . . . . . . . . . . . . . . 81
The cicslterm client cannot connect to a region . . . . . . . . . . . . 81
Function keys do not work . . . . . . . . . . . . . . . . . . . . 82
The cicslterm client behaves differently when connected to different regions 82
The cicslterm client does not display field attributes correctly . . . . . . . 82
The cicslterm client does not work with a given terminal type . . . . . . . 83
Purge behavior initiated with the cicslterm command . . . . . . . . . . 83
When cicsteld does not work when started from the inetd daemon . . . . . . 83
Resolving problems with cicstermp emulation . . . . . . . . . . . . . . 83
When cicstermp does not work . . . . . . . . . . . . . . . . . . 83
Errors when printing to a local print queue . . . . . . . . . . . . . . 84
Chapter 13. Using CICS trace . . . . . . . . . . . . . . . . . . . 85
Types of trace information . . . . . . . . . . . . . . . . . . . . . 86
Enabling and requesting trace . . . . . . . . . . . . . . . . . . . 87
Enabling trace . . . . . . . . . . . . . . . . . . . . . . . . 88
Requesting trace . . . . . . . . . . . . . . . . . . . . . . . 88
Setting trace values administratively . . . . . . . . . . . . . . . . . 89
Application trace . . . . . . . . . . . . . . . . . . . . . . . . 89
Collecting application trace . . . . . . . . . . . . . . . . . . . 89
Storing application trace . . . . . . . . . . . . . . . . . . . . 90
Reading application trace . . . . . . . . . . . . . . . . . . . . 90
System trace . . . . . . . . . . . . . . . . . . . . . . . . . 91
Collecting system trace . . . . . . . . . . . . . . . . . . . . . 92
Storing system trace . . . . . . . . . . . . . . . . . . . . . . 94
Setting system-trace values dynamically . . . . . . . . . . . . . . 97
Reading system trace . . . . . . . . . . . . . . . . . . . . . 97
Summary of trace-related RD stanza entries . . . . . . . . . . . . . . 99
CICSTRACE environment variable . . . . . . . . . . . . . . . . . . 99
Contents v
||||||
Problems with trace output . . . . . . . . . . . . . . . . . . . . 100
Trace output has gone to the wrong destination . . . . . . . . . . . 100
The required trace data is missing . . . . . . . . . . . . . . . . 100
Chapter 14. Using CICS dump . . . . . . . . . . . . . . . . . . 103
Setting the dump destination . . . . . . . . . . . . . . . . . . . 103
Controlling dump output . . . . . . . . . . . . . . . . . . . . . 104
Formatting a dump . . . . . . . . . . . . . . . . . . . . . . . 105
Dump file name . . . . . . . . . . . . . . . . . . . . . . . 105
Understanding the format of a dump . . . . . . . . . . . . . . . . 106
Problems with dump output . . . . . . . . . . . . . . . . . . . . 107
You have not formatted the correct dump . . . . . . . . . . . . . . 107
Dump is incomplete . . . . . . . . . . . . . . . . . . . . . . 107
You did not get a dump when an abnormal termination occurred . . . . . 108
Some dump IDs were missing from the sequence of dumps . . . . . . . 108
You did not get the correct data from a system dump . . . . . . . . . 108
Interpreting the dump . . . . . . . . . . . . . . . . . . . . . . 109
You have a problem with the region configuration . . . . . . . . . . . 109
Transaction does not run . . . . . . . . . . . . . . . . . . . . 109
CICS terminated abnormally . . . . . . . . . . . . . . . . . . 109
You have a problem in an application . . . . . . . . . . . . . . . 109
A storage violation occurred . . . . . . . . . . . . . . . . . . . 110
A transaction terminated abnormally . . . . . . . . . . . . . . . . 110
General program information in the dump . . . . . . . . . . . . . . . 110
Abends caused by Conditions from EXEC CICS commands . . . . . . . 111
Analysis of A158 abends . . . . . . . . . . . . . . . . . . . . 111
Analysis of ASRA Abends . . . . . . . . . . . . . . . . . . . 111
Analysis of A012 Abends in IBM Cobol programs . . . . . . . . . . . 114
Analysis of ASRA Abends in non-CICS C subroutines . . . . . . . . . 114
Chapter 15. Working with your support organization . . . . . . . . . 117
What your support organization needs to know . . . . . . . . . . . . . 117
About the problem . . . . . . . . . . . . . . . . . . . . . . 118
About your environment . . . . . . . . . . . . . . . . . . . . 118
About the circumstances . . . . . . . . . . . . . . . . . . . . 118
Sending documentation to the support organization . . . . . . . . . . . 118
Running cicsservice . . . . . . . . . . . . . . . . . . . . . 120
Preparing additional information . . . . . . . . . . . . . . . . . 121
Receiving a solution to the problem . . . . . . . . . . . . . . . . . 121
Applying a patch . . . . . . . . . . . . . . . . . . . . . . . 122
Appendix. CICS module identifiers . . . . . . . . . . . . . . . . 123
CICS API modules . . . . . . . . . . . . . . . . . . . . . . . 123
Terminal modules . . . . . . . . . . . . . . . . . . . . . . . 123
Data control modules . . . . . . . . . . . . . . . . . . . . . . 123
Task control modules . . . . . . . . . . . . . . . . . . . . . . 123
Communications modules . . . . . . . . . . . . . . . . . . . . 124
Control modules . . . . . . . . . . . . . . . . . . . . . . . . 124
CICS storage modules . . . . . . . . . . . . . . . . . . . . . 124
CICS support modules . . . . . . . . . . . . . . . . . . . . . 124
CICS information modules . . . . . . . . . . . . . . . . . . . . 124
Region database modules . . . . . . . . . . . . . . . . . . . . 125
Administration modules . . . . . . . . . . . . . . . . . . . . . 125
Notices . . . . . . . . . . . . . . . . . . . . . . . . . . . 127
Trademarks and service marks . . . . . . . . . . . . . . . . . . 128
vi TXSeries for Multiplatforms: Problem Determination Guide

Index . . . . . . . . . . . . . . . . . . . . . . . . . . . . 131
Contents vii

viii TXSeries for Multiplatforms: Problem Determination Guide
Figures
1. Working through a problem . . . . . . . . . . . . . . . . . . . . . . . . . . . 1
2. Example output from db2diag.log . . . . . . . . . . . . . . . . . . . . . . . . . 11
3. Example output from dtcxa.log . . . . . . . . . . . . . . . . . . . . . . . . . . 11
4. Sample syslog entry for XA error . . . . . . . . . . . . . . . . . . . . . . . . . 73
5. CICS Console Message: Cannot load a switch load file . . . . . . . . . . . . . . . . 74
6. CICS Console Message: Cannot Open Informix Database . . . . . . . . . . . . . . . 75
7. Oracle XA Trace File: Nonexistent User Put in Open String . . . . . . . . . . . . . . . 76
8. CICS Console Message: Nonexistent User . . . . . . . . . . . . . . . . . . . . . 76
9. Sample Oracle XA Trace File: Server Configured Remotely . . . . . . . . . . . . . . . 76
10. Oracle XA Trace Entry: SELECT Privilege Not Granted to V$XATRANS$ View . . . . . . . . 77
11. Sybase XA Trace File: Wrong Password for User sa in Open String . . . . . . . . . . . . 78
12. CICS Console Messages: Wrong Password for User sa in Sybase Open String . . . . . . . . 79
13. Sybase XA Trace: Wrong LRM Name in Sybase Open String . . . . . . . . . . . . . . 79
14. Sybase XA Trace: Wrong Server Name in Sybase xa_config File . . . . . . . . . . . . . 79
15. The CICS trace model: each CICS process is traced separately, and start-up values are stored in
the master trace area . . . . . . . . . . . . . . . . . . . . . . . . . . . . . 86
16. The types of CICS trace . . . . . . . . . . . . . . . . . . . . . . . . . . . . 87
17. The relationship of CICS trace types to RD stanza attributes . . . . . . . . . . . . . . . 88
18. Fragment of a file containing application trace . . . . . . . . . . . . . . . . . . . . 91
19. Fragment of a file containing system trace . . . . . . . . . . . . . . . . . . . . . 98
© Copyright IBM Corp. 1999, 2008 ix

x TXSeries for Multiplatforms: Problem Determination Guide
Tables
1. Road map for the CICS Problem Determination Guide book . . . . . . . . . . . . . . . xiii
2. Conventions that are used in this book . . . . . . . . . . . . . . . . . . . . . . . xiv
3. Classifying the problem . . . . . . . . . . . . . . . . . . . . . . . . . . . . . 5
4. Sources of information . . . . . . . . . . . . . . . . . . . . . . . . . . . . . 7
5. Contents of the message logs and transient data destinations . . . . . . . . . . . . . . . 8
6. Application debugging tools . . . . . . . . . . . . . . . . . . . . . . . . . . . 35
7. Common problems when using Oracle . . . . . . . . . . . . . . . . . . . . . . . 77
8. Types of system-trace events . . . . . . . . . . . . . . . . . . . . . . . . . . 92
9. CICS process-type identifiers used in tracing . . . . . . . . . . . . . . . . . . . . 94
10. Example problem reporting sheet . . . . . . . . . . . . . . . . . . . . . . . . 117
© Copyright IBM Corp. 1999, 2008 xi

xii TXSeries for Multiplatforms: Problem Determination Guide
About this book
This book is intended to help you determine the causes of problems in a CICS®
system. The book provides information to help you solve CICS application and
system problems, and tells you how to use your support organization.
Who should read this book
This book is for those who are responsible for debugging CICS systems and
application programs.
This book assumes that you have a good knowledge of CICS systems. If you are
using the book to solve system problems, you need to be familiar with the books
that tell you how to install and use a CICS system.
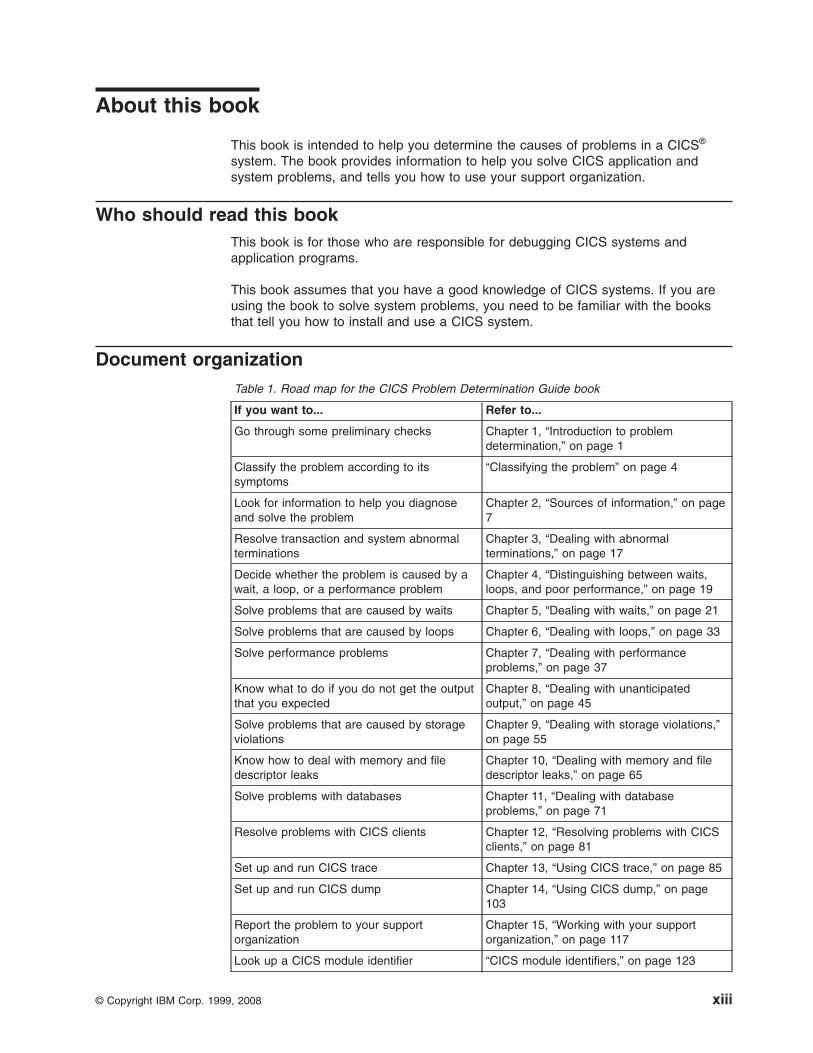
Document organization
Table 1. Road map for the CICS Problem Determination Guide book
If you want to... Refer to...
Go through some preliminary checks Chapter 1, “Introduction to problem
determination,” on page 1
Classify the problem according to its
symptoms
“Classifying the problem” on page 4
Look for information to help you diagnose
and solve the problem
Chapter 2, “Sources of information,” on page
7
Resolve transaction and system abnormal
terminations
Chapter 3, “Dealing with abnormal
terminations,” on page 17
Decide whether the problem is caused by a
wait, a loop, or a performance problem
Chapter 4, “Distinguishing between waits,
loops, and poor performance,” on page 19
Solve problems that are caused by waits Chapter 5, “Dealing with waits,” on page 21
Solve problems that are caused by loops Chapter 6, “Dealing with loops,” on page 33
Solve performance problems Chapter 7, “Dealing with performance
problems,” on page 37
Know what to do if you do not get the output
that you expected
Chapter 8, “Dealing with unanticipated
output,” on page 45
Solve problems that are caused by storage
violations
Chapter 9, “Dealing with storage violations,”
on page 55
Know how to deal with memory and file
descriptor leaks
Chapter 10, “Dealing with memory and file
descriptor leaks,” on page 65
Solve problems with databases Chapter 11, “Dealing with database
problems,” on page 71
Resolve problems with CICS clients Chapter 12, “Resolving problems with CICS
clients,” on page 81
Set up and run CICS trace Chapter 13, “Using CICS trace,” on page 85
Set up and run CICS dump Chapter 14, “Using CICS dump,” on page
103
Report the problem to your support
organization
Chapter 15, “Working with your support
organization,” on page 117
Look up a CICS module identifier “CICS module identifiers,” on page 123
© Copyright IBM Corp. 1999, 2008 xiii
Conventions used in this book
TXSeries® for Multiplatforms documentation uses the following typographical and
keying conventions.
Table 2. Conventions that are used in this book
Convention Meaning
Bold Indicates values that you must use literally, such as commands,
functions, and resource definition attributes and their values. When
referring to graphical user interfaces (GUIs), bold also indicates
menus, menu items, labels, buttons, icons, and folders.
Monospace Indicates text that you must enter at a command prompt. Monospace
also indicates screen text and code examples.
Italics Indicates variable values that you must provide (for example, you
supply the name of a file for file_name). Italics also indicates
emphasis and the titles of books.
< > Encloses the names of keys on the keyboard.
<Ctrl-x> Where x is the name of a key, indicates a control-character
sequence. For example, <Ctrl-c> means hold down the Ctrl key
while you press the c key.
<Return> Refers to the key labeled with the word Return, the word Enter, or
the left arrow.
% Represents the UNIX® command-shell prompt for a command that
does not require root privileges.
# Represents the UNIX command-shell prompt for a command that
requires root privileges.
C:\> Represents the Windows® command prompt.
> When used to describe a menu, shows a series of menu selections.
For example, ″Select File > New″ means ″From the File menu,
select the New command.″
Entering commands When instructed to “enter” or “issue” a command, type the command
and then press <Return>. For example, the instruction “Enter the ls
command” means type ls at a command prompt and then press
<Return>.
[ ] Encloses optional items in syntax descriptions.
{ } Encloses lists from which you must choose an item in syntax
descriptions.
| Separates items in a list of choices enclosed in { } (braces) in syntax
descriptions.
... Ellipses in syntax descriptions indicate that you can repeat the
preceding item one or more times. Ellipses in examples indicate that
information was omitted from the example for the sake of brevity.
IN In function descriptions, indicates parameters whose values are used
to pass data to the function. These parameters are not used to
return modified data to the calling routine. (Do not include the IN
declaration in your code.)
OUT In function descriptions, indicates parameters whose values are used
to return modified data to the calling routine. These parameters are
not used to pass data to the function. (Do not include the OUT
declaration in your code.)
xiv TXSeries for Multiplatforms: Problem Determination Guide
Table 2. Conventions that are used in this book (continued)
Convention Meaning
INOUT In function descriptions, indicates parameters whose values are
passed to the function, modified by the function, and returned to the
calling routine. These parameters serve as both IN and OUT
parameters. (Do not include the INOUT declaration in your code.)
$CICS Indicates the full path name of the location in which the CICS
product is installed; for example, /usr/lpp/cics on AIX®. If the CICS
environment variable is set to the product path name, you can use
the examples exactly as shown in this book; otherwise, you must
replace all instances of $CICS with the CICS product path name.
CICS on Open
Systems
Refers collectively to the CICS product for all supported UNIX
platforms.
TXSeries for
Multiplatforms
Refers collectively to the CICS for AIX, CICS for HP-UX (HP-UX
PA-RISC and HP-UX IPF), CICS for Solaris, and CICS for Windows
products.
CICS Refers generically to the CICS for AIX, CICS for HP-UX, CICS for
Solaris, and CICS for Windows products. Other CICS products in the
CICS Family are distinguished by their operating system (for
example, IBM® mainframe-based CICS for the z/OS platform).
How to send your comments
Your feedback is important in helping to provide the most accurate and highest
quality information. If you have any comments about this book or any other
TXSeries for Multiplatforms documentation, send your comments by e-mail to
[email protected]. Be sure to include the name of the book, the document
number of the book, the version of TXSeries for Multiplatforms, and, if applicable,
the specific location of the information you are commenting on (for example, a page
number or table number).
About this book xv

xvi TXSeries for Multiplatforms: Problem Determination Guide
Chapter 1. Introduction to problem determination
To solve problems with your CICS system, you usually start with a symptom, or set
of symptoms, and trace them back to their cause. This book describes tools and
techniques you can use to find the cause of a problem and suggests actions for
solving the problem.
Sometimes you cannot solve the problem yourself if, for example, it is caused by a
limitation in the hardware or software that you are using. If the cause of the problem
is CICS code, you need to contact your support organization, as described in
Chapter 15, “Working with your support organization,” on page 117.
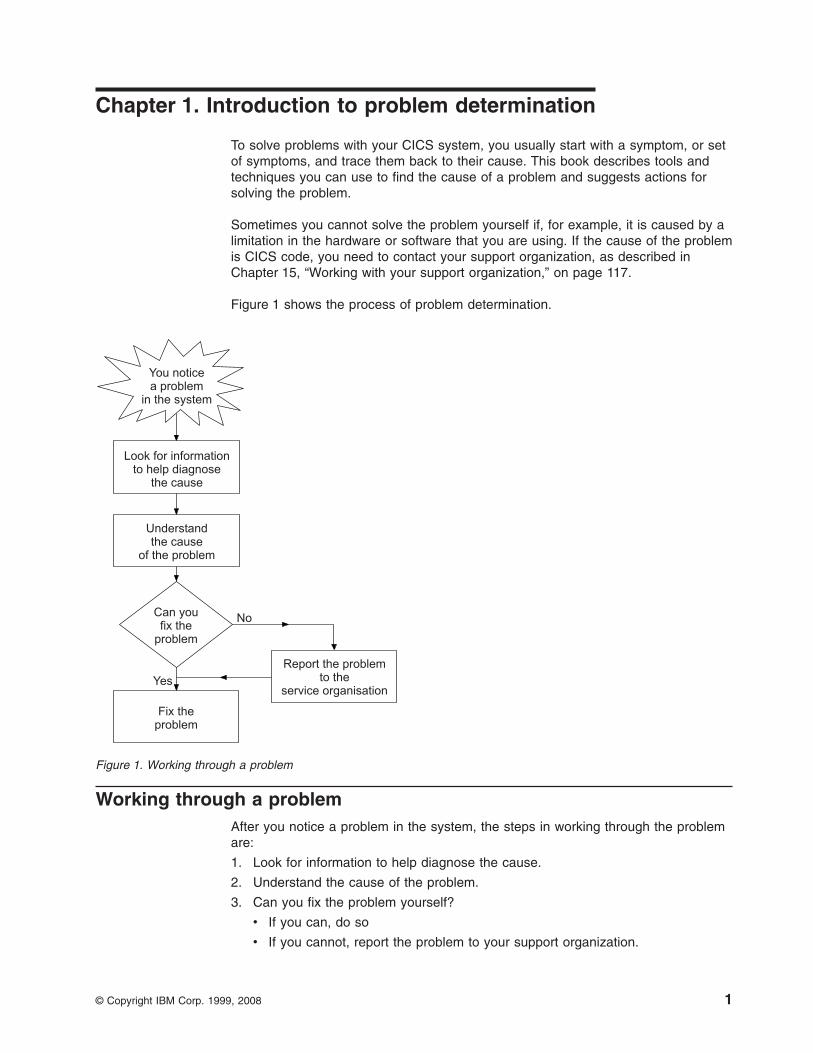
Figure 1 shows the process of problem determination.
Working through a problem
After you notice a problem in the system, the steps in working through the problem
are:
1. Look for information to help diagnose the cause.
2. Understand the cause of the problem.
3. Can you fix the problem yourself?
v If you can, do so
v If you cannot, report the problem to your support organization.
Figure 1. Working through a problem
© Copyright IBM Corp. 1999, 2008 1
Preliminary checks
Before you go further into looking for the cause of the problem, perform the
following preliminary checks. These checks might highlight a simple cause or
narrow the range of possible causes.
When you go through the questions, note anything that is relevant to the problem.
Even if your observations do not at first suggest a cause, they can be useful if you
look at the problem in more detail later.
Do not discard information because you do not think it is correct. Corrupt data often
reveals what might be going wrong.
1. Are you the first person to have a problem invoking the CICS region?
a. Check that you have set the region up correctly.
2. Have you any messages that explain the error?
a. Check the message logs as described in “Abnormal termination codes and
error messages” on page 7 and refer to TXSeries for Multiplatforms
Messages and Codes for an explanation.
3. Can you reproduce the error?
a. Can you identify any application that is always in the system when the
problem occurs?
v Check for application-coding errors.
v Check whether you have defined enough memory in the three CICS
pools:
– Task-Private
– Task-Shared
– Region
b. Check whether your CICS resource definitions are correctly defined. See
TXSeries for Multiplatforms Administration Guide for guidance on setting up
your CICS system.
c. Does the problem seem to be related to system loading? If so, the system
might be running near its maximum capacity, or it might need tuning. On all
systems except Windows, you can use ps, sar iostat, and other
operating-system utilities to find out the system loading. For more
information about optimizing CICS for Windows, see TXSeries for
Multiplatforms Administration Guide.
4. Does the error occur at specific times of day? If the error occurs at specific
times of day, the error might be dependent on system loading. Typically, peak
system loading is at mid-morning and mid-afternoon, so those are the times
when load-dependent errors are most likely to occur. If your CICS network
extends across more than one time zone, peak system loading might occur at
another time of day.
5. Is the error intermittent?
If an error is intermittent, particularly if it does not always show the same
symptoms, the problem might be more difficult to solve. In some such cases,
the transaction that caused the error might have exited from the system long
before the symptoms start to occur.
See Chapter 8, “Dealing with unanticipated output,” on page 45 for more
information.
6. Have any changes been made since the last successful run?
Service
a. Have you applied a patch or PTF (FixPack for Windows) to CICS?
2 TXSeries for Multiplatforms: Problem Determination Guide
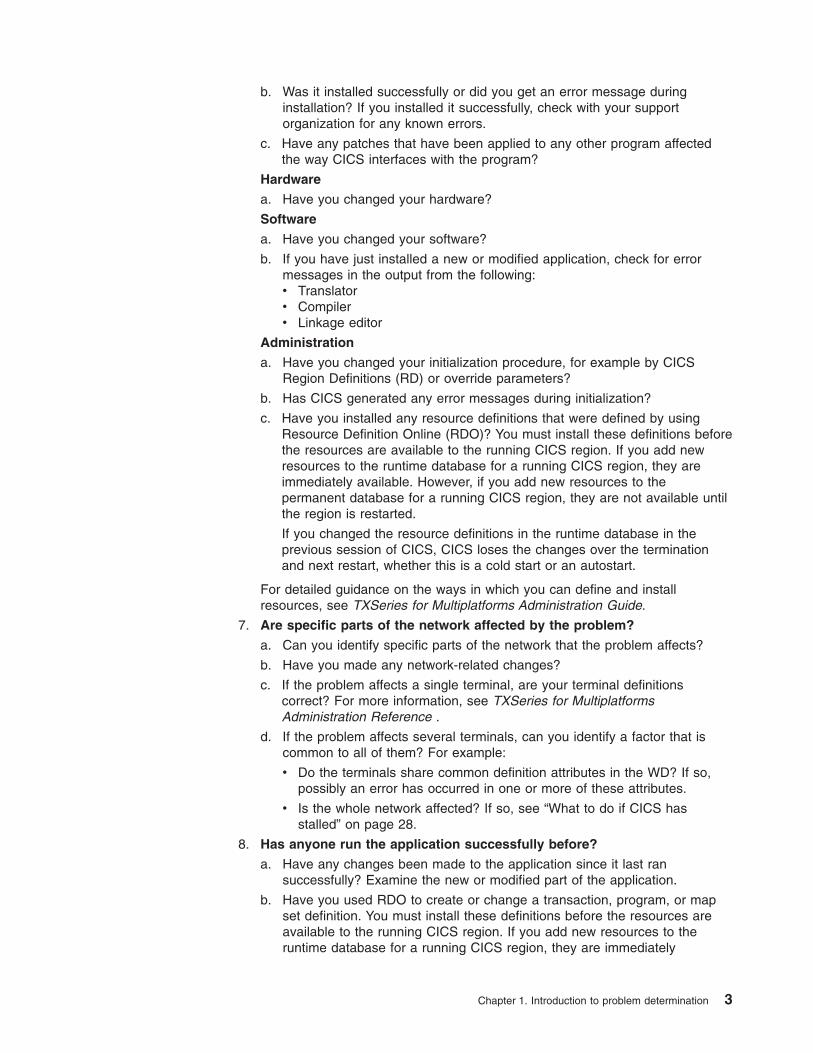
b. Was it installed successfully or did you get an error message during
installation? If you installed it successfully, check with your support
organization for any known errors.
c. Have any patches that have been applied to any other program affected
the way CICS interfaces with the program?
Hardware
a. Have you changed your hardware?
Software
a. Have you changed your software?
b. If you have just installed a new or modified application, check for error
messages in the output from the following:
v Translator
v Compiler
v Linkage editor
Administration
a. Have you changed your initialization procedure, for example by CICS
Region Definitions (RD) or override parameters?
b. Has CICS generated any error messages during initialization?
c. Have you installed any resource definitions that were defined by using
Resource Definition Online (RDO)? You must install these definitions before
the resources are available to the running CICS region. If you add new
resources to the runtime database for a running CICS region, they are
immediately available. However, if you add new resources to the
permanent database for a running CICS region, they are not available until
the region is restarted.
If you changed the resource definitions in the runtime database in the
previous session of CICS, CICS loses the changes over the termination
and next restart, whether this is a cold start or an autostart.
For detailed guidance on the ways in which you can define and install
resources, see TXSeries for Multiplatforms Administration Guide.
7. Are specific parts of the network affected by the problem?
a. Can you identify specific parts of the network that the problem affects?
b. Have you made any network-related changes?
c. If the problem affects a single terminal, are your terminal definitions
correct? For more information, see TXSeries for Multiplatforms
Administration Reference .
d. If the problem affects several terminals, can you identify a factor that is
common to all of them? For example:
v Do the terminals share common definition attributes in the WD? If so,
possibly an error has occurred in one or more of these attributes.
v Is the whole network affected? If so, see “What to do if CICS has
stalled” on page 28.
8. Has anyone run the application successfully before?
a. Have any changes been made to the application since it last ran
successfully? Examine the new or modified part of the application.
b. Have you used RDO to create or change a transaction, program, or map
set definition. You must install these definitions before the resources are
available to the running CICS region. If you add new resources to the
runtime database for a running CICS region, they are immediately
Chapter 1. Introduction to problem determination 3
available. However, if you add new resources to the permanent database
for a running CICS region, they are not available until the region is
restarted.
c. If you changed any maps, have you created both a new physical map and
a new symbolic map, and compiled every program that is using that new
symbolic map? Find out what the application was doing when the error
occurred, and check the source code in that part of the program.
If a program has run successfully on many previous occasions, use trace
and dump information to examine the contents of any records, screen data,
and files that the application was processing when the error occurred. They
might contain an unusual data value that causes the program to perform a
rarely used function.
d. Check that the application successfully retrieved the records that it required
at the time of the error. You can use CICS trace to do this. If more than
one method of accessing the information is available, check that the data
can be accessed in precisely the same way that the program would have
done.
e. Check that all fields within the records at the time of the error contain data
that is in a format that is acceptable to the program. You can use CICS
dump to do this.
If you can reproduce the problem in your test system, you can use
programming language debug tools and the CEDF transaction to help you
check the data and solve the problem.
9. The application has not run successfully before If the application has not
run successfully before, examine it for errors.
a. Check the output from the translator, the compiler and the linkage editor, to
determine whether any errors were reported.
If your application does not translate, compile, link-edit cleanly, or copy into
the correct directory, the application cannot run when you invoke it.
b. Check the coding logic of the application. The symptoms of the error might
indicate a particular function and, therefore, a particular section of code.
c. Check whether you have the correct release of compiler for the supporting
programming languages for your release of CICS. See the planning and
installation information for your product for details.
10. Does the problem involve software other than CICS?
a. Check whether the operating system is operating.
Classifying the problem
This book groups problems into the following broad categories:
v Abnormal termination
v Waits
v Loops
v Performance problems
v Unanticipated output
v Storage violations
v Problems that involve the operating system
v Problems that involve databases
Assigning your problem to a class of problem can help in the following ways:
v It can point you to an appropriate course of action to solve the problem.
v It can indicate common problems across your organization.
4 TXSeries for Multiplatforms: Problem Determination Guide
v It can help IBM to search for information about the problem.
Your support organization maintains a database called RETAIN® of all known
problems. This database is continually updated. If you have access to this
database, you can use the problem classification to search the database and see
whether other users have encountered a similar problem.
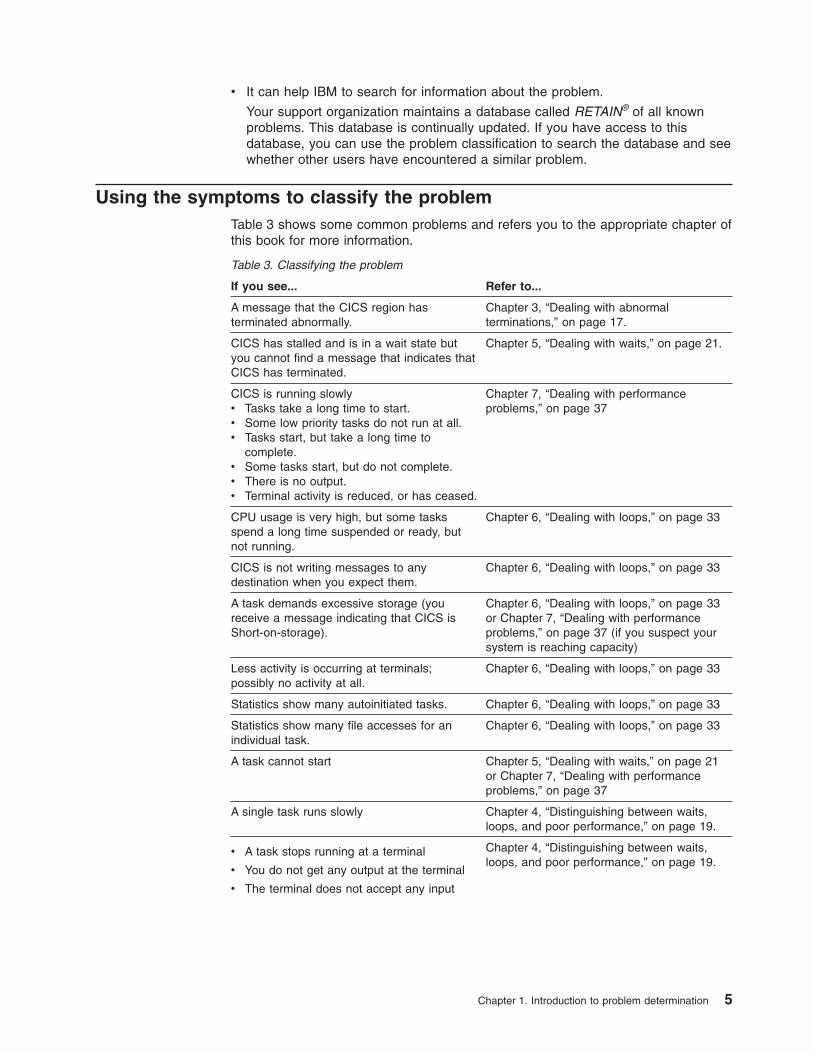
Using the symptoms to classify the problem
Table 3 shows some common problems and refers you to the appropriate chapter of
this book for more information.
Table 3. Classifying the problem
If you see... Refer to...
A message that the CICS region has
terminated abnormally.
Chapter 3, “Dealing with abnormal
terminations,” on page 17.
CICS has stalled and is in a wait state but
you cannot find a message that indicates that
CICS has terminated.
Chapter 5, “Dealing with waits,” on page 21.
CICS is running slowly
v Tasks take a long time to start.
v Some low priority tasks do not run at all.
v Tasks start, but take a long time to
complete.
v Some tasks start, but do not complete.
v There is no output.
v Terminal activity is reduced, or has ceased.
Chapter 7, “Dealing with performance
problems,” on page 37
CPU usage is very high, but some tasks
spend a long time suspended or ready, but
not running.
Chapter 6, “Dealing with loops,” on page 33
CICS is not writing messages to any
destination when you expect them.
Chapter 6, “Dealing with loops,” on page 33
A task demands excessive storage (you
receive a message indicating that CICS is
Short-on-storage).
Chapter 6, “Dealing with loops,” on page 33
or Chapter 7, “Dealing with performance
problems,” on page 37 (if you suspect your
system is reaching capacity)
Less activity is occurring at terminals;
possibly no activity at all.
Chapter 6, “Dealing with loops,” on page 33
Statistics show many autoinitiated tasks. Chapter 6, “Dealing with loops,” on page 33
Statistics show many file accesses for an
individual task.
Chapter 6, “Dealing with loops,” on page 33
A task cannot start Chapter 5, “Dealing with waits,” on page 21
or Chapter 7, “Dealing with performance
problems,” on page 37
A single task runs slowly Chapter 4, “Distinguishing between waits,
loops, and poor performance,” on page 19.
v A task stops running at a terminal
v You do not get any output at the terminal
v The terminal does not accept any input
Chapter 4, “Distinguishing between waits,
loops, and poor performance,” on page 19.
Chapter 1. Introduction to problem determination 5
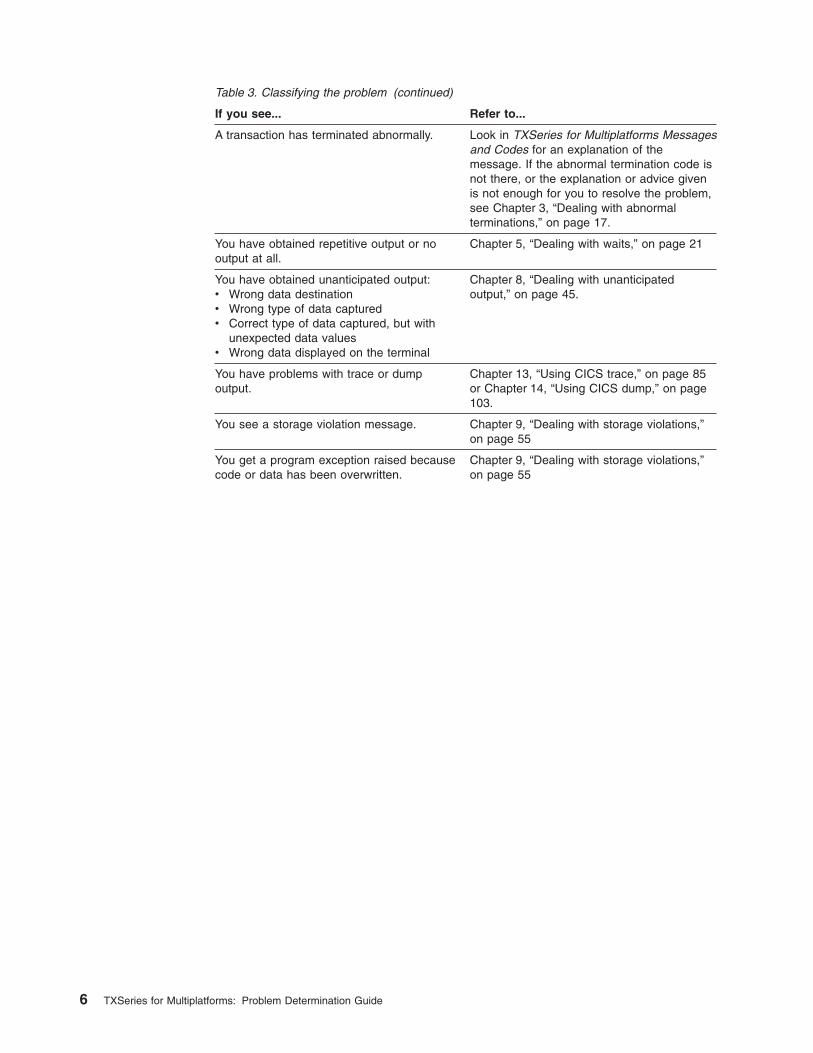
Table 3. Classifying the problem (continued)
If you see... Refer to...
A transaction has terminated abnormally. Look in TXSeries for Multiplatforms Messages
and Codes for an explanation of the
message. If the abnormal termination code is
not there, or the explanation or advice given
is not enough for you to resolve the problem,
see Chapter 3, “Dealing with abnormal
terminations,” on page 17.
You have obtained repetitive output or no
output at all.
Chapter 5, “Dealing with waits,” on page 21
You have obtained unanticipated output:
v Wrong data destination
v Wrong type of data captured
v Correct type of data captured, but with
unexpected data values
v Wrong data displayed on the terminal
Chapter 8, “Dealing with unanticipated
output,” on page 45.
You have problems with trace or dump
output.
Chapter 13, “Using CICS trace,” on page 85
or Chapter 14, “Using CICS dump,” on page
103.
You see a storage violation message. Chapter 9, “Dealing with storage violations,”
on page 55
You get a program exception raised because
code or data has been overwritten.
Chapter 9, “Dealing with storage violations,”
on page 55
6 TXSeries for Multiplatforms: Problem Determination Guide
Chapter 2. Sources of information
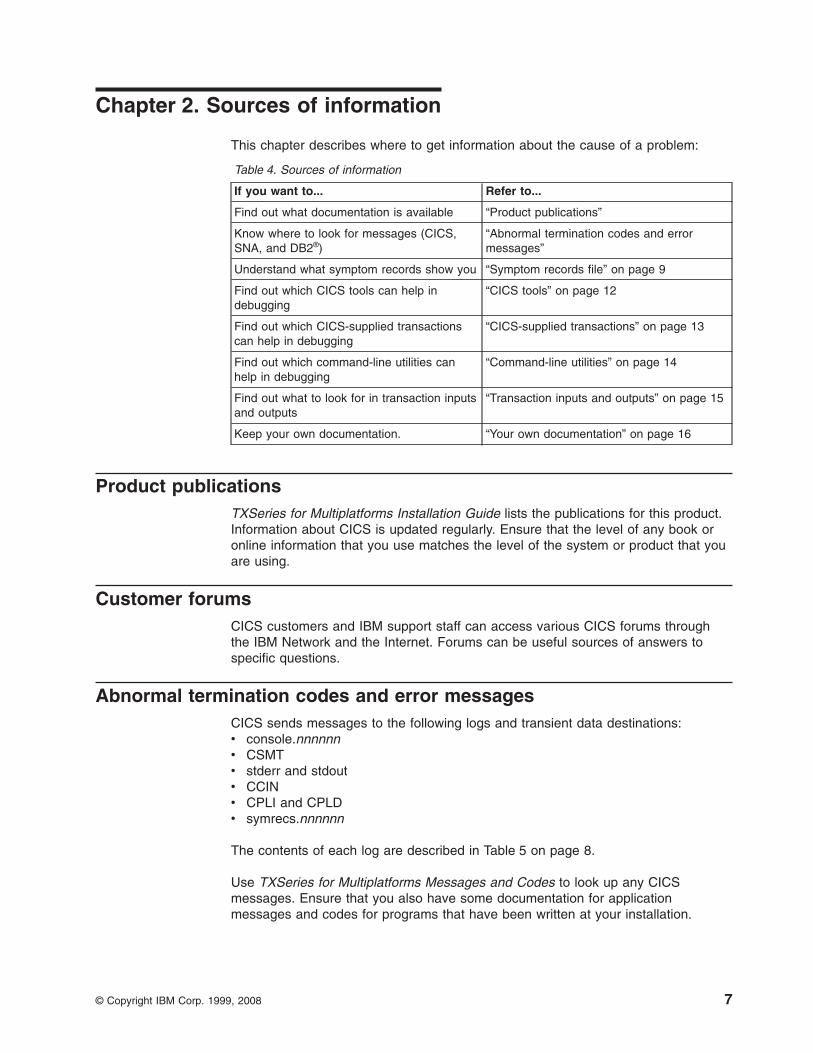
This chapter describes where to get information about the cause of a problem:
Table 4. Sources of information
If you want to... Refer to...
Find out what documentation is available “Product publications”
Know where to look for messages (CICS,
SNA, and DB2®)
“Abnormal termination codes and error
messages”
Understand what symptom records show you “Symptom records file” on page 9
Find out which CICS tools can help in
debugging
“CICS tools” on page 12
Find out which CICS-supplied transactions
can help in debugging
“CICS-supplied transactions” on page 13
Find out which command-line utilities can
help in debugging
“Command-line utilities” on page 14
Find out what to look for in transaction inputs
and outputs
“Transaction inputs and outputs” on page 15
Keep your own documentation. “Your own documentation” on page 16
Product publications
TXSeries for Multiplatforms Installation Guide lists the publications for this product.
Information about CICS is updated regularly. Ensure that the level of any book or
online information that you use matches the level of the system or product that you
are using.
Customer forums
CICS customers and IBM support staff can access various CICS forums through
the IBM Network and the Internet. Forums can be useful sources of answers to
specific questions.
Abnormal termination codes and error messages
CICS sends messages to the following logs and transient data destinations:
v console.nnnnnn
v CSMT
v stderr and stdout
v CCIN
v CPLI and CPLD
v symrecs.nnnnnn
The contents of each log are described in Table 5 on page 8.
Use TXSeries for Multiplatforms Messages and Codes to look up any CICS
messages. Ensure that you also have some documentation for application
messages and codes for programs that have been written at your installation.
© Copyright IBM Corp. 1999, 2008 7
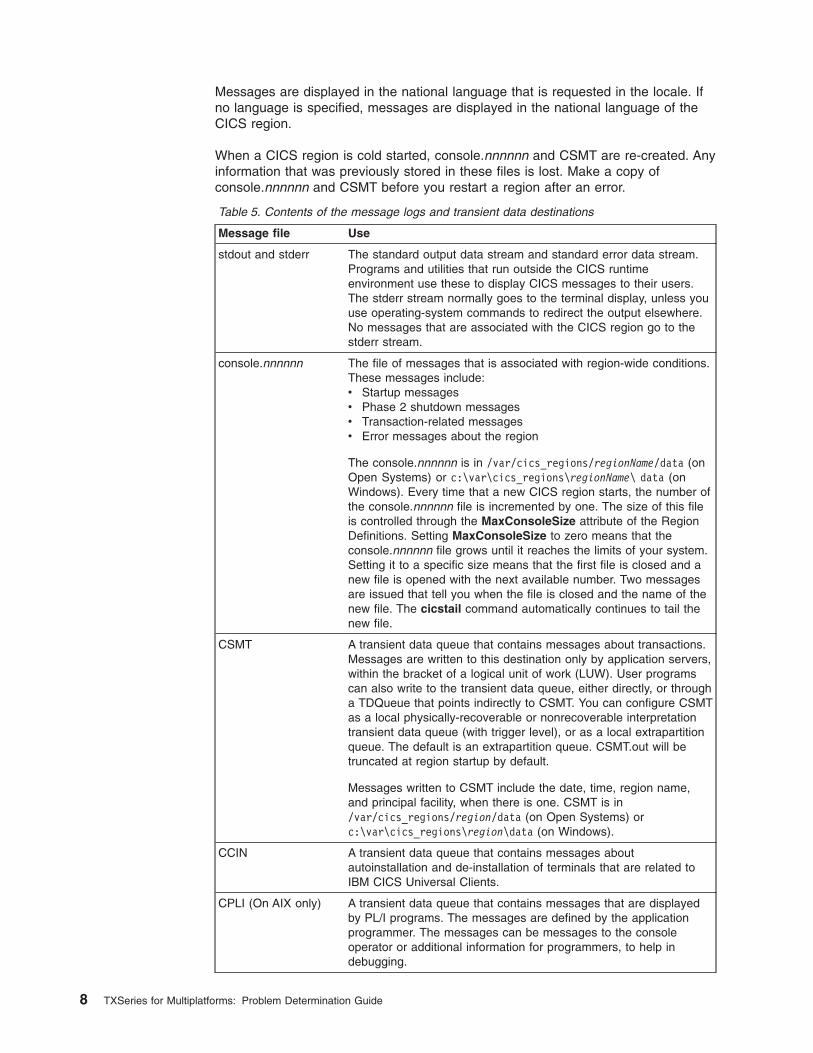
Messages are displayed in the national language that is requested in the locale. If
no language is specified, messages are displayed in the national language of the
CICS region.
When a CICS region is cold started, console.nnnnnn and CSMT are re-created. Any
information that was previously stored in these files is lost. Make a copy of
console.nnnnnn and CSMT before you restart a region after an error.
Table 5. Contents of the message logs and transient data destinations
Message file Use
stdout and stderr The standard output data stream and standard error data stream.
Programs and utilities that run outside the CICS runtime
environment use these to display CICS messages to their users.
The stderr stream normally goes to the terminal display, unless you
use operating-system commands to redirect the output elsewhere.
No messages that are associated with the CICS region go to the
stderr stream.
console.nnnnnn The file of messages that is associated with region-wide conditions.
These messages include:
v Startup messages
v Phase 2 shutdown messages
v Transaction-related messages
v Error messages about the region
The console.nnnnnn is in /var/cics_regions/regionName/data (on
Open Systems) or c:\var\cics_regions\regionName\ data (on
Windows). Every time that a new CICS region starts, the number of
the console.nnnnnn file is incremented by one. The size of this file
is controlled through the MaxConsoleSize attribute of the Region
Definitions. Setting MaxConsoleSize to zero means that the
console.nnnnnn file grows until it reaches the limits of your system.
Setting it to a specific size means that the first file is closed and a
new file is opened with the next available number. Two messages
are issued that tell you when the file is closed and the name of the
new file. The cicstail command automatically continues to tail the
new file.
CSMT A transient data queue that contains messages about transactions.
Messages are written to this destination only by application servers,
within the bracket of a logical unit of work (LUW). User programs
can also write to the transient data queue, either directly, or through
a TDQueue that points indirectly to CSMT. You can configure CSMT
as a local physically-recoverable or nonrecoverable interpretation
transient data queue (with trigger level), or as a local extrapartition
queue. The default is an extrapartition queue. CSMT.out will be
truncated at region startup by default.
Messages written to CSMT include the date, time, region name,
and principal facility, when there is one. CSMT is in
/var/cics_regions/region/data (on Open Systems) or
c:\var\cics_regions\region\data (on Windows).
CCIN A transient data queue that contains messages about
autoinstallation and de-installation of terminals that are related to
IBM CICS Universal Clients.
CPLI (On AIX only) A transient data queue that contains messages that are displayed
by PL/I programs. The messages are defined by the application
programmer. The messages can be messages to the console
operator or additional information for programmers, to help in
debugging.
8 TXSeries for Multiplatforms: Problem Determination Guide

Table 5. Contents of the message logs and transient data destinations (continued)
Message file Use
CPLD (On AIX only) A transient data queue that contains PL/I PLIDUMP commands.
These messages are for the application programmer.
Windows event log
(On Windows systems
only)
Contains messages similar to those in the console.nnnnnn file.
However, this is the only place where you find messages relating to
the operation of CICS as a Windows service. Three levels of log
exist: System, Security, and Application.
Symptom records file
When CICS detects potential software or system damage, it generates one or more
messages to report the symptom and writes the information automatically as a
symptom record (symrec). Examples of such conditions are corruption of the data
system, or a missing Region Definitions (RD). Conditions like these can possibly
result in an abnormal end of the CICS utility program or, if a failure occurs in a
region, an application server or the whole CICS region.
Symptom records contain information that assists your support organization. Check
whether you get all the symptom records that were generated at the time of the
error (use the TIME field), because sometimes more than one exists.
All symptom records are written as English ASCII text. You can examine them by
using standard utilities, such as the cat command on Open Systems or the type
command Windows, provided that the LANG environment variable is first set to the
U.S. language setting on your platform.
To prevent a symrecs file from becoming too large, you can restrict its size by using
the MaxConsoleSize attribute of the Region Definitions. When the upper limit is
reached, the file is closed and a new symrecs file is opened with the next available
number. A message at the end of the file indicates the name (and therefore the
number) of the new file.
When the CICS region writes a symptom record, the record is appended to the file
/var/cics_regions/regionName/symrecs.nnnnnn (on CICS for Open Systems) or
c:\var\cics_regions\regionName\symrecs.nnnnnn (on CICS for Windows). This file
does not exist until a symptom record is written. CICS appends to the
symrecs.nnnnnn file and never truncates it. Although the amount of information
written is generally small, you must ensure that the file does not grow indefinitely.
When a part of CICS other than the region, such as an RDO command like
cicsget, writes a symptom record, it is written to stderr.
A symptom record consists of two lines of data:
SYMPTOMS = primary
symptom data
SECONDARY SYMPTOMS = secondary symptom data
The primary symptom data contains the following information:
v TIME – When the condition is detected (TIME field)
v REGION – The region name
v PROD – The product component ID
v LVLS – The product level
v MOD – The module name and module-build timestamp
v FUNC, LINE, and MSN – Where in the code it happens
Chapter 2. Sources of information 9
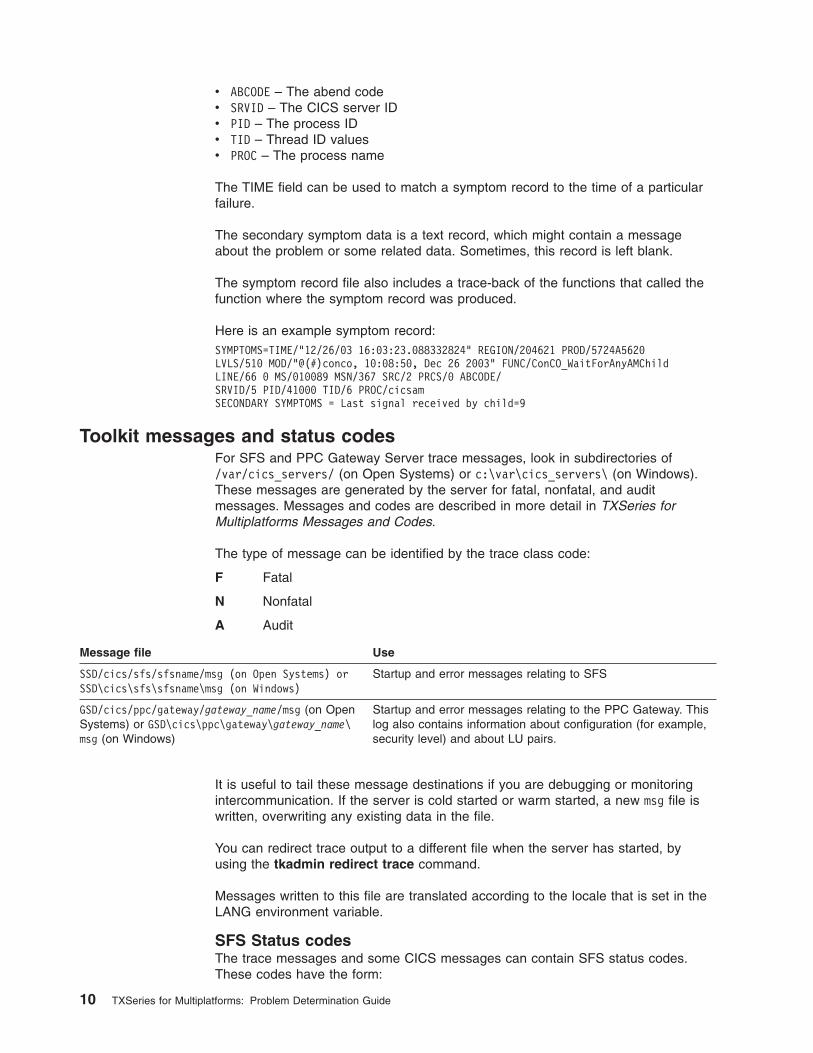
v ABCODE – The abend code
v SRVID – The CICS server ID
v PID – The process ID
v TID – Thread ID values
v PROC – The process name
The TIME field can be used to match a symptom record to the time of a particular
failure.
The secondary symptom data is a text record, which might contain a message
about the problem or some related data. Sometimes, this record is left blank.
The symptom record file also includes a trace-back of the functions that called the
function where the symptom record was produced.
Here is an example symptom record:
SYMPTOMS=TIME/"12/26/03 16:03:23.088332824" REGION/204621 PROD/5724A5620
LVLS/510 MOD/"@(#)conco, 10:08:50, Dec 26 2003" FUNC/ConCO_WaitForAnyAMChild
LINE/66 0 MS/010089 MSN/367 SRC/2 PRCS/0 ABCODE/
SRVID/5 PID/41000 TID/6 PROC/cicsam
SECONDARY SYMPTOMS = Last signal received by child=9
Toolkit messages and status codes
For SFS and PPC Gateway Server trace messages, look in subdirectories of
/var/cics_servers/ (on Open Systems) or c:\var\cics_servers\ (on Windows).
These messages are generated by the server for fatal, nonfatal, and audit
messages. Messages and codes are described in more detail in TXSeries for
Multiplatforms Messages and Codes.
The type of message can be identified by the trace class code:
F Fatal
N Nonfatal
A Audit
Message file Use
SSD/cics/sfs/sfsname/msg (on Open Systems) or
SSD\cics\sfs\sfsname\msg (on Windows)
Startup and error messages relating to SFS
GSD/cics/ppc/gateway/gateway_name/msg (on Open
Systems) or GSD\cics\ppc\gateway\gateway_name\msg (on Windows)
Startup and error messages relating to the PPC Gateway. This
log also contains information about configuration (for example,
security level) and about LU pairs.
It is useful to tail these message destinations if you are debugging or monitoring
intercommunication. If the server is cold started or warm started, a new msg file is
written, overwriting any existing data in the file.
You can redirect trace output to a different file when the server has started, by
using the tkadmin redirect trace command.
Messages written to this file are translated according to the locale that is set in the
LANG environment variable.
SFS Status codes
The trace messages and some CICS messages can contain SFS status codes.
These codes have the form:
10 TXSeries for Multiplatforms: Problem Determination Guide
ENC-component name - code
They are documented in the TXSeries for Multiplatforms Application Programming
Reference.
SNA messages
See TXSeries for Multiplatforms Intercommunication Guide for details of where to
look for SNA information.
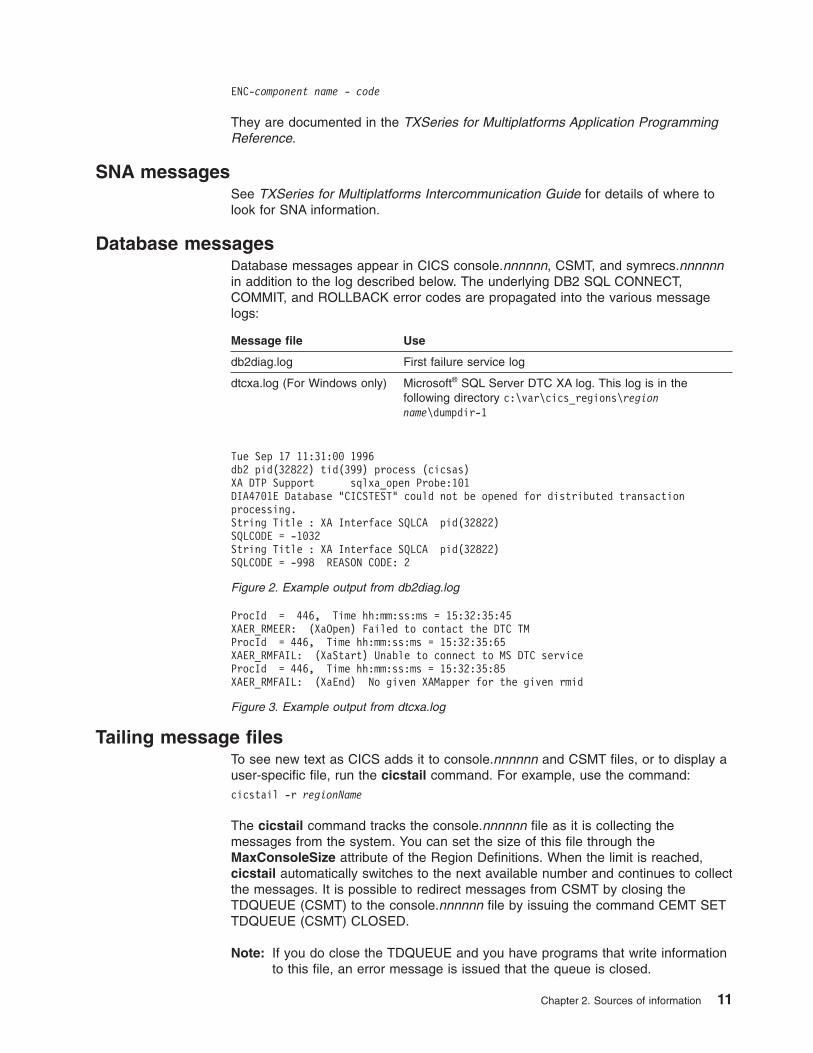
Database messages
Database messages appear in CICS console.nnnnnn, CSMT, and symrecs.nnnnnn
in addition to the log described below. The underlying DB2 SQL CONNECT,
COMMIT, and ROLLBACK error codes are propagated into the various message
logs:
Message file Use
db2diag.log First failure service log
dtcxa.log (For Windows only) Microsoft® SQL Server DTC XA log. This log is in the
following directory c:\var\cics_regions\region
name\dumpdir-1
Tailing message files
To see new text as CICS adds it to console.nnnnnn and CSMT files, or to display a
user-specific file, run the cicstail command. For example, use the command:
cicstail -r regionName
The cicstail command tracks the console.nnnnnn file as it is collecting the
messages from the system. You can set the size of this file through the
MaxConsoleSize attribute of the Region Definitions. When the limit is reached,
cicstail automatically switches to the next available number and continues to collect
the messages. It is possible to redirect messages from CSMT by closing the
TDQUEUE (CSMT) to the console.nnnnnn file by issuing the command CEMT SET
TDQUEUE (CSMT) CLOSED.
Note: If you do close the TDQUEUE and you have programs that write information
to this file, an error message is issued that the queue is closed.
Tue Sep 17 11:31:00 1996
db2 pid(32822) tid(399) process (cicsas)
XA DTP Support sqlxa_open Probe:101
DIA4701E Database "CICSTEST" could not be opened for distributed transaction
processing.
String Title : XA Interface SQLCA pid(32822)
SQLCODE = -1032
String Title : XA Interface SQLCA pid(32822)
SQLCODE = -998 REASON CODE: 2
Figure 2. Example output from db2diag.log
ProcId = 446, Time hh:mm:ss:ms = 15:32:35:45
XAER_RMEER: (XaOpen) Failed to contact the DTC TM
ProcId = 446, Time hh:mm:ss:ms = 15:32:35:65
XAER_RMFAIL: (XaStart) Unable to connect to MS DTC service
ProcId = 446, Time hh:mm:ss:ms = 15:32:35:85
XAER_RMFAIL: (XaEnd) No given XAMapper for the given rmid
Figure 3. Example output from dtcxa.log
Chapter 2. Sources of information 11
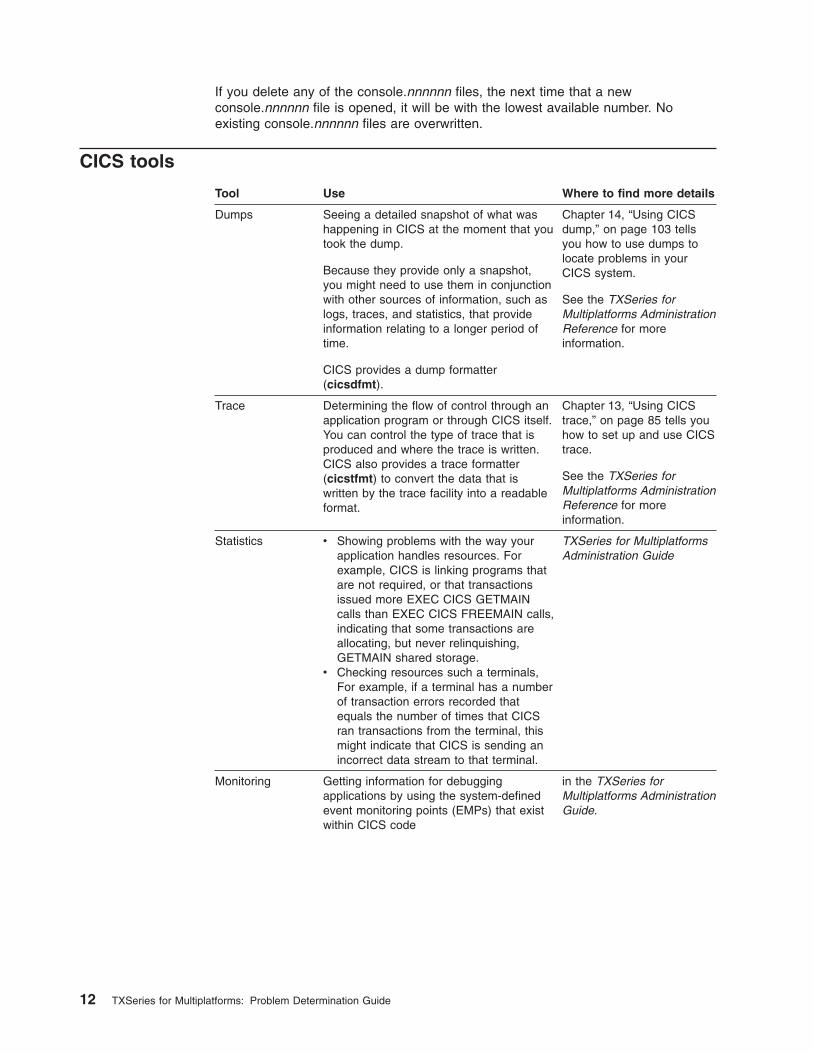
If you delete any of the console.nnnnnn files, the next time that a new
console.nnnnnn file is opened, it will be with the lowest available number. No
existing console.nnnnnn files are overwritten.
CICS tools
Tool Use Where to find more details
Dumps Seeing a detailed snapshot of what was
happening in CICS at the moment that you
took the dump.
Because they provide only a snapshot,
you might need to use them in conjunction
with other sources of information, such as
logs, traces, and statistics, that provide
information relating to a longer period of
time.
CICS provides a dump formatter
(cicsdfmt).
Chapter 14, “Using CICS
dump,” on page 103 tells
you how to use dumps to
locate problems in your
CICS system.
See the TXSeries for
Multiplatforms Administration
Reference for more
information.
Trace Determining the flow of control through an
application program or through CICS itself.
You can control the type of trace that is
produced and where the trace is written.
CICS also provides a trace formatter
(cicstfmt) to convert the data that is
written by the trace facility into a readable
format.
Chapter 13, “Using CICS
trace,” on page 85 tells you
how to set up and use CICS
trace.
See the TXSeries for
Multiplatforms Administration
Reference for more
information.
Statistics v Showing problems with the way your
application handles resources. For
example, CICS is linking programs that
are not required, or that transactions
issued more EXEC CICS GETMAIN
calls than EXEC CICS FREEMAIN calls,
indicating that some transactions are
allocating, but never relinquishing,
GETMAIN shared storage.
v Checking resources such a terminals,
For example, if a terminal has a number
of transaction errors recorded that
equals the number of times that CICS
ran transactions from the terminal, this
might indicate that CICS is sending an
incorrect data stream to that terminal.
TXSeries for Multiplatforms
Administration Guide
Monitoring Getting information for debugging
applications by using the system-defined
event monitoring points (EMPs) that exist
within CICS code
in the TXSeries for
Multiplatforms Administration
Guide.
12 TXSeries for Multiplatforms: Problem Determination Guide
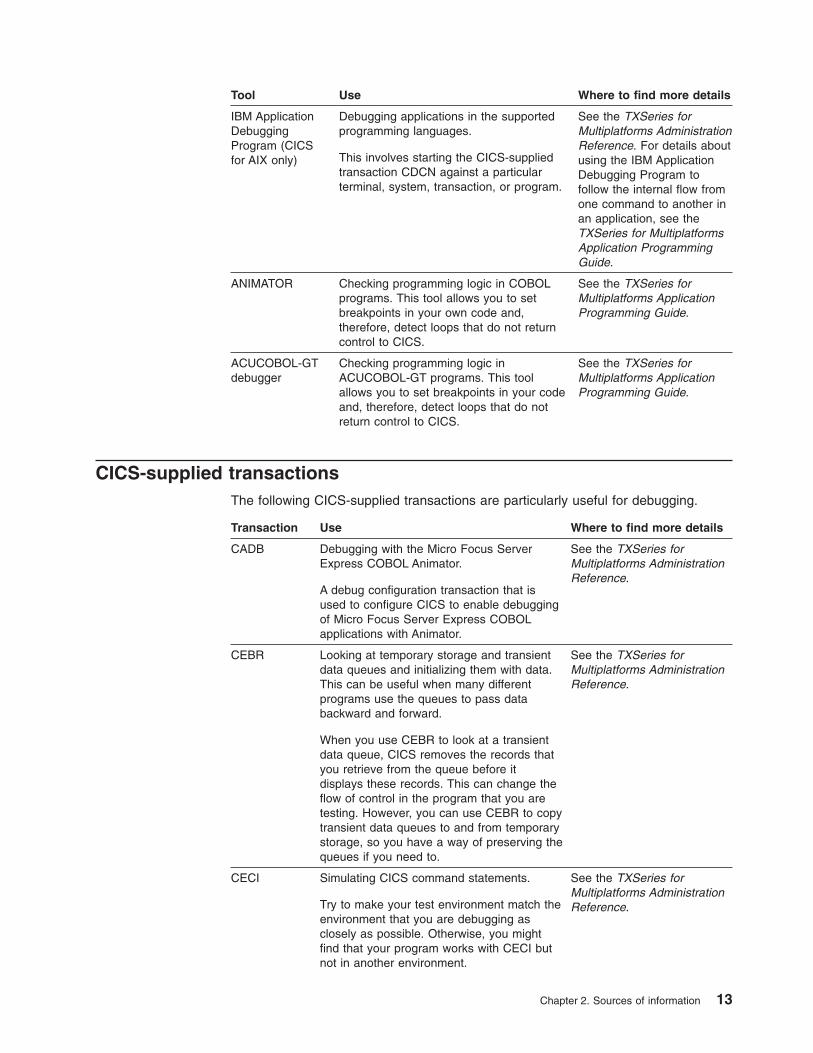
Tool Use Where to find more details
IBM Application
Debugging
Program (CICS
for AIX only)
Debugging applications in the supported
programming languages.
This involves starting the CICS-supplied
transaction CDCN against a particular
terminal, system, transaction, or program.
See the TXSeries for
Multiplatforms Administration
Reference. For details about
using the IBM Application
Debugging Program to
follow the internal flow from
one command to another in
an application, see the
TXSeries for Multiplatforms
Application Programming
Guide.
ANIMATOR Checking programming logic in COBOL
programs. This tool allows you to set
breakpoints in your own code and,
therefore, detect loops that do not return
control to CICS.
See the TXSeries for
Multiplatforms Application
Programming Guide.
ACUCOBOL-GT
debugger
Checking programming logic in
ACUCOBOL-GT programs. This tool
allows you to set breakpoints in your code
and, therefore, detect loops that do not
return control to CICS.
See the TXSeries for
Multiplatforms Application
Programming Guide.
CICS-supplied transactions
The following CICS-supplied transactions are particularly useful for debugging.
Transaction Use Where to find more details
CADB Debugging with the Micro Focus Server
Express COBOL Animator.
A debug configuration transaction that is
used to configure CICS to enable debugging
of Micro Focus Server Express COBOL
applications with Animator.
See the TXSeries for
Multiplatforms Administration
Reference.
CEBR Looking at temporary storage and transient
data queues and initializing them with data.
This can be useful when many different
programs use the queues to pass data
backward and forward.
When you use CEBR to look at a transient
data queue, CICS removes the records that
you retrieve from the queue before it
displays these records. This can change the
flow of control in the program that you are
testing. However, you can use CEBR to copy
transient data queues to and from temporary
storage, so you have a way of preserving the
queues if you need to.
See the TXSeries for
Multiplatforms Administration
Reference.
CECI Simulating CICS command statements.
Try to make your test environment match the
environment that you are debugging as
closely as possible. Otherwise, you might
find that your program works with CECI but
not in another environment.
See the TXSeries for
Multiplatforms Administration
Reference.
Chapter 2. Sources of information 13
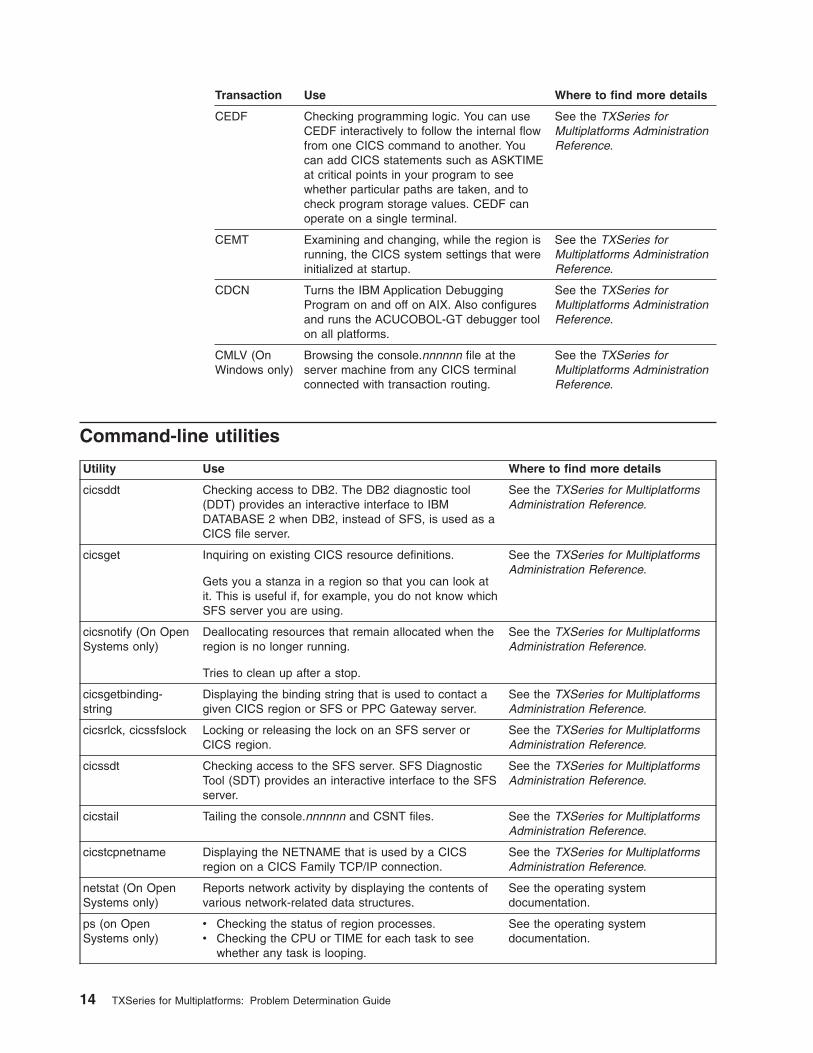
Transaction Use Where to find more details
CEDF Checking programming logic. You can use
CEDF interactively to follow the internal flow
from one CICS command to another. You
can add CICS statements such as ASKTIME
at critical points in your program to see
whether particular paths are taken, and to
check program storage values. CEDF can
operate on a single terminal.
See the TXSeries for
Multiplatforms Administration
Reference.
CEMT Examining and changing, while the region is
running, the CICS system settings that were
initialized at startup.
See the TXSeries for
Multiplatforms Administration
Reference.
CDCN Turns the IBM Application Debugging
Program on and off on AIX. Also configures
and runs the ACUCOBOL-GT debugger tool
on all platforms.
See the TXSeries for
Multiplatforms Administration
Reference.
CMLV (On
Windows only)
Browsing the console.nnnnnn file at the
server machine from any CICS terminal
connected with transaction routing.
See the TXSeries for
Multiplatforms Administration
Reference.
Command-line utilities
Utility Use Where to find more details
cicsddt Checking access to DB2. The DB2 diagnostic tool
(DDT) provides an interactive interface to IBM
DATABASE 2 when DB2, instead of SFS, is used as a
CICS file server.
See the TXSeries for Multiplatforms
Administration Reference.
cicsget Inquiring on existing CICS resource definitions.
Gets you a stanza in a region so that you can look at
it. This is useful if, for example, you do not know which
SFS server you are using.
See the TXSeries for Multiplatforms
Administration Reference.
cicsnotify (On Open
Systems only)
Deallocating resources that remain allocated when the
region is no longer running.
Tries to clean up after a stop.
See the TXSeries for Multiplatforms
Administration Reference.
cicsgetbinding-
string
Displaying the binding string that is used to contact a
given CICS region or SFS or PPC Gateway server.
See the TXSeries for Multiplatforms
Administration Reference.
cicsrlck, cicssfslock Locking or releasing the lock on an SFS server or
CICS region.
See the TXSeries for Multiplatforms
Administration Reference.
cicssdt Checking access to the SFS server. SFS Diagnostic
Tool (SDT) provides an interactive interface to the SFS
server.
See the TXSeries for Multiplatforms
Administration Reference.
cicstail Tailing the console.nnnnnn and CSNT files. See the TXSeries for Multiplatforms
Administration Reference.
cicstcpnetname Displaying the NETNAME that is used by a CICS
region on a CICS Family TCP/IP connection.
See the TXSeries for Multiplatforms
Administration Reference.
netstat (On Open
Systems only)
Reports network activity by displaying the contents of
various network-related data structures.
See the operating system
documentation.
ps (on Open
Systems only)
v Checking the status of region processes.
v Checking the CPU or TIME for each task to see
whether any task is looping.
See the operating system
documentation.
14 TXSeries for Multiplatforms: Problem Determination Guide
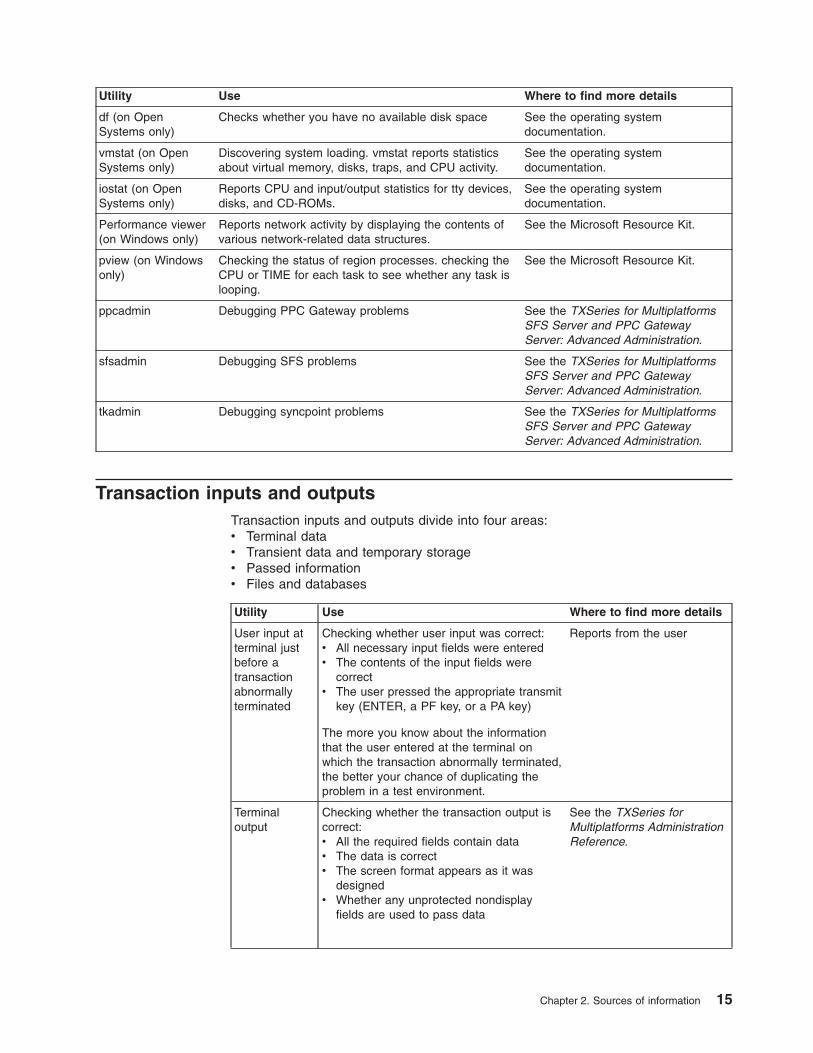
Utility Use Where to find more details
df (on Open
Systems only)
Checks whether you have no available disk space See the operating system
documentation.
vmstat (on Open
Systems only)
Discovering system loading. vmstat reports statistics
about virtual memory, disks, traps, and CPU activity.
See the operating system
documentation.
iostat (on Open
Systems only)
Reports CPU and input/output statistics for tty devices,
disks, and CD-ROMs.
See the operating system
documentation.
Performance viewer
(on Windows only)
Reports network activity by displaying the contents of
various network-related data structures.
See the Microsoft Resource Kit.
pview (on Windows
only)
Checking the status of region processes. checking the
CPU or TIME for each task to see whether any task is
looping.
See the Microsoft Resource Kit.
ppcadmin Debugging PPC Gateway problems See the TXSeries for Multiplatforms
SFS Server and PPC Gateway
Server: Advanced Administration.
sfsadmin Debugging SFS problems See the TXSeries for Multiplatforms
SFS Server and PPC Gateway
Server: Advanced Administration.
tkadmin Debugging syncpoint problems See the TXSeries for Multiplatforms
SFS Server and PPC Gateway
Server: Advanced Administration.
Transaction inputs and outputs
Transaction inputs and outputs divide into four areas:
v Terminal data
v Transient data and temporary storage
v Passed information
v Files and databases
Utility Use Where to find more details
User input at
terminal just
before a
transaction
abnormally
terminated
Checking whether user input was correct:
v All necessary input fields were entered
v The contents of the input fields were
correct
v The user pressed the appropriate transmit
key (ENTER, a PF key, or a PA key)
The more you know about the information
that the user entered at the terminal on
which the transaction abnormally terminated,
the better your chance of duplicating the
problem in a test environment.
Reports from the user
Terminal
output
Checking whether the transaction output is
correct:
v All the required fields contain data
v The data is correct
v The screen format appears as it was
designed
v Whether any unprotected nondisplay
fields are used to pass data
See the TXSeries for
Multiplatforms Administration
Reference.
Chapter 2. Sources of information 15
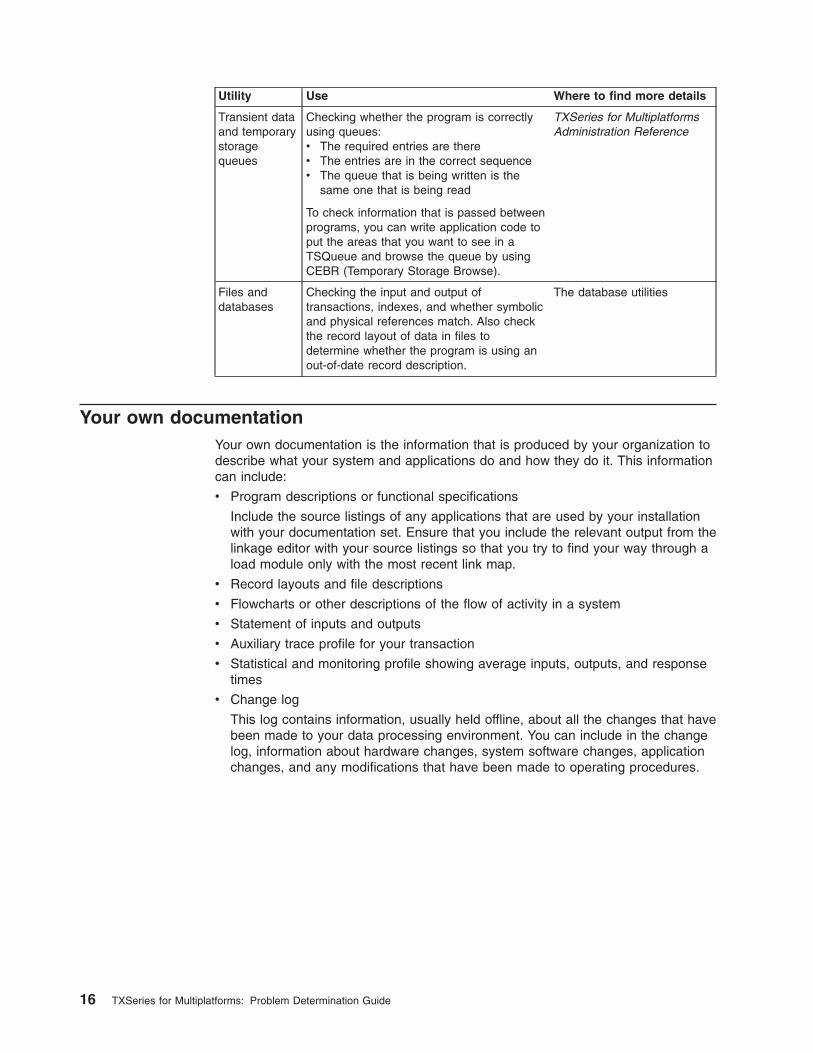
Utility Use Where to find more details
Transient data
and temporary
storage
queues
Checking whether the program is correctly
using queues:
v The required entries are there
v The entries are in the correct sequence
v The queue that is being written is the
same one that is being read
To check information that is passed between
programs, you can write application code to
put the areas that you want to see in a
TSQueue and browse the queue by using
CEBR (Temporary Storage Browse).
TXSeries for Multiplatforms
Administration Reference
Files and
databases
Checking the input and output of
transactions, indexes, and whether symbolic
and physical references match. Also check
the record layout of data in files to
determine whether the program is using an
out-of-date record description.
The database utilities
Your own documentation
Your own documentation is the information that is produced by your organization to
describe what your system and applications do and how they do it. This information
can include:
v Program descriptions or functional specifications
Include the source listings of any applications that are used by your installation
with your documentation set. Ensure that you include the relevant output from the
linkage editor with your source listings so that you try to find your way through a
load module only with the most recent link map.
v Record layouts and file descriptions
v Flowcharts or other descriptions of the flow of activity in a system
v Statement of inputs and outputs
v Auxiliary trace profile for your transaction
v Statistical and monitoring profile showing average inputs, outputs, and response
times
v Change log
This log contains information, usually held offline, about all the changes that have
been made to your data processing environment. You can include in the change
log, information about hardware changes, system software changes, application
changes, and any modifications that have been made to operating procedures.
16 TXSeries for Multiplatforms: Problem Determination Guide
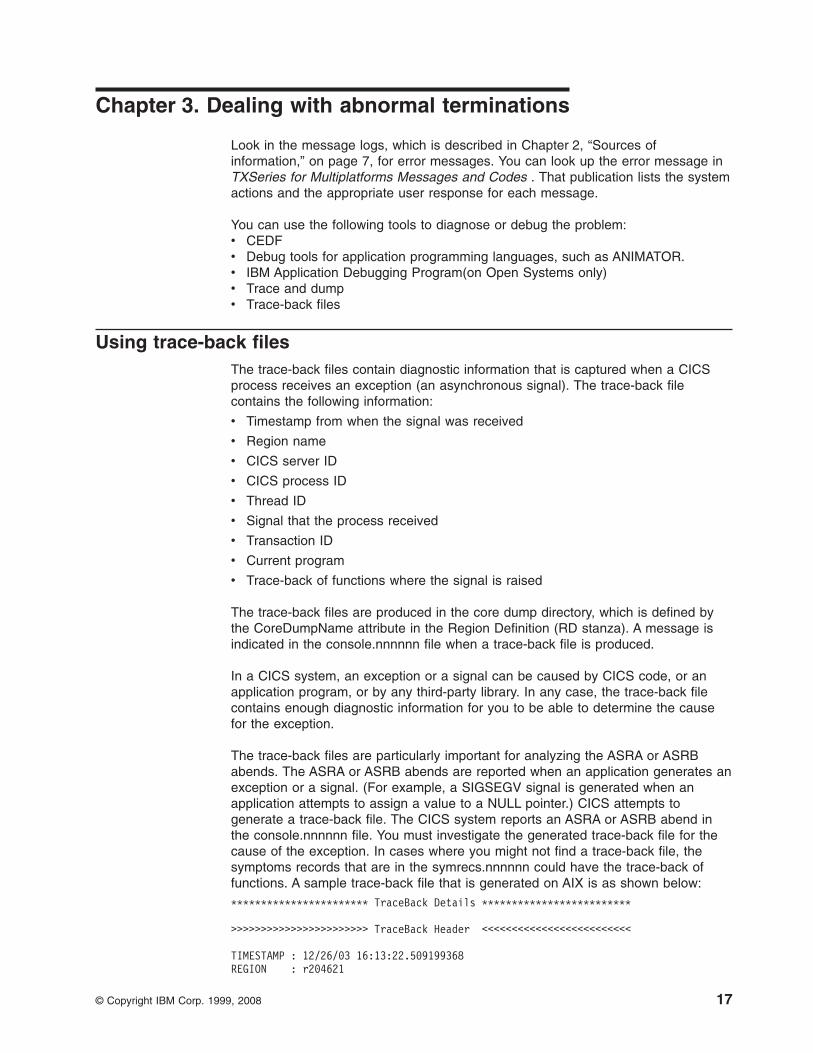
Chapter 3. Dealing with abnormal terminations
Look in the message logs, which is described in Chapter 2, “Sources of
information,” on page 7, for error messages. You can look up the error message in
TXSeries for Multiplatforms Messages and Codes . That publication lists the system
actions and the appropriate user response for each message.
You can use the following tools to diagnose or debug the problem:
v CEDF
v Debug tools for application programming languages, such as ANIMATOR.
v IBM Application Debugging Program(on Open Systems only)
v Trace and dump
v Trace-back files
Using trace-back files
The trace-back files contain diagnostic information that is captured when a CICS
process receives an exception (an asynchronous signal). The trace-back file
contains the following information:
v Timestamp from when the signal was received
v Region name
v CICS server ID
v CICS process ID
v Thread ID
v Signal that the process received
v Transaction ID
v Current program
v Trace-back of functions where the signal is raised
The trace-back files are produced in the core dump directory, which is defined by
the CoreDumpName attribute in the Region Definition (RD stanza). A message is
indicated in the console.nnnnnn file when a trace-back file is produced.
In a CICS system, an exception or a signal can be caused by CICS code, or an
application program, or by any third-party library. In any case, the trace-back file
contains enough diagnostic information for you to be able to determine the cause
for the exception.
The trace-back files are particularly important for analyzing the ASRA or ASRB
abends. The ASRA or ASRB abends are reported when an application generates an
exception or a signal. (For example, a SIGSEGV signal is generated when an
application attempts to assign a value to a NULL pointer.) CICS attempts to
generate a trace-back file. The CICS system reports an ASRA or ASRB abend in
the console.nnnnnn file. You must investigate the generated trace-back file for the
cause of the exception. In cases where you might not find a trace-back file, the
symptoms records that are in the symrecs.nnnnnn could have the trace-back of
functions. A sample trace-back file that is generated on AIX is as shown below:
*********************** TraceBack Details *************************
>>>>>>>>>>>>>>>>>>>>>>> TraceBack Header <<<<<<<<<<<<<<<<<<<<<<<<<
TIMESTAMP : 12/26/03 16:13:22.509199368
REGION : r204621
© Copyright IBM Corp. 1999, 2008 17
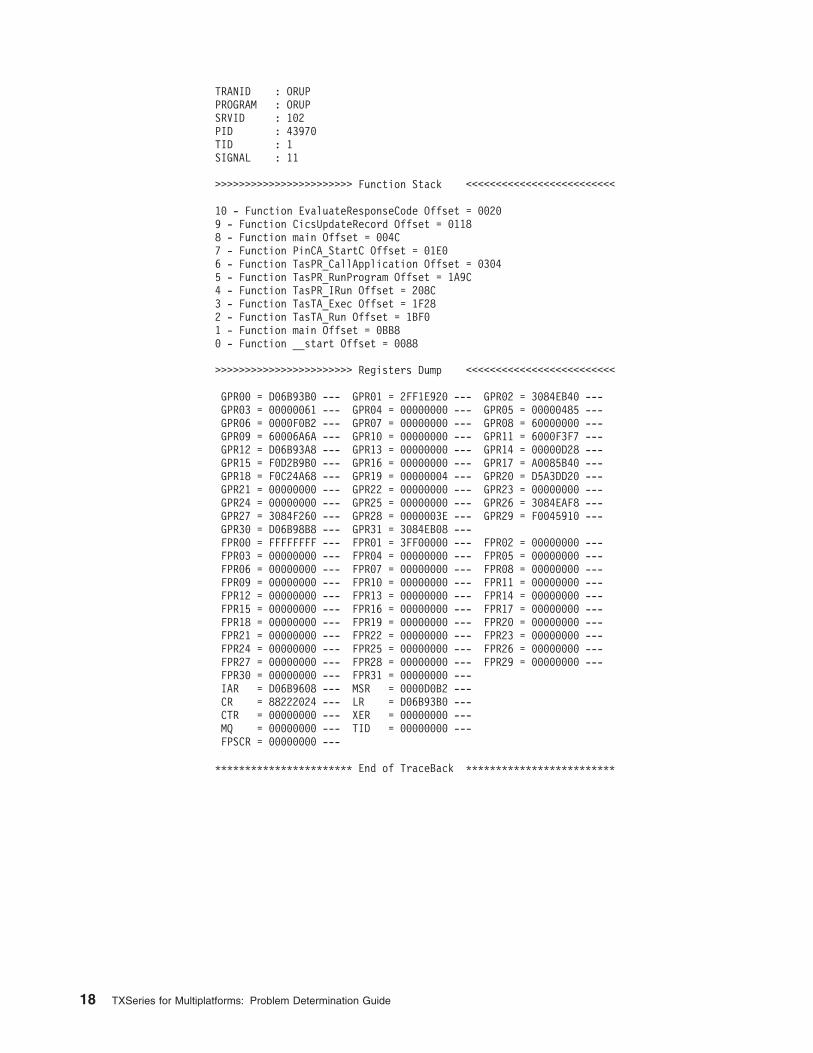
TRANID : ORUP
PROGRAM : ORUP
SRVID : 102
PID : 43970
TID : 1
SIGNAL : 11
>>>>>>>>>>>>>>>>>>>>>>> Function Stack <<<<<<<<<<<<<<<<<<<<<<<<<
10 - Function EvaluateResponseCode Offset = 0020
9 - Function CicsUpdateRecord Offset = 0118
8 - Function main Offset = 004C
7 - Function PinCA_StartC Offset = 01E0
6 - Function TasPR_CallApplication Offset = 0304
5 - Function TasPR_RunProgram Offset = 1A9C
4 - Function TasPR_IRun Offset = 208C
3 - Function TasTA_Exec Offset = 1F28
2 - Function TasTA_Run Offset = 1BF0
1 - Function main Offset = 0BB8
0 - Function __start Offset = 0088
>>>>>>>>>>>>>>>>>>>>>>> Registers Dump <<<<<<<<<<<<<<<<<<<<<<<<<
GPR00 = D06B93B0 --- GPR01 = 2FF1E920 --- GPR02 = 3084EB40 ---
GPR03 = 00000061 --- GPR04 = 00000000 --- GPR05 = 00000485 ---
GPR06 = 0000F0B2 --- GPR07 = 00000000 --- GPR08 = 60000000 ---
GPR09 = 60006A6A --- GPR10 = 00000000 --- GPR11 = 6000F3F7 ---
GPR12 = D06B93A8 --- GPR13 = 00000000 --- GPR14 = 00000D28 ---
GPR15 = F0D2B9B0 --- GPR16 = 00000000 --- GPR17 = A0085B40 ---
GPR18 = F0C24A68 --- GPR19 = 00000004 --- GPR20 = D5A3DD20 ---
GPR21 = 00000000 --- GPR22 = 00000000 --- GPR23 = 00000000 ---
GPR24 = 00000000 --- GPR25 = 00000000 --- GPR26 = 3084EAF8 ---
GPR27 = 3084F260 --- GPR28 = 0000003E --- GPR29 = F0045910 ---
GPR30 = D06B98B8 --- GPR31 = 3084EB08 ---
FPR00 = FFFFFFFF --- FPR01 = 3FF00000 --- FPR02 = 00000000 ---
FPR03 = 00000000 --- FPR04 = 00000000 --- FPR05 = 00000000 ---
FPR06 = 00000000 --- FPR07 = 00000000 --- FPR08 = 00000000 ---
FPR09 = 00000000 --- FPR10 = 00000000 --- FPR11 = 00000000 ---
FPR12 = 00000000 --- FPR13 = 00000000 --- FPR14 = 00000000 ---
FPR15 = 00000000 --- FPR16 = 00000000 --- FPR17 = 00000000 ---
FPR18 = 00000000 --- FPR19 = 00000000 --- FPR20 = 00000000 ---
FPR21 = 00000000 --- FPR22 = 00000000 --- FPR23 = 00000000 ---
FPR24 = 00000000 --- FPR25 = 00000000 --- FPR26 = 00000000 ---
FPR27 = 00000000 --- FPR28 = 00000000 --- FPR29 = 00000000 ---
FPR30 = 00000000 --- FPR31 = 00000000 ---
IAR = D06B9608 --- MSR = 0000D0B2 ---
CR = 88222024 --- LR = D06B93B0 ---
CTR = 00000000 --- XER = 00000000 ---
MQ = 00000000 --- TID = 00000000 ---
FPSCR = 00000000 ---
*********************** End of TraceBack *************************
18 TXSeries for Multiplatforms: Problem Determination Guide
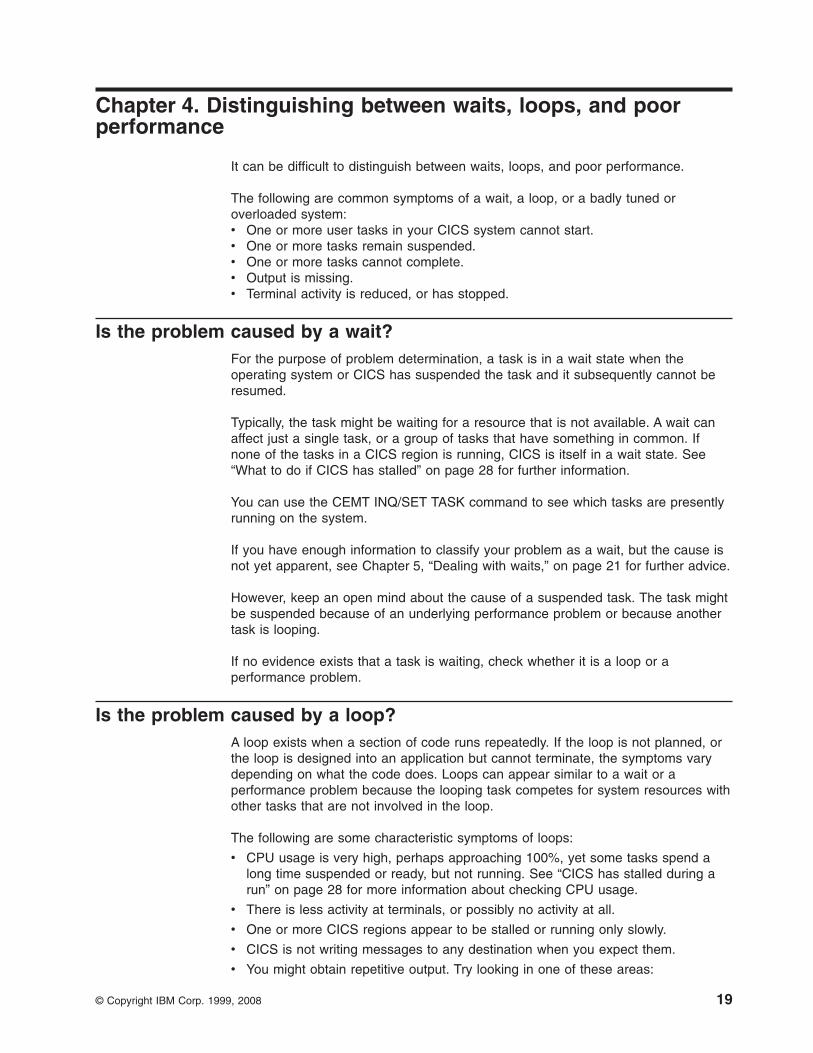
Chapter 4. Distinguishing between waits, loops, and poor
performance
It can be difficult to distinguish between waits, loops, and poor performance.
The following are common symptoms of a wait, a loop, or a badly tuned or
overloaded system:
v One or more user tasks in your CICS system cannot start.
v One or more tasks remain suspended.
v One or more tasks cannot complete.
v Output is missing.
v Terminal activity is reduced, or has stopped.
Is the problem caused by a wait?
For the purpose of problem determination, a task is in a wait state when the
operating system or CICS has suspended the task and it subsequently cannot be
resumed.
Typically, the task might be waiting for a resource that is not available. A wait can
affect just a single task, or a group of tasks that have something in common. If
none of the tasks in a CICS region is running, CICS is itself in a wait state. See
“What to do if CICS has stalled” on page 28 for further information.
You can use the CEMT INQ/SET TASK command to see which tasks are presently
running on the system.
If you have enough information to classify your problem as a wait, but the cause is
not yet apparent, see Chapter 5, “Dealing with waits,” on page 21 for further advice.
However, keep an open mind about the cause of a suspended task. The task might
be suspended because of an underlying performance problem or because another
task is looping.
If no evidence exists that a task is waiting, check whether it is a loop or a
performance problem.
Is the problem caused by a loop?
A loop exists when a section of code runs repeatedly. If the loop is not planned, or
the loop is designed into an application but cannot terminate, the symptoms vary
depending on what the code does. Loops can appear similar to a wait or a
performance problem because the looping task competes for system resources with
other tasks that are not involved in the loop.
The following are some characteristic symptoms of loops:
v CPU usage is very high, perhaps approaching 100%, yet some tasks spend a
long time suspended or ready, but not running. See “CICS has stalled during a
run” on page 28 for more information about checking CPU usage.
v There is less activity at terminals, or possibly no activity at all.
v One or more CICS regions appear to be stalled or running only slowly.
v CICS is not writing messages to any destination when you expect them.
v You might obtain repetitive output. Try looking in one of these areas:
© Copyright IBM Corp. 1999, 2008 19
– Terminals
– Temporary storage queues (use CEBR to browse these online)
– Data files and CICS journals.
v A task demands excessive storage. If the loop contains an EXEC CICS
GETMAIN SHARED request, CICS acquires storage each time the task passes
this point in the loop, as long as enough storage to satisfy the request remains
available. If the task does not also release storage with an EXEC CICS
FREEMAIN in the loop, CICS eventually becomes short on storage (SOS). You
then receive a message reporting that CICS is under stress. If no GETMAIN
SHARED storage exists, CICS raises a condition on the offending program.
v Statistics show many initiated tasks.
v Statistics show many file accesses for an individual task.
You might be able to distinguish a loop from a wait or a performance problem by
making the loop produce repetitive output. Waits and performance problems never
give repetitive output. If the loop produces no output, trace might show a repeating
pattern. If you have enough information to classify the problem as a loop, you need
to define the limits of the loop. See Chapter 6, “Dealing with loops,” on page 33 for
further advice.
Is the problem a performance problem?
A performance problem is one where system performance is perceptibly degraded
either because tasks do not start running at all, or because after they are started,
they take a long time to complete.
If you get several messages telling you that CICS is under stress, this can indicate
that either the system is operating near its maximum capacity, or a task with an
error has used up a large amount of storage, possibly because it is looping.
If you do not get this type of message, see Chapter 7, “Dealing with performance
problems,” on page 37 for further advice. Check first whether you can best classify
the problem as performance, rather than a wait or a loop.
If you have only a poorly defined set of symptoms that can indicate a loop, a wait,
or possibly a performance problem with an individual transaction, the cause might
be a poorly designed application program. See the TXSeries for Multiplatforms
Application Programming Guide for advice.
20 TXSeries for Multiplatforms: Problem Determination Guide
Chapter 5. Dealing with waits
If the operating system or CICS has suspended a task, and that task subsequently
cannot be resumed, although other tasks seem able to be, the task is in a wait
state. A task is said to be in a wait state if the operating system or CICS has
suspended it after it has first started to run. For example, when a task requests
access to a transient data queue that is being accessed by another task.
You are unlikely to have direct evidence that a CICS system process is in a wait
state, except from a detailed examination of trace. You are more likely to notice that
one of your user tasks is waiting. A waiting CICS system process might ultimately
cause the user task to wait.
You can handle as performance problems the waits that are described in these
examples. Tasks that are ready to run but cannot start might have too low a priority,
or the system might be under stress. For example, the system might be short on
storage (SOS). For more information, see Chapter 7, “Dealing with performance
problems,” on page 37.
Most tasks get suspended at least once during their lifetime. One example of this is
while a task waits for file input and output to occur. This is part of the normal flow of
control, allowing other tasks to run. It is only when tasks remain suspended longer
than they should, that problems arise.
Some operations, such as accessing a slow device, take a long time to complete. If
this causes problems, review the way in which resources are being used.
CICS system waits
If a CICS system process is in a wait state, it does not necessarily mean that an
error has occurred in CICS. Some system processes spend long periods in wait
states while they wait for work, or wait for a timeout to expire.
Several types of timeout are possible. If CICS detects a possible deadlock, it makes
the transaction wait for the number of seconds that is specified in the
DeadLockTimeout attribute in the Transaction Definitions (TD). If a transaction
requires terminal input, it waits for input until the Timeout expires. Both these
conditions are controlled by attributes in the Transaction Definitions (TD). If the
timeout value is high, a wait can occur. If the timeout value is the default, 0, a wait
occurs because the timeout never expires.
Another example is a condition in which a conversation is allocated over a TCP/IP
link to a back end transaction, and the back end transaction does not start. In this
condition, the allocating transaction is not abnormally ended until the
AllocateTimeout expires. AllocateTimeout is an attribute in the Communications
Definitions (CD) for the remote system.
The operating system might cause a process to wait; for example, if CICS attempts
to write to a file that is on a networked file system, the process waits until the
operation completes. If the file system is very slow, for example because the server
is under stress or the network is overloaded, the process does not resume until the
problem is corrected. In this condition, follow the instructions that are associated
with any messages that are logged on the operating system console. Several
different kinds of wait are possible, but the most common cause is competition for a
system resource.
© Copyright IBM Corp. 1999, 2008 21
Maximum server condition waits
A maximum server condition wait occurs when the number of tasks is greater than
the maximum number of application servers.
A running CICS system can have several application servers. Each application
server can run only one task at a time. When you attempt to start a task from the
CICS 3270 Terminal Emulator or with the EXEC CICS START command, CICS
attempts to assign it to an idle application server. If not enough application servers
are available, the request joins a queue, and the task runs when it reaches the
head of the queue.
If tasks are waiting for an application server and the number of application servers
is less than the MaxServer limit that is defined in the Region Definitions (RD), CICS
starts up a new application server to run the task. Therefore, the MaxServer limit
determines the maximum number of tasks that CICS can run concurrently.
If tasks are waiting for an application server, and the number of application servers
has reached the MaxServer limit, the task must wait. You can solve this problem by
raising the MaxServer limit in the RD.
You can use the CEMT INQ SYSTEM transaction to query or increase the
maximum number of application servers that CICS creates at startup.
Terminal waits
A terminal wait occurs when a task cannot start at, or does not read from, a
terminal.
If a terminal is unresponsive, showing no new output, and accepting no input, this
does not necessarily indicate a terminal wait. The task that is running on the
terminal might be waiting for another resource.
On all systems except Windows, use CEMT INQ TERMINAL to determine which
transaction is running at the terminal, then use the ps operating system command
to check whether the task is waiting.
If none of the terminals in the network is responding, and CICS has stalled, see
“What to do if CICS has stalled” on page 28.
Investigate the following possibilities:
v An obvious physical occurrence might be the cause the wait. For example, a
terminal user does not respond to a request for input.
v Check the CSMT log for error messages. If CICS detects an error that is
connected with terminal control, it sends a message reporting the problem to the
CSMT log and, optionally, to the console.nnnnnn file.
If a message reports a terminal error that relates to the task, the message might
indicate why the task is waiting. Look in TXSeries for Multiplatforms Messages
and Codes, for a further explanation and a description of the system action in
response to the error.
v If the terminal is installed by using autoinstall, check whether the system was
able to load the autoinstall program (DFHCHATX).
v If the terminal does not start an Automatic Transaction Initiation (ATI) task, use
CEMT to check whether ATI tasks are enabled at that terminal.
22 TXSeries for Multiplatforms: Problem Determination Guide
v Check whether the terminal is being debugged by another terminal that is using
CEDF (Execution Diagnostic Facility). If the terminal user on the CEDF terminal
is not responding to a request for input, the first terminal can appear
unresponsive.
Intersystem waits
Intersystem waits occur when the appropriate resources for communication between
CICS and a communication subsystem are not available.
In TCP/IP communication subsystems, intersystem waits occur only if no spare
application servers are available.
In SNA communication subsystems, intersystem waits occur when a user task
attempts to get a session with another CICS region, but all the sessions are in use.
The task must wait until a session is available. You can resolve this problem by
defining a greater number of sessions. You define each additional session by
adding an entry to the Communications Definitions (CD).
You can check whether a task is waiting on a TCP/IP link or an SNA link by using
the CICS monitoring facility.
If you have a problem that you have identified as an intersession or an intersystem
communication wait, investigate it in the same way in which you investigated
“Terminal waits” on page 22.
Transient data waits
Transient data waits affect tasks that issue requests to read from, write to, and
delete transient data destinations. The reasons depend on the type of request that
the task makes, and whether the task attempts to access an extrapartition or an
intrapartition queue.
If you have defined a transient data queue as logically recoverable in the transient
data definitions (see the TXSeries for Multiplatforms Administration Reference), or if
a database is used as the CICS file and queue manager, the queue is restricted so
that only one task can use the queue at a time for a particular type of request. A
task writing to, reading from, or deleting such a queue is enqueued on it, and any
other task making a similar request to the same queue must wait until the first task
either terminates or issues an EXEC CICS SYNCPOINT command.
READQ
Read lock: No other tasks can read or delete. This task will read only
committed data.
WRITEQ
Write lock: No other tasks can write or delete.
DELETEQ
Read and write lock: No other tasks can do anything.
You can code the NOSUSPEND option to prevent an EXEC CICS READQ TD from
waiting for records to be committed. This restriction enforces isolation between
different transactions, and allows a sequence of operations within a transaction on a
queue to take place atomically.
Chapter 5. Dealing with waits 23
You can use the CICS monitoring facility to check whether a task is waiting for
transient data input or output.
Note: See the TXSeries for Multiplatforms Intercommunication Guide about long
running function shipping transactions. This note describes the effects of
using the EXEC CICS SYNCPOINT command with these types of
transactions.
File control waits
File control waits occur for several different reasons, but affect tasks that issue
requests to read and write to files. The reasons depend on the type of request that
the task makes, and whether the task attempts to access a recoverable or
nonrecoverable file.
If a task accesses a recoverable file, any record that it reads or writes remains
locked until the task terminates or issues an EXEC CICS SYNCPOINT command. A
second task cannot access records locked in that way, and has to wait until the first
task terminates or issues an EXEC CICS SYNCPOINT command.
File control waits can be long if a lot of file operations need user action before a
task releases a resource. For example, a Structured File Server (SFS) lock might
require many file operations before the task completes and releases the file.
If a transaction does not change a record, you can avoid file control waits by
issuing an EXEC CICS UNLOCK command. If the transaction modifies a record in a
recoverable file, SFS does not release the lock until the transaction commits or
abnormally terminates, or the transaction encounters an EXEC CICS SYNCPOINT
command.
You can check whether a task is waiting for file control by using the CICS
monitoring facility.
Note: See TXSeries for Multiplatforms Intercommunication Guide about long
running function shipping transactions. This note describes the effects of
using the EXEC CICS SYNCPOINT command with these types of
transactions.
Temporary storage queue waits
A temporary storage queue wait occurs when a task has made a request to a
temporary storage queue but the temporary storage queue cannot meet the
request. This can occur for two reasons:
v Not enough auxiliary storage or main storage is available to satisfy the request.
v Another transaction is already using the temporary storage queue.
Not enough storage
CICS forces a task to wait if the task makes a request for temporary storage, but
CICS cannot meet the request because not enough storage is available.
If the task issues an EXEC CICS WRITEQ TS command, with or without the
REWRITE option, but without specifying NOSUSPEND, CICS cannot meet the
request and suspends the task until sufficient storage becomes available.
24 TXSeries for Multiplatforms: Problem Determination Guide
If a task issues an EXEC CICS WRITEQ TS command and does specify
NOSUSPEND, and CICS cannot meet the request, CICS does not suspend the
task. Instead, if the required storage is not available, CICS returns an exception
response to the task.
Temporary storage queue already in use
A task is forced to wait if it issues a WRITE or DELETE request against a
temporary storage queue that another task is already using. The task that is using
the queue has a lock on the queue.
The length of time that a task has a lock on a temporary storage queue depends on
whether or not the queue is recoverable. If the queue is recoverable, the task has a
lock until the logical unit of work is complete. If the queue is not recoverable, the
task has a lock only for the duration of the temporary storage request.
You can check whether specific tasks are frequently waiting on temporary storage
queues, by using the CICS monitoring facility.
Solutions to temporary storage queue waits include:
v Ensure that queue identifiers are unique, so that different tasks do not
unintentionally perform operations on the same temporary storage queue.
v Create more temporary storage queues to reduce the contention between tasks.
v Make tasks relinquish control of a recoverable queue more quickly. You can
reduce the size of the logical unit of work (LUW), or change conversational tasks
to pseudoconversational.
System dump waits
System dump waits occur when CICS produces a system dump. CICS suspends all
tasks until the dump is complete, to ensure that tasks do not change data during
the dump, and that the dump reflects the state of CICS at the moment that the
dump started.
If you find that the cause of a wait is that the system dump services are in control,
this is normal CICS operation. When the dump completes, if there are no other
problems with CICS, previously suspended tasks will continue.
See Chapter 14, “Using CICS dump,” on page 103 for more information.
ENQ and SUSPEND task control waits
ENQ and SUSPEND task control waits can occur for two reasons:
v A transaction attempts to ENQ a resource that is already enqueued by another
transaction.
v A transaction uses EXEC CICS SUSPEND.
Enqueueing a locked resource
The CICS task control command EXEC CICS ENQ suspends the calling task if
another transaction already has the resource enqueued. The second task must wait
until the transaction that is holding the ENQ on the resource releases it by calling
DEQ or reaching a SYNCPOINT.
Possible solutions to an ENQ task control wait are:
Chapter 5. Dealing with waits 25
v Ensure that transactions hold enqueues on a resource only for a short time.
v Use the NOSUSPEND option of ENQ, to ensure that if the lock is not available
immediately, the ENQ does not block, but returns with the ENQBUSY condition
code.
v Use the DeadlockTimeout attribute for transactions that use ENQ.This ensures
that if the lock cannot be obtained within a given amount of time, CICS raises an
AKCS abnormal termination code. DeadlockTimeout option has no effect when
DB2 is configured as the CICS file and queue manager.
Suspending a transaction
The CICS task control command EXEC CICS SUSPEND suspends the task for a
short time only, allowing other running transactions to use the CPU. This command
should not cause long task waits. If this appears to be the cause of a long task
wait, contact your support organization.
Journal waits
Journal waits occur when a task makes a request to a journal, but CICS cannot
satisfy the request because not enough space is available.
If a task makes a JOURNAL request without the NOSUSPEND option, and CICS
cannot satisfy the request because not enough storage is available, CICS forces
the task to wait until storage becomes available in the operating system’s’ file
system that is associated with the specified journal.
If a task makes a JOURNAL request with the NOSUSPEND option, and CICS
cannot satisfy the request because the data volume is full, CICS returns a
NOSPACE condition to the task.
You can find out whether tasks are frequently waiting on journals, by using the
CICS monitoring facility.
Possible solutions to journal waits are:
v Increase the size of the operating system file that contains journal data. Examine
the DiskA and DiskB attributes in the Journal Definitions (JD) to identify the files
that are involved.
v Reduce the amount of journal data that is written by tasks.
v Allocate separate files for heavily used journals. This prevents heavily used
journals affecting the space that is available to other journals.
Syncpoint waits
Syncpoint waits occur when tasks issue EXEC CICS SYNCPOINT requests in
synclevel 2 conversations. The tasks are forced to wait until a syncpoint has been
taken. This involves either committing or rolling back any recoverable resources that
are involved in the transaction.
Note: See the TXSeries for Multiplatforms Intercommunication Guide about
long-running function shipping transactions. This note describes the effects of
using the EXEC CICS SYNCPOINT command with these types of
transactions.
26 TXSeries for Multiplatforms: Problem Determination Guide
Non-distributed transactions
A syncpoint wait occurs only if problems occur during attempts to communicate with
the Structured File Server (SFS).
Distributed transactions
For distributed transactions, the task that is initiating the syncpoint sends a prepare
request to remote tasks that are participating in the transaction. It then waits for a
prepared response from each of them before it begins the commit phase of the
two-phase commit procedure. Extended waits can occur in the following conditions:
v A slave transaction does not issue an EXEC CICS SYNCPOINT within a
designated time, for example:
– It has not issued an EXEC CICS RECEIVE.
– It does not respond correctly to the EIBSYNC flag after returning from an
EXEC CICS RECEIVE.
– It is blocked on a wait of some kind.
– It is blocked in a conversation with another system.
– It is running slowly on a heavily loaded system.
v The two-phase commit procedure stalls because of a system failure during the
prepare or commit phases. Use the CEMT INQ TASK INDOUBT transaction to
identify tasks in this state.
You can use the CEMT INQ TASK INDOUBT transaction to detect tasks that are
waiting in the first phase of the two-phase commit process.
It is best to leave such tasks ‘in-doubt’ until the remote system is restarted, so that
the syncpoint completes naturally. This avoids the condition in which some parts of
the transaction have committed and some parts have backed out. If this condition
does occur, you might need to intervene manually, for example to correct database
inconsistencies.
Alternatively, you can use CEMT SET TASK FORCEPURGE to force an outcome
(backout or commit) as determined by the Transaction Definitions (TD) entry for the
task.
CICS system process waits
System process waits occur when a system error stops a process from resuming.
If a system process is in a wait state and a system error prevents it from resuming,
contact your support organization if you cannot solve the problem. However, do not
assume that a system error exists unless you have other evidence that the system
is malfunctioning. Other possible causes of system process waits are:
v System processes that are meant to wait for long periods while they wait for work
to do.
v System processes that perform many input and output operations and are
subject to constraints, such as file locking.
If you have a system process wait and evidence of a system error, contact your
support organization.
Chapter 5. Dealing with waits 27
What to do if CICS has stalled
CICS can stall during initialization, when it is running apparently normally, or during
termination.
CICS has stalled during initialization
If CICS stalls during initialization, either on cold start or auto start, check how far
the initialization has progressed. If the region was started from the command line,
look in the console.nnnnnn file. Alternatively, look at the stderr of the terminal on
which the CICS process started. The CICS system trace log is also a useful source
of information. The following message indicates completion of startup:
ERZ010020I/0068: *** CICS startup is complete ***
Specific stages of initialization can have significant, but normal, delays, depending
on how CICS last terminated. For example:
v If the resource definition database is large, CICS might take some time to read in
the resource definitions.
v A user program that is listed in the StartUpProgList attribute in the Region
Definitions (RD) does not follow the strict protocols that are required by CICS.
This can cause CICS to stall. For each program that is listed, CICS displays the
following message:
ERZ010063I/0070: Running startup program progname
If you check this output, you can detect any program that causes a problem.
v You see the following message, associated with abend code U1029:
ERZ010073E Unable to start transaction CAIN
No cicsas processes completed initialization inside the normal transaction start
time (2 minutes). This problem can occur for several reasons; for example,
problems have occurred with XA, a switch-load file cannot be found, or a
switch-load file does not load correctly. You must investigate to find the cause of
the problem.
CICS has stalled during a run
If a CICS region stalls after running normally, produces no output, and accepts no
input, the scope of the problem is potentially system-wide. The problem might be
within CICS, or be caused by another process that is running under your operating
system.
CICS rarely stalls completely during a run. Usually, the system appears to be
stalled because several tasks have stalled at the same time. This might happen if a
deadlock occurs on resources.
Check for any operating system messages, especially those indicating that you
must intervene. Then check the CICS system log for messages and (on Open
Systems only) the operating system error log or (on Windows only) the event log,
which might indicate problems in the operating system itself or with other products
that are being used with CICS.
If these checks do not reveal any problems, the task might be using a large
percentage of CPU or increasing amounts of TIME. In these cases the task might
be looping. See Chapter 6, “Dealing with loops,” on page 33 for further advice.
Type the following command at the command line, and note the CPU and TIME
entry for each task:
28 TXSeries for Multiplatforms: Problem Determination Guide
CICS for AIX
ps gvaxc
CICS for HP-UX
top
CICS for Solaris
ps -el
If the CPU usage is low, CICS is doing very little work. Some of the possible
reasons are:
v The region is short on storage, so existing tasks are waiting for storage to
become available.
v The system is at the MaxServer limit and no new tasks can start. Existing tasks
might be deadlocked without deadlock timeout values, or be conversational and
waiting for user input. For information about waits, read Chapter 5, “Dealing with
waits,” on page 21.
v A CICS system error has occurred.
You can find out if any of these apply to your region by checking the following
information. For some of the investigations, you need to refer to a system dump of
the CICS region. The region might produce a system dump automatically. If it does
not, you can take a system dump, but you must be able to use CEMT to do so. If
CICS is stalled completely, you cannot. In some cases, however, you still can. For
example, if the region’s MaxServer limit has been reached, but CEMT is already
running, you can use it to investigate the problem and take a system dump.
Note: A system dump itself can give the appearance of CICS being stalled. To
determine whether this is so, check the CICS log for a ‘completed’ message.
On all systems except Windows, a CICS region might actually stall during a
system dump if the directory to which the dump is being written is on an
NFS file system that is unavailable. To solve this problem, you must get the
NFS file system online again.
Are the Region Definitions (RD) parameters wrong?
The Region Definitions (RD) parameters for your region might cause it to stall,
possibly at some critical loading. Check what has been specified, and give
particular attention to the following items:
CheckpointInterval
The frequency with which CICS takes snapshots of the region, and is set to
minimize future recovery time. If this is set too small, it is difficult for CICS
tasks to perform any work, because all available CPU time goes into
checkpointing.
ClassMaxTasks
The maximum number of transactions for each transaction class that can
be run in the region at any one time. If the values are too low, new tasks
might not be able to start.
IntrospectInterval
The frequency with which CICS runs self-consistency checks. If this is too
small, CICS spends all available CPU time running the consistency check
transaction.
Chapter 5. Dealing with waits 29
MaxServer
The maximum number of application servers. If this is too low for the
region, new tasks might be unable to start.
Is the region short on storage?
If the region is short on storage, CICS sends a message to the CICS log stating
that CICS is under stress. Check whether the values of the MaxRegionPool and
MaxTSHPool attributes in the Region Definitions (RD) are large enough.
Is the MaxServer limit causing the stall?
Each new transaction requires an available application server before it can start. In
a region that is running normally, tasks run and terminate, and new transactions
start, although the MaxServer limit is occasionally reached. CICS stalls when
MaxServer has been reached and tasks cannot complete or be purged from the
region.
Has a CICS system error occurred?
If you have checked all the factors described here, and not yet found a cause, a
CICS system error might have occurred. Contact your support organization about
the problem.
CICS has stalled during termination
CICS might appear to stall during termination when it is actually waiting. Waits often
occur when CICS is quiescing because some terminal input or output has not
concluded. To check this possibility, try using the CEMT transaction to inquire on
the tasks currently in the region.
CICS termination takes place in two stages:
1. All transactions are quiesced.
2. All files and terminals are closed.
If you cannot use the CEMT transaction, the region is probably already in the
second stage of termination. You cannot use CEMT beyond the first stage of
termination.
Note: To run CEMT during the first phase of shutdown, the CEMT and CHAT
transactions must both be marked as “can be run” at shutdown. To do this,
set the InvocationMode attribute in the Transaction Definitions (TD) entries
for these two transactions to at_shutdown_start. The default for this
attribute is at_normal_running. If either transaction is not marked as “can
be run” at shutdown, you cannot run CEMT.
The next step depends on whether you can use the CEMT transaction, and if you
can use it, whether any user tasks are running in the region.
v If you can use the CEMT transaction:
– If some user tasks are running in the region, one or more of them is probably
waiting for operator intervention. Determine what type of terminal is
associated with the running tasks.
If the terminal is an IBM 3270 Information Display System family device, it
might need some keyboard input. If the terminal is a printer, it might be
switched off or need more paper.
Try to solve the problem with the appropriate action. If you cannot solve the
problem, you can, as a last resort, purge the task by using CEMT SET TASK
FORCEPURGE.
30 TXSeries for Multiplatforms: Problem Determination Guide
– If no user tasks are running in the region, one or more terminals might not
have closed. Use the CEMT transaction to see which terminals are
INSERVICE, and use CEMT SET to set them OUTSERVICE.
If these steps are unsuccessful, proceed as if you were unable to use the CEMT
transaction.
v If you cannot use the CEMT transaction:
– Check whether any CICS processes for the given region are consuming CPU
time. Use pview (Windows) or ps (OpenSystems) to check the status of
processes. If the processes are consuming CPU, and an application server
appears to be looping, try to physically trace the terminal and terminate it. If
you still cannot solve the problem, the only option is to run cicsstop. and, for
all systems except Windows, run cicsnotify, passing the name of the
subsystem to be terminated.
For example, for a region named ACC, first stop all the current processes with
the cicsstop command:
cicsstop -k ACC
then invoke cicsnotify:
cicsnotify cics.ACC.
Use the cicsnotify command as a last resort. Do not use it the first time that
termination appears to stall.
Chapter 5. Dealing with waits 31

32 TXSeries for Multiplatforms: Problem Determination Guide
Chapter 6. Dealing with loops
Before reading this section, look at Chapter 4, “Distinguishing between waits, loops,
and poor performance,” on page 19.
This chapter tells you about loops:
v “Different types of loop”
v “Investigating loops”
Different types of loop
Loops that are coded into applications must always terminate or they can cause
any of the symptoms of loops described in “Classifying the problem” on page 4.
Possible causes of a loop that does not terminate are:
v The termination condition can never occur.
v The code never tests for the termination condition.
v When the termination condition is met, the conditional branch causes the loop to
be performed again.
The following is an outline of procedures for finding programs that are involved in a
loop that does not terminate.
If the looping code is in one of your applications, check the code for errors.
If the error appears to be in the CICS code, contact your support organization,
following the procedures that are given in Chapter 15, “Working with your support
organization,” on page 117.
Classifying loops by their symptoms
Two types of unplanned loops exist:
v Loops that never return control to CICS
v Loops that do return control to CICS
Loops that never return control to CICS
This type of loop performs the same instructions repeatedly, and the program never
returns control to CICS. The loop can include more than one program if all of the
programs are called with COBOL CALL statements or similar C or PL/I constructs.
(PL/I is supported only on CICS for AIX and CICS for Windows.)
An example is a single instruction in a loop that causes a branch to repeat itself.
Loops that do return control to CICS
This type of loop performs the same instructions repeatedly, but calls one or more
CICS commands inside the loop. The loop can embrace multiple programs.
Investigating loops
Some examples of initial symptoms that can indicate a loop are:
v Repetitive output
v Statistics show an excessive number of input and output operations
v Statistics show an excessive number of requests for storage
v An application server is using a lot of CPU time
© Copyright IBM Corp. 1999, 2008 33
The characteristics of the symptoms might indicate which transaction is causing the
loop, but to define the limits of the loop, you must use trace.
Use auxiliary trace to capture the whole loop in the trace data. If you use internal
trace, wraparound might prevent you from seeing the whole loop. See Chapter 13,
“Using CICS trace,” on page 85 for further information.
After you have captured the trace data, purge the looping task from the system. To
do this, find the task number of the task by using CEMT INQ TASK. Use CEMT
SET TASK PURGE or FORCEPURGE to purge the task. This causes the
transaction to terminate abnormally and produce a transaction dump of the task
storage areas.
If the loop does not contain any EXEC CICS statements, you cannot use trace to
determine the limits of the loop. Insert EXEC CICS ENTER calls into the application
code in the areas that you suspect are causing problems, and capture the trace
data again. See Chapter 13, “Using CICS trace,” on page 85.
The documentation you need
The following documentation is useful:
v The trace data
v The transaction dump
v Source listings of all the programs that are in the transaction.
Use the trace data and the program listings to identify the limits of the loop. Use the
transaction dump to examine the user storage for the program. Examine the data to
see why the loop occurred.
Identifying the loop
Use the trace table to detect the repeating pattern of trace entries. If this is difficult,
possibly the loop is large because many different programs are involved. Another
possibility is that you have not captured the whole loop in the trace file, because the
loop did not complete one cycle before you purged the transaction.
Remember that you might not be dealing with a loop, so the symptoms might be
caused by something else; for example, poor application design.
If you can detect a pattern, you can identify the corresponding pattern of statements
in your source code.
To help you identify the task that might be looping, you can set the MaxTaskCPU
and the MaxTaskAction attributes of the Region Definitions (RD). The
MaxTaskAction attribute can be set to abend or warning so that if the particular
task exceeds the limit that is set in MaxTaskCPU, either a message is issued, or
the transaction abends. The MaxTaskCPU attribute of the Transaction Definitions
(TD) allows you to target specific transactions.
Finding the reason for the loop
Examine the statements that are contained in the loop. Does the logic of the code
suggest why the loop occurred? If not, examine the contents of data fields in the
task’s user storage. Look particularly for unexpected response codes and null
values when the program copes only with finite values. The action of a program can
be unpredictable when these conditions are encountered unless the code tests for
such conditions and handles them accordingly.
34 TXSeries for Multiplatforms: Problem Determination Guide
What to do if you cannot find the cause of a loop
If you cannot find the cause of a loop by using these techniques, you can try
several more ways:
1. Use the interactive tools that CICS provides; for example, CEDF or the IBM
Application Debugging Program (CICS for AIX).
2. Modify the program, and run it again.
3. Use the ANIMATOR debugging tool or the ACUCOBOL-GT debugging tool.
Investigating loops using interactive tools
If the loop returns control to CICS, you can use the CEDF transaction to look at
parts of your program and the storage that is owned by the task at each interaction
with CICS. CEDF is a good way to investigate whether an unexpected return code
has caused the problem.
To look at other areas of storage such as the COMMAREA (which is storage
accessed by the GETMAIN command), you can write out the areas of storage to
temporary storage and browse it by using the CEBR transaction.
You can CECI and CEBR to examine the status of files and queues during the
running of your program. Programs must test for, and handle, conditions in which
they do not find records and queue entries, or they might react unpredictably.
On Solaris, you can investigate loops by using the truss debugging tool,
information for which can be found online in the man pages.
Modifying your program to investigate the loop
If the program is extremely complex, or the data path difficult to follow, you might
have to insert additional statements into the source code. Extra ASKTIMEs allow
you to use CEDF and inspect the program at more points. You can also request
dumps from within your program, and insert user trace entries.
Using IBM Application Debugging Program
You can use IBM Application Debugging Program to debug programs in the
supported programming languages. This involves starting the CICS-supplied
transaction CDCN against a particular terminal, system, transaction, or program.
See the TXSeries for Multiplatforms Administration Reference for more information.
For details about how to use IBM Application Debugging Program to debug
particular applications, see the TXSeries for Multiplatforms Application Programming
Guide.
Using application debugging tools
You can use ANIMATOR or ACUCOBOL-GT to debug COBOL programs. These
tools allow you to set breakpoints in your own code and, therefore, detect loops that
do not return control to CICS. For Windows only, you can use the debugging tools
that are supported by the compilers that are listed in the following tableTable 6:
Table 6. Application debugging tools
Language Compiler Debugger
C IBM VisualAge® C++ Idebug
C Microsoft Visual C++ windbg/msdev
C++ IBM VisualAge C++ Idebug
C++ Microsoft Visual C++ windbg/msdev
Chapter 6. Dealing with loops 35
Table 6. Application debugging tools (continued)
Language Compiler Debugger
COBOL Micro Focus Net Express COBOL ANIMATOR
ACUCOBOL-GT ACUCOBOL-GT debugging tool
Note: CICS does not support OO techniques in COBOL.
See the TXSeries for Multiplatforms Application Programming Guide for details.
36 TXSeries for Multiplatforms: Problem Determination Guide
Chapter 7. Dealing with performance problems
Finding the bottleneck in scheduled transactions
Two potential bottlenecks can cause unnecessary delays in executing a transaction:
v Giving requests to the scheduler
v Scheduling the transaction.
Both areas are affected by a different set of system parameters, and adjusting the
parameters might resolve the bottleneck. You must determine which bottleneck is
causing your performance problem so that you can find out which parameters to
adjust.
If performance is poor for any tasks in your system, you can capture useful
information about them by using the CICS dump, trace, statistics, and monitoring
facilities.
Tasks not given to the transaction scheduler
If CICS has not attached a task to the transaction scheduler, you cannot obtain any
information about the status of the task online. Use CEMT INQ TASK to check
whether the scheduler knows about the task. If the response to the command
indicates that the task is not known, and the task has not already run and ended,
CICS has not given the task to the transaction scheduler. See “Why tasks are not
given to the scheduler” on page 38 for further information.
Task is not scheduled
If CEMT INQ TASK displays information about the task, the scheduler has received
the task request. If the information shows the task as dispatchable, the scheduler
has not yet scheduled the task for execution. If this is the case, see “Why tasks are
not scheduled” on page 39.
Note: For a conversational transaction, any delay in scheduling the task appears
as a hang on the terminal from which the transaction was invoked.
Terminal definitions not removed from the system
An occasion might occur in which users kill the cicslterm process that is running
their autoinstalled terminal because the terminal appears to hang; for example,
because of an abnormal transaction termination. If this condition occurs, the CICS
terminal definitions might not be uninstalled and therefore might remain in the
system. The first indications of this condition might be a drop in performance, or
reports from the users.
You can check for uninstalled terminal definitions by using CEMT INQUIRE
TERMINALto see whether more terminals than otherwise expected are in the list of
terminals, particularly if they have similar NETNAMEs. (This indicates that the user
has killed the cicslterm process that is running their autoinstalled terminal, and has
started up a new one). Then you can use the ps command to determine which
terminal definitions do not have any cicslterm processes, and are therefore
uninstalled. Remove the unused terminal definitions by setting the terminals
OUTSERVICE in CEMT. For further information, see TXSeries for Multiplatforms
Administration Reference and “Transaction does not run” on page 109.
© Copyright IBM Corp. 1999, 2008 37
You must investigate the primary cause of the problem; for example, the abnormal
termination or hang of the transaction, to ensure that it does not reoccur.
Why tasks are not given to the scheduler
A transaction might not be given to the scheduler for various reasons. Some of the
reasons depend on how the task is started.
Terminal and remotely initiated tasks
The RPC listener process, cicsrl, handles requests from cicslterm, cicsteld, and
from PPC Gateway servers that might be requests from other CICS regions or SNA
applications.
It is possible that the value set for the RPCListenerThreads attribute in the
Regions Definitions (RD) is too low. This attribute controls the number of threads
that cicsrl creates for listening for incoming transactions and install requests.
A thread can be in use only for the time taken to give the task to the scheduler
(asynchronous scheduling). This rarely leads to problems. However, a thread can
be in use until the task is completed (synchronous scheduling). This leads to
improved performance in many cases, but can lead to task-scheduling problems
where RPCListenerThreads is set too low. See “Why tasks are not scheduled” on
page 39.
When the RPC listener threads are too few for the region workload, synchronous
scheduling can result in all threads being in use and no further tasks being
scheduled until one or more of the active tasks is completed. To minimize the risk of
this happening, cicsrl manages the available threads so that approximately 90% of
threads can be used for synchronous scheduling. Further tasks are then scheduled
asynchronously. Note, however, that terminal install requests are always scheduled
synchronously. When all RPC listener threads are busy, cicsrl does not schedule
any further tasks until the number of synchronous requests reduces. Use CEMT
INQUIRE TASK to list all transactions that are known to the scheduler.
Note: For each busy thread, an additional eight requests will be queued, waiting for
a thread to become available. When all threads are busy and the additional
request queues are all full, further requests are then rejected.
Interval control transactions
An interval control transaction might not be started for several reasons:
v The interval that is specified on an EXEC CICS START command has not
expired, or the time specified has not been reached, or an error is affecting
interval control.
Check whether the EXEC CICS START command includes INTERVAL or TIME.
v The terminal that is specified on an EXEC CICS START command is not
available. It might be out of service or performing another task. You can check
the status of the terminal by using CEMT INQ TERMINAL, then rectify the
problem if necessary.
Remember that it can take CICS a long time to give a transaction to the
scheduler if several tasks are queued on the terminal, especially if some tasks
require user interaction.
v A remote region that is specified on an EXEC CICS START command is not
available, or an error condition has been detected in the remote region. In a case
like this, the error is not reported back to the local region.
38 TXSeries for Multiplatforms: Problem Determination Guide
You can use the CICS Resource Definition Online (RDO) facility to inquire on the
Communications Definitions (CD) to determine the status of the remote region at
installation.
You can use the EXEC CICS INQ CONNECTION command to find out the
current status of the remote region.
Note also that Interval Control transactions that specify a terminal or remote
region are considered terminal and remotely initiated tasks.
Why tasks are not scheduled
Several things affect the time it takes to schedule a task:
v Task Class
v Application server availability
v Task priority
Do not consider any of these in isolation.
Task is held by class
A task uses the class of its associated transaction. This is defined with the TClass
attribute in the Transaction Definitions. The maximum number of tasks of each class
that can be run in a region at any one time is controlled by the ClassMaxTasks
attribute in the Region Definitions. When a task request is received, and the
maximum number of tasks in that class are already running in the region, the task
request is queued. If this results in unwanted delays in running tasks, review your
use of transaction classes. See the TXSeries for Multiplatforms Administration
Guide .
No application server available
The number of application servers that are available in a region is controlled by the
MinServer, MaxServer, and ServerIdleLimit attributes in the Region Definitions.
When a task request is received, it is given to an idle server if possible. If no idle
server is available, the task request is queued, and if the maximum number of
servers that are specified by MaxServer are not running already, a new server is
started. After it is queued, the task does not run until a server becomes available for
it.
The most efficient way to schedule tasks is to run them in servers that are idle
when the task request is received. The likelihood of an idle server being available is
controlled by the values that are set for the MinServer and ServerIdleLimit
attributes. The region always maintains the minimum number of servers that are
specified by the MinServer attribute. Any server that is above the MinServer
requirement remains idle for the number of seconds specified by the
ServerIdleLimit attribute before closing down. You must balance your setting of
these attributes in accordance with the expected flow of task requests and the
resource requirements of redundant application servers.
The default ServerIdleLimit is 300 seconds (five minutes). This is to allow the
operating system to perform automatic working set trimming, which reduces the
amount of RAM that the cicsas process uses over time. Setting ServerIdleLimit to
a very low value to reduce the use of memory can actually cause increased
memory consumption, because newly created application servers acquire a large
working set, which is trimmed relatively slowly, unless the whole system has little
free memory available.
Chapter 7. Dealing with performance problems 39
If all the application servers are busy, it might be because all the servers are
occupied by conversational transactions that are waiting for user input. Check
through the list of running transactions to see whether this is the case.
On Windows only, application servers can consume relatively large amounts of
memory. Most performance problems are caused by shortages of memory.
Therefore, be careful not to over-allocate the application servers.
Task priority
Queued tasks requests are removed from the queue in the sequence of their
priority when the reason for their being queued is removed. After a task is queued,
its priority cannot be changed. As a result, a task remains queued if the region
receives requests for tasks with a higher priority.
If this creates a problem, you can change the priority for the task so that the next
invocation does not have the same problem. The priority of the task can be
increased, or the reason for its being queued in the first place can be relaxed. The
priority of a task is the sum of the transaction, terminal, and user priorities; the
maximum is 255.
Why the scheduler refuses to schedule tasks
If the absolute limit of tasks that is permitted in the system has been reached for
any given task class (specified by ClassMaxTasks + ClassMaxTaskLim attributes -
1), subsequent tasks of that class that come into the system are never scheduled.
The scheduler refuses to handle them and they are purged from the system.
Every time this happens, the scheduler statistics are updated to reflect the purging
of each task.
The scheduler dump information
If you are having trouble diagnosing where a scheduling bottleneck occurs, the
transaction scheduler information that is in the System Global Data section of a
dump might help. When the region appears slow in running transactions, you can
use the CEMT PERFORM SNAP command to compile a dump. You can locate the
scheduler section of the dump by searching for the following message:
**** SCHEDULER MODULE (ConTS) ****
Although some of the information is useful only to your support organization, other
information is of wider interest. The following information is included:
For each task class:
v The number of tasks that are active (running in an application server)
v The number of tasks that are queued
v The maximum number of active tasks that are allowed in the region as defined
by the ClassMaxTasks attribute in the Region Definitions
v The maximum number of tasks that are allowed to be queued
For application servers:
v The minimum that is allowed in the region. This is usually the value of the
MinServer attribute in the Region Definitions, although it might have been
changed by using CEMT SET TCLASS, and it will be 0 in a shutdown dump.
v The current number that is running in the region.
40 TXSeries for Multiplatforms: Problem Determination Guide
v The maximum that is allowed in the region. This is usually the value of the
MaxServer attribute in the Region Definitions, although it might have been
changed by using CEMT SET TCLASS.
v A list of application servers that are currently idle.
v A list of tasks, in priority sequence, that are currently queued in the region.
v A list of tasks that are currently running in the region.
Information about each task that is listed includes the task number, the transaction,
device and user ID, the task priority, the transaction class, and whether or not the
transaction is synchronous.
If the region is having bottleneck problems, and if the CEMT transaction was not
started before the bottleneck happens, it is important that you assign CEMT to a
unique transaction class. This is so that an application server is always available to
run the CEMT transaction. See the description of the ClassMaxTasks and
MaxServer attributes of the Region Definitions (RD) and the description of the
TClass attribute of the Transaction Definitions (TD) in the TXSeries for
Multiplatforms Administration Reference.
Scheduler statistics
In addition to the information that is provided in the dump, the scheduler also
provides helpful statistics. These are:
v The maximum number of tasks in region (active and queued)
v For each transaction class (1 through 10):
– The class maximum value (ClassMaxTasks)
– Current number of tasks that are in region
– Number of times that class maximum was reached
– Maximum number of tasks that was reached (active and queued)
– Maximum number of tasks that is permitted (ClassMaxTasks +
ClassMaxTaskLim - 1)
– Number of tasks that were purged because the permitted maximum number of
tasks were in the system.
For more information about task statistics, see the TXSeries for Multiplatforms
Administration Reference.
Short on storage
New tasks can obtain an application server even when the system is short on
storage (SOS). In this condition, tasks run, but with degraded performance.
When the SOS condition occurs, CICS sends one or other of these messages to
the console.nnnnnn file:
ERZ048001I CICS Is Under Stress - Short on Task Shared storage.
ERZ048002I CICS Is Under Stress - Short on Runtime Support storage.
If you see a repeating pattern of messages telling you that CICS is short on
storage, then it is not short on storage, a transaction might well contain a
GETMAIN/FREEMAIN loop.
If you cannot see any SOS messages in the console.nnnnnn file, you can find out
how many times CICS has raised SOS from the storage statistics.
Note:
Chapter 7. Dealing with performance problems 41
1. CICS also raises the SOS condition if a task makes an unconditional
request for storage when the system is approaching SOS. If the request
is for task shared storage, CICS suspends the task that is making the
unconditional request.
2. Short-on-storage messages might mean only that a greater volume of
work than normal is running through your system. It could also be that
the nature of transactions has changed, putting increased demands on a
particular pool. Both these conditions can be resolved by increasing the
appropriate Region Definition (RD) attributes. Try doubling the existing
values and seeing whether the short-on-storage messages disappear. If
they do, you could reduce the values slightly. If, after increasing the
values, the short-on-storage messages take longer to appear, you might
have a problem with an application that is leaking storage.
Incorrect settings of region attributes
In addition to the MinServer and MaxServer attributes, the settings of other
attributes that are in the Region Definitions (RD) might adversely affect
performance:
CheckpointInterval
Determines how often CICS writes snapshots of the region to its master log.
The value of this attribute is a compromise between the need to reduce restart
time following an abnormal termination (requiring a low value), and the need to
avoid slowing down active tasks during normal running (requiring a high value).
IntrospectInterval
Determines how often CICS schedules a CICS-private transaction that checks
the internal consistency of the region.
The value of this attribute is a compromise between the need to check that user
transactions do not destroy region-owned data, for example, by writing beyond the
logical end of the common work area (CWA), (requiring a low value), and the need
to avoid slowing down active tasks while it runs (requiring a high value).
Incorrect settings of SFS attributes
The following Structured File Server Definition (SSD) attributes might affect
performance or cause errors when an SFS server is configured as the CICS file
and queue manager:
OpThreadPoolSize
Determines the maximum number of SFS requests that can be processed
concurrently by the server. If you set the value too low, the application servers
get communication errors for file operations that involve the SFS server. The
SFS server still runs, but error messages will be in CSMT. The optimum value
for OpThreadPoolSize depends on how heavily the server is used. A guideline
is to set the attribute value proportional to the number of application servers
that are configured to use the SFS server. The value also depends on the type
of usage and the region configuration.
ResThreadPoolSize
Determines how many threads are available for particular SFS calls that free
resources. Normally, the default value of 3 is enough, but if a server is heavily
used, you might need to increase that value.
IdleTimeout
If a transaction contends for an SFS thread and blocks for a period greater than
42 TXSeries for Multiplatforms: Problem Determination Guide
the IdleTimeout value that is specified for the SFS server, errors can occur.
You can often solve this by increasing the value for the OpThreadPoolSize
attribute. If this does not work, it might be the fault of the transaction. If the
setting for the DeadlockTimeout attribute for the transaction is too high, you
can reduce it. If the transaction is badly designed, you can restructure it (for
example, by adding SYNCPOINTs).
Chapter 7. Dealing with performance problems 43

44 TXSeries for Multiplatforms: Problem Determination Guide
Chapter 8. Dealing with unanticipated output
This section tells you what to do if you do not get the output that you expected:
v “An output device displays unanticipated data”
v “Unanticipated data is present on a file or user journal” on page 47
v “An application did not work as expected” on page 47
An output device displays unanticipated data
An output device can display unanticipated data for system-related reasons or for
application-related reasons. The following is an explanation of how to investigate
output that is unanticipated for system-related reasons.
In this discussion, a terminal is any device by which the system can display data;
for example, a screen or a printer. CICS recognizes other types of terminals,
including remote CICS regions, but this section does not consider them.
Problems with unanticipated data on a terminal are:
v The data information is wrong, so unexpected values appear.
v The layout is incorrect; that is, the format of the data is wrong.
In practice, it can be difficult to distinguish between unanticipated data and incorrect
formatting, but often you do not need to make this distinction to handle the problem.
Sometimes a transaction runs satisfactorily at one terminal but does not give the
anticipated output on another. This might be because of a difference in the terminal
characteristics or because the transaction encountered an incorrect window size at
the second terminal.
Preliminary information
Before you can investigate the reasons why CICS displays unanticipated output at a
terminal, you need the following information about the transaction that is running at
the terminal and about the terminal itself:
v The identity of the transaction that is associated with the unanticipated output
v The model number of the terminal, if it is an autoinstalled terminal, to ensure that
you query the correct terminal type. You can find this from the autoinstall
message in the CSMT log.
Depending on the symptoms, you might need to use CEMT INQ TERMINAL to find
the terminals that are defined, and Resource Definitions Online (RDO) commands
to check the Terminal Definitions (WD) for the affected terminal. The most useful
attributes to check are NumLines and NumColumns in the WD entry for the
terminal. Other attributes might also be significant.
Specific types of unanticipated output
Unanticipated output can be of several specific types, each with possible causes.
Unexpected messages and codes
If the incorrect data is a message or code that you do not understand, look in
TXSeries for Multiplatforms Messages and Codes for a further explanation of the
meaning.
The following example is a common error that causes CICS to display a code:
© Copyright IBM Corp. 1999, 2008 45
An application has sent a spurious hex value corresponding to a
control character in a data stream.
For example, X’11’ is
understood as set buffer address by an IBM 3270
Information Display System terminal, and the values that follow are
interpreted as the new buffer address.
This eventually causes CICS to display an error code.
If your problem is similar to this example, check your application code carefully to
ensure that the application code is not sending any unintended control characters.
Unexpected appearance of uppercase or lowercase characters
If CICS has unexpectedly translated the data on your terminal into uppercase
characters, or if you have some lowercase characters when you were expecting
uppercase translation, look at the options that are governing the translation.
The UCTranFlag (see the TXSeries for Multiplatforms Administration Reference)
specifies whether lowercase characters in the data that has been sent from a
transaction are to be translated to uppercase.
Wrong data values are displayed
If the data values are wrong on the user’s part of the screen (the space above the
area that CICS uses to display status information to the user), or in the hard copy
that a printer produces, it might be an error in the application or an error in input to
the application.
Some data is not displayed
If you find that some data is not being displayed, the values that are set for the
MapHeight or MapWidth attributes in the WD might be too large for the device that
is receiving the data. In this condition, the receiving buffer for the device overflows,
resulting in lost data.
Another reason could be that the Basic Mapping Support (BMS) is not using the
correct map suffix for the device. Check whether the map suffix for the device is
correct, and check whether the SufficesSupported attribute in the Region
Definitions (RD) is set to yes.
The data format is wrong
Incorrect data formatting can have many causes. Some possible causes are:
v Basic Mapping Support (BMS) maps are incorrect.
v Applications have not been recompiled with the latest maps.
v The NumLines and NumColumns values that are included in the Terminal
Definitions (WD) conflict with the characteristics of the terminal.
For a screen display, the number of columns must be less than or equal to the
line width. For a printer, the number of columns that is specified must be less
than the line width; otherwise, both BMS (if you are using it) and the printer
provide a new line so you get unwanted extra spacing.
v An application is sending control characters that are not required by the printer.
If your application is handling the buffering of output to a printer, ensure that an end
of message control character is sent at the end of every buffer full of data.
Otherwise, the printer might put the next data that it receives onto a new line.
46 TXSeries for Multiplatforms: Problem Determination Guide
Unanticipated data is present on a file or user journal
This error can occur if the Structured File Server (SFS) or user journal allows a
transaction to read a record while another transaction is updating it. If the
transaction that is reading the record takes action that is based on the value of the
record, the action might be incorrect. This depends on how the application has
been written and how it controls access to resources; for example, whether it uses
syncpoints.
Example
In an inventory control, a warehouse has 150 items in stock. One hundred items
are sold to a customer, who is promised delivery within 24 hours. The invoice is
prepared, and this causes a transaction to be started that reads the inventory
record from an SFS or operating system file and updates it accordingly.
In the meantime, a second customer also asks for 100 items. The salesperson uses
a terminal to query the number currently in stock. The querying transaction reads
the record that the first transaction has read for update but not yet rewritten, and
returns the information that there are 150 items. This customer, too, is promised
delivery within 24 hours.
To guard against this type of error, always read for update and do not split Logical
Units of Work (LUWs).
An application did not work as expected
It is not possible to give specific advice about how to handle this type of problem,
but the points and techniques that follow can help you to find the area in which the
error is occurring.
Applications getting forcepurged
The factors influencing forcepurge of a task are as follows:
v Client timeouts. If a client times out (such as ECI timeout), TXSeries forcepurges
the task. The client is informed about the status of the forcepurge: task abended
(1); task not abended (2).
v Network failure. If a network connection is lost with a client or region, TXSeries
forcepurges all the associated tasks.
v Abnormal terminal disconnects. If a terminal is abnormally disconnected,
TXSeries forcepurges the associated task.
v User induced. A user can forcepurge a task using CEMT SET TASK command.
For more information see TXSeries for Multiplatforms Administration Reference.
Whenever a task is forcepurged, a message is logged in the console, which will
have information about the cause and the ID of the process which initiated the
forcepurge. Forcepurge of a task will cause the associated application server to go
down. It is possible that the task might not be forcepurged if TXSeries is in a critical
execution path; a message will be logged in such situations.
For more information on forcepurge see TXSeries for Multiplatforms Administration
Reference.
Chapter 8. Dealing with unanticipated output 47
|
|
|||
||
||
|
|
|||||
||
General points to consider
v Ensure that you can define exactly what happened, and how this differs from
what you expected to happen.
v Check whether the commands that you are using are accurate and complete. For
definitive programming interface information, see the TXSeries for Multiplatforms
Application Programming Reference. If you have used default values, are the
default values the values that you really want? Does the description of the effect
of each command match your expectations?
v Can you identify an incorrect sequence of commands? If so, can you reproduce
the incorrect sequence of commands by using CECI?
v Are the resources that the application requires defined as you expect?
v For input type requests, does the item exist? You can check this by using offline
utilities.
v For output type requests, is the item created? Check that the before- and
after-images are as you expect.
Using traces and dumps
Traces and dumps can give you valuable information about unusual conditions that
could make your application work in an unexpected way.
v If the path through the transaction is indeterminate, insert user trace entries at all
the principal points.
v If you know the point in the code where the error occurs, insert a CICS
transaction dump request immediately after the error point.
v Use CEMT to set the master system trace flag ON.
v Run the transaction after setting the trace options, and wait until CICS responds
to the system dump request. Format the internal trace table from the dump, and
examine the trace entries before the error. Look in particular for unusual or
unexpected conditions, possibly ones that the application is not designed to
handle.
Classifying the problem
Was the output from the transaction:
v No output at all
v Incorrect output.
Transactions that produce no output must be resolved differently from those that do.
No output at all
If your transaction produced no output at all, the following preliminary checks might
provide a simple explanation for the error.
Do you have any messages?
Check the CSMT transient data queue and the console.nnnnnn file for any
messages that might relate to the task. You might have a message that explains
why you received no output.
If there is no message, look at information about your terminal, the CICS region,
and the status of the transaction that produced no output.
48 TXSeries for Multiplatforms: Problem Determination Guide
Can you use the terminal where the transaction should have
started?
Go to the terminal on which the transaction was expected to have started, and
check whether the keyboard is locked. Press RESET if it is. Try to issue CEMT INQ
TASK from the terminal.
If you cannot issue CEMT INQ TASK from the terminal, one of these explanations
applies:
v The task that produced no output is still attached to the terminal.
v The terminal on which you made the inquiry is not in service.
v The problem is system wide.
v You are not authorized to use the CEMT transaction.
Find a terminal from which you can issue CEMT INQ TASK. If no terminal seems
to work, probably a system wide problem has occurred. Otherwise, see whether
the task you are investigating is shown in the task summary.
v If the task is shown, it is probably still attached, and either looping or waiting.
v If the task is not shown, the terminal from which you first attempted to issue
CEMT INQ TASK has a problem.
If you can issue CEMT INQ TASK from the terminal at which the transaction was
attached, one of these explanations applies:
v The transaction gave no output because it never started.
v The transaction ran without producing any output, and terminated.
v The transaction started at another terminal, and might still be in the system. If the
task is still in the system, it should be in the task summary that you got for CEMT
INQ TASK. The task might be looping or waiting, or it might be a long-running
task.
What to do if the task is still in the system
If you obtained no output and the task is still in the system, it is either waiting for
some resource, or looping. Look at the status for the task that is returned by CEMT
INQ TASK, and use the ps command to see which condition is most likely.
If the task is suspended, handle this as a wait problem. See Chapter 5, “Dealing
with waits,” on page 21 to investigate the problem further.
If the task is running, it might be looping. See Chapter 6, “Dealing with loops,” on
page 33 to find out what to do next.
What to do if the task is not in the system
If you have obtained no output and CEMT INQ TASK shows the task is not in the
system, one of two things might have happened:
v Your transaction never started.
v Your transaction ran but produced no output.
A task can be initiated by direct request from a terminal, or by Automatic Task
Initiation (ATI). Most of the following problem-determination techniques apply to both
sorts of task, but for ATI tasks, you must investigate some extra items. Perform the
tests that apply to all tasks first, then go on to the tests for ATI tasks if you need to
(see “Investigating tasks initiated by Automatic Transaction Initiation (ATI)” on page
51).
Chapter 8. Dealing with unanticipated output 49
Did the task run? Techniques for all tasks
Many techniques are available that can help you determine whether a transaction
started, or ran but produced no output. Use the techniques that are most
appropriate for your installation.
Using CICS system trace entry points: CICS system tracing is a powerful
technique that helps you determine whether a transaction ever started. If you are
not sure about what time a task is expected to start, direct the trace output to the
auxiliary trace destination, because even a large internal trace table might wrap and
overlay the data that you want to see.
Use the CEMT INQUIRE/SET TRACE transaction to request the trace facility. See
“An application did not work as expected” on page 47 for guidance about setting up
trace options and the TXSeries for Multiplatforms Application Programming
Reference for further information about CEMT INQUIRE/SET TRACE.
Turn tracing on, and try to start your task. When it is past the time when the output
is expected to appear, stop tracing and format the trace file.
Using the Execution Diagnostic Facility (EDF): If the transaction that is being
tested requires a terminal, you can use the CEDF transaction. Put the transaction
terminal under control of EDF by issuing the following command on the terminal
that you are using for EDF:
CEDF TTTT
At the transaction terminal, enter the transaction, or the sequence of transactions
that causes CICS to initiate the transaction that is under test. Wait long enough for
the transaction to start. If no output appears at the transaction terminal, the
transaction has not started. If you have not yet done so, use trace to get more
information about the error. Any program that you want to run with EDF must be
compiled for EDF. You must have the appropriate security and task rating to use
EDF.
Using statistics: If no one else is using the transaction in question, the CICS
statistics show whether the program has run or not.
Use the EXEC CICS SET STATISTICS command before you test your transaction.
Initiate the transaction, and wait until it should have run. Repeat the EXEC CICS
SET STATISTICS command to get a new set of statistics written to the statistics file.
Format the data from the file for the transaction that you are checking, and look at
the statistics that were recorded before and after you attempted to run the
transaction.
Using CEBR: You can use CEBR (Temporary Storage Browse) to investigate your
transaction if it reads from, or writes to, a transient data queue or temporary storage
queue. A change in either of these queues suggests that the transaction ran,
provided that the environment is sufficiently controlled so that nothing else (for
example, another transaction) could produce the same effect.
If no change occurs to either of these queues, it does not necessarily mean that the
transaction did not run. It might have run incorrectly and therefore did not make the
expected change.
Using CECI: If your transaction writes to a file, you can use CECI (Command
Level Interpreter) before and after the transaction to check whether the transaction
50 TXSeries for Multiplatforms: Problem Determination Guide
did run. A change in the file means the transaction ran. If no change occurred, that
does not necessarily mean that the transaction did not run. The transaction might
have worked incorrectly so that CICS did not make the expected changes.
Disabling the transaction: If your transaction requires a terminal, use the CEMT
transaction to disable the transaction that is under test, then initiate the transaction.
You should get this message at the terminal where it is due to run:
ERZ100025E Transaction ’xxxx’ rejected - ’yyyy’
If you do not get this message, possibly your transaction did not start because of a
problem with that terminal.
Investigating tasks initiated by Automatic Transaction Initiation
(ATI)
In addition to the general techniques for all tasks, some additional techniques are
required for tasks that are to be started by ATI.
You can run tasks that are to be started by ATI in either of these ways:
v By issuing EXEC CICS START commands, even if you do not specify an interval
v By writing to transient data queues with nonzero trigger levels.
Automatically initiated tasks might not start for many reasons. If the CICS system is
operating normally, an ATI transaction might not be able to start for either of the
following reasons:
v The ATI transaction needs a resource that is not available. The resource is
usually a terminal, although it can be a queue.
v The ATI transaction is not scheduled to start until some time in the future. EXEC
CICS START commands are subject to this sort of scheduling, but transactions
that are started when transient data trigger levels are reached, are not.
CICS maintains a chain for scheduling transactions that have been requested, but
not started, called the Interval Control Element (ICE) chain. Each element in this
chain contains details of a transaction that is waiting to start.
Incorrect output
If your transaction produced no output at all, see “No output at all” on page 48.
You get incorrect output to a terminal if data that is the object of the transaction
becomes overwritten at some stage.
Data can be overwritten at various points in a transaction as it flows from its source;
for example a file, to a terminal. For five common reasons, data can be overwritten
when it is retrieved from a source and output to the terminal:
v Data records are incorrect or missing from the file.
v Data from the file is mapped into the program incorrectly.
v Data input at the terminal is mapped into the program incorrectly.
v Bad programming logic causes the data to be overwritten.
v Data is mapped incorrectly to the terminal.
Each of these possibilities is discussed in turn.
Missing or incorrect records
You can check the contents of a file or database either by using CECI, or by using
a utility program to list the records in question.
Chapter 8. Dealing with unanticipated output 51
If you find invalid data in the file, possibly the program that last updated the records
that contain that data caused the error. If the records that you expected were
missing, check whether your application can handle a ‘record not found’ condition.
If the data that is stored in the file is valid, the data has been overwritten after the
program read it in.
Data mapped incorrectly into the program
When a program reads data from a file or a database, the data is put into a field
that is described by a symbolic data declaration in the program.
Check whether the data that is contained in the record is compatible with the data
declaration that is in the program.
Check each field in the data structure that is receiving the record, and ensure that
the type of data that is in the record is the same as the type of data that is in the
declaration. Ensure also that the field that is receiving the record is the correct
length.
If the program receives input data from the terminal, ensure that the relevant data
declarations are correct for that also.
If the way in which data is mapped from the file or terminal to the program storage
areas is without error, check the program logic.
Poor programming logic
To determine whether data is being overwritten by poor programming logic in the
application, check the flow of data through the transaction.
You can determine the flow of data through your transaction by checking the source
code by hand, or by using the interactive tools and tracing techniques hat are
supplied by CICS.
Checking the source code by hand is sometimes best done with the help of a
programmer who is not familiar with the program. Often, such a person can see
weaknesses in the code that you have overlooked.
You can use interactive tools to see how the data values that the program
manipulates change as the transaction proceeds. Tools, including the following, are
described in Chapter 2, “Sources of information,” on page 7. See the TXSeries for
Multiplatforms Application Programming Guide for details of the tools that are
available with CICS on Open Systems.
v IBM Application Debugging Program
v Application debugging tools
v CECI
v CEBR
v User trace enables you to trace the flow of control and data through your
program, and to record data values at specific points in the running of the
transaction. You can, for example, look at the values of counters, flags, and key
variables during the running of your program. This can be a powerful technique
to find where data values are being overwritten.
For general programming interface information about user tracing, see the
TXSeries for Multiplatforms Application Programming Reference.
If the logic of the program is without error, check the way that data is mapped to
the terminal.
52 TXSeries for Multiplatforms: Problem Determination Guide
Data mapped incorrectly to the terminal
Incorrect data mapping to a terminal can have both application-related and
system-related causes. If you are using Basic Mapping Support (BMS) mapping,
check these items:
v Examine the symbolic map carefully to ensure that its date, time stamp, and size
agree with the map that is in the load module.
v Ensure that the attributes of the fields are appropriate. For example:
– An attribute of DARK on a field can prevent the data in the field from being
displayed on the screen.
– Not turning on the Modified Data Tag (MDT) in a field might prevent that field
from being transmitted when CICS reads the screen in.
Note: The MDT is turned on automatically if the user enters data in the field. If,
however, the user does not enter data there, the application must turn the
tag on explicitly to read the field in.
v If your program changes a field attribute byte or a write control character, look at
each byte and check whether its value is correct by looking in the appropriate
reference manual for the terminal.
v Check whether the window size is correct.
Chapter 8. Dealing with unanticipated output 53

54 TXSeries for Multiplatforms: Problem Determination Guide
Chapter 9. Dealing with storage violations
Storage violations divide into two classes:
v Those detected and reported by CICS
v Those not detected by CICS
They require different problem determination techniques. Violations that are
detected by CICS are easy to identify, because CICS sends an informative
message to the console.nnnnnn file or to the CSMT TD queue.
If you have received a storage violation message, look up the message in TXSeries
for Multiplatforms Messages and Codes. It contains an explanation of the values,
telling you how CICS detected the storage violation. Then see “CICS has detected
a storage violation.”
Storage violations that are not detected by CICS are less easy to identify. They can
cause almost any sort of symptom. Typically, you get a program exception with a
condition code that indicates an operation exception or a data exception, because
the program or its data has been overwritten with invalid data. Whatever the
evidence for the storage violation, if CICS has not detected it, see “Storage
violations that affect innocent transactions” on page 64.
CICS has detected a storage violation
CICS uses the concept of signature strings to detect storage violations. The
signature strings are checked for consistency when a storage area is released back
to CICS. Signature strings are also checked by CICS self-consistency checks. If a
signature string is overwritten, a storage violation has occurred.
CICS has several functions that automatically perform internal checking procedures,
including a CICS-private transaction that is scheduled to detect storage violations
periodically. This is called self-consistency checking or introspection.
The action that CICS takes when a storage violation occurs depends on which
storage pool is affected:
v Task-Private Pool
v Task-Shared Pool
v Region Pool
Task-private pool
The task-private pool contains:
v Storage that is allocated by GETMAIN from the program code of the transaction
v Storage areas that are allocated internally by CICS application server code
CICS checks for storage violations in the task-private pool when a program
explicitly calls FREEMAIN, when CICS releases storage that it allocated internally,
and when storage is reclaimed at the end of a task. If CICS detects a storage
violation, messages are written to CSMT or console.nnnnnn indicating the address
where the storage violation occurred.
One of the following messages is written to CSMT or console.nnnnnn if CICS
detects a storage violation while a transaction is executing:
© Copyright IBM Corp. 1999, 2008 55
ERZ047007E CICS has detected a storage inconsistency\
in transaction ... on terminal ...
ERZ047009E CICS has detected a storage inconsistency \
in transaction ... executing ...
ERZ047010E CICS has detected a storage inconsistency \
in storage area ... at ...
If CICS detects a storage violation in the task-private pool while a transaction is
executing, abend A47C is raised. If you have set the TransDump attribute in the
Transaction Definitions (TD) to yes, CICS initiates a transaction dump. The affected
storage area is recovered into the task-private pool.
One of the following messages is written to CSMT or console.nnnnnn if CICS
detects a storage violation during the reclamation of storage at the end of a task:
ERZ047014W CICS has detected a storage inconsistency\
in transaction ... on terminal ...
ERZ047015W CICS has detected a storage inconsistency \
in transaction ... executing ...
ERZ047016W CICS has detected a storage inconsistency \
in storage area ... at ...
See TXSeries for Multiplatforms Messages and Codes for further information about
a specific error message.
If a storage corruption is detected during end of task storage reclamation, you do
not get a transaction dump. However, a dump can help you determine the source of
the problem, so it is useful to force a dump. To force a transaction dump, code an
EXEC CICS DUMP command immediately before an EXEC CICS RETURN
command in the transaction program. Choose the COMPLETE or STORAGE
options for the EXEC CICS DUMP command (see the Application Programming
Reference).
Task-shared pool
The task-shared pool contains:
v Storage that is allocated by GETMAIN SHARED from the program code of the
transaction
v Storage that is allocated for maps, tables, and the common work area (CWA)
v Storage areas that are allocated internally by CICS application server code
CICS checks for storage violations in this pool by using the CICS-supplied
transaction CLAM, which performs self-consistency checking.
If CICS cannot satisfy an EXEC CICS GETMAIN SHARED request because not
enough storage is available, it does not suspend the task, but returns a condition
code to the program. If CICS cannot satisfy BMS map requests and data table
requests because not enough storage is available, it does suspend the task.
If CICS detects a storage violation, the following message is written to
console.nnnnnn and the signature string is restored. The storage area is still
available, and the region and any executing transactions continue to run:
ERZ048027E A task shared pool has been overwritten...
If console.nnnnnn contains this type of message, which indicates inconsistency for
the task-shared pool, you can use CEMT PERFORM SNAP DUMP to take a
system dump.
56 TXSeries for Multiplatforms: Problem Determination Guide
Common programming errors that can cause storage violation problems are listed
in the TXSeries for Multiplatforms Application Programming Guide.
Region pool
The region pool contains storage that is allocated by CICS to hold control blocks
and system buffers.
CICS checks for storage violations in this pool by using the CICS-supplied
transaction CLAM, which performs self-consistency checking. If CICS detects a
storage violation, one of the following messages is written to console.nnnnnn:
See TXSeries for Multiplatforms Messages and Codes for further information about
a specific error message.
Storage violations in the region pool cause the CICS region to abnormally terminate
and produce a system dump. The information in the system dump can help you
determine the cause of the storage violation, but you need to inform your support
organization if a storage violation occurs.
SafetyLevel attribute
This attribute defines the degree of protection that CICS provides for programs that
are running in this region. Possible values are none, normal, and guard (CICS for
Windows only).
Note: SafetyLevel=normal is not supported on windows for COBOL transactions.
If you set SafetyLevel to none, CICS and user transactions can both access the
region pool.
If you set SafetyLevel to normal, on all operating systems except Solaris, only
CICS transactions can access the region pool. (On CICS for Solaris systems, the
SafetyLevel setting is ignored entirely, and user transactions can always access
the region pool.)
The guard setting is provided specifically for use on the Windows operating system.
On this operating system, the normal SafetyLevel setting incurs significant
performance costs in response time and system capacity. (A busy system can show
several thousand page and transition faults per second.) To lessen these
performance costs, the guard setting provides an intermediate level of protection in
which only the first and last (guard) pages of the region pool are protected.
Set SafetyLevel to normal on CICS for Windows only for test systems or for
debugging storage violations. If the overhead incurred by the normal setting is still
unacceptable in these conditions, set SafetyLevel to guard. On CICS for AIX and
CICS for HP-UX systems, the guard setting is handled in the same way as the
normal setting is.
The SafetyLevel setting affects the symptoms that you see when a user transaction
attempts a storage violation.
ERZ048020E CICS has overwritten the Region Control Area (RCA) signature
ERZ048021E CICS has overwritten the region pool data block signature ...
ERZ048022E CICS has overwritten the region pool data block terminator ...
ERZ048023E CICS has overwritten the region pool data block chain ...
ERZ048024E A region pool storage area has been overwritten by a data overrun ...
Chapter 9. Dealing with storage violations 57
|
When SafetyLevel is set to normal
The user transaction attempting the storage violation abends immediately with the
code ASRA. On CICS for Windows, the performance overhead for the normal
setting is high. On CICS for AIX and CICS for HP-UX, the overhead is low.
A user transaction is denied access to the region pool, and any attempt to reference
the pool, even for read-access, results in an immediate abend of the user
transaction with the code ASRA. The CICS application server does not abend. The
message ERZ014016E is written to console.nnnnnn.
The user transaction abends immediately with the code ASRA.
When SafetyLevel is set to none (or to any setting on CICS for
Solaris)
The transaction attempting the storage violation can either abend with the code
A158 during the attempt, or it can run without problems and other transactions can
fail later. A CICS internal transaction can abend. CLAM remains functional in all
cases. The CICS region can abend. If it does, the abend can be deferred, or it can
occur when the CLAM transaction detects a storage overwrite. No performance
overhead is involved.
Problems occur if a user transaction overwrites the region pool. The consequences
depend on which areas of storage are corrupted. Symptoms can include:
v The transaction that is corrupting the storage can abend with the code A158,
abending the application server.
v Subsequent transactions, including CICS internal transactions, can abend.
v The CLAM transaction can detect that the internal storage signatures are
corrupted. In this case, CICS abends and produces a dump. The following error
codes can occur:
– ERZ010074E
– ERZ010148E
– ERZ010003E
– ERZ052004I
No problems arise if a user transaction references the region pool for read-access
(however, this condition is not recommended or necessary).
The user transaction can abend immediately, continue before abending, or complete
successfully. Other transactions can subsequently abend with error messages that
are not previously associated with them, including references to internal data
inconsistencies. Significant delays can exist between the time at which the original
violation occurs and when subsequent transactions fail as a result. These delays
make problem diagnosis more difficult.
When SafetyLevel is set to guard (on CICS for Windows only)
You can see a mixture of symptoms as if SafetyLevel were set to none or normal.
A CICS internal transaction can abend. CLAM remains functional in all cases. If a
guard page is touched, the CICS region does not abend. If an area inside the
region pool is touched, the CICS region can abend. If it does, the abend can be
deferred or occur when the CLAM transaction detects a storage overwrite. A low
performance overhead is involved.
If a user transaction attempts to reference a guard page, it abends with the code
ASRA and has no effect on CICS. If a user transaction misses a guard page and
corrupts an area inside the region pool, the effects are the same as having
SafetyLevel set to none.
58 TXSeries for Multiplatforms: Problem Determination Guide
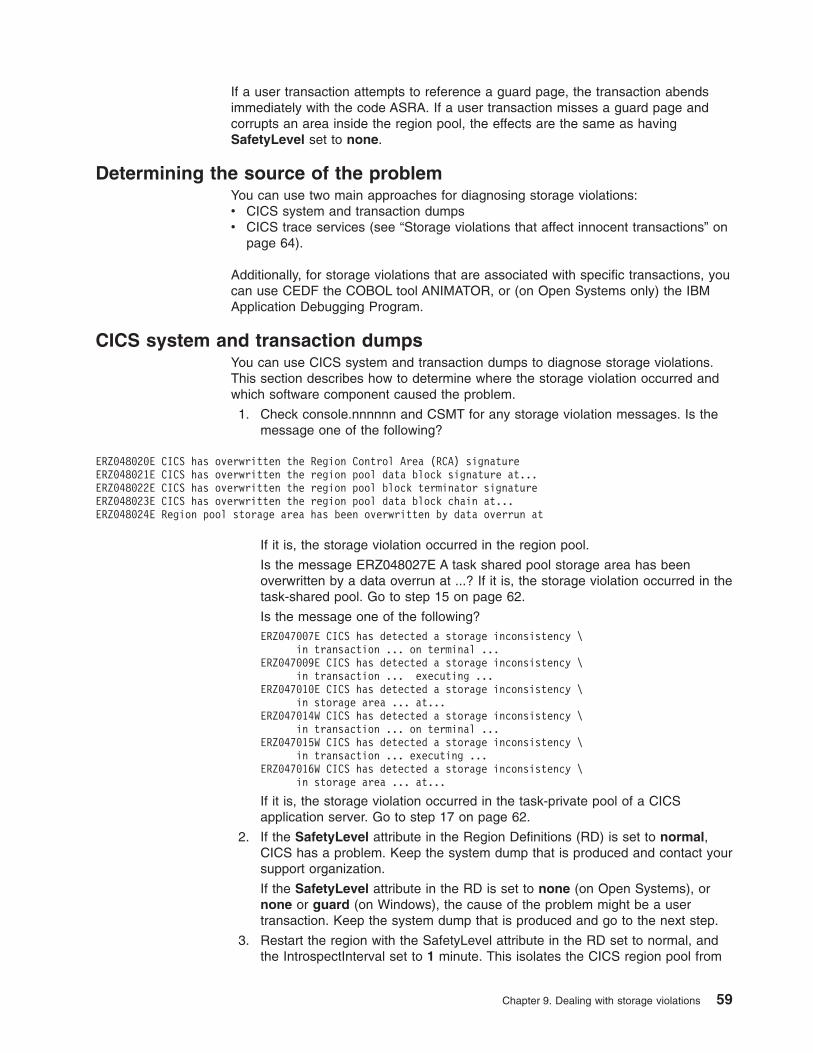
If a user transaction attempts to reference a guard page, the transaction abends
immediately with the code ASRA. If a user transaction misses a guard page and
corrupts an area inside the region pool, the effects are the same as having
SafetyLevel set to none.
Determining the source of the problem
You can use two main approaches for diagnosing storage violations:
v CICS system and transaction dumps
v CICS trace services (see “Storage violations that affect innocent transactions” on
page 64).
Additionally, for storage violations that are associated with specific transactions, you
can use CEDF the COBOL tool ANIMATOR, or (on Open Systems only) the IBM
Application Debugging Program.
CICS system and transaction dumps
You can use CICS system and transaction dumps to diagnose storage violations.
This section describes how to determine where the storage violation occurred and
which software component caused the problem.
1. Check console.nnnnnn and CSMT for any storage violation messages. Is the
message one of the following?
If it is, the storage violation occurred in the region pool.
Is the message ERZ048027E A task shared pool storage area has been
overwritten by a data overrun at ...? If it is, the storage violation occurred in the
task-shared pool. Go to step 15 on page 62.
Is the message one of the following?
ERZ047007E CICS has detected a storage inconsistency \
in transaction ... on terminal ...
ERZ047009E CICS has detected a storage inconsistency \
in transaction ... executing ...
ERZ047010E CICS has detected a storage inconsistency \
in storage area ... at...
ERZ047014W CICS has detected a storage inconsistency \
in transaction ... on terminal ...
ERZ047015W CICS has detected a storage inconsistency \
in transaction ... executing ...
ERZ047016W CICS has detected a storage inconsistency \
in storage area ... at...
If it is, the storage violation occurred in the task-private pool of a CICS
application server. Go to step 17 on page 62.
2. If the SafetyLevel attribute in the Region Definitions (RD) is set to normal,
CICS has a problem. Keep the system dump that is produced and contact your
support organization.
If the SafetyLevel attribute in the RD is set to none (on Open Systems), or
none or guard (on Windows), the cause of the problem might be a user
transaction. Keep the system dump that is produced and go to the next step.
3. Restart the region with the SafetyLevel attribute in the RD set to normal, and
the IntrospectInterval set to 1 minute. This isolates the CICS region pool from
ERZ048020E CICS has overwritten the Region Control Area (RCA) signature
ERZ048021E CICS has overwritten the region pool data block signature at...
ERZ048022E CICS has overwritten the region pool block terminator signature
ERZ048023E CICS has overwritten the region pool data block chain at...
ERZ048024E Region pool storage area has been overwritten by data overrun at
Chapter 9. Dealing with storage violations 59
user transactions and initiates self-consistency checking (introspection) at one
minute intervals. Attempt to reproduce the problem.
If the system abnormally ends with the same set of messages that you had at
step 1 on page 59, a problem exists within CICS. Keep the system dump that
is produced for this run, and contact your support organization.
If you have e no messages, you have a problem with a user transaction.
Restart the region with the SafetyLevel attribute set to none and the
IntrospectInterval attribute set to 1 minute. Attempt to reproduce the problem
again. This run should detect the problem within a minute of its happening and
help you to determine which transactions were running at that time. If you can
successfully reproduce the problem, keep the system dump that is produced
from this run and go to the next step.
If you cannot reproduce the problem, use the dump you kept from step 2 on
page 59 and go to the next step.
4. You must have a system dump. Format the system dump by using cicsdfmt.
Use an appropriate editing program to view the formatted dump file. Go to the
next step.
5. Look at each Task Control Area (TCA) that is in the system dump file. Each
application server that is in the region has one TCA. Search the dump file for
each occurrence of “Task Control Area Header”.
If the Task State value in the TCA header is TASTA_TASKSTATE_IDLE, you
have found a TCA for an idle task. If the Task State value in the TCA header is
any other value, you have found a TCA for an active task. Some information
headed “Control Area Task specific part:” follows the header information.
Make a note of the transaction identifier and terminal identifier from the Task
Control Area (TCA) specific dump and the address that is given for “Control
Area Task specific part:”. This information tells you which transactions were
active in the region when the storage violation occurred, or was detected.
Look for the string “**** Start of PROGRAM CONTROL MODULE Transaction
Dump (TasPR) ****”. This is the start of the information that shows which
programs were active in the region. In a system dump, this section occurs
many times. In the section entitled of “Program Control part of TCA task:” is a
field called “Active PCI”. This is the address of the Program Control
Information (PCI) for a program that was executing in a task when the storage
violation was detected.
A list of PCI structures follows this section. One PCI structure exists for each
program that was executing within a task. You can match the address that was
found in the “Active PCI” field with a structure in this list and find out the
associated program name. Therefore, you can use the PCI structures to find
out which programs were active in the region when the storage violation
occurred, or was detected.
You can use the information about which transactions and programs were
active to isolate which particular transaction is causing a problem. Retry each
transaction in turn and go to step 14 on page 61.
If you are investigating problems with the region pool, go to the next step.
If you are investigating problems with the task-shared pool, you must look at
the dump for further information about the storage violation. Go to step 16 on
page 62.
6. Look in the system dump file for the section headed “Management Area:”. This
is the beginning of the control information for the region pool. Go to the next
step.
60 TXSeries for Multiplatforms: Problem Determination Guide
7. Following the statistics information for the region pool is a record of each
control block for each allocation in the region pool. The message or messages
that you saw in console.nnnnnn and CSMT at the beginning of this procedure
contain hexadecimal address information that shows where the storage
violation was detected. Go to the step that corresponds the message that you
saw:
v For message ERZ048020E, go to step 10.
v For message ERZ048021E, go to step 11.
v For message ERZ048022E, go to step 12.
v For message ERZ048023E, go to step 13.
v For message ERZ048024E, go to the next step.
8. ERZ048024E contains the details of a User Area address and a Region Pool
Data Block address.
Note these addresses, and go to the next step.
9. Search for the address or addresses that you have found in the control block
lists.
When you find the control block for this User Area and Region Pool Data
Block, examine the control block information and the ASCII or Hexadecimal
dump of the User Area.
At this stage, you must check the dump carefully, because contents of the
control block and the user area might be important information. Examples of
useful information are:
v Character strings or hexadecimal data that only particular transactions and
programs can write
v File records that only particular transactions can process.
Make a note of the address or addresses from the message and the
ASCII/hexadecimal dump. Retry each transaction that is in the list that was
created in step 5 on page 60.
Go to step 14.
10. ERZ048020E contains the details of the address that contains the signature
string that guards the Region Storage control area. You can search for this
address in the dump and examine the output. The output might contain data
that belongs to a specific transaction or program.
Note the address from ERZ048020E and the information that the dump shows.
Retry each transaction that is in the list that was created in 5 on page 60.
Go to step 14.
11. ERZ048021E contains the details of the address that contains the signature
string that guards the start of a Region Pool Data Block.
Note this address, and go to step 9.
12. ERZ048022E contains the details of the address that contains the signature
string that guards the end of a Region Pool Data Block. Subtract 16 bytes from
this address. This gives the address of the start of the Region Pool Data
Block.
Note this address, and go to step 9.
13. ERZ048023E indicates that the linked list address in a Region Pool Data Block
does not address the next control block in the chain. The address in the
message is the start of a Region Pool Data Block.
Note this address, and go to step 9.
14. Retry each transaction that was found at step 5 on page 60 to see whether
any transactions cause the storage violation messages.
Chapter 9. Dealing with storage violations 61
You can use CEDF or application debugging tools IBM Application Debugging
Program. during this step. Use these tools to check the contents of the
program variables of the transaction; that is, to see whether the variable
contents are the same as any storage addresses that were found during the
investigation, or are the same as any data that was seen in the dump.
Occasionally, a problem is caused by the interaction between transactions. You
might need to try combinations of the active transactions to isolate this type of
problem further.
At this stage, you should have isolated the problem, and traced its cause to a
specific transaction. Investigate the transaction fully. For further information,
see the TXSeries for Multiplatforms Application Programming Guide .
If you have not isolated the problem to one transaction or a small set of
transactions, use the CICS trace facility to investigate the problem further. See
“Storage violations that affect innocent transactions” on page 64.
You have reached the end of this investigation.
15. Keep a copy of the system dump that was produced in the first step of this
procedure.
Restart the region with the IntrospectInterval attribute in the RD set to 1
minute. Attempt to reproduce the problem again. This run should detect the
problem within a minute of its happening, and help you determine which
transactions are running when the storage violation occurs, or is detected. If
you can successfully reproduce the problem, keep the system dump that is
produced from this run and go to step 4 on page 60.
If you cannot reproduce the problem, use the dump that you kept from the first
step in this procedure and go to step 4 on page 60.
16. Look for the string formatted system dump. This is the beginning of the
task-shared pool control area. Message ERZ048027E contains two addresses.
Look for the address that is given by Task-Shared Pool Data Block in the
dump.
The dump contains the corresponding Pool Data Block and an
ASCII/hexadecimal dump of the User Area.
At this stage, you must check the dump carefully, because the content of the
user area might be important. Examples of useful information are:
v Character strings or hexadecimal data that only particular transactions and
programs can write
v File records that only particular transactions can process
v Map and table data that only particular transactions can access
Keep a note of the address or addresses from the message and the
ASCII/hexadecimal dump. Retry each transaction that is in the list that was
created in step 5 on page 60.
Go to step 14 on page 61.
17. You must have a transaction dump that was produced in the first step of this
procedure. Format the transaction dump using cicsdfmt. View the formatted
dump file using an appropriate editing program. Go to step 18.
18. Look in the formatted transaction dump for the Task Control Area (TCA), by
searching for an occurrence of “Task Control Area Header”. A section that is
headed “Task Control Area Task Specific part:” follows the header information.
Note the transaction identifier and terminal identifier from the Task Control Area
(TCA) specific dump and the address that is given for Area Task specific part.
This information tells you which transaction was active when the storage
violation occurred.
62 TXSeries for Multiplatforms: Problem Determination Guide
Look for the string “****Start of PROGRAM CONTROL MODULE Transaction
Dump (TasPR) ****”. This is the start of the information that show which
programs were active in the region. In a system dump, this section occurs
many times. In the section entitled “Program Control Module part of TCA
task:”, is an “Active PCI”. This is the address of the Program Control
Information (PCI) for a program that was executing in a task when the storage
violation was detected.
A list of PCI structures follows this section. One PCI structure exists for each
program that was executing within a task. You can match, with a structure that
is in this list, the address that is in the “Active PCI” field, and determine the
associated program name. Therefore, you can use the PCI structures to
determine which programs were active in the task when the storage violation
occurred.
Go to the next step.
19. Search for “**** INTRA TASK STORAGE CONTROL MODULE (StoTA) ****” in
the formatted transaction dump. This is the beginning of the control areas for
the task-private pool allocations.
The error message that indicates an inconsistency in the task-private pool
contains the base address of the area that is allocated to a transaction. Search
for this address in the control blocks in the dump.
You will find an ASCII/hexadecimal dump of this area. At this stage, you must
check the dump carefully, because the content of the dump might be
important. Examples of useful information are:
v Character strings or hexadecimal data that only particular programs in this
transaction can write
v File records that only particular programs in this transaction can process
Keep a note of the address or addresses from the message and the
ASCII/hexadecimal dump information.
Go to the next step.
20. Retry the transaction that is indicated in the error message, using CEDF or
application debugging tools IBM Application Debugging Program. Use these
tools to check the contents of the program variables of the transaction; that is,
to see whether the variable contents are the same as any storage addresses
that were found during the investigation, or the same as the data that is in the
dump.
At this stage, you should have isolated the problem to a particular point in a
transaction program. Investigate the transaction program fully. For further
information, see the information about Storage Services in the TXSeries for
Multiplatforms Application Programming Guide.
If you have not isolated the problem, use the CICS trace facility to investigate
the problem further (see “Storage violations that affect innocent transactions”
on page 64).
You have reached the end of this investigation.
For more information, see:
v “Storage violations that affect innocent transactions” on page 64.
v Chapter 13, “Using CICS trace,” on page 85.
v Chapter 14, “Using CICS dump,” on page 103.
v The TXSeries for Multiplatforms Application Programming Guide.
v The TXSeries for Multiplatforms Administration Reference.
v The TXSeries for Multiplatforms Messages and Codes.
Chapter 9. Dealing with storage violations 63
Storage violations that affect innocent transactions
In the context of problem determination, innocent transactions are transactions that
are not suspected of causing the storage violation. Storage violations that affect
innocent transactions can be detected by the CICS self-checking transaction. CICS
logs such storage violations by writing an error message to the console.nnnnnn file.
The most likely cause of such a violation is a transaction that is overwriting an area
of storage in the task-shared pool that is accessed by the innocent transaction. This
could be an area of GETMAIN SHARED storage, a Basic Mapping Support (BMS)
map area, a data table, the CICS Common Work Area (CWA), or another area.
Finding the cause of the storage violation
The storage violation has been caused by a program that is writing to an area of
task-shared storage. You must determine which program caused the error.
You can look at the CICS system dump. When a storage violation occurs, take a
CICS system dump, unless the error causes CICS to take a system dump anyway.
Use the dump formatter (cicsdfmt) to format the dump information.
You can also use the CICS trace facility to collect a history of all the activities that
reference the affected area. The trace must be active from when CICS scheduled
the task that is overwriting the data, because that trace entry relates the
transaction’s identity to the unit of work number that is used on subsequent entries.
This could mean that you need a large amount of trace information. Internal trace is
not suitable, because when it is full, it overwrites essential trace entries.
Auxiliary trace is a suitable destination for recording long periods of system activity,
because you can specify very large auxiliary trace files, and they do not wrap when
they are full. Use the CEMT transaction to select auxiliary trace, and use the trace
formatter (cicstfmt) to format the trace information.
If you have no idea which transaction is overwriting the data, you have to trace the
activities of every transaction. This affects performance, because of the processing
overhead.
You cannot find the cause of the storage violation
Check the application program. Common programming errors that can cause
storage violation problems are listed in the TXSeries for Multiplatforms Application
Programming Guide.
If you cannot identify the cause of the storage violation after doing these
procedures, contact your support organization.
64 TXSeries for Multiplatforms: Problem Determination Guide
Chapter 10. Dealing with memory and file descriptor leaks
The CICS_LEAKDEBUG environment variable provides a facility that enables you
to generate reports about memory and file descriptor leaks that can occur in CICS
Application Server processes. You can use this facility when:
v Continuous growth in CICS Application Server process memory is observed over
a period of time. On an Open Systems platform, use the ps command to monitor
process memory size; on a Windows platforms, use Task Manager.
v Recurring messages, such as Task Shared Pool is under stress. CICS is
short on Task Shared storage, are seen in the Console log. These messages
indicate growth in the Task Shared Pool.
v A Memory leak occurs in the Task Private pool.
Note: Failure of GETMAIN API with a NOSTG condition indicates that CICS has
no more Task Private pool storage available.
v Too many file descriptors remain open in the system.
You can use this facility to isolate the leaks in your application programs. The
debugging reports contain information that is recorded at the following places in the
CICS code:
v User application load and unload
v User application entry and exit
v EXEC CICS API entry and exit
A report is generated in a set of text files for every CICS Application server process,
and stored in the specified path. Every file is named in the format, cicsas.<process
id>.
Observing memory growth for application server processes
If a constant increase is observed in the data segment size of the CICS application
server processes, the CICS system can report or warn by placing messages into
the console.nnnnnn file. CICS does this by constantly monitoring the data-segment
size with a dedicated thread that is spawned in the application server process, and
is configured through ServerMemCheckInterval and ServerMemCheckLimit
attributes of the region definition stanza(RD).
The ServerMemCheckInterval value, in seconds, indicates the period of time in
which the CICS application server process could record its data segment size. The
ServerMemCheckLimit value specifies the number of times that the
ServerMemCheckInterval must be done before CICS evaluates and reports or
warns that a constant increase in the data segment size of the application server
process has occurred. A value of zero to any of these stanza attributes disables this
warning facility. Also, this facility is disabled by default.
You could use this facility as an alert where, for example, the applications or
third-party components might leave memory allocated without freeing it. You would
then investigate the transaction or the application program with the help of
CICS_LEAKDEBUG facility. For more information about the CICS_LEAKDEBUG
facility, see “Generating debugging reports” on page 66.
© Copyright IBM Corp. 1999, 2008 65
The debugging information
The debugging information that is in the file includes memory size, or the number of
open file descriptors, and the following details:
v Time stamp
v Transaction name
v Application program name
v Name of the CICS APIs
v Line number for the API in the application program source
v Appropriate tags to denote the location from where the debug information is
collected:
BL Before loading of application program.
AL After loading of application program.
BE Before entering application.
AE After returning from application
BUL Before unloading of application program.
AUL After unloading of application program.
v The difference between the memory size, or the amount of file descriptors.
Generating debugging reports
To generate the debugging reports, set environment variable CICS_LEAKDEBUG in
the region environment file.
The syntax for CICS_LEAKDEBUG is:
CICS_LEAKDEBUG =
"LOGDIR=<Location of the directory to store debug report files>
MEM=<Type of memory>
LANG=<Programming languages of the application programs>
FILEDES=minlimit=<value>,maxlimit=<value>[,allowcore]
TIMESTAMP=<ON/OFF>
DEBUGLEVEL=<value>
TRAN=<List of transactions>"
Note: Options must be separated by a space.
The options are:
LOGDIR
The directory in which the debug information files are created. For each
CICS Application Server process, a file is created with cicsas.<pid> name. If
this option is not specified, no leak debug information is generated. The
permissions for this log directory should be cics:cics.
MEM Specifies the type of memory for which the debug report is to be generated.
For this option, you can specify any one of these three values:
heap Monitor process memory growth.
taskprivate
Collect information for task private pool growth.
taskshared
Collect information for task shared pool growth.
66 TXSeries for Multiplatforms: Problem Determination Guide
You can specify only one of these three values at a time.
Note: Because CICS_LEAKDEBUG generates a large amount of
debugging information, you can specify either the MEM or the
FILEDES option. If you specify both options together, only the MEM
option is effective. If you do not specify either of them, no debug
information is generated.
LANG Restricts leak debug information to selected programming languages. For
this option, you can specify one or more of these language values:
v c
v cpp
v cobol
v ibmcob
v ibmpli
v java
v cbmfnt
v acucob
To enable this option for all the language modules, set the value to all.
FILEDES
Collects file descriptor leak information. This option is available only on AIX
and HP-UX platforms. It has no effect on other platforms. For this option,
you can specify these values:
minlimit
Specifies the number of open file descriptors above which detailed
information is printed to the file cicsas.<process id>. If the number
of open file descriptors is less than this value, only the number of
open file descriptors is printed to the file.
maxlimit
The maximum number of open file descriptors that is allowed in the
CICS Application Server process before the process performs a
core dump, if allowcore is specified.
allowcore
Allows the CICS Application Server process to perform a core dump
when the number of open file descriptors exceeds the maxlimit
value.
Note: Because CICS_LEAKDEBUG generates a large amount of
debugging information, you can specify either the MEM or the
FILEDES option. If you specify both options together, only the MEM
option is effective. If you do not specify either of them, no debug
information is generated.
TIMESTAMP
Enables printing of the timestamp. When this option is specified with value
set to ON, timestamp is printed on each line of the output.
DEBUGLEVEL
Helps limit the amount of information that is printed to the file. If a value of
1 is specified, only the application entry and exit points are printed. If a
value greater than 1 is specified, debugging information is collected at all
the locations that are specified in the TRAN option. The default value is 1.
TRAN Specifies the transaction names for which the debug information is to be
Chapter 10. Dealing with memory and file descriptor leaks 67
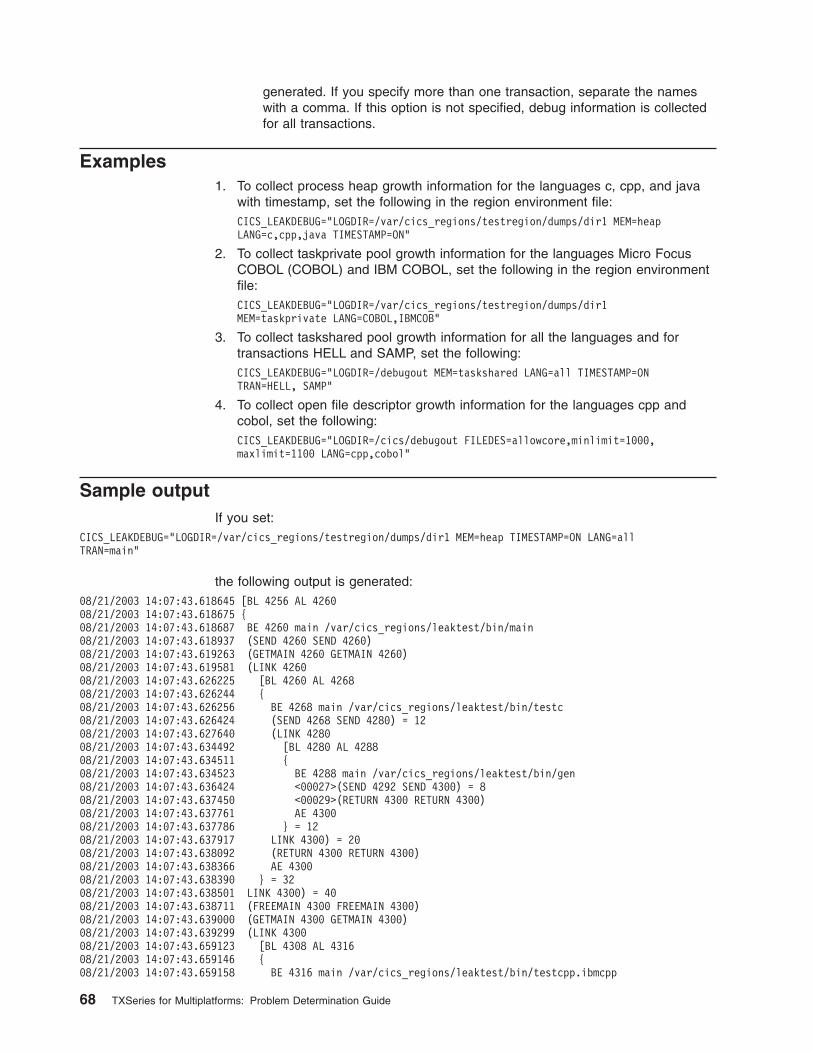
generated. If you specify more than one transaction, separate the names
with a comma. If this option is not specified, debug information is collected
for all transactions.
Examples
1. To collect process heap growth information for the languages c, cpp, and java
with timestamp, set the following in the region environment file:
CICS_LEAKDEBUG="LOGDIR=/var/cics_regions/testregion/dumps/dir1 MEM=heap
LANG=c,cpp,java TIMESTAMP=ON"
2. To collect taskprivate pool growth information for the languages Micro Focus
COBOL (COBOL) and IBM COBOL, set the following in the region environment
file:
CICS_LEAKDEBUG="LOGDIR=/var/cics_regions/testregion/dumps/dir1
MEM=taskprivate LANG=COBOL,IBMCOB"
3. To collect taskshared pool growth information for all the languages and for
transactions HELL and SAMP, set the following:
CICS_LEAKDEBUG="LOGDIR=/debugout MEM=taskshared LANG=all TIMESTAMP=ON
TRAN=HELL, SAMP"
4. To collect open file descriptor growth information for the languages cpp and
cobol, set the following:
CICS_LEAKDEBUG="LOGDIR=/cics/debugout FILEDES=allowcore,minlimit=1000,
maxlimit=1100 LANG=cpp,cobol"
Sample output
If you set:
CICS_LEAKDEBUG="LOGDIR=/var/cics_regions/testregion/dumps/dir1 MEM=heap TIMESTAMP=ON LANG=all
TRAN=main"
the following output is generated:
08/21/2003 14:07:43.618645 [BL 4256 AL 4260
08/21/2003 14:07:43.618675 {
08/21/2003 14:07:43.618687 BE 4260 main /var/cics_regions/leaktest/bin/main
08/21/2003 14:07:43.618937 (SEND 4260 SEND 4260)
08/21/2003 14:07:43.619263 (GETMAIN 4260 GETMAIN 4260)
08/21/2003 14:07:43.619581 (LINK 4260
08/21/2003 14:07:43.626225 [BL 4260 AL 4268
08/21/2003 14:07:43.626244 {
08/21/2003 14:07:43.626256 BE 4268 main /var/cics_regions/leaktest/bin/testc
08/21/2003 14:07:43.626424 (SEND 4268 SEND 4280) = 12
08/21/2003 14:07:43.627640 (LINK 4280
08/21/2003 14:07:43.634492 [BL 4280 AL 4288
08/21/2003 14:07:43.634511 {
08/21/2003 14:07:43.634523 BE 4288 main /var/cics_regions/leaktest/bin/gen
08/21/2003 14:07:43.636424 <00027>(SEND 4292 SEND 4300) = 8
08/21/2003 14:07:43.637450 <00029>(RETURN 4300 RETURN 4300)
08/21/2003 14:07:43.637761 AE 4300
08/21/2003 14:07:43.637786 } = 12
08/21/2003 14:07:43.637917 LINK 4300) = 20
08/21/2003 14:07:43.638092 (RETURN 4300 RETURN 4300)
08/21/2003 14:07:43.638366 AE 4300
08/21/2003 14:07:43.638390 } = 32
08/21/2003 14:07:43.638501 LINK 4300) = 40
08/21/2003 14:07:43.638711 (FREEMAIN 4300 FREEMAIN 4300)
08/21/2003 14:07:43.639000 (GETMAIN 4300 GETMAIN 4300)
08/21/2003 14:07:43.639299 (LINK 4300
08/21/2003 14:07:43.659123 [BL 4308 AL 4316
08/21/2003 14:07:43.659146 {
08/21/2003 14:07:43.659158 BE 4316 main /var/cics_regions/leaktest/bin/testcpp.ibmcpp
68 TXSeries for Multiplatforms: Problem Determination Guide
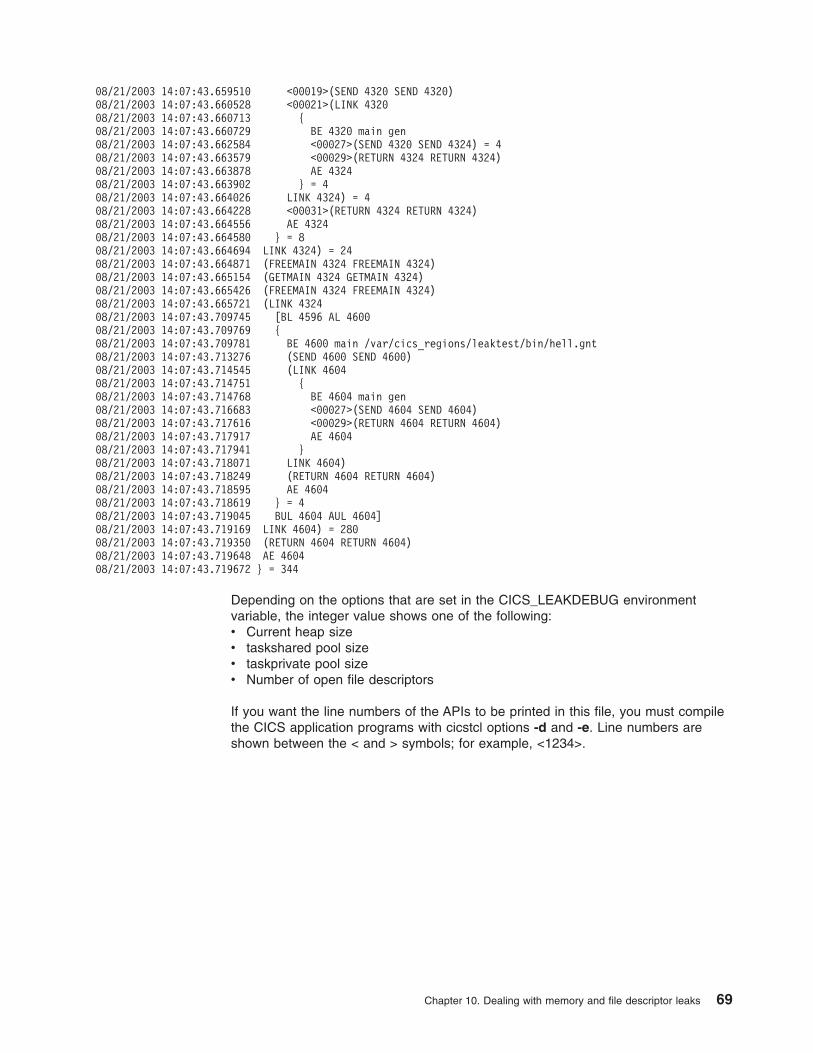
08/21/2003 14:07:43.659510 <00019>(SEND 4320 SEND 4320)
08/21/2003 14:07:43.660528 <00021>(LINK 4320
08/21/2003 14:07:43.660713 {
08/21/2003 14:07:43.660729 BE 4320 main gen
08/21/2003 14:07:43.662584 <00027>(SEND 4320 SEND 4324) = 4
08/21/2003 14:07:43.663579 <00029>(RETURN 4324 RETURN 4324)
08/21/2003 14:07:43.663878 AE 4324
08/21/2003 14:07:43.663902 } = 4
08/21/2003 14:07:43.664026 LINK 4324) = 4
08/21/2003 14:07:43.664228 <00031>(RETURN 4324 RETURN 4324)
08/21/2003 14:07:43.664556 AE 4324
08/21/2003 14:07:43.664580 } = 8
08/21/2003 14:07:43.664694 LINK 4324) = 24
08/21/2003 14:07:43.664871 (FREEMAIN 4324 FREEMAIN 4324)
08/21/2003 14:07:43.665154 (GETMAIN 4324 GETMAIN 4324)
08/21/2003 14:07:43.665426 (FREEMAIN 4324 FREEMAIN 4324)
08/21/2003 14:07:43.665721 (LINK 4324
08/21/2003 14:07:43.709745 [BL 4596 AL 4600
08/21/2003 14:07:43.709769 {
08/21/2003 14:07:43.709781 BE 4600 main /var/cics_regions/leaktest/bin/hell.gnt
08/21/2003 14:07:43.713276 (SEND 4600 SEND 4600)
08/21/2003 14:07:43.714545 (LINK 4604
08/21/2003 14:07:43.714751 {
08/21/2003 14:07:43.714768 BE 4604 main gen
08/21/2003 14:07:43.716683 <00027>(SEND 4604 SEND 4604)
08/21/2003 14:07:43.717616 <00029>(RETURN 4604 RETURN 4604)
08/21/2003 14:07:43.717917 AE 4604
08/21/2003 14:07:43.717941 }
08/21/2003 14:07:43.718071 LINK 4604)
08/21/2003 14:07:43.718249 (RETURN 4604 RETURN 4604)
08/21/2003 14:07:43.718595 AE 4604
08/21/2003 14:07:43.718619 } = 4
08/21/2003 14:07:43.719045 BUL 4604 AUL 4604]
08/21/2003 14:07:43.719169 LINK 4604) = 280
08/21/2003 14:07:43.719350 (RETURN 4604 RETURN 4604)
08/21/2003 14:07:43.719648 AE 4604
08/21/2003 14:07:43.719672 } = 344
Depending on the options that are set in the CICS_LEAKDEBUG environment
variable, the integer value shows one of the following:
v Current heap size
v taskshared pool size
v taskprivate pool size
v Number of open file descriptors
If you want the line numbers of the APIs to be printed in this file, you must compile
the CICS application programs with cicstcl options -d and -e. Line numbers are
shown between the < and > symbols; for example, <1234>.
Chapter 10. Dealing with memory and file descriptor leaks 69

70 TXSeries for Multiplatforms: Problem Determination Guide
Chapter 11. Dealing with database problems
This chapter describes how to handle problem determination when using XA
support for IBM DB2, Oracle, and Informix®.
v “DB2 (Open systems only)” on page 72
v “Oracle” on page 75
v “Sybase” on page 78
CICS transactions can access relational database managers (RDBMs) by including
SQL calls within their application programs. Coordinated commitment and the
recovery of transactions that use SQL calls is possible only with databases that
support the X/Open XA interface.
You should have access to the following database publications to help configure
and resolve problems with databases:
v DB2 Command Reference
v DB2 Administration Guide
v DB2 Installation Guide
v Oracle Server for Unix - Administrator’s Reference
v Informix OnLine Administrator’s Guide
See the TXSeries for Multiplatforms Installation Guide for details of the versions of
databases that are supported by this release of CICS.
Problems involving databases are generally caused by one of the following:
v Errors in CICS configuration
v Errors in the RDBMS configuration
v Application coding errors
v Application building errors
Before you start investigating, ensure that you understand how CICS uses relational
databases. See the TXSeries for Multiplatforms Administration Guide for details.
Checking CICS and RDBMS configuration
1. Check the database error logs and CICS message destinations
(console.nnnnnn, CSMT.out, and symrecs).
2. Check whether you have correctly executed the steps in the TXSeries for
Multiplatforms Administration Guide.
3. Use pview (Windows) or ps (Open Systems) to check the status of processes.
4. Look for any release-specific information in the product README, which is
supplied in TX_install_directory/cics/doc. This file might contain changes to the
database enabling procedure.
5. Check whether you have installed the correct level of software. See the
TXSeries for Multiplatforms Installation Guide for details.
6. Run the CICS-provided database sample programs to verify that your database
has been set up correctly. See the TXSeries for Multiplatforms Administration
Guide for details.
7. Check whether you have set the Product Definitions attributes as described in
the TXSeries for Multiplatforms Administration Guide .
8. Check for SQL codes that are handled by the application. For example, for DB2:
© Copyright IBM Corp. 1999, 2008 71
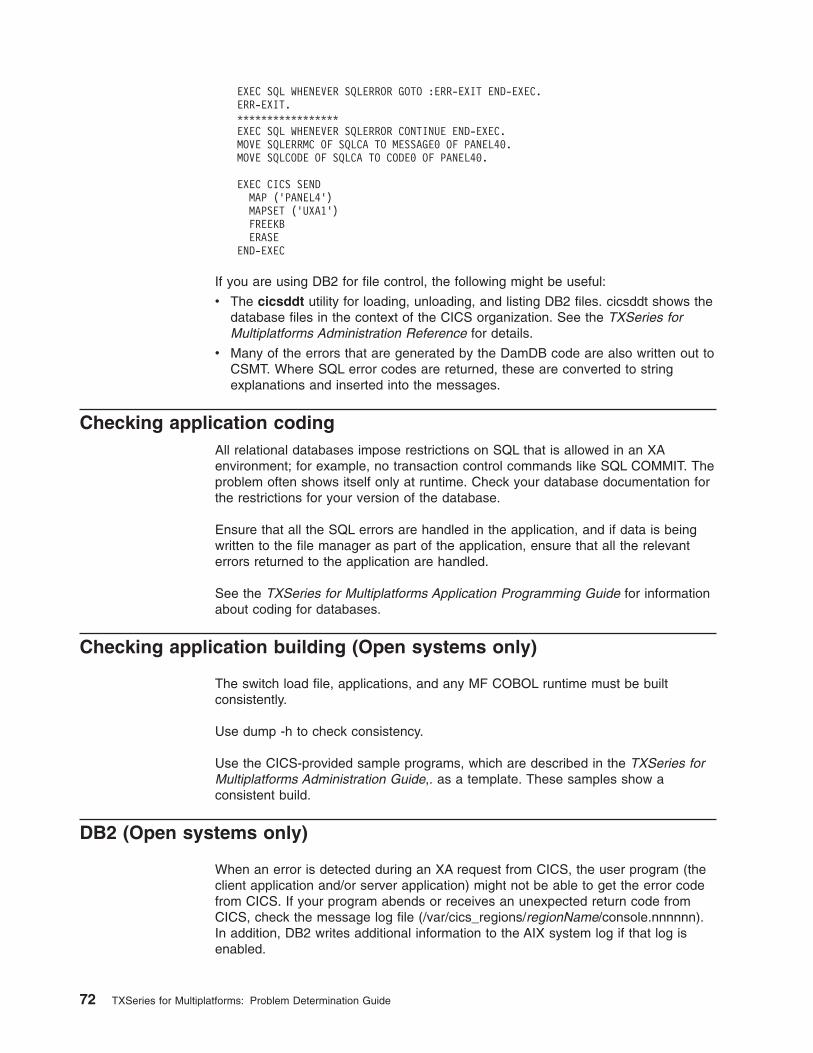
EXEC SQL WHENEVER SQLERROR GOTO :ERR-EXIT END-EXEC.
ERR-EXIT.
*****************
EXEC SQL WHENEVER SQLERROR CONTINUE END-EXEC.
MOVE SQLERRMC OF SQLCA TO MESSAGE0 OF PANEL40.
MOVE SQLCODE OF SQLCA TO CODE0 OF PANEL40.
EXEC CICS SEND
MAP (’PANEL4’)
MAPSET (’UXA1’)
FREEKB
ERASE
END-EXEC
If you are using DB2 for file control, the following might be useful:
v The cicsddt utility for loading, unloading, and listing DB2 files. cicsddt shows the
database files in the context of the CICS organization. See the TXSeries for
Multiplatforms Administration Reference for details.
v Many of the errors that are generated by the DamDB code are also written out to
CSMT. Where SQL error codes are returned, these are converted to string
explanations and inserted into the messages.
Checking application coding
All relational databases impose restrictions on SQL that is allowed in an XA
environment; for example, no transaction control commands like SQL COMMIT. The
problem often shows itself only at runtime. Check your database documentation for
the restrictions for your version of the database.
Ensure that all the SQL errors are handled in the application, and if data is being
written to the file manager as part of the application, ensure that all the relevant
errors returned to the application are handled.
See the TXSeries for Multiplatforms Application Programming Guide for information
about coding for databases.
Checking application building (Open systems only)
The switch load file, applications, and any MF COBOL runtime must be built
consistently.
Use dump -h to check consistency.
Use the CICS-provided sample programs, which are described in the TXSeries for
Multiplatforms Administration Guide,. as a template. These samples show a
consistent build.
DB2 (Open systems only)
When an error is detected during an XA request from CICS, the user program (the
client application and/or server application) might not be able to get the error code
from CICS. If your program abends or receives an unexpected return code from
CICS, check the message log file (/var/cics_regions/regionName/console.nnnnnn).
In addition, DB2 writes additional information to the AIX system log if that log is
enabled.
72 TXSeries for Multiplatforms: Problem Determination Guide
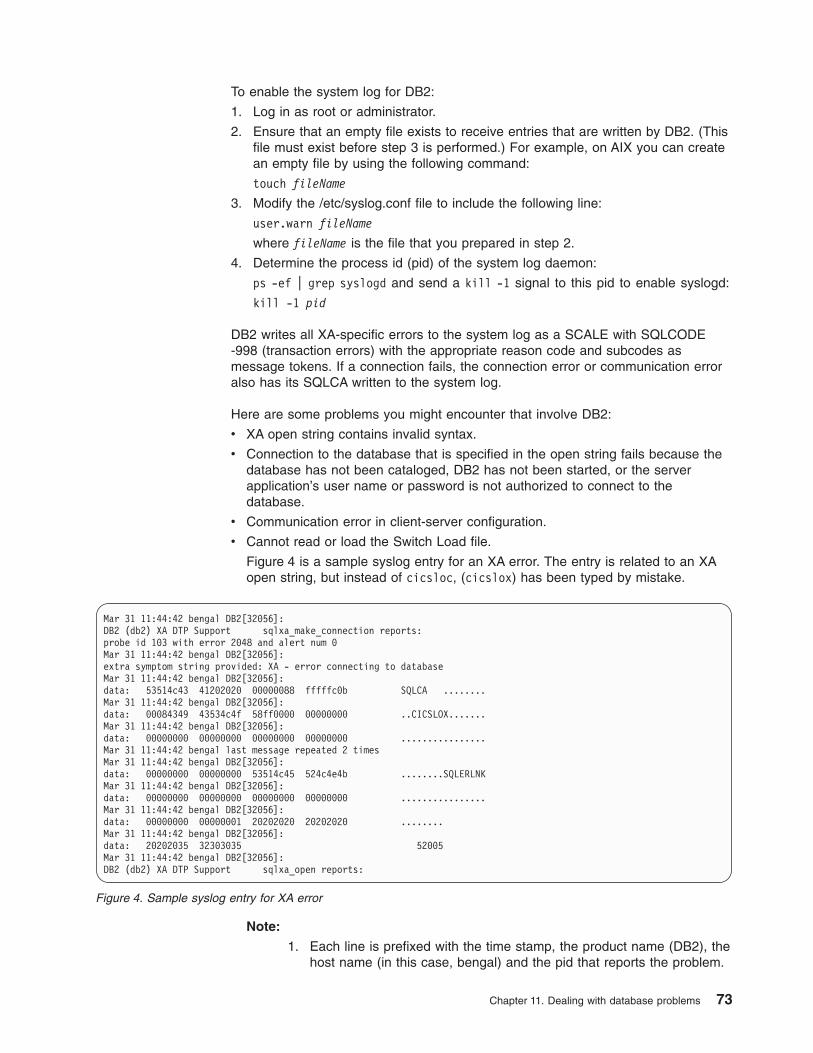
To enable the system log for DB2:
1. Log in as root or administrator.
2. Ensure that an empty file exists to receive entries that are written by DB2. (This
file must exist before step 3 is performed.) For example, on AIX you can create
an empty file by using the following command:
touch fileName
3. Modify the /etc/syslog.conf file to include the following line:
user.warn fileName
where fileName is the file that you prepared in step 2.
4. Determine the process id (pid) of the system log daemon:
ps -ef | grep syslogd and send a kill -1 signal to this pid to enable syslogd:
kill -1 pid
DB2 writes all XA-specific errors to the system log as a SCALE with SQLCODE
-998 (transaction errors) with the appropriate reason code and subcodes as
message tokens. If a connection fails, the connection error or communication error
also has its SQLCA written to the system log.
Here are some problems you might encounter that involve DB2:
v XA open string contains invalid syntax.
v Connection to the database that is specified in the open string fails because the
database has not been cataloged, DB2 has not been started, or the server
application’s user name or password is not authorized to connect to the
database.
v Communication error in client-server configuration.
v Cannot read or load the Switch Load file.
Figure 4 is a sample syslog entry for an XA error. The entry is related to an XA
open string, but instead of cicsloc, (cicslox) has been typed by mistake.
Note:
1. Each line is prefixed with the time stamp, the product name (DB2), the
host name (in this case, bengal) and the pid that reports the problem.
Mar 31 11:44:42 bengal DB2[32056]:
DB2 (db2) XA DTP Support sqlxa_make_connection reports:
probe id 103 with error 2048 and alert num 0
Mar 31 11:44:42 bengal DB2[32056]:
extra symptom string provided: XA - error connecting to database
Mar 31 11:44:42 bengal DB2[32056]:
data: 53514c43 41202020 00000088 fffffc0b SQLCA ........
Mar 31 11:44:42 bengal DB2[32056]:
data: 00084349 43534c4f 58ff0000 00000000 ..CICSLOX.......
Mar 31 11:44:42 bengal DB2[32056]:
data: 00000000 00000000 00000000 00000000 ................
Mar 31 11:44:42 bengal last message repeated 2 times
Mar 31 11:44:42 bengal DB2[32056]:
data: 00000000 00000000 53514c45 524c4e4b ........SQLERLNK
Mar 31 11:44:42 bengal DB2[32056]:
data: 00000000 00000000 00000000 00000000 ................
Mar 31 11:44:42 bengal DB2[32056]:
data: 00000000 00000001 20202020 20202020 ........
Mar 31 11:44:42 bengal DB2[32056]:
data: 20202035 32303035 52005
Mar 31 11:44:42 bengal DB2[32056]:
DB2 (db2) XA DTP Support sqlxa_open reports:
Figure 4. Sample syslog entry for XA error
Chapter 11. Dealing with database problems 73
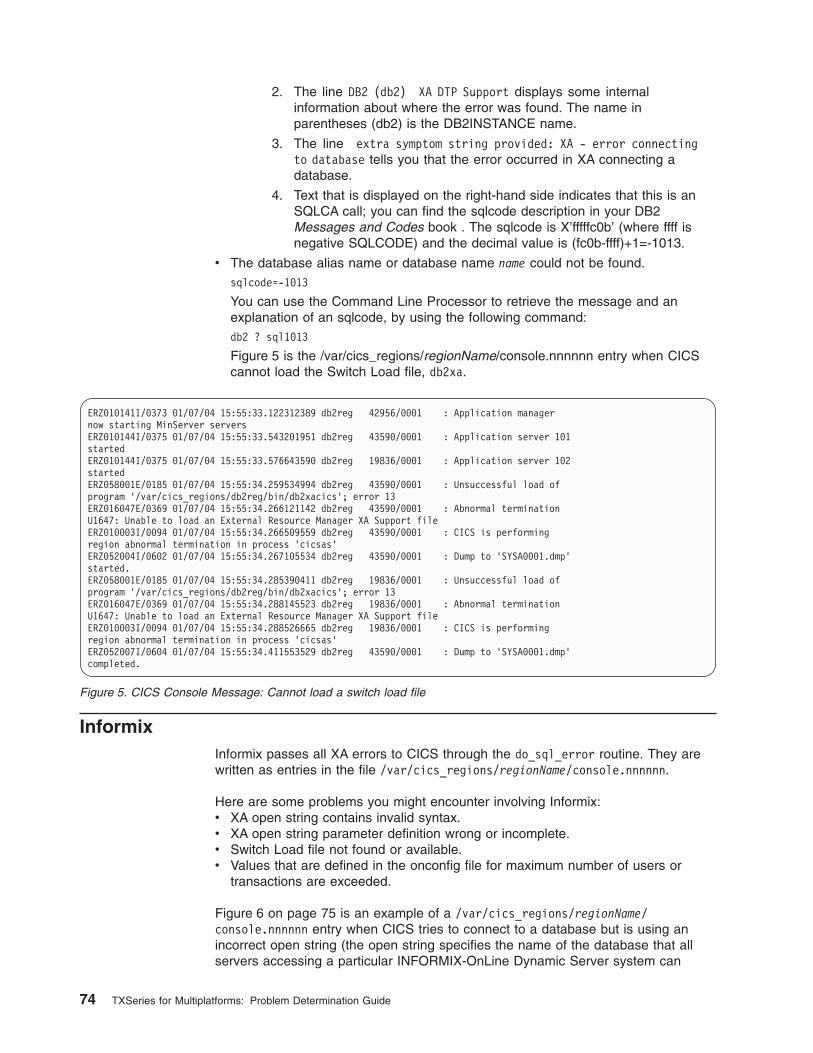
2. The line DB2 (db2) XA DTP Support displays some internal
information about where the error was found. The name in
parentheses (db2) is the DB2INSTANCE name.
3. The line extra symptom string provided: XA - error connecting
to database tells you that the error occurred in XA connecting a
database.
4. Text that is displayed on the right-hand side indicates that this is an
SQLCA call; you can find the sqlcode description in your DB2
Messages and Codes book . The sqlcode is X’fffffc0b’ (where ffff is
negative SQLCODE) and the decimal value is (fc0b-ffff)+1=-1013.
v The database alias name or database name name could not be found.
sqlcode=-1013
You can use the Command Line Processor to retrieve the message and an
explanation of an sqlcode, by using the following command:
db2 ? sql1013
Figure 5 is the /var/cics_regions/regionName/console.nnnnnn entry when CICS
cannot load the Switch Load file, db2xa.
Informix
Informix passes all XA errors to CICS through the do_sql_error routine. They are
written as entries in the file /var/cics_regions/regionName/console.nnnnnn.
Here are some problems you might encounter involving Informix:
v XA open string contains invalid syntax.
v XA open string parameter definition wrong or incomplete.
v Switch Load file not found or available.
v Values that are defined in the onconfig file for maximum number of users or
transactions are exceeded.
Figure 6 on page 75 is an example of a /var/cics_regions/regionName/console.nnnnnn entry when CICS tries to connect to a database but is using an
incorrect open string (the open string specifies the name of the database that all
servers accessing a particular INFORMIX-OnLine Dynamic Server system can
ERZ010141I/0373 01/07/04 15:55:33.122312389 db2reg 42956/0001 : Application manager
now starting MinServer servers
ERZ010144I/0375 01/07/04 15:55:33.543201951 db2reg 43590/0001 : Application server 101
started
ERZ010144I/0375 01/07/04 15:55:33.576643590 db2reg 19836/0001 : Application server 102
started
ERZ058001E/0185 01/07/04 15:55:34.259534994 db2reg 43590/0001 : Unsuccessful load of
program ’/var/cics_regions/db2reg/bin/db2xacics’; error 13
ERZ016047E/0369 01/07/04 15:55:34.266121142 db2reg 43590/0001 : Abnormal termination
U1647: Unable to load an External Resource Manager XA Support file
ERZ010003I/0094 01/07/04 15:55:34.266509559 db2reg 43590/0001 : CICS is performing
region abnormal termination in process ’cicsas’
ERZ052004I/0602 01/07/04 15:55:34.267105534 db2reg 43590/0001 : Dump to ’SYSA0001.dmp’
started.
ERZ058001E/0185 01/07/04 15:55:34.285390411 db2reg 19836/0001 : Unsuccessful load of
program ’/var/cics_regions/db2reg/bin/db2xacics’; error 13
ERZ016047E/0369 01/07/04 15:55:34.288145523 db2reg 19836/0001 : Abnormal termination
U1647: Unable to load an External Resource Manager XA Support file
ERZ010003I/0094 01/07/04 15:55:34.288526665 db2reg 19836/0001 : CICS is performing
region abnormal termination in process ’cicsas’
ERZ052007I/0604 01/07/04 15:55:34.411553529 db2reg 43590/0001 : Dump to ’SYSA0001.dmp’
completed.
Figure 5. CICS Console Message: Cannot load a switch load file
74 TXSeries for Multiplatforms: Problem Determination Guide
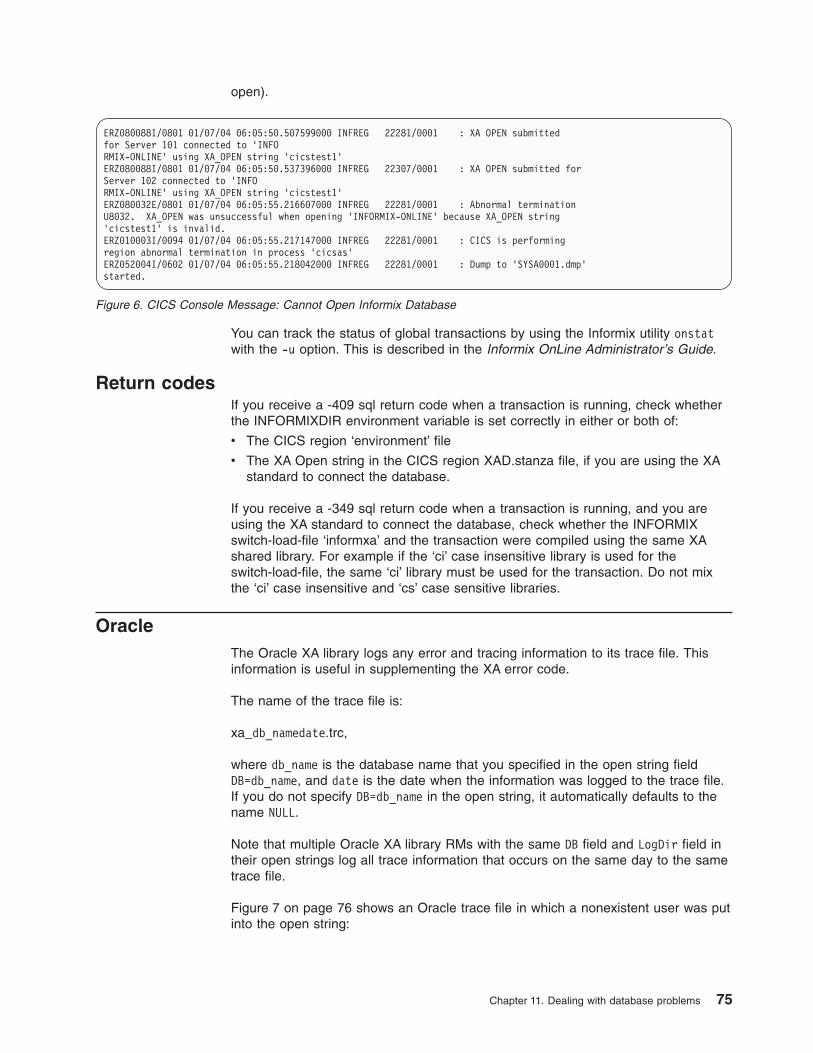
open).
You can track the status of global transactions by using the Informix utility onstat
with the -u option. This is described in the Informix OnLine Administrator’s Guide.
Return codes
If you receive a -409 sql return code when a transaction is running, check whether
the INFORMIXDIR environment variable is set correctly in either or both of:
v The CICS region ‘environment’ file
v The XA Open string in the CICS region XAD.stanza file, if you are using the XA
standard to connect the database.
If you receive a -349 sql return code when a transaction is running, and you are
using the XA standard to connect the database, check whether the INFORMIX
switch-load-file ‘informxa’ and the transaction were compiled using the same XA
shared library. For example if the ‘ci’ case insensitive library is used for the
switch-load-file, the same ‘ci’ library must be used for the transaction. Do not mix
the ‘ci’ case insensitive and ‘cs’ case sensitive libraries.
Oracle
The Oracle XA library logs any error and tracing information to its trace file. This
information is useful in supplementing the XA error code.
The name of the trace file is:
xa_db_namedate.trc,
where db_name is the database name that you specified in the open string field
DB=db_name, and date is the date when the information was logged to the trace file.
If you do not specify DB=db_name in the open string, it automatically defaults to the
name NULL.
Note that multiple Oracle XA library RMs with the same DB field and LogDir field in
their open strings log all trace information that occurs on the same day to the same
trace file.
Figure 7 on page 76 shows an Oracle trace file in which a nonexistent user was put
into the open string:
ERZ080088I/0801 01/07/04 06:05:50.507599000 INFREG 22281/0001 : XA OPEN submitted
for Server 101 connected to ’INFO
RMIX-ONLINE’ using XA_OPEN string ’cicstest1’
ERZ080088I/0801 01/07/04 06:05:50.537396000 INFREG 22307/0001 : XA OPEN submitted for
Server 102 connected to ’INFO
RMIX-ONLINE’ using XA_OPEN string ’cicstest1’
ERZ080032E/0801 01/07/04 06:05:55.216607000 INFREG 22281/0001 : Abnormal termination
U8032. XA_OPEN was unsuccessful when opening ’INFORMIX-ONLINE’ because XA_OPEN string
’cicstest1’ is invalid.
ERZ010003I/0094 01/07/04 06:05:55.217147000 INFREG 22281/0001 : CICS is performing
region abnormal termination in process ’cicsas’
ERZ052004I/0602 01/07/04 06:05:55.218042000 INFREG 22281/0001 : Dump to ’SYSA0001.dmp’
started.
Figure 6. CICS Console Message: Cannot Open Informix Database
Chapter 11. Dealing with database problems 75
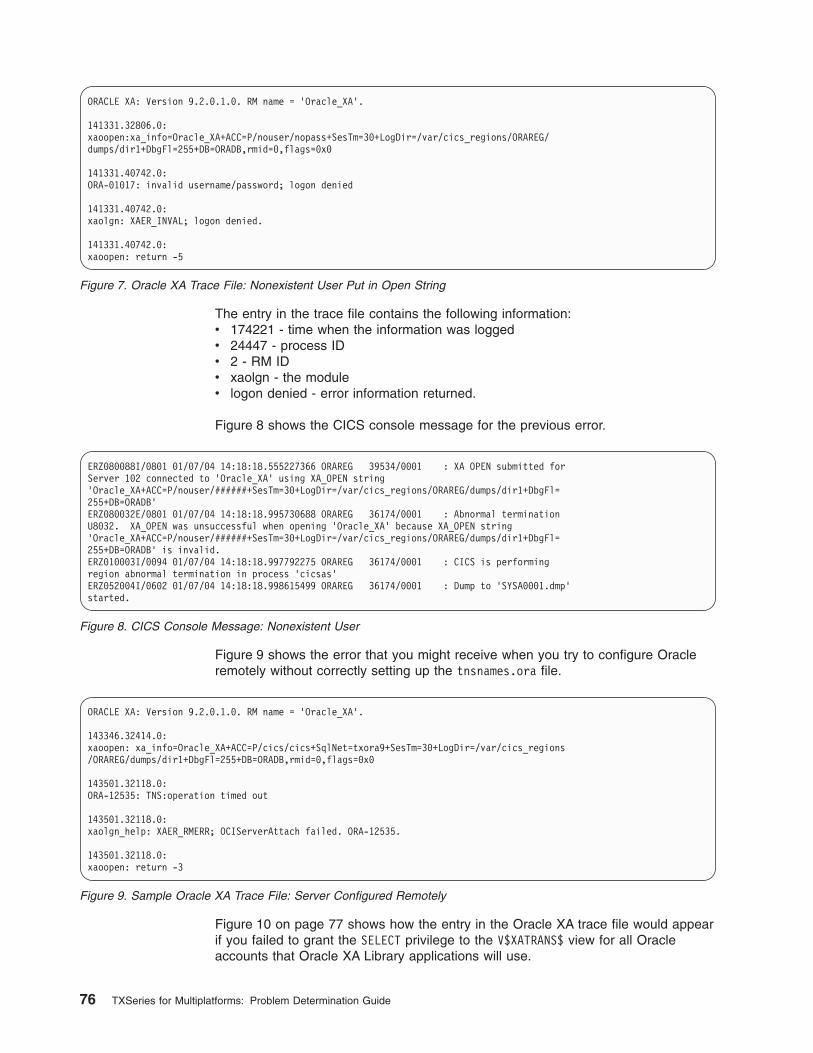
The entry in the trace file contains the following information:
v 174221 - time when the information was logged
v 24447 - process ID
v 2 - RM ID
v xaolgn - the module
v logon denied - error information returned.
Figure 8 shows the CICS console message for the previous error.
Figure 9 shows the error that you might receive when you try to configure Oracle
remotely without correctly setting up the tnsnames.ora file.
Figure 10 on page 77 shows how the entry in the Oracle XA trace file would appear
if you failed to grant the SELECT privilege to the V$XATRANS$ view for all Oracle
accounts that Oracle XA Library applications will use.
ORACLE XA: Version 9.2.0.1.0. RM name = ’Oracle_XA’.
141331.32806.0:
xaoopen:xa_info=Oracle_XA+ACC=P/nouser/nopass+SesTm=30+LogDir=/var/cics_regions/ORAREG/
dumps/dir1+DbgFl=255+DB=ORADB,rmid=0,flags=0x0
141331.40742.0:
ORA-01017: invalid username/password; logon denied
141331.40742.0:
xaolgn: XAER_INVAL; logon denied.
141331.40742.0:
xaoopen: return -5
Figure 7. Oracle XA Trace File: Nonexistent User Put in Open String
ERZ080088I/0801 01/07/04 14:18:18.555227366 ORAREG 39534/0001 : XA OPEN submitted for
Server 102 connected to ’Oracle_XA’ using XA_OPEN string
’Oracle_XA+ACC=P/nouser/######+SesTm=30+LogDir=/var/cics_regions/ORAREG/dumps/dir1+DbgFl=
255+DB=ORADB’
ERZ080032E/0801 01/07/04 14:18:18.995730688 ORAREG 36174/0001 : Abnormal termination
U8032. XA_OPEN was unsuccessful when opening ’Oracle_XA’ because XA_OPEN string
’Oracle_XA+ACC=P/nouser/######+SesTm=30+LogDir=/var/cics_regions/ORAREG/dumps/dir1+DbgFl=
255+DB=ORADB’ is invalid.
ERZ010003I/0094 01/07/04 14:18:18.997792275 ORAREG 36174/0001 : CICS is performing
region abnormal termination in process ’cicsas’
ERZ052004I/0602 01/07/04 14:18:18.998615499 ORAREG 36174/0001 : Dump to ’SYSA0001.dmp’
started.
Figure 8. CICS Console Message: Nonexistent User
ORACLE XA: Version 9.2.0.1.0. RM name = ’Oracle_XA’.
143346.32414.0:
xaoopen: xa_info=Oracle_XA+ACC=P/cics/cics+SqlNet=txora9+SesTm=30+LogDir=/var/cics_regions
/ORAREG/dumps/dir1+DbgFl=255+DB=ORADB,rmid=0,flags=0x0
143501.32118.0:
ORA-12535: TNS:operation timed out
143501.32118.0:
xaolgn_help: XAER_RMERR; OCIServerAttach failed. ORA-12535.
143501.32118.0:
xaoopen: return -3
Figure 9. Sample Oracle XA Trace File: Server Configured Remotely
76 TXSeries for Multiplatforms: Problem Determination Guide
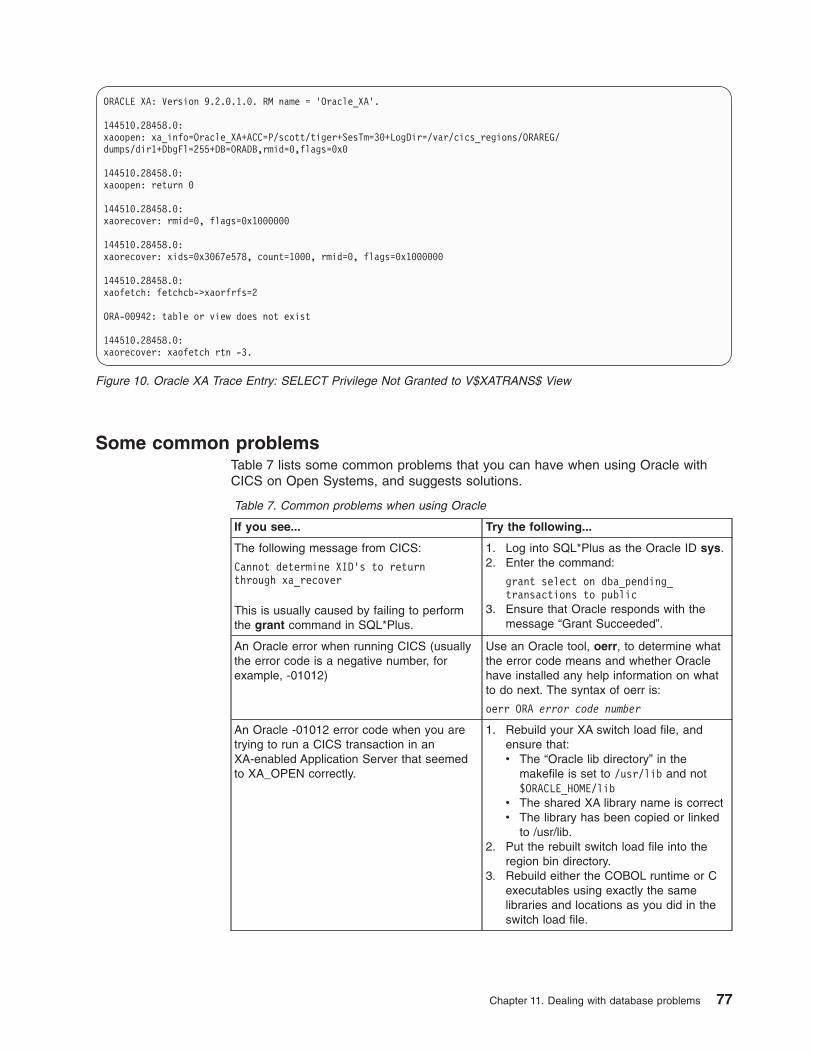
Some common problems
Table 7 lists some common problems that you can have when using Oracle with
CICS on Open Systems, and suggests solutions.
Table 7. Common problems when using Oracle
If you see... Try the following...
The following message from CICS:
Cannot determine XID’s to return
through xa_recover
This is usually caused by failing to perform
the grant command in SQL*Plus.
1. Log into SQL*Plus as the Oracle ID sys.
2. Enter the command:
grant select on dba_pending_
transactions to public
3. Ensure that Oracle responds with the
message “Grant Succeeded”.
An Oracle error when running CICS (usually
the error code is a negative number, for
example, -01012)
Use an Oracle tool, oerr, to determine what
the error code means and whether Oracle
have installed any help information on what
to do next. The syntax of oerr is:
oerr ORA error code number
An Oracle -01012 error code when you are
trying to run a CICS transaction in an
XA-enabled Application Server that seemed
to XA_OPEN correctly.
1. Rebuild your XA switch load file, and
ensure that:
v The “Oracle lib directory” in the
makefile is set to /usr/lib and not
$ORACLE_HOME/lib
v The shared XA library name is correct
v The library has been copied or linked
to /usr/lib.2. Put the rebuilt switch load file into the
region bin directory.
3. Rebuild either the COBOL runtime or C
executables using exactly the same
libraries and locations as you did in the
switch load file.
ORACLE XA: Version 9.2.0.1.0. RM name = ’Oracle_XA’.
144510.28458.0:
xaoopen: xa_info=Oracle_XA+ACC=P/scott/tiger+SesTm=30+LogDir=/var/cics_regions/ORAREG/
dumps/dir1+DbgFl=255+DB=ORADB,rmid=0,flags=0x0
144510.28458.0:
xaoopen: return 0
144510.28458.0:
xaorecover: rmid=0, flags=0x1000000
144510.28458.0:
xaorecover: xids=0x3067e578, count=1000, rmid=0, flags=0x1000000
144510.28458.0:
xaofetch: fetchcb->xaorfrfs=2
ORA-00942: table or view does not exist
144510.28458.0:
xaorecover: xaofetch rtn -3.
Figure 10. Oracle XA Trace Entry: SELECT Privilege Not Granted to V$XATRANS$ View
Chapter 11. Dealing with database problems 77
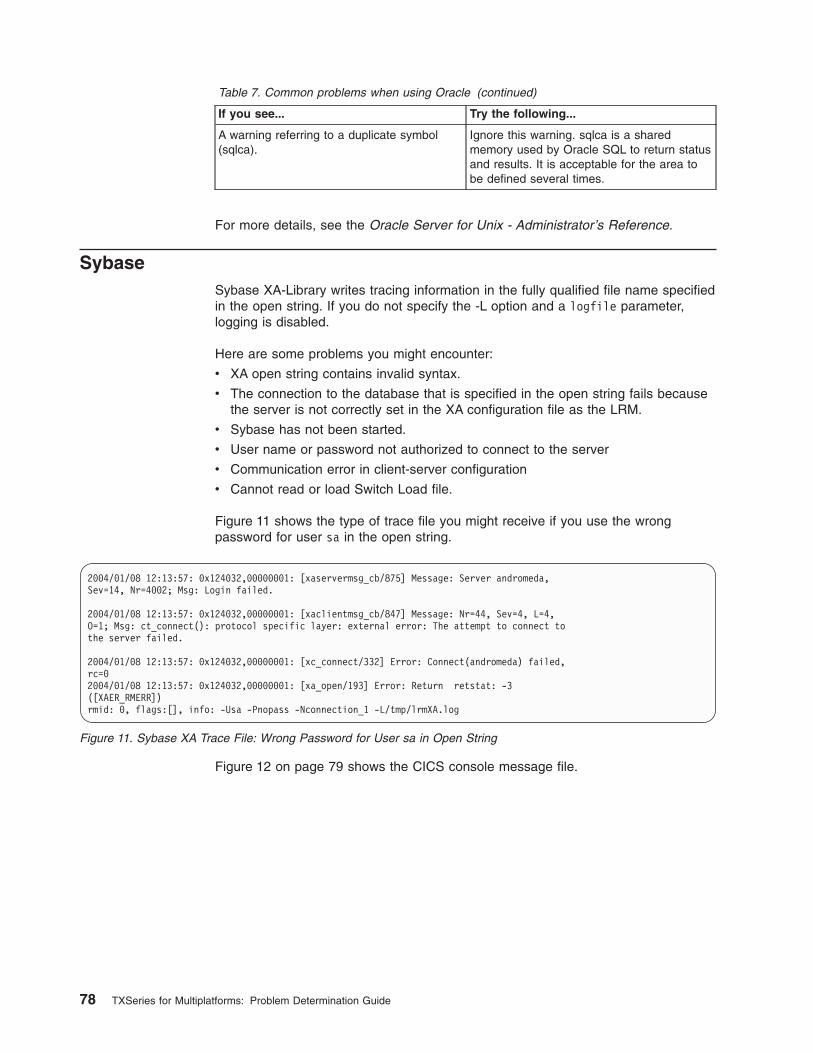
Table 7. Common problems when using Oracle (continued)
If you see... Try the following...
A warning referring to a duplicate symbol
(sqlca).
Ignore this warning. sqlca is a shared
memory used by Oracle SQL to return status
and results. It is acceptable for the area to
be defined several times.
For more details, see the Oracle Server for Unix - Administrator’s Reference.
Sybase
Sybase XA-Library writes tracing information in the fully qualified file name specified
in the open string. If you do not specify the -L option and a logfile parameter,
logging is disabled.
Here are some problems you might encounter:
v XA open string contains invalid syntax.
v The connection to the database that is specified in the open string fails because
the server is not correctly set in the XA configuration file as the LRM.
v Sybase has not been started.
v User name or password not authorized to connect to the server
v Communication error in client-server configuration
v Cannot read or load Switch Load file.
Figure 11 shows the type of trace file you might receive if you use the wrong
password for user sa in the open string.
Figure 12 on page 79 shows the CICS console message file.
2004/01/08 12:13:57: 0x124032,00000001: [xaservermsg_cb/875] Message: Server andromeda,
Sev=14, Nr=4002; Msg: Login failed.
2004/01/08 12:13:57: 0x124032,00000001: [xaclientmsg_cb/847] Message: Nr=44, Sev=4, L=4,
O=1; Msg: ct_connect(): protocol specific layer: external error: The attempt to connect to
the server failed.
2004/01/08 12:13:57: 0x124032,00000001: [xc_connect/332] Error: Connect(andromeda) failed,
rc=0
2004/01/08 12:13:57: 0x124032,00000001: [xa_open/193] Error: Return retstat: -3
([XAER_RMERR])
rmid: 0, flags:[], info: -Usa -Pnopass -Nconnection_1 -L/tmp/lrmXA.log
Figure 11. Sybase XA Trace File: Wrong Password for User sa in Open String
78 TXSeries for Multiplatforms: Problem Determination Guide
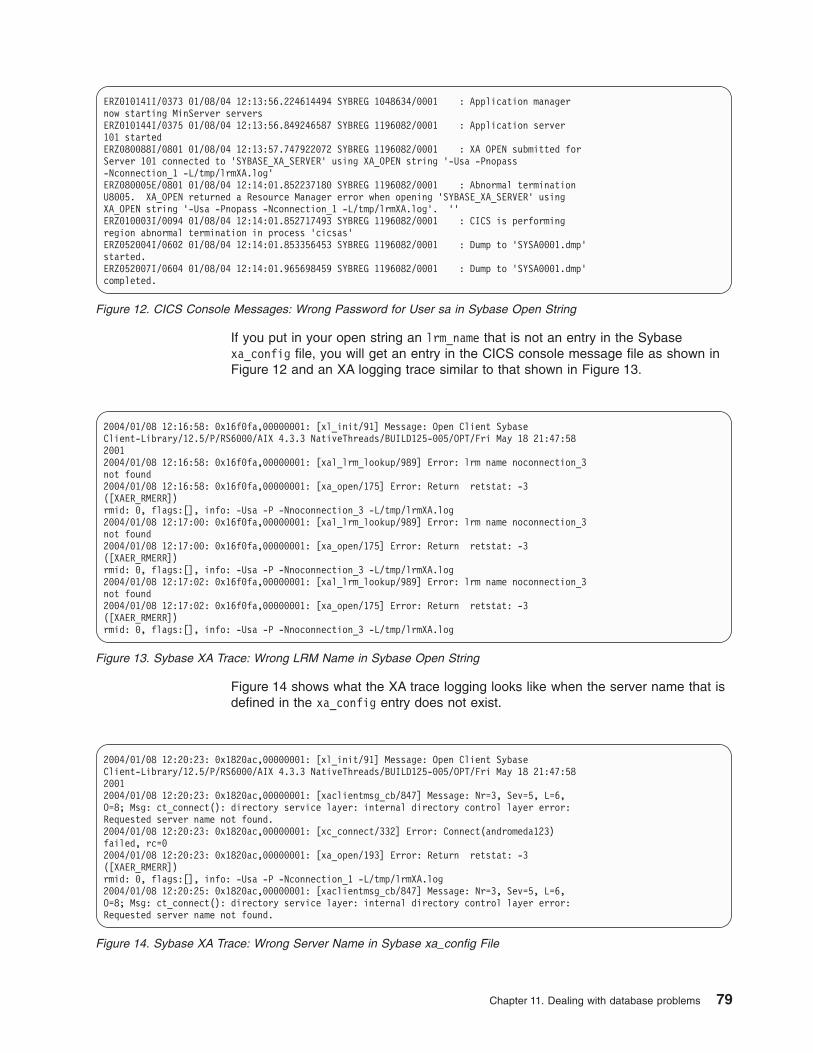
If you put in your open string an lrm_name that is not an entry in the Sybase
xa_config file, you will get an entry in the CICS console message file as shown in
Figure 12 and an XA logging trace similar to that shown in Figure 13.
Figure 14 shows what the XA trace logging looks like when the server name that is
defined in the xa_config entry does not exist.
ERZ010141I/0373 01/08/04 12:13:56.224614494 SYBREG 1048634/0001 : Application manager
now starting MinServer servers
ERZ010144I/0375 01/08/04 12:13:56.849246587 SYBREG 1196082/0001 : Application server
101 started
ERZ080088I/0801 01/08/04 12:13:57.747922072 SYBREG 1196082/0001 : XA OPEN submitted for
Server 101 connected to ’SYBASE_XA_SERVER’ using XA_OPEN string ’-Usa -Pnopass
-Nconnection_1 -L/tmp/lrmXA.log’
ERZ080005E/0801 01/08/04 12:14:01.852237180 SYBREG 1196082/0001 : Abnormal termination
U8005. XA_OPEN returned a Resource Manager error when opening ’SYBASE_XA_SERVER’ using
XA_OPEN string ’-Usa -Pnopass -Nconnection_1 -L/tmp/lrmXA.log’. ’’
ERZ010003I/0094 01/08/04 12:14:01.852717493 SYBREG 1196082/0001 : CICS is performing
region abnormal termination in process ’cicsas’
ERZ052004I/0602 01/08/04 12:14:01.853356453 SYBREG 1196082/0001 : Dump to ’SYSA0001.dmp’
started.
ERZ052007I/0604 01/08/04 12:14:01.965698459 SYBREG 1196082/0001 : Dump to ’SYSA0001.dmp’
completed.
Figure 12. CICS Console Messages: Wrong Password for User sa in Sybase Open String
2004/01/08 12:16:58: 0x16f0fa,00000001: [xl_init/91] Message: Open Client Sybase
Client-Library/12.5/P/RS6000/AIX 4.3.3 NativeThreads/BUILD125-005/OPT/Fri May 18 21:47:58
2001
2004/01/08 12:16:58: 0x16f0fa,00000001: [xal_lrm_lookup/989] Error: lrm name noconnection_3
not found
2004/01/08 12:16:58: 0x16f0fa,00000001: [xa_open/175] Error: Return retstat: -3
([XAER_RMERR])
rmid: 0, flags:[], info: -Usa -P -Nnoconnection_3 -L/tmp/lrmXA.log
2004/01/08 12:17:00: 0x16f0fa,00000001: [xal_lrm_lookup/989] Error: lrm name noconnection_3
not found
2004/01/08 12:17:00: 0x16f0fa,00000001: [xa_open/175] Error: Return retstat: -3
([XAER_RMERR])
rmid: 0, flags:[], info: -Usa -P -Nnoconnection_3 -L/tmp/lrmXA.log
2004/01/08 12:17:02: 0x16f0fa,00000001: [xal_lrm_lookup/989] Error: lrm name noconnection_3
not found
2004/01/08 12:17:02: 0x16f0fa,00000001: [xa_open/175] Error: Return retstat: -3
([XAER_RMERR])
rmid: 0, flags:[], info: -Usa -P -Nnoconnection_3 -L/tmp/lrmXA.log
Figure 13. Sybase XA Trace: Wrong LRM Name in Sybase Open String
2004/01/08 12:20:23: 0x1820ac,00000001: [xl_init/91] Message: Open Client Sybase
Client-Library/12.5/P/RS6000/AIX 4.3.3 NativeThreads/BUILD125-005/OPT/Fri May 18 21:47:58
2001
2004/01/08 12:20:23: 0x1820ac,00000001: [xaclientmsg_cb/847] Message: Nr=3, Sev=5, L=6,
O=8; Msg: ct_connect(): directory service layer: internal directory control layer error:
Requested server name not found.
2004/01/08 12:20:23: 0x1820ac,00000001: [xc_connect/332] Error: Connect(andromeda123)
failed, rc=0
2004/01/08 12:20:23: 0x1820ac,00000001: [xa_open/193] Error: Return retstat: -3
([XAER_RMERR])
rmid: 0, flags:[], info: -Usa -P -Nconnection_1 -L/tmp/lrmXA.log
2004/01/08 12:20:25: 0x1820ac,00000001: [xaclientmsg_cb/847] Message: Nr=3, Sev=5, L=6,
O=8; Msg: ct_connect(): directory service layer: internal directory control layer error:
Requested server name not found.
Figure 14. Sybase XA Trace: Wrong Server Name in Sybase xa_config File
Chapter 11. Dealing with database problems 79

80 TXSeries for Multiplatforms: Problem Determination Guide
Chapter 12. Resolving problems with CICS clients
The CICS on Open Systems client provides an interface to CICS regions, and
enables system administrators to perform region management and CICS users to
request data from the region and submit data to it. End users of CICS connect as
clients to CICS regions to use CICS application programs, services, and resources.
It is recommended that you set up a CICS on Open Systems client on each CICS
machine. A CICS machine can run either the client only, or it can run CICS regions
and file managers also.
The information in this chapter assumes that you have created and configured a
CICS on Open Systems client by following the instructions that are given in the
TXSeries for Multiplatforms Installation Guide. The purpose of this chapter is to
present some problem-solving tips for resolving difficulties that involve client
communications.
“Dealing with problems involving cicslterm” provides some problem-solving tips for
resolving difficulties when a cicslterm client is used to connect to a CICS region.
“When cicsteld does not work when started from the inetd daemon” on page 83
provides some problem-solving tips for resolving difficulties when a Telnet (cicsteld)
client is used to connect to a CICS region.
Dealing with problems involving cicslterm
This section tells you how to solve some common cicslterm problems that possibly
result from configuration errors.
The cicslterm command does not work
Check the following requirements:
v The cicssetupclients command has been run.
Note: The cicssetupclients command is invoked when the cicscp command
program is used to configure the client. The cicssetupclients command
can be run at any time to recreate the keytab files.
v The 3270.keys file contains key bindings that are appropriate to the terminal type
that is being used. See the TXSeries for Multiplatforms Installation Guide for
more information.
v The terminal type is correctly specified in the TERM environment variable. This
environment variable is set by the operating system. If the correct value is not
set, use the CICSLTERM environment variable, which overrides any settings for
TERM.
v The NLSPATH environment variable is set correctly for the CICS message
catalog. Check also that the LANG environment variable is set correctly. For
more information, see the TXSeries for Multiplatforms Installation Guide.
v The /var file system is not full.
The cicslterm client cannot connect to a region
Check the following requirements:
v The region is running.
© Copyright IBM Corp. 1999, 2008 81
v The region host is listed in the CICS_HOSTS environment variable, or the host is
specified with the cicslterm -h option.
Function keys do not work
This problem is often caused by running the cicslterm client through an ASCII
asynchronous terminal emulator. For example, the user can dial in from a PC to an
Open System by using a vt220 terminal emulator. The TERM environment variable
can be correctly set to vt220. The user can then start the cicslterm command and
find that particular 3270 keys do not work despite bindings being present for them
in the keys file.
The reason for this usually lies with the ASCII asynchronous terminal emulator. One
of the following conditions probably applies to the keys in question:
v The keys are not set up.
v The keys are local keys. They have special meanings to the terminal emulator
and invoke local functions such as file transfer.
v The keys generate incorrect key codes. The terminal emulator causes
nonstandard codes to be generated.
Consult the terminal emulator’s documentation to find out how to rebind these keys.
Alternatively, you can add bindings that require multiple key strokes, in the same
way as the /etc/3270.keys file binds keys for ASCII terminals. For example, you
can map <Esc-1> to <PF1> and <Esc-2> to <PF2>.
When keys do not work, another possible cause occurs when a system wide
3270.keys file (that is, /etc/3270.keys file) is used. The key bindings for terminals
other than windowed terminals in this file often require the pressing of multiple keys,
such as <Esc-1> for <PF1>.
The cicslterm client behaves differently when connected to different
regions
The data stream that is generated by the Basic Mapping Support (BMS) is modified
by the Terminal Definitions (WD) that is defined to the region. Ensure that the
attributes Highlight, Foreground, ExtDS, and so on, are set in the WD for the
region.
The cicslterm client does not display field attributes correctly
This problem can be caused by incorrect settings for the WD, as explained in the
previous section; inadequate capabilities in the ASCII terminal device; or inadequate
capabilities in the terminal emulator when the cicsteld server process is used. The
terminal capabilities for the terminal types are stored in the terminfo database in
the /usr/share/lib/terminfo directory.
Capabilities can easily be checked by using the operating system tput command.
For example, to determine whether the terminal has the underline capability, you
can use the following command to put the terminal into underline mode:
tput smul
If the terminal supports underlining, all subsequent input is underlined. After the
test, reset the underline mode:
tput rmul
Refer to the operating system documentation for more information.
82 TXSeries for Multiplatforms: Problem Determination Guide
The cicslterm client does not work with a given terminal type
Check for the following:
v The terminal type does not have enough capabilities to run the cicslterm client.
A useful capability test is to run the vi editor. If the vi command fails to start in
the usual full-screen mode, the terminal device cannot support the cicslterm
client.
v The terminfo database does not contain definitions for this terminal type.
Purge behavior initiated with the cicslterm command
When the cicslterm client receives a user interrupt signal SIGINT (generated when
a user presses <Ctrl-C>), the terminal emulator terminates immediately. If a
transaction is running, it is purged. The purge happens only at the start or end of an
EXEC CICS call, so the transaction does not terminate if it is waiting for a resource
or if it is in a loop that does not involve EXEC CICS calls. If a transaction in this
condition needs to be canceled, the system administrator must purge it by using the
CEMT SET TASK(termid) FORCEPURGE command from within CICS.
When cicsteld does not work when started from the inetd daemon
If the cicsteld server process does not start from the inetd daemon, ensure that an
unused port has been selected to listen for cicsteld connections. This port is
specified in the /etc/services file. Then check whether the /etc/inetd.conf file
contains the appropriate line to start the cicsteld process when a connection
request is received at this port.
The inetd daemon needs to be refreshed after changes have been made to the
inetd.conf file. See the instructions in the header of inetd.conf about how to
refresh the inetd daemon.
The cicsteld.sh shell script is supplied as a basis for customizing the invocation of
the cicsteld server. Note that a maximum of five parameters can be specified in
inetd.conf; extra ones are silently discarded. If more parameters are required for
cicsteld (for example the server and client code page information), this must be
done with a shell script. Diagnostic trace can also be written to a file from within the
cicsteld.sh script to ensure that the cicsteld command is passed the correct
parameters and is running in the appropriate environment.
Resolving problems with cicstermp emulation
Use the following information to help you resolve problems when using the CICS
printer emulator:
When cicstermp does not work
When the cicstermp process does not work, ensure the following:
v cicstermp is invoked with the -n netName option.
v A Terminal Definitions (WD) entry is defined with the IsPrinter attribute set to yes
and the NetName attribute set to the network name specified with the cicstermp
-n option.
v The PRINT option is specified in the EXEC CICS SEND MAP statement in the
CICS program.
v If CECI is used to invoke the transaction, the printer’s TERMID is specified on
the CECI command line.
Chapter 12. Resolving problems with CICS clients 83
|
||
|
|
|
|||
||
||
Errors when printing to a local print queue
When a print job is queued to a local queue, the operating system assumes that the
file being printed will remain on the file system until printing is complete. Because
cicstermp deletes the temporary file as soon as the print command returns, the
print job can fail when it is queued to a local print queue. To solve this problem,
include the -c copy flag when using lp or lpr in the print command.
84 TXSeries for Multiplatforms: Problem Determination Guide
|
|||||
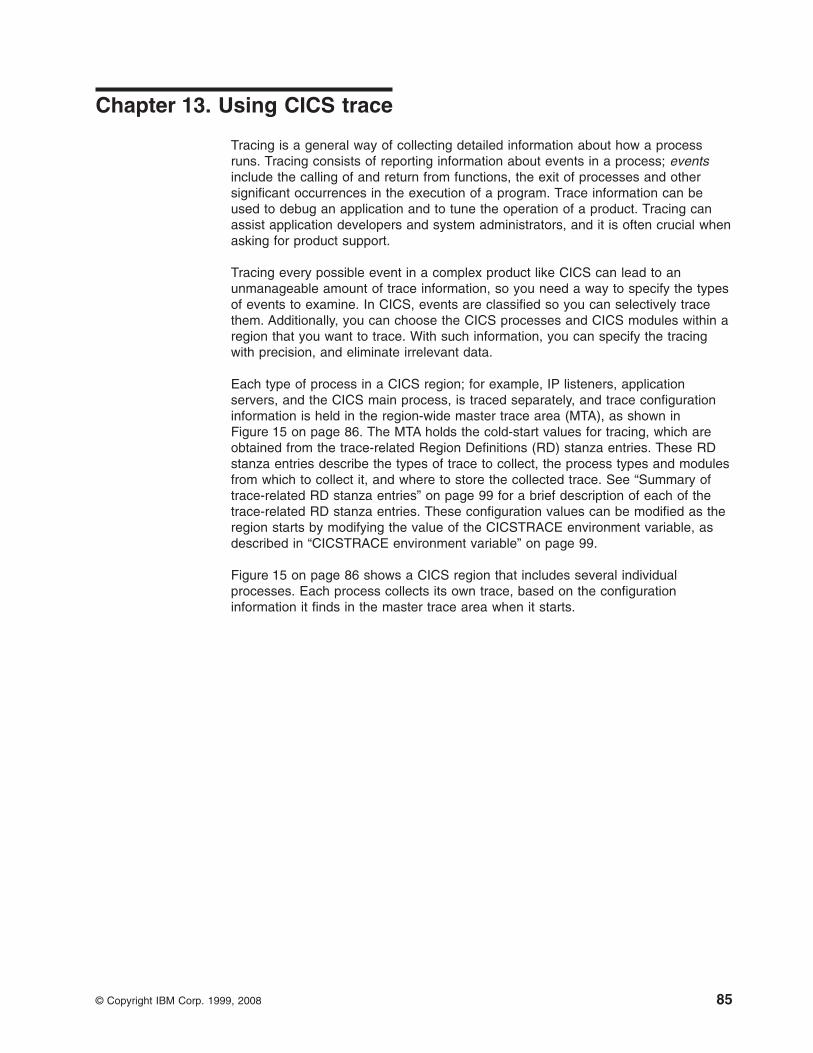
Chapter 13. Using CICS trace
Tracing is a general way of collecting detailed information about how a process
runs. Tracing consists of reporting information about events in a process; events
include the calling of and return from functions, the exit of processes and other
significant occurrences in the execution of a program. Trace information can be
used to debug an application and to tune the operation of a product. Tracing can
assist application developers and system administrators, and it is often crucial when
asking for product support.
Tracing every possible event in a complex product like CICS can lead to an
unmanageable amount of trace information, so you need a way to specify the types
of events to examine. In CICS, events are classified so you can selectively trace
them. Additionally, you can choose the CICS processes and CICS modules within a
region that you want to trace. With such information, you can specify the tracing
with precision, and eliminate irrelevant data.
Each type of process in a CICS region; for example, IP listeners, application
servers, and the CICS main process, is traced separately, and trace configuration
information is held in the region-wide master trace area (MTA), as shown in
Figure 15 on page 86. The MTA holds the cold-start values for tracing, which are
obtained from the trace-related Region Definitions (RD) stanza entries. These RD
stanza entries describe the types of trace to collect, the process types and modules
from which to collect it, and where to store the collected trace. See “Summary of
trace-related RD stanza entries” on page 99 for a brief description of each of the
trace-related RD stanza entries. These configuration values can be modified as the
region starts by modifying the value of the CICSTRACE environment variable, as
described in “CICSTRACE environment variable” on page 99.
Figure 15 on page 86 shows a CICS region that includes several individual
processes. Each process collects its own trace, based on the configuration
information it finds in the master trace area when it starts.
© Copyright IBM Corp. 1999, 2008 85
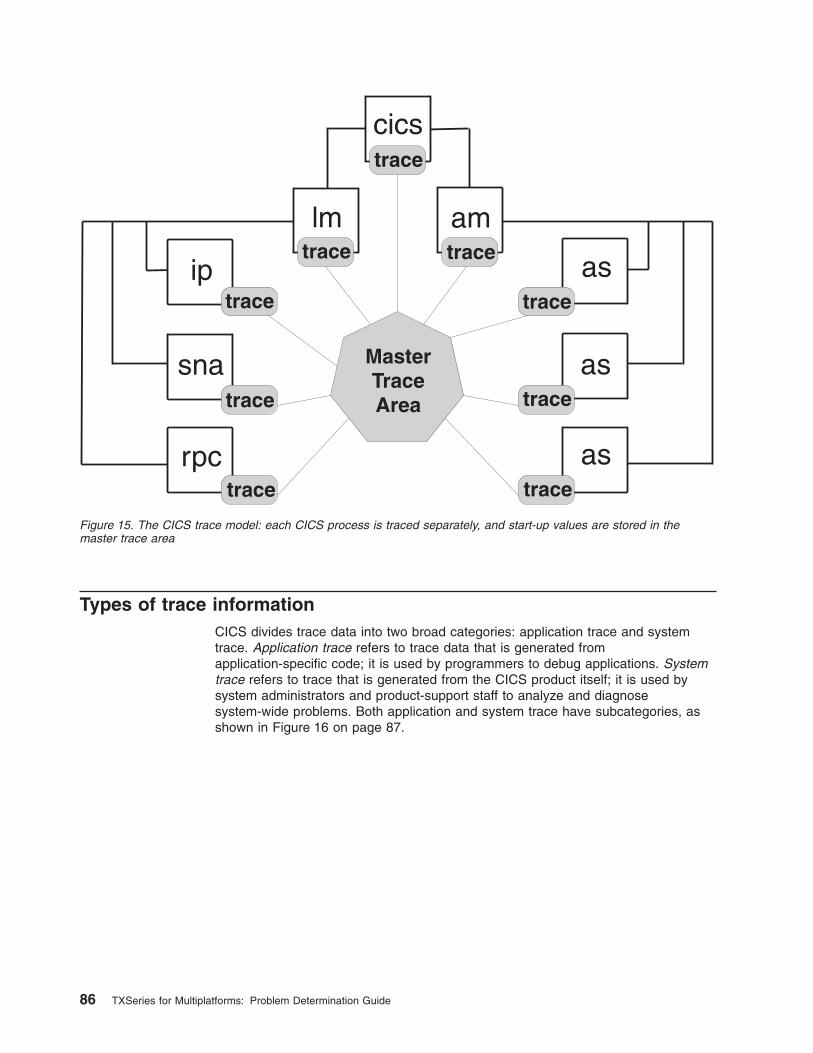
Types of trace information
CICS divides trace data into two broad categories: application trace and system
trace. Application trace refers to trace data that is generated from
application-specific code; it is used by programmers to debug applications. System
trace refers to trace that is generated from the CICS product itself; it is used by
system administrators and product-support staff to analyze and diagnose
system-wide problems. Both application and system trace have subcategories, as
shown in Figure 16 on page 87.
Figure 15. The CICS trace model: each CICS process is traced separately, and start-up values are stored in the
master trace area
86 TXSeries for Multiplatforms: Problem Determination Guide
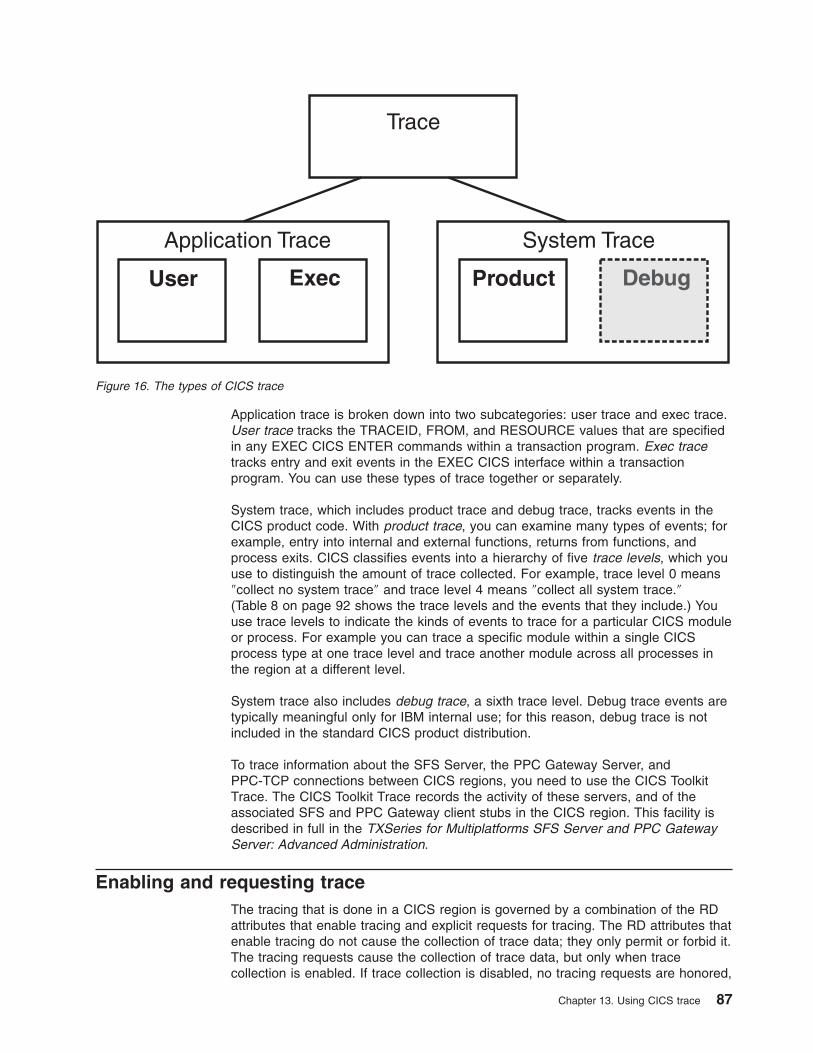
Application trace is broken down into two subcategories: user trace and exec trace.
User trace tracks the TRACEID, FROM, and RESOURCE values that are specified
in any EXEC CICS ENTER commands within a transaction program. Exec trace
tracks entry and exit events in the EXEC CICS interface within a transaction
program. You can use these types of trace together or separately.
System trace, which includes product trace and debug trace, tracks events in the
CICS product code. With product trace, you can examine many types of events; for
example, entry into internal and external functions, returns from functions, and
process exits. CICS classifies events into a hierarchy of five trace levels, which you
use to distinguish the amount of trace collected. For example, trace level 0 means
″collect no system trace″ and trace level 4 means ″collect all system trace.″
(Table 8 on page 92 shows the trace levels and the events that they include.) You
use trace levels to indicate the kinds of events to trace for a particular CICS module
or process. For example you can trace a specific module within a single CICS
process type at one trace level and trace another module across all processes in
the region at a different level.
System trace also includes debug trace, a sixth trace level. Debug trace events are
typically meaningful only for IBM internal use; for this reason, debug trace is not
included in the standard CICS product distribution.
To trace information about the SFS Server, the PPC Gateway Server, and
PPC-TCP connections between CICS regions, you need to use the CICS Toolkit
Trace. The CICS Toolkit Trace records the activity of these servers, and of the
associated SFS and PPC Gateway client stubs in the CICS region. This facility is
described in full in the TXSeries for Multiplatforms SFS Server and PPC Gateway
Server: Advanced Administration.
Enabling and requesting trace
The tracing that is done in a CICS region is governed by a combination of the RD
attributes that enable tracing and explicit requests for tracing. The RD attributes that
enable tracing do not cause the collection of trace data; they only permit or forbid it.
The tracing requests cause the collection of trace data, but only when trace
collection is enabled. If trace collection is disabled, no tracing requests are honored,
Figure 16. The types of CICS trace
Chapter 13. Using CICS trace 87
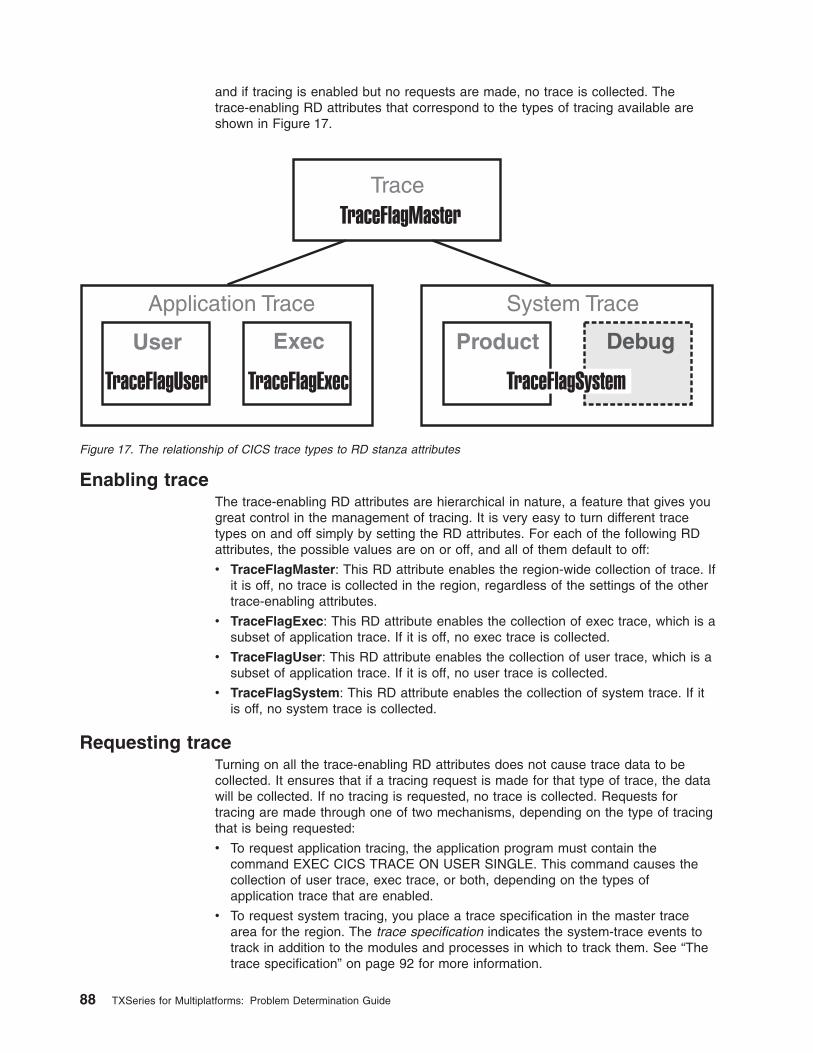
and if tracing is enabled but no requests are made, no trace is collected. The
trace-enabling RD attributes that correspond to the types of tracing available are
shown in Figure 17.
Enabling trace
The trace-enabling RD attributes are hierarchical in nature, a feature that gives you
great control in the management of tracing. It is very easy to turn different trace
types on and off simply by setting the RD attributes. For each of the following RD
attributes, the possible values are on or off, and all of them default to off:
v TraceFlagMaster: This RD attribute enables the region-wide collection of trace. If
it is off, no trace is collected in the region, regardless of the settings of the other
trace-enabling attributes.
v TraceFlagExec: This RD attribute enables the collection of exec trace, which is a
subset of application trace. If it is off, no exec trace is collected.
v TraceFlagUser: This RD attribute enables the collection of user trace, which is a
subset of application trace. If it is off, no user trace is collected.
v TraceFlagSystem: This RD attribute enables the collection of system trace. If it
is off, no system trace is collected.
Requesting trace
Turning on all the trace-enabling RD attributes does not cause trace data to be
collected. It ensures that if a tracing request is made for that type of trace, the data
will be collected. If no tracing is requested, no trace is collected. Requests for
tracing are made through one of two mechanisms, depending on the type of tracing
that is being requested:
v To request application tracing, the application program must contain the
command EXEC CICS TRACE ON USER SINGLE. This command causes the
collection of user trace, exec trace, or both, depending on the types of
application trace that are enabled.
v To request system tracing, you place a trace specification in the master trace
area for the region. The trace specification indicates the system-trace events to
track in addition to the modules and processes in which to track them. See “The
trace specification” on page 92 for more information.
Figure 17. The relationship of CICS trace types to RD stanza attributes
88 TXSeries for Multiplatforms: Problem Determination Guide
Requests for tracing are ignored if the appropriate flags are not enabled.
Setting trace values administratively
Trace is configured by setting values in the master trace area. These values can
come from a variety of places:
v The trace-related RD stanza entries. The values in the RD stanza provide the
cold-start values for a CICS region. These values can be overridden or changed.
See “Summary of trace-related RD stanza entries” on page 99 for a list of all
trace-related RD stanza entries and their default values.
v The CICSTRACE environment variable. This variable can be used to override the
values from the RD stanza in the master trace area for any of the trace-related
attributes. See “CICSTRACE environment variable” on page 99 for more
information. This variable can be set either:
– In the region environment file, /var/cics_regions/regionName/environment,
where it is read when the region starts. The CICSTRACE environment
variable should always be set in the region environment file if it will apply to
the region.
– On the command line, where it is read dynamically. The CICSTRACE
environment variable must always be set on the command line for offline
commands.
Application trace
You can use application trace to verify the flow of logic or to identify bottlenecks
within CICS transaction programs. Application trace consists of two subcategories:
user trace and exec trace. User trace consists of the TRACEID, FROM, and
RESOURCE values that are specified in any EXEC CICS ENTER commands within
a transaction program. Exec trace consists of entry to and return from all EXEC
CICS commands within a transaction program.
Note: Application trace information corresponds to the information that is available
through the CICS Execution Diagnostic Facility (CEDF), which is used for
debugging application programs. For information about using the CEDF, see
the TXSeries for Multiplatforms Application Programming Guide.
Collecting application trace
To collect application trace, you must set the appropriate RD attributes to enable
tracing, then issue the trace request from the transaction programs that you want to
trace. Here is the procedure:
1. Switch on the TraceFlagMaster RD attribute. You can do this administratively
(see “Setting trace values administratively” for more information), or from within
a CICS transaction program by using the EXEC CICS TRACE ON command.
2. Switch on the appropriate application trace flags:
v For user trace, switch on the TraceFlagUser RD attribute. You can do this
administratively (see “Setting trace values administratively” for more
information), or from within a CICS transaction program by using the EXEC
CICS TRACE ON USER command.
v For exec trace, switch on the TraceFlagExec RD attribute. You can do this
administratively (see “Setting trace values administratively” for more
information), or from within a CICS transaction program by using the EXEC
CICS TRACE ON EI command.
Chapter 13. Using CICS trace 89
3. If you want to write the trace to the user trace file, specify this by using the
EXEC CICS TRACE ON USER SINGLE command within the transaction
program. The command turns on the writing of user and (optionally) exec trace
information to the user trace file, depending on the settings of the application
trace flags. The TraceFlagUser RD attribute must be also switched on for user
and exec trace to be written to this destination.
If you do not switch on the TraceFlagUser RD attribute and use the EXEC
CICS TRACE ON USER SINGLE command, information is not written to the
user trace file. However, in this case, if you switch the TraceFlagExec RD
attribute on, the exec trace might still be written to other destinations (buffer and
AUX on all platforms, plus the external trace on AIX).
The request is canceled automatically when the transaction program exits.
Application trace events are triggered when the CICS API command EXEC
CICS ENTER is invoked. The request to write the trace to the user trace file can
be made only from within a program; no administrative equivalent exists.
Storing application trace
When application trace is collected, the process writes the trace records to files.
The directory that contains the files is determined by the value of the
TraceDirectoryUser RD attribute. This attribute defaults to /tmp on Open Systems
and to \var\cics_tmp on Windows systems.
Files that are generated for application trace are named in accordance with the
following pattern:
regionName.userName.nprocessNumber.pprocessID.cicsusr
Under this naming convention, processNumber is the identifier that is assigned by
CICS, not the operating system; processID is the operating-system identifier. For
example, the following files contain trace for the region TJEREG2 and the user
CICSUSER:
TJEREG2.CICSUSER.n101.p21440.cicsusr
TJEREG2.CICSUSER.n102.p19592.cicsusr
TJEREG2.CICSUSER.n102.p20846.cicsusr
Trace records for application trace events that have no user identifier (for example,
those that run when the region starts) are stored in a special file in the
application-trace directory. The name of this file is determined by the value of the
TraceUserPublicFile RD attribute; this value defaults to cicspubl. File names
follow this pattern:
regionName.public.cicsusr
For example, the following file contains public trace for the region TJEREG2:
TJEREG2.public.cicsusr
The trace files that are generated for application trace are unformatted. They must
be formatted by using the cicstfmt utility before they can be read.
Reading application trace
Figure 18 on page 91 shows an excerpt from a file that contains application trace.
Each line is a separate trace record.
90 TXSeries for Multiplatforms: Problem Determination Guide
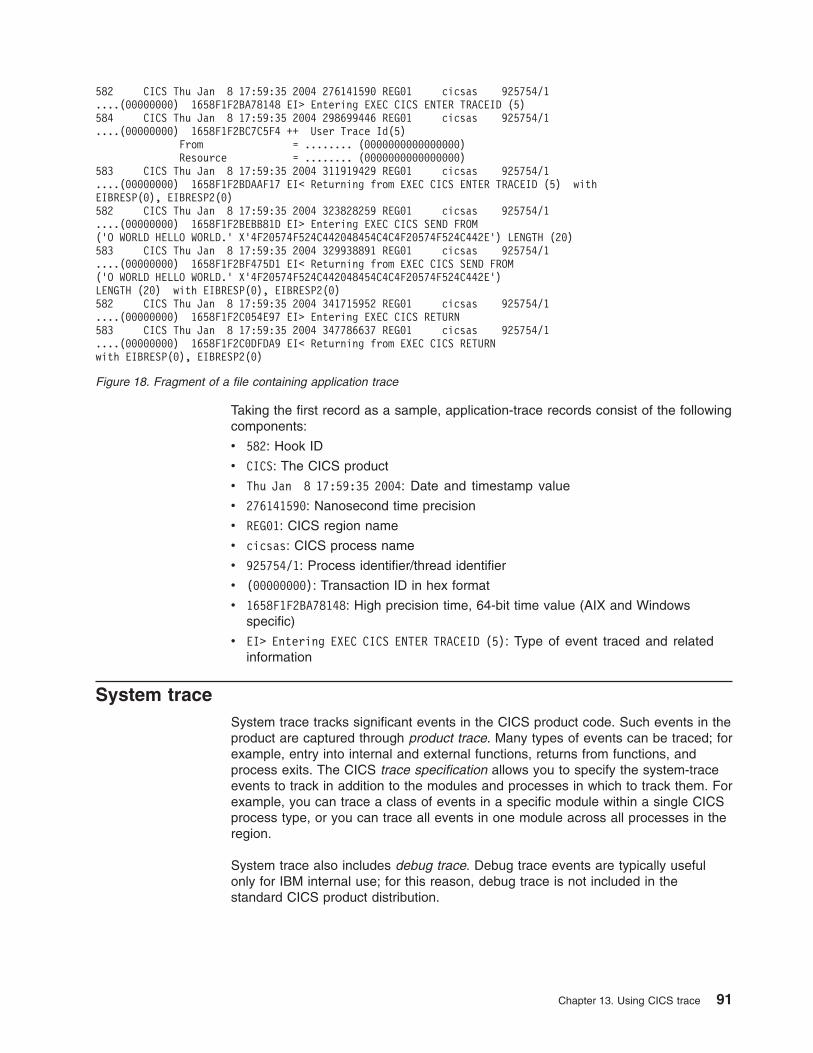
Taking the first record as a sample, application-trace records consist of the following
components:
v 582: Hook ID
v CICS: The CICS product
v Thu Jan 8 17:59:35 2004: Date and timestamp value
v 276141590: Nanosecond time precision
v REG01: CICS region name
v cicsas: CICS process name
v 925754/1: Process identifier/thread identifier
v (00000000): Transaction ID in hex format
v 1658F1F2BA78148: High precision time, 64-bit time value (AIX and Windows
specific)
v EI> Entering EXEC CICS ENTER TRACEID (5): Type of event traced and related
information
System trace
System trace tracks significant events in the CICS product code. Such events in the
product are captured through product trace. Many types of events can be traced; for
example, entry into internal and external functions, returns from functions, and
process exits. The CICS trace specification allows you to specify the system-trace
events to track in addition to the modules and processes in which to track them. For
example, you can trace a class of events in a specific module within a single CICS
process type, or you can trace all events in one module across all processes in the
region.
System trace also includes debug trace. Debug trace events are typically useful
only for IBM internal use; for this reason, debug trace is not included in the
standard CICS product distribution.
582 CICS Thu Jan 8 17:59:35 2004 276141590 REG01 cicsas 925754/1
....(00000000) 1658F1F2BA78148 EI> Entering EXEC CICS ENTER TRACEID (5)
584 CICS Thu Jan 8 17:59:35 2004 298699446 REG01 cicsas 925754/1
....(00000000) 1658F1F2BC7C5F4 ++ User Trace Id(5)
From = ........ (0000000000000000)
Resource = ........ (0000000000000000)
583 CICS Thu Jan 8 17:59:35 2004 311919429 REG01 cicsas 925754/1
....(00000000) 1658F1F2BDAAF17 EI< Returning from EXEC CICS ENTER TRACEID (5) with
EIBRESP(0), EIBRESP2(0)
582 CICS Thu Jan 8 17:59:35 2004 323828259 REG01 cicsas 925754/1
....(00000000) 1658F1F2BEBB81D EI> Entering EXEC CICS SEND FROM
(’O WORLD HELLO WORLD.’ X’4F20574F524C442048454C4C4F20574F524C442E’) LENGTH (20)
583 CICS Thu Jan 8 17:59:35 2004 329938891 REG01 cicsas 925754/1
....(00000000) 1658F1F2BF475D1 EI< Returning from EXEC CICS SEND FROM
(’O WORLD HELLO WORLD.’ X’4F20574F524C442048454C4C4F20574F524C442E’)
LENGTH (20) with EIBRESP(0), EIBRESP2(0)
582 CICS Thu Jan 8 17:59:35 2004 341715952 REG01 cicsas 925754/1
....(00000000) 1658F1F2C054E97 EI> Entering EXEC CICS RETURN
583 CICS Thu Jan 8 17:59:35 2004 347786637 REG01 cicsas 925754/1
....(00000000) 1658F1F2C0DFDA9 EI< Returning from EXEC CICS RETURN
with EIBRESP(0), EIBRESP2(0)
Figure 18. Fragment of a file containing application trace
Chapter 13. Using CICS trace 91
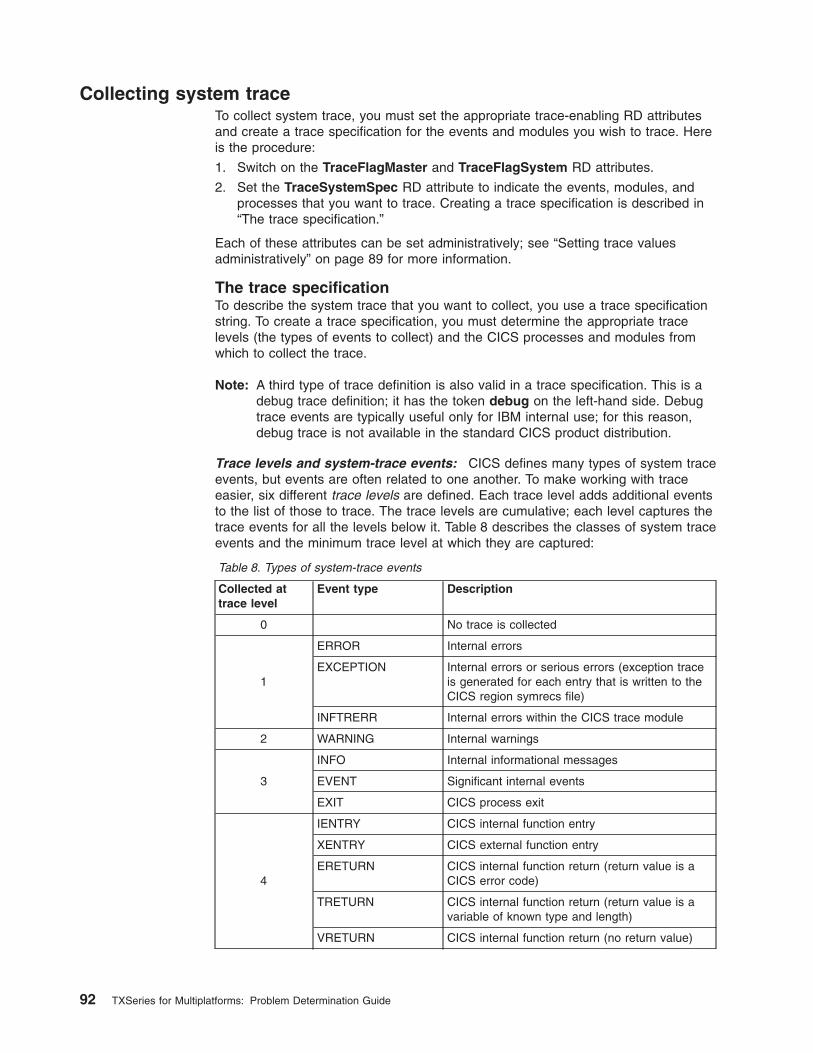
Collecting system trace
To collect system trace, you must set the appropriate trace-enabling RD attributes
and create a trace specification for the events and modules you wish to trace. Here
is the procedure:
1. Switch on the TraceFlagMaster and TraceFlagSystem RD attributes.
2. Set the TraceSystemSpec RD attribute to indicate the events, modules, and
processes that you want to trace. Creating a trace specification is described in
“The trace specification.”
Each of these attributes can be set administratively; see “Setting trace values
administratively” on page 89 for more information.
The trace specification
To describe the system trace that you want to collect, you use a trace specification
string. To create a trace specification, you must determine the appropriate trace
levels (the types of events to collect) and the CICS processes and modules from
which to collect the trace.
Note: A third type of trace definition is also valid in a trace specification. This is a
debug trace definition; it has the token debug on the left-hand side. Debug
trace events are typically useful only for IBM internal use; for this reason,
debug trace is not available in the standard CICS product distribution.
Trace levels and system-trace events: CICS defines many types of system trace
events, but events are often related to one another. To make working with trace
easier, six different trace levels are defined. Each trace level adds additional events
to the list of those to trace. The trace levels are cumulative; each level captures the
trace events for all the levels below it. Table 8 describes the classes of system trace
events and the minimum trace level at which they are captured:
Table 8. Types of system-trace events
Collected at
trace level
Event type Description
0 No trace is collected
1
ERROR Internal errors
EXCEPTION Internal errors or serious errors (exception trace
is generated for each entry that is written to the
CICS region symrecs file)
INFTRERR Internal errors within the CICS trace module
2 WARNING Internal warnings
3
INFO Internal informational messages
EVENT Significant internal events
EXIT CICS process exit
4
IENTRY CICS internal function entry
XENTRY CICS external function entry
ERETURN CICS internal function return (return value is a
CICS error code)
TRETURN CICS internal function return (return value is a
variable of known type and length)
VRETURN CICS internal function return (no return value)
92 TXSeries for Multiplatforms: Problem Determination Guide
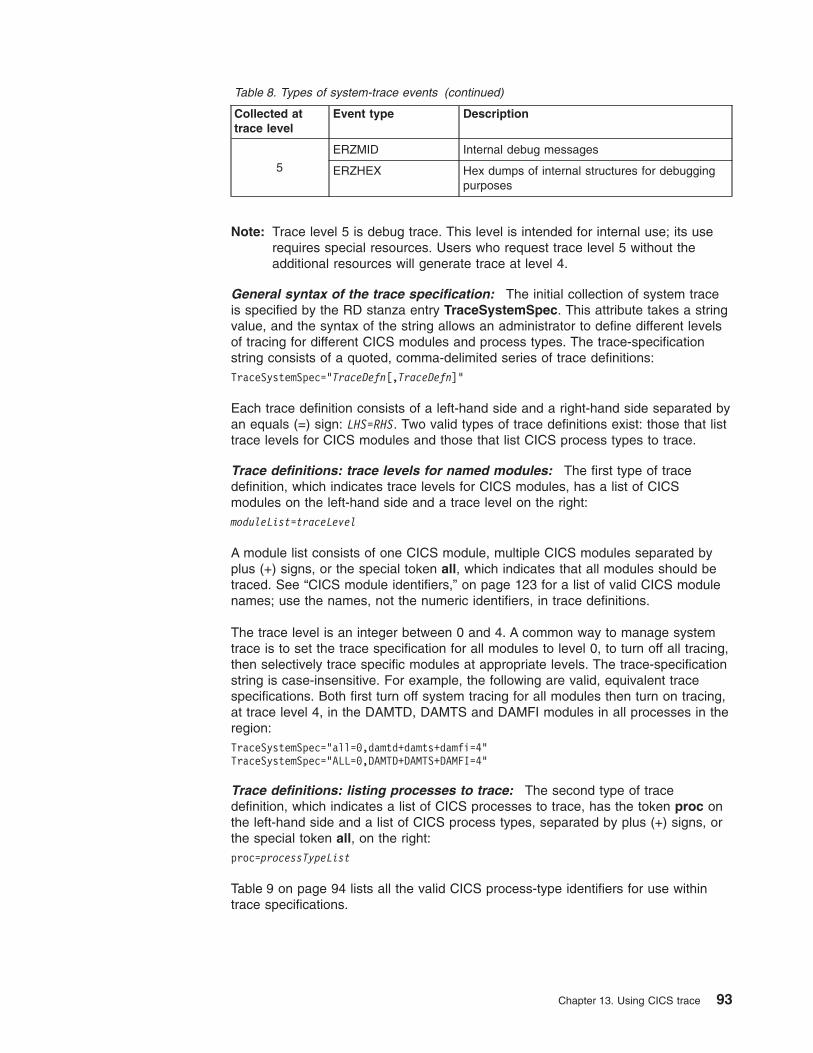
Table 8. Types of system-trace events (continued)
Collected at
trace level
Event type Description
5
ERZMID Internal debug messages
ERZHEX Hex dumps of internal structures for debugging
purposes
Note: Trace level 5 is debug trace. This level is intended for internal use; its use
requires special resources. Users who request trace level 5 without the
additional resources will generate trace at level 4.
General syntax of the trace specification: The initial collection of system trace
is specified by the RD stanza entry TraceSystemSpec. This attribute takes a string
value, and the syntax of the string allows an administrator to define different levels
of tracing for different CICS modules and process types. The trace-specification
string consists of a quoted, comma-delimited series of trace definitions:
TraceSystemSpec="TraceDefn[,TraceDefn]"
Each trace definition consists of a left-hand side and a right-hand side separated by
an equals (=) sign: LHS=RHS. Two valid types of trace definitions exist: those that list
trace levels for CICS modules and those that list CICS process types to trace.
Trace definitions: trace levels for named modules: The first type of trace
definition, which indicates trace levels for CICS modules, has a list of CICS
modules on the left-hand side and a trace level on the right:
moduleList=traceLevel
A module list consists of one CICS module, multiple CICS modules separated by
plus (+) signs, or the special token all, which indicates that all modules should be
traced. See “CICS module identifiers,” on page 123 for a list of valid CICS module
names; use the names, not the numeric identifiers, in trace definitions.
The trace level is an integer between 0 and 4. A common way to manage system
trace is to set the trace specification for all modules to level 0, to turn off all tracing,
then selectively trace specific modules at appropriate levels. The trace-specification
string is case-insensitive. For example, the following are valid, equivalent trace
specifications. Both first turn off system tracing for all modules then turn on tracing,
at trace level 4, in the DAMTD, DAMTS and DAMFI modules in all processes in the
region:
TraceSystemSpec="all=0,damtd+damts+damfi=4"
TraceSystemSpec="ALL=0,DAMTD+DAMTS+DAMFI=4"
Trace definitions: listing processes to trace: The second type of trace
definition, which indicates a list of CICS processes to trace, has the token proc on
the left-hand side and a list of CICS process types, separated by plus (+) signs, or
the special token all, on the right:
proc=processTypeList
Table 9 on page 94 lists all the valid CICS process-type identifiers for use within
trace specifications.
Chapter 13. Using CICS trace 93
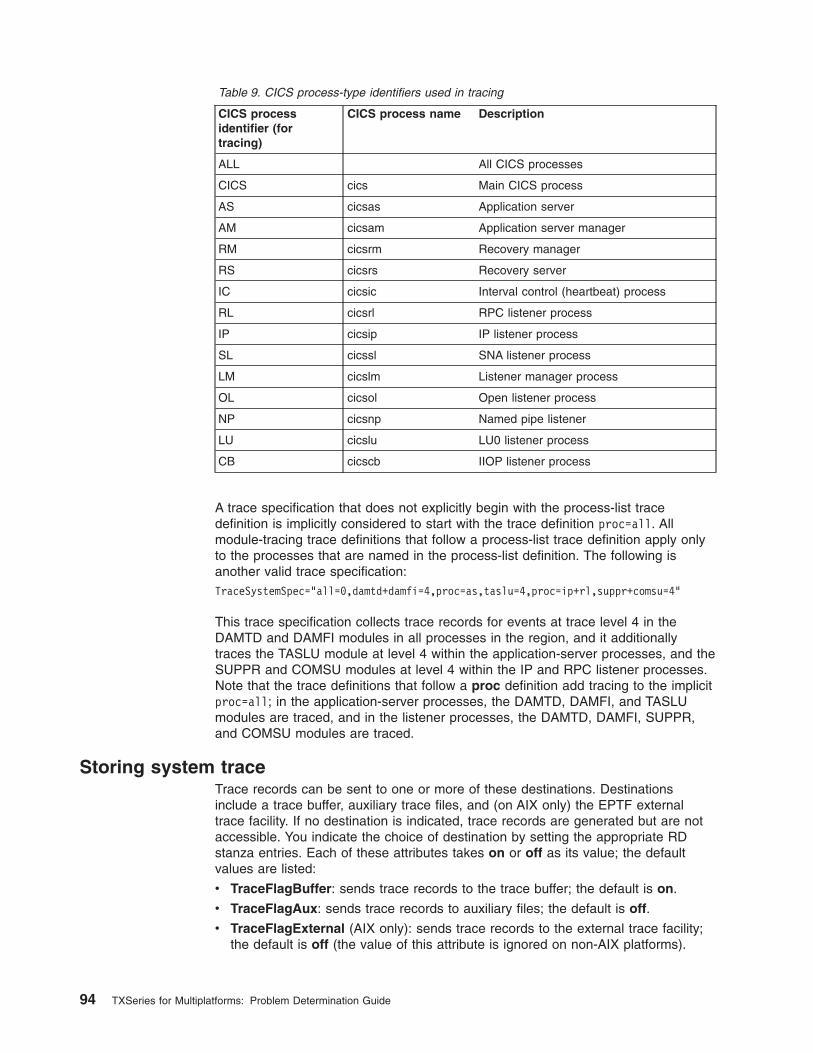
Table 9. CICS process-type identifiers used in tracing
CICS process
identifier (for
tracing)
CICS process name Description
ALL All CICS processes
CICS cics Main CICS process
AS cicsas Application server
AM cicsam Application server manager
RM cicsrm Recovery manager
RS cicsrs Recovery server
IC cicsic Interval control (heartbeat) process
RL cicsrl RPC listener process
IP cicsip IP listener process
SL cicssl SNA listener process
LM cicslm Listener manager process
OL cicsol Open listener process
NP cicsnp Named pipe listener
LU cicslu LU0 listener process
CB cicscb IIOP listener process
A trace specification that does not explicitly begin with the process-list trace
definition is implicitly considered to start with the trace definition proc=all. All
module-tracing trace definitions that follow a process-list trace definition apply only
to the processes that are named in the process-list definition. The following is
another valid trace specification:
TraceSystemSpec="all=0,damtd+damfi=4,proc=as,taslu=4,proc=ip+rl,suppr+comsu=4"
This trace specification collects trace records for events at trace level 4 in the
DAMTD and DAMFI modules in all processes in the region, and it additionally
traces the TASLU module at level 4 within the application-server processes, and the
SUPPR and COMSU modules at level 4 within the IP and RPC listener processes.
Note that the trace definitions that follow a proc definition add tracing to the implicit
proc=all; in the application-server processes, the DAMTD, DAMFI, and TASLU
modules are traced, and in the listener processes, the DAMTD, DAMFI, SUPPR,
and COMSU modules are traced.
Storing system trace
Trace records can be sent to one or more of these destinations. Destinations
include a trace buffer, auxiliary trace files, and (on AIX only) the EPTF external
trace facility. If no destination is indicated, trace records are generated but are not
accessible. You indicate the choice of destination by setting the appropriate RD
stanza entries. Each of these attributes takes on or off as its value; the default
values are listed:
v TraceFlagBuffer: sends trace records to the trace buffer; the default is on.
v TraceFlagAux: sends trace records to auxiliary files; the default is off.
v TraceFlagExternal (AIX only): sends trace records to the external trace facility;
the default is off (the value of this attribute is ignored on non-AIX platforms).
94 TXSeries for Multiplatforms: Problem Determination Guide
The location of all system trace files, those that are dumped from the buffer in
addition to those that are generated by auxiliary trace, is determined by the value of
the TraceDirectorySystem attribute. The default value is /var/cics_regions/regionName/dumps/dir1 on Open Systems and \var\cics_regions\regionName\dumps\dir1 on Windows. This attribute can be set to any valid path.
Using the trace buffer
System trace records are stored in the trace buffer of each process when the
TraceFlagBuffer is switched on. The trace buffer is a ring; trace records are written
sequentially into the buffer, and when the end of the buffer is reached, storage
continues at the beginning of the buffer, overwriting older records. The size of the
ring buffer is determined by the value of the TraceMaxSizeBuffer attribute. The
default value is 131,072, the unit is bytes. The attribute can be set to any positive
integer, but changes cannot be made while CICS is running.
The ring buffer is the default destination for system trace records. The storing of
trace records in the ring buffer puts the least load on the process that is being
traced, making this the best way to trace production systems.
Records that are in the ring buffer must be retrieved before they can be read; this is
done by dumping the ring buffer to a file. CICS processes dump their ring buffers
automatically; see “Automatic ring-buffer dumps” for more information.
The location of all system trace files, including those that are dumped from the
buffer, is determined by the value of the TraceDirectorySystem attribute. Files that
are generated from ring buffers are named in accordance with the following pattern:
regionName.processName.processNumber.cicsdmp.indexCounter
Under this naming convention, processName is the name of the CICS process from
which the trace is generated (see Table 9 on page 94 for a list of CICS process
names), the processNumber is the identifier that is assigned by CICS, not by the
operating system. The indexCounter is a three-digit integer that indicates the
number of dumps that have occurred since the region was cold-started. These
numbers ensure that a process does not overwrite its dump files. They can also be
used to match dump files from different processes across the region; all processes
dumped at the same time will use the same index counter.
The trace files that are generated from ring buffers are unformatted. They must be
formatted by using the cicstfmt utility before they can be read.
Automatic ring-buffer dumps: CICS processes dump their ring buffers
automatically, according to the settings of certain environment variables. These
variables indicate the conditions under which processes should dump their ring
buffers:
1. CICSTRACE_DUMP_ON_ABNORMAL_EXIT dumps the ring buffer whenever a
task exits through an abnormal task-termination procedure. Set the variable to
any value; the value itself is not meaningful.
2. CICSTRACE_DUMP_ON_EXIT dumps the ring buffer whenever a task exits
through the normal or abnormal task-termination procedure. Set the variable to
any value; the value itself is not meaningful.
3. CICSTRACE_DUMP_ON_SYMREC dumps the ring buffer whenever a symrec
is recorded. Set the variable to any value; the value itself is not meaningful.
4. CICSTRACE_DUMP_ON_ABEND dumps the ring buffer whenever a symrec is
generated for one of the CICS abend codes. Set the variable to a
comma-delimited list of abend codes.
Chapter 13. Using CICS trace 95
5. CICSTRACE_DUMP_ON_MSN dumps the rings buffer whenever a symrec is
generated for one of the CICS message sequence numbers (MSNs). Set the
variable to a comma-delimited list of MSNs.
The routine collection of system trace to the ring buffer in conjunction with the use
of these variables can be very helpful in tracing unexpected failures in production
systems and in diagnosing the failure the first time it occurs, without having to
attempt reproduction of the failure. It places very little load on the system, and
dump files are not generated until a specific condition triggers them.
Using auxiliary trace files
System trace records are stored directly to files, called auxiliary trace files, when
the TraceFlagAux RD attribute is switched on. The location of all system trace files,
including auxiliary trace files, is determined by the value of the
TraceDirectorySystem RD attribute. Auxiliary trace files are named in accordance
with the following pattern:
regionName.processName.nprocessNumber.pprocessID.tthreadID.cicstrc
Under this naming convention, processName is the name of the CICS process from
which the trace is generated (see Table 9 on page 94 for a list of CICS process
names), the processNumber is the identifier that is assigned by CICS, not by the
operating system; processID is the operating-system identifier. The threadID is
omitted for single-threaded processes like standalone programs; in multi-threaded
processes, trace from each thread goes into separate files. Before the files that are
inside the braces {{}} can be read, you must use the cicsfmt utility to format them.
The formatted files are generated in the following pattern:
regionName.processName.nprocessNumber.pprocessID.threadID.cicstrc.fmt
For example, the following files contain system trace for the region TJEREG2:
TJEREG2.cicsas.n102.p23374.t1.{{cicstrc}}
TJEREG2.cicsas.n102.p23374.t2.{{cicstrc}}
TJEREG2.cicsas.n102.p23384.t1.{{cicstrc}}
TJEREG2.cicsas.n102.p23384.t2.{{cicstrc}}
TJEREG2.cicsas.n103.p20628.t1.{{cicstrc}}
TJEREG2.cicsas.n103.p20628.t2.{{cicstrc}}
TJEREG2.cicsic.n4.p19714.t1.{{cicstrc}}
Auxiliary trace files are named in the following pattern:
regionName.processName.nprocessNumber.pprocessID.threadID.cicstrc
Under this naming convention, processName is the name of the CICS process from
which the trace is generated (see Table 9 on page 94 for a list of CICS process
names), the processNumber is the identifier that is assigned by CICS, not by the
operating system, and processID is the operating-system identifier. The threadID is
omitted for single-threaded processes like standalone programs; in multi-threaded
processes, trace from each thread goes into separate files. For example, the
following files contain system trace for the region TJEREG2:
v TJEREG2.cicsas.n102.p23374.t1.cicstrc
v TJEREG2.cicsas.n102.p23374.t2.cicstrc
v TJEREG2.cicsas.n102.p23384.t1.cicstrc
v TJEREG2.cicsas.n102.p23384.t2.cicstrc
v TJEREG2.cicsas.n103.p20628.t1.cicstrc
v TJEREG2.cicsas.n103.p20628.t2.cicstrc
v TJEREG2.cicsic.n4.p19714.t1.cicstrc
96 TXSeries for Multiplatforms: Problem Determination Guide
These files must be formatted with the cicstfmt utility before they can be viewed.
The formatted files are generated in the following pattern:
regionName.processName.nprocessNumber.pprocessID.threadID.cicstrc.fmt
The maximum size, in bytes, of auxiliary trace files is determined by the value of
the TraceMaxSizeAux RD attribute. The value can be any positive integer, and the
special value 0 (zero) is used to indicate an unlimited size. The default value is 0.
Writing trace records directly to files is not as efficient as writing them to the ring
buffer, but it can be very useful for capturing problems that occur before the ring
buffer is initialized.
Setting system-trace values dynamically
You can turn system tracing on and off while a CICS region runs, by issuing a
sequence of commands. This is useful when a problem that requires immediate
tracing occurs while a region is running. Each sequence of commands enables the
necessary trace attributes to start or stop collecting system trace.
To start collecting system trace from a running region, issue these commands:
1. CECI TRACE ON
2. CECI TRACE SYSTEM ON
3. CEMT SET AUXTRACE ON
To stop collecting system trace from a running region, issue these commands:
1. CEMT SET AUXTRACE OFF
2. CECI TRACE SYSTEM OFF
3. CECI TRACE OFF
The location of all system trace files, including those created by dynamic trace
commands, is determined by the value of the TraceDirectorySystem attribute. See
“Storing system trace” on page 94 for more information.
Reading system trace
Figure 19 on page 98 shows an excerpt from a file that contains system trace. Each
line that begins with CICS starts a new record; lines have been broken to format the
excerpt.
Chapter 13. Using CICS trace 97
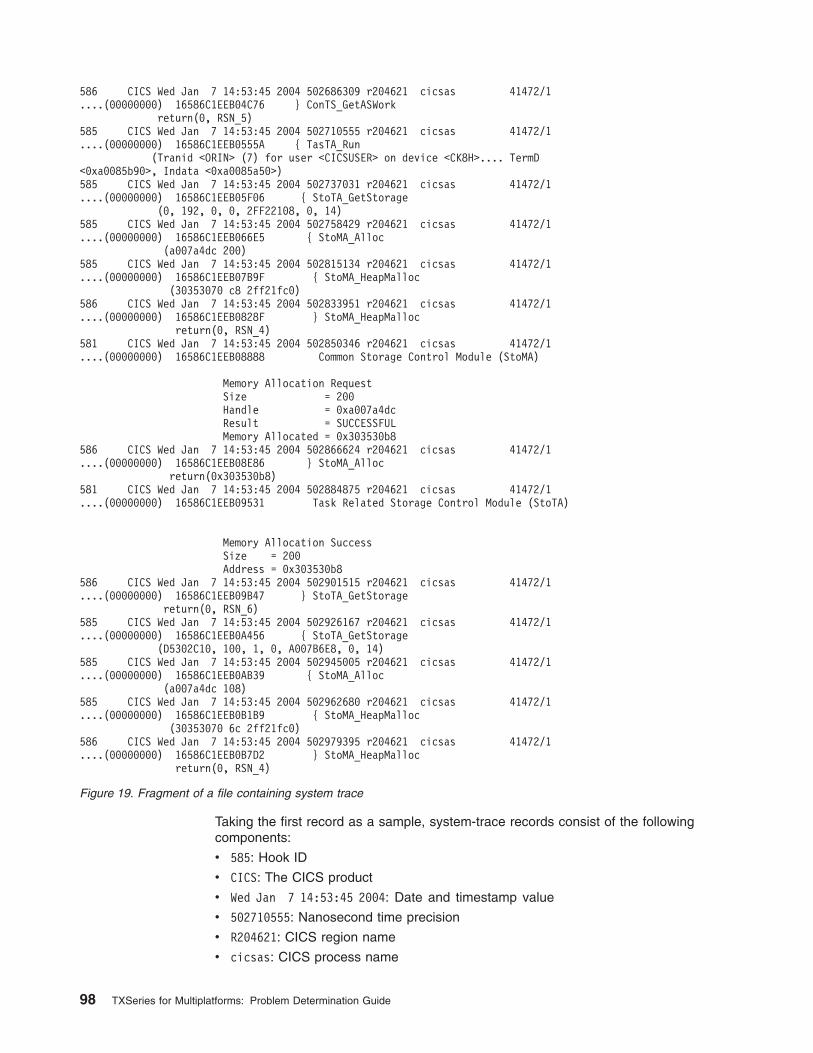
Taking the first record as a sample, system-trace records consist of the following
components:
v 585: Hook ID
v CICS: The CICS product
v Wed Jan 7 14:53:45 2004: Date and timestamp value
v 502710555: Nanosecond time precision
v R204621: CICS region name
v cicsas: CICS process name
586 CICS Wed Jan 7 14:53:45 2004 502686309 r204621 cicsas 41472/1
....(00000000) 16586C1EEB04C76 } ConTS_GetASWork
return(0, RSN_5)
585 CICS Wed Jan 7 14:53:45 2004 502710555 r204621 cicsas 41472/1
....(00000000) 16586C1EEB0555A { TasTA_Run
(Tranid <ORIN> (7) for user <CICSUSER> on device <CK8H>.... TermD
<0xa0085b90>, Indata <0xa0085a50>)
585 CICS Wed Jan 7 14:53:45 2004 502737031 r204621 cicsas 41472/1
....(00000000) 16586C1EEB05F06 { StoTA_GetStorage
(0, 192, 0, 0, 2FF22108, 0, 14)
585 CICS Wed Jan 7 14:53:45 2004 502758429 r204621 cicsas 41472/1
....(00000000) 16586C1EEB066E5 { StoMA_Alloc
(a007a4dc 200)
585 CICS Wed Jan 7 14:53:45 2004 502815134 r204621 cicsas 41472/1
....(00000000) 16586C1EEB07B9F { StoMA_HeapMalloc
(30353070 c8 2ff21fc0)
586 CICS Wed Jan 7 14:53:45 2004 502833951 r204621 cicsas 41472/1
....(00000000) 16586C1EEB0828F } StoMA_HeapMalloc
return(0, RSN_4)
581 CICS Wed Jan 7 14:53:45 2004 502850346 r204621 cicsas 41472/1
....(00000000) 16586C1EEB08888 Common Storage Control Module (StoMA)
Memory Allocation Request
Size = 200
Handle = 0xa007a4dc
Result = SUCCESSFUL
Memory Allocated = 0x303530b8
586 CICS Wed Jan 7 14:53:45 2004 502866624 r204621 cicsas 41472/1
....(00000000) 16586C1EEB08E86 } StoMA_Alloc
return(0x303530b8)
581 CICS Wed Jan 7 14:53:45 2004 502884875 r204621 cicsas 41472/1
....(00000000) 16586C1EEB09531 Task Related Storage Control Module (StoTA)
Memory Allocation Success
Size = 200
Address = 0x303530b8
586 CICS Wed Jan 7 14:53:45 2004 502901515 r204621 cicsas 41472/1
....(00000000) 16586C1EEB09B47 } StoTA_GetStorage
return(0, RSN_6)
585 CICS Wed Jan 7 14:53:45 2004 502926167 r204621 cicsas 41472/1
....(00000000) 16586C1EEB0A456 { StoTA_GetStorage
(D5302C10, 100, 1, 0, A007B6E8, 0, 14)
585 CICS Wed Jan 7 14:53:45 2004 502945005 r204621 cicsas 41472/1
....(00000000) 16586C1EEB0AB39 { StoMA_Alloc
(a007a4dc 108)
585 CICS Wed Jan 7 14:53:45 2004 502962680 r204621 cicsas 41472/1
....(00000000) 16586C1EEB0B1B9 { StoMA_HeapMalloc
(30353070 6c 2ff21fc0)
586 CICS Wed Jan 7 14:53:45 2004 502979395 r204621 cicsas 41472/1
....(00000000) 16586C1EEB0B7D2 } StoMA_HeapMalloc
return(0, RSN_4)
Figure 19. Fragment of a file containing system trace
98 TXSeries for Multiplatforms: Problem Determination Guide
v 41472/1: Process identifier/thread identifier
v (00000000): Transaction ID in hex format
v 16586C1EEB0555A: High precision time, 64-bit time value (AIX and Windows
specific)
v { TasTA_Run (Tranid <ORIN> (7) for user <CICSUSER> on device
<CK8H>.... TermD <0xa0085b90>, Indata <0xa0085a50>): Internal CICS function
call and its hex parameter values
Summary of trace-related RD stanza entries
The following categorizes all the trace-related RD stanza entries and lists them with
their default values.
v Region-wide trace: TraceFlagMaster (off)
v Application trace
– Trace attributes
- TraceFlagUser (off)
- TraceFlagExec (off)
– Trace storage
- TraceDirectoryUser (/tmp or \var\cics_tmp)
- TraceUserPublicFile (cicspubl)
v System trace: TraceFlagSystem (off)
– Trace specification: TraceSystemSpec (all=0)
– Trace destinations
- TraceDirectorySystem (/var/cics_regions/regionName/dumps/dir1 or
\var\cics_regions\regionName\dumps\dir1)
- Buffer
v TraceFlagBuffer (on)
v TraceMaxSizeBuffer (131,072)
- Auxiliary files
v TraceFlagAux (off)
v TraceMaxSizeAux (0, which means unlimited size)
- External: TraceFlagExternal (off)
CICSTRACE environment variable
The CICSTRACE environment variable can be used to override trace-related data
in the RD stanzas for a CICS region. It also provides the means to define trace
settings for standalone or co-routine processes, which do not access the RD
stanzas. The environment variable mimics a command line in format, and provides
a switch for each of the RD stanza attributes. It uses this syntax:
CICSTRACE="-d TraceDirectorySystem
-u TraceDirectoryUser
-A TraceFlagAux
-B TraceFlagBuffer
-E TraceFlagExec
-X TraceFlagExternal
-M TraceFlagMaster
-STraceFlagSystem
-UTraceFlagUser
-a TraceMaxSizeAux
-b TraceMaxSizeBuffer
-t TraceSystemSpec
Chapter 13. Using CICS trace 99
See “Summary of trace-related RD stanza entries” on page 99 for a summary of the
RD stanza entries and their default values.
You can specify the switches in any sequence, and you can omit any whose current
values are acceptable. The following is a valid setting for the CICSTRACE
environment variable:
CICSTRACE=" -A on -u /tmp -U on -B off -M on -S on -t all=4"
Earlier versions of TXSeries for Multiplatforms allowed full trace (equivalent to a
trace spec of all=5, master, system, and aux flags on) to be forced on for offline
commands by setting CICSTRACE=1. If this setting was used for a region, the flags
were all forced on, but the trace spec that was used was the one that was defined
in the region stanza. This behavior is retained for compatibility, and CICSTRACE is
checked for this value before an attempt to parse for the new values.
An equivalent variable, CICSEXTERNALTRACE, exists that does the same as
CICSTRACE. It turns on the external flag instead of the aux flag for AIX. These two
variables are mostly used for offline command tracing. If you set both
CICSEXTERNALTRACE and CICSTRACE to 1, you will write to both the auxiliary
trace file an the external trace (on AIX).
Problems with trace output
Common problems with trace output are:
v The trace output has gone to the wrong destination.
v The required trace data is missing.
Trace output has gone to the wrong destination
Check whether you have correctly specified the trace destination. For application
trace, see “Storing application trace” on page 90; for system trace, see “Storing
system trace” on page 94.
The required trace data is missing
1. Check the settings of the appropriate trace-enabling attributes. The
TraceFlagMaster RD attribute must be on for any trace to be collected. Specific
types of trace require additional flags. For application trace, see “Collecting
application trace” on page 89; for system trace, see “Collecting system trace” on
page 92. Enabling trace attributes is not enough to collect trace; enabling trace
attributes simply tells the system to honor trace-collection requests. Ensure that
the appropriate tracing has been requested:
v For application trace, ensure that the transaction programs include the
command CICS EXEC TRACE ON USER SINGLE. This command requests
the collection of application trace.
v For system trace, ensure that the trace specification RD attribute,
TraceSystemSpec, is tracing the correct modules and processes at a level to
catch the events that you want to see. See “The trace specification” on page
92.
2. If the trace flags are correct and the trace runs but does not produce the trace
entries you wanted, two possibilities exist:
v The task that you are checking did not run.
v The task that you are checking did not involve the CICS components that you
expected.
100 TXSeries for Multiplatforms: Problem Determination Guide
Examine the trace in the area in which you expected the task to appear, to
determine why CICS did not perform the task. Remember that the tracing
options might not, after all, have been appropriate.
3. If you are storing system trace to the ring buffer, but dumps of the ring buffer do
not show the required entries, it is possible that CICS has overwritten them, or
that the process has not progressed far enough to write trace to the ring buffer.
If you suspect that the buffer has been overwritten, increase the size of the ring
buffer. See “Using the trace buffer” on page 95. If your process appears not to
have run long enough to write to the ring buffer, direct trace to auxiliary trace
files. See “Using auxiliary trace files” on page 96.
Chapter 13. Using CICS trace 101

102 TXSeries for Multiplatforms: Problem Determination Guide
Chapter 14. Using CICS dump
Three types of dump are available in CICS:
Transaction dump
A transaction dump writes specified areas of memory to a file, to assist you
in debugging an application program or to identify why an abnormal
termination or storage violation occurred.
Transaction dumps can be executed concurrently.
System dump
A system dump writes information about the whole CICS region, including:
v Details of the last CICS command that was executed
v Details of each transaction that is in progress
v The region configuration at the time the dump is taken
v Transaction dump of any non-application server processes
v All enabled trace information.
To ensure that the data that is included in the system dump is as accurate
as possible, CICS prevents any changes being made to any data that is
written to the dump file, until the system dump is complete. CICS allows a
task to resume execution only after the task has dumped its task-private
data to the dump file and the system dump is complete. System dumps are
queued and executed singly.
You cannot control the content of a CICS system dump. The amount of
data can be very large. Ensure that you have enough space for the dump
data.
Core dump
In exceptional conditions, CICS produces an operating system core dump
instead of a dump that is formatted by CICS. If this happens, investigate it
by using the commands for an operating system core dump. If CICS
produces a core dump, messages are written to console.nnnnnn to indicate
why it has done this.
CICS attempts to format the core dump automatically by running the
showProcInfo tool against the core file. If CICS is successful in formatting
the core file, a message that specifies the filename of the formatted core
dump is produced in the console.nnnnnn.
Setting the dump destination
CICS uses several directories to write the dump. These directories are
subdirectories of the dump directory.
1. On the DumpName attribute of the Region Definitions (RD), specify the name
of the directory (containing the subdirectories) to which CICS dumps are written.
2. On the CoreDumpName attribute of the Region Definitions (RD), specify the
name of a subdirectory of the DumpName directory. CICS uses this
subdirectory for a core dump if a nonrecoverable CICS abnormal termination
occurs.
A dump might fail if not enough file space or file size is available. On all systems
except Windows, the dump subdirectories can be symbolically linked to directories
on different physical devices to give you more space in which to save dumps.
© Copyright IBM Corp. 1999, 2008 103
During start-up, CICS obtains the dump directory from the region database, and
checks whether CICS has write permission in all the dump subdirectories. If CICS
finds a nonwritable dump subdirectory, a warning message is written to the
console.nnnnnn file. If you are a system administrator, deal with this type of warning
message promptly.
Controlling dump output
A transaction dump can be generated by:
v EXEC CICS DUMP calls (you cannot suppress this dump)
v EXEC CICS ABEND calls
v Transaction abnormal terminations (including abnormal terminations that are
generating ASRA and ASRB abnormal termination codes when an exception
occurs within an application program belonging to that transaction).
Note: Not all transaction abnormal terminations produce a dump. Refer to the
System Action description in TXSeries for Multiplatforms Messages and
Codes for the abend code that you receive, to determine whether that abend
code produces a dump. AKCS and AKCT abends do not produce dumps
despite the TransDump flag.
A system dump can be generated by:
v CICS system abnormal terminations (you cannot suppress this dump)
v CICS system shutdowns
v CEMT PERFORM SNAP command
v The transaction abnormal termination code ASRA when an exception occurs in
an application program
v The transaction abnormal termination code ASRB when a system call is made
incorrectly in an application program.
You cannot prevent a dump from occurring when you use EXEC CICS DUMP
command or when an abnormal system termination occurs.
You can enable dump in the following ways:
1. Through settings in the Region Definitions and Transaction Definitions
(SysDump, ABDump, PCDump, and TransDump)
2. Through CEMT INQUIRE/SET DUMP and CEMT INQUIRE/SET
DUMPOPTIONS during runtime.
3. Through the dump request user exit. See the TXSeries for Multiplatforms
Administration Guide and the TXSeries for Multiplatforms Administration
Reference.
If you want to... Set the following ...
Enable dump when any of the following
occur:
v CICS shuts down abnormally
v CEMT PERFORM SNAP
v ASRA abend
v ASRB abend
SysDump(yes) or CEMT SET DUMP ON
Produce a CICS system dump after an ASRA
abend
SysDump(yes) or CEMT SET DUMP ON
plus either PCDump(yes) or CEMT SET
DUMPOPTIONS PCDUMP plus
TransDump(yes)
104 TXSeries for Multiplatforms: Problem Determination Guide
If you want to... Set the following ...
Produce a CICS system dump after an ASRB
abend
SysDump(yes) or CEMT SET DUMP ON
plus either ABDump(yes) or CEMT SET
DUMPOPTIONS ABDUMP plus
TransDump(yes)
Produce a dump of CICS resource definitions
and main storage areas that are related to a
task
EXEC CICS DUMP
See the TXSeries for Multiplatforms
Application Programming Reference for
information about the options that are
available on EXEC CICS DUMP.
Produce a CICS Transaction Dump after an
ASRB abend
In your Region Definitions, set ABDump=no
or CEMT SET DUMPOPTIONS NOABDUMP
together with TransDump=yes
Produce a CICS Transaction Dump after an
ASRA abend
In your Region Definitions, set PCDump=no
or CEMT SET DUMPOPTIONS NOPCDUMP
together with TransDump=yes.
See the TXSeries for Multiplatforms
Application Programming Guidefor information
about the options available on EXEC CICS
DUMP.
Formatting a dump
CICS provides a dump formatter, cicsdfmt, to convert the data that is written by the
dump facility into a form that can be written to the operating system standard
output.
cicsdfmt can be used to:
v List dump files with a particular base name, for a particular region, or in a
particular region
v Format dump files
v Delete dump files (this is useful for creating space on your file system)
See the TXSeries for Multiplatforms Administration Reference for details of the
syntax of cicsdfmt and examples of its use.
Dump file name
CICS names the dump file as:
aaaannnn.dmpmm
where:
aaaa
Indicates how the dump was started:
ASRA As a result of an ASRA abnormal termination.
ASRB As a result of an ASRB abnormal termination.
SYSA As a result of a SYSA abnormal termination.
SHUT From a shutdown request.
SNAP From a CEMT PERFORM SNAP DUMP request.
A four letter dumpcode
From an EXEC CICS DUMP command.
Chapter 14. Using CICS dump 105
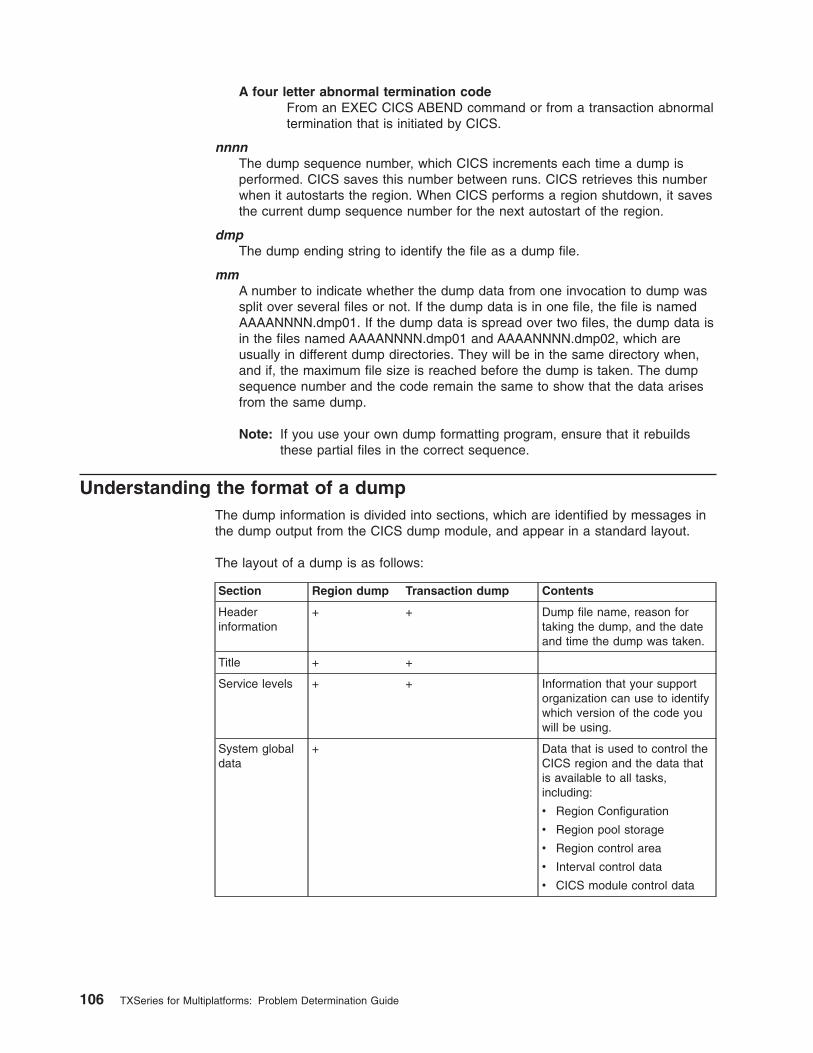
A four letter abnormal termination code
From an EXEC CICS ABEND command or from a transaction abnormal
termination that is initiated by CICS.
nnnn
The dump sequence number, which CICS increments each time a dump is
performed. CICS saves this number between runs. CICS retrieves this number
when it autostarts the region. When CICS performs a region shutdown, it saves
the current dump sequence number for the next autostart of the region.
dmp
The dump ending string to identify the file as a dump file.
mm
A number to indicate whether the dump data from one invocation to dump was
split over several files or not. If the dump data is in one file, the file is named
AAAANNNN.dmp01. If the dump data is spread over two files, the dump data is
in the files named AAAANNNN.dmp01 and AAAANNNN.dmp02, which are
usually in different dump directories. They will be in the same directory when,
and if, the maximum file size is reached before the dump is taken. The dump
sequence number and the code remain the same to show that the data arises
from the same dump.
Note: If you use your own dump formatting program, ensure that it rebuilds
these partial files in the correct sequence.
Understanding the format of a dump
The dump information is divided into sections, which are identified by messages in
the dump output from the CICS dump module, and appear in a standard layout.
The layout of a dump is as follows:
Section Region dump Transaction dump Contents
Header
information
+ + Dump file name, reason for
taking the dump, and the date
and time the dump was taken.
Title + +
Service levels + + Information that your support
organization can use to identify
which version of the code you
will be using.
System global
data
+ Data that is used to control the
CICS region and the data that
is available to all tasks,
including:
v Region Configuration
v Region pool storage
v Region control area
v Interval control data
v CICS module control data
106 TXSeries for Multiplatforms: Problem Determination Guide
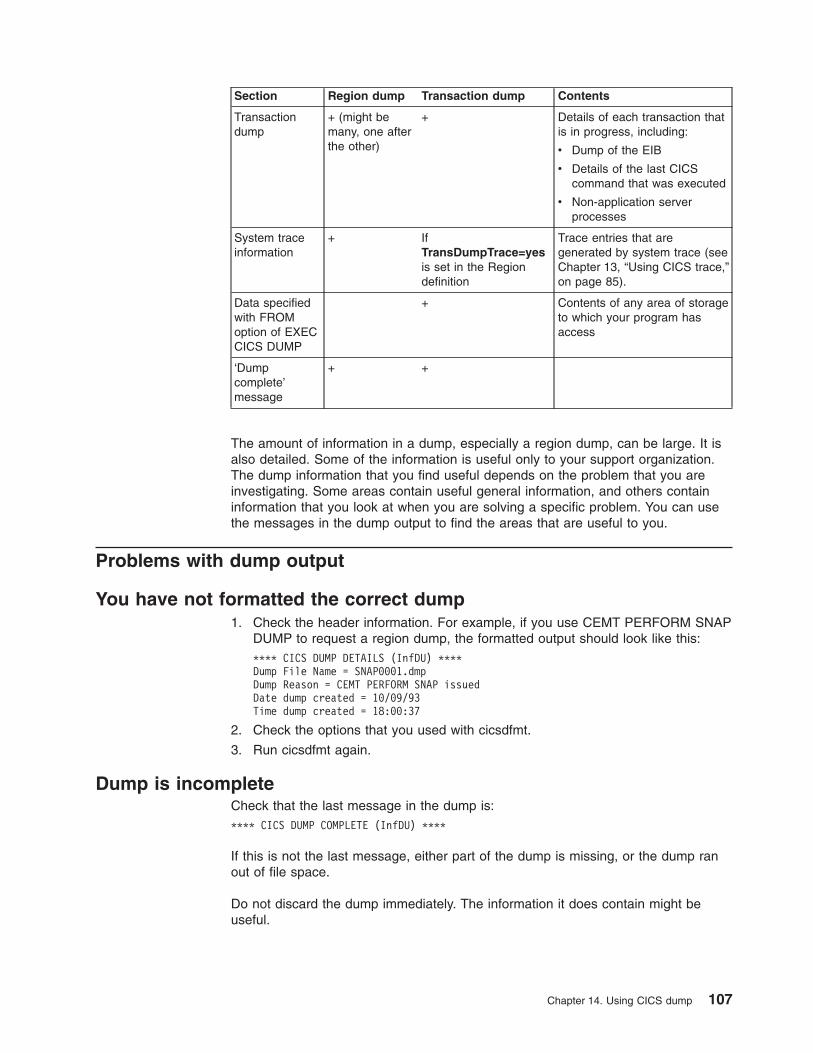
Section Region dump Transaction dump Contents
Transaction
dump
+ (might be
many, one after
the other)
+ Details of each transaction that
is in progress, including:
v Dump of the EIB
v Details of the last CICS
command that was executed
v Non-application server
processes
System trace
information
+ If
TransDumpTrace=yes
is set in the Region
definition
Trace entries that are
generated by system trace (see
Chapter 13, “Using CICS trace,”
on page 85).
Data specified
with FROM
option of EXEC
CICS DUMP
+ Contents of any area of storage
to which your program has
access
‘Dump
complete’
message
+ +
The amount of information in a dump, especially a region dump, can be large. It is
also detailed. Some of the information is useful only to your support organization.
The dump information that you find useful depends on the problem that you are
investigating. Some areas contain useful general information, and others contain
information that you look at when you are solving a specific problem. You can use
the messages in the dump output to find the areas that are useful to you.
Problems with dump output
You have not formatted the correct dump
1. Check the header information. For example, if you use CEMT PERFORM SNAP
DUMP to request a region dump, the formatted output should look like this:
**** CICS DUMP DETAILS (InfDU) ****
Dump File Name = SNAP0001.dmp
Dump Reason = CEMT PERFORM SNAP issued
Date dump created = 10/09/93
Time dump created = 18:00:37
2. Check the options that you used with cicsdfmt.
3. Run cicsdfmt again.
Dump is incomplete
Check that the last message in the dump is:
**** CICS DUMP COMPLETE (InfDU) ****
If this is not the last message, either part of the dump is missing, or the dump ran
out of file space.
Do not discard the dump immediately. The information it does contain might be
useful.
Chapter 14. Using CICS dump 107
You did not get a dump when an abnormal termination occurred
You might have experienced any of these problems:
v A transaction abnormally terminated, but you did not get a transaction dump.
v A transaction abnormally terminated and you got a transaction dump, but not a
system dump.
v A system abnormal termination occurred, but you did not get a system dump.
The three most likely reasons are:
v The transaction that abends does not request a dump in its HANDLE ABEND
routine.
v The definitions of the CICS region suppress dumping, for example:
– TransDump=no for a transaction which abended without a transaction dump
being taken.
v A system error prevents CICS from taking a dump, for example:
– No transaction or system dump files are available.
– An input or output error occurs on a transaction or a system dump file.
– Not enough space is available to write the dump in the dump file. For Open
Systems only,in this condition, create more directories below the dump
directory, so that if a directory is filled, the dump is written to the sequence of
files below the dump directory. You can use symbolic links to write data to
other file systems, for example, a tape drive.
Whether the dump formatting tool (cicsdfmt) can or cannot format the available data
depends on the areas that are missing from the dump.
For each system error, a message explains what has happened. See TXSeries for
Multiplatforms Messages and Codes for guidance on the action to take.
Some dump IDs were missing from the sequence of dumps
CICS keeps a count of the number of times that it takes a dump during the current
run, and CICS includes the count as part of the dump ID that it gives at the start of
the dump.
If CICS takes both a transaction dump and a system dump in response to the event
that started the dump, it gives the same dump ID to both. However, if CICS takes
only a transaction dump or only a system dump, the dump ID is unique to that
dump.
The complete range of dump IDs for any run of CICS is, therefore, distributed
between the set of system dumps and the set of transaction dumps, but neither set
of dumps has them all.
You did not get the correct data from a system dump
If you do not get the correct data formatted from a CICS system dump, the
following are possible reasons:
v You have used the wrong release level of the CICS dump formatting program
(cicsdfmt).
v The file data was damaged (for example, another person has manipulated the
data in the dump).
v A storage violation has corrupted dump data.
108 TXSeries for Multiplatforms: Problem Determination Guide
Interpreting the dump
This section tells you what to look for in a dump to help solve a CICS problem.
You have a problem with the region configuration
1. Take a region dump.
2. Search for structures that have the name IEntry. One IEntryexists for each CICS
definition. They contain configuration data and data that is specific to the
resource type. For example, a terminal (TE) IEntry shows details of the
signed-on user for that terminal.
Transaction does not run
1. Take a region dump.
2. Look in the Scheduler (ConTS) section. From this you can see which
transactions are running in the region, which transactions are queued in the
region, whether a transaction class has reached its maximum and whether the
MaxServer limit has been reached.
3. If some transactions are queued or waiting to run, see “Different types of loop”
on page 33.
4. If the problem is with a particular transaction, search for its transaction dump.
5. Determine whether the problem is in CICS code, or in application code:
v To determine whether a problem is in CICS code, look at the field labeled
UserMode in the Task Control Area (TCA). You can find the TCA by searching
for the string “Task Control Area Task specific part”.
If the problem is in CICS code, look at the EIB. This shows the command
that is being executed at the time of the dump, which can indicate what to
investigate next.
v If the problem is in application code, you must investigate the transaction
itself, and correct the problem.
If the transaction is not running or queued, check how the transaction was
submitted, and what you expected it to do. Possibly the transaction has
already completed, but has not produced the output you expected.
6. If you start a transaction by Automatic Transaction Initiation (ATI) and the
transaction does not start, search the region dump for the string “Interval
Control Structure (ICE)” to look at the outstanding requests. One structure exists
for each request. They show whether a transaction is ready to run or has
expired. Possibly you specified an incorrect delay and the delay has not yet
expired.
7. If you still cannot find the problem, keep the dump for your support organization.
CICS terminated abnormally
1. Look at the error messages in stderr, console.nnnnnn and CSMT. The error
messages can indicate what to look for in the dump, and you can use keywords
from the error messages to search the dump.
2. Investigate any areas of storage that have been corrupted.
You have a problem in an application
1. Use the EXEC CICS DUMP command to get a transaction dump.
2. Use the FROM option to dump specific areas of storage and check whether
they have the data that you expect.
3. Check that the CWA contains the data that you expect.
Chapter 14. Using CICS dump 109
A storage violation occurred
Check which programs or transactions were active in the region when the violation
occurred.
A transaction terminated abnormally
1. Determine the meaning of the abend code by referring to the TXSeries for
Multiplatforms Messages and Codes book. The areas of importance in the dump
depend on the abend type.
2. Search the dump for the string “EXEC Interface Block”. The EIB contains the
EIBflags and the last command that was attempted before the abnormal
termination occurred. Look for the string “cics_args”.
3. Search the dump for the string “Task Control Area Task specific part”, which
shows the control information for a task.
General program information in the dump
The name of the failing transaction is shown near the start of the dump, labeled
’Transaction Id’.
The process identifier of the transaction is shown by the label ’AIX process ID’; this
can be used to identify trace entries that relate to this transaction (main trace
buffers can be included in a transaction dump by setting the Region Definition
attribute TransDumpTrace=yes). The Program Control area of the dump is under
the following header:
**** Start of PROGRAM CONTROL MODULE Transaction Dump (TasPR) ****
Within this area:
v The name of the current CICS program (one which has a CICS Program
Definition) is shown under the header ’Program Control Information:’, labeled
’Program Name’.
v The full path name of the file which was loaded and contains the active program
is also under the ’Program Control Information:’ header, and is labeled: ’Program
full path name’.
v This area also indicates whether the program is cached (by the label ’Value of
Resident attribute’).
v The loaded program is dumped by the label ’Program Code’ and the program’s
data area is dumped by the label: ’Program Data:’; use of eyecatchers in the
program local variables can aid in locating variable values in this dumped
storage.
v The last active EXEC CICS command is formatted and dumped by the label:EXEC CICS command string:
the values that are passed by the application program are shown in the output, for
example:
EXEC CICS command string:
Buffer Address = 0x2ff1e430
EXEC CICS SEND TEXT
TEXT
FROM (X’20A16CB0’)
LENGTH (12)
ERASE
110 TXSeries for Multiplatforms: Problem Determination Guide
The above example can be found just above this output in the dump, in the
’Program Data’ area, because it points to a local variable in the application
program.
The next section, headed ’cics_args’, shows more detail of the current EXEC CICS
command. If the program was prepared with the -d option on cicstran or cicstc,
the line number of the current EXEC CICS command in the application source file is
shown by the label ’CEDF line number’. Below this the programming language is
shown, by the label ’Programming language’.
Abends caused by Conditions from EXEC CICS commands
A transaction can sometimes cause multiple abends. It could be important to know
when the first abend occurs that is caused by the transactions. It could be important
also to know in which program that abend occurred. In such cases, the
console.nnnnnn indicates that first abend, and the actual abend.
If the abend results from a bad parameter on an EXEC CICS call, for example,
abend ’AEIV’, which can result from the ’LENGERR’ condition from many EXEC
CICS commands, examine the parameters that were passed to CICS by the
application program. These can be found in the section of the transaction dump
headed:
**** Start of PROGRAM CONTROL MODULE Transaction Dump (TasPR) ****
The command is formatted with the values that the application passed to CICS.
Below this is an area headed ’cics_args’, which is formatted output of the data
structure that is generated in the application program when it is prepared, and used
to pass the details of each EXEC CICS command to CICS when the application is
run. The item ’CEDF line number’ in this data structure gives the line number of the
most recent EXEC CICS command in the CICS source file, if the program was
prepared with the -d option on cicstc or cicstran.
Analysis of A158 abends
If a signal is raised in CICS code, this generates an A158 abend. This can happen
if a bad parameter is passed to CICS on an EXEC CICS call, so if you get a
transaction dump from an A158 abend, check the EXEC CICS command
parameters in the CICS API MODULE section of the dump to see whether one of
them could be the cause of the problem; for example the application could be
passing a bad pointer value to CICS which then tries to write to storage at that bad
address. If the parameters that are passed to CICS appear to be valid, contact your
support organization for assistance with this problem. Retain the dump because it
might useful to them.
Analysis of ASRA Abends
If the abend results from a signal’s being raised in the application code itself (this
results in an abend code of ASRA or ASRB), for example if the application code
tries to write to an invalid storage location, stack, offset and register information,
which might be useful, is available in the transaction dump. Use this information in
conjunction with assembly listings that were produced when the program was
prepared, either through use of the -s option on cicstcl, or through use of the
compiler option -qlist. If an assembly listing was not obtained when the program
was prepared for CICS, one can be generated at a later date provided that the
program source has not changed and that the software levels (AIX, compiler and
CICS) are the same.
Chapter 14. Using CICS dump 111
Near the start of the dump is the following section, which shows which transaction
caused the abend and gives details of the stack at the time of the abend:
**** START OF TRANSACTION DUMP ****
Application Server id = 103
Transaction Id = ilad
User Name = CICSUSER
Details of function being executed: 0x2ff1e640
Function Name = main
Service Level =
Offset of current instruction = 0x16c
Called by function = PinCA_StartC
from offset = 0x29c
Called by function = TasPR_CallApplication
from offset = 0x758
Called by function = TasPR_RunProgram
from offset = 0x17c0
Called by function = TasPR_RunProgram
from offset = 0x17c0
Called by function = TasPR_IRun
from offset = 0x1bd0
Called by function = TasTA_Exec
from offset = 0x2ccc
Called by function = TasTA_Run
from offset = 0x2790
Called by function = main
from offset = 0xe80
The Transaction Identifier (transid) is shown (in this example it is ″ilad″), but
because this is a C application, the current program name is not included in this
section. It occurs later in the dump. The stack details show that the current function
is named ″main″, and it is identified as a C program by the CICS function that
called it - ″PinCA_StartC″. APinCA_Start* function exists for each supported
language:
PinCA_StartC - C applications
PinCA_StartCpp - C++ applications
PinCA_StartIBMCob - IBM Cobol applications
PinCA_StartIBMPli - IBM PL/I applications
PinCA_StartCob - MF Cobol applications
The application programming language is also specified later in the dump. ASRA
abends can result from the wrong language support being used by CICS. This can
happen if the program filename extension is included in the Program Definition
’PathName’value; for example, the C++ application program that is contained in the
file ’cppapp1.ibmcppv should have a PathName of ’/cppapp1’. If the PathName is
set to ’/cppapp1.ibmcpp, it is run with C language support instead of C++ support;
this is seen in the stack, which includes PinCA_StartC instead of PinCA_StartCpp.
This problem is easily solved by removing the .ibmcpp file suffix from the PathName
value.
The ″Offset of current instruction″ (in this case ″0x16c″) gives the offset at which
the program was executing when the abend occurred. This is generally the last
successful instruction. The instruction that follows it is the one that generated the
112 TXSeries for Multiplatforms: Problem Determination Guide
abend. Below is a section of the assembly listing of the application that is used in
this example (’illadr.lst’, generated by using the -s option on ’cicstcl), which
includes these offsets:
61| 000150 cal 389D0000 1 LR gr4=gr29
61| 000154 st 90810078 1 ST4A c(gr1,120)=gr4
62| 000158 l 80610074 1 L4A gr3=b(gr1,116)
62| 00015C bla 48000003 0 LDIV gr3,gr4=gr3,gr4,mq",gr0",lr"
62| 000160 st 90610070 2 ST4A a(gr1,112)=gr3
64| 000164 cal 389D0000 1 LR gr4=gr29
64| 000168 st 9081007C 1 ST4A point(gr1,124)=gr4
65| 00016C cal 3860000A 1 LI gr3=10
65| 000170 st 90640000 1 ST4A (*)long(gr4,0)=gr3
70| 000174 cal 387F0000 1 LR gr3=gr31
70| 000178 st 907E0084 1 ST4A CicsArgs.DataArea(gr30,132)=gr3
71| 00017C cal 38600012 1 LI gr3=18
The source line numbers are in the first column, and the hex offsets in the second
column, so it can be seen that offsets x’16c’ and x’170v are generated from source
code line number 65. The source line numbers in the assembly listing refer to the
compiler source file (’filename.c’ for a C application, ’filename.C’for C++ and
’filename.cbl’ for IBM Cobol), not to the CICS source file. Use of the ’-s’ option on
’cicstcl’ causes retention of the compiler source file to allow for its use in debugging.
It might be enough to examine the source code and fix the problem from this
information. However, the following section in the dump gives the values of the
general purpose registers at the time of the abend, which might be of additional
value when debugging programs. The register area in the example dump is shown
below:
General Purpose Registers set when signal raised
Buffer Address = 0xf0c3b31c
GPR0 = 2022852C GPR1 = 2FF1EA50
GPR2 = 20848438 GPR3 = 0000000A
GPR4 = 00000000 GPR5 = 00000000
GPR6 = 02000000 GPR7 = 00000000
GPR8 = 00000000 GPR9 = 00000000
GPR10 = 00000000 GPR11 = 60000666
GPR12 = D01AA264 GPR13 = A007229C
GPR14 = 00000000 GPR15 = D2878A70
GPR16 = 00000004 GPR17 = A007211C
GPR18 = 0000010F GPR19 = 00000000
GPR20 = A00BEC70 GPR21 = F0BEB1DC
GPR22 = F0BF3AF8 GPR23 = D052A27C
GPR24 = 20757598 GPR25 = 00000000
GPR26 = 00000001 GPR27 = 00000002
GPR28 = 20000000 GPR29 = 00000000
GPR30 = 20848450 GPR31 = D01AA408
The instruction at offset xv170’is a ’store’ of the contents of register 3 into the
address in register 4. The dumped register contents above show that register 4
contains ’00000000’; therefore, this instruction has produced a segmentation
violation. The source code is as follows:
long * point;
point = 0; /* line number 64 */
*point = 10; /* line number 65 */
This is a simple example but shows the use of the dump information.
ASRA or ASRB abends are caused by an exception or a signal that is in the
application code but could leave the application server process unusable or corrupt.
For example, the application code or third-party library components might overwrite
Chapter 14. Using CICS dump 113
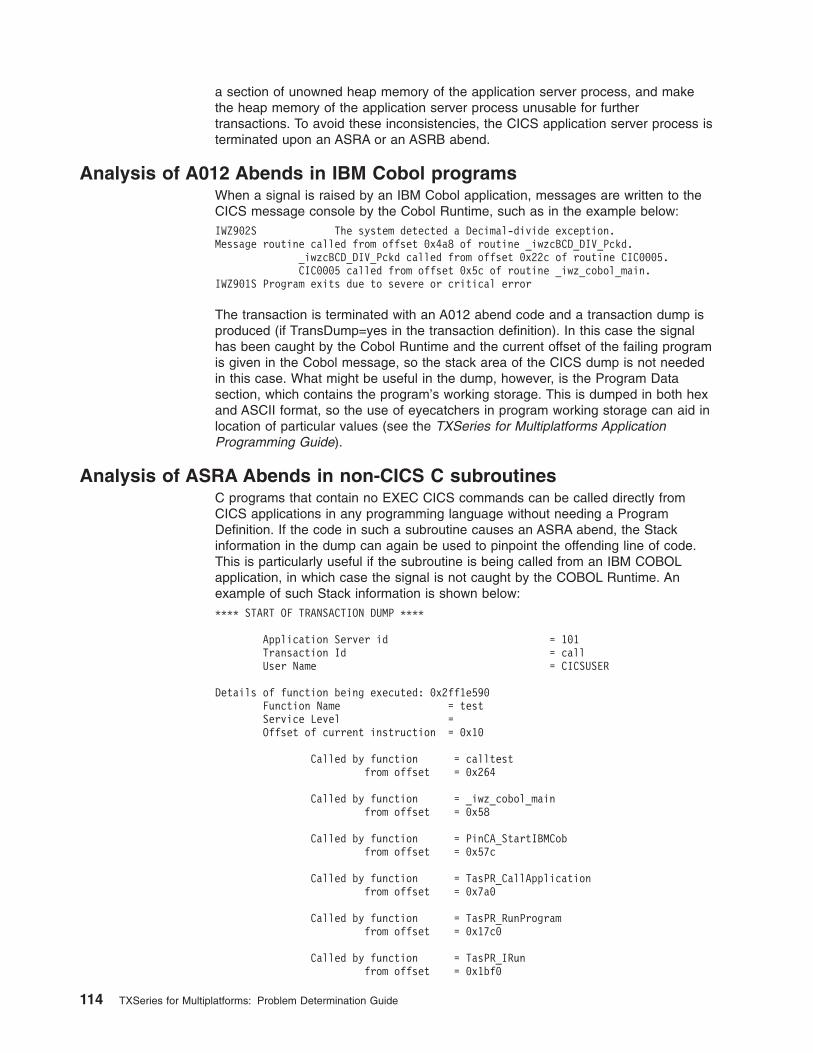
a section of unowned heap memory of the application server process, and make
the heap memory of the application server process unusable for further
transactions. To avoid these inconsistencies, the CICS application server process is
terminated upon an ASRA or an ASRB abend.
Analysis of A012 Abends in IBM Cobol programs
When a signal is raised by an IBM Cobol application, messages are written to the
CICS message console by the Cobol Runtime, such as in the example below:
IWZ902S The system detected a Decimal-divide exception.
Message routine called from offset 0x4a8 of routine _iwzcBCD_DIV_Pckd.
_iwzcBCD_DIV_Pckd called from offset 0x22c of routine CIC0005.
CIC0005 called from offset 0x5c of routine _iwz_cobol_main.
IWZ901S Program exits due to severe or critical error
The transaction is terminated with an A012 abend code and a transaction dump is
produced (if TransDump=yes in the transaction definition). In this case the signal
has been caught by the Cobol Runtime and the current offset of the failing program
is given in the Cobol message, so the stack area of the CICS dump is not needed
in this case. What might be useful in the dump, however, is the Program Data
section, which contains the program’s working storage. This is dumped in both hex
and ASCII format, so the use of eyecatchers in program working storage can aid in
location of particular values (see the TXSeries for Multiplatforms Application
Programming Guide).
Analysis of ASRA Abends in non-CICS C subroutines
C programs that contain no EXEC CICS commands can be called directly from
CICS applications in any programming language without needing a Program
Definition. If the code in such a subroutine causes an ASRA abend, the Stack
information in the dump can again be used to pinpoint the offending line of code.
This is particularly useful if the subroutine is being called from an IBM COBOL
application, in which case the signal is not caught by the COBOL Runtime. An
example of such Stack information is shown below:
**** START OF TRANSACTION DUMP ****
Application Server id = 101
Transaction Id = call
User Name = CICSUSER
Details of function being executed: 0x2ff1e590
Function Name = test
Service Level =
Offset of current instruction = 0x10
Called by function = calltest
from offset = 0x264
Called by function = _iwz_cobol_main
from offset = 0x58
Called by function = PinCA_StartIBMCob
from offset = 0x57c
Called by function = TasPR_CallApplication
from offset = 0x7a0
Called by function = TasPR_RunProgram
from offset = 0x17c0
Called by function = TasPR_IRun
from offset = 0x1bf0
114 TXSeries for Multiplatforms: Problem Determination Guide
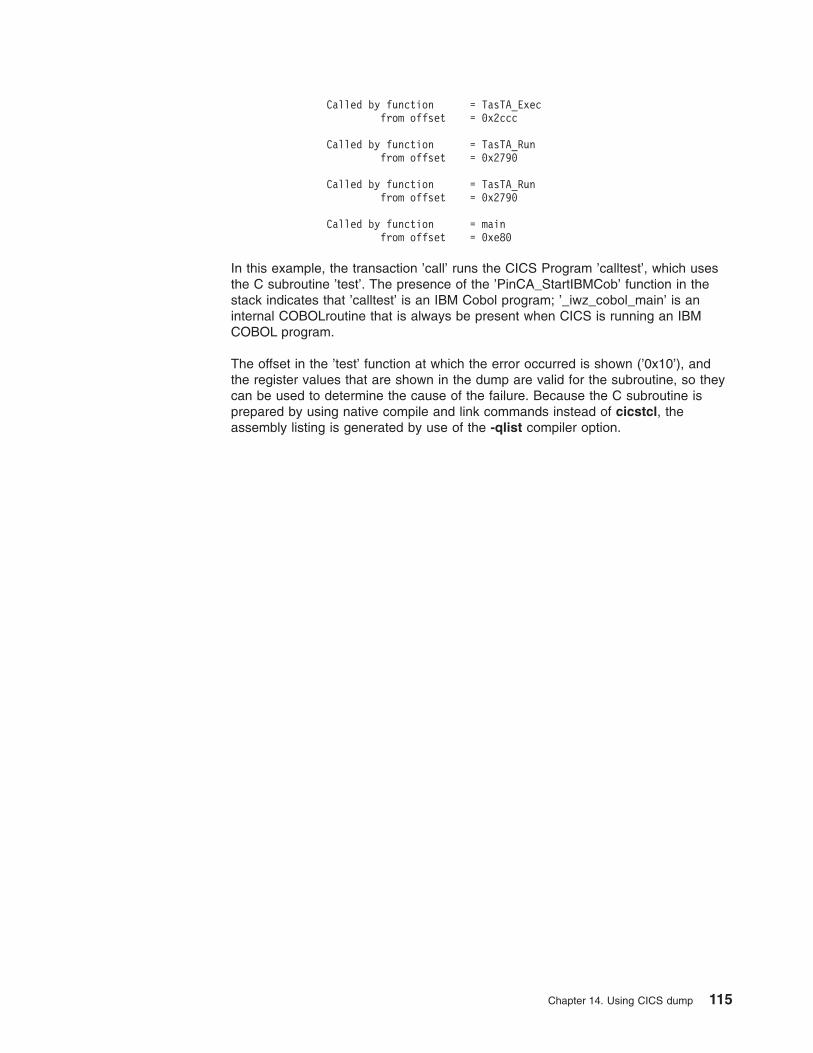
Called by function = TasTA_Exec
from offset = 0x2ccc
Called by function = TasTA_Run
from offset = 0x2790
Called by function = TasTA_Run
from offset = 0x2790
Called by function = main
from offset = 0xe80
In this example, the transaction ’call’ runs the CICS Program ’calltest’, which uses
the C subroutine ’test’. The presence of the ’PinCA_StartIBMCob’ function in the
stack indicates that ’calltest’ is an IBM Cobol program; ’_iwz_cobol_main’ is an
internal COBOLroutine that is always be present when CICS is running an IBM
COBOL program.
The offset in the ’test’ function at which the error occurred is shown (’0x10’), and
the register values that are shown in the dump are valid for the subroutine, so they
can be used to determine the cause of the failure. Because the C subroutine is
prepared by using native compile and link commands instead of cicstcl, the
assembly listing is generated by use of the -qlist compiler option.
Chapter 14. Using CICS dump 115

116 TXSeries for Multiplatforms: Problem Determination Guide
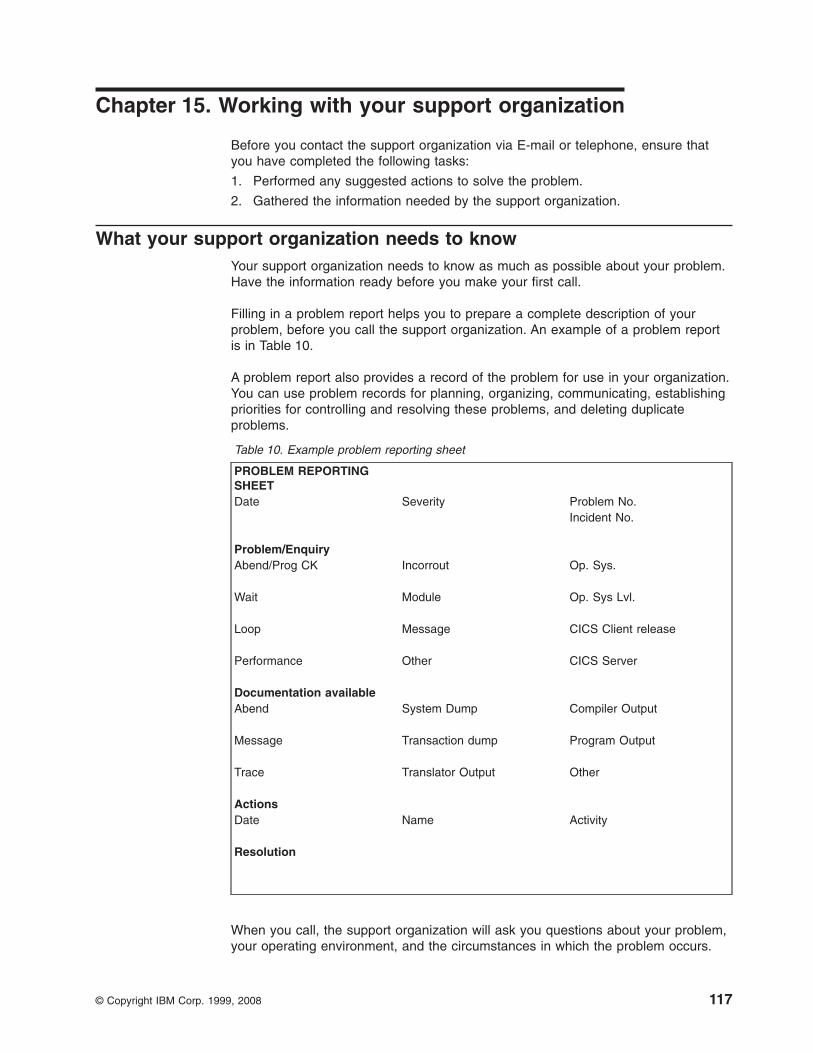
Chapter 15. Working with your support organization
Before you contact the support organization via E-mail or telephone, ensure that
you have completed the following tasks:
1. Performed any suggested actions to solve the problem.
2. Gathered the information needed by the support organization.
What your support organization needs to know
Your support organization needs to know as much as possible about your problem.
Have the information ready before you make your first call.
Filling in a problem report helps you to prepare a complete description of your
problem, before you call the support organization. An example of a problem report
is in Table 10.
A problem report also provides a record of the problem for use in your organization.
You can use problem records for planning, organizing, communicating, establishing
priorities for controlling and resolving these problems, and deleting duplicate
problems.
Table 10. Example problem reporting sheet
PROBLEM REPORTING
SHEET
Date Severity Problem No.
Incident No.
Problem/Enquiry
Abend/Prog CK Incorrout Op. Sys.
Wait Module Op. Sys Lvl.
Loop Message CICS Client release
Performance Other CICS Server
Documentation available
Abend System Dump Compiler Output
Message Transaction dump Program Output
Trace Translator Output Other
Actions
Date Name Activity
Resolution
When you call, the support organization will ask you questions about your problem,
your operating environment, and the circumstances in which the problem occurs.
© Copyright IBM Corp. 1999, 2008 117
About the problem
v Is it a new problem or a further call on an existing problem?
v Brief description of the problem
v Severity of the problem:
1. You cannot use CICS, which results in a critical condition that needs
immediate attention
2. You can use CICS, but that operation is severely restricted
3. You can use CICS, but with limited functions. However, the problem is not
critical to your overall operation.
v Are there any relevant messages in the server’s:
– console.nnnnnn
– CSMT.out
– symrecs file
About your environment
v Version and release number of:
– CICS
– Operating system
v Is the CICS server running? (enter ps -eaf | grep sfs)
v Are all CICS, operating system, environment variables set according to the
installation instructions?
v What is the physical memory size, and the page space usage?
About the circumstances
v Are any file systems full?
v What has changed since the system last worked, for example:
– Changes in level of the operating system or related products (for example,
databases)
– Patches applied
– PTFs installed
– Additional features that are used
– Application programs changed
– Unusual user action.
Sending documentation to the support organization
Use the cicsservice tool to collate the diagnostic information needed by the
support organization. The information is compressed into a single file.
The cicsservice tool collates the following information for you:
v Region information:
– The console.nnnnnn file.
– The symrecs.nnnnnn file.
– The console.msg file.
– The console.nam and symrecs.nam files.
– The regionname.env file.
– The cicspid.traceback files.
– The core.timestamp.fmt files (On CICS on Open Systems).
– The permanent database stanza definitions.
118 TXSeries for Multiplatforms: Problem Determination Guide
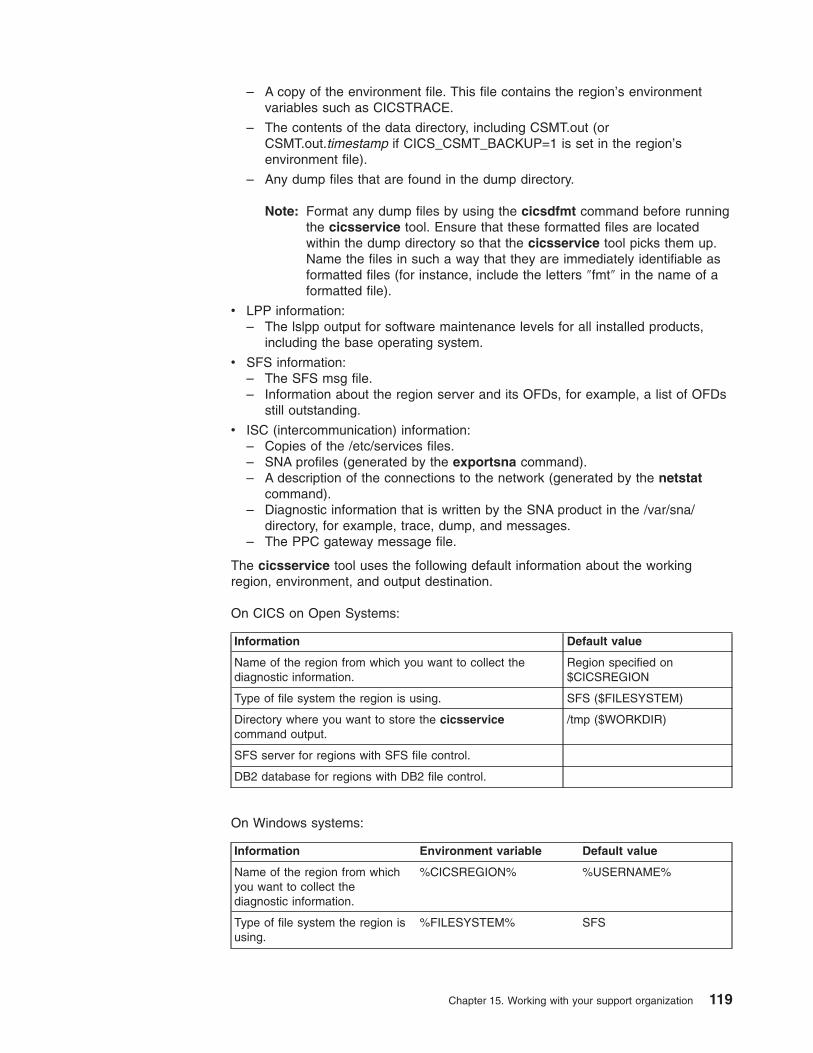
– A copy of the environment file. This file contains the region’s environment
variables such as CICSTRACE.
– The contents of the data directory, including CSMT.out (or
CSMT.out.timestamp if CICS_CSMT_BACKUP=1 is set in the region’s
environment file).
– Any dump files that are found in the dump directory.
Note: Format any dump files by using the cicsdfmt command before running
the cicsservice tool. Ensure that these formatted files are located
within the dump directory so that the cicsservice tool picks them up.
Name the files in such a way that they are immediately identifiable as
formatted files (for instance, include the letters ″fmt″ in the name of a
formatted file).
v LPP information:
– The lslpp output for software maintenance levels for all installed products,
including the base operating system.
v SFS information:
– The SFS msg file.
– Information about the region server and its OFDs, for example, a list of OFDs
still outstanding.
v ISC (intercommunication) information:
– Copies of the /etc/services files.
– SNA profiles (generated by the exportsna command).
– A description of the connections to the network (generated by the netstat
command).
– Diagnostic information that is written by the SNA product in the /var/sna/
directory, for example, trace, dump, and messages.
– The PPC gateway message file.
The cicsservice tool uses the following default information about the working
region, environment, and output destination.
On CICS on Open Systems:
Information Default value
Name of the region from which you want to collect the
diagnostic information.
Region specified on
$CICSREGION
Type of file system the region is using. SFS ($FILESYSTEM)
Directory where you want to store the cicsservice
command output.
/tmp ($WORKDIR)
SFS server for regions with SFS file control.
DB2 database for regions with DB2 file control.
On Windows systems:
Information Environment variable Default value
Name of the region from which
you want to collect the
diagnostic information.
%CICSREGION% %USERNAME%
Type of file system the region is
using.
%FILESYSTEM% SFS
Chapter 15. Working with your support organization 119
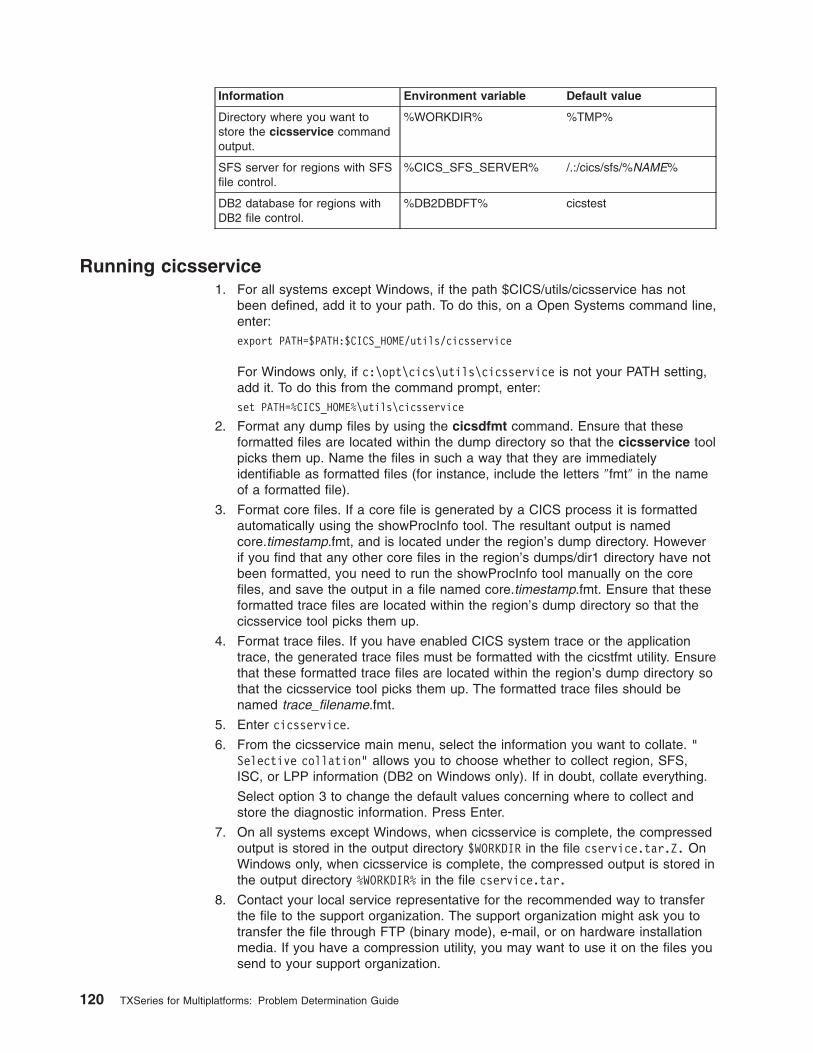
Information Environment variable Default value
Directory where you want to
store the cicsservice command
output.
%WORKDIR% %TMP%
SFS server for regions with SFS
file control.
%CICS_SFS_SERVER% /.:/cics/sfs/%NAME%
DB2 database for regions with
DB2 file control.
%DB2DBDFT% cicstest
Running cicsservice
1. For all systems except Windows, if the path $CICS/utils/cicsservice has not
been defined, add it to your path. To do this, on a Open Systems command line,
enter:
export PATH=$PATH:$CICS_HOME/utils/cicsservice
For Windows only, if c:\opt\cics\utils\cicsservice is not your PATH setting,
add it. To do this from the command prompt, enter:
set PATH=%CICS_HOME%\utils\cicsservice
2. Format any dump files by using the cicsdfmt command. Ensure that these
formatted files are located within the dump directory so that the cicsservice tool
picks them up. Name the files in such a way that they are immediately
identifiable as formatted files (for instance, include the letters ″fmt″ in the name
of a formatted file).
3. Format core files. If a core file is generated by a CICS process it is formatted
automatically using the showProcInfo tool. The resultant output is named
core.timestamp.fmt, and is located under the region’s dump directory. However
if you find that any other core files in the region’s dumps/dir1 directory have not
been formatted, you need to run the showProcInfo tool manually on the core
files, and save the output in a file named core.timestamp.fmt. Ensure that these
formatted trace files are located within the region’s dump directory so that the
cicsservice tool picks them up.
4. Format trace files. If you have enabled CICS system trace or the application
trace, the generated trace files must be formatted with the cicstfmt utility. Ensure
that these formatted trace files are located within the region’s dump directory so
that the cicsservice tool picks them up. The formatted trace files should be
named trace_filename.fmt.
5. Enter cicsservice.
6. From the cicsservice main menu, select the information you want to collate. “
Selective collation” allows you to choose whether to collect region, SFS,
ISC, or LPP information (DB2 on Windows only). If in doubt, collate everything.
Select option 3 to change the default values concerning where to collect and
store the diagnostic information. Press Enter.
7. On all systems except Windows, when cicsservice is complete, the compressed
output is stored in the output directory $WORKDIR in the file cservice.tar.Z. On
Windows only, when cicsservice is complete, the compressed output is stored in
the output directory %WORKDIR% in the file cservice.tar.
8. Contact your local service representative for the recommended way to transfer
the file to the support organization. The support organization might ask you to
transfer the file through FTP (binary mode), e-mail, or on hardware installation
media. If you have a compression utility, you may want to use it on the files you
send to your support organization.
120 TXSeries for Multiplatforms: Problem Determination Guide
Preparing additional information
The support organization might ask you to send some information in addition to the
output of the cicsservice tool. Such information can include:
v Details of any patches applied
v Application programs and the BMS maps that are used with the program
v Data or databases
v Output of utilities
You can reduce the time it takes to resolve a problem if you can send to the
support organization a small test case to recreate the problem. If the problem
involves large databases or complex processes, this action might not be possible.
If you upload files to a mainframe system, upload them in binary rather than ASCII
format.
Compress information before sending it to the support organization by performing
the following steps:
v On CICS on Open Systems:
1. Tar the files by entering the following command:
tar cvf /target_file_pathname.tar files to include
The value target_file_pathname is the absolute path to the target _file. The
value files to include represents all of the files to be included in the tar file.
The output is stored in the file target_file.tar.
2. Compress the resulting tar file target_file.tar by entering the following
command:
compress target_file.tar
The output is stored in the file target_file.tar.Z.
v On Windows systems:
1. With a file-archiving tool, create an archive file in zip format.
2. Add to this archive in compressed state all files to be sent to the support
organization.
Receiving a solution to the problem
The support organization supplies solutions to problems in the product code in the
following ways:
v Patches
A patch is a temporary fix. There is no guarantee that the fix will be made
generally available as a Program Temporary Fix (PTF). It helps if you apply the
patch and feedback the results to your support organization as soon as possible
so that the patch can be added to the PTF.
v Program Temporary Fix (PTF) (on Open Systems)
A PTF is a fully-supported fix to a customer problem. Several PTFs are made
into a PTF set. The fileset number of the CICS lpps identifies a PTF set. A PTF
set refreshes the lpp’s that make the CICS product, replacing files in /usr/lpp/cics.
v FixPacks (on Windows only)
Each FixPack may contain several APAR fixes. If an individual APAR fix within a
FixPack is found to be in error, it may still be advisable to apply the FixPack to
obtain the other fixes.
Chapter 15. Working with your support organization 121
In time, a formal FixPack (previously called a Corrective Service Diskette) is
made available. You can order the FixPack through your support organization.
Details on how to apply fixes are supplied with the FixPack.
Applying a patch
1. Unpack the compressed file sent by the support organization. For example,
uncompress filename.tar.Z
tar xcf /file path.tar
2. Read the README file supplied. This file tells you which product files will be
rebuilt and how to apply the patch.
3. If the patch does not fix the problem, tell your support organization.
Applying a PTF or FixPack
1. Unpack the compressed file sent by the support organization. For example:
uncompress filename.tar.Z
tar xcf /file path.tar
2. Read the README supplied. This file tells you how to apply the PTF (or
FixPack for Windows) and enables you to plan for any special actions.
3. Install the PTF (or FixPack for Windows).
4. After you have installed the PTF or FixPack:
v Do any actions that are recommended in the README.
v For all systems, run cicssetupclients as described in the TXSeries for
Multiplatforms Administration Guide.
v For all systems except Windows, run cicsmkcobol as described in the
TXSeries for Multiplatforms Administration Reference.
5. Contact your support organization if you experience any problems after you
have installed the PTF.
122 TXSeries for Multiplatforms: Problem Determination Guide
Appendix. CICS module identifiers
CICS assigns a number, called the module identifier, to each of its internal modules.
This number is used to generate message numbers and abend codes. For
example, module identifier 10 belongs to a module called ConCO, and messages
that begin ERZ010... and abend codes that begin A10... or U10... are all generated
by ConCO. (See TXSeries for Multiplatforms Messages and Codes.)
The module identifier is also used in the format and control of trace output. The
TraceSystemSpec attribute in the Region Definitions (RD) takes a list of module
names (not the numeric identifiers). CICS uses this list to control which module or
modules produce trace. The module identifier is also used in generating the trace
hook identifier for certain types of system trace. For further information, see
Chapter 13, “Using CICS trace,” on page 85.
The modules used in CICS can be grouped into functional areas, and are listed as
follows:
CICS API modules
01 PinCA CICS API Module
02 PinCV Data Conversion For Function Shipping
03 PinCI Command Interpreter/Syntax Checker
04 PinPR Command Language Translator
05 PinBM BMS Map Translator
06 PinDA Screen Design Aid (Open systems only)
104 PinDB Debug Control Module
Terminal modules
11 TerSH CICS Replaceable Shell Module
12 TerBY CESN and CESF Supplied Transactions
18 TerTL Telnet Server Support
33 TerEP EPI Interface Module
62 TerBM Terminal Support Module
64 TerEC ECI Component
97 TerEM Portable 3270 emulator (On CICS for AIX only)
98 TerLD External API for new 3270 emulator (On CICS for AIX only)
99 TerKD CICS TTY line discipline for 3270 emulation (On CICS for AIX only)
100 TerNT EPI based CICS terminal (On CICS for AIX only)
Data control modules
21 DamFI File Control Module
22 DamTD Transient Data Module
23 DamTS Temporary Storage Module
24 DamJO Journals Module
25 DamFS File Service Module
26 DamBR CEBR Supplied Transaction
82 DamDB File Service Module - DB2 Interface
101 DamFH File Service Module - External File Handler Interface
Task control modules
14 TasTA Task Control Module
15 TasPR Program Control Module
© Copyright IBM Corp. 1999, 2008 123
16 TasLU Logical Units of Work Module
17 TasCO Conditions Control Module
19 TasED CEDF Supplied Transaction
Communications modules
27 ComFS Function Shipping Module
28 ComTR Transaction Routing Module
29 ComDP Distributed Transaction Processing Module
30 ComSU Communications Support Module
31 ComCR CRTE Supplied Transaction
32 ComRS Remote Scheduler Module
41 ComRL RPC Listener Scheduler
42 ComCL Common Client Support
43 ComDL Common Decision Layer
44 ComIP TCPIP
61 ComLQ Local Queueing Module
63 ComSN Local SNA Services
109 ComLU FEPI LU0
Control modules
07 ConTI Interval Control Module
10 ConCO CICS Control Module
39 ConTS Transaction Scheduler
CICS storage modules
47 StoTA Task Private Storage Control Module
48 StoRE Region Storage Control Module
60 StoMA Storage Control Module
CICS support modules
40 SupTM Threading Module
56 SupPR Primitives Module
57 SupER Error Support Module
58 SupOS Operating System Specifics Module
59 SupPK Generic packaging module
66 SupSC Scripted Shell test tool
67 SupBU Product release build tool
85 SupIV cicsivp
86 SupTR Trace And Dump Support Module
107 (Windows)
SupLM License Manager Module
CICS information modules
13 InfTF Product Trace File Formatting Module
20 InfOD Online Documentation Module
49 InfTR Product Trace Module
50 InfEV Event Monitoring Module
51 InfST Statistics Gathering Module
52 InfDU Dump Module
53 InfCS Statistics Monitoring Module
54 InfDF Dump Formatter Module
55 InfSF Statistics Formatter Module
65 InfMF Event Monitoring File Formatting Module
124 TXSeries for Multiplatforms: Problem Determination Guide
Region database modules
34 RegDC Region Database Class Module
45 RegSE Region Security Module
46 RegRM Resource Management Module
69 RegCO Communications Class Module
68 RegYY Communications Class Module
70 RegFI Files Class Module
71 RegJO Journals Class Module
72 RegMO Monitoring Class Module
73 RegPR Programs Class Module
74 RegRE Region Class Module
75 RegTD TDQs Class Module
76 RegTE Terminals Class Module
77 RegTR Transactions Class Module
78 RegTS TSQs Class Module
79 RegUS Users Class Module
80 RegXA Product Definitions (XAD) Class Module
81 RegGA Gateway Class Module
83 RegSC Schema File Stanza Class Module
84 RegSF SFS Server Stanza Class Module
87 RegLI Listener Class Module
88 RegGY Region Database for the Gateway Server
Administration modules
35 AdmGY Administration for the PPC Gateway Server
36 AdmLG Log Server Admin Module
37 AdmSC Schema Admin Module
38 AdmSF SFS Server Admin Module
96 AdmSA Overall system administration
102 AdmDB DB2 File Control Administration Module
Appendix. CICS module identifiers 125

126 TXSeries for Multiplatforms: Problem Determination Guide
Notices
This information was developed for products and services offered in the U.S.A. IBM
may not offer the products, services, or features discussed in this document in other
countries. Consult your local IBM representative for information on the products and
services currently available in your area. Any reference to an IBM product, program,
or service is not intended to state or imply that only that IBM product, program, or
service may be used. Any functionally equivalent product, program, or service that
does not infringe any IBM intellectual property right may be used instead. However,
it is the user’s responsibility to evaluate and verify the operation of any non-IBM
product, program, or service.
IBM may have patents or pending patent applications covering subject matter
described in this document. The furnishing of this document does not give you any
license to these patents. You can send license inquiries, in writing, to:
IBM Director of Licensing
IBM Corporation
North Castle Drive
Armonk, NY 10504-1785
U.S.A.
For license inquiries regarding double-byte (DBCS) information, contact the IBM
Intellectual Property Department in your country or send inquiries, in writing, to:
IBM World Trade Asia Corporation Licensing
2-31 Roppongi 3-chome, Minato-ku
Tokyo 106, Japan
The following paragraph does not apply to the United Kingdom or any other
country where such provisions are inconsistent with local law:
INTERNATIONAL BUSINESS MACHINES CORPORATION PROVIDES THIS
DOCUMENT “AS IS” WITHOUT WARRANTY OF ANY KIND, EITHER EXPRESS
OR IMPLIED, INCLUDING, BUT NOT LIMITED TO, THE IMPLIED WARRANTIES
OR CONDITIONS OF NON-INFRINGEMENT, MERCHANTABILITY OR FITNESS
FOR A PARTICULAR PURPOSE. Some states do not allow disclaimer of express
or implied warranties in certain transactions, therefore, this statement may not apply
to you.
This information could include technical inaccuracies or typographical errors.
Changes are periodically made to the information herein; these changes will be
incorporated in new editions of the document. IBM may make improvements and/or
changes in the product(s) and/or the program(s) described in this publication at any
time without notice.
Any references in this information to non-IBM Web sites are provided for
convenience only and do not in any manner serve as an endorsement of those
Web sites. The materials at those Web sites are not part of the materials for this
IBM product and use of those Web sites is at your own risk.
IBM may use or distribute any of the information you supply in any way it believes
appropriate without incurring any obligation to you.
Licensees of this program who wish to have information about it for the purpose of
enabling: (i) the exchange of information between independently created programs
© Copyright IBM Corp. 1999, 2008 127
and other programs (including this one) and (ii) the mutual use of the information
which has been exchanged, should contact:
IBM Corporation
ATTN: Software Licensing
11 Stanwix Street
Pittsburgh, PA 15222
U.S.A.
Such information may be available, subject to appropriate terms and conditions,
including in some cases, payment of a fee.
The licensed program described in this document and all licensed material available
for it are provided by IBM under terms of the IBM International Program License
Agreement or any equivalent agreement between us.
Any performance data contained herein was determined in a controlled
environment. Therefore, the results obtained in other operating environments may
vary significantly. Some measurements may have been made on development-level
systems and there is no guarantee that these measurements will be the same on
generally available systems. Furthermore, some measurements may have been
estimated through extrapolation. Actual results may vary. Users of this document
should verify the applicable data for their specific environment.
Information concerning non-IBM products was obtained from the suppliers of those
products, their published announcements or other publicly available sources. IBM
has not tested those products and cannot confirm the accuracy of performance,
compatibility or any other claims related to non-IBM products. Questions on the
capabilities of non-IBM products should be addressed to the suppliers of those
products.
All statements regarding IBM’s future direction or intent are subject to change or
withdrawal without notice, and represent goals and objectives only.
This information contains examples of data and reports used in daily business
operations. To illustrate them as completely as possible, the examples may include
the names of individuals, companies, brands, and products. All of these names are
fictitious and any similarity to the names and addresses used by an actual business
enterprise is entirely coincidental.
If you are viewing this information softcopy, the photographs and color illustrations
may not appear.
Trademarks and service marks
The following terms are trademarks or registered trademarks of the IBM Corporation
in the United States, other countries, or both:
Advanced Peer-to-Peer Networking® AIX
AS/400® CICS
CICS/400® CICS/6000®
CICS/ESA® CICS/MVS®
CICS/VSE® CICSPlex®
C-ISAM™ Database 2™
DB2 DB2 Universal Database™
128 TXSeries for Multiplatforms: Problem Determination Guide
GDDM® IBM
IBM Registry™ IMS™
Informix Language Environment®
MVS™ MVS/ESA™
OS/390® OS/2®
OS/400® RACF®
RETAIN RISC System/6000®
RS/6000® SOM®
Systems Application Architecture® System/390®
TXSeries TCS®
VisualAge VSE/ESA™
VTAM® WebSphere®
z/OS®
Domino®, Lotus®, and LotusScript are trademarks or registered trademarks of Lotus
Development Corporation in the United States, other countries, or both.
ActiveX, Microsoft, Visual Basic, Visual C++, Visual J++, Visual Studio, Windows,
Windows NT®, and the Windows 95 logo are trademarks or registered trademarks
of Microsoft Corporation in the United States, other countries, or both.
Java™ and all Java-based trademarks and logos are trademarks or registered
trademarks of Sun Microsystems, Inc. in the United States, other countries, or both.
UNIX is a registered trademark of The Open Group in the United States and other
countries.
Acucorp and ACUCOBOL-GT are registered trademarks of Acucorp, Inc. in the
United States, other countries, or both.
Pentium® is a trademark of Intel® Corporation in the United States, other countries,
or both.
This software contains RSA encryption code.
Other company, product, and service names may be trademarks or service marks
of others.
Notices 129

130 TXSeries for Multiplatforms: Problem Determination Guide
Index
AABDump attribute 104
abend codes 7
abnormal terminationclassification 4
codes 7
dealing with 17
dump not made when expected 108
generating dump 104
time taken to restart 42
transaction dump 103
what to look for in dump 109
ACUCOBOL-GT 13
administration changes 2
AllocateTimeout attribute 21
ANIMATOR 13, 36
checking programming logic 52
investigating loops 35
investigating storage violations 59
application designdebugging applications 35
application programACUCOBOL-GT 13
ANIMATOR 13
CADB transaction 13
CEBR transaction 13
CECI transaction 13
CEDF transaction 14
checking mapping from file 52
checking use of queues 16
data handling 2
debugging tools 35
EXEC CICS UNLOCK 24
EXEC CICS WRITEQ TS 24
generating dump 104
handling SQL codes 71
IBM Application Debugging Program 13
leaking storage 42
map size 46
module identifiers 123
not working as expected 47
PL/I message log 8, 9
poor programming logic 52
preliminary checks 2
restrictions on SQL 72
transaction dump 103
types of loops 33
unintended control characters 46
using dump to investigate 109
application programsEXEC CICS GETMAIN SHARED 20
loops 19
application servermaximum server condition 22
too many servers 22
approach to problem determination 1
asynchronous scheduling 38
ATI (Automatic Transaction Initiation) 22
using dump to investigate 109
attributes, resource definitionABDump 104
AllocateTimeout 21
CheckpointInterval 29, 42
ClassMaxTasks 29, 39
CoreDumpName 103
DeadLockTimeout 21
DumpName 103
IdleTimeout 42
IntrospectInterval 29, 42
MapHeight 46
MapWidth 46
MaxRegionPool 30
MaxServer 22, 30, 39
MaxTSHPool 30
MinServer 39
NumColumns 45
NumLines 45
OpThreadPoolSize 42
PCDump 104
ResThreadPoolSize 42
RPCListenerThreads 38
SafetyLevel 57
ServerIdleLimit 39
StartUpProgList 28
SufficesSupported 46
SysDump 104
TClass 39
TraceFlagExec 87
TraceFlagMaster 87
TraceFlagSystem 87
TraceFlagUser 87
TransDump 104
UCTranFlag 46
autoinstall program, DFHCHATX 22
automatic transaction initiation (ATI)task produced no output 49, 51
Automatic Transaction Initiation (ATI) 22
automatic working set trimming 39
auxiliary storage, not enough 24
BBasic Mapping Support (BMS) 46
binding string, displaying 14
BMS (Basic Mapping Support)applications not compiled with latest maps 46
attributes of fields 53
maps incorrect 46
modified data tag (MDT) 53
symbolic map 53
© Copyright IBM Corp. 1999, 2008 131
CCADBR transaction 13
cat utility 9
category of problem 4
CCIN 8
CEBRchecking use of queues 16
investigating loops 35
investigating no task output 50
CEBR transaction 13
checking programming logic 52
CECIchecking for invalid data in a file 51
investigating loops 35
investigating no task output 50
CECI TRACE command 97
CECI transaction 13
checking programming logic 52
CEDFeffect on other terminals 22
investigating loops 35
investigating storage violations 59
investigating task output 50
CEDF transaction 14
checking programming logic 52
CEMTcannot be used 30
checking ATI tasks 22
checking for uninstalled terminal definitions 37
checking tasks and scheduler 37
checking terminals in service 31
detecting tasks waiting 27
disabling transactions 51
enabling dump 104
generating system dump 104
increasing application servers 22
investigating tasks 49
PERFORM SNAP 104
purging a task 34
CEMT SET AUXTRACE command 97
CEMT transaction 14
changes in environment 2
changed applications 2
changes to hardware 2
changes to software 2
changes to system administration 2
CHAT transaction 30
checking access to DB2 14
checking access to SFS 14
CheckpointInterval attribute 42
checks, preliminary 2
CICS Animator Debug Configuration Transaction
(CADB) 13
CICS clientscicslterm problems 81
CICS Command-level Interpreter (CECI) 13
CICS Execution Diagnostic Facility (CEDF) 14
CICS Master Terminal (CEMT) 14
CICS storage pools 2
CICS Temporary Storage Browse (CEBR) 13
CICS tools 12
CICS_LEAKDEBUG environment variable 65
CICS-supplied transactionsCADB 13
CEBR 13
CECI 13
CEDF 14
CEMT 14
CHAT 30
CICS-private 42
cicsddt utility 14
cicsdfmt utility 105
cicsget utility 14
cicsgetbindingstring utility 14
cicsltermuse of 83
CICSLTERM environment variable, use of 81
cicslterm problemsCICS clients 81
cicslterm process 37
cicsnotify command 31
cicsnotify utility 14
cicsrl process 38
cicsrlck utility 14
cicssdt utility 14
cicsservice 118
cicssfslock utility 14
cicsstop utility 31
cicstail 11
cicstcpnetname utility 14
cicstfmt 12
CICSTRACE environment variable 89
CLAM 57
CLAM transaction 42
classifying problems 4
ClassMaxTasks attribute 39
cold startCICS stalls 28
effect of RDO changes 2
effect on message file 10
effect on message logs 8
commands, use ofcicslterm 83
compilerdebugging tools 35
problems with 4
consistency checking 57
Console Message Log Viewer (CMLV) 14
console.nnnnnnstorage violations 55
content of trace, controlling 87
control module identifiers 124
controlling timeout value 21
core dump 103
CoreDumpName attribute 103
CPLD 9
CPLI 8
CPU usage high 19
CSMT 8
investigating terminals 45
storage violations 55
132 TXSeries for Multiplatforms: Problem Determination Guide
DDamDB code 72
data module identifiers 123
data overwritten 51
databasescheck CICS configuration 71
check database configuration 71
checking application coding 72
checking use of 16
cicsddt utility 14
classifying the problem 4
dealing with problems 71
message logs 11
sample programs 71
SQL codes 71
using pview 71
XA support 71
DB2check CICS configuration 71
check database configuration 71
checking access 14
checking application coding 72
cicsddt utility 71
db2diag.log 11
DeadLockTimeout attribute 26
dealing with problems 71
file control waits 24
for file control 71
problem determination 72
using ps 71
using pview 71
XA support 71
db2diag.log 11
deadlock 21
DeadLockTimeout attribute 21, 26
debugging program, IBM 35
debugging tools for applications 35
DELETEQ TD command 23
destination of dump 103
DFHCHATX, autoinstall program 22
diagnostic information, collating 118
display, unanticipated output 45
displaying binding string 14
distinguishing waits, loops, and performance
problems 19
documentation 7
dump 12
cicsdfmt 105
controlling output 104
core dump 103
data not formatted correctly 108
directory 103
file name 105
for incorrect output 48
for information about loops 34
formatting 105
IDs missing from the sequence of dumps 108
in storage violations 56
interpreting 109
investigating storage violations 57, 59
layout 106
dump (continued)no dump produced 108
queueing 103
scheduler information 40
setting destination 103
system 103
system dump waits 25
transaction 103
unexpected output 107
user exit, UE052017 104
using 103
DumpName attribute 103
Eeliminating obvious causes 2
EMP (event monitoring point) 12
ENQ task control waits 25
enqueueing a locked resource 25
environment variablesCICSLTERM, use of 81
TERM, use of 81
environment, effect of changes 2
error messages 7
event monitoring point (EMP) 12
EXEC CICS ABEND 104
EXEC CICS DUMP 104
EXEC CICS GETMAIN SHARED 20
EXEC CICS START command 38
EXEC CICS UNLOCK command 24
checking waits for file control 24
EXEC CICS WRITEQ TS command 24
Ffile control waits 24
file control, DB2 71
file descriptor leaks 65
file name, dump 105
first failure data capture 9
forcepurge 47
formatting dump 105
forums 7
Ggenerating dump 104
GETMAIN SHARED 20
Hhardware changes 2
heuristic damage 27
IIBM Application Debugging Program 13
checking programming logic 52
using 35
Index 133
IBM CICS Universal ClientCCIN 8
Idebug tool 35
IdleTimeout attribute 42
incorrect outputapplication did not work as expected 47
BMS mapping 53
checking for invalid data in a file 51
dump 107
from file or journal 47
trace data missing 100
trace destination wrong 100
trace output wrong 100
using trace and dump 48
wrong output obtained 51
information for support organization 117
information module identifiers 124
information sourcesstatistics 12
Informixproblem determination 74
initializationCICS stalls 28
effect of changes 2
innocent transactions 64
input to a transaction 15
intercommunicationdisplaying NETNAME 14
module identifiers 124
poor performance 39
SNA messages 11
syncpoint waits 26
two-phase commit 27
waits 23
intermittent errors 2
interval control element (ICE) 51
interval control transactions not started 38
IntrospectInterval attribute 42
investigating loops 33
Jjournal waits 26
Lleaks, memory and file descriptor 65
loopsCICS detected 33
CICS region stalled 19
classification 4
dealing with 33
in CICS code 33
investigating by modifying your program 35
possible causes 33
processes 31
purging a task 34
short on storage 20
sources of information 19, 34
symptoms 19, 33
tools 35
loops (continued)types 33
using trace for information 34
lowercase characters 46
Mmain memory buffer
trace entries missing 101
main storage, not enough 24
MapHeight attribute 46
maps 2
mapset, defined through RDO 2
MapWidth attribute 46
maximum server condition 22
MAXSERVER 22
MaxServer attribute 22, 39
memory leaks 65
message log file 72
message log viewer 14
message logs 7
Microsoft SQL Server 71
MinServer attribute 39
modified data tag (MDT) 53
module identifiers 123
monitoring 12
checking for journal waits 26
checking for transient data waits 24
checking TS queue waits 25
Nnetworks, preliminary checks 2
NLS for messages 8
NumColumns attribute 45
NumLines attribute 45
Ooperating system
classifying the problem 4
OpThreadPoolSize attribute 42
Oracleproblem determination 75
output from a transaction 15
output from terminal 15
Ppatch 2, 121
PCDump attribute 104
performance 37
allocating application servers 40
automatic working set trimming 39
bottlenecks 37
checking the status of processes 14
classifying the problem 4
effect of ServerIdleLimit 39
IdleTimeout 42
incorrect setting of SFS attributes 42
134 TXSeries for Multiplatforms: Problem Determination Guide
performance (continued)interval control delays 38
interval for consistency checking 42
maximum number of SFS requests 42
number of application servers 39
number of threads for SFS calls 42
poor performance 19
problem 20
ps utility 14
remote system status 39
short on storage 41
task class 39
task priority 40
tasks not given to scheduler 37, 38
tasks not scheduled 39
terminal status 38
using dump for information 40
using statistics for information 41
writing snapshots of the region 42
physical map 2
pools, storage 55
preliminary checks 2
network related errors 2
no previous success 2
printersprinted output wrong 45
unexpected line feeds and form feeds 46
priority, task 40
problem reporting 117
process of problem determination 1
processes, checking status of 14
programdefined through RDO 2
ps utility 14
PTF 2
PTF (program temporary fix) 121
publications 7
purging a task 34
Rrandom storage overrun 2
READQ TD command 23
reduced activity at terminal 19
regionapplication servers available 39
checking the status of processes 14
consistency checking 42
controlling trace output 87
displaying binding string 14
displaying NETNAME 14
incorrectly set attributes 42
module identifiers 125
pool 2
ps utility 14
releasing lock (cicsrlck) 14
setting task class 39
short on storage 29
stall during termination 30
stalled 19
stalls 28
region (continued)status of remote region 39
stopping processes 31
storage pools 55
task priority 40
using dump for information 109
Region Definitions (RD)MaxTaskCPU 34
MaxTaskCPUAction 34
region pool 2, 57
relational database managers (RDBMs) 71
repetitive output 19
reporting a problem 117
preparing information 117
sending documentation 118
reproducing the errorpreliminary checks 2
resource definitionsetting case for characters 46
Resource Definition Online (RDO) 2
mapset definition 2
program definition 2
transaction definition 2
resource definitionsaccess to region storage pool 57
CEMT transaction 14
controlling cicsrl threads 38
controlling number of application servers 39
controlling timeout value 21
controlling trace output 87
enabling dump 104
IdleTimeout 42
incorrect 29
inquiring on (cicsget) 14
maximum number of servers 22
maximum number of SFS requests 42
number of threads for SFS calls 42
setting checkpoint intervals 42
setting dump destination 103
setting map size 46
setting task class 39
terminal attributes 45
resourcesdefinition errors 2
ResThreadPoolSize attribute 42
road map 7
RPC listener process 38
RPCListenerThreads 38
Ssample programs, database 71
scheduler statistics 41
ServerIdleLimit attribute 39
service changes 2
SFSchecking access 14
file control waits 24
IdleTimeout 42
incorrect attribute settings 42
incorrect data read from file 47
Index 135
SFS (continued)maximum number of SFS requests 42
number of threads for SFS calls 42
syncpoint waits 27
SFS serverreleasing lock (cicsrlck) 14
short on storage 20, 41
signature strings 55
SNA messages 11
SNA, intersystem waits 23
software changes 2
solution from support organization 121
sources of informationACUCOBOL-GT 13
ANIMATOR 13
CADB 13
CCIN 8
CEBR 13
CECI 13
CEDF 14
CEMT 14
checking for intersystem waits 23
CICS tools 12
CICS-supplied transactions 13
cicsddt 14
cicsget 14
cicsgetbindingstring 14
cicsnotify 14
cicsrlck 14
cicssdt 14
cicssfslock 14
cicstail 11
cicstcpnetname 14
command-line utilities 14
CPLD 9
CPLI 8
CSMT 8
customer forums 7
database messages 11
dealing with loops 19
dump 12
error messages 7
files and databases 16
for database information 71
for intersystem waits 23
for terminal 22
IBM Application Debugging Program 13
link-edit maps 16
loops 34
monitoring 12
national language 8
product documentation 7
ps 14
queues 16
SNA messages 11
source listings 16
statistics 12
stderr 8
stdout 8
symrecs.nnnnnn file 9
tailing message files 11
sources of information (continued)terminal output 15
trace 12
unexpected messages 45
user input 15
using dump 103
Windows event log 9
your documentation 16
SQLchecking application coding 72
codes handled by application 71
dealing with problems 71
restrictions in XA environment 72
XA support 71
stall of CICS 28
stall of two-phase commit 27
standard error d 8
standard output data stream 8
starting problem determination 1
StartUpProgList attribute 28
statistics 12
autoinitiated tasks 20
information for performance problems 41
investigating no task output 50
number of times short on storage 41
status codes 10
stderr 8
stdout 8
stopping CICS processes 31
storageCICS pools 2
consistency checking 57
dealing with violations 55
innocent transactions 64
insufficient storage 24
module identifiers 124
pools 55
random overrun 2
region pool 57
setting of SafetyLevel 57
short on storage 41
signature strings 55
sources of information 59
statistics 41
task-private pool 55
task-shared pool 56
storage violations 55
classifying the problem 4
stress 20
SufficesSupported attribute 46
support module identifiers 124
support organizationclassifying problems 4
information needed 117
problem reporting 117
RETAIN 4
sending you a solution 121
SUSPEND task control waits 25
suspended tasks 21
suspending a transaction 26
136 TXSeries for Multiplatforms: Problem Determination Guide
Sybaseproblem determination 78
symbolic maps 2, 53
symptom records 9
symptomsapplication did not work as expected 47
CICS has stalled during a run 28
CICS region stalled 19
CICS stalls during initialization 28
CICS under stress 20
classifying the problem 5
code runs repeatedly 19
communication error 72
CPU time excessive 34
CPU usage high 19
database connection fails 72
dump output not as expected 107
file accesses excessive 20
input operations excessive 34
loops 19
low CPU usage 29
network problems 2
output missing 19
output operations excessive 34
output repetitive 19, 34
performance degraded 20
performance problems 20
priority 21
reduced terminal activity 19
short on storage 20
storage requests excessive 34
suspended tasks 21
Switch Load file problems 72
task fails to complete 19
task is waiting 19, 21
task not started 19
task suspended 19
tasks do not run 20
terminal appears to hang 37
terminal is unresponsive 22
trace output not as expected 100
transaction is delayed 37
unanticipated data in a file or user journal 47
unexpected return code 72
symrecs.nnnnnn file 9
synchronous scheduling 38
syncpoint waits 26
SysDump attribute 104
system dump 103
system dump waits 25
system loading 2
system process waits 27
Ttailing message files 11
task-private pool 2, 55
task-shared pool 2, 56
tasksATI, no output produced 49, 51
autoinitiated 20
tasks (continued)class 39
demanding excessive storage 20
do not run 20
ENQ waits 25
inquiring on status 49
journal waits 26
looking at the ICE chain 51
looping 33
maximum server condition 22
module identifiers 123
not given to scheduler 38
not scheduled 37
precedence 41
priority 40
private storage pool 2
purging 34
queuing 39
shared storage pool 2
short on storage 20
SUSPEND waits 25
suspended 19, 21
syncpoint waits 26
unable to attach to the transaction scheduler 37
unable to schedule 39
waiting 21
waits 19
TCP/IP, intersystem waits 23
temporary storageconditional requests for storage 24
no task output 50
unconditional requests for storage 24
waits 24
TERM environment variable, use of 81
Terminal Definitions (WD)MaxTaskCPU 34
terminalsautoinstall program not loaded 22
checking output 15
checking user input 15
control characters in data stream 45
data not displayed 46
effect on performance 38
hang 37
incorrect mapping of data 53
incorrect output 45
message log 8
module identifiers 123
preliminary checks 2
problems with a single terminal 2
problems with multiple terminals 2
reduced activity 19
repetitive output 19
unexpected characters 46
using ATI 22
waits 22
wrong data values displayed 46
termination 30
threads, RPC listener 38
timeout 21
timing of problem 2
Index 137
tkadmin redirect trace 10
toolsACUCOBOL-GT 13
ANIMATOR 13, 36
dealing with abnormal terminations 17
dump 12
for loops 35
IBM Application Debugging Program 13
Idebug 35
monitoring 12
statistics 12
trace 12
windbg/msdev 35
trace 12
application 86
application trace 89
checking flow through application 52
checking programming logic 52
CICSTRACE 89
controlling contents 87
dynamic tracing 97
events 86
exec trace 89
for incorrect output 48
for information about loops 34
for information on loops 34
formatting 90
in a system dump 103
incorrect output 100
investigating no task output 50
investigating storage violations 64
location in dump file 107
missing data 100
model 85
module identifiers 123
overview 12, 85
redirecting output 10
setting attributes 89
system 86, 91
types of information 86
user trace 89
wrong destination 100
trace specification 92
TraceFlagExec attribute 87
TraceFlagMaster attribute 87
TraceFlagSysten attribute 87
TraceFlagUser attribute 87
transaction scheduler 37
transactions 15
ATI (Automatic Transaction Initiation) 22
CADB 13
CEBR 13
CECI 13
CEDF 14
CEMT 14
CICS-supplied 13
class 39
controlling timeout value 21
defined through RDO 2
disabling 51
effect of SafetyLevel 57
transactions (continued)innocent 64
input and output 15
interval control 38
message log 8
no output produced 48, 49
scheduled 37
suspending 26
timeout 21
using dump for information 109
using trace to investigate 50
wrong output produced 51
TransDump attribute 104
transient datachecking use of queues 16
no task output 50
waits 23
transient data queueCCIN 8
CEBR transaction 13
CPLD 9
CPLI 8
CSMT 8
two-phase commit 27
UUCTranFlag attribute 46
UE052017, dump request user exit 104
unanticipated outputclassifying the problem 4
printed output unanticipated 45
terminal output unanticipated 45
unexpected messages 45
uppercase characters 46
user documentation 16
user exit for dump, UE052017 104
user input 15
user program 28
utilitiescat 9
cicsddt 14, 71
cicsdfmt 105
cicsget 14
cicsgetbindingstring 14
cicsnotify 14
cicsrlck 14
cicssdt 14
cicssfslock 14
cicsstop 31
cicstcpnetname 14
cicstfmt 90
DFHCHATX, autoinstall program 22
ps 14
Wwaits
autoinstall program not loaded 22
CICS stalls 28
classification 4
138 TXSeries for Multiplatforms: Problem Determination Guide
waits (continued)dealing with 21
definition 19
file control 24
intersystem 23
ISC 23
journal 26
maximum server condition 22
stages in resolving 21
symptoms 19
syncpoint 26
system dump 25
system process 27
task control 25
temporary storage 24
terminal 22
transient data 23
warm startCICS stalls 28
effect on message file 10
windbg/msdev tool 35
Windows event log 9
XXA support 71
Index 139

140 TXSeries for Multiplatforms: Problem Determination Guide


���
SC34-6636-02
Spine information:
��
�
TX
Serie
s fo
r M
ultip
latfo
rms
Prob
lem
D
eter
min
atio
n G
uide
Ve
rsio
n 6.
2 SC
34-6
636-
02