Embed Size (px)
Citation preview
Unit 2: Population and Migration
Demography
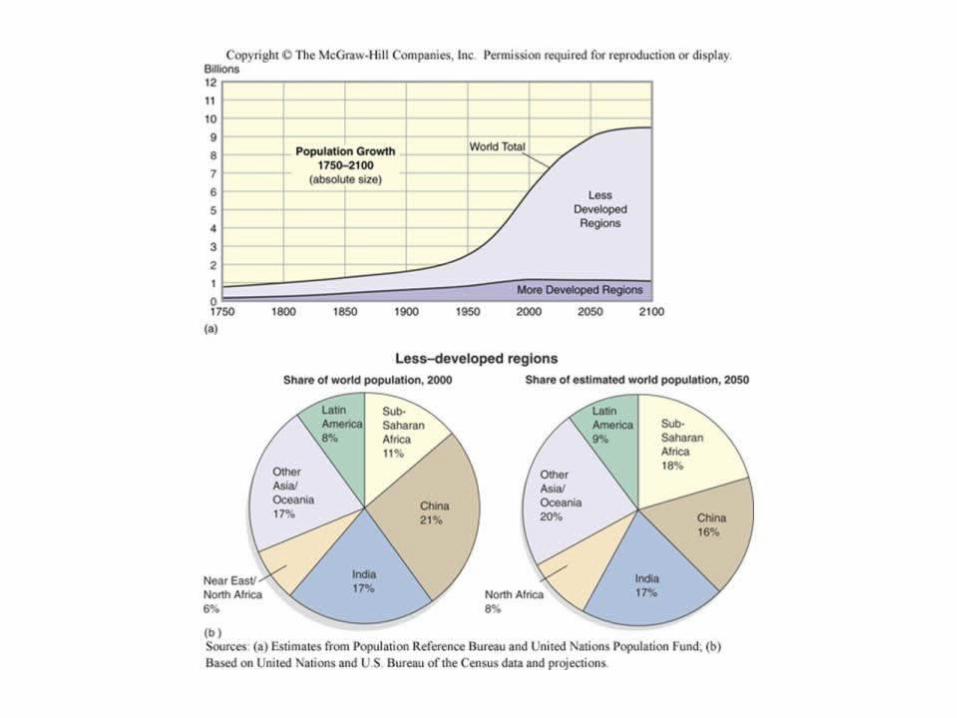
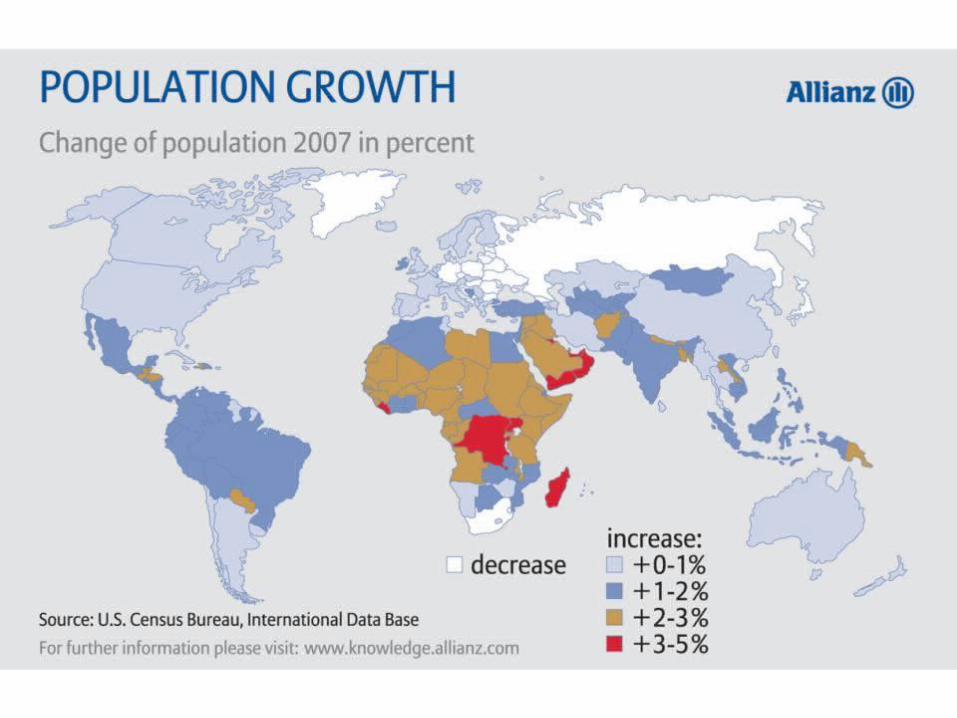
Why is it so important to study world population?
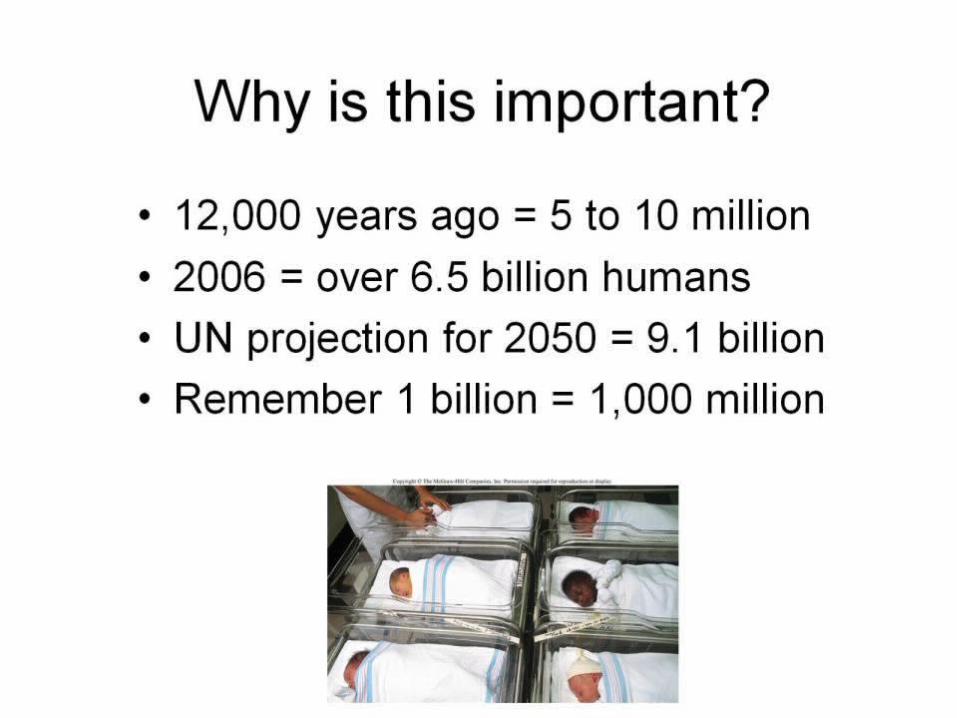
Why is this important?
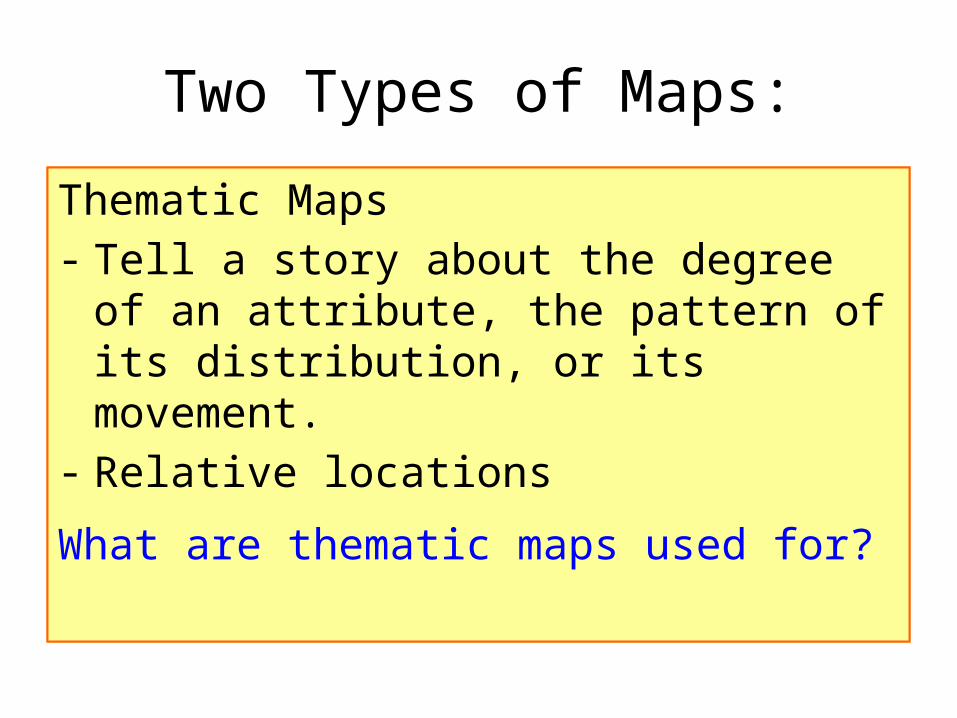
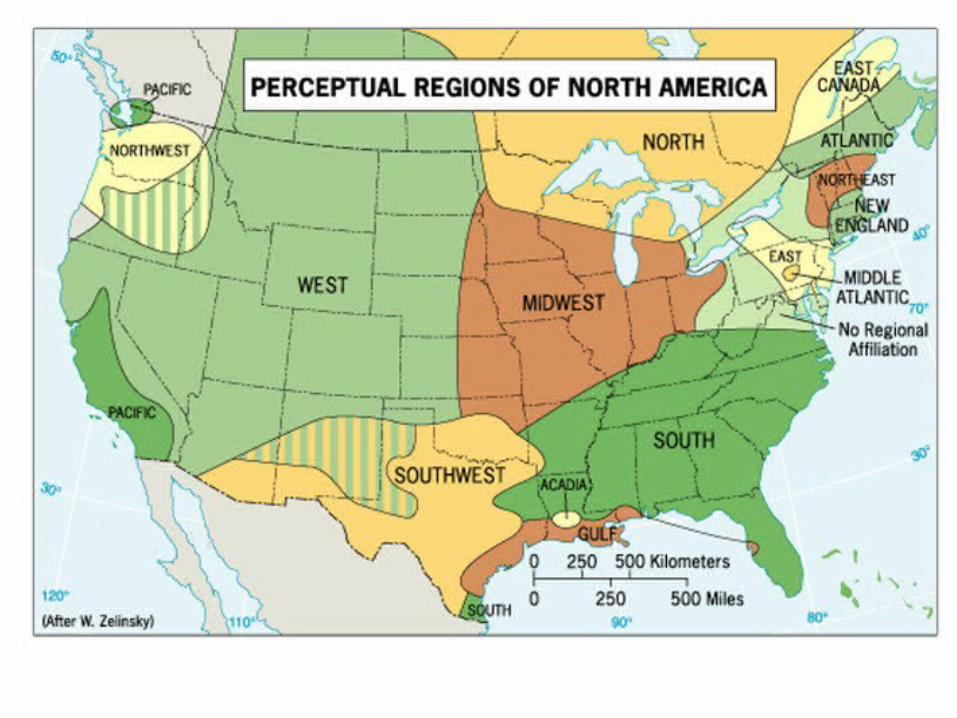
Two Types of Maps:
Reference Maps- Show locations of places and geographic
features- Absolute locations
What are reference maps used for?
Thematic Maps- Tell a story about the degree of an attribute,
the pattern of its distribution, or its movement.
- Relative locations
What are thematic maps used for?
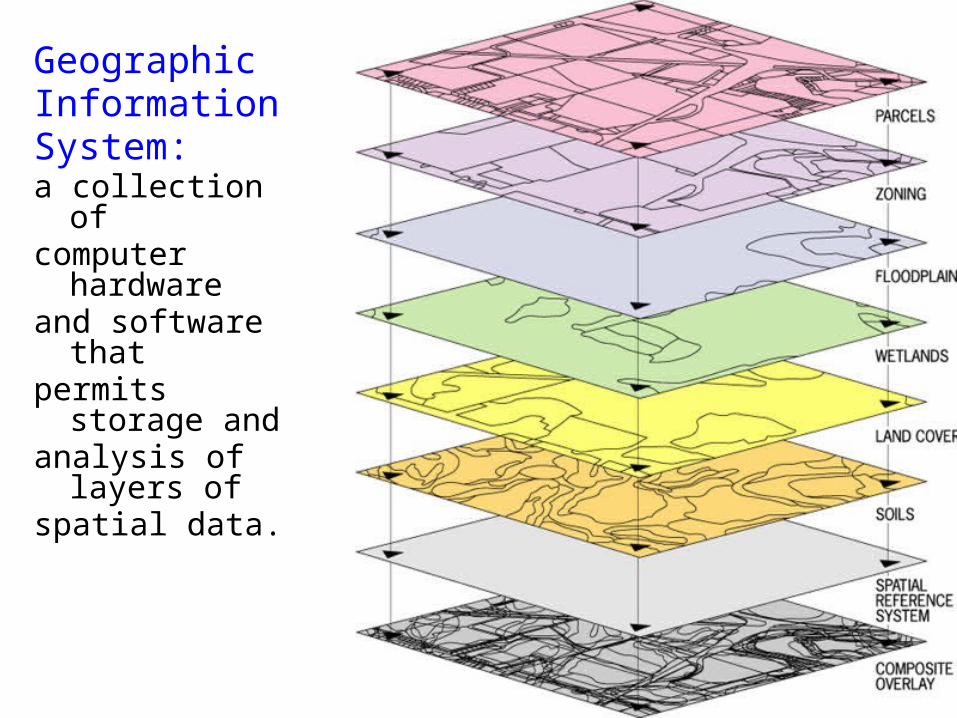
Geographic Information System:a collection of computer hardware and software that permits storage and analysis of layers of spatial data.
In this unit:
Overpopulation: is it a problem?
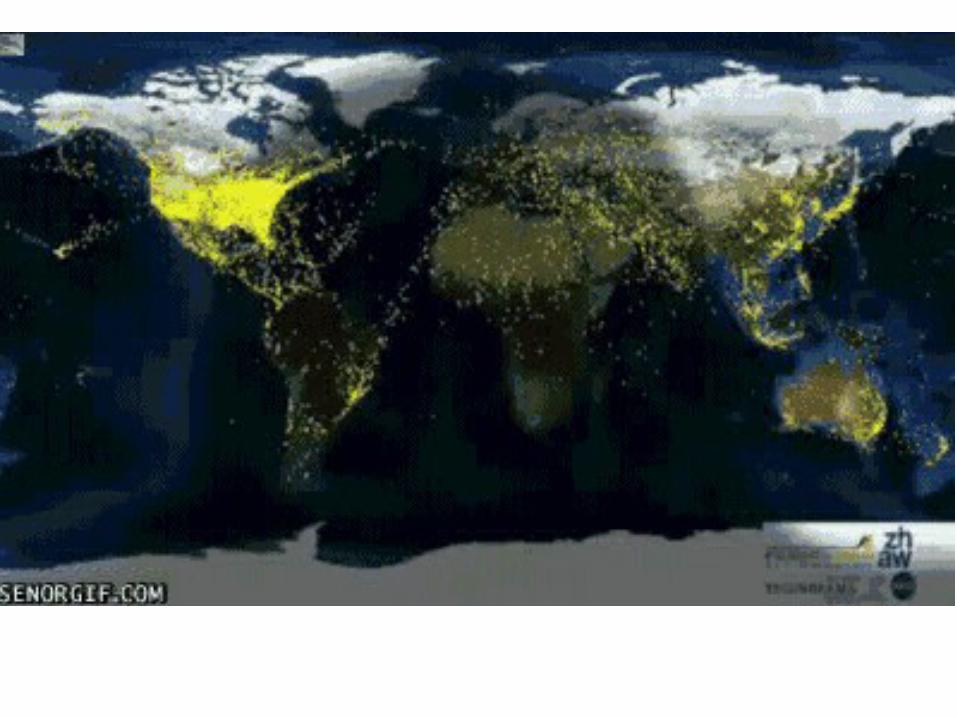
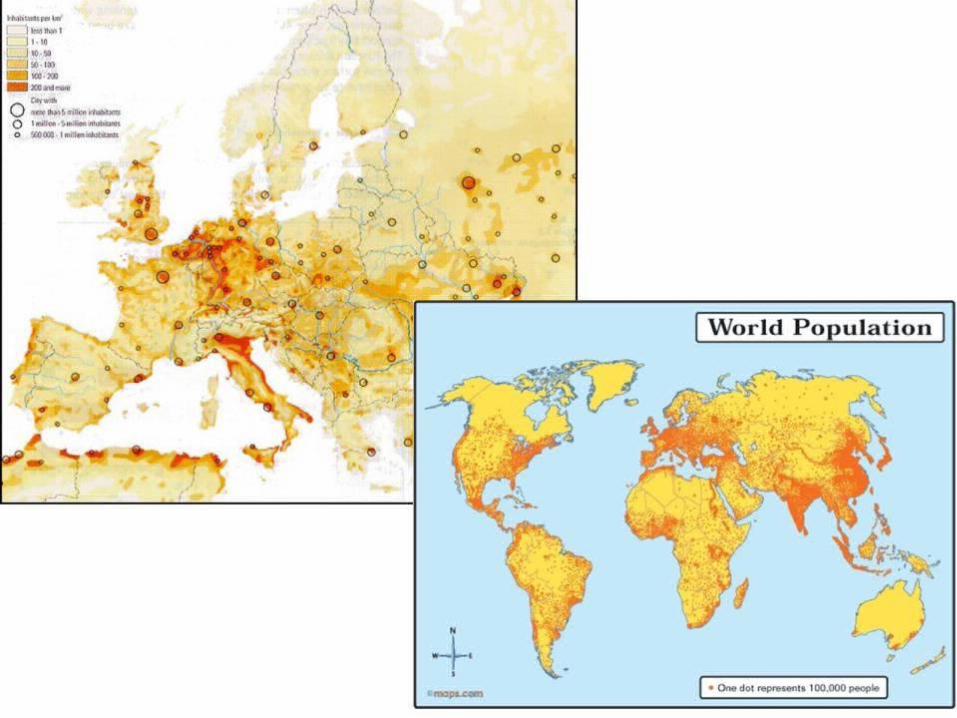
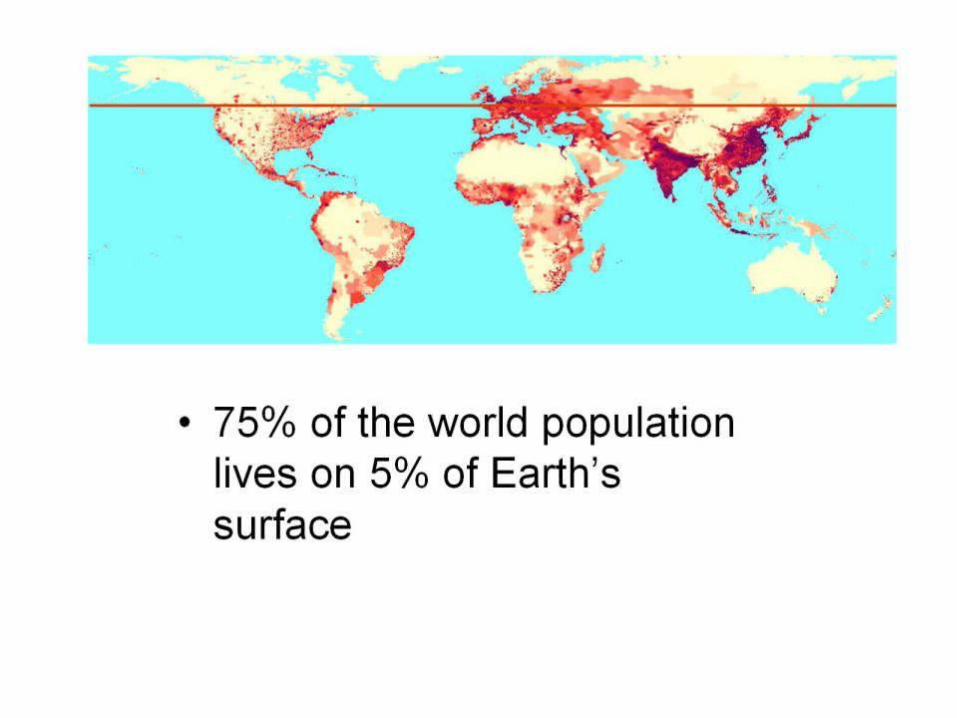
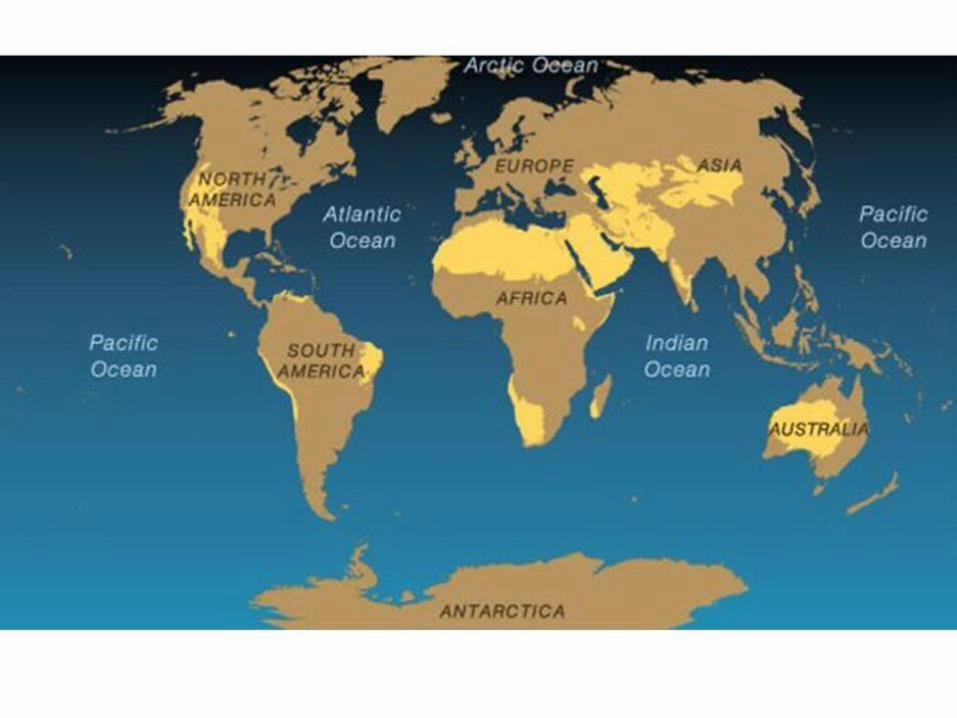
Where is the world’s population distributed?
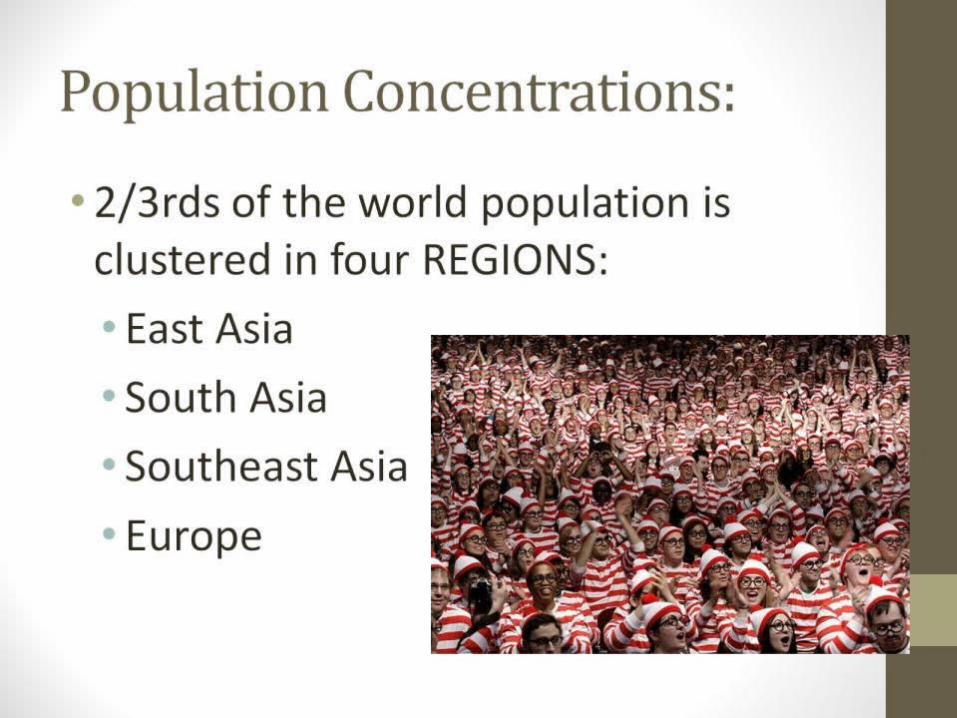
Population Concentrations:
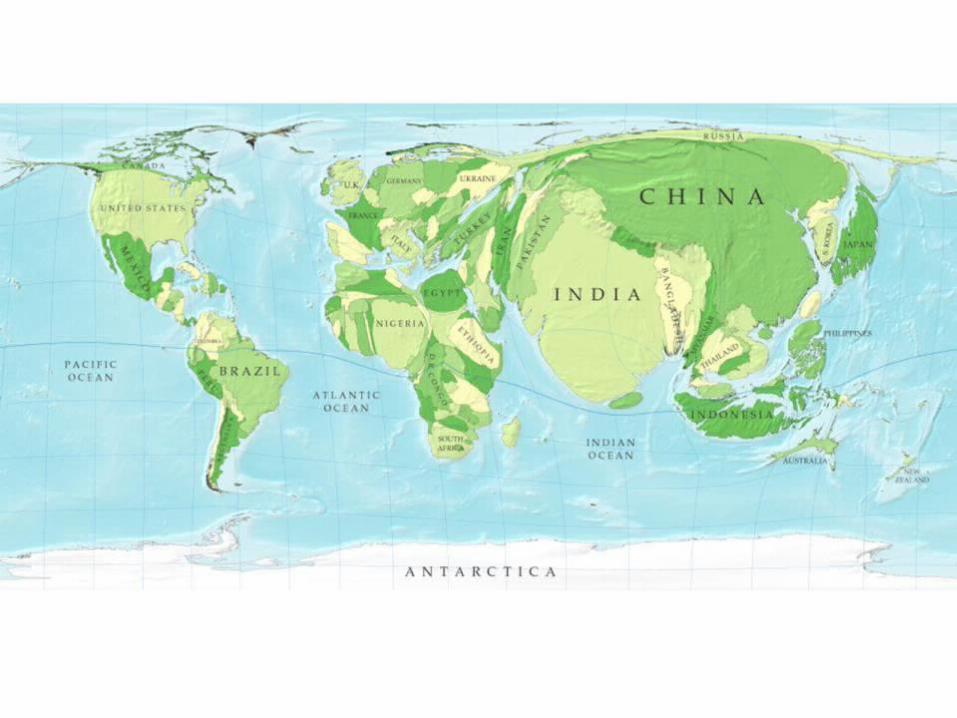
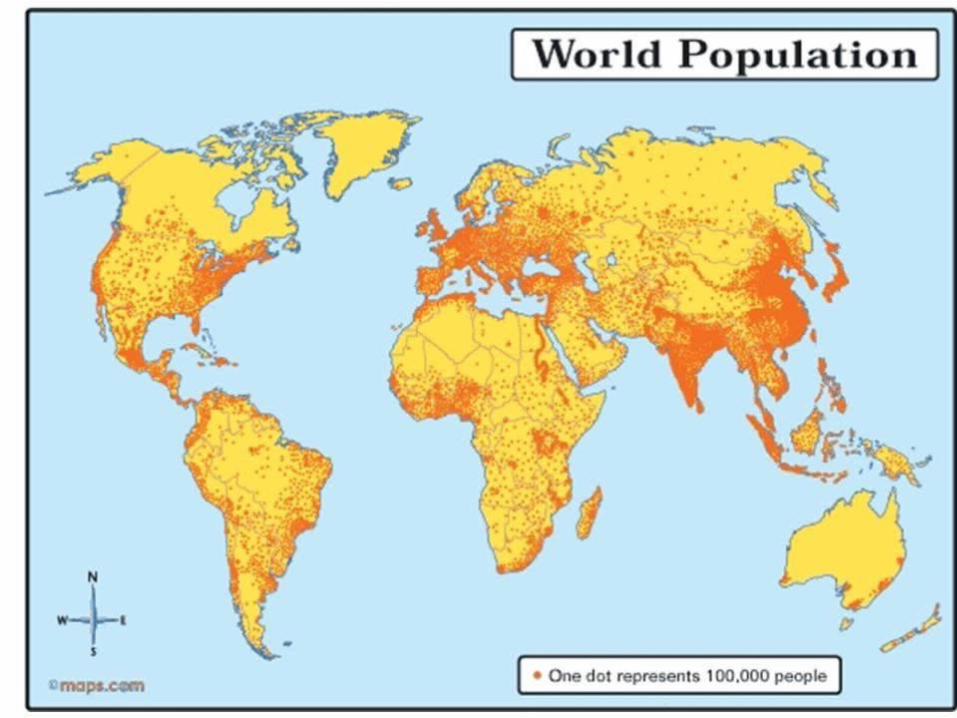


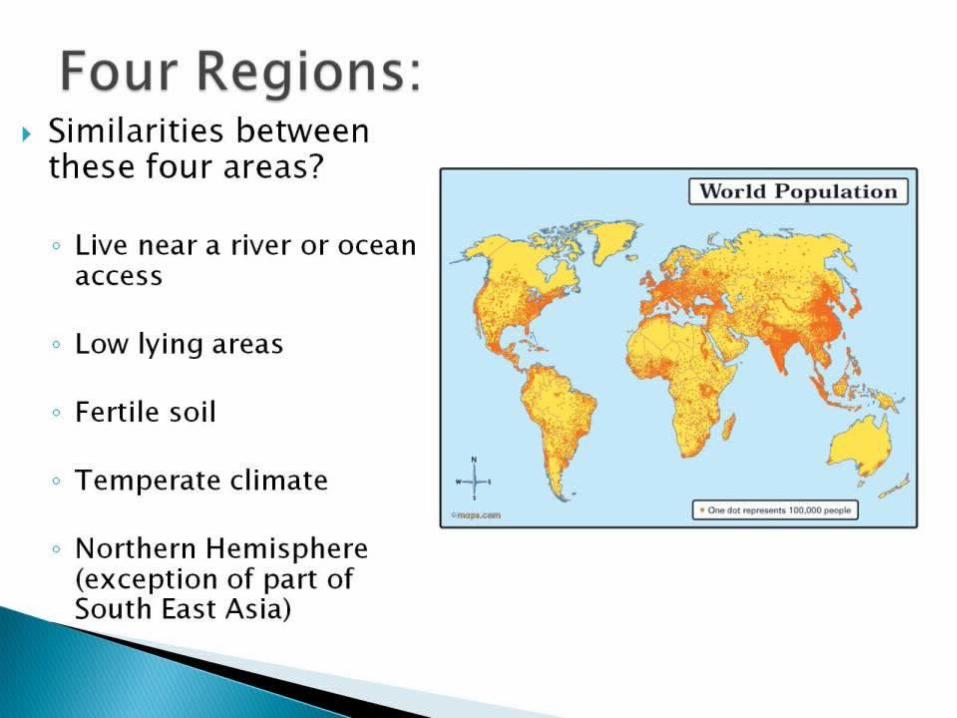
Four Regions:
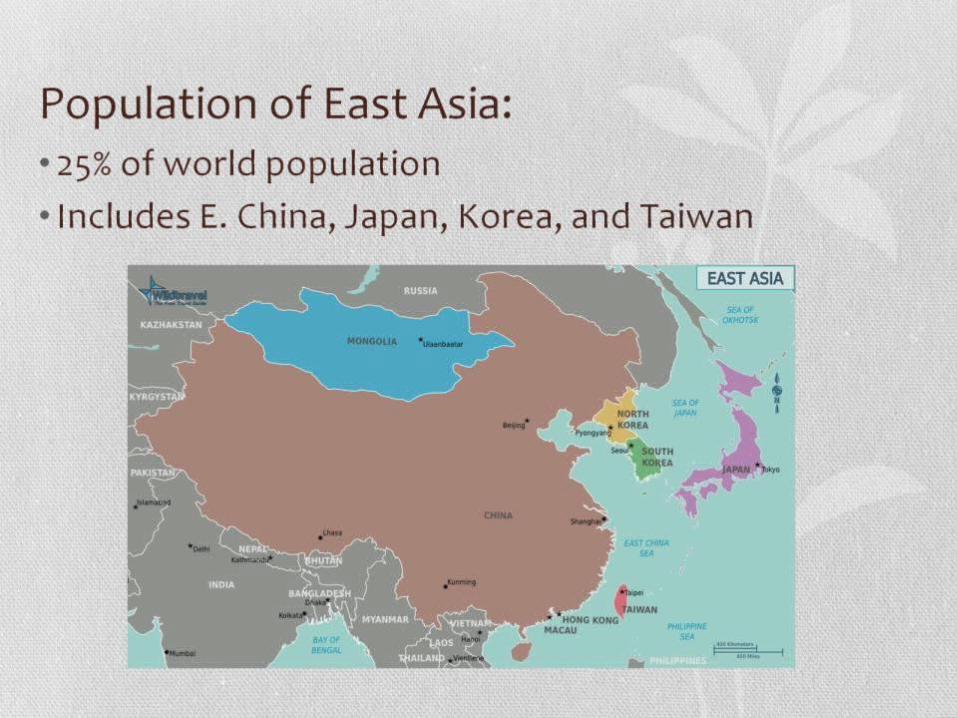
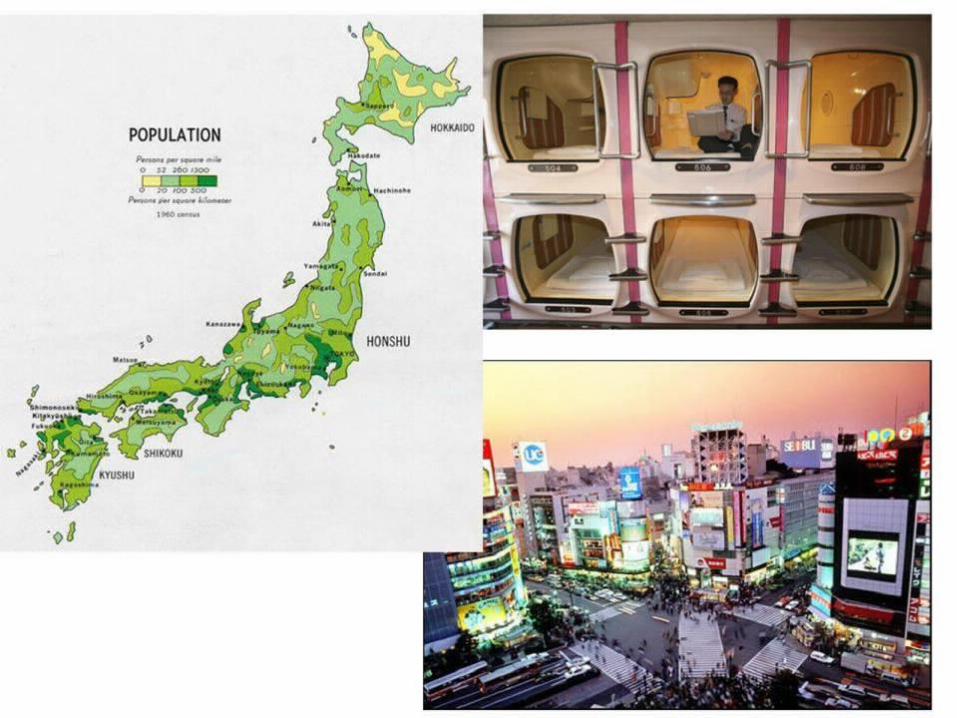
Population of East Asia:
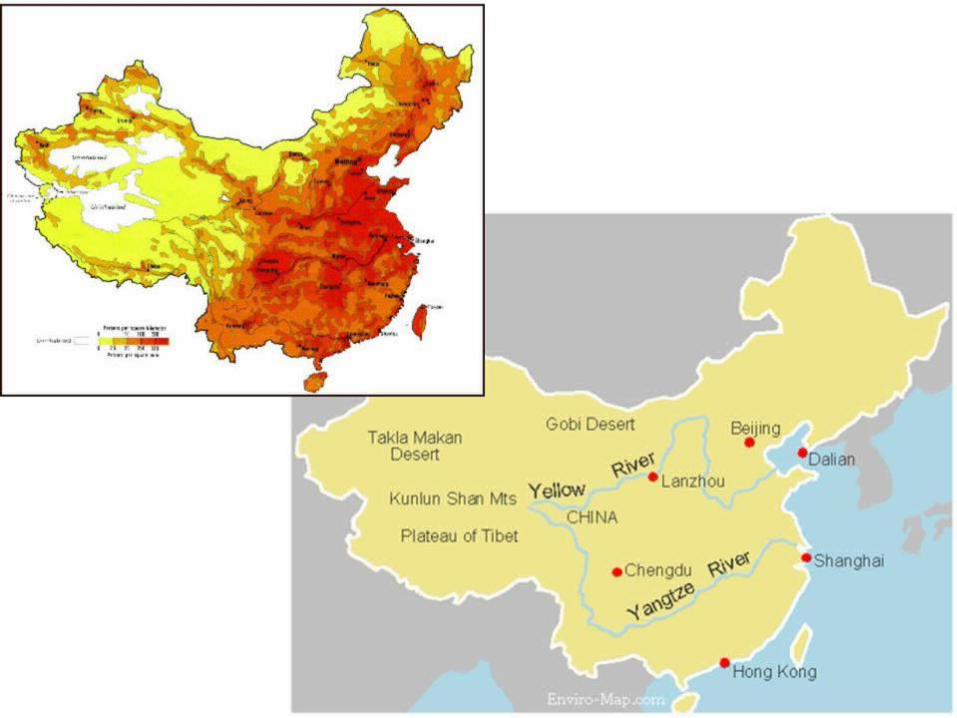
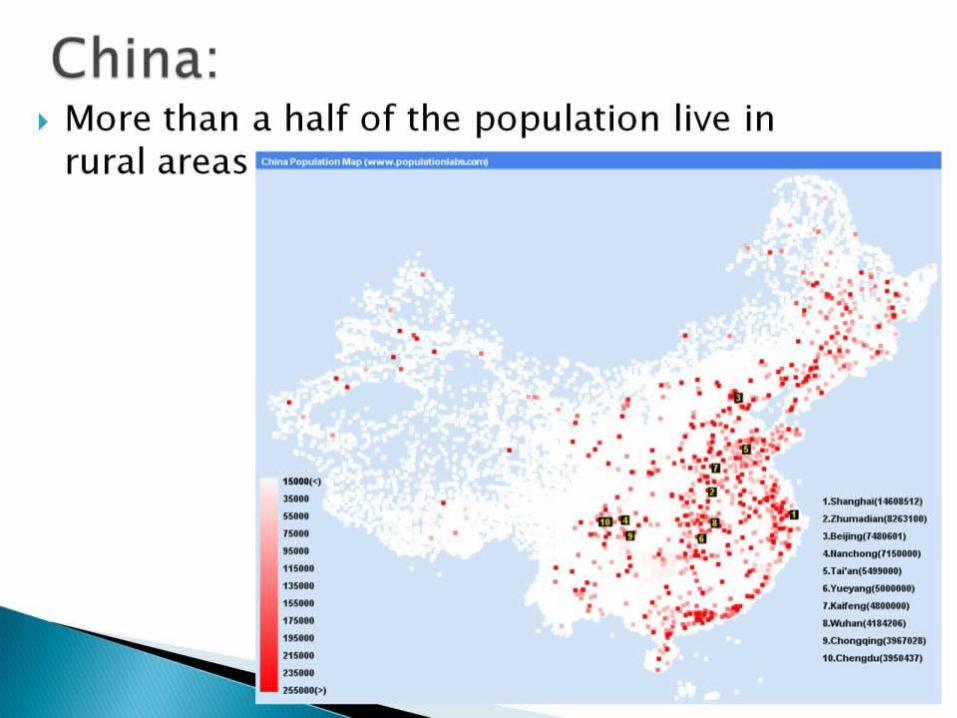
China:

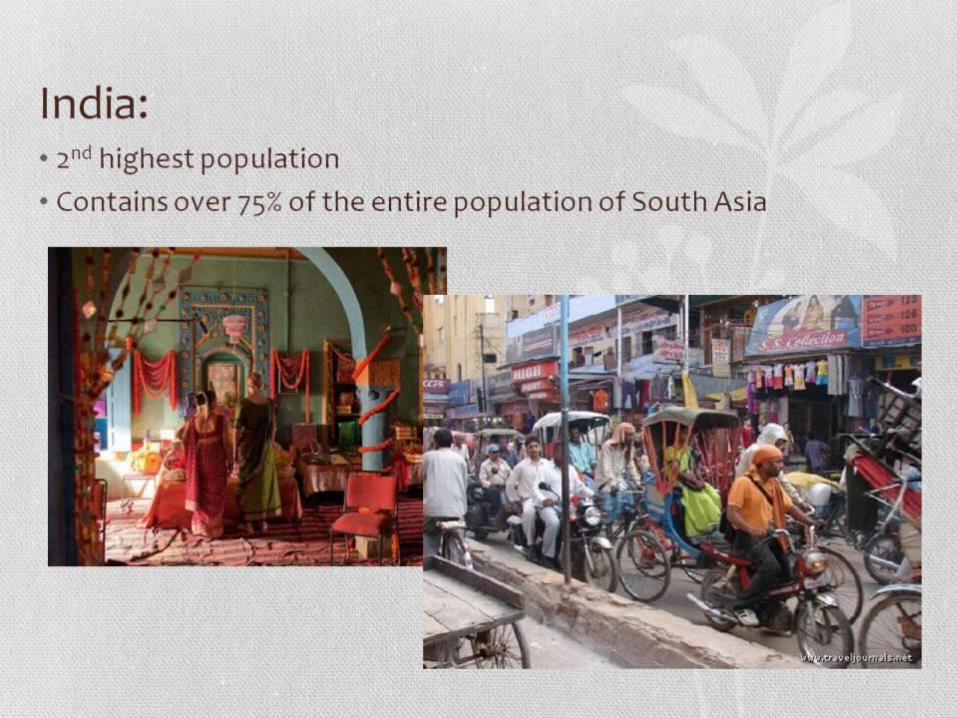
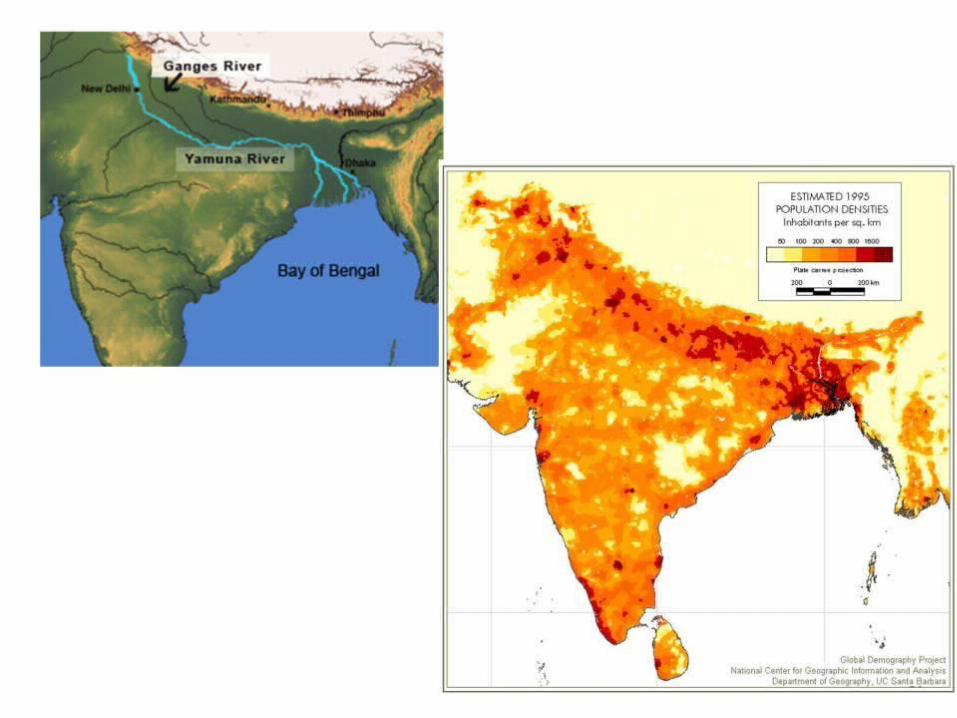
India:
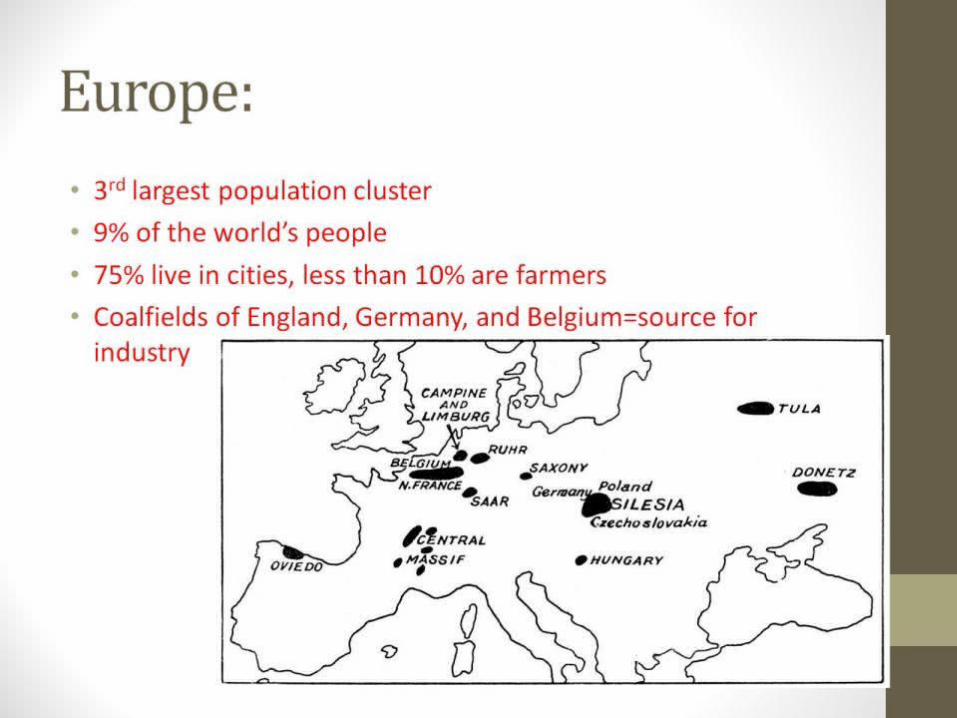
Europe:
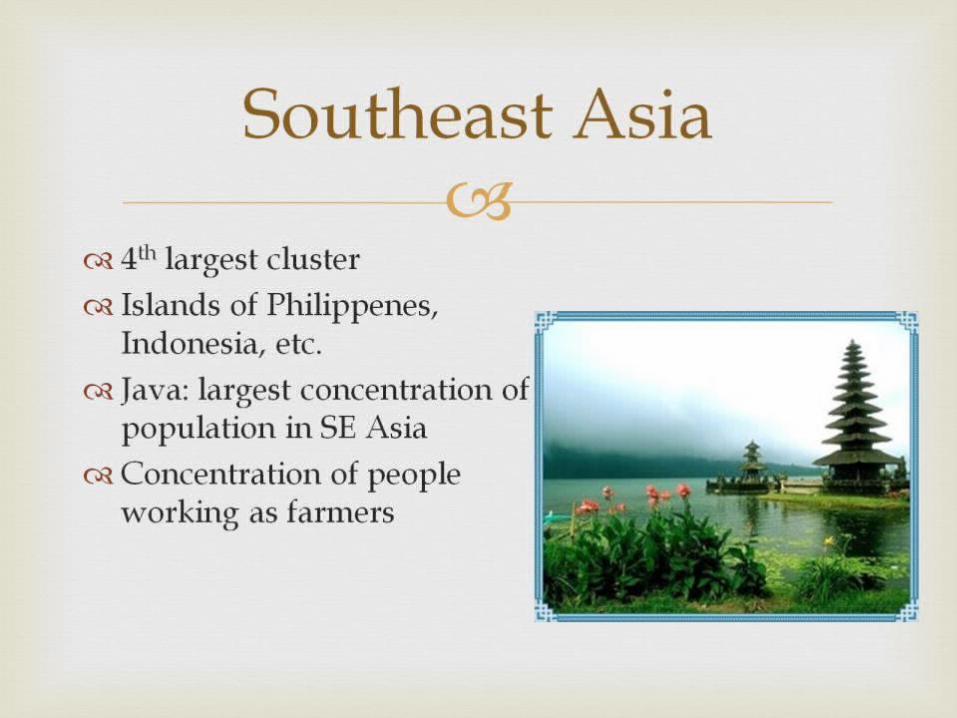
Southeast Asia
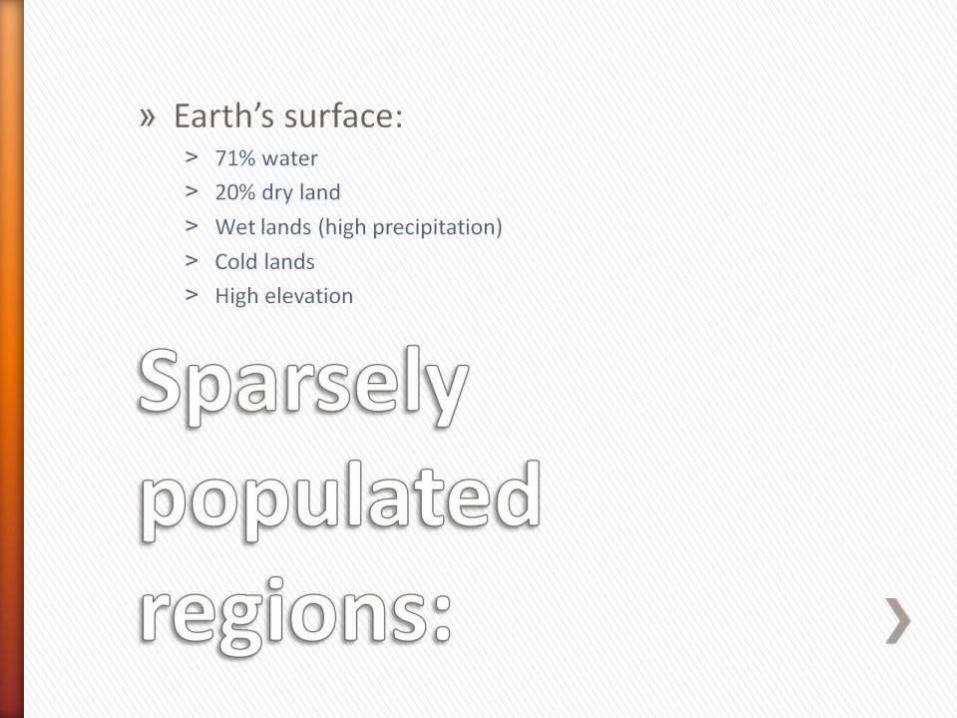
Sparsely populated regions:
Reliability of Population Data, Fertility/Mortality/Birth rate
Precursor to Demographic Transition Model
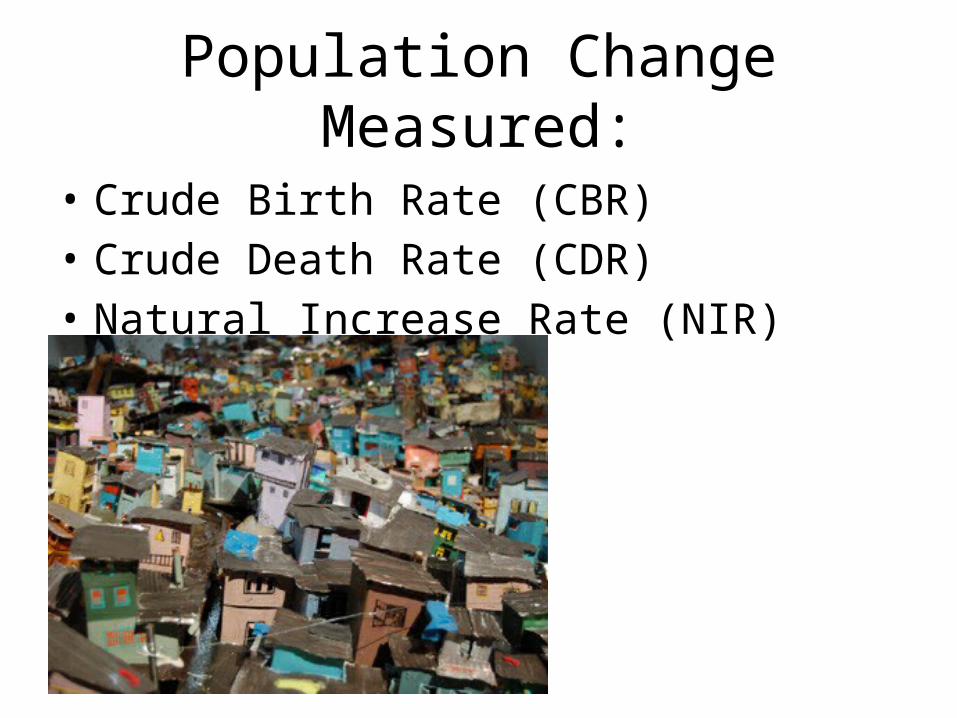
Population Change Measured:
• Crude Birth Rate (CBR)• Crude Death Rate (CDR)• Natural Increase Rate (NIR)
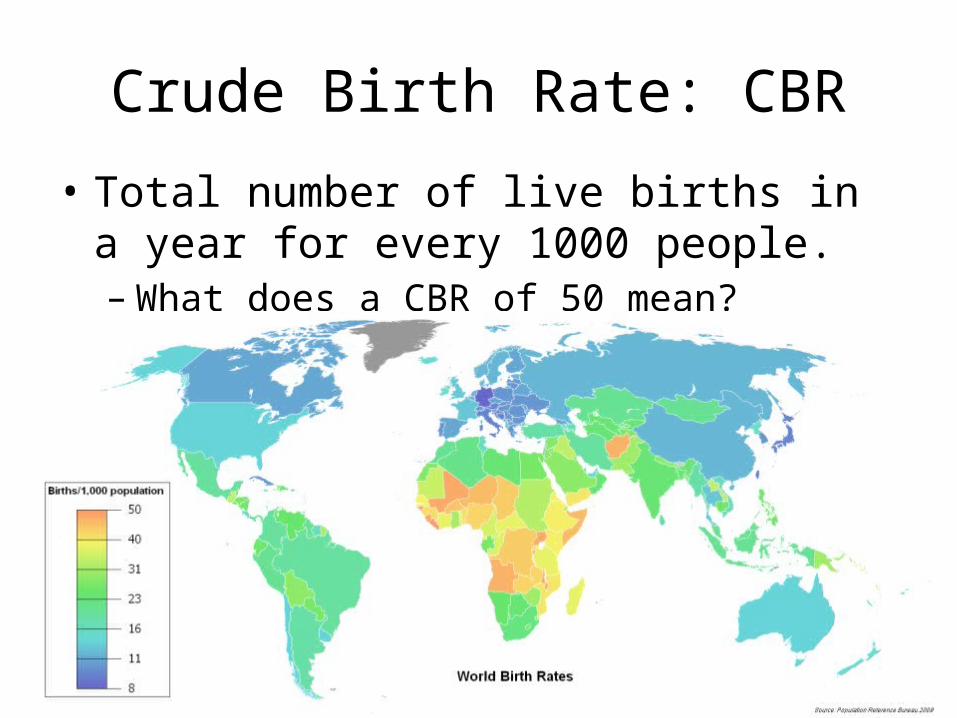
Crude Birth Rate: CBR
• Total number of live births in a year for every 1000 people.– What does a CBR of 50 mean?
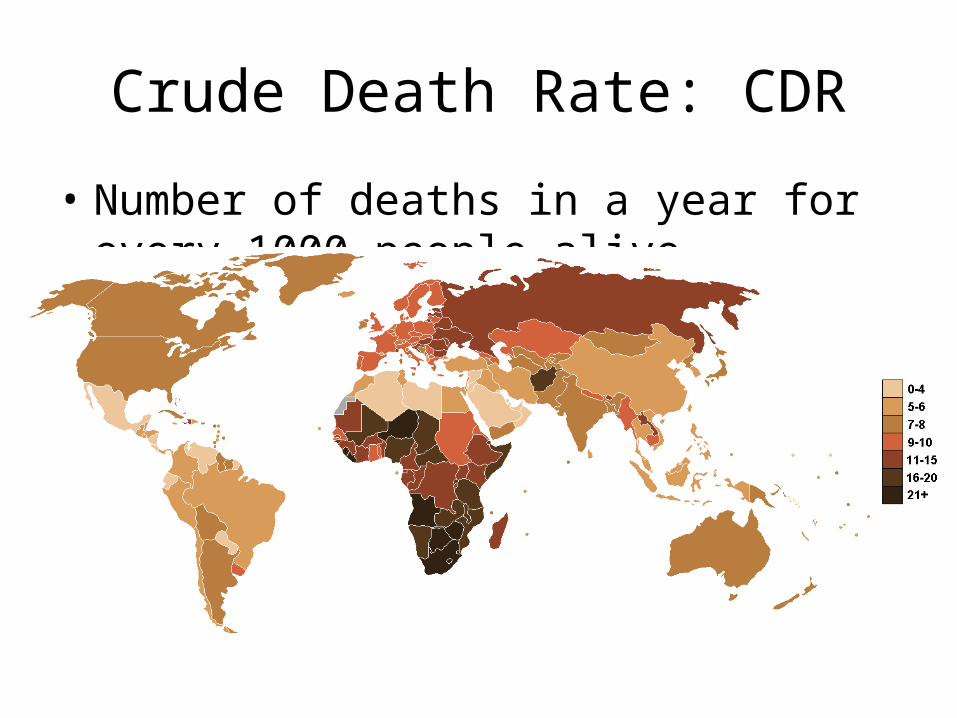
Crude Death Rate: CDR
• Number of deaths in a year for every 1000 people alive
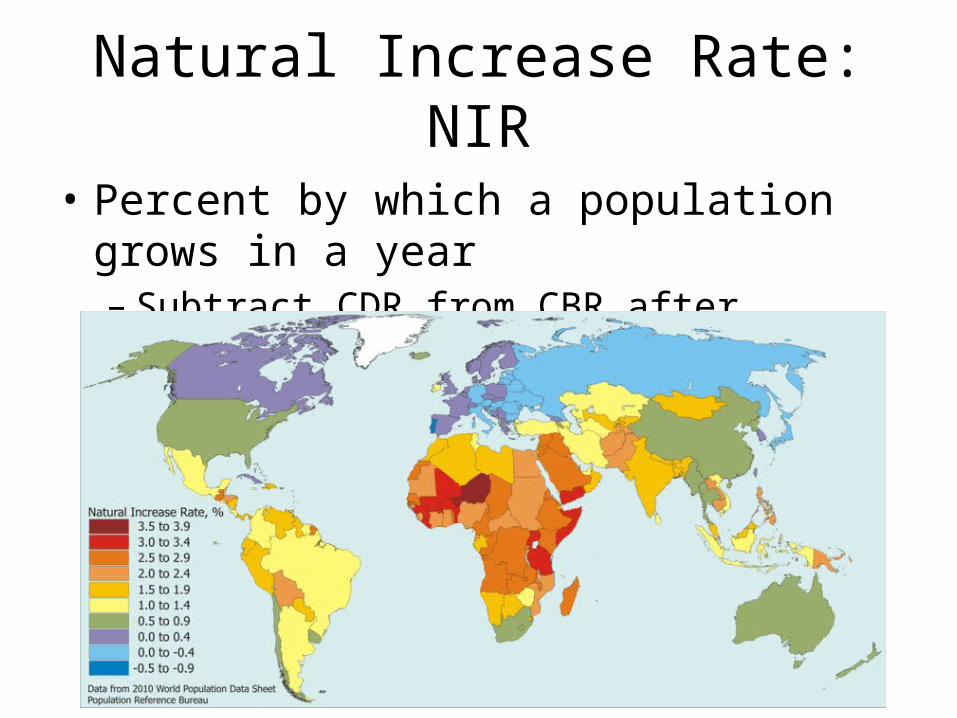
Natural Increase Rate: NIR
• Percent by which a population grows in a year– Subtract CDR from CBR after converting the
numbers to percentages– CDR 5 per 1000– CBR 20 per 1000
Natural Increase Rate:
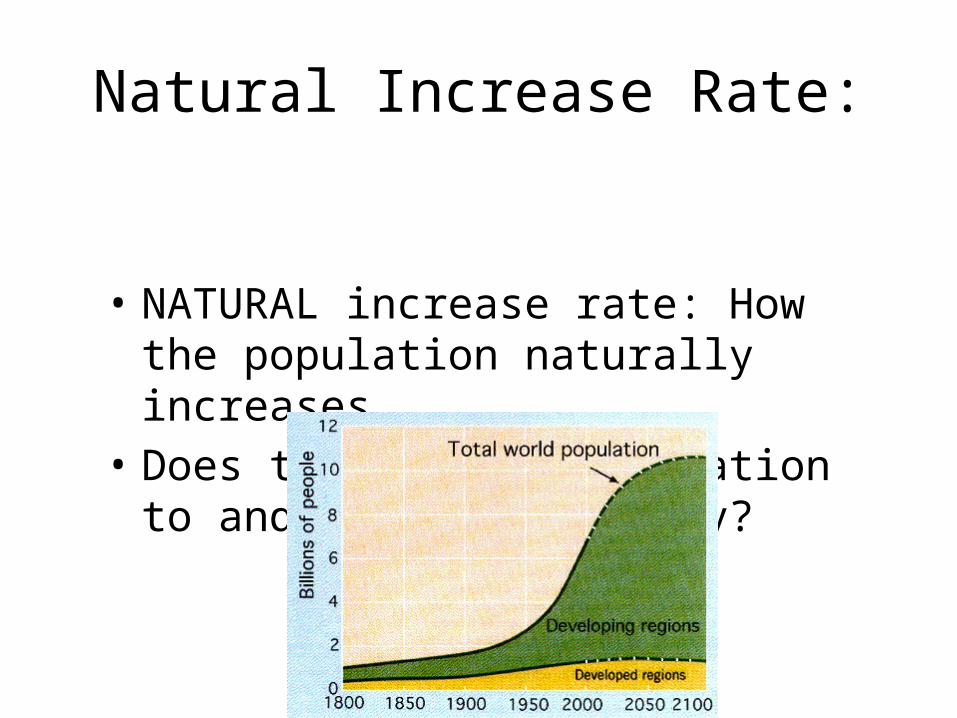
• NATURAL increase rate: How the population naturally increases.
• Does this include migration to and from the country?
Doubling Time
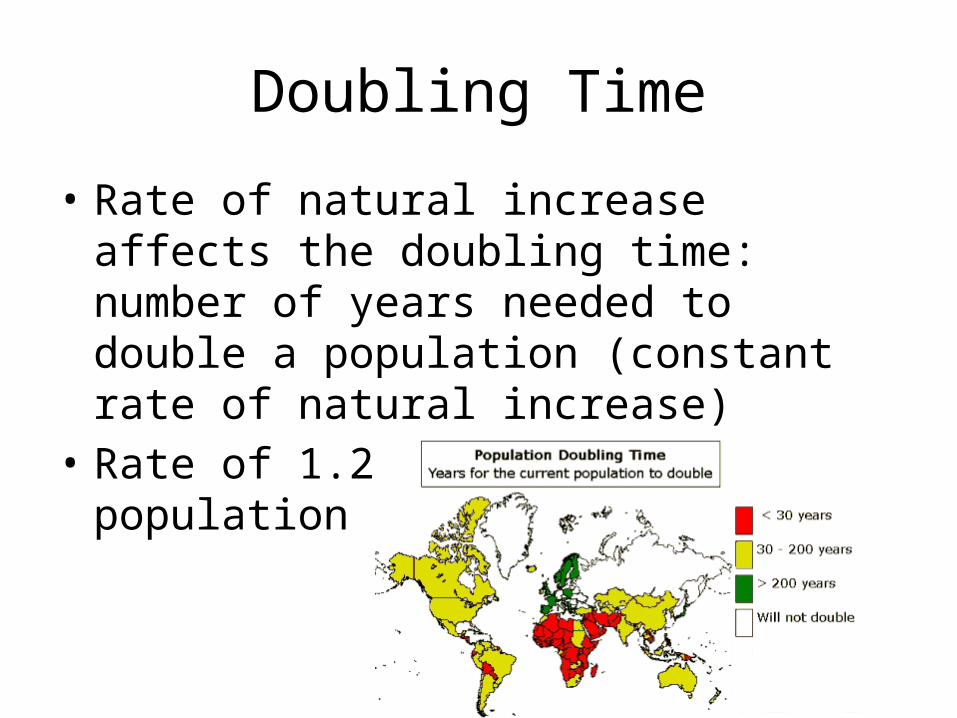
• Rate of natural increase affects the doubling time: number of years needed to double a population (constant rate of natural increase)
• Rate of 1.2: in 2100 the population would be 24 billion
Population Decline:
• What countries/regions?– NIR declining in Europe
Differences in Growth Rates:
• Fertility rates• Mortality rates• We use both to explain how countries and
regions vary in population growth (or even population decline)
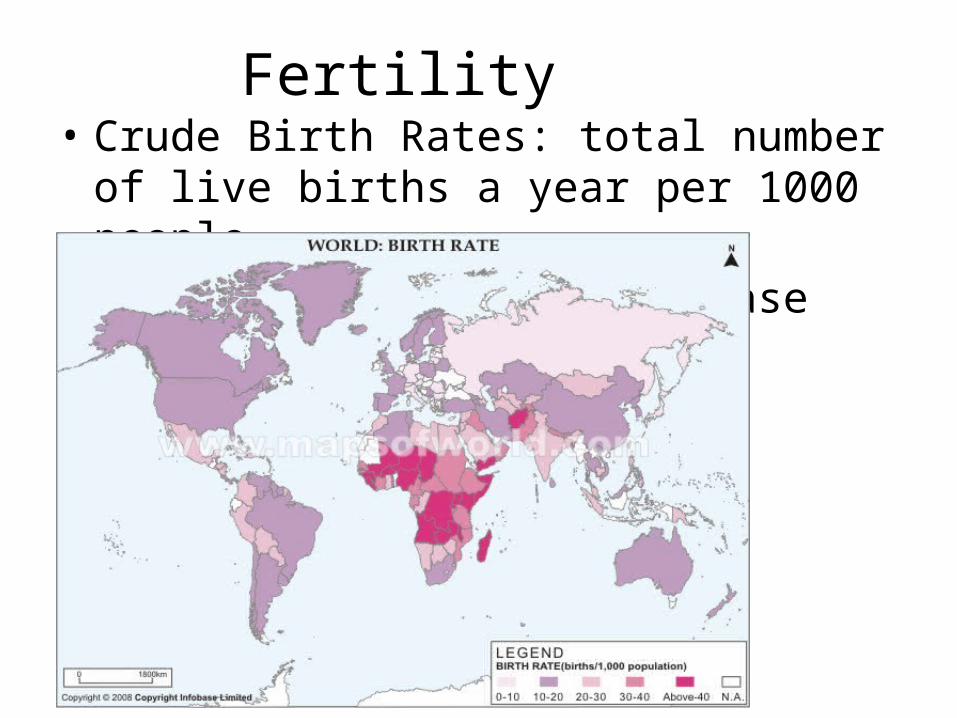
Fertility• Crude Birth Rates: total number of live births a
year per 1000 people.• CBRs mirror Natural increase rates (NIRs) on
maps
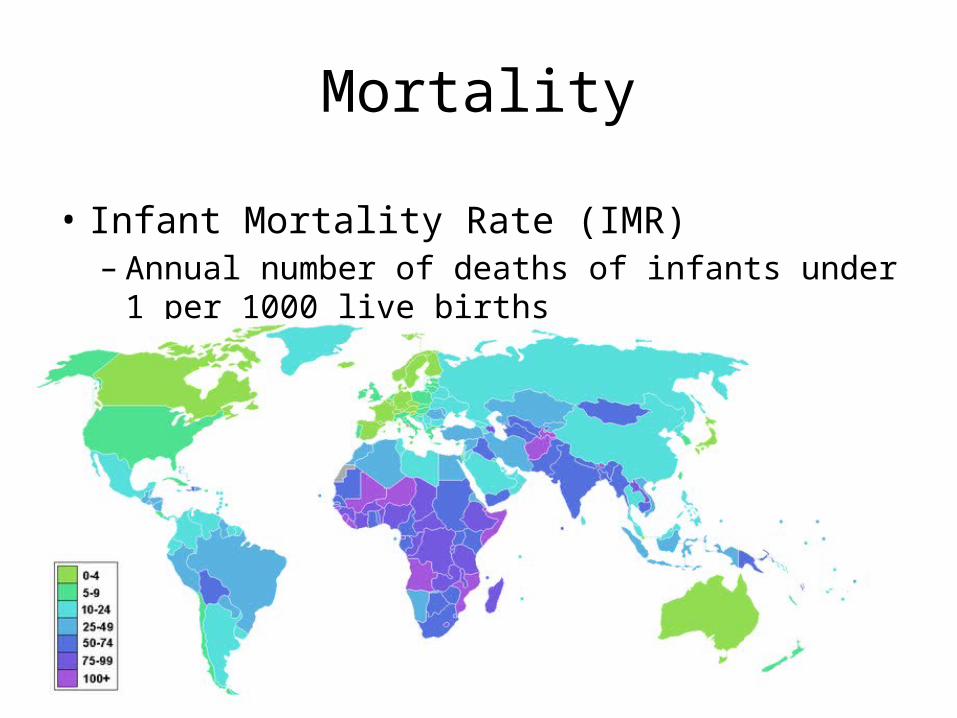
Mortality
• Infant Mortality Rate (IMR)– Annual number of deaths of infants under 1 per 1000
live births• Life Expectancy
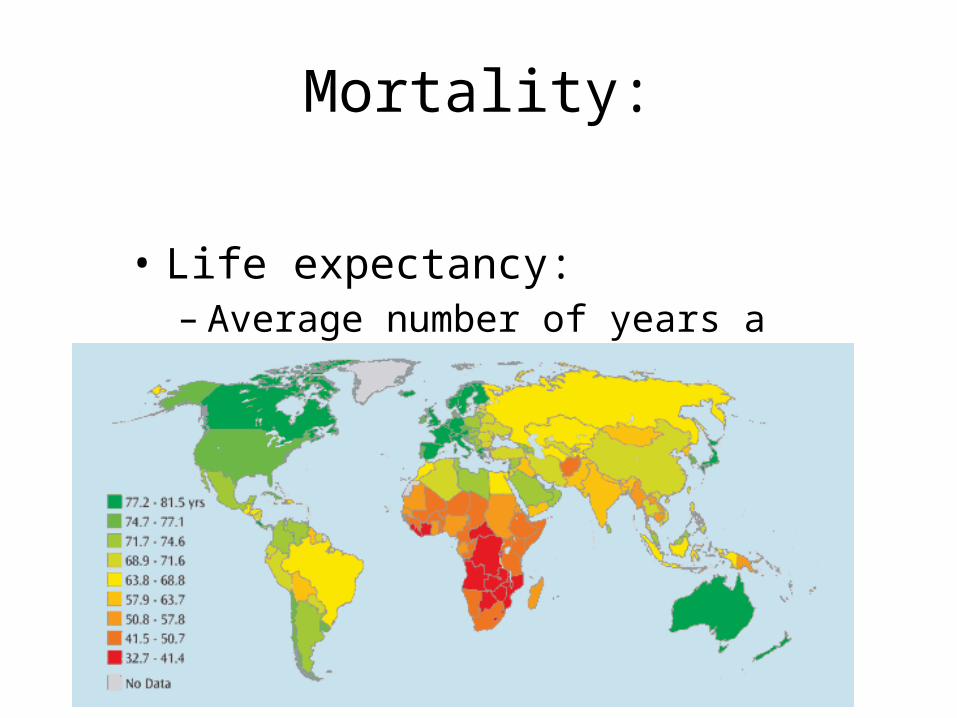
Mortality:
• Life expectancy:– Average number of years a newborn
infant can expect to live – High life expectancy where?
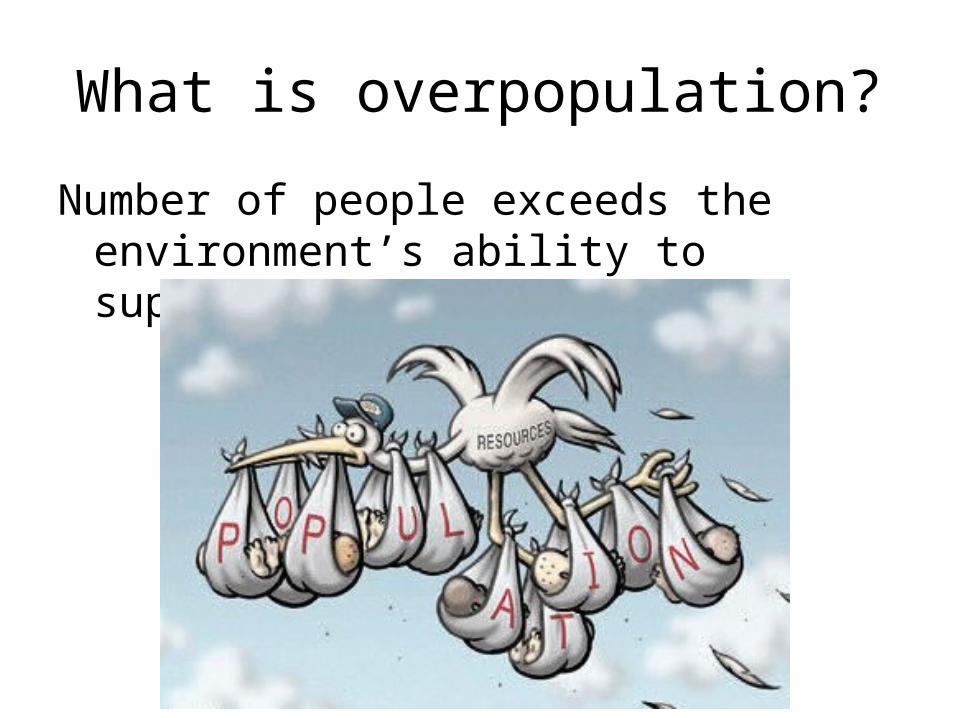
What is overpopulation?
Number of people exceeds the environment’s ability to support life
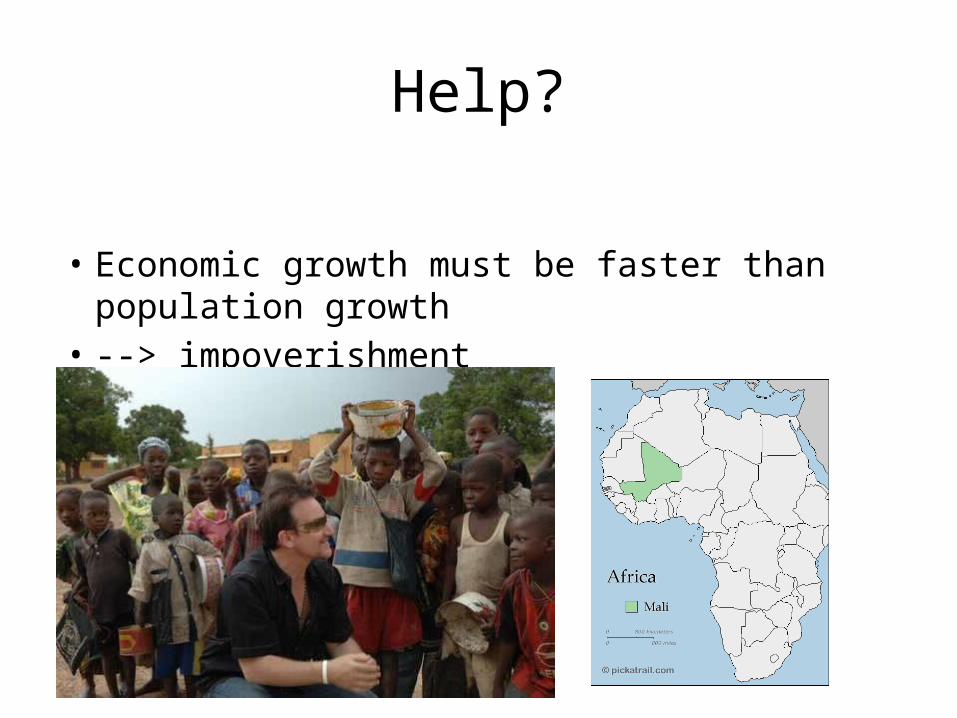
Help?
• Economic growth must be faster than population growth
• --> impoverishment
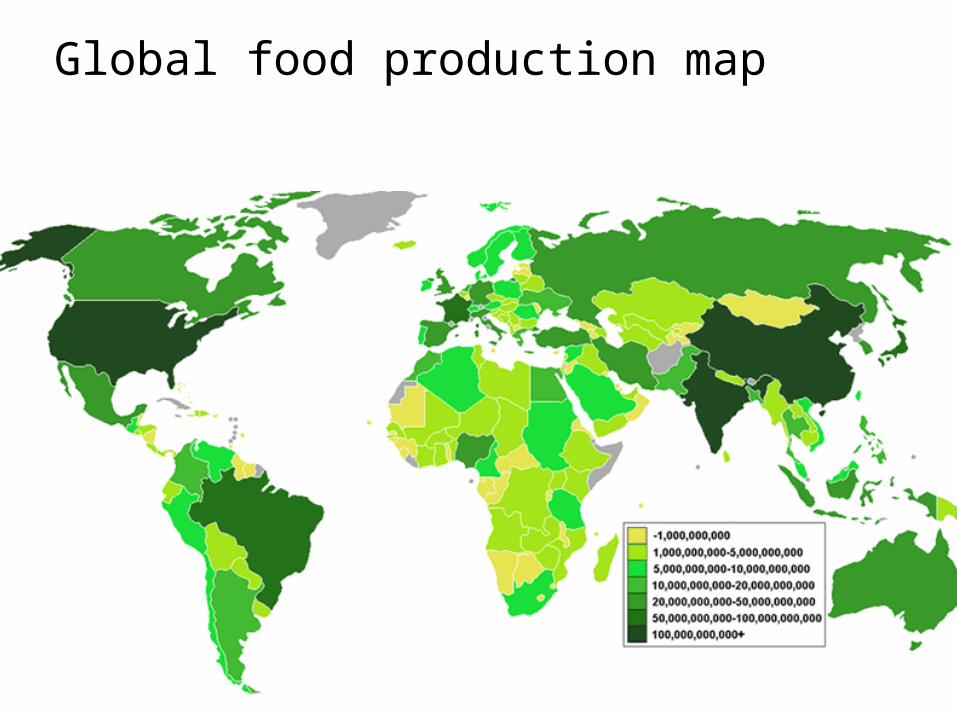
Global food production map
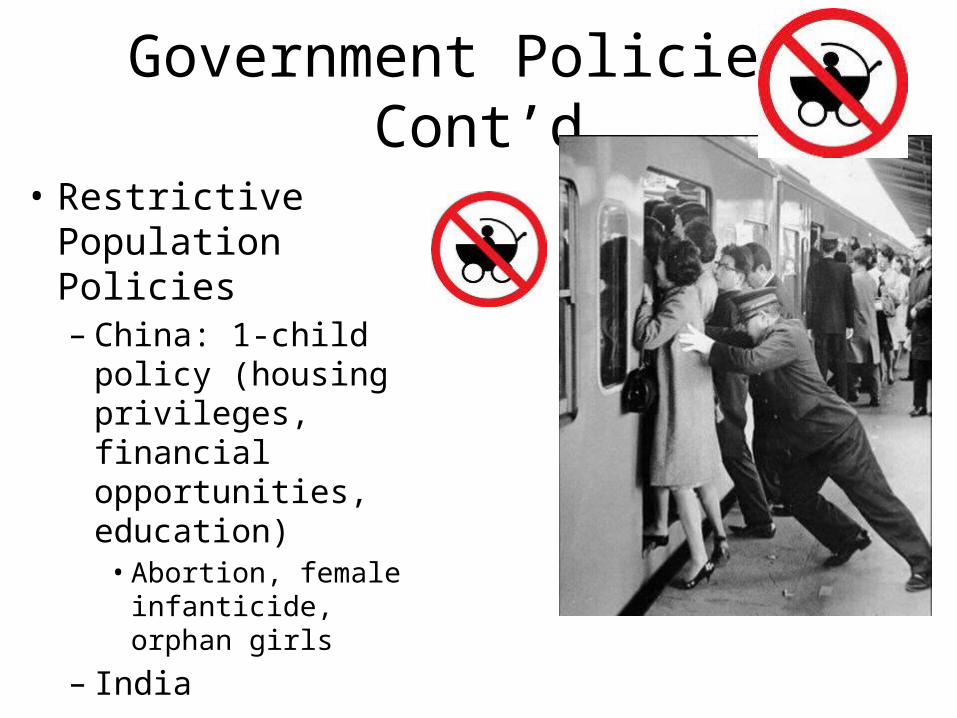
Government Policies: Cont’d
• Restrictive Population Policies– China: 1-child policy
(housing privileges, financial opportunities, education)• Abortion, female
infanticide, orphan girls
– India
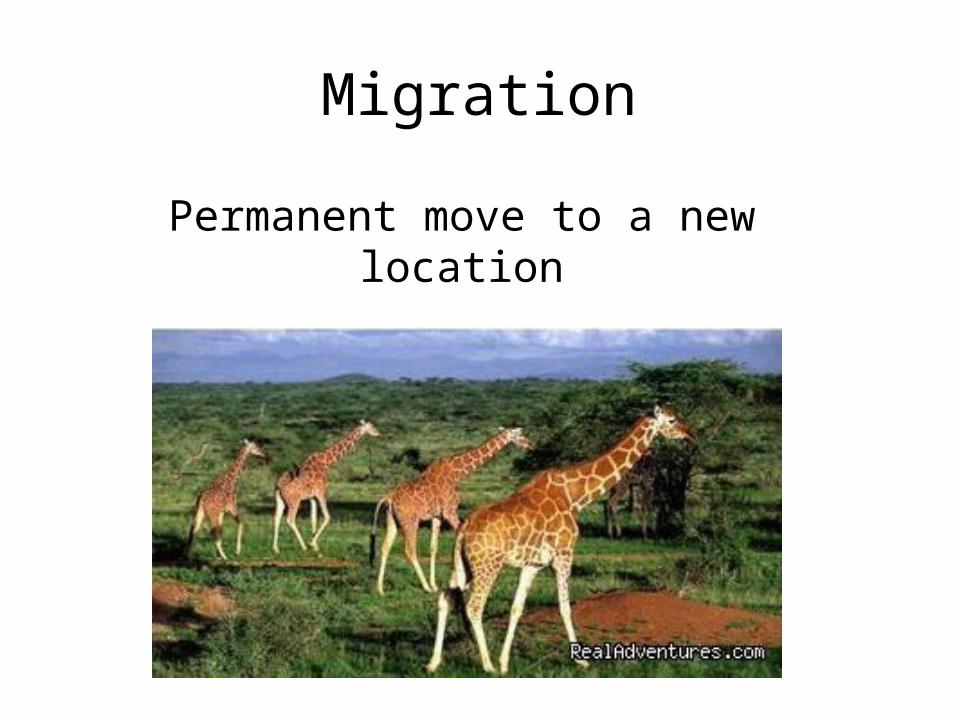
Migration
Permanent move to a new location
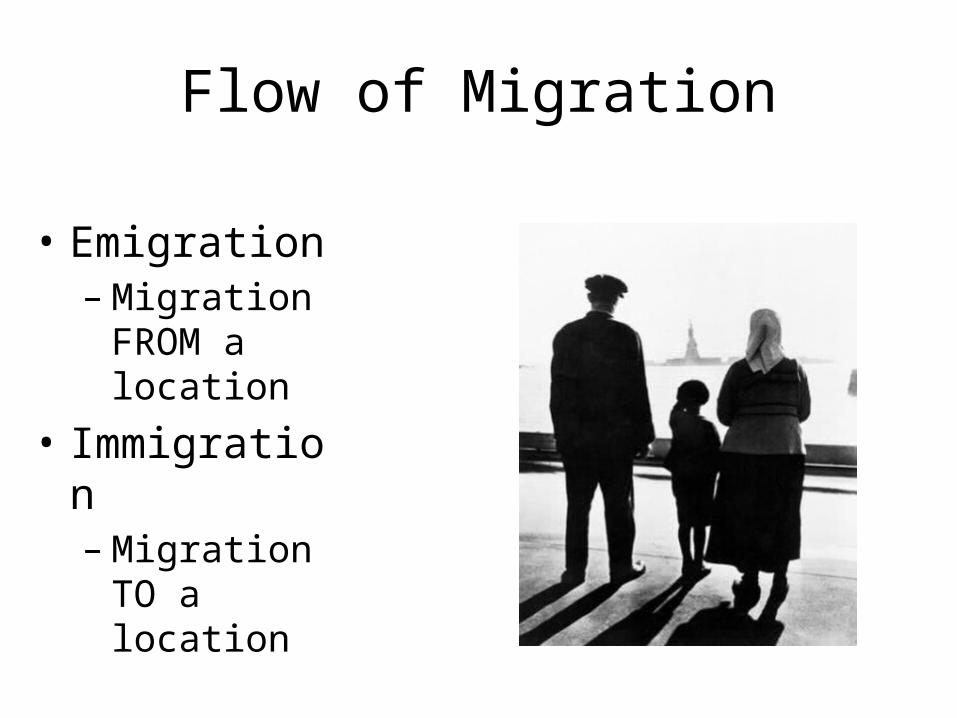
Flow of Migration
• Emigration– Migration
FROM a location
• Immigration– Migration TO
a location
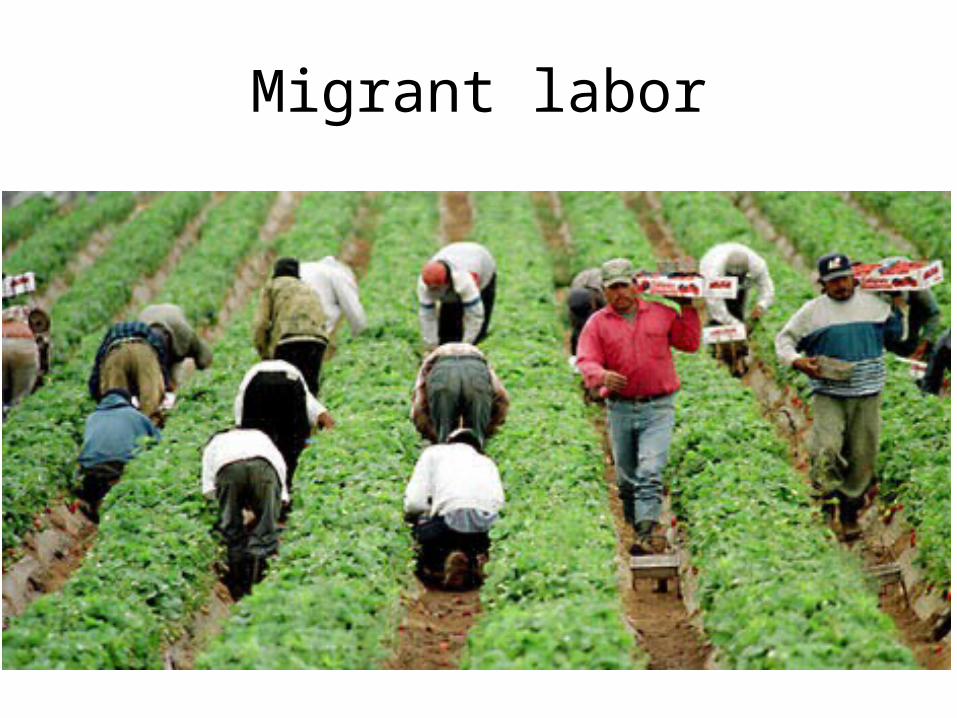
Migrant labor

Push Factors vs. Pull Factors• Push Factor: induces people to move out of their location
• Pull factor: induces people to move into a new location
I think I need to move…
Main reason for international migration?
• Job related opportunities
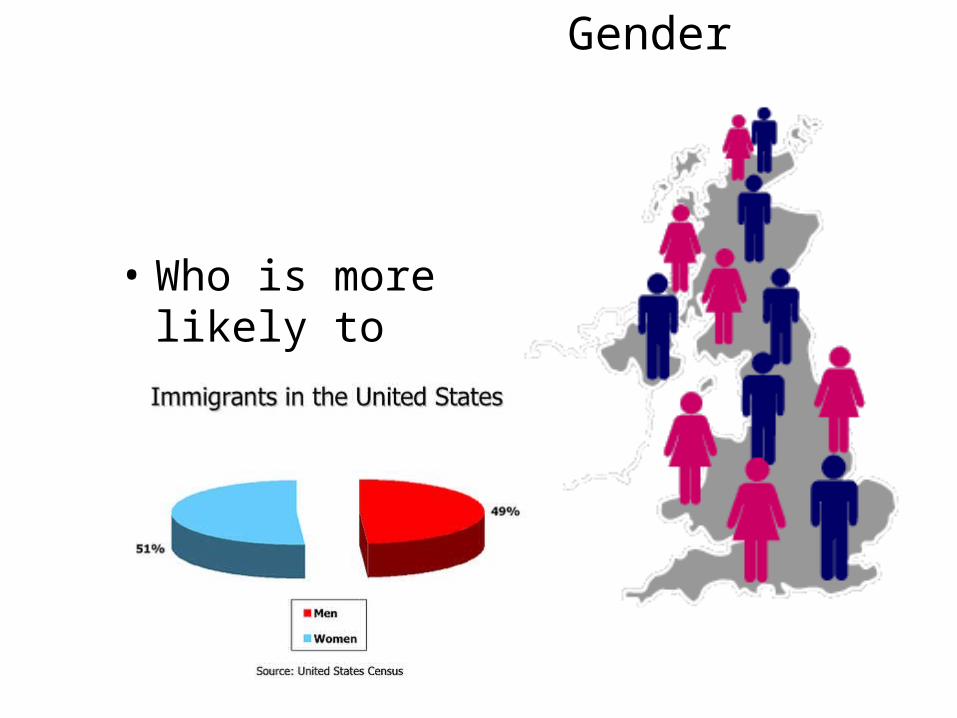
Gender
• Who is more likely to migrate? Why?
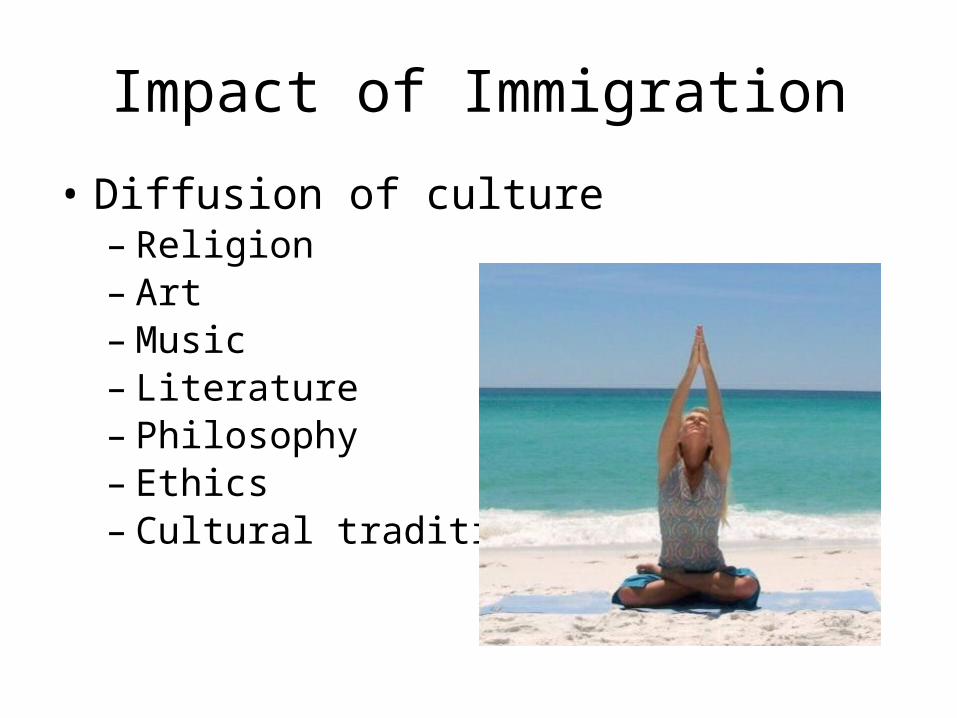
Impact of Immigration
• Diffusion of culture– Religion– Art– Music– Literature– Philosophy– Ethics– Cultural traditions
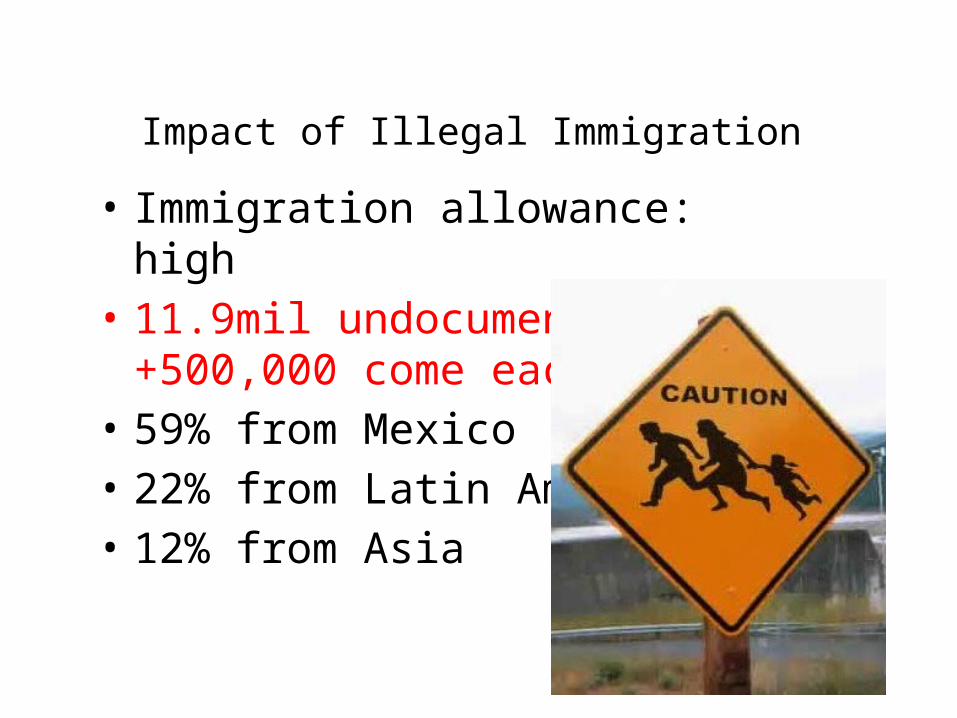
Impact of Illegal Immigration• Immigration allowance: high• 11.9mil undocumented, +500,000
come each year• 59% from Mexico• 22% from Latin America• 12% from Asia
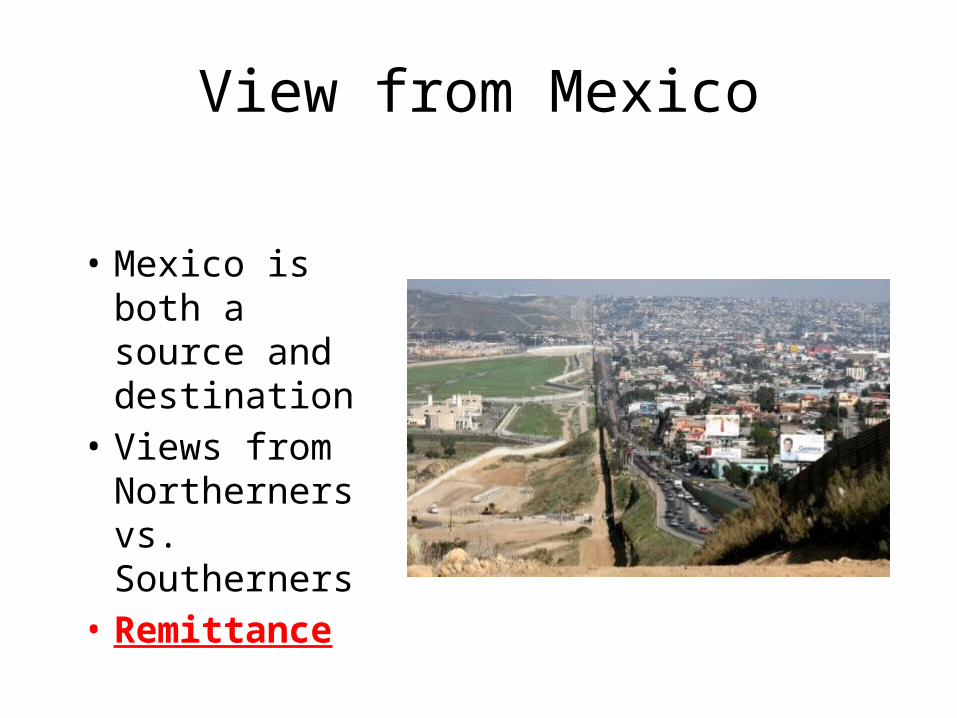
View from Mexico
• Mexico is both a source and destination
• Views from Northerners vs. Southerners
• Remittance