Embed Size (px)
Citation preview

Adopted September 21, 2011 Approved by EPA May 30, 2012
Two Total Maximum Daily Loads for Indicator Bacteria in Cottonwood Branch and Grapevine Creek
Segments 0822A and 0822B Assessment Units: 0822A_02 and 0822B_01
P r e p a r e d b y t h e O f f i c e o f W a t e r , W a t e r Q u a l i t y P l a n n i n g D i v i s i o n
TEXAS C OMM IS SION ON ENVIR ONMEN TA L QU ALI TY

Two Total Maximum Daily Loads for Indicator Bacteria in Cottonwood Branch and Grapevine Creek
Texas Commission on Environmental Quality ii Adopted September 2011
Distributed by the Total Maximum Daily Load Team
Texas Commission on Environmental Quality MC-203
P.O. Box 13087 Austin, Texas 78711-3087
TMDL project reports are available on the TCEQ website at <www.tceq.state.tx.us/implementation/water/tmdl/66_cottongrape_bacteria.html/>
The preparation of this report was financed in part through grants from
the U.S. Environmental Protection Agency.
This TMDL report is based in part on the reports titled “Technical Support Document for Bacteria TMDLs:
Segment 0822A– Cottonwood Branch & Segment 0822B – Grapevine Creek” and
“Allocation Support Document for Two Total Maximum Daily Loads for Bacteria in Cottonwood Branch and Grapevine Creek”
Prepared by the Texas Institute for Applied Environmental Research

Two Total Maximum Daily Loads for Indicator Bacteria in Cottonwood Branch and Grapevine Creek
Texas Commission on Environmental Quality iii Adopted September 2011
Contents Executive Summary ........................................................................................................................ 1 Introduction ................................................................................................................................... 2 Problem Definition ........................................................................................................................ 3
Ambient Indicator Bacteria Concentrations ......................................................................... 3 Watershed Overview ...................................................................................................................... 3 Endpoint Identification ................................................................................................................. 8 Source Analysis .............................................................................................................................. 8
Permitted Sources ................................................................................................................... 8 Domestic and Industrial Wastewater Facilities .............................................................. 8 Sanitary Sewer Overflows................................................................................................. 8 TPDES-Regulated Stormwater ........................................................................................ 9 Illicit Discharges.............................................................................................................. 10
Unregulated Sources .............................................................................................................. 11 Wildlife and Unmanaged Animal Contributions ........................................................... 11 Unregulated Agricultural Activities and Domesticated Animals ................................. 11 Failing On-site Sewage Facilities .................................................................................... 12 Domestic Pets ................................................................................................................... 12
Linkage Analysis ........................................................................................................................... 13 Load and Flow Duration Curve Analyses ............................................................................. 13 Load Duration Curve Results ................................................................................................ 15
Seasonal Variation ........................................................................................................................ 15 Margin of Safety ............................................................................................................................18 Pollutant Load Allocation ............................................................................................................. 19
Wasteload Allocation ............................................................................................................. 19 Load Allocation ............................................................................................................................ 22
Future Growth ....................................................................................................................... 22 TMDL Calculations ............................................................................................................... 23
Public Participation ..................................................................................................................... 26 Implementation and Reasonable Assurances............................................................................ 26
Key Elements of an I-Plan .................................................................................................... 27 References ................................................................................................................................. 27 Appendix A. Equations for Calculating TMDL Allocations for Changed Contact
Recreation Standard ............................................................................................... 29

Two Total Maximum Daily Loads for Indicator Bacteria in Cottonwood Branch and Grapevine Creek
Texas Commission on Environmental Quality iv Adopted September 2011
Figures Figure 1. Cottonwood Branch and Grapevine Creek study area showing locations of
AUs and monitoring stations. .................................................................................. 5 Figure 2. Map of land use for impaired AU 0822A_02 of Cottonwood Branch .................. 6 Figure 3. Map of land use for Grapevine Creek watershed..................................................... 7 Figure 4. Grapevine Creek watershed (regulated/unregulated stormwater areas) ........... 10 Figure 5. Load duration curve for station 17165 (AU 0822A_02) ....................................... 16 Figure 6. Load duration curve for station 17166 (AU 0822A_02 ........................................ 16 Figure 7. Load duration curve for station 17531 (AU 0822B_01) ........................................ 17 Figure 8. Load duration curve for station 17939 (AU 0822B_01) ....................................... 17 Figure 9. Load duration curve for station 20311 (AU 0822B_01) .......................................18 Figure A-1. Allocation loads for Cottonwood Branch, AU 0822A_02, as a function of
water quality criteria ............................................................................................... 30 Figure A–2. Allocation loads for Grapevine Creek, AU 0822B_01, as a function of
water quality criteria ................................................................................................ 31
Tables Table 1. Summary of routine monitoring: E. coli data for November 2001 -
October 2004 ............................................................................................................ 4 Table 2. Land use summary for Cottonwood Branch, impaired AU 0822A_02, and
Grapevine Creek, impaired AU0822B_01. ............................................................. 6 Table 3. Phase I and Phase II MS4 stormwater discharges in AUs 0822A_02 and
0822B_01 .................................................................................................................. 9 Table 4. Estimated numbers of pets in the TMDL area watershed and their
estimated fecal coliform daily production (x 109) .................................................. 12 Table 5. Summary of TMDL calculation for Cottonwood Branch and
Grapevine Creek ...................................................................................................... 24 Table 6. Future growth computations for Cottonwood Branch and Grapevine Creek .... 24 Table 7. Regulated stormwater computation for Cottonwood Branch (AU 0822A_02)
and Grapevine Creek (AU 0822B_01) .................................................................. 24 Table 8. Non-regulated stormwater computation for Cottonwood Branch (AU
0822A_02) and Grapevine Creek (AU 0822B_01) ............................................. 25 Table 9. TMDL allocation summary for Cottonwood Branch and Grapevine Creek ....... 25 Table 10. Final TMDL allocations for Cottonwood Branch (AU 0822A_02) and
Grapevine Creek (AU 0822_01) ............................................................................ 25

Two Total Maximum Daily Loads for Indicator Bacteria in Cottonwood Branch and Grapevine Creek
Texas Commission on Environmental Quality v Adopted September 2011
List of Abbreviations AU assessment unit AVMA American Veterinary Medical Association BMP best management practice CFR Code of Federal Regulations cfs cubic feet per second cms cubic meters per second DMR Discharge Monitoring Report
EPA Environmental Protection Agency E. coli Escherichia coli
FDC flow duration curve GIS geographic information system gpcd gallons per capita per day ha hectare I/I inflow and infiltration I-Plan implementation plan km kilometer LA load allocation LDC load duration curve MGD million gallons per day mm millimeter mL milliliter MOS margin of safety MPN most probable number MS4 municipal separate storm sewer system NCTCOG North Central Texas Council of Governments NDEP Nevada Division of Environmental Protection NEIWPCC New England Interstate Water Pollution Control Commission NPDES National Pollutant Discharge Elimination System NWS National Weather Service OSSF on-site sewage facility SSO sanitary sewer overflow SWPPP Stormwater Pollution Prevention Plan SWQMIS Surface Water Quality Monitoring Information System TCEQ Texas Commission on Environmental Quality TIAER Texas Institute for Applied Environmental Research TMDL total maximum daily load TPDES Texas Pollutant Discharge Elimination System TRA Trinity River Authority USGS United States Geological Survey WLA wasteload allocation WQMP Water Quality Management Plan WWTF wastewater treatment facility
Two Total Maximum Daily Loads for Indicator Bacteria in Cottonwood Branch and Grapevine Creek
Texas Commission on Environmental Quality vi Adopted September 2011

Texas Commission on Environmental Quality 1 Adopted September 2011
Two Total Maximum Daily Loads for Indicator Bacteria in Cottonwood
Branch and Grapevine Creek
Executive Summary This document describes total maximum daily loads (TMDLs) for Cottonwood Branch and Grapevine Creek, where concentrations of indicator bacteria exceed the criteria used to evaluate attainment of the contact recreation use. The Texas Commission on Environmental Quality (TCEQ) first identified the impairments in the 2006 version of the Texas Water Quality Inventory and 303(d) List.
Cottonwood Branch and Grapevine Creek (Segments 0822A and 0822B) are urban creeks located in the north central portion of the Dallas-Fort Worth metroplex. Both are tributaries to the Elm Fork Trinity River below Lake Lewisville (Segment 0822). Grapevine Creek (0822B) is the larger of the two creeks with a drainage area of 9,295 acres, while Cottonwood Branch (0822A) has a drainage area of 2,964 acres. Cottonwood Branch is divided into two assessment units (AUs) while Grapevine Creek consists of a single AU. The drainage area of both AUs for Cottonwood Branch and the sole AU for Grapevine Creek lie entirely within Dallas County with the exception of the upstream portion of the AU for Grapevine Creek that lies within Tarrant County.
Escherichia coli (E. coli) are the preferred indicator bacteria for assessing the contact recreation use in freshwater, and were used for development of the TMDL. The criteria for assessing attainment of the contact recreation use are expressed as the number (or “counts”) of E. coli bacteria, typically given as the most probable number (MPN) per hundred milliliters (100 mL) of water. The contact recreation use is not supported when the geometric mean of all E. coli samples exceeds 126 MPN per 100 mL, or if individual samples exceed 394 MPN per 100 mL more than 25 percent of the time.
Historical ambient water quality data for indicator bacteria (November 2001 - October 2004) were analyzed on select TCEQ monitoring stations in the Cottonwood Branch and Grapevine Creek watersheds. The geometric means of E. coli exceeded the standard in the upstream AU of Cottonwood Branch, 0822A_02, and in the single AU of Grapevine Creek, 0822B_01, with the geometric means calculated as 786 MPN/100 mL and 411 MPN/100 mL, respectively.
The most probable sources of indicator bacteria within the watersheds of the impaired AUs are stormwater runoff from permitted storm sewer sources, dry weather discharges (illicit discharges) from storm sewers, sanitary sewer overflows, and unregulated sources such as wildlife, unmanaged feral animals and pets.
A load duration curve analysis was used to quantify allowable pollutant loads and specific TMDL allocations for point and nonpoint sources of indicator bacteria. The TMDL allocations are discussed in the section “TMDL Calculations.”
Compliance with these TMDLs is based on keeping the indicator bacteria concentrations in the selected waters below the geometric mean criterion of 126 MPN/100 mL.
Future growth of existing or new point sources was determined using population projections. The TMDL calculations in this report will guide determination of the

Two Total Maximum Daily Loads for Indicator Bacteria in Cottonwood Branch and Grapevine Creek
Texas Commission on Environmental Quality 2 Adopted September 2011
assimilative capacity of each stream under changing conditions, including future growth. Wastewater discharge facilities will be evaluated on a case-by-case basis.
Introduction Section 303(d) of the federal Clean Water Act requires all states to identify waters that do not meet, or are not expected to meet, applicable water quality standards. States must develop a TMDL for each pollutant that contributes to the impairment of a listed water body. The TCEQ is responsible for ensuring that TMDLs are developed for impaired surface waters in Texas.
A TMDL is like a budget—it determines the amount of a particular pollutant that a water body can receive and still meet its applicable water quality standards. TMDLs are the best possible estimates of the assimilative capacity of the water body for a pollutant under consideration. A TMDL is commonly expressed as a load with units of mass per time period, but may be expressed in other ways. TMDLs must also estimate how much the pollutant load must be reduced from current levels in order to achieve water quality standards.
The TMDL Program is a major component of Texas’ overall process for managing the quality of its surface waters. The program addresses impaired or threatened streams, reservoirs, lakes, bays, and estuaries (water bodies) in, or bordering on, the state of Texas. The primary objective of the TMDL Program is to restore and maintain the beneficial uses—such as drinking water supply, recreation, support of aquatic life, or fishing—of impaired or threatened water bodies. This TMDL addresses impairments to the contact recreation use due to exceeding indicator bacteria criteria in Cottonwood Branch and Grapevine Creek, two tributaries to the Elm Fork Trinity River below Lake Lewisville (Segment 0822) in north-central Texas.
Section 303(d) of the Clean Water Act and the implementing regulations of the U.S. Environmental Protection Agency (EPA) in Title 40 of the Code of Federal Regulations (CFR), Part 130 (40 CFR 130) describe the statutory and regulatory requirements for acceptable TMDLs. The EPA provides further direction in its Guidance for Water Quality-Based Decisions: The TMDL Process (EPA, 1991). This TMDL document has been prepared in accordance with those regulations and guidelines.
The TCEQ must consider certain elements in developing a TMDL. They are described in the following sections of this report:
Problem Definition Endpoint Identification Source Analysis Linkage Analysis Seasonal Variation Margin of Safety Pollutant Load Allocation Public Participation Implementation and Reasonable Assurance
Upon EPA approval, these TMDLs will become an update to the state’s Water Quality Management Plan (WQMP).

Two Total Maximum Daily Loads for Indicator Bacteria in Cottonwood Branch and Grapevine Creek
Texas Commission on Environmental Quality 3 Adopted September 2011
Problem Definition TCEQ first identified the impairment to the contact recreation use for Cottonwood Branch (Segment 0822A) and Grapevine Creek (Segment 0822B) in the 2006 Texas Water Quality Inventory and 303(d) List (TCEQ, 2008b). All or part of each water body was subsequently included on the 2008 and Draft 2010 §303(d) Lists under category 5a, indicating that they are a priority for developing a TMDL.
The impaired AUs in Segments 0822A and 0822B on the 303(d) list are 0822A_02 and 0822B_01 (TCEQ, 2008b) (see Figure 1). An AU is the smallest geographic area of use support reported in the Texas Integrated Report. These AUs define the TMDL area addressed in this report.
The standards for water quality are defined in the Texas Surface Water Quality Standards (TSWQS) (TCEQ 2000). Contact recreation is the presumed use in Cottonwood Branch and Grapevine Creek under the current TSWQS. E. coli are the preferred indicator bacteria for assessing the contact recreation use in freshwater, and were used for analysis and modeling to support TMDL development for the watershed. The criteria for assessing attainment of the contact recreation use are expressed as the number (or “counts”) of E. coli bacteria, typically given as the most probable number (MPN). For the E. coli indicator, if the minimum sample requirement is met, the contact recreation use is not supported when:
the geometric mean of all E. coli and/or individual samples exceed 394 MPN per 100 mL more than 25 percent of the
time.
samples exceeds 126 MPN per 100 mL;
Ambient Indicator Bacteria Concentrations Table 1 presents a historical summary of ambient indicator bacteria data from the TCEQ surface water database, Surface Water Quality Monitoring Information System (SWQMIS) for November 2001 through October 2004. All AUs in Segments 0822A and 0822B are included in the data summary. As indicated in Table 1, only the AUs associated with TCEQ stations 17165 and 17166 (in AU 0822A_02) and 17531 and 17939 (in AU 0822B_01) exceeded the geometric mean criterion of 126 MPN/100 mL.
Watershed Overview Cottonwood Branch lies within the jurisdictional area of the City of Irving, Dallas County (Figure 1). The creek is defined in the Draft 2010 Texas Integrated Report for Clean Water Act Sections 305(b) and 303(d) (formerly the Water Quality Inventory and List) as starting at Valley View Lane, at the south end of Dallas-Fort Worth (DFW) International Airport and extending approximately six miles eastward to the confluence with Hackberry Creek. The creek consists of two AUs (see Figure 1) defined in the Draft 2010 Texas Integrated Report as follows.
AU 0822A_01 is the downstream portion of Cottonwood Branch, from the confluence with Hackberry Creek at the downstream end to the upstream end at North Story Road.
AU 0822A_02 is the upstream portion of Cottonwood Branch, from 0.5 miles downstream of North Story Road to the upstream end at Valley View Lane.
AU 0822A_02 is the focus of TMDL development.
Two Total Maximum Daily Loads for Indicator Bacteria in Cottonwood Branch and Grapevine Creek
Texas Commission on Environmental Quality 4 Adopted September 2011
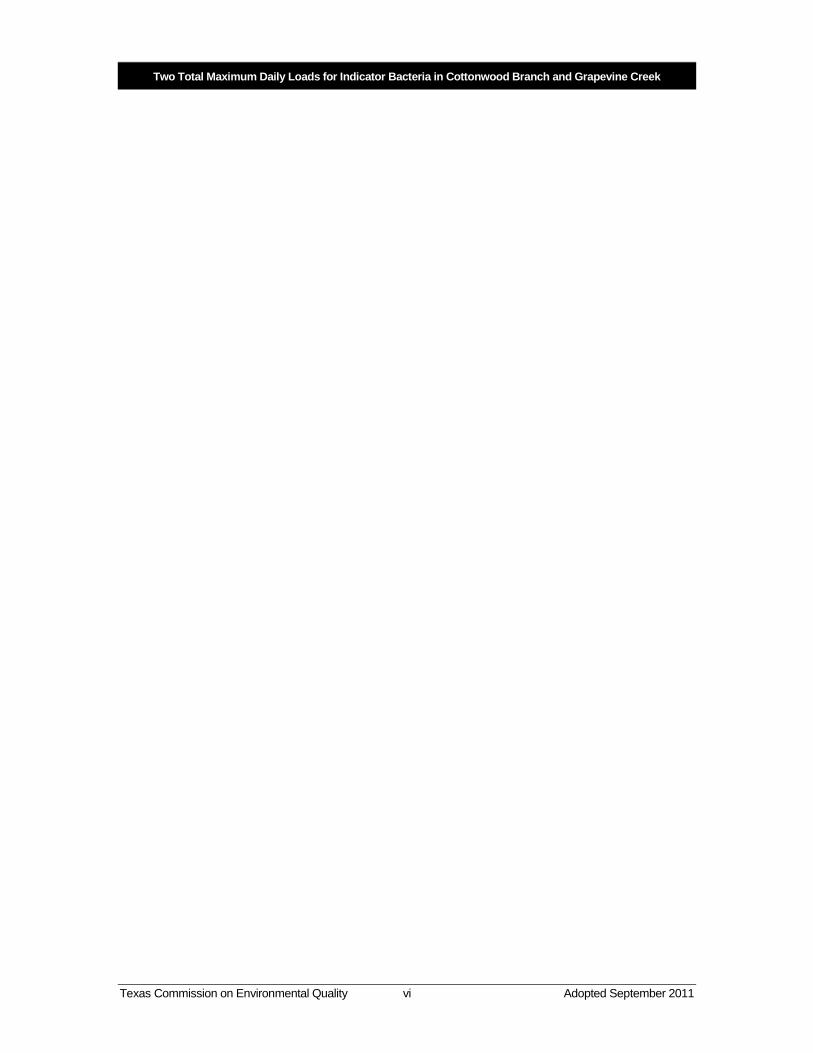
The drainage area encompassing AU 0822A_02 of Cottonwood Branch is 723 hectares (ha), about three square miles. Dominant land uses in the watershed include residential (31%), undeveloped (22%), commercial/industrial (22%); and infrastructure (19%) (Figure 2, Table 2). The remaining land use categories comprise 7% of the land cover.
Grapevine Creek flows approximately ten miles from its headwaters west of International Parkway in Tarrant County, downstream to its confluence with the Elm Fork Trinity River (Segment 0822) in Dallas County (Figure 1; TCEQ, 2010). The Grapevine Creek drainage area lies within the jurisdictional areas of the City of Irving, City of Coppell, City of Grapevine, and DFW International Airport. The entire reach of Grapevine Creek, from the headwaters to the confluence with the Elm Fork Trinity River, consists of one AU, defined as follows:
AU 0822B_01 is the portion of Grapevine Creek from the confluence with the Elm Fork Trinity River in Dallas County upstream to its headwaters west of International Parkway at the DFW Airport in Tarrant County.
Table 1. Summary of routine monitoring: E. coli(Downloaded from SWQMIS July – August 2009)
data for November 2001 - October 2004
Stations provided in an upstream to downstream order. Only AUs 0822A_02 and 0822B_01 indicate nonsupport of contact recreation use.
AU Station ID Location No. of
Samples
Range of Measured E.
coli Station Geometric Mean
(MPN/100mL)
Concentrations (MPN/100mL)
AU
Geometric Mean (MPN/100mL)
0822A_01 18359 433 m upstream of N. MacArthur Blvd / Dallas Co.
16 2 – 2,600 37 47
17167 N. MacArthur Blvd / Dallas Co. 7 3 – >2,400 154
17168 Spur 348 (Northwest Hwy) / Dallas Co. 31 <1 – 977 41
0822A_02 17165 N. Beltline Rd. / Dallas Co. 32 19 – >4,838 764 786
17166 N. Story Rd. / Dallas Co. 30 99 – >4,840 811
0822B_01 17531 Airfield North upstream of bridge / Tarrant Co.
12 21 – >2,419 121 411
17939 Regent Blvd. 535 m upstream of I-635 / Dallas Co.
22 48 – 4,838 799
In the Grapevine Creek watershed, North Lake, a cooling reservoir for a recently closed power plant, has a storage capacity of approximately 17,000 acre-feet and drains via an unnamed tributary into Grapevine Creek approximately 300 meters upstream of TCEQ station 20311 at MacArthur Blvd. (Figure 1). North Lake and its drainage area are considered

Two Total Maximum Daily Loads for Indicator Bacteria in Cottonwood Branch and Grapevine Creek
Texas Commission on Environmental Quality 5 Adopted September 2011
a non-contributing portion of the Grapevine Creek watershed from the perspective of both bacteria loading and streamflow. Power company staff report that North Lake rarely releases into Grapevine Creek, with discharges typically occurring a few years apart (personal communication, John Mummert, TCEQ; December 1, 2009).
Figure 1. Cottonwood Branch and Grapevine Creek study area showing locations of AUs and monitoring stations.
Two Total Maximum Daily Loads for Indicator Bacteria in Cottonwood Branch and Grapevine Creek
Texas Commission on Environmental Quality 6 Adopted September 2011
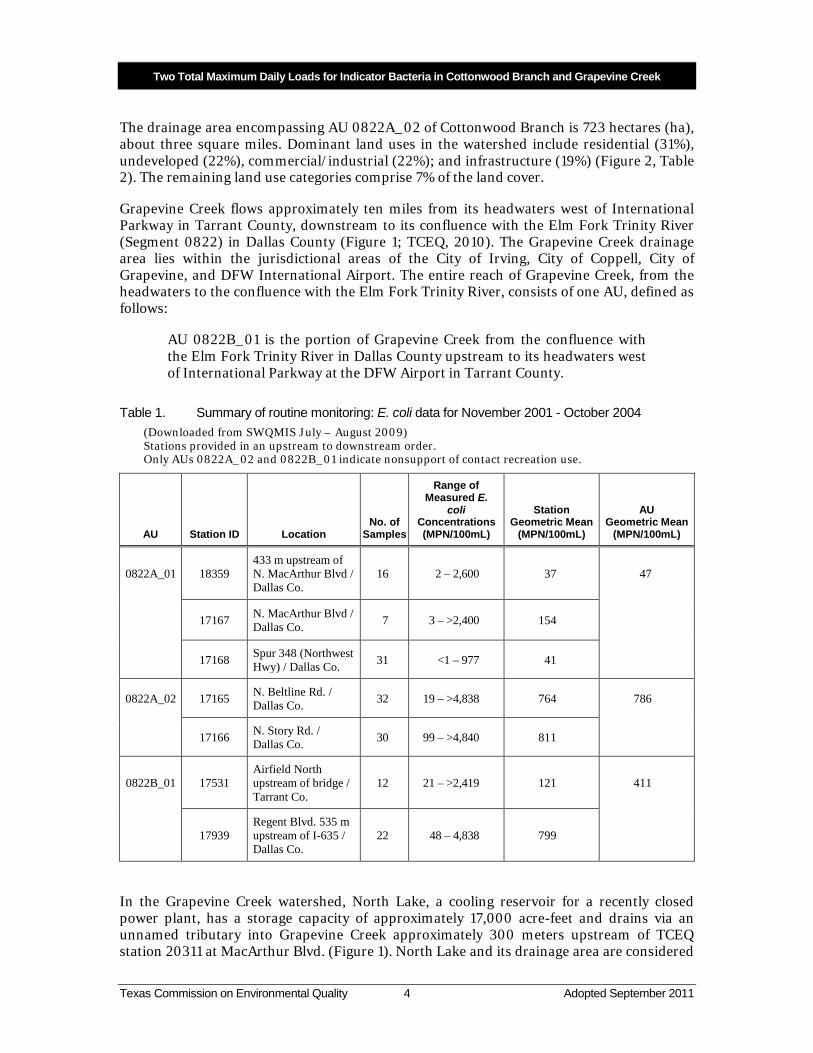
Figure 2. Map of land use for impaired AU 0822A_02 of Cottonwood Branch (Source: North Central Texas Council of Governments (NCTCOG) GIS Data Clearinghouse website <www.dfwmaps.com/clearinghouse/metadata.asp>. Represents land use/cover estimates for 2005.)
Table 2. Land use summary for Cottonwood Branch, impaired AU 0822A_02, and Grapevine
Creek, impaired AU0822B_01.
Aggregated Land Use Category Cottonwood Branch (0822A_02)
Area | % of Total Grapevine Creek (0822B_01) Area | % of Total
Residential 224 31.01 1,027 33.43
Undeveloped 156 21.56 789 25.68
Commercial/Industrial 156 21.53 770 25.04
Infrastructure 138 19.12 423 13.75
Parks 45 6.17 56 1.82
Water 4 .61 8 .28
723 hectares TOTALS 100% 3,073 hectares 100%
Two Total Maximum Daily Loads for Indicator Bacteria in Cottonwood Branch and Grapevine Creek
Texas Commission on Environmental Quality 7 Adopted September 2011
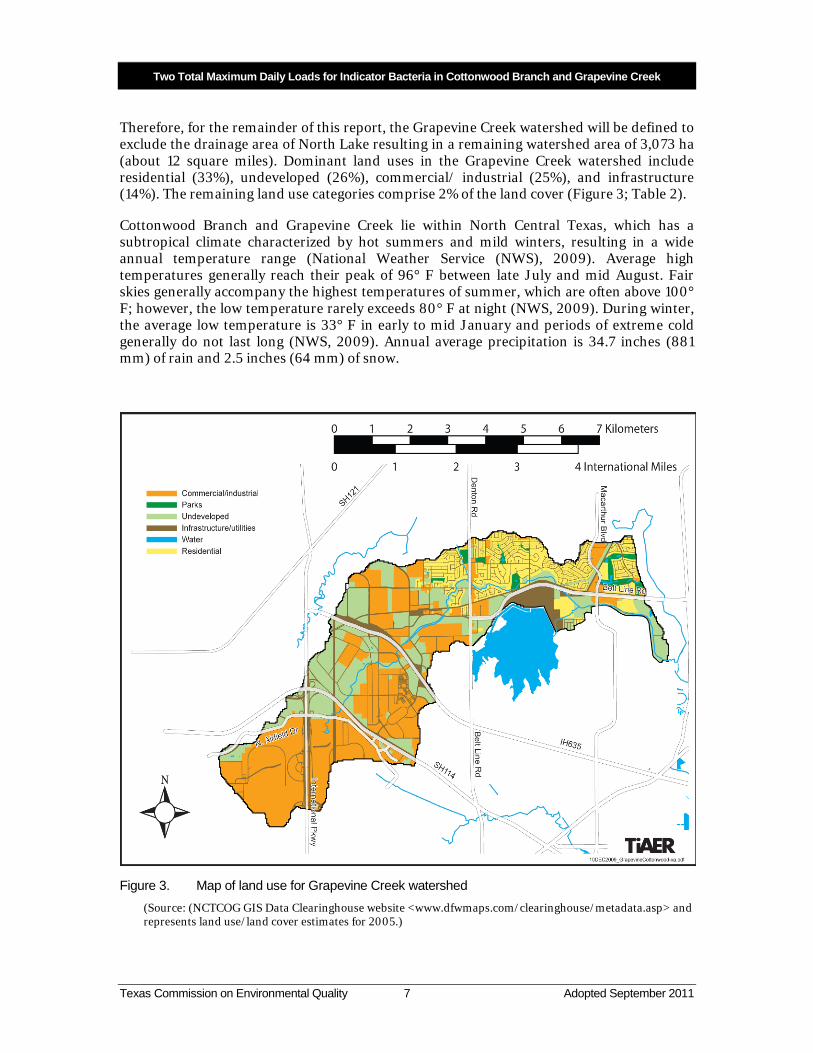
Therefore, for the remainder of this report, the Grapevine Creek watershed will be defined to exclude the drainage area of North Lake resulting in a remaining watershed area of 3,073 ha (about 12 square miles). Dominant land uses in the Grapevine Creek watershed include residential (33%), undeveloped (26%), commercial/ industrial (25%), and infrastructure (14%). The remaining land use categories comprise 2% of the land cover (Figure 3; Table 2).
Cottonwood Branch and Grapevine Creek lie within North Central Texas, which has a subtropical climate characterized by hot summers and mild winters, resulting in a wide annual temperature range (National Weather Service (NWS), 2009). Average high temperatures generally reach their peak of 96° F between late July and mid August. Fair skies generally accompany the highest temperatures of summer, which are often above 100° F; however, the low temperature rarely exceeds 80° F at night (NWS, 2009). During winter, the average low temperature is 33° F in early to mid January and periods of extreme cold generally do not last long (NWS, 2009). Annual average precipitation is 34.7 inches (881 mm) of rain and 2.5 inches (64 mm) of snow.
Figure 3. Map of land use for Grapevine Creek watershed (Source: (NCTCOG GIS Data Clearinghouse website <www.dfwmaps.com/clearinghouse/metadata.asp> and represents land use/land cover estimates for 2005.)
Two Total Maximum Daily Loads for Indicator Bacteria in Cottonwood Branch and Grapevine Creek
Texas Commission on Environmental Quality 8 Adopted September 2011
Endpoint Identification All TMDLs must identify a quantifiable water quality target that indicates the desired water quality condition and provides a measurable goal for the TMDL. The TMDL endpoint serves to focus the technical work to be accomplished and as a criterion against which to evaluate future conditions.
The endpoint for the TMDLs in this report is to maintain concentrations of E. coli below the geometric mean criterion of 126 MPN/100 mL in Cottonwood Branch (impaired AU 0822A_02) and Grapevine Creek (impaired AU 0822B_01).
Source Analysis Potential sources of indicator bacteria pollution can be divided into two primary categories: regulated and unregulated. Pollution sources that are regulated have permits under the Texas Pollutant Discharge Elimination System (TPDES) and the National Pollution Discharge Elimination System (NPDES). Examples of regulated sources include:
municipal and private domestic wastewater treatment facility (WWTF) discharges; industrial facilities with individual stormwater permits and/or discharging treated
industrial wastewater and/or groundwater; and stormwater discharges from industries, construction, and municipal separate storm
sewer systems (MS4s). Nonpoint source pollution originates from multiple locations, usually carried to surface waters by rainfall runoff. It is not regulated by permit under the TPDES or NPDES.
Permitted Sources Permitted sources are regulated by permit under the TPDES and the NPDES. Stormwater discharges from industries, construction sites, and MS4s represent the permitted sources in impaired AUs 0822A_02 and 0822B_01.
Domestic and Industrial Wastewater Facilities Currently there are no individually authorized domestic or industrial WWTF dischargers located within the watershed of either stream. The entire watersheds of both impaired AUs are located within the wastewater and sewered collection system area served by the Trinity River Authority (TRA) Central Regional WWTF (Figure 1).
DFW Airport has an individual industrial permit (WQ0001441) that authorizes the discharge of stormwater. The permit includes one outfall (059) that discharges to Grapevine Creek. The permit is targeted at the control of stormwater runoff following aircraft de-icing operations. The discharge is considered intermittent and variable (subject to precipitation and runoff), and no flow limit is specified in the permit. In addition, the Airport is also covered under the TPDES Phase II MS4 General Stormwater Permit. Given the circumstances of the permit, this outfall will be treated as part of the TPDES-permitted stormwater discharge load.
Sanitary Sewer Overflows Sanitary sewer overflows (SSOs) are unauthorized discharges that must be addressed by the responsible party, either the TPDES permittee or the owner of the collection system that is

Two Total Maximum Daily Loads for Indicator Bacteria in Cottonwood Branch and Grapevine Creek
Texas Commission on Environmental Quality 9 Adopted September 2011
connected to a permitted system. SSOs in dry weather most often result from blockages in the sewer collection pipes caused by tree roots, grease, and other debris. Inflow and infiltration (I/I) are typical causes of SSOs under conditions of high flow in the WWTF system. Blockages in the line may exacerbate the I/I problem. Other causes, such as a collapsed sewer line, may occur under any condition.
The importance of SSOs as a source of bacteria loadings is typically difficult to assess. A damaged sewer line near TCEQ station 17166 in Cottonwood Branch (Figure 1) is suspected of being a major source of high E. coli values determined for samples collected at this station in 2008 during TMDL bacteria data collection. The sewer line has since been repaired. The TCEQ Region 4 records of SSOs reported by responsible entities in the Dallas–Fort Worth Metroplex were reviewed for the period September 2003 – February 2009. The database contains entries that appear to be within the Cottonwood Branch and Grapevine Creek watersheds, though most of these entries are the result of relatively minor line blockages. Based on available information it is concluded that SSOs do not appear to be a widespread source of bacteria to the two creeks; however, they may at times be a significant source in localized portions of either creek. Further evaluation of any sewer line issues in the watersheds can be made during the implementation phase of this project.
TPDES-Regulated Stormwater When evaluating stormwater for a TMDL allocation, a distinction must be made between stormwater originating from an area under a TPDES-regulated discharge permit and stormwater originating from areas not under a TPDES-regulated discharge permit. Stormwater discharges fall into two categories:
stormwater subject to regulation, which is any stormwater originating from TPDES Phase I and Phase II MS4-permitted discharges (Table 3), permitted industrial stormwater areas, and permitted construction site areas; and
stormwater not subject to regulation.
Table 3. Phase I and Phase II MS4 stormwater discharges in AUs 0822A_02 and 0822B_01
Impaired AU Regulated Entity Name NPDES Permit Number a TPDES Permit Number
0822A_02 North Texas Tollway Authority TXS000703 WQ0004400
0822A_02 and 0822B_01 City of Irving TXS001301 WQ0004691
0822B_01 City of Coppell TXR040375 TXR040000
0822B_01 City of Dallas TXS000701 WQ0004396
0822B_01 DFW International Airport TX0025101 WQ0001441 b
0822B_01 DFW International Airport TXR040044 TXR040000
a
b The individual industrial stormwater permit for DFW Airport will be treated as part of the MS4 loading.
Although the jurisdictional boundary of the City of Grapevine is within the Grapevine Creek watershed, that portion of the city boundary is not within the City of Grapevine MS4 and thus is not a permittee in the Grapevine Creek TMDL.

Two Total Maximum Daily Loads for Indicator Bacteria in Cottonwood Branch and Grapevine Creek
Texas Commission on Environmental Quality 10 Adopted September 2011
Figure 4. Grapevine Creek watershed (regulated/unregulated stormwater areas)
The geographic region of Cottonwood Branch and Grapevine Creek covered by Phase I and II MS4 permits is that portion of the study area within the jurisdictional boundaries of the regulated entity. For Phase I permits, the jurisdictional area is defined by the city limits. For Phase II permits, the jurisdictional area is defined as the intersection or overlapping areas of the city limits and the 2000 Census Urbanized Area. Of the MS4 permitted entities in the two watersheds, the City of Dallas, City of Irving, and North Texas Tollway Authority have a Phase I permit (Table 3).
The entire watershed of the impaired AU of Cottonwood Branch (0822A_02) is regulated under MS4 permits, and 84.8 percent of the Grapevine Creek (AU 0822B_01) watershed is within the regulated area of MS4 permits (Figure 4). DFW Airport is covered under two stormwater permits—an individual industrial stormwater permit (WQ0001441) and the Phase II MS4 general permit (TXR040000). As noted previously, Outfall 059 in the individual industrial stormwater permit for DFW Airport will be treated as part of the MS4 loading for AU 0822B_01 in Grapevine Creek.
Illicit Discharges Bacteria loads from regulated stormwater can enter the streams from permitted outfalls and illicit discharges under both dry and wet weather conditions. The term “illicit discharge” is defined in TPDES General Permit No. TXR040000 for Phase II MS4s as, “Any discharge to a municipal separate storm sewer that is not entirely composed of stormwater, except

Two Total Maximum Daily Loads for Indicator Bacteria in Cottonwood Branch and Grapevine Creek
Texas Commission on Environmental Quality 11 Adopted September 2011
discharges pursuant to this general permit or a separate authorization and discharges resulting from emergency fire fighting activities.” Illicit discharges can be categorized as either direct or indirect contributions. New England Interstate Water Pollution Control Commission (NEIWPCC) provides examples of illicit discharges identified in the Illicit Discharge Detection and Elimination Manual: A Handbook for Municipalities (NEIWPCC, 2003) including:
Direct illicit discharges
• sanitary wastewater piping that is directly connected from a home to the storm sewer;
:
• materials (e.g., used motor oil) that have been dumped illegally into a storm drain catch basin;
• a shop floor drain that is connected to the storm sewer; and • a cross-connection between the municipal sewer and storm sewer systems.
Indirect illicit discharges
• an old and damaged sanitary sewer line that is leaking fluids into a cracked storm sewer line; and
:
• a failing septic system that is leaking into a cracked storm sewer line or causing surface discharge into the storm sewer.
Unregulated Sources Unregulated sources of indicator bacteria are generally nonpoint and can emanate from wildlife, various agricultural activities, agricultural animals, land application fields, urban runoff not covered by a permit, failing onsite sewage facilities (OSSFs), unmanaged feral animals, and domestic pets. Most of these unregulated sources are limited in scale in the TMDL study area because of the highly urban nature of the area.
Wildlife and Unmanaged Animal Contributions E. coli bacteria are common inhabitants of the intestines of all warm-blooded animals, including wildlife such as mammals, birds, and unmanaged feral animals. In developing bacteria TMDLs, it is important to identify by watershed the potential for bacteria contributions from wildlife, birds, and unmanaged feral animals. Wildlife are naturally attracted to riparian corridors of streams and rivers. With direct access to the stream channel, the direct deposition of wildlife waste can be a concentrated source of bacteria loading to a water body. Fecal bacteria from wildlife are also deposited onto land surfaces, where it may be washed into nearby streams by rainfall runoff. There are currently insufficient data available to estimate populations and spatial distribution of wildlife and avian species in the watershed. Consequently, it is difficult to assess the magnitude of bacteria contributions from wildlife species as a general category. Studies in other watersheds have found avian species to be important contributors to the bacteria load (e.g., Hussong et al., 1979; Hyer and Moyer, 2003). There is also little information available on contributions from feral animals in the watershed.
Unregulated Agricultural Activities and Domesticated Animals A number of agricultural activities that do not require permits can also be sources of fecal bacteria loading. Given the fact that the Cottonwood Branch and Grapevine Creek watersheds are highly urbanized, livestock and other domesticated animals are either not

Two Total Maximum Daily Loads for Indicator Bacteria in Cottonwood Branch and Grapevine Creek
Texas Commission on Environmental Quality 12 Adopted September 2011
found in the watershed or exist in very small numbers. Therefore, livestock and other domesticated animals are not considered a significant contributor of bacteria loads in the two impaired AUs.
Failing On-site Sewage Facilities Failing OSSFs are not considered a major source of bacteria loading in the TMDL study area because the entire watersheds of Cottonwood Branch and Grapevine Creek are served by centralized wastewater collection and treatment systems of the Trinity River Authority Central Regional WWTF. Although it is possible that small portions of the areas included in the centralized collection and treatment areas could still be serviced by OSSFs, the likelihood of many OSSFs in these two watersheds is remote. Because of this, further consideration of OSSFs as significant sources of bacteria is unnecessary.
Domestic Pets Based on the urban nature of this project and the availability of relevant data, dogs and cats are the only pets considered in calculating loads for domestic pets. Fecal matter from dogs and cats is transported to streams by runoff from urban and suburban areas and can be a potential source of bacteria loading. Table 4 summarizes the estimated number of dogs and cats for the AUs of the TMDL area watershed and provides an estimate of the fecal coliform load from domestic dogs and cats.
Table 4. Estimated numbers of pets in the TMDL area watershed and their estimated fecal
coliform daily production (x 109
AU
)
Estimated Number of Households
Number Dogsa
Number Cats b
Daily Production Dogs b
Daily Production Cats c
0822A_02
c
5,602 3,540 3,994 11,683 2,157
0822B_01 11,673 7,377 8,323 24,344 4,494
a 2005 NCTCOG population district-based estimate b 2008 AVMA national per-household estimate: 0.632 dogs; 0.713 cats c
Schueler (2000) estimated fecal coliform load per animal per day: 3.3 x 10⁹ dogs and 5.4 x 10⁸ cats
The estimated loadings are based on estimated fecal coliform production rates of 5.4x10⁸ per day for cats and 3.3x10⁹ per day for dogs (Schueler 2000). Pet population estimates were calculated based on American Veterinary Medical Association (AVMA) estimated number of dogs (0.632) and cats (0.713) per household (AVMA, 2009).
The number of households was determined using North Central Texas Council of Governments (NCTCOG) 2005 household numbers by population districts (NCTCOG, 2009a&b) with the estimate based on the percentage of each district located inside each AU and an assumed even spatial distribution of households within each district. The actual contribution and significance of fecal coliform loads from pets reaching the impaired reaches of Cottonwood Branch and Grapevine Creek is unknown.

Two Total Maximum Daily Loads for Indicator Bacteria in Cottonwood Branch and Grapevine Creek
Texas Commission on Environmental Quality 13 Adopted September 2011
Linkage Analysis Establishing the relationship between instream water quality and the source of loadings is an important component in developing a TMDL. It allows for the evaluation of management options that will achieve the desired endpoint. The relationship may be established through a variety of techniques.
Generally, if high bacteria concentrations are measured in a water body at low to median flow in the absence of runoff events, the main contributing sources are likely to be point sources or direct deposition. During ambient flows, these constant inputs to the system will increase pollutant concentrations depending on the magnitude and concentration of the sources. As flows increase in magnitude, the impact of point sources is typically diluted, and is therefore a smaller part of the overall concentrations.
Bacteria contributions from regulated and unregulated stormwater sources are greatest during runoff events. Rainfall runoff, depending upon the severity of the storm, has the capacity to carry bacteria from the land surface into the receiving stream. Generally, this loading follows a pattern of low concentration in the water body just before the rain event, followed by a rapid increase in bacteria concentrations in the water body as the first flush of storm runoff enters the receiving stream. Over time, the concentrations diminish because the sources of bacteria are attenuated as runoff washes them from the land surface and the volume of runoff decreases following the rain event.
Load and Flow Duration Curve Analyses Load duration curve (LDC) analyses were used to examine the relationship between instream water quality, the broad sources of bacteria loads (i.e., regulated point source and regulated/unregulated stormwater), and are the basis of the TMDL allocations. The strength of this TMDL is the use of the LDC method to determine the TMDL allocations.
LDCs are a simple statistical method that provides a basic description of the water quality problem. This tool is easily developed and explained to stakeholders, and uses available water quality and flow data. The LDC method does not require any assumptions regarding loading rates, stream hydrology, land use conditions, and other conditions in the watershed. The U.S. EPA supports the use of this approach to characterize pollutant sources. The TCEQ and the Texas State Soil and Water Conservation Board, identified this method as a tool for TMDL development. In addition, many other states are using this method to develop TMDLs.
The weaknesses of this method include the limited information it provides regarding the magnitude or specific origin of the various sources. Only limited information was gathered regarding point and nonpoint sources in the watershed. The general difficulty in analyzing and characterizing E. coli in the environment is also a weakness of this method.
The LDC method provides a tool for estimation of existing and allowable loads by utilizing the cumulative frequency distribution of streamflow and measured pollutant concentration data (Cleland, 2003). In addition to estimating stream loads, this method allows for the determination of the hydrologic conditions under which impairments are typically occurring, can give indications of the broad origins of the bacteria (i.e., point source and stormwater), and provides a means to allocate allowable loadings.

Two Total Maximum Daily Loads for Indicator Bacteria in Cottonwood Branch and Grapevine Creek
Texas Commission on Environmental Quality 14 Adopted September 2011
Data requirements for the LDC are minimal, consisting of continuous daily streamflow records and historical bacteria data. While the number of observations required to develop a flow duration curve is not rigorously specified, the curves are usually based on more than five years of observations, and encompasses inter-annual and seasonal variation. Ideally, the drought of record and flood of record are included in the observations. Daily average stream flows over a period of 15 years (08 August 1993 – 07 August 2008) were used for this project.
It was necessary to estimate flows within the TMDL area since there is a lack of long-term flow data at several needed locations. Daily average flows from the past 48 years were obtained from U.S. Geological Survey (USGS) gage 08057200 on White Rock Creek. This creek is located in north Dallas, roughly 14 miles to the east of the TMDL study area, and was chosen based on proximity and the similarity of land use to that of Cottonwood Branch and Grapevine Creek. Flows were estimated within AUs 0822A_02 and 0822B_01 based on application of drainage area ratios. For purposes of the pollutant load computations, the hydrologic records were adjusted to reflect future capacity estimates that account for the probability that additional flows from WWTF discharges may occur due to of future population increases.
Flow duration curves (FDCs) and LDCs for AU 0822A_02 were developed for the two TCEQ monitoring stations in the study area (17165 and 17166). FDCs and LDCs for AU 0822B_01 were developed for the three TCEQ monitoring stations in the study area (17531, 17939, and 20311). The daily flow data in units of cubic meters per second (cms) were used to first develop a FDC for each station.
The FDC was generated by (1) ranking the daily flow data from highest to lowest, (2) calculating the percent of days each flow was exceeded (rank ÷ quantity of the number of data points + 1), and (3) plotting each flow value (y-axis) against its exceedance value (x-axis). Exceedance values along the x-axis represent the percent of days that flow was at or above the associated flow value on the y-axis. Exceedance values near 100% occur during low flow or drought conditions while values approaching 0% occur during periods of high flow or flood conditions.
Bacteria LDCs were then developed based on the current numeric water quality criterion (126 MPN/100 mL) and the data from the streamflow duration curves. LDCs were developed by multiplying each streamflow value along the flow duration curves by the E. coli criterion (126 MPN/100 mL) and by the conversion factor to convert to loading in colonies per day. This effectively displays the LDC as the TMDL curve of maximum allowable loading:
TMDL (MPN/day) = criterion * flow (cms) * conversion factor Where:
Criterion = 126 MPN/100 mL (E. coliConversion factor (to MPN/day) = 864,000,000 100 mL/m
) 3
* seconds/day
The resulting curve plots each bacteria load value (y-axis) against its exceedance value (x-axis). Exceedance values along the x-axis represent the percent of days that the bacteria load was at or above the allowable load on the y-axis.
Historical bacteria data were then superimposed on the allowable bacteria LDC. Historical E. coli data from November 2001 – August 2008 were obtained from two sources: (1) routine data collected under the TCEQ Surface Water Quality Monitoring Program and the Texas

Two Total Maximum Daily Loads for Indicator Bacteria in Cottonwood Branch and Grapevine Creek
Texas Commission on Environmental Quality 15 Adopted September 2011
Clean Rivers Program and obtained from the TCEQ SWQMIS database, and (2) various additional data collected by the TMDL contractor, the Texas Institute of Applied Environmental Research (TIAER). Each historical E. coli measurement was associated with the streamflow on the day of measurement and converted to a bacteria load.
The associated streamflow for each bacteria loading was compared to the FDC data to determine its value for “percent days flow exceeded,” which becomes the “percent of days load exceeded” value for purposes of plotting the E. coli loading. Each load was then plotted on the load duration curve at its percent exceedance. This process was repeated for each E. coli measurement at each station. Points above a curve represent exceedances of the bacteria criterion and its associated allowable loadings.
The flow exceedance frequency can be subdivided into hydrologic condition classes to facilitate the diagnostic and analytical uses of FDCs and LDCs. The hydrologic classification scheme utilized for the Cottonwood Branch and Grapevine Creek TMDLs is as follows: high flows (0 – 10%), mid-range flows (10 – 50%), and low flows (50 – 100%). These three flow regimes were based on hydrology (slope of the FDCs). Additional information explaining the LDC method may be found in Cleland (2003) and NDEP (2003).
Load Duration Curve Results FDCs and LDCs were developed for the two TCEQ monitoring stations within AU 0822A_02 and the three TCEQ monitoring stations within AU 0822B_01. LDCs and FDCs were developed for all stations for which adequate historical E. coli data existed in order to present a complete representation of conditions in each impaired AU. However, only the median loading of the high flow regime (5% exceedance) for the most downstream site within each impaired AU was used for the Cottonwood Branch and Grapevine Creek TMDL calculations. The most downstream station within AU 0822A_02 was station 17166, and the most downstream station within AU 0822B_01 was station 20311. The median loading of the high flow regime (or the 5% exceedance point) is used for the TMDL calculations, because it represents a reasonable yet high value for the allowable pollutant load allocation.
At the TCEQ, monitoring station locations (Figure 1), load relationships and possible sources were defined through LDCs created with historical E. coli data and the associated daily average flow for the flow duration curves. Load duration curves developed for stations within impaired AU 0822A_02 of Cottonwood Branch (Figures 5 and 6) indicate E. coli loadings often exceeded allowable loadings under all flow conditions, including those not influenced by rainfall runoff. Similar patterns were also found at stations on Grapevine Creek, for which exceedances were often reported under all flow conditions, and during both dry- and wet-weather conditions (Figures 7 – 9).
Seasonal Variation Federal regulations (40 CFR §130.7(c)(1)) require that TMDLs account for seasonal variation in watershed conditions and pollutant loading. E. coli data were examined and no statistically significant seasonal variation was found in Cottonwood Branch and Grapevine Creek (Millican and Hauck, 2010). Seasonality in E. coli data are thus not considered in the TMDL calculations.

Two Total Maximum Daily Loads for Indicator Bacteria in Cottonwood Branch and Grapevine Creek
Texas Commission on Environmental Quality 16 Adopted September 2011
1.E+08
1.E+09
1.E+10
1.E+11
1.E+12
1.E+13
0% 10% 20% 30% 40% 50% 60% 70% 80% 90% 100%
Percent of days load exceeded
E. c
oli
(MPN
/ da
y)
Allowable Load at Geomean Criterion Non-wet Weather Event Wet Weather Event
High Flows Mid-Range Flows Low Flows
Figure 5. Load duration curve for station 17165 (AU 0822A_02) E. coli
samples collected within 24 hours of a precipitation event are designated as triangles. Median flows in each range at this station are: High = 5.71 cfs (0.162 cms); Mid-range = 0.962 cfs (0.027 cms); Low= 0.403 cfs (0.011 cms)
1.E+08
1.E+09
1.E+10
1.E+11
1.E+12
1.E+13
1.E+14
0% 10% 20% 30% 40% 50% 60% 70% 80% 90% 100%
Percent of days load exceeded
E. c
oli
(MPN
/ da
y)
Allowable Load at Geomean Criterion Non-wet Weather Event Wet Weather Event
High Flows Mid-Range Flows Low Flows
Figure 6. Load duration curve for station 17166 (AU 0822A_02 E. coli samples collected within 24 hours of a precipitation event are designated as triangles. Median flows in each range at this station are: High = 12.01 cfs (0.340 cms); Mid-range = 1.89 cfs (0.054 cms); Low = 0.703 cfs (0.020 cms).

Two Total Maximum Daily Loads for Indicator Bacteria in Cottonwood Branch and Grapevine Creek
Texas Commission on Environmental Quality 17 Adopted September 2011
1.E+08
1.E+09
1.E+10
1.E+11
1.E+12
0% 10% 20% 30% 40% 50% 60% 70% 80% 90% 100%
Percent of days load exceeded
E. c
oli (
MPN
/ da
y)
Allowable Load at Geomean Criterion Non-wet Weather Event Wet Weather Event
High Flows Mid-Range Flows Low Flows
Figure 7. Load duration curve for station 17531 (AU 0822B_01) E. coli
samples collected within 24 hours of a precipitation event are designated as triangles. Median flows in each range at this station are: High = 14.35 cfs (0.406 cms); Mid-range = 2.38 cfs (0.067 cms); Low = 0.970 cfs (0.027 cms).
1.E+08
1.E+09
1.E+10
1.E+11
1.E+12
1.E+13
0% 10% 20% 30% 40% 50% 60% 70% 80% 90% 100%
Percent of days load exceeded
E. c
oli (
MPN
/ da
y)
Allowable Load at Geomean Criterion Non-wet Weather Event Wet Weather Event
High Flows Mid-Range Flows Low Flows
Figure 8. Load duration curve for station 17939 (AU 0822B_01) E. coli samples collected within 24 hours of a precipitation event are designated as triangles. Median flows in each range at this station are: High = 22.34 cfs (0.632 cms); Mid-range = 3.56 cfs (0.101 cms); Low = 1.35 cfs (0.038 cms).

Two Total Maximum Daily Loads for Indicator Bacteria in Cottonwood Branch and Grapevine Creek
Texas Commission on Environmental Quality 18 Adopted September 2011
1.E+08
1.E+09
1.E+10
1.E+11
1.E+12
1.E+13
0% 10% 20% 30% 40% 50% 60% 70% 80% 90% 100%
Percent of days load exceeded
E. c
oli (
MPN
/ da
y)
Allowable Load at Geomean Criterion Non-wet Weather Event Wet Weather Event
High Flows Mid-Range Flows Low Flows
Figure 9. Load duration curve for station 20311 (AU 0822B_01) E. coli
samples collected within 24 hours of a precipitation event are designated as triangles. Median flows in each range at this station are: High = 63.65 cfs (1.802 cms); Mid-range = 9.67 cfs (0.274 cms); Low = 3.32 cfs (0.094 cms).
Margin of Safety The margin of safety (MOS) is used to account for uncertainty in the analysis used to develop the TMDL and thus provide a higher level of assurance that the goal of the TMDL will be met. According to EPA guidance (EPA, 1991), the MOS can be incorporated into the TMDL using two methods:
Implicitly incorporating the MOS using conservative model assumptions to develop allocations; or
Explicitly specifying a portion of the TMDL as the MOS and using the remainder for allocations.
The MOS is designed to account for any uncertainty that may arise in specifying water quality control strategies for the complex environmental processes that affect water quality. Quantification of this uncertainty, to the extent possible, is the basis for assigning a MOS.
The TMDLs covered by this report incorporate an explicit MOS by setting a target for indicator bacteria loads that is 5 percent lower than the geometric mean criterion. For contact recreation, this equates to a geometric mean target of 120 MPN/100 mL of E. coli. The net effect of the TMDL with MOS is that the assimilative capacity or allowable pollutant loading of each water body is slightly reduced.
The explicit MOS is computed as 5 percent of the allowable loading entering each AU. This is expressed in the following equation:

Two Total Maximum Daily Loads for Indicator Bacteria in Cottonwood Branch and Grapevine Creek
Texas Commission on Environmental Quality 19 Adopted September 2011
MOS = 0.05 * TMDL Where:
TMDL = total maximum allowable load
Pollutant Load Allocation The TMDL represents the maximum amount of a pollutant that the stream can receive in a single day without exceeding water quality standards. The pollutant load allocations for the selected scenarios were calculated using the following equation:
TMDL = ΣWLA + ΣLA + ΣFG + MOS Where:
WLA = wasteload allocation, the amount of pollutant allowed by permitted or regulated dischargers LA = load allocation, the amount of pollutant allowed by unregulated sources FG = loadings associated with future growth from potential permitted facilities MOS = margin of safety load
As stated in 40 CFR, 130.2(1), TMDLs can be expressed in terms of mass per time, toxicity, or other appropriate measures. For E. coli, TMDLs are expressed as MPN/day, and represent the maximum one-day load the stream can assimilate while still attaining the standards for surface water quality.
Wasteload Allocation TPDES-permitted wastewater treatment facilities are allocated a daily wasteload (WLAWWTF) calculated as their full permitted discharge flow rate multiplied by one-half of the instream geometric mean criterion. One-half of the water quality criterion (63 MPN/100mL) is used as the WWTF target to provide instream and downstream load capacity. This is expressed in the following equation:
WLAWWTF
Where: = Criterion/2 * flow (MGD) * conversion factor
Criterion = 126 MPN/100 mL Flow (MGD) = full permitted flow Conversion factor = 37,854,000 100 mL / MGD
As previously discussed, there are currently no permitted wastewater treatment facilities within the TMDL study area. DFW Airport is the only facility with an individual permit; however, that permit authorizes the discharge of only stormwater during periods of de-icing activity and will be treated as part of the waste load allocation for TPDES-permitted stormwater discharges (discussed below). The Airport is also covered under the TPDES Phase II General Permit.
No individual WLAWWTF was calculated for the DFW Airport permit, and the total WLAWWTF is set to zero. In the event that the permitting process for a new WWTF is initiated in either watershed, a future growth component has been included in this TMDL that will allow for the allocation of loads based on an estimate of the future WWTF discharge requirements for both watersheds.

Two Total Maximum Daily Loads for Indicator Bacteria in Cottonwood Branch and Grapevine Creek
Texas Commission on Environmental Quality 20 Adopted September 2011
Additional stormwater dischargers represent additional flow that is not accounted for in the current allocations. In urbanized areas currently regulated by an MS4 permit, development and/or re-development of land in urbanized areas must implement the control measures/programs outlined in an approved Stormwater Pollution Prevention Plan (SWPPP). Although additional flow may occur from development or re-development, loading of the pollutant of concern should be controlled and/or reduced through the implementation of best management practices (BMPs) as specified in both the NPDES permit and the SWPPP.
An iterative, adaptive management approach will be used to address stormwater discharges. This approach encourages the implementation of structural or non-structural controls, implementation of mechanisms to evaluate the performance of the controls, and finally, allowance to make adjustments (e.g., more stringent controls or specific BMPs) as necessary to protect water quality.
Stormwater discharges from MS4, industrial, and construction areas are considered permitted point sources. Therefore, the WLA calculations must also include an allocation for permitted stormwater discharges (WLASW). A simplified approach for estimating the WLA for these areas was used in the development of these TMDLs due to the limited amount of data available, the complexities associated with simulating rainfall runoff, and the variability of stormwater loading. The percentage of each watershed that is under the jurisdiction of an entity required to comply with MS4 permit regulations (FDASWP) is used to estimate the amount of the overall runoff load that should be allocated in the WLASW as the permitted stormwater contribution. Thus, WLASW is the sum of loads from regulated (or permitted) stormwater sources and is calculated as follows:
ΣWLASW = (TMDL – ΣWLAWWTF – ΣFG – MOS) * FDAWhere:
SWP
ΣWLASW
TMDL = total maximum allowable load = sum of all permitted stormwater loads
ΣWLAWWTF
ΣFG = sum of future growth loads from potential permitted facilities = sum of all WWTF loads = 0
MOS = margin of safety load = 0.05 * TMDL FDASWP
= fractional proportion of drainage area under jurisdiction of stormwater permits
The TCEQ intends to implement the individual WLAs through the permitting process as monitoring requirements and/or effluent limitations as required by the amendment of 30 Texas Administrative Code Chapter 319 which became effective November 26, 2009. WWTFs discharging to the TMDL Segment AUs will be assigned an effluent limit based on the TMDL. Monitoring requirements are based on permitted flow rates and are listed in §319.9. The permit requirements will be implemented during the routine permit renewal process. However, there may be a more economical or technically feasible means of achieving the goal of improved water quality and circumstances may warrant changes in individual WLAs after this TMDL is adopted. Therefore, the individual WLAs, as well as the WLAs for stormwater, are non-binding until implemented via a separate TPDES permitting action, which may involve preparation of an update to the state’s Water Quality Management Plan. Regardless, all permitting actions will demonstrate compliance with the TMDL.

Two Total Maximum Daily Loads for Indicator Bacteria in Cottonwood Branch and Grapevine Creek
Texas Commission on Environmental Quality 21 Adopted September 2011
The executive director or commission may establish interim effluent limits and/or monitoring-only requirements at a permit amendment or permit renewal. These interim limits will allow a permittee time to modify effluent quality in order to attain the final effluent limits necessary to meet the TCEQ and EPA approved TMDL allocations. The duration of any interim effluent limits may not be any longer than three years from the date of permit re-issuance. New permits will not contain interim effluent limits because compliance schedules are not allowed for a new permit.
Where a TMDL has been approved, domestic WWTF TPDES permits will require conditions consistent with the requirements and assumptions of the wasteload allocations. For NPDES/ TPDES-regulated municipal, construction stormwater discharges, and industrial stormwater discharges, water quality-based effluent limits that implement the WLA for stormwater may be expressed as BMPs or other similar requirements, rather than as numeric effluent limits (November 12, 2010, memorandum from EPA relating to establishing WLAs for stormwater sources). The EPA memo states that:
“The CWA provides that stormwater permits for MS4 discharges shall contain controls to reduce the discharge of pollutants to the "maximum extent practicable" and such other provisions as the Administrator or the State determines appropriate for the control of such pollutants [CWA section 402(p)(3)(8)(iii)]. Under this provision, the NPDES permitting authority has the discretion to include requirements for reducing pollutants in stormwater discharges as necessary for compliance with water quality standards [Defenders of Wildlife v. Browner, 191 F.3d 1159, 1166 (9th Cir. 1999)].
The permitting authority's decision as to how to express the WQBEL(s), either as numeric effluent limitations or BMPs, including BMPs accompanied by numeric benchmarks, should be based on an analysis of the specific facts and circumstances surrounding the permit, and/or the underlying WLA, including the nature of the stormwater discharge, available data, modeling results or other relevant information. As discussed in the 2002 memorandum, the permit's administrative record needs to provide an adequate demonstration that, where a BMP-based approach to permit limitations is selected, the BMPs required by the permit will be sufficient to implement applicable WLAs. Improved knowledge of BMP effectiveness gained since 2002 should be reflected in the demonstration and supporting rationale that implementation of the BMPs will attain water quality standards and WLAs.”
A November 22, 2002, memorandum from EPA relating to establishing WLAs for stormwater sources states that:
“...the Interim Permitting Approach Policy recognizes the need for an iterative approach to control pollutants in stormwater discharges...[s]pecifically, the policy anticipates that a suite of BMPs will be used in the initial rounds of permits and that these BMPs will be tailored in subsequent rounds.”
Using this iterative adaptive approach to the maximum extent practicable is appropriate to address the stormwater component of this TMDL.
Two Total Maximum Daily Loads for Indicator Bacteria in Cottonwood Branch and Grapevine Creek
Texas Commission on Environmental Quality 22 Adopted September 2011
This TMDL is, by definition, the total of the sum of the WLA, the sum of the LA, and the MOS. Changes to individual WLAs may be necessary in the future in order to accommodate changing conditions within the watershed. These changes to individual WLAs do not ordinarily require a revision of the TMDL document; instead, changes will be made through updates to the TCEQ’s WQMP. Any future changes to effluent limitations will be addressed through the permitting process and by updating the WQMP.
Load Allocation The LA is the sum of loads from unregulated sources. Nonpoint sources within the Cottonwood Branch and Grapevine Creek watersheds include unregulated stormwater runoff and direct deposition from warm-blooded animals. The LA term is calculated as:
LA = TMDL - ΣWLAWWTF – ΣWLASW
Where: – ΣFG – MOS
LA = allowable load from unregulated sources entering the AU TMDL = total maximum allowable load ΣWLAWWTF
ΣWLA = sum of all WWTF loads = 0
SW
ΣFG = sum of future growth loads from potential permitted facilities = sum of all permitted stormwater loads
MOS = margin of safety load = 0.05 * TMDL The TMDL equation can thus be expanded to show the components of WLA and LA:
TMDL = ΣWLAWWTF + ΣWLASW + LA
+ ΣFG +MOS
In addition, the three-tiered antidegradation policy in the Standards prohibits an increase in loading that would cause or contribute to degradation of an existing use. The antidegradation policy applies to both point and nonpoint source pollutant discharges. In general, antidegradation procedures establish a process for reviewing individual proposed actions to determine if the activity will degrade water quality. The TMDLs in this document will result in protection of existing beneficial uses and conform to Texas’s antidegradation policy.
Future Growth To account for the probability that new flows from WWTF discharges may occur in both AUs, a provision for future growth was included in the TMDL calculations based on the population increase from year 2005 estimates to year 2030 projections and an estimate of the amount of wastewater generated per person per day or gallons per capita per day (gpcd).
Currently, no permitted WWTFs discharge into Segments 0822A and 0822B. Wastewater generated within Cottonwood Branch and Grapevine Creek is transported out of both watersheds to the TRA Central Regional WWTF located on the Lower West Fork Trinity River (Segment 0841).
Since both impaired watersheds lie within the much larger wastewater collection service area for the TRA Central Regional WWTF, it is infeasible to readily determine average wastewater generation per person for each watershed. The approach taken was to determine the year 2005 average daily discharge for the TRA Central Regional WWTF based on its discharge monitoring reports (DMRs) obtained from the EPA permit compliance system website (EPA, 2009) for that year. Next, the service population of the TRA WWTF for the year 2005 was

Two Total Maximum Daily Loads for Indicator Bacteria in Cottonwood Branch and Grapevine Creek
Texas Commission on Environmental Quality 23 Adopted September 2011
determined using available GIS layers of the WWTF service area and NCTCOG population districts, and NCTCOG population estimates by population district (NCTCOG, 2009a, 2009b). The population within the TRA Central Regional WWTF service area was estimated based on the 2005 NCTCOG population district estimates and the percentage of each district in the service area, further assuming even population distribution within each district. The wastewater flow per capita was then determined by dividing the TRA Central Regional WWTF 2005 annual daily discharge by its service population giving a wastewater flow of 107 gpcd.
Next, the population of the entire watersheds of Cottonwood Branch and Grapevine Creek were estimated using the GIS shape files of each watershed and the NCTCOG population districts and population data for 2005 and 2030. Assuming even distribution in each district, the population of each watershed was then determined based on percentage of each population district in each watershed, the 2005 and 2030 population estimates for each district, and summing the computed populations by watershed. With this information, the future growth (FG) of each watershed is calculated as follows:
FG = criterion/2 * Flow2005 * (Pop30 - Pop05
Where: )
Criterion = 126 MPN/100 mL Flow2005
Pop
= 107 gallons per capita per day (gpcd) based on the average daily discharge of TRA WWTF from year 2005 DMR data divided by year 2005 TRA WWTF wastewater collection area population estimate
30
Pop = estimated watershed population for year 2030
05
Conversion factor = 10 = estimated watershed population for year 2005
-6
MGD/gpcd * 37,854,000 100 mL / MGD = 37.854 100mL/gpcd
Additional stormwater dischargers represent additional flow that is not accounted for in the current allocations. Changes in MS4 jurisdiction or additional development associated with population increases in the watershed can be accommodated by shifting allotments between the WLA and the LA. This can be done without the need to reserve future-capacity WLAs for stormwater. In non-urbanized areas, growth can be accommodated by shifting loads between the LA and the WLA (for stormwater).
TMDL Calculations The TMDL was calculated based on the median flow in the 0-10 percentile range (high flow regime) from the LDC developed for the most downstream station within each AU, which is station 17166 in AU 0822A_02 and station 20311 in AU 0822B_01 (Figure 1). Each term in the TMDL equation was determined based on the equations provided previously. Table 5 summarizes the calculation of the TMDL for each AU. Table 6 summarizes the computation of future growth for the combined AUs.
The entire drainage area of AU 0822A_02 is located within jurisdictional areas regulated by stormwater permits, and 84.8% of the drainage area of AU 0822B_01 is located within the jurisdictional areas regulated by stormwater permits (2,605 ha out of 3,073 ha are under stormwater permit regulation). Table 7 summarizes the computation of term WLASW.
Since the entire drainage of AU 0822A_02 is within the jurisdictional areas regulated by stormwater permits, the LA associated with this AU is zero. For AU 0822B_01, 468 ha or

Two Total Maximum Daily Loads for Indicator Bacteria in Cottonwood Branch and Grapevine Creek
Texas Commission on Environmental Quality 24 Adopted September 2011
15.2% of its drainage area is not regulated by stormwater permits, and LA was computed from the value of terms in Table 7 (see Table 8).
Table 9 summarizes the TMDL calculations for AUs 0822A_02 and 0822B_01. The final TMDL allocations needed to comply with the requirements of 40 CFR 130.7 are presented in Table 10. The final TMDL allocations include the future growth component designated as WLAWWTF while allocations to permitted MS4 entities are designated as WLASW. The allocations are based on the current geometric mean criterion for E. coli in freshwater of 126 MPN/100 mL, with the exception of the Future Growth component. The Future Growth component is based on ½ the current geometric mean criterion (63 MPN/100 mL) to account to provide instream and downstream capacity.
Table 5. Summary of TMDL calculation for Cottonwood Branch and Grapevine Creek
Segment Stream Name Station Median Value of High
Flow Regime TMDL
(Billion MPN/day)
0822A_02 Cottonwood Branch 17166 0.3402 cms (12.01 cfs) 37.04
0822B_01 Grapevine Creek 20311 1.802 cms (63.65 cfs) 196.22
Table 6. Future growth computations for Cottonwood Branch and Grapevine Creek
Segment Stream Name
2005 Population
2030 Population
Population Increase 2005
to 2030
Additional Wastewater Production
(MGD)
Future Growth (Billion
MPN/day) *
0822A Cottonwood Branch 19,499 20,328 829 0.089 .212
0822B Grapevine Creek 20,807 22,622 1,815 0.195 .464
* Future growth includes a reduction for MOS of 5%
Table 7. Regulated stormwater computation for Cottonwood Branch (AU 0822A_02) and
Grapevine Creek (AU 0822B_01) (All loads expressed as Billion MPN/day)
AU TMDL WLAWWTF Future Growth MOS FD WLAASWP SW
0822A_02
37.04 0.00 0.21 1.85 1.000 34.97
0822B_01 196.22 0.00 0.46 9.81 0.848 157.60

Two Total Maximum Daily Loads for Indicator Bacteria in Cottonwood Branch and Grapevine Creek
Texas Commission on Environmental Quality 25 Adopted September 2011
Table 8. Non-regulated stormwater computation for Cottonwood Branch (AU 0822A_02) and Grapevine Creek (AU 0822B_01)
AU LA
(Billion MPN/day)
0822A_02 0
0822B_01 28.34
Table 9. TMDL allocation summary for Cottonwood Branch and Grapevine Creek
(All units in Billion MPN per day)
AU Stream Name TMDL WLAa WWTF WLAb SW LAc MOSd Future
Growthe
0822A_02
f
Cottonwood Branch 37.04 0.00 34.97 0 1.85 0.21
0822B_01 Grapevine Creek 196.22 0.00 157.60 28.34 9.81 0.46
a TMDL = Median flow (high flow regime) * 126 MPN/100 mL * Conversion Factor; where the Conversion Factor = 8.64E+08 100 mL/m3 * seconds/day; Median Flow from Table 5
b No WWTF discharges into AUs 0822A_02 and 0822B_01 c WLASW = (TMDL - WLAWWTF - FG - MOS) * FDASWP; (see Table 7 for equation values) d LA = TMDL - WLAWWTF - MOS - WLASW - FG; because the entire drainage area of 0822A_02 is
covered by MS4 permits its LA = 0.000 e MOS = 0.05 * TMDL f Future Growth = Criterion /2 (63 MPN/day) *Flow2005 * (Pop30 – Pop05) * Conversion Factor; where
Flow2005 = 107 gpcd, Pop30
is the estimated population within the watershed for year 2030 and Pop05 is the estimated population within the watershed for year 2005; and Conversion Factor = 37.854 100 ml/gpcd; (see Table 6 for population estimates)
Table 10. Final TMDL allocations for Cottonwood Branch (AU 0822A_02) and Grapevine Creek
(AU 0822_01) (All units in Billion MPN per day)
AU Stream Name TMDL WLAWWTF WLA* LA SW MOS
0822A_02 Grapevine Creek 37.04 0.21 34.97 0 1.85
0822B_01 Cottonwood Branch 196.22 0.46 157.60 28.34 9.81
* WLAWWTF = WLAWWTF
+ Future Growth
In the event that the criteria change due to future revisions in the state’s surface water quality standards, Appendix A provides guidance for recalculating the allocations in Table 10. Figures A-1 and A-2 of Appendix A were developed to demonstrate how assimilative capacity, TMDL calculations, and pollutant load allocations change in relation to a number of hypothetical water quality criteria for E. coli. The equations provided, along with Figures A-1 and A-2, allow calculation of new TMDLs and pollutant load allocations based on any potential new water quality criterion for E. coli.
Two Total Maximum Daily Loads for Indicator Bacteria in Cottonwood Branch and Grapevine Creek
Texas Commission on Environmental Quality 26 Adopted September 2011
Public Participation The TCEQ maintains an inclusive public participation process. From the inception of the investigation, the project team sought to ensure that stakeholders were informed and involved. Communication and comments from the stakeholders in the watershed strengthen TMDL projects and their implementation.
TCEQ and TIAER are jointly providing coordination for public participation in this project. A series of public meetings have been conducted over recent years to keep the public aware of the TMDL process and to engage public participation. Public meetings were held at the Valley Ranch Library in Irving on June 10, 2008, September 24, 2009, and April 22, 2010.
The meetings introduced the TMDL process, identified the impaired AUs and reason for the impairment, reviewed historical data, described potential sources of bacteria within the watershed, and presented the TMDL allocations. In addition, the meetings gave TCEQ the opportunity to solicit input from all interested parties within the study area. Information on past and future meetings for the Cottonwood Branch and Grapevine Creek TMDLs can be found on the TCEQ website at: <www.tceq.state.tx.us/implementation/water/tmdl/ 66_cottongrape_bacteria.html >.
Implementation and Reasonable Assurances The issuance of permits consistent with TMDLs through TPDES provides reasonable assurance that wasteload allocations in this TMDL report will be achieved. Consistent with federal requirements, each TMDL is a plan element of an update to Texas’ WQMP.
The TCEQ’s WQMP coordinates and directs the state’s efforts to manage water quality and maintain or restore designated uses throughout Texas. The WQMP is continually updated with new, more specifically focused plan elements, as identified in federal regulations 40 CFR 130.6(c). Commission adoption of a TMDL is the state’s certification of the associated WQMP update.
Based on the TMDL and Implementation Plan (I-Plan), the TCEQ will propose and certify WQMP updates to establish required water-quality-based effluent limitations necessary for specific TPDES wastewater discharge permits.
For MS4 permits, the TCEQ will normally establish BMPs. BMPs are a substitute for effluent limitations, as allowed by federal rules, where numeric effluent limitations are infeasible (see November 22, 2002, memorandum from EPA relating to establishing TMDL WLAs for stormwater sources). When such practices are established in an MS4 permit, the TCEQ will not identify specific implementation requirements applicable to a specific TPDES stormwater permit through an effluent limitation update. Rather, the TCEQ might revise a stormwater permit, require a revised Stormwater Management Program or Pollution Prevention Plan, or implement other specific revisions affecting stormwater dischargers in accordance with an adopted I-Plan.
Strategies for achieving pollutant loads in TMDLs from both point and nonpoint sources are reasonably assured by the state’s use of an I-Plan. The TCEQ is committed to supporting implementation of all TMDLs adopted by the commission.
I-Plans for Texas TMDLs use an adaptive management approach that allows for refinement or addition of methods to achieve environmental goals. This adaptive approach reasonably

Two Total Maximum Daily Loads for Indicator Bacteria in Cottonwood Branch and Grapevine Creek
Texas Commission on Environmental Quality 27 Adopted September 2011
assures that the necessary regulatory and voluntary activities to achieve pollutant reductions will be implemented. Periodic, repeated evaluations of the effectiveness of implementation methods ascertain whether progress is occurring, and may show that the original distribution of loading among sources should be modified to increase efficiency. I-Plans will be adapted as necessary to reflect needs identified in evaluations of progress.
Key Elements of an I-Plan An I-Plan includes a detailed description and schedule of the regulatory and voluntary management measures to implement the WLAs and LAs of particular TMDLs within a reasonable time. I-Plans also identify the organizations responsible for carrying out management measures, and a plan for periodic evaluation of progress. EPA does not approve I-Plans for Texas TMDLs.
Strategies to optimize compliance and oversight are identified in an I-Plan when necessary. Such strategies may include additional monitoring and reporting of effluent discharge quality to evaluate and verify loading trends, adjustment of an inspection frequency or a response protocol to public complaints, and escalation of an enforcement remedy to require corrective action of a regulated entity contributing to an impairment.
The TCEQ works with stakeholders and interested governmental agencies to develop and support I-Plans and track their progress. Work on the I-Plan begins during development of TMDLs, but the plan is not completed until sometime after the EPA approves the TMDLs. The cooperation required to develop an I-Plan for approval by the commission becomes a cornerstone for the shared responsibility necessary for carrying out the plan.
Ultimately, the I-Plan will identify the commitments and requirements to be implemented through specific permit actions and other means. For these reasons, the I-Plan that is adopted may not approximate the predicted loadings identified category-by-category in the TMDL and its underlying assessment. However, with certain exceptions, the I-Plan must nonetheless meet the overall loading goal established by the EPA-approved TMDL.
NCTCOG is working with the TCEQ to lead development of the I-Plan. Through the stakeholder group led by the NCTCOG, the resources and expertise of the local organizations and individuals will be brought together to set priorities, provide flexibility, and consider appropriate social and economic factors.
References AVMA (American Veterinary Medical Association). 2009. U.S. Pet Ownership-2007.
<www.avma.org/reference/marketstats/ownership.asp>. Accessed 28 October 2009.
Cleland, B. 2003. TMDL Development from the “Bottom Up”—Part III: Duration Curves and Wet-Weather Assessments. America’s Clean Water Foundation, Washington, DC.
EPA. 1991. Guidance for Water Quality-Based Decisions: The TMDL Process. <www.epa.gov/OWOW/tmdl/decisions/>. Accessed 28 October 2009.
EPA. 2002. Memorandum: Establishing Total Maximum Daily Load (TMDL) Wasteload Allocations (WLAs) for Stormwater Sources and NPDES Permit Requirements Based
Two Total Maximum Daily Loads for Indicator Bacteria in Cottonwood Branch and Grapevine Creek
Texas Commission on Environmental Quality 28 Adopted September 2011
on Those WLAs. November 22, 2002 (Robert H. Wayland, III to Water Division Directors).
EPA. 2006. Memorandum: Clarification Regarding “Phased” Total Maximum Daily Loads. August 2, 2006 (Benita Best-Wong to Water Division Directors).
EPA. 2009. (United States Environmental Protection Agency). 2009. <www.epa.gov/enviro/html/pcs/adhoc.html> Accessed December 8, 2009.
Millican, J. and L. Hauck. 2010. Allocation Support Document for Two Total Maximum Daily Loads for Bacteria in Cottonwood Branch and Grapevine Creek. Prepared for: Texas Commission on Environmental Quality, Prepared by: Texas Institute for Applied Environmental Research, Tarleton State University, Stephenville, TX.
Millican, J. and L. Hauck. 2010. Technical Support Document For Bacteria TMDLs Segments 0822A Cottonwood Branch and 0822B Grapevine Creek. Prepared for: Texas Commission on Environmental Quality, Prepared by: Texas Institute for Applied Environmental Research, Tarleton State University, Stephenville, TX.
NDEP (Nevada Division of Environmental Protection). 2003. Load duration curve methodology for assessment and TMDL development. <ndep.nv.gov/bwqp/ loadcurv.pdf>. Accessed 08 December 2009.
NCTCOG (North Central Texas Council of Governments). 2009a. North Central Texas Demographic Forecast 2030 <www.nctcog.org/ris/demographics/forecast.asp>. Accessed October 16, 2009
NCTCOG (North Central Texas Council of Governments). 2009b. GIS Data Clearinghouse. <www.dfwmaps.com/clearinghouse/>. Accessed 18 November 2009.
NWS (National Weather Service). 2009. <www.srh.noaa.gov/fwd/?n=dnarrative>. Accessed 29 July 2009.
NEIWPCC (New England Interstate Water Pollution Control Commission). 2003. Illicit Discharge Detection and Elimination Manual. January 2003.
Schueler, T.R. 2000. Microbes and Urban Watersheds: Concentrations, Sources, and Pathways. In The Practice of Watershed Protection, T.R. Schueler and H.K. Holland, eds. Center for Watershed Protection, Ellicott City, MD.
TCEQ. 2000. Texas Surface Water Quality Standards, 2000 update, 30 TAC 307. <www.tceq.state.tx.us/permitting/water_quality/wq_assessment/standards/ WQ_standards_2000.html>. Accessed 28 October 2009.
TCEQ. 2008a. 2008 Guidance for Assessing and Reporting Surface Water Quality in Texas (March 19, 2008). <www.tceq.state.tx.us/compliance/monitoring/water/quality/data/ swqmgawg.html#documents>. Accessed 28 October 2009.
TCEQ. 2008b. Texas Water Quality Inventory and 303(d) List. <www.tceq.state.tx.us/ compliance/monitoring/water/quality/data/08twqi/twqi08.html>. Accessed 28 October 2009.
TCEQ. 2010. Draft 2010 Texas 303(d) List (February 5, 2010). <www.tceq.state.tx.us/assets/public/compliance/monops/water/10twqi/2010_303d.pdf> Accessed February 16, 2010.

Two Total Maximum Daily Loads for Indicator Bacteria in Cottonwood Branch and Grapevine Creek
Texas Commission on Environmental Quality 29 Adopted September 2011
Appendix A. Equations for Calculating TMDL Allocations for
Changed Contact Recreation Standard

Two Total Maximum Daily Loads for Indicator Bacteria in Cottonwood Branch and Grapevine Creek
Texas Commission on Environmental Quality 30 Adopted September 2011
Figure A-1. Allocation loads for Cottonwood Branch, AU 0822A_02, as a function of water quality criteria
Equations for calculating new TMDL and allocations for AU 0822A_02:
TMDL = WLAWWTF + WLASW
+ LA + MOS
TMDL = 0.2939 * Std WLAWWTF
WLA = Future Growth * Conversion Factor * 63 * (1 – 0.05) = 0.2122
SW
LA = 0 = 0.2792 * Std 0.2122
MOS = 0.05 * TMDL Where:
WLASW
WLA = Waste load allocation (permitted stormwater)
WWTF
LA = Load allocation (non-permitted stormwater) = Potential future permitted WWTF discharge load allocation
Future Growth
Std = Revised Contact Recreation Standard = Potential future permitted WWTF discharge (MGD)
MOS = Margin of Safety
630 1030126 206
37.0
60.6
185
303
15.1
9.26
1.853.03
176
287
57.134.8
0.4030.403
-40
0
40
80
120
160
200
240
280
320
0 400 800 1,200
Criteria (MPN/100mL)
Load
(109
MPN
/day
)
Criteria TMDL MOS WLAsw WLAwwtf

Two Total Maximum Daily Loads for Indicator Bacteria in Cottonwood Branch and Grapevine Creek
Texas Commission on Environmental Quality 31 Adopted September 2011
630 1030126 206
196
321
981
160480.2
49.1
9.81
16.0
232
142
46.3
28.3
789
1291
258157
0.8820.882
-200
0
200
400
600
800
1,000
1,200
1,400
1,600
1,800
0 400 800 1,200
Criteria (MPN/100mL)
Load
(109
MPN
/day
)
Criteria TMDL MOS LA WLAsw WLAwwtf
Figure A–2. Allocation loads for Grapevine Creek, AU 0822B_01, as a function of water quality criteria
Equations for calculating new TMDL and allocations for AU 0822B_01:
TMDL = WLAWWTF + WLASW
+ LA + MOS
TMDL = 1.5573 * Std WLAWWTF
WLA = Future Growth * Conversion Factor * 63 = 0.4643
sw
LA = 0.2255 * Std – 0.0708 = 1.2540 * Std – 0.3935
MOS = 0.05 * TMDL Where:
WLAWWTF
WLA= Potential future permitted WWTF discharge load allocation
sw
LA = Load allocation (non-permitted stormwater) = Waste load allocation (permitted stormwater)
Future Growth
Std = Revised Contact Recreation Standard = Potential future permitted WWTF discharge (MGD)
MOS = Margin of Safety