Embed Size (px)
Citation preview
University of South CarolinaScholar Commons
Theses and Dissertations
2016
Two-Stage Psa System For CO2 Removal AndConcentration During Closed-Loop Human SpaceExploration MissionsHanife ErdenUniversity of South Carolina
Follow this and additional works at: https://scholarcommons.sc.edu/etd
Part of the Chemical Engineering Commons
This Open Access Dissertation is brought to you by Scholar Commons. It has been accepted for inclusion in Theses and Dissertations by an authorizedadministrator of Scholar Commons. For more information, please contact [email protected].
Recommended CitationErden, H.(2016). Two-Stage Psa System For CO2 Removal And Concentration During Closed-Loop Human Space Exploration Missions.(Doctoral dissertation). Retrieved from https://scholarcommons.sc.edu/etd/3986
TWO-STAGE PSA SYSTEM FOR CO2 REMOVAL AND
CONCENTRATION DURING CLOSED-LOOP HUMAN SPACE
EXPLORATION MISSIONS
by
Hanife Erden
Bachelor of Science
Ege University, Turkey, 2005
Master of Science
Mugla University, Turkey, 2009
Submitted in Partial Fulfillment of the Requirements
For the Degree of Doctor of Philosophy in
Chemical Engineering
College of Engineering and Computing
University of South Carolina
2016
Accepted by:
James A. Ritter, Major Professor
Armin D. Ebner, Committee Member
John Monnier, Committee Member
Jamil Khan, Committee Member
John Weidner, Committee Member
Cheryl L. Addy, Vice Provost and Dean of the Graduate School

ii
© Copyright by Hanife Erden, 2016
All Rights Reserved.
iii
DEDICATION
To my brilliant, beloved, miracle son Levent Ege Erden.
iv
ACKNOWLEDGEMENTS
I want to express my deepest appreciation to my advisor Dr. James A. Ritter, for
being a tremendous mentor for me. Without his guidance and encouragement this
dissertation would have not been possible. I would particularly like to thank my second
advisor Dr. Armin D. Ebner for his insightful comments and suggestions and teaching me
the art of problem solving. Many thanks to my committee members, John Monnier, Jamil
Khan, John Weidner for their time, and guidance.
I am grateful to Dr. Marjorie Nicholson and Charles E. Holland for all their help in
carrying out my experiments. I would also like to express my thanks to all my previous and
present research group mates, Dr. Shubhra Bhadra, Dr. Fan Wu, Dr Mohammad Iftekhar
Hossain, Dr. Anahita Abdollahi Govar, Dr. Atikur Rahman, Nima Mohammadi, Hind
Shabbani.
I would like to offer my special thanks to my husband Lutfi Erden for his
unconditional love and endless support. I owe much gratitude to my hard working parents
Mehmet Kurt and Murvet Kurt for all the sacrifices they made, their love and care. Special
thanks also to my sisters Meltem Kacan and Havva Kurt for their endless support and
always believing in me.
Finally, I would like to thank to National Education Ministry of Turkey for the
economic support as a scholarship I was gathered during my doctorate education in USA.
v
ABSTRACT
A novel two-stage pressure swing adsorption (PSA) system has been developed to
remove metabolic CO2 removal from the spacecraft cabin air of the International Space
Station (ISS). This PSA system enriches and recovers the CO2 to make it suitable for use
in a Sabatier reactor (CO2 reduction). This two-stage PSA process utilizes Stage 1 to
concentrate metabolic CO2 from about 0.2667 vol% to about 40 to 60 vol% and Stage 2 to
further enrich the CO2 product from Stage 1 up to > 97 vol% CO2, while recovering at least
95% of it, which corresponds to removing 4.0 kg/day of CO2. Each stage of this PSA
system utilizes a combination of equalization, cocurrent depressurization, heavy and light
reflux cycle steps to facilitate significant heavy component enrichment and recovery (i.e.,
CO2) from a dilute feed stream. The first generation of this two-stage PSA process utilizes
beaded commercial adsorbent, i.e., 13X zeolite, in both stages. These two PSA systems
were designed via simulation using the Dynamic Adsorption Process Simulator (DAPS).
The DAPS results were validated using an experimental multi-bed PSA system. DAPS was
then used to scale up Stage 1 and scale down stage 2 to size the full scale two-stage PSA
system that might someday be used on the ISS. The modeling results from Stage 1 revealed
that longer heavy and light reflux step times played an important role in concentrating the
CO2 in the heavy product and modeling results from Stage 2 showed that a heavy reflux
step was essential to achieving the desired performance. Implications from these modeling
and experimental results began to hint at the possibility of significantly concentrating CO2

vi
from ambient air up to around 10 to 15 vol% at relatively high recovery using a simple
PSA cycle.
The Environmental Control and Life Support System (ECLSS) for the Space Station
performs several functions such as O2 and N2 supply and control, CO2 removal and
reduction, potable water supply, comfortable cabin temperature and humidity levels and
total cabin pressure, and .adequate nutrition. An atmosphere revitalization system (ARS)
includes oxygen and nitrogen supply and control, carbon dioxide removal and reduction,
trace contaminant removal. For a closed loop system for future long term duration
spaceflights, CO2 removal system has an important role on not only cabin atmosphere
quality but also water recovery, via CO2 reduction, and O2 recovery, via water electrolysis.
Detailed information about CO2 capture from flue gas, CO2 capture from
atmospheric air, International Space Station (ISS), Environmental Control and Life
Support System (ECLSS) and its subsystems such as Humidity and Temperature Control,
Atmosphere Control and Supply, Waste Management, Food Management, Fire Detection
and Suppression, and Atmosphere Revitalization: Oxygen Generation, Nitrogen Supply,
Trace Contaminant Removal and Monitoring, mostly Carbon Dioxide Removal
subsystem, Carbon Dioxide Reduction, Water Recovery and Management and lastly about
Pressure Swing Adsorption (PSA) were given in Chapter 1.
Chapter 2 is about model description of a FORTRAN based in house dynamic
adsorption process simulator (DAPS) that simulations of all PSA cycles in this thesis were
carried out.
vii
In Chapter 3, simulations of a 3-bed 9-step pressure swing adsorption (PSA) cycles
were carried out to study the enrichment and recovery trace amount of CO2 from a CO2-air
mixture using 13X zeolite using dynamic adsorption process simulator DAPS. Extensive
parametric studies were investigated in order to determine how process performances are
affected by process parameters such as HR/LR step time (thus cycle time), light reflux
ratio, co-current and counter-current depressurization pressures, and light reflux pressure.
In Chapter 4, initial simulations using the full scale flow rates in search of the bed
size, light reflux ratio, cycle time and vacuum pressure that lead to the desired performance
with a 3-bed 8-step pressure swing adsorption (PSA) cycles (0.4% CO2 from a CO2-N2
mixture) were carried out by using 13X zeolite as an adsorbent using dynamic adsorption
process simulator DAPS. The initial DAPS results were then used to determine the 3-bed
experimental conditions. Experimental runs have been done by using a 4-bed PSA
apparatus. Model validation was carried out via running simulations with no adjustable
parameters against experimental results.
In Chapter 5, a novel two-stage pressure swing adsorption (PSA) system has been
developed to remove metabolic CO2 removal from the spacecraft cabin air of the
International Space Station (ISS). These two PSA systems were designed via simulation
using the Dynamic Adsorption Process Simulator (DAPS). The DAPS results were
validated using an experimental multi-bed PSA system. DAPS was then used to scale up
Stage-1 and scale down Stage-2 to size the full scale two-stage PSA system.

viii
Overall this study showed that target process performance for NASA has been
achieved with two-stage PSA system. Two-stage PSA process performances are 98.10%
CO2 purity with 97.46% CO2 recovery, (4.13kg CO2 removal / day) from 0.2667 vol. %
CO2 concentration in feed stream.
ix
TABLE OF CONTENTS
DEDICATION ....................................................................................................................... iii
ACKNOWLEDGEMENTS ........................................................................................................ iv
ABSTRACT ............................................................................................................................v
LIST OF TABLES .................................................................................................................. xi
LIST OF FIGURES ............................................................................................................... xiii
LIST OF SYMBOLS ............................................................................................................ xvii
LIST OF ABBREVIATIONS ................................................................................................... xix
CHAPTER 1: INTRODUCTION ............................................................................................1
1.1 CO2 CAPTURE FROM FLUE GAS ............................................................................2
1.2 CO2 CAPTURE FROM ATMOSPHERIC AIR ..............................................................2
1.3 INTERNATIONAL SPACE STATION (ISS), ENVIRONMENTAL CONTROL AND LIFE
SUPPORT SYSTEM (ECLSS) ......................................................................................5
1.4 PRESSURE SWING ADSORPTION (PSA) ..............................................................22
CHAPTER 2 MODEL DESCRIPTION ................................................................................32
2.1 MODEL DESCRIPTION ........................................................................................32
2.2 ADSORPTION ISOTHERM MEASUREMENTS ........................................................34
2.3 MASS TRANSFER MODEL ..................................................................................36
CHAPTER 3: A PARAMETRIC STUDY ON PRESSURE SWING ADSORPTION
PROCESS TO ENRICH TRACE AMOUNT OF CO2 FROM AIR BY USING 13X
ZEOLITE ...........................................................................................................................46
3.1 SUMMARY .........................................................................................................46

x
3.2 PSA CYCLE DESCRIPTION ................................................................................47
3.3 BED AND ADSORBENT CHARACTERISTICS .........................................................50
3.4 PARAMETRIC STUDY .........................................................................................51
3.5 RESULT AND DISCUSSION .................................................................................51
3.6 CONCLUSION .....................................................................................................61
CHAPTER 4: PRELIMINARY STUDY TO DEVELOP A NEW PSA CYCLE FOR CO2
REMOVAL AND CONCENTRATION DURING CLOSED-LOOP HUMAN SPACE
EXPLORATION MISSIONS ............................................................................................81
4.1 SUMMARY .........................................................................................................81
4.2 PSA CYCLE DESCRIPTION .................................................................................83
4.3 BED AND ADSORBENT CHARACTERISTICS .........................................................85
4.4 EXPERIMENTAL SECTION ..................................................................................86
4.5. RESULT AND DISCUSSION ................................................................................93
4.6. MODEL VALIDATION ........................................................................................96
4.7. CONCLUSION ....................................................................................................99
CHAPTER 5: TWO-STAGE PSA SYSTEM FOR CO2 REMOVAL DURING CLOSED-
LOOP HUMAN SPACE EXPLORATION MISSIONS ..................................................118
5.1 SUMMARY .......................................................................................................118
5.2. 1ST STAGE PSA SYSTEM FOR CO2 REMOVAL DURING CLOSED-LOOP HUMAN
SPACE EXPLORATION MISSIONS ...........................................................................119
5.3. 2ND STAGE PSA SYSTEM FOR CO2 REMOVAL DURING CLOSED-LOOP HUMAN
SPACE EXPLORATION MISSIONS ...........................................................................136
5.4 CONCLUSION ...................................................................................................153
REFERENCES ................................................................................................................188
xi
LIST OF TABLES
Table 1.1 ECLSS functions and sub-functions (Council, 1997; Wieland, 1994). .............23
Table 2.1 Mathematical model governing equations used in Dynamic Adsorption Process
Simulator (DAPS). .............................................................................................................39
Table 2.2 Initial conditions, boundary conditions and balances for the PSA cycle. ..........40
Table 2.3 The TPL isotherm parameters for pure gas .......................................................41
Table 2.4 Kinetic properties, used in LDF approach both for macropore and micropore
limited diffusion. ................................................................................................................42
Table 3.1 PSA bed and adsorbent properties with process characteristics. .......................63
Table 3.2 Input parameters of 3-Bed 9-Step PSA process for parametric study using the
cycle depicted below. Run no. 3 is taken as the base case for each parametric study. ......64
Table 3.3 Parameter ranges investigated and performances in terms of CO2 purity and
recovery obtained for the PSA cycle. ................................................................................65
Table 3.4 Moles of CO2, and N2+O2 into the bed step by step for each runs ....................66
Table 3.5 Moles of CO2, and N2+O2 leaving the bed step by step for each runs...............67
Table 3.6 Bed pressures in kPa at the end of each steps for each run. ..............................68
Table 4.1 PSA bed, adsorbent, equilibrium and kinetic properties for initial simulation 101
Table 4.2 Conditions and performances in terms of CO2 purity and recovery of 3-Bed 8-
Step PSA process for initial simulations using the cycle depicted below. ......................102
Table 4.3 Bed, adsorbent properties for the experiments and model validation..............103
Table 4.4 PSA process conditions for the experiments and model validation. ................104
Table 4.5 Summary of PSA Process Performance. Experiments (E1-4) .........................105
Table 4.6 Comparison of experiment and model PSA process performances. ................106
Table 5.1 Stage 1 PSA bed, adsorbent, and process characteristics. ...............................155
xii
Table 5.2 Input parameters of 3-Bed 9-Step PSA process for parametric study via running
simulations using the cycle depicted below .....................................................................156
Table 5.3 Stage 1 PSA process performance results from parametric study via DAPS ..157
Table 5.4 Stage 2 preliminary DAPS simulations bed, adsorbent, and process
characteristics ...................................................................................................................158
Table 5.5 Stage 2 scale-up simulations, experiments and model validation bed, adsorbent,
and process characteristics. ..............................................................................................159
Table 5.6 Stage 2 preliminary PSA process performance results from DAPS.. ..............160
Table 5.7 Scale-up conditions from the selected Feed II to 4-bed PSA apparatus. .........161
Table 5.8 Effect of scaled up feed flow rate and step times used in DAPS simulations and
corresponding performances ............................................................................................162
Table 5.9 4-bed Stage 2 experimental conditions and parameters...................................163
Table 5.10 4-bed Stage 2 periodic state PSA process performance ................................164
Table 5.11 Comparison of experiment and model PSA process performances ...............165
xiii
LIST OF FIGURES
Figure 1.1 Current space station regenerative environmental control and life support system
(ECLSS) flow diagram, open system (NASA Facts, 2004)...............................................24
Figure 1.2 Future space station regenerative environmental control and life support system
(ECLSS) flow diagram, closed-loop system (NASA web page). ......................................25
Figure 1.3 Temperature and humidity control system (Wieland, 1994). ...........................26
Figure 1.4 Atmosphere Control and Supply (Wieland, 1994). ..........................................27
Figure 1.5 Atmosphere revitalization subsystems (Wieland, 1994). .................................28
Figure.1.6 CDRA-4BMS schematic. Desiccant-adsorbent Bed 2 adsorbing CO2 from the
cabin and desiccant-adsorbent Bed 1 desorbing to the space vacuum (Knox et al., 2005;
Matty, 2010). ......................................................................................................................29
Figure.1.7 Water recovery and management (Wieland, 1994). .........................................30
Figure.1.8 Waste management system (Wieland, 1994) ...................................................31
Figure 2.1 Picture of ASAP 2010 ......................................................................................43
Figure 2.2 Isotherms of Carbon dioxide, Nitrogen and Oxygen at three different
temperatures in linear (left) and log-log scale (right). The solid lines represent the model
fits and the markers represent the experimental data. ........................................................44
Figure 2.3 Single bed rapid pressure swing (RPSA) apparatus (Rahman, 2016). .............45
Figure 3.1 Cycle sequence of preliminary simulations: 3-Bed 9-Step PSA Cycle. ...........69
Figure 3.2 Effect of HR/LR/F step time (thus cycle time) on cyclic steady state performance
for the runs 1-4 in Table 3.2. a) CO2 purity and recovery, b) Power. ................................70
Figure 3.3 Bed profiles at the end of HR step for each run (1-4 in Table 3.2) at periodic
steady state. ........................................................................................................................71
Figure 3.4 Relative losses of CO2 from light end (minus: decrease in CO2 loss, +: increase
in CO2 loss relative to x=0). Run numbers 1-4 in Table 3.2. .............................................72
Figure 3.5 Cumulative CO2 gas phase concentration (ȳCO2, cum) from the beginning to
the end of feed step. Run numbers 1-4 in Table 3.2. .........................................................73
xiv
Figure 3.6 Effect of light reflux ratio (LRR) on cyclic steady state performance for the PSA
cycle. Run numbers 3 and 5-7 in Table 3.2. a) CO2 purity and recovery, b) Power. ........74
Figure 3.7 Bed profiles at the end of HR step for each run (3 and 5-7 in Table 3.2) at
periodic steady state. ..........................................................................................................75
Figure 3.8 Effect of counter-current depressurization pressure (PCnD) on cyclic steady state
performance for the PSA cycle. Run numbers 3, 8, and 9 in Table 3.2. a) CO2 purity and
recovery, b) Power. ............................................................................................................76
Figure 3.9 Bed profiles at the end of HR step for each run (3, 8-9 in Table 3.2) at periodic
steady state. ........................................................................................................................77
Figure 3.10 Effect of light reflux pressure (PLR) on cyclic steady state performance for the
PSA cycle. Run numbers 3, 10-11 in Table 3.2. a) CO2 purity and recovery, b) Power. ..78
Figure 3.11 Bed profiles at the end of HR step for each run 3, 10-11 in Table 3.2) at periodic
steady state. ........................................................................................................................79
Figure 3.12 Effect of co-current depressurization pressure (PCoD) on cyclic steady state
performance for the PSA cycle. Run numbers 3, 12-13 in Table 3.2. a) CO2 purity and
recovery, b) Power .............................................................................................................80
Figure 4.1 Cycle sequence of initial simulations: 3-Bed 8-Step PSA Cycle. ..................107
Figure 4.2 Bed profiles at end of HR step for different x times ......................................108
Figure 4.3 Cycle sequence for the experiments and model validation: 3-Bed 9-Step PSA
Cycle. ...............................................................................................................................109
Figure 4.4 Schematic diagram of the 4-Bed PSA system, showing all the valves, mass flow
controllers and mass flow meters, pressure-vacuum pump, heavy product tank and light
product tank. ....................................................................................................................110
Figure 4.5 Back and front views of 4-Bed PSA system. .................................................111
Figure 4.6 Front Panel of LabVIEW Program .................................................................112
Figure 4.7 Temperature history of one bed for the E1-4 (a-d, respectively) during one entire
cycle. T1-7 (10.12%, 22.78%, 35.44%, 48.10%, 60.75%, 73.41%, 86.07%) are locations
of thermocouples from feed end. .....................................................................................113
Figure 4.8 Pressure history during one entire cycle for E4 (a) and a zoomed-in view of
pressure when equalization down, CoD, CnD steps (b) and light reflux, equalization up and
light product pressurization steps (c) occur. ....................................................................114
xv
Figure 4.9 Pressure history during one bed with one-third of entire cycle (Top) and
zoomed-in view of pressure during Eq down, CoD and CnD steps (left) and zoomed-in
view during Eq up and LPP steps (right) for E4&M4. ....................................................115
Figure 4.10 Comparison of temperature histories of experiment 4, E, (solid) and model 4,
M (dashed). T1-7 (10.12%, 22.78%, 35.44%, 48.10%, 60.75%, 73.41%, and 86.07% from
T1 through T-7, respectively) are locations of thermocouples from feed end. ................116
Figure 4.11 Bed profiles at end of HR step of modelling results for E1-4. .....................117
Figure 5.1 Cycle sequence of 1st stage: 3-Bed 10-Step PSA Cycle. ...............................166
Figure 5.2 Pfeiffer vacuum pump, model ACP 40 performance curve. The pressure and
flow rate operating points during the CnD and LR steps for this Stage 1 PSA process
operating at 0.1 kPa (purple), 0.3 kPa (green), 0.5 kPa (blue), 4kPa (orange) and 5kPa
(pink) are indicated. .........................................................................................................167
Figure 5.3 Effect of HR/LR/F step time (thus cycle time) on cyclic steady state performance
for the runs base and S1-5 in Table 5.2. a) CO2 purity and recovery, b) Total Power ....168
Figure 5.4 Bed profiles at the end of HR step for each run (base and S1-5 in Table 5.2) at
periodic steady state. ........................................................................................................169
Figure 5.5 Relative losses of CO2 from light end (minus: decrease in CO2 loss, +: increase
in CO2 loss relative to base case). Run numbers base and S1-5 in Table 5.2. .................170
Figure 5.6 Cumulative CO2 gas phase concentration (ȳCO2, cum) from the beginning to
the end of feed step. Run numbers base and S1-5 in Table 5.2. ......................................171
Figure 5.7 Effect of production LR step flow rate (FLR1) on cyclic steady state performance
for the PSA cycle. Run numbers base and S6-7 in Table 5.2. a) CO2 purity and recovery,
b) Total Power..................................................................................................................172
Figure 5.8 Bed profiles at the end of HR step for the parametric study of production LR
step flow rate (FLR1), corresponding runs are base and S6-7 in Table 5.2 at periodic steady
state. .................................................................................................................................173
Figure 5.9 Effect of light reflux 2 step flow rate (FLR2) on cyclic steady state performance
for the PSA cycle. Run numbers base and S8-10 in Table 5.2. a) CO2 purity and recovery,
b) Total Power..................................................................................................................174
Figure 5.10 Bed profiles at the end of HR step for the parametric study of light reflux 2
step flow rate (FLR2), corresponding runs are base and S8-10 in Table 5.2 at periodic steady
state. .................................................................................................................................175
Figure 5.11 Effect of production LR step time (ts,2) on cyclic steady state performance for
the PSA cycle. Run numbers base and S11-12in Table 5.2. a) CO2 purity and recovery, b)
Total Power. .....................................................................................................................176

xvi
Figure 5.12 Bed profiles at the end of HR step for the parametric study of production LR
step time (ts, 2) effect at periodic steady state, corresponding runs are base and S11-12 in
Table 5.2 ..........................................................................................................................177
Figure 5.13 Effect of counter-current depressurization pressure (PCnD) on cyclic steady
state performance for the PSA cycle. Corresponding runs are base, S13, and S14 in Table
5.2. a) CO2 purity and recovery, b) Total Power .............................................................178
Figure 5.14 Bed profiles at the end of HR step for the parametric study of counter-current
depressurization pressure (PCnD) effect, corresponding runs are base and S13-14 in Table
5.2 at periodic steady state. ..............................................................................................179
Figure 5.15 Effect of light reflux pressures (PLR1&2) on cyclic steady state performance for
the PSA cycle. Corresponding runs are base, and S15 in Table 5.2. a) CO2 purity and
recovery, b) Total Power..................................................................................................180
Figure 5.16 Bed profiles at the end of HR step for the parametric study of light reflux
pressures (PLR1&2) effect, corresponding runs are base and S15in Table 5.2 at periodic
steady state.. .....................................................................................................................181
Figure 5.17 New 4-bed 9-step Stage 2 PSA process cycle schedule and cycle step
sequence with a heavy reflux (HR) step at an intermediate pressure between the two
equalization (Eq) steps that uses the heavy product produced during the LR step as its feed
source. ..............................................................................................................................182
Figure 5.18 Temperature history of one bed for the E3 during one entire cycle at steady
state. 1-7 are locations of thermocouples from feed end. T1-7 (10.12%, 22.78%, 35.44%,
48.10%, 60.75%, 73.41%, 86.07%) are locations of thermocouples from feed end. ......183
Figure 5.19 Pressure history of one bed for the E3 run during one entire cycle at steady
state ..................................................................................................................................184
Figure 5.20 Comparison of pressure history of one bed for the experiment 3, E (solid line)
and model 3, M (dashed line) run during one entire cycle at steady state. ......................185
Figure 5.21 Comparison of temperature histories of experiment 3, E, (solid) and model 3,
M (dashed). T1-7 (10.12%, 22.78%, 35.44%, 48.10%, 60.75%, 73.41%, and 86.07% from
T1 through T-7, respectively) are locations of thermocouples from feed end... ..............186
Figure 5.22 Schematic of the two-stage PSA system designed to remove 4.0 kg/day of
metabolic CO2 from cabin air. Stage 1 is a 3-bed 10-step PSA process with the dimensions
of I.D: 10.62 in, L: 19.75 in and Stage 2 is a 4-bed 9-step PSA process the dimensions of
I.D: 1.5 in, L: 19.75in. .....................................................................................................187
xvii
LIST OF SYMBOLS
A Cross sectional area, m2
Bj,i heat of adsorption for component i on site j, K
bj,i Affinity parameter for site j in TPL isotherm for component i, kPa-1
0
ij,b pre-exponential constant for temperature dependence, kPa-1
Cpa,j the molar heat capacity of species i in the adsorbed phase, kJ/mol/K
Cpg,i the molar heat capacity of species i in the gas, kJ/mol/K
Cpg gas phase heat capacity, kJ/mol/K
Cpp the heat capacity of the pellet, kJ/mol/K
CT (t) total molar conc. at the downstream of the bed at time t, mol/m3
CT total molar concentration, mol/m3
Cv valve coefficient
cv the valve coefficient
E Energy, J
Ffeed Feed flow rate, slpm
hw the heat transfer coefficient at the wall of the bed
km micropore mass transfer coefficient
kM,i* overall effective macropore mass transfer coeff. of component i, s-1
kM,i Macropore mass transfer parameter of component i, s-1
L length of the column, m
m Number of the species
Mg average molecular weight of the gas phase
mstep(t) the molar flow leaving the bed at time t, mol/s
N number of components
P Power, W
Po the pressure outside the valve
Pstep (t) the pressure at the downstream of the bed at time t, kPa
xviii
qi adsorbed phase conc. of component i in the solid phase, mol/kg
ijsq , maximum possible adsorbed amount of component i on site j, mol/kg
*
iq equilibrium adsorbed amount of component i, mol/kg
µg the viscosity of the gas phase
R Universal Gas Constant, 8.314Pa.m3/mol/K
ri the internal radius of the bed
rp the effective radius of the pellet
RRLPP Light product pressurization reflux ratio
s the number of energy consuming steps
Sg the specific gravity of the gas relative to air at 1 atm and 21.45 oC
Subscript f Denotes end of the step (in Table2)
T (t) the temperature at the downstream of the bed at time t, K
T temperature of both gas and solid phases, K
tcycle the total cycle time, s
tfeed the feed step time, s
tstep the total time of a specific step which the energy is calculated for, s
v interstitial velocity, m/s
vstep (t) the velocity at the downstream of the bed at time t, m/s
yCO2 (t) the CO2 gas phase conc. at the downstream of the bed at time t
ȳCO2, cum Cumulative CO2 gas phase concentration
yCO2,f CO2 concentration in feed
yi molar fraction of species i in the gas phase
yif Feed stream concentration of component i (i 1-3)
γ the ratio of heat capacities (1.4 in all energy calculations in this work)
ΔHi heat of adsorption of component i, kJ/mol
εb bed porosity
εp pellet porosity
ρg the density of the gas phase
ρp density of the particle, kg/m3
𝜂 the efficiency
xix
LIST OF ABBREVIATIONS
4BMS 4-bed molecular sieve
AES Advanced exploration systems
ARS Air revitalization system
C Carbon
C.M.B. Component mass balances
C2H4 Ethylene
C6H6 Benzene
CCS Carbon capture and sequestration
CDRA Carbon dioxide removal assembly
CH4 Methane
CnD Counter-current depressurization
CO Carbon monoxide
CO2 Carbon dioxide
CoD Co-current depressurization
DAC Direct air capture
DAPS Dynamic adsorption process simulator
E Equalization down
E* Equalization up
E.B. Energy balance
ECLSS Environmental control and life support system
EVA Extra vehicular activity
F Feed
H2 Hydrogen
H2O Water
HR Heavy reflux
I Idle
xx
IPCC The intergovernmental panel on climate change
ISS International space station
KOH Potassium Hydroxide
LDF Linear driving force
LPP Light product pressurization
LR Light reflux
M.B. Momentum balance
MCA Major Constituent Analyzer
MEMS Micro-electromechanical
N2 Nitrogen
NASA The National Aeronautics and Space Administration
NH3 Ammonia
NOX Nitric oxides
O.M.B. Overall mass balance
O2 Oxygen
PSA Pressure swing adsorption
STEL Short-term exposure limit
TCCS Trace contaminant control system
TPL Triple process langmuir isotherm
TSA Temperature swing adsorption
UPA Urine processor assembly
V.E. Valve equation
VCD Vapor compression distillation
WPS Water processor assembly
WRS Water recovery system

1
CHAPTER 1
INTRODUCTION
Widespread research and development focused on slowing or reducing carbon
dioxide (CO2) emissions have been motivated by the growing understanding that the
atmosphere is not an infinite sink thus the rising atmospheric CO2 concentration and its
impact on climate (Ebner and Ritter 2009; Ebner et al. 2011). The Intergovernmental Panel
on Climate Change (IPCC) has also stated that CO2 is the greenhouse gas contributing the
largest portion of the increase in global warming (Zeman and Lackner 2004). The general
agreement is to reduce CO2 emissions in order to avoid negative consequences such as
global warming, the spread of diseases, the destruction of ecosystems, and sea level rise
(Satyapal et al. 1999; Jones 2011; Satyapal et al. 2000).
In addition to greenhouse gas capture, technology for removing CO2 from air has
been practiced for decades to maintain safe levels of CO2 in submarines (Carey,
Gomezplata, and Sarich 1983) and spaceships (DallBauman and Finn 1999). Another
words, such systems for efficient removal of CO2 at low concentration are also a key for
the proper operation of submarines and space crafts (Satyapal et al. 2001; Ernsting 1999),
mining and diving (Moore 2007), and also medical applications (Dosch 2006), where CO2
concentrations are typically below 5000 ppm (J. C. Knox 2000; Mulloth and Finn 1998;
Satyapal et al. 2001).
2
1.1 CO2 capture from flue gas
The most frequently targeted point sources for CO2 emission are fossil-fuel power
plants; they are responsible for more than 40% of CO2 emission. More development of
carbon capture and sequestration (CCS) technologies will be required for a reduction of
CO2 emissions (K. S. Lackner et al. 2012). In this process CO2 is captured before its
emission to atmosphere. CO2 capture in CCS process can be done in three ways: pre-
combustion capture, post-combustion capture (more applicable, energy is produced by
direct combustion of coal) and oxy-combustion. In terms of CO2 capture from flue gas,
several CCS technologies are under development such as absorption (both chemical and
physical), adsorption, membranes, and cryogenic processes (Ebner and Ritter 2009;
Satyapal et al. 1999). None of these technologies is economically feasible because of power
requirements, energy integration, CO2 compression, and O2 supply for pre-combustion and
oxy-combustion capture. Among these technologies, pressure swing adsorption (PSA)
does not need heat or steam for regeneration and it can easily be modified for more
improvements (Ebner et al. 2011). Even after eliminating all emissions from power plants
with the commercial technologies for CO2 capture, the remaining would still be released
to the atmosphere, so atmospheric CO2 will still require stabilizing.
1.2 CO2 capture from atmospheric air
Besides capturing CO2 with conventional CCS from coal fired and other fossil fuel
based power plants, concentrated industrial sources, it is physically possible to capture CO2
directly from air as a plausible alternate approach, which is called direct air capture (DAC).
CO2 capture from air, unlike conventional CCS, could address all other sources of
3
anthropogenic carbon such as cars, buses, and planes (Jones 2011; K. S. Lackner et al.
2012). A significant challenge for air capture is that separating and concentrating a gas
from ultra-dilute conditions is more difficult than from a moderately dilute conditions
(Jones 2011). The idea of CO2 removal from atmospheric air first was introduced by
Lackner and colleagues in 1999 (K. Lackner, Ziock, and Grimes 1999; K. Lackner, Grimes,
and Ziock 1999). Both conventional CCS and DAC approaches have three steps; separation
and concentration, compression and pipelining of CO2, and pumping and storage. The only
difference is separation and concentration techniques for the two approaches (Jones 2011).
Air capture operates at lower temperatures (at ambient conditions); while CCS processes
typically operate at higher temperatures because of these different techniques. The main
approaches for the separation and concentration techniques in air capture are to use metal
hydroxides or oxides to capture CO2 from air and convert it to metal carbonates to
concentrate CO2, and then the concentrated CO2 stream is released via a calcination step
by heating to high temperature, around 900oC (Baciocchi et al., 2006; Zeman and Lackner,
2004). Baciocchi and coworkers’ air capture process was based on a sodium/calcium cycle
in 2006, while Zeman and Lackner’s process was based on absorption of CO2 in aqueous
sodium hydroxide solutions in 2004. Thereafter, Sodium Hydroxide Spray tower instead
of a packed column cotactor has been reported to capture CO2 from air to reduce the costs
(Stolaroff and Keith 2008), but the overall cost of the process was expected to be quite
large. However, the main disadvantage of these approaches is being energy intensive
processes. Another state-of-the-art adsorption technology for air capture relies on
adsorption-based approaches with the solid adsorbents such as zeolites, activated carbon,
solid amine, and alumina. In 2008, a sodium-based and calcium-based CO2 adsorption
4
cycle has been done by Steinfeld and coworkers. A technical challenge was the slow
carbonation rate of the solids that leads slow adsorption rates and inefficient use of the
sorbents. Sodium or calcium hydroxides as the reacting species in solid forms or in solution
require substantial heat input to regenerate the sorbent or solution; leading significant
energy costs (Nikulshina, Ayesa, and Steinfeld 2008). Another adsorption based DAC has
been done by using weakly basic, quaternary ammonium ion-exchange resins between the
bicarbonate and carbonate forms and exposed water. The main disadvantage is that having
low CO2 adsorption capacity causes large masses of adsorbent (Klaus S Lackner and
Brennan 2009). Therefore, a follow-up adsorption-desorption process was based on
adsorption on dry resin (K S Lackner 2009). The process operates with multiple filters; one
in adsorption mode and the others in various stages of regeneration. In the regeneration
stages, either water vapor or liquid water has been used for inducing desorption. However,
the presence of water vapor will adversely affect the selectivity and adsorption capacity for
CO2 (Belmabkhout, Serna-Guerrero, and Sayari 2010). Adsorption based studies given so
far has been at elevated temperatures those studied in high-temperature CCS processes.
Some other groups are also studied novel air capture materials and processes that are based
on adsorption at ambient temperatures. Those air capture materials are oxide-supported
amine materials and silica-supported amines as adsorbents for the extraction of CO2 from
ambient air (Choi et al. 2009; Belmabkhout, Serna-Guerrero, and Sayari 2010). It can be
said that supported amine adsorbents are promising materials for use in potential air capture
processes because of being regenerable with low-cost. So far, there is no detailed scale-up
design reported in the literature for air capture. Overall, technologies for the removal of
CO2 from ambient air on a larger scale are still in their infancy, they have gained increased
5
attention recently (Jones, 2011; Wang et al., 2015) because DAC presents an even greater
challenge because of the extremely dilute CO2 concentrations in ambient air. If air capture
economically practical, it can actually reduce the global CO2 concentration in the
atmosphere.
In addition to greenhouse gas capture from flue gas and ambient air, technology for
removing CO2 from air has been practiced for decades to maintain safe levels of CO2 in
submarines (Carey, Gomezplata, and Sarich 1983) and spaceships (DallBauman and Finn
1999).
1.3 International Space Station (ISS), Environmental Control and Life Support
System (ECLSS)
The National Aeronautics and Space Administration (NASA) is responsible in
civilian space program as well as advancement of aeronautics and space science and
involved developing the life support technology required to support current and future
long-duration manned space flight; extensive research and development is being
continuing on individual life support subsystems (L. and C. 1970; Pearson A.O. 1971;
Rudolph, Hebestreit, and Harzer 2000; NASA Facts 2004).
In the International Space Station (ISS), basic life support needs O2 supply, CO2
removal, comfortable temperature and humidity range, pure water supply, adequate
nutrition that the crew can live and work. Physical storage of the necessary quantities of
food, water, oxygen, absorbents leads increasingly weight penalties, especially when
missions of several months or more are considered. For such missions, regenerative
systems will be required (Bowman and Lawrence 1971). Environmental Control and Life
6
Support System (ECLSS) is the responsible with all these needs. Another word, ECLSS
functions are oxygen supply for metabolic consumption, potable water supply for
consumption, food preparation and hygiene uses, carbon dioxide removal from the cabin
air, particulates and microorganisms filter from the cabin air, removal of volatile organic
trace gases from the cabin air, cabin pressure control, cabin atmosphere composition and
purity control, monitoring and controlling cabin environment partial pressures of nitrogen,
oxygen, carbon dioxide, methane, hydrogen and water vapor, temperature and humidity
control, cabin ventilation, collect, stabilize, store, and dispose of wastes (waste
management), and fire detection and suppression for all mission and recycle water and
oxygen for long mission (NASA Facts 2004; DallBauman and Finn 1999; Daues 2006;
Ewert, Barta, and Mcquillan 2009; Wieland 1994; R. Carrasquillo 2013). The functions
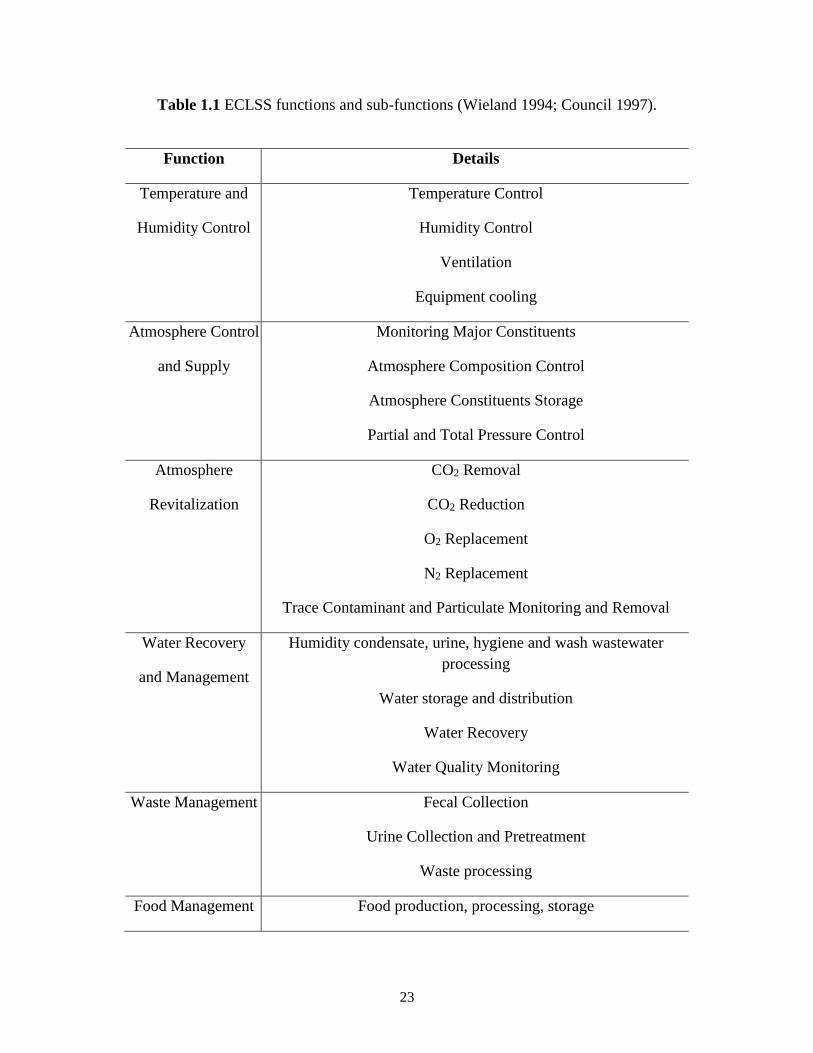
and sub-functions of ECLSS are given in Table 1.1. ECLSS modes of operation are open
loop for current short term missions and closed loop for future long term missions. In open-
loop ECLSS uses resources being brought from the Earth, continuous input and output,
while in closed-loop flow diagram life support system recovers other sources with
processing possibilities of non-useful waste. The current and future long-duration manned
space flight flow diagrams of ECLSS are given in Figure 1.1 and Figure 1.2 respectively.
1.3.1 Humidity/Temperature Control
Temperature and Humidity Control system of ECLSS is responsible for
temperature control, humidity control, ventilation, equipment cooling, shown in Figure.1.3
Firstly, To keep the temperature even, the station is insulated with a highly-reflective
blanket called Multi-Layer Insulation because the temperature range of outside of the
Space Station is 250 to minus 250 oF (Sun-facing side and the dark side) without thermal
7
controls (NASA 2001). Temperature Humidity Control subsystem maintains a habitable
environment and monitors the temperature inside the Space Station by removing heat and
humidity, and circulating the cool dry air. Circulating cool, dry air minimizes the
temperature variations, keeps the humidity low and supports smoke detection (NASA
Facts, 2008). Cabin temperature nominal range is 65 to 80˚F (NASA 2001). Heat
exchangers have been used on all crewed spacecraft to date to control temperature and to
condense moisture from the atmosphere (R. L. Carrasquillo 2008; Council 1997; Wieland
1994). Sources of heat include electronics, lighting, and solar heating of the habitat as well
as metabolic sources. Excess heat is removed via ventilation. Ventilation is the primary
method of removing heat (Wieland 1994).
Cabin humidity is usually maintained at about 60% relative humidity because high
humidity can promote the growth of microbes and fungi and low humidity can cause drying
of the eyes and skin and the decreasing protection against respiratory infections (NASA
2001; Wieland 1994). In addition to effects on human health, low humidity leads the
generation of sparks, very serious fires on a space station when being mixed with oxygen,
hydrogen, and other flammable gases, caused by a buildup of static electricity ((NASA,
n.d.). A rotary liquid centrifugal separator, mechanical device has been used to remove
condensate from the air stream in a microgravity environment (Council 1997). Currently
ISS uses condensing heat exchangers with anti-microbial hydrophilic coatings requiring
periodic dry out, which is a disadvantage (Gatens and Ruff 2013). Using membranes
instead of mechanical separators have been investigating in order to simplify the system
design for future long-duration spaceflights (Council 1997; R. L. Carrasquillo 2008).

8
1.3.2 Atmosphere Control and Supply
The cabin atmosphere in the ISS is maintained at the Earth-normal conditions at
sea level for reasons including safety and easier testing of equipment, with a partial
pressure of oxygen sufficient to sustain human life. The Atmosphere Control and Supply
subsystem especially monitors the amount of nitrogen and oxygen in the space station’s
air. The subsystem consists of pressure sensors and regulators, shutoff valves, check
valves, relief valves, distribution lines and tanks, and valves and controls to provide the
proper concentrations of oxygen and nitrogen (Council 1997; Wieland 1994; R. L.
Carrasquillo 2008). The total pressure for an extravehicular activity (EVA) or spacewalks
is regulated to 70.3 kPa (10.2 psia) to ease the transition to the space suit pressure. A
simplified schematic of an atmosphere control and supply system is shown in Figure 1.4
(Wieland 1994). After monitoring major constituents (N2, O2, CO2, and humidity) by
having separate analyzers for each gas such as a solid-state laser diode absorption system
for O2, a solid-state infrared absorption system for CO2, and a solid-state, thin film
capacitance detection system for relative humidity, reports are sent to the Major
Constituent Analyzer (J. L. Perry et al. 2015). The pressure control panel monitors total
pressure and the O2 partial pressure of the space station’s cabin to determine N2 and O2
amounts (NASA, n.d.; Wieland 1994; J. L. Perry et al. 2015). High pressure tanks and
cryogenic storage of liquefied gases have been used for storage of the atmosphere
constituent gases, N2 and O2, (NASA, n.d.; Wieland 1994). The Major Constituent
Analyzer (MCA) on ISS is based on mass spectrometry.
9
1.3.3 Atmosphere Revitalization
National Aeronautics and Space Administration’s (NASA) Advanced Exploration
Systems (AES) Program has been studying and developing candidate atmosphere
revitalization System (ARS) equipment technologies for deep space exploration missions
(J. C. Knox et al. 2012; J. Perry et al. 2012; Howard, D., Perry, J., and Roman, M. 2014).
Therefore, the ISS AR subsystem has served as the starting basis to economically advance
environmental control and life support (ECLSS) technology for developing the AR
subsystem of the future long-duration space exploration missions (J. L. Perry et al. 2015;
Hodgson et al. 2012). Fundamentals of air revitalization system (ARS) are oxygen and
nitrogen supply and control, carbon dioxide removal, carbon dioxide reduction for oxygen
recovery and trace contaminant removal, shown in Figure 1.5 (Murdock 2010; Ewert,
Barta, and Mcquillan 2009; J. L. Perry et al. 2015). These processes also interact with the
water recovery system to re-form water by carbon dioxide reduction assembly for water
electrolysis to produce oxygen with the hydrogen by-product which is utilized by the
carbon dioxide reduction assembly along with the waste carbon dioxide (Murdock 2010).
Carbon dioxide reduction step is a necessary step for closed-loop that minimizes the
resupply needed for crew support for long duration mission (Murdock 2010).
1.3.3.1 Oxygen Generation
The concentration of O2 must be maintained near the sea-level O2 partial pressure
to avoid physiological effects such as decreased night vision, impaired memory and
coordination, unconsciousness, death of nerve tissue (Anoxia) and hypoxia (lack of O2) at
lower partial pressures of O2 and lung irritation at higher partial pressures of O2. It is
extremely vital to maintain an adequate O2 supply because of these physiological effects
10
(Wieland 1994; NASA, n.d.). In the space crafts, oxygen is consumed by the crew,
experimental animals, and lost through leakage (Council 1997). Oxygen can be provided
by resupply and storage. On all U.S-crewed missions to date, the O2 has been supplied
from stored gaseous or cryogenic oxygen (Council 1997; NASA, n.d.; Daues 2006). For
longer duration missions, mass penalty of these open-loop technologies is excessive, thus
recovery of O2 is required. Electrolysis of recovered waste water to supply O2 is the
technology chosen by the ISS for future long-duration missions (Wieland 1994; Council
1997; J. L. Perry et al. 2015; R. L. Carrasquillo 2008; NASA, n.d.; Murdock 2010). The
machine that produces oxygen using electrolysis is called “Elektron” which is powered by
the solar panels and batteries (NASA, n.d.). Electrolysis process dissociates water (H2O)
into oxygen and hydrogen gas (O2 and H2) by an electric current (R. L. Carrasquillo 2008).
Hydrogen goes to the negative electric pole while oxygen goes to the positive electric pole.
By-product of electrolysis, H2, is currently sending to space, overboard venting, but it
would be used in CO2 reduction processes for future long duration mission (Wieland 1994;
Council 1997; R. L. Carrasquillo 2008). The technologies for water electrolysis are static
feed water electrolysis with KOH electrolyte, solid polymer water electrolysis with a per-
fluorinated sulfonic acid polymer, which has been used in the ISS, and circulating KOH
electrolysis (Council 1997; Wieland 1994). Only in emergencies, perchlorate candle
produces oxygen through chemical reactions. A Portable Breathing Apparatus or gas mask
can also be used in critical situations (NASA, n.d.).
1.3.3.2 Nitrogen Supply
Nitrogen is needed to maintain the total atmospheric pressure of cabin. Nitrogen is
safely stored onboard spacecraft because of being inert gas then it is generally resupplied
11
from stored gaseous or cryogenic tanks in the ISS (Council 1997). The nitrogen
replacement system consists of pressurized tanks of nitrogen with electrically and manually
controlled valves (NASA, n.d.). N2 might also be provided by the catalytic dissociation of
hydrazine (N2H4) or ammonia (NH3) for future mission because of having a lower mass
penalty than storing N2, but hydrazine is highly toxic (Council 1997; Wieland 1994). The
recovery of nitrogen from metabolic waste products has also being investigated.
1.3.3.3 Trace Contaminant Removal and Monitoring
In a space habitat, even a small amount of a contaminant may result in the crew
discomfort or sickness because the atmosphere of a space habitat does not have the volume
of the Earth's atmosphere, as a result, does not dilute contaminants (Wieland 1994; Council
1997). Therefore, it is essential to monitor even the trace amounts of contaminants in the
closed environment of a space habitat atmosphere. The crewmembers receive the proper
air make-up. Trace Contaminant Control and removal system must protect crew for
metabolic and chemical contaminants and particles, and deal with sources of trace
contaminants. The sources of trace contaminants include off-gassing of materials,
contaminants produced by humans (feces, urine, perspiration, etc.), food preparation,
housekeeping cleaners, and experimental activity (Council 1997; Wieland 1994). Some
contaminants are common to all missions such as the products of human metabolism while
others will vary from mission to mission and time duration of mission (Council 1997).
There might be as many as trace contaminants. The main contaminants are carbon
monoxide (CO) from machine off-gassing and in their urine and their breath, ammonia
(NH3) from cleaning supplies and the breakdown of urea in sweat, nitric oxides (NOX),
ethylene (C2H4), benzene (C6H6), methane (CH4), is produced in the intestines, and
12
particulates (NASA, n.d.). On the Earth these contaminants are not a big problem because
of existing as small amounts but on the ISS, air is constantly reused and the chemicals will
accumulate if the air is not cleaned properly. To protect crew members, Trace Contaminant
Control and removal system must detect hazardous trace gases, control contaminants below
the maximum allowable concentrations in space, and keep them an acceptable range.
Therefore, the level of the trace-contaminant should be monitored at all time. The method
of trace contaminant monitoring used on the ISS is a second miniature mass spectrometer
integrated with a micro-electromechanical (MEMS) gas chromatograph (J. L. Perry et al.
2015; Wieland 1994; Council 1997). The ISS Trace Contaminant Control System (TCCS)
has four contaminant removal components: particulate filters, activated charcoal
adsorption bed and thermal catalytic oxidizer with post-sorbent bed (R. L. Carrasquillo
2008; Council 1997). The method to remove dust particles, aerosols, and airborne microbes
is a high efficiency particulate atmosphere filters in the ventilation system (Wieland 1994;
Council 1997). Activated charcoal adsorption bed removes compounds with high
molecular weights compounds. Thermal catalytic oxidizer oxidizes compounds at high
temperature (400oC). Chemisorbant beds are used to remove nitrogen and sulfur
compounds, halogens, and metal hybrids (Council 1997; Wieland 1994). Advanced Trace
Contaminant Control (ATCC) systems such as photo catalytic oxidation, thermal catalytic
oxidation and regenerable adsorbent process are being investigated (Ewert, Barta, and
Mcquillan 2009).
1.3.3.4 Carbon Dioxide Removal
Environmental air normally contains ca. 0.03 vol. % CO2 with 4 vol. % CO2 in air
exhaled by humans. According to the United States Occupational Safety and Health
13
Administration, the threshold limit value (TLV) of CO2 is 0.5% with 3% for short-term
exposure limit (STEL) during 15 minutes. The danger of suffocation in closed rooms is the
displacement of oxygen by CO2-accumulation (Knox, J.C. and Howard 2007; Mattox and
Bardot 2011). Therefore, if the exhaled gas is to be recycled, it is necessary to remove the
carbon dioxide in the breathing loop considering human health (Dosch 2006). Because
spacecrafts are completely closed environment, produced carbon dioxide by the crew’s
normal metabolic respiration, other living organisms, and chemical processes must be
removed from the atmosphere, therefore the concentration of CO2 must maintain at a very
low level (0.4 kPa or below) in order to avoid adverse physiological effects n crew
members (Council 1997; Wieland 1994). One crew member generates CO2 during normal
metabolic respiration is at an average rate of 1kg (2.2 lb) per day and that must be removed
at a nominal rate of 1kg per day per person. The methods considered for use on space
habitat to remove CO2 from cabin air are rely on absorption (chemical or electrochemical
reaction with a sorbent material) such as electrochemical depolarization concentration and
air polarized concentrator, adsorption (physical attraction to a sorbent material) such as
metal oxide, solid phase amine, lithium hydroxide, and molecular sieves, membrane
separation (osmotic membranes, amine-functional membranes), and scrubbing CO2, such
as permeable membranes, liquid amine, adsorbents, and absorbents (Wieland 1994; Sherif
et al. 2005; Tsai et al. 2003).
The primary method to remove CO2 in space life support systems has been used on
most U.S. space habitats until early 1990s was absorption by lithium hydroxide (LiOH);
granular lithium hydroxide (LiOH) canisters (Ewert, Barta, and Mcquillan 2009; Council
1997; Wieland 1994; DallBauman and Finn 1999; NASA, n.d.; Hwang et al. 2008;
14
Satyapal et al. 2001; scott R. Johnson, Garrad, and Mitchell 1993; S. R. Johnson 1992;
Satyapal et al. 1999). Although the storage capacity of LiOH is high (30 wt %), the material
cannot be practically regenerated because of having nonreversible chemical reaction. In
this process chemisorption of CO2 on LiOH is a nonreversible chemical reaction which
means that the LiOH must be periodically replaced with fresh LiOH material (Wieland
1994). In addition, the required LiOH amount to remove generated CO2 from one person
per day is 2kg and this mass is increasing linearly with the duration of mission and the crew
size (DallBauman and Finn 1999). This works well for short duration missions, but for
future long duration missions, additional storage of fresh LiOH canisters will be required
which is prohibitive because of weight penalty of spacecrafts for long duration. Therefore,
non-regenerable lithium hydroxide canisters are nor useful for long duration missions
(Wieland 1994; Council 1997). Later on, a regenerable amine based system has been
demonstrated for carbon dioxide removal and partial humidity control; regeneration has
been done via a vacuum swing process (Ewert, Barta, and Mcquillan 2009). This system
functions on two adjacent sorbent beds; one bed is for removing CO2 and water vapor by
exposing to the ventilation loop flow, while the other is regenerated by vacuum exposure
or inert gas (Filburn, Dean, and Thomas 1998).
Currently the International Space Station uses the Carbon Dioxide Removal
Assembly (CDRA) to remove carbon dioxide from the cabin atmosphere. This assembly is
a 4-Bed molecular sieve (4BMS); the first two regenerative desiccant beds are packed with
silica gel and zeolite 13X to remove water and the other two regenerative beds are packed
with zeolite 5A to remove carbon dioxide or to maintain CO2 within tolerable limits
(generally below 7.6 mm Hg) with the temperature swing adsorption (TSA) technology,
15
which utilizes an adiabatic thermal cycling process that involves the adsorption and
regeneration of CO2 using an adsorbent (Mattox and Bardot 2011; James C Knox et al.
2005; J. Perry et al. 2012; J. L. Perry et al. 2015; J. C. Knox et al. 2012; J. C. Knox et al.
2013; J. C. Knox et al. 2014; R. L. Carrasquillo 2008; Ewert, Barta, and Mcquillan 2009).
The components of 4-bed molecular sieve assembly are a blower, an air save pump, bed
heaters, heat exchanger, valves, and sensors. The two desiccant-adsorbent beds operate on
a cycle with one adsorbing CO2 from the cabin air while the other desorbs previously
accumulated CO2 to space vacuum, before exposing the heated bed to space vacuum, the
ullage air is pumped out (James C Knox et al. 2005; Matty 2010). Figure 1.6 shows the
CDRA-4BMS schematically. The benefit of using the any kind of zeolites, here is zeolite
5A is that they can be easily regenerable and continuously re-used. The two beds for CO2
removal operate in such a way that one bed uses a fan to pass cabin air through the bed to
remove CO2 and water vapor, while the second bed is exposed to space vacuum to
regenerate the sorbent (Satyapal et al. 2001; J. C. Knox et al. 2012; J. C. Knox et al. 2013;
J. C. Knox et al. 2014; James C. Knox et al. 2015). Although the CDRA has been proven
to be very effective, there are some major drawbacks to this current system. The first one
is generation of dust that contaminates equipment on the space station. Having temperature
oscillation in TSA system generates dust because the clay binder and the crystal have
different thermal expansion and contraction that leads generation of cracking then
eventually dust (Do 1998). The next drawback is that the dust buildup inside the packed
beds results in increased pressure drop during the beds. The last one is requirement of a
large amount of energy to regenerate the material; because the clay binder is a poor thermal
16
conductor that limits the escape of heat generated from the heat of adsorption (Mattox and
Bardot 2011).
1.3.3.5 Carbon Dioxide Reduction
Currently, CO2 is heat and vacuum desorbed to space because there is no need to
process it further for short-duration missions, but it could be supplied to a CO2 reduction
assembly to recover O2 for longer duration missions (Council 1997; Wieland 1994; Ewert,
Barta, and Mcquillan 2009; James C Knox et al. 2005). Because the loss of mass in O2
will lead to increased storage or resupply requirements which will be expensive and weight
penalty for long duration missions (Wieland 1994). Therefore, this subsystem of AR
system as well as CO2 removal system has an essential role to have closed-loop flow
diagram for long duration missions. Currently, the ISS does not include CO2 reduction
assembly (Council 1997; Ewert, Barta, and Mcquillan 2009; R. L. Carrasquillo 2008).
There are several methods such as Sabatier reactor, Bosch reactor, electrochemical
separation of O2 from CO2 or biological methods to recover this O2 (Council 1997; Wieland
1994; Ewert, Barta, and Mcquillan 2009; R. L. Carrasquillo 2008). CO2 reacts with
hydrogen (H2) at high temperature in the presence of a catalyst to produce methane (CH4)
and water (H2O) in the exothermic Sabatier process for CO2 reduction (Ewert, Barta, and
Mcquillan 2009; Council 1997; Wieland 1994; James C Knox et al. 2005). O2 can be
produced for the cabin atmosphere by water electrolysis by using this produced H2O and
the by-product of water electrolysis, hydrogen (H2), can be recycled to the Sabatier. The
CH4 can theoretically be used for attitude control or can be vented overboard as a waste
product (Council, 1997; Knox et al., 2005). Another process is the exothermic Bosch
process. In this reactor CO2 again reacts with H2 at high temperature in the presence of a
17
catalyst to produce solid carbon (C) and water (H2O). This process, the catalyst bed should
be replaced periodically because of carbon accumulation (Council 1997; Wieland 1994).
And the other process is CO2 electrolysis and it has been still investigated. In that process,
CO2 converts to carbon and O2 directly. The last possible CO2 reduction technology is
biological methods; plants can also reduce CO2 through photosynthesis (Council 1997).
ISS is planning to use Sabatier reactor for CO2 reduction along those technologies because
it is more mature technology than others. There are two modes of operation (process and
standby) in the planning Sabatier assembly. In Process mode, inlet gas flows through the
system and methane and water were produced operated at sub-ambient to avoid
combustible gasses leaking out to the atmosphere. In Standby mode, the unit was evacuated
to below 1 psia by isolated supply gasses and stopped coolant air (James C Knox et al.
2005).
1.3.4 Water Recovery and Management
Potable (drinking) and washing water has been provided from the stored water
tanks, filled prior to launch, on all human space missions so far. To recover water from
wastewater and urine for long-term missions has an essential role to potentially reduce the
net mass of required water, thus weight because having limited storage space, having larger
crews or, it would be prohibitive to store or resupply all of the water required for longer
duration missions (Wieland 1994; Council 1997; NASA Facts 2004). A simplified water
recovery and management (WRM) system schematic is shown in Figure.1.7
Several methods including filtration, distillation, evaporation, absorption,
adsorption, catalytic oxidation, and biological methods are available to process humidity
condensate, urine, and hygiene and wash water for reuse as potable water or for other uses
18
on space habitats (Council 1997; Wieland 1994). Therefore, the water recovery system
(WRS) is designed to recycle crewmember urine, cabin humidity condensate, wastewater,
and Extra Vehicular Activity (EVA) wastes for reuse as clean water (Council 1997; NASA
Facts 2004). The distillation techniques are vapor compression distillation (VCD),
thermoelectric integrated membrane evaporation, vapor phase catalytic ammonia removal,
and simple air evaporation and the filtration methods are reverse osmosis, multifiltration,
and electrodialysis (Council 1997). The ISS Water Recovery System (WRS) includes urine
processor assembly (UPA) and water processor assembly (WPS) (R. L. Carrasquillo 2008;
NASA Facts 2004). The urine processor, a phase change process, recovers water from urine
through an ambient-temperature Vapor Compression Distillation (VCD) technology,
which is a low-pressure evaporation in a rotating distillation assembly that compensates
the absence of gravity and aids in the separation of liquids and gases in space(R. L.
Carrasquillo 2008; Council 1997; NASA Facts 2004; Wieland 1994). Distillate water from
the VCD is combined with all other wastewaters and delivered to the Water Processor for
treatment. The advantage of VCD is being a power-efficient process while having complex
mechanical design with limited water recovery as a disadvantage (R. L. Carrasquillo 2008).
The other subsystem of water recovery system is the water processor assembly which
produces potable water from urine distillate, cabin air humidity condensate, and other
hygiene and miscellaneous waste waters (R. L. Carrasquillo 2008; NASA Facts 2004). The
technology uses includes multi-filtration, adsorption, ion exchange, and heterogeneous
catalytic oxidation, and gas/liquid membrane separators (NASA Facts 2004; R. L.
Carrasquillo 2008; Wieland 1994). The Water Processor first removes free gas and solid
materials such as hair and lint, then operates a series of multi-filtration beds for further
19
purification and uses a high-temperature catalytic reactor assembly to remove any
remaining organic contaminants and microorganisms (NASA Facts 2004; Wieland 1994;
Council 1997). The main drawbacks are logistics penalties, required bed replacement,
higher power, and complexity of temperature catalytic reaction process (NASA Facts 2004;
R. L. Carrasquillo 2008).
Monitoring of the product water quality is needed to ensure that the water is with
acceptable quality and is done by the Process Control and Water Quality Monitor in the
ISS(NASA Facts 2004; Council 1997). The recovered water must meet purity standards
before it can be reused by crew members. To check the purity of product water electrical
conductivity sensors have been used because the conductivity of water is increased by the
presence of typical contaminants. If the water is acceptable, it is delivered to product water
storage, while unacceptable water is reprocessed through the system again (NASA Facts
2004; Council 1997; R. L. Carrasquillo 2008; NASA, n.d.; Wieland 1994).
1.3.5 Waste Management
Waste Management subsystem must deal with the sources of wastes in a space
habitat, which are metabolic wastes consisting of moist solids including feces and vomitus,
other solid wastes (paper and plastics), liquid wastes including urine and waste hygiene
water, and gaseous wastes (metabolic gaseous wastes (CH4, H2S, H2, CO, and CO2) and by
products from various chemical processes), which shown in Figure 1.8 with the products
of waste processing (Wieland 1994). The goal of the waste management system is to
develop waste management technologies to recover resources, and to increase crew safety
and performance while decreasing mission cost.

20
The Waste Management includes a toilet subsystem for collecting urine and feces and
an overall housekeeping system for collecting and storing other wastes; liquid, solid, and
concentrated wastes such as food waste, refuse, and biomass (Council 1997). Waste
Collection System consists of a commode, urinal, fan separators, odor and bacterial filter
(vacuum vent quick disconnect), and waste collection controls. The commode processes
the fecal wastes with bag liner, and the urinal is a flexible hose with attachable funnels for
storage in waste water tank. The ISS Segment utilizes a commode/urinal system (Daues
2006). In the ISS for short-duration missions recycling is less of an issue, so feces and
refuse are collected in a bag and compacted in a cylindrical canister for storage and disposal
for eventual by sending it back to Earth with a visiting Shuttle crew, or by placing it into a
Progress rocket (Council 1997; Daues 2006). For more advanced long-duration missions,
it is necessary to recover for reuse the mass, both liquid and solid, of the metabolic waste.
The Heat Melt Compactor, sterile, compact, plastic encapsulated disks, might be the
technology for waste stabilization and storage and volume reduction of waste as well as for
water recovery. In the heat melt compactor, to compress the waste pneumatic pistons can
be used and the waste is heated, plastic is melted as well as the water is vaporized with
electric heaters, the that vaporized water might be condensed and recovered (Ewert, Barta,
and Mcquillan 2009). Another technology for stabilizing the waste and providing
recovered methane fuel as well as water is pyrolysis technology, (Ewert, Barta, and
Mcquillan 2009).
1.3.6 Food Management
Food currently provided on space vehicles is produced and packaged on the ground.
Stored food must be preserved until needed and will either be dehydrated, refrigerated (for
21
short-term storage), or frozen (for long-term storage) (Wieland 1994). The technologies to
preserve the food include freeze-drying, canning, radiation-stabilization, thermo-
stabilization (heat processed, canned, and stored at room temperature), and other methods
(Council 1997). On the ISS, the electrical power is produced by solar arrays, which does
not produce water (Casaburri, Gardner, and George 1999). Food management in the ISS
provides frozen foods, refrigerated foods, rehydratable foods (soups, casseroles, appetizers,
breakfast foods), thermo-stabilized foods (meats, vegetables, fish, fruit), irradiated foods
(meats), natural-form foods (nuts, granola bars, cookies) because no addition water
required before consumption of the foods (Daues 2006; Casaburri, Gardner, and George
1999). All daily menu food is single-service, disposable containers to eliminate the need
for a dishwasher (Daues 2006). Food production in space through biological processes
might be needed for long-duration missions, but it raises new issues in food processing,
storage, and preparation and also requirement for the additional power, mass, and volume
(Council 1997).
1.3.7 Fire Detection and Suppression
Fire Detection and Suppression subsystem of ECLSS detects incipient fires
regardless of location or type (fire detection sensors), proves a system of alarms and
automatic software actions to alert the crew and automatically respond to a fire, suppresses
of fires while minimizing toxic effects on the crew (fire extinguishers, portable breathing
equipment), and cleans up after a fire (Wieland 1994; NASA Facts 2004). Methods to
detect the fire include flame detectors based on visible, infrared, and ultraviolet emissions,
smoke detectors based on detecting the particles emitted by burning materials, ionization
detectors, and photoelectric flame detectors; ISS is using the smoke detector is based on
22
photoelectric technology. Suppression methods are water, foam, CO2, and Halon in
general, but in space some of them are not useful such as water because of possibility of
being related to electrical failures, and foam because of cleanup problems. Halon and CO2
can be used as a suppressant; ISS is using portable CO2 fire suppression bottles. The reason
to choose CO2 suppressant is due to its effectiveness and ability to be easily removed by
the atmosphere revitalization system (Gatens and Ruff 2013; Wieland 1994; R. L.
Carrasquillo 2008; Daues 2006).
1.4 Pressure Swing Adsorption (PSA)
In the last decades, pressure swing adsorption (PSA) technology has been
developed with tremendous progress and it is one of the more efficient gas separation and
purification technologies because of its low energy requirement and low capital investment
costs (Yoshida et al. 2003). PSA technology is being widely used in industry for air-drying,
CO2 capture, hydrogen purification or recovery, air separation, and various other
separations such as methane recovery from landfill gas (Yoshida et al. 2003). There are
excellent reviews available in the literature (Diagne, Goto, and Hirose 1995; Tondeur, D.;
Wankat 1985; Kawai 1986; Ruthven, D. M.; Farooq 1994; Suzuki 1991; Yang 1987; Ebner
and Ritter 2009).
In this thesis, the CO2 removal and concentration from trace amount of CO2
containing stream during closed-loop human space exploration missions has been achieved
via pressure swing adsorption technology.
23
Table 1.1 ECLSS functions and sub-functions (Wieland 1994; Council 1997).
Function Details
Temperature and
Humidity Control
Temperature Control
Humidity Control
Ventilation
Equipment cooling
Atmosphere Control
and Supply
Monitoring Major Constituents
Atmosphere Composition Control
Atmosphere Constituents Storage
Partial and Total Pressure Control
Atmosphere
Revitalization
CO2 Removal
CO2 Reduction
O2 Replacement
N2 Replacement
Trace Contaminant and Particulate Monitoring and Removal
Water Recovery
and Management
Humidity condensate, urine, hygiene and wash wastewater
processing
Water storage and distribution
Water Recovery
Water Quality Monitoring
Waste Management Fecal Collection
Urine Collection and Pretreatment
Waste processing
Food Management Food production, processing, storage
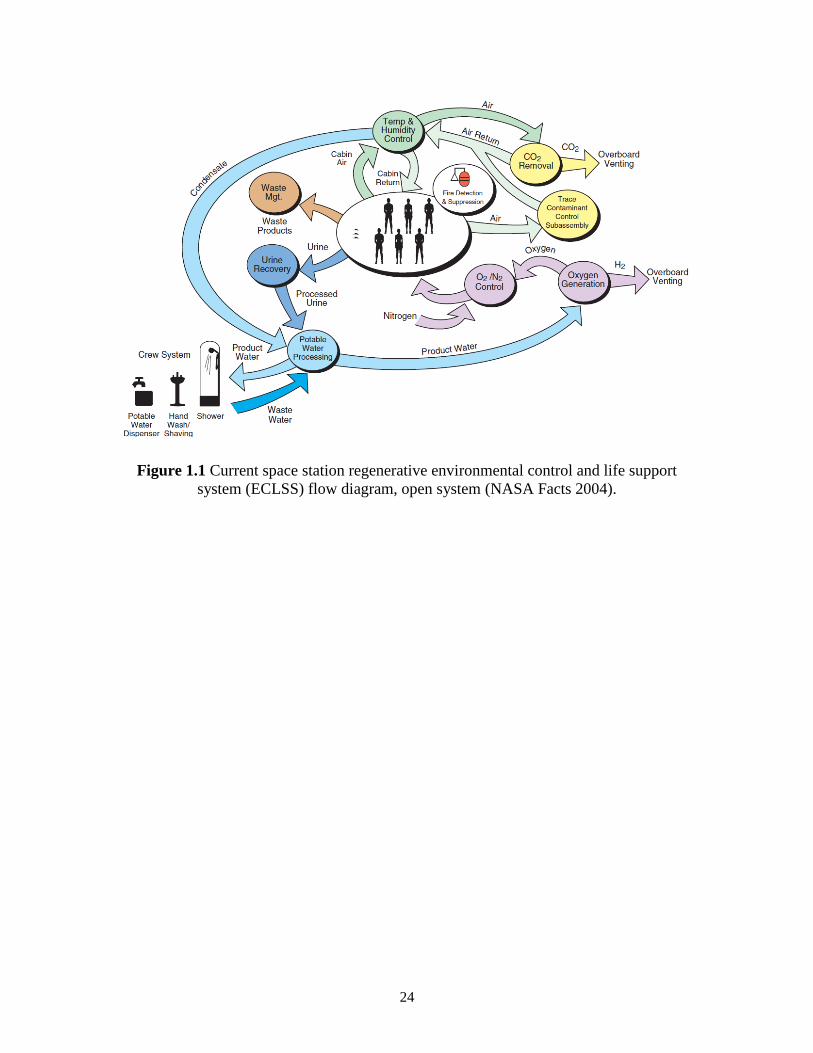
24
Figure 1.1 Current space station regenerative environmental control and life support
system (ECLSS) flow diagram, open system (NASA Facts 2004).
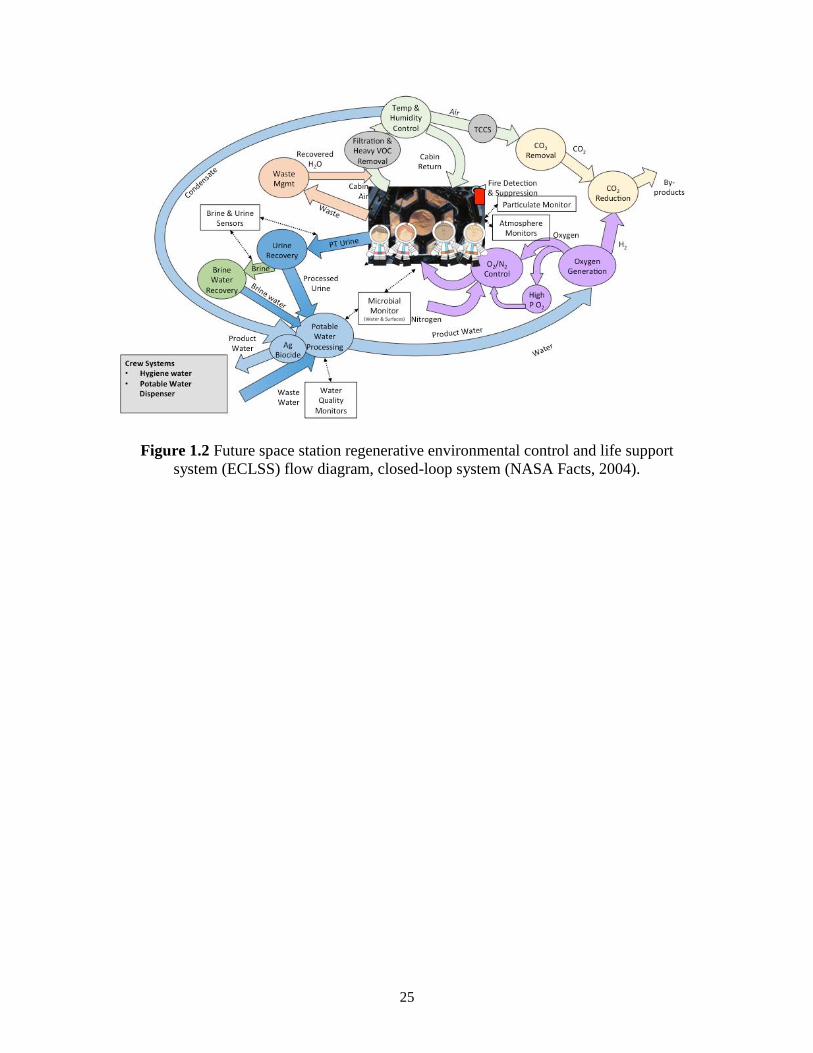
25
Figure 1.2 Future space station regenerative environmental control and life support
system (ECLSS) flow diagram, closed-loop system (NASA Facts, 2004).
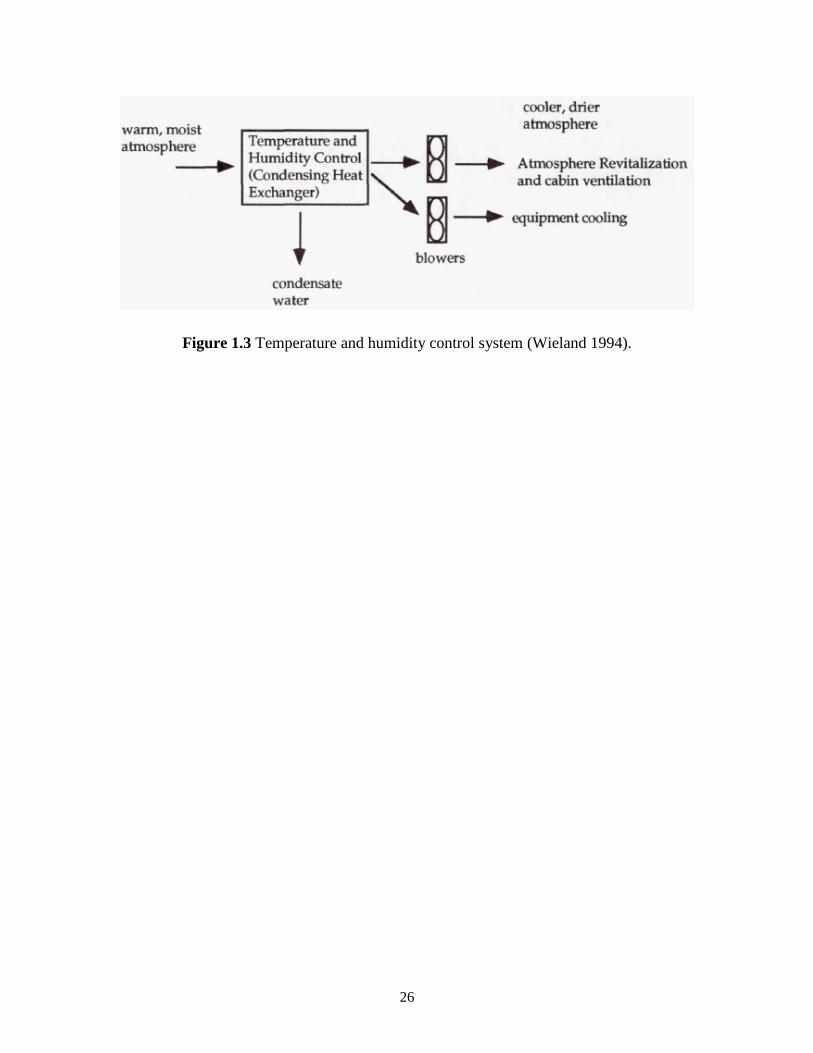
26
Figure 1.3 Temperature and humidity control system (Wieland 1994).
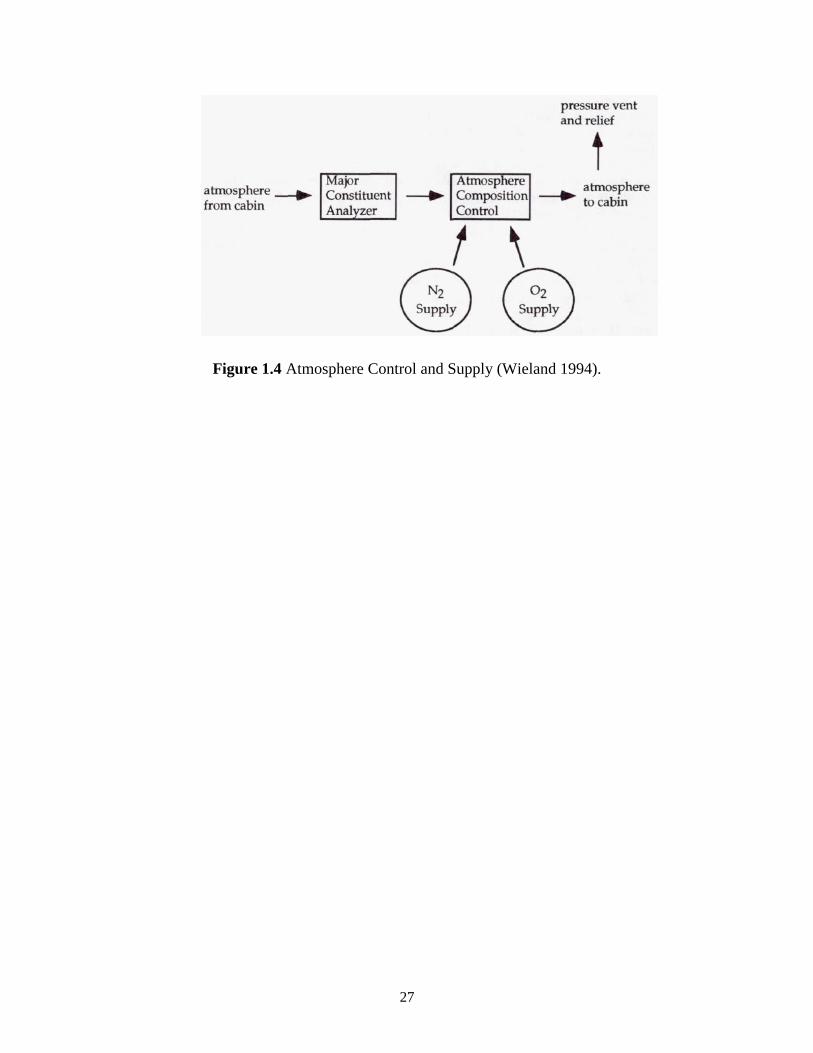
27
Figure 1.4 Atmosphere Control and Supply (Wieland 1994).
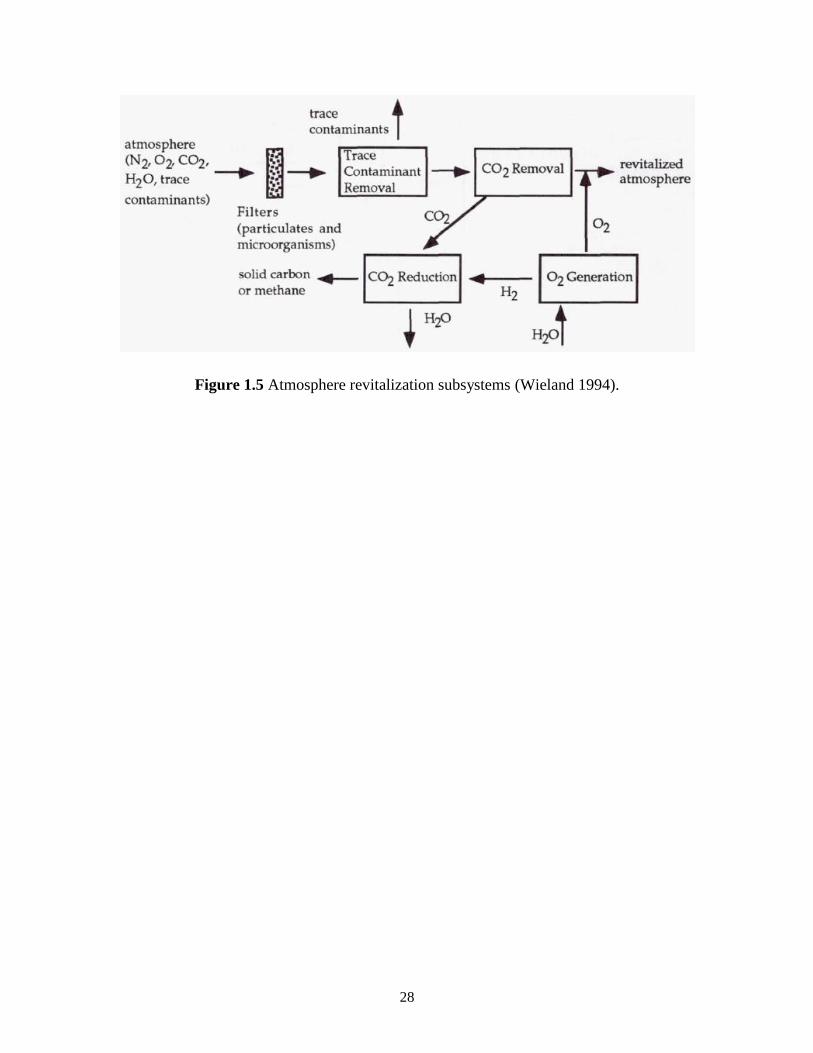
28
Figure 1.5 Atmosphere revitalization subsystems (Wieland 1994).
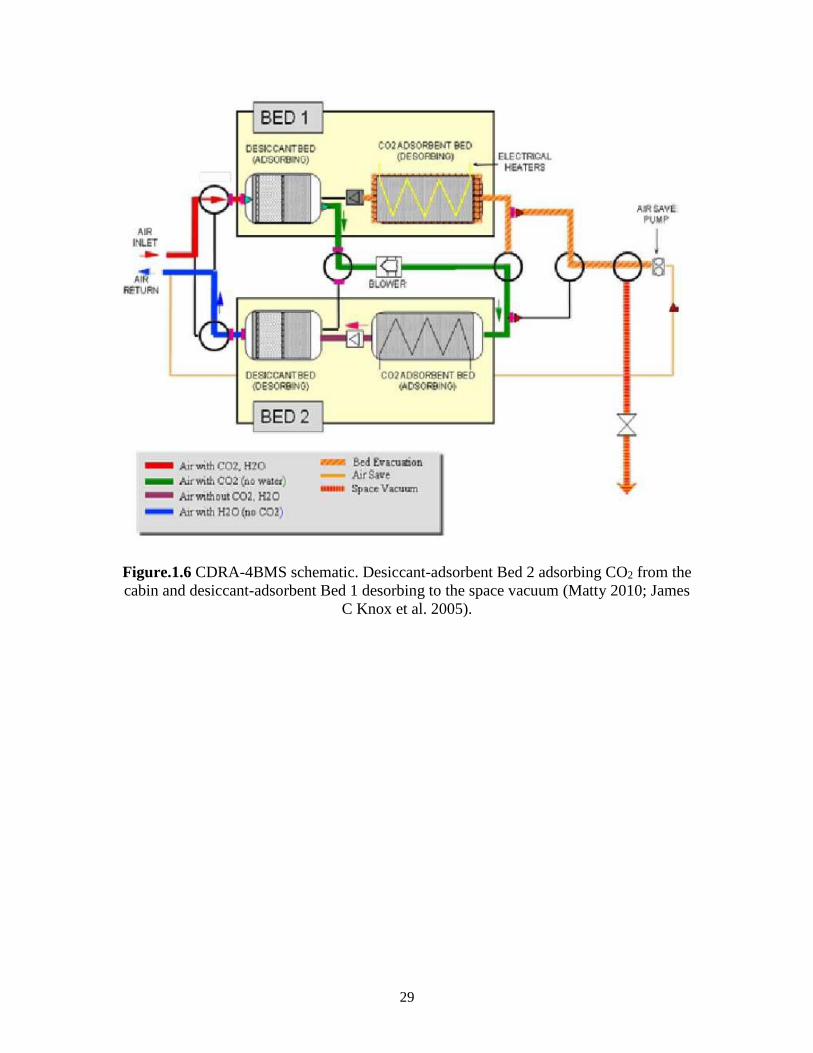
29
Figure.1.6 CDRA-4BMS schematic. Desiccant-adsorbent Bed 2 adsorbing CO2 from the
cabin and desiccant-adsorbent Bed 1 desorbing to the space vacuum (Matty 2010; James
C Knox et al. 2005).
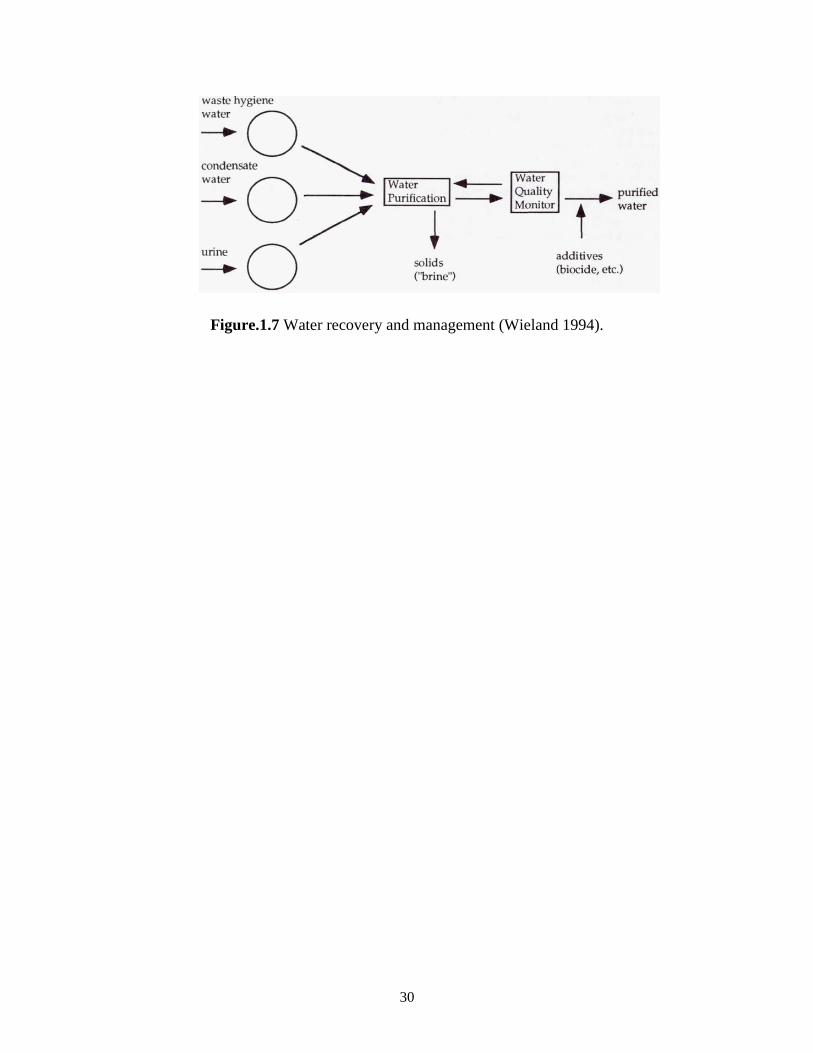
30
Figure.1.7 Water recovery and management (Wieland 1994).
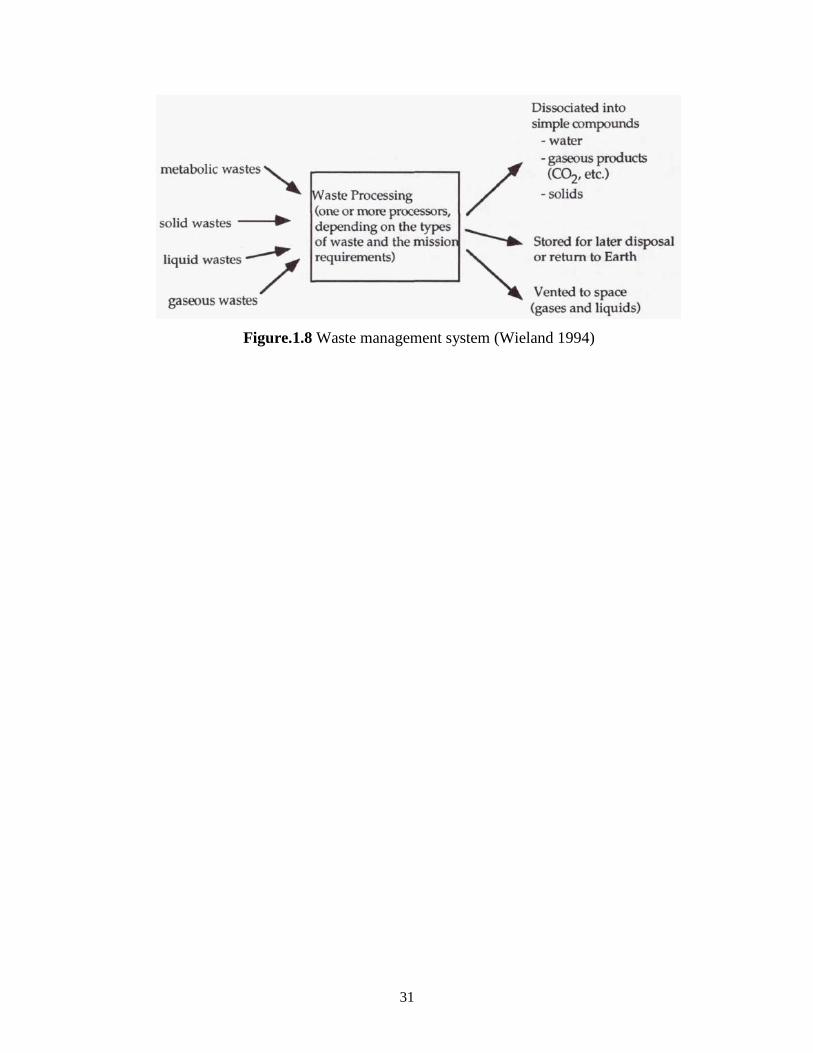
31
Figure.1.8 Waste management system (Wieland 1994)
32
CHAPTER 2
MODEL DESCRIPTION
2.1 Model Description
Simulations of all PSA cycles were carried out using a FORTRAN based in house
dynamic adsorption process simulator (DAPS) that uses DASPK as a solver platform,
which is built for solving complex partial differential equations via method of lines and a
time adaptive integration technique (Brown, Hindmarsh, and Linda 1994). The nature
dynamic PSA simulation models can be described by mass and energy balances, mass and
energy transfer equations, and equilibrium isotherm. Table 2.1 shows the main equations
included in the present model: component mass balances, an overall mass balance, a pellet
mass balance through a linear driving force (LDF) mechanism, an energy balance, a
momentum balance represented by Ergun’s equation and an equilibrium isotherm model
represented by Three Process Langmuir model. For the current study, following
simplifying assumptions are imposed: 1) gas phase concentration is represented by ideal
gas law; 2) negligible gradients of velocity, pressure, temperature and concentrations in the
radial directions; 3) negligible second order mechanisms such as bed mass dispersion or
thermal conduction; 4) negligible heat transfer limitation between different phases within
the bed, i.e., pellet, gas and bed walls; 5) the gas phase concentration in both bulk and pellet
porosity is identical; 6) constant cross section area and wall properties and exterior

33
temperature along the bed; 7) the mass transfer between solid and gas defines by the linear
driving force (LDF) approach.
The equations given in Table 2.1 constitute a complete mathematical model for
multi-component pressure swing adsorption process once the initial and boundary
conditions for particular steps are specified. For a system containing N components, there
are a total of 2N+3 variables and equations that have to be solved at each node. The initial
conditions of a step in a cycle are taken as those that occurred at the end of the previous
step. Table 2.2 shows all the initial and boundary conditions for the PSA cycles, those
conditions are applied at the first (z/L = 0) and last (z/L = 1) nodes of the bed. Component
mass balances, overall mass balances and energy balances are applied in those nodes
whenever the gas stream leaves the bed, otherwise, gas concentrations, temperatures and
gas velocities (or flows) are defined based on the corresponding values of the feed stream.
In addition, pressures along the bed are evaluated relative to the pressure of the gas where
the gas stream leaves the bed. At this location, the pressure in the bed is evaluated relative
to a defined pressure outside the bed through a valve equation. When concentrations,
flows, temperatures and valve equations are not specified or required, consistency at the
boundary is maintained by utilizing the corresponding balances identified in the equations
(C.M.B., O.M.B., LDF, E.B., M.B.) in Table 2.1. The pressure at the other end of the bed
is simply evaluated via a momentum balance equation (i.e., Ergun’s equation).
The component and overall mass, energy, momentum balance and LDF equations
with equilibrium isotherm constitute a complete mathematical model for multi-component
PSA process once the initial and boundary conditions for particular steps are specified.

34
2.2 Adsorption Isotherm Measurements
Pure component adsorption equilibrium isotherms for nitrogen (N2), oxygen (O2),
and carbon dioxide (CO2) on zeolite 13X were measured at three different temperatures
(25, 50 and 75oC) by using a volumetric system from micromeritics (ASAP 2010 , shown
in Figure 2.1, located at the University of South Carolina) by Mohammadi et al., 2016.
Volumetric method involves measuring the pressure change in a known volume of sample
gas exposed to an adsorbent sample. As the gas is adsorbed and allowed to come to
equilibrium with the adsorbent, the measured decrease of pressure in the closed system
indicates the amount of gas adsorbed under the given isothermal conditions. Prior to each
isotherm measurement, the zeolite 13X was regenerated at 350 oC for under a vacuum of
less than 1.33*10-5 kPa and sample temperature was gradually increased up to the
regeneration temperature in order to prevent structural damage caused by desorbing water
steam. Free space or available volume was measured by ASAP2010 using non-adsorbing
He gas then helium was evacuated from the system by applying vacuum for 1 hour. All
three gases have purities higher than 99.99%. A water bath connected to a chiller was used
to keep the sample at a desired temperature throughout the experiment for a particular
temperature. Data were collected for the equilibrium pressure range of 0.001 to 110 kPa
with the help of the molecular drag pump to reach the lowest pressure (e.g. 1.3*10-6)
(Mohammadi et al. 2016).
Three Process Langmuir (TPL) model has been used to correlate the experimental
adsorption equilibrium data with simultaneously regressing all of the experimental single-
gas data by minimizing ∑ (𝑛𝑖,𝑚𝑜𝑑𝑒𝑙 − 𝑛𝑖,𝑒𝑥𝑝𝑒𝑟𝑖𝑚𝑒𝑛𝑡𝑎𝑙)2𝑛
𝑖=1 using Solver in MS Excel. The
TPL model describes the adsorption of a gas on a heterogeneous adsorbent composed of
35
three energetically different but homogeneous sites with the assumption that the free
energy of adsorbate-adsorbent on each site is constant. The TPL isotherm parameters for
pure gas were obtained by fitting the experimental data by using Equation 2.1 and the fitted
equilibrium parameters are summarized in Table 2.3. The resulting equilibrium adsorption
isotherms for CO2, N2 and O2 both experimental and TPL model fits are shown in Figure
2.2 for three different temperatures. The Triple Process Langmuir (TPL), pure gas
isotherm:
𝑞𝑖 = ∑ (𝑞𝑠
𝑗,𝑖𝑏𝑗,𝑖𝑃𝑦𝑖
(1+𝑏𝑗,𝑖𝑃𝑦𝑖))
𝑗
3𝑗=1 𝑤𝑖𝑡ℎ 𝑏𝑗,𝑖 = 𝑏0
𝑗,𝑖𝑒𝑥𝑝 (𝐵𝑗.𝑖
𝑇) (2.1)
where 𝑞𝑗,𝑖𝑠 is the saturation capacity for component i on site j and 𝑏𝑗,𝑖 affinity parameter for
component i on site j, and P is the absolute pressure. 𝐵𝑗,𝑖 and 𝑏0𝑗,𝑖 are the adsorption energy
of the component i on site j and the pre-exponential factor for component i on site j,
respectively. While obtaining TPL isotherm parameters for all three pure gas by using
Equation 2.1, there are nine parameters to be fitted for CO2, while there are three
parameters for N2 and three parameters for O2. The reason to have just three parameters for
N2 and for O2 is based on an assumption, which indicates that they have the same affinity
(𝑏𝑗,𝑖) for all three sites since adsorption isotherms of N2 and O2 are linear in the range of
working pressure in this thesis.
After having the fitting parameters for pure gases, the Triple Process Langmuir
(TPL) mixed gas isotherm equation (Equation 2.2) has been used in the DAPS because in
the real PSA process all three gases are available together. Therefore, Equation 2.2 has
been used in the simulation for mixed gas isotherms with the parameters coming from pure
gas isotherm fittings.
36
T
Bbbwith
Pyb
qPybq
ijijij
jm
k
kkj
ijs
iij
i
,,
0
,
3
1
,
,,* exp
1
(2.2)
Toth model has been used in order to calculate heat of adsorption (ΔHi) for each
gas. The Toth model is an empirical expression and was developed to yield an improved
fit versus traditional Langmuir isotherm modelling. It is used to describe a monolayer
adsorption with assuming adsorption on energetically heterogeneous surfaces with most
sites having adsorption energy lower than the maximum. The Toth isotherm model
approaches the Henry region at infinite dilution. Experimental isotherms for each pure gas
were fitted by using Equation 2.3 to calculate heat of adsorption ∆𝐻𝑖.
𝑞𝑖 =𝑞𝑖
𝑠𝑏𝑖𝑃
(1+(𝑏𝑖𝑃)𝑡)1
𝑡⁄ 𝑤𝑖𝑡ℎ 𝑏𝑖 = 𝑏𝑜
𝑖𝑒𝑥 𝑝 (∆𝐻𝑖
𝑇) 𝑎𝑛𝑑 𝑞𝑖
𝑠 = 𝑞0𝑠 + 𝑞i
𝑠𝑇 (2.3)
where 𝑞𝑖𝑠 and 𝑏𝑖 are the saturation capacity and affinity parameters for component i,
respectively. P is the absolute pressure. t is the parameter that indicates the heterogeneity
of the adsorbent. ∆𝐻𝑖 and 𝑏𝑜𝑖 are the adsorption energy of component i and the pre-
exponential factor of component i, respectively. The obtained heat of adsorption values of
each gas are shown in Table 2.3.
2.3 Mass Transfer Model
The mass transfer between solid and gas phases is defined by the modified linear
driving force (LDF) approach for macropore limited diffusion because 3mm 13X beds have
been used in the 4-Bed Pressure Swing Adsorption Apparatus, which is going to be used
to run experiments in the next chapters. The macropore mass transfer coefficients for CO2,
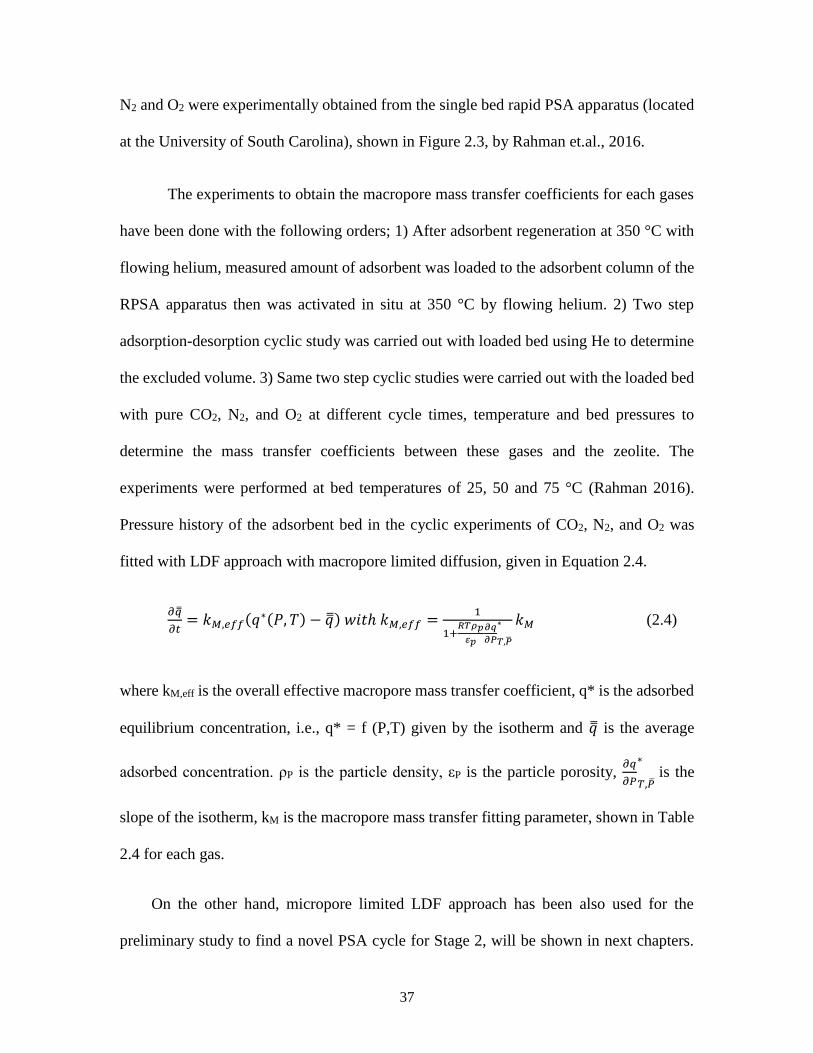
37
N2 and O2 were experimentally obtained from the single bed rapid PSA apparatus (located
at the University of South Carolina), shown in Figure 2.3, by Rahman et.al., 2016.
The experiments to obtain the macropore mass transfer coefficients for each gases
have been done with the following orders; 1) After adsorbent regeneration at 350 °C with
flowing helium, measured amount of adsorbent was loaded to the adsorbent column of the
RPSA apparatus then was activated in situ at 350 °C by flowing helium. 2) Two step
adsorption-desorption cyclic study was carried out with loaded bed using He to determine
the excluded volume. 3) Same two step cyclic studies were carried out with the loaded bed
with pure CO2, N2, and O2 at different cycle times, temperature and bed pressures to
determine the mass transfer coefficients between these gases and the zeolite. The
experiments were performed at bed temperatures of 25, 50 and 75 °C (Rahman 2016).
Pressure history of the adsorbent bed in the cyclic experiments of CO2, N2, and O2 was
fitted with LDF approach with macropore limited diffusion, given in Equation 2.4.
𝜕�̿�
𝜕𝑡= 𝑘𝑀,𝑒𝑓𝑓(𝑞∗(𝑃, 𝑇) − �̿�) 𝑤𝑖𝑡ℎ 𝑘𝑀,𝑒𝑓𝑓 =
1
1+𝑅𝑇𝜌𝑝
𝜀𝑝
𝜕𝑞
𝜕𝑃𝑇,�̅�
∗ 𝑘𝑀 (2.4)
where kM,eff is the overall effective macropore mass transfer coefficient, q* is the adsorbed
equilibrium concentration, i.e., q* = f (P,T) given by the isotherm and �̿� is the average
adsorbed concentration. ρP is the particle density, εP is the particle porosity, 𝜕𝑞
𝜕𝑃𝑇,�̅�
∗ is the
slope of the isotherm, kM is the macropore mass transfer fitting parameter, shown in Table
2.4 for each gas.
On the other hand, micropore limited LDF approach has been also used for the
preliminary study to find a novel PSA cycle for Stage 2, will be shown in next chapters.
38
Micropore limited LDF approach equation is given in Equation 2.5 with the micropore
mass transfer parameters shown in Table 2.4 .
𝜕�̿�
𝜕𝑡= 𝑘𝑚(𝑞∗(�̅�, 𝑇) − �̿�) (2.5)
where km is micropore mass transfer coefficient, q* is the adsorbed equilibrium
concentration, and �̿� is the average adsorbed concentration.
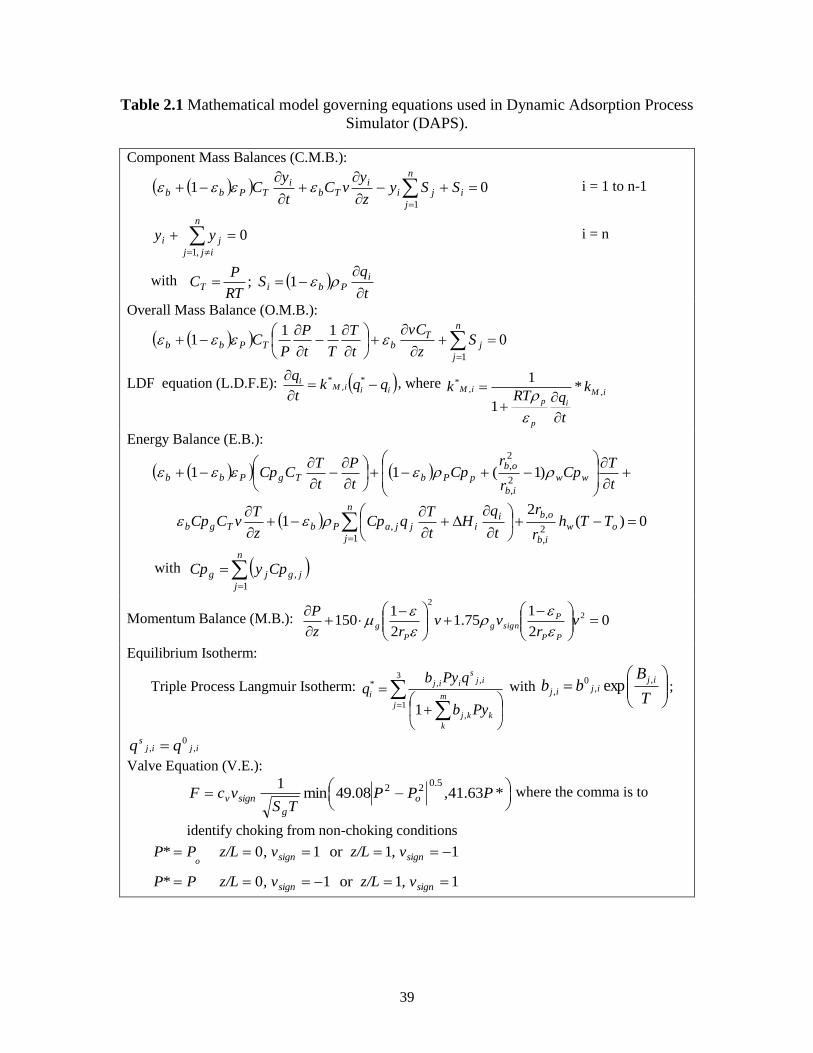
39
Table 2.1 Mathematical model governing equations used in Dynamic Adsorption Process
Simulator (DAPS).
Component Mass Balances (C.M.B.):
011
i
n
j
jii
Tbi
TPbb SSyz
yvC
t
yC i = 1 to n-1
0,1
n
ijj
ji yy i = n
with
Overall Mass Balance (O.M.B.):
011
11
n
j
jT
bTPbb Sz
vC
t
T
Tt
P
PC
LDF equation (L.D.F.E): iiiMi qqk
t
q
*,
* , where iM
i
p
p
iM k
t
qRTk ,,
* *
1
1
Energy Balance (E.B.):
t
TCp
r
rCp
t
P
t
TCCp ww
ib
ob
pPbTgPbb )1(112,
2,
0)(2
12,
,
1
,
ow
ib
obn
j
iijjaPbTgb TTh
r
r
t
qH
t
TqCp
z
TvCCp
with
n
j
jgjg CpyCp1
,
Momentum Balance (M.B.): 02
175.1
2
1150 2
2
v
rvv
rz
P
PP
Psigng
P
g
Equilibrium Isotherm:
Triple Process Langmuir Isotherm:
3
1
,
,,*
1jm
k
kkj
ijs
iij
i
Pyb
qPybq with
T
Bbb
ijijij
,,
0
, exp ;
ijijs qq ,
0,
Valve Equation (V.E.):
*63.41,08.49min1 5.0
22 PPPTS
vcF o
g
signv where the comma is to
identify choking from non-choking conditions
11or 10 *
11or 10 *
signsign
signsign
, vz/L, vz/LPP
, vz/L, vz/LPPo
t
qS
RT
PC i
PbiT
1 ;
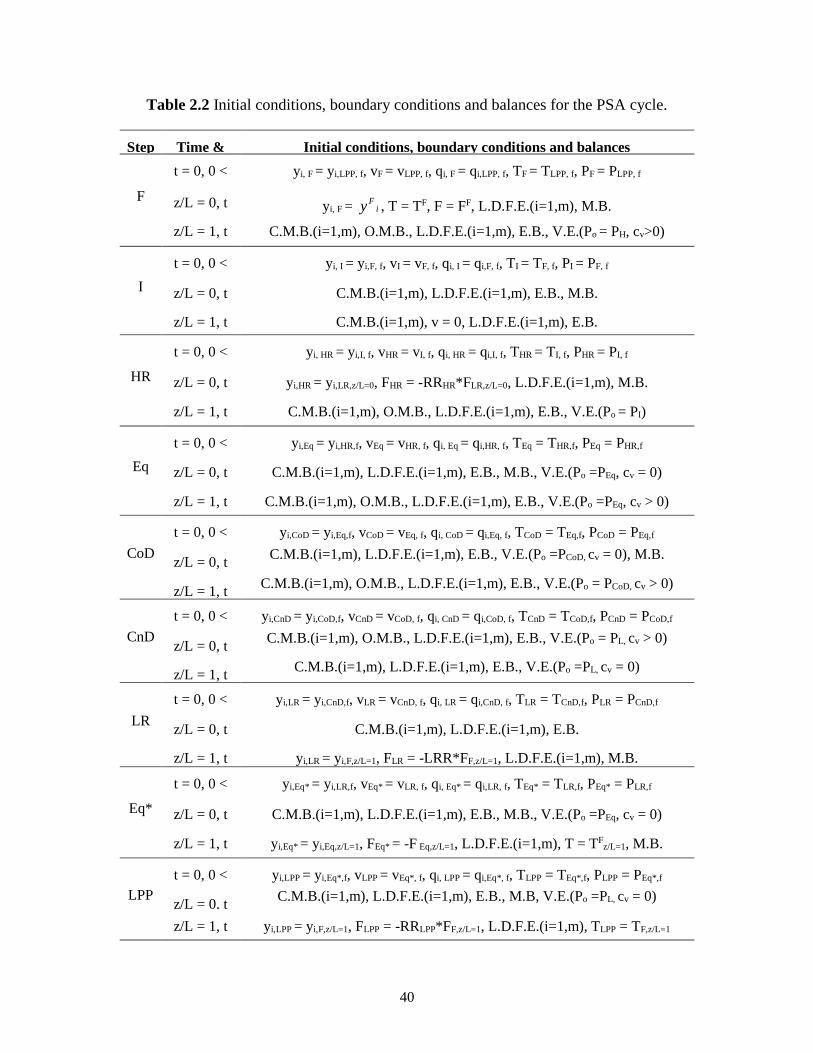
40
Table 2.2 Initial conditions, boundary conditions and balances for the PSA cycle.
Step Time &
bed
location
Initial conditions, boundary conditions and balances
F
t = 0, 0 <
z/L < 1
yi, F = yi,LPP, f, vF = vLPP, f, qi, F = qi,LPP, f, TF = TLPP, f, PF = PLPP, f
z/L = 0, t
≥ 0
yi, F = iFy , T = TF, F = FF, L.D.F.E.(i=1,m), M.B.
z/L = 1, t
≥ 0
C.M.B.(i=1,m), O.M.B., L.D.F.E.(i=1,m), E.B., V.E.(Po = PH, cv>0)
I
t = 0, 0 <
z/L < 1
yi, I = yi,F, f, vI = vF, f, qi, I = qi,F, f, TI = TF, f, PI = PF, f
z/L = 0, t
≥ 0
C.M.B.(i=1,m), L.D.F.E.(i=1,m), E.B., M.B.
z/L = 1, t
≥ 0
C.M.B.(i=1,m), v = 0, L.D.F.E.(i=1,m), E.B.
HR
t = 0, 0 <
z/L < 1
yi, HR = yi,I, f, vHR = vI, f, qi, HR = qi,I, f, THR = TI, f, PHR = PI, f
z/L = 0, t
≥ 0
yi,HR = yi,LR,z/L=0, FHR = -RRHR*FLR,z/L=0, L.D.F.E.(i=1,m), M.B.
z/L = 1, t
≥ 0
C.M.B.(i=1,m), O.M.B., L.D.F.E.(i=1,m), E.B., V.E.(Po = PI)
Eq
t = 0, 0 <
z/L < 1
yi,Eq = yi,HR,f, vEq = vHR, f, qi, Eq = qi,HR, f, TEq = THR,f, PEq = PHR,f
z/L = 0, t
≥ 0
C.M.B.(i=1,m), L.D.F.E.(i=1,m), E.B., M.B., V.E.(Po =PEq, cv = 0)
z/L = 1, t
≥ 0
C.M.B.(i=1,m), O.M.B., L.D.F.E.(i=1,m), E.B., V.E.(Po =PEq, cv > 0)
CoD
t = 0, 0 <
z/L < 1
yi,CoD = yi,Eq,f, vCoD = vEq, f, qi, CoD = qi,Eq, f, TCoD = TEq,f, PCoD = PEq,f
z/L = 0, t
≥ 0
C.M.B.(i=1,m), L.D.F.E.(i=1,m), E.B., V.E.(Po =PCoD, cv = 0), M.B.
z/L = 1, t
≥ 0
C.M.B.(i=1,m), O.M.B., L.D.F.E.(i=1,m), E.B., V.E.(Po = PCoD, cv > 0)
CnD
t = 0, 0 <
z/L < 1
yi,CnD = yi,CoD,f, vCnD = vCoD, f, qi, CnD = qi,CoD, f, TCnD = TCoD,f, PCnD = PCoD,f
z/L = 0, t
≥ 0
C.M.B.(i=1,m), O.M.B., L.D.F.E.(i=1,m), E.B., V.E.(Po = PL, cv > 0)
z/L = 1, t
≥ 0
C.M.B.(i=1,m), L.D.F.E.(i=1,m), E.B., V.E.(Po =PL, cv = 0)
LR
t = 0, 0 <
z/L < 1
yi,LR = yi,CnD,f, vLR = vCnD, f, qi, LR = qi,CnD, f, TLR = TCnD,f, PLR = PCnD,f
z/L = 0, t
≥ 0
C.M.B.(i=1,m), L.D.F.E.(i=1,m), E.B.
z/L = 1, t
≥ 0
yi,LR = yi,F,z/L=1, FLR = -LRR*FF,z/L=1, L.D.F.E.(i=1,m), M.B.
Eq*
t = 0, 0 <
z/L < 1
yi,Eq* = yi,LR,f, vEq* = vLR, f, qi, Eq* = qi,LR, f, TEq* = TLR,f, PEq* = PLR,f
z/L = 0, t
≥ 0
C.M.B.(i=1,m), L.D.F.E.(i=1,m), E.B., M.B., V.E.(Po =PEq, cv = 0)
z/L = 1, t
≥ 0
yi,Eq* = yi,Eq,z/L=1, FEq* = -F Eq,z/L=1, L.D.F.E.(i=1,m), T = TFz/L=1, M.B.
LPP
t = 0, 0 <
z/L < 1
yi,LPP = yi,Eq*,f, vLPP = vEq*, f, qi, LPP = qi,Eq*, f, TLPP = TEq*,f, PLPP = PEq*,f
z/L = 0, t
≥ 0
C.M.B.(i=1,m), L.D.F.E.(i=1,m), E.B., M.B, V.E.(Po =PL, cv = 0)
z/L = 1, t
≥ 0
yi,LPP = yi,F,z/L=1, FLPP = -RRLPP*FF,z/L=1, L.D.F.E.(i=1,m), TLPP = TF,z/L=1
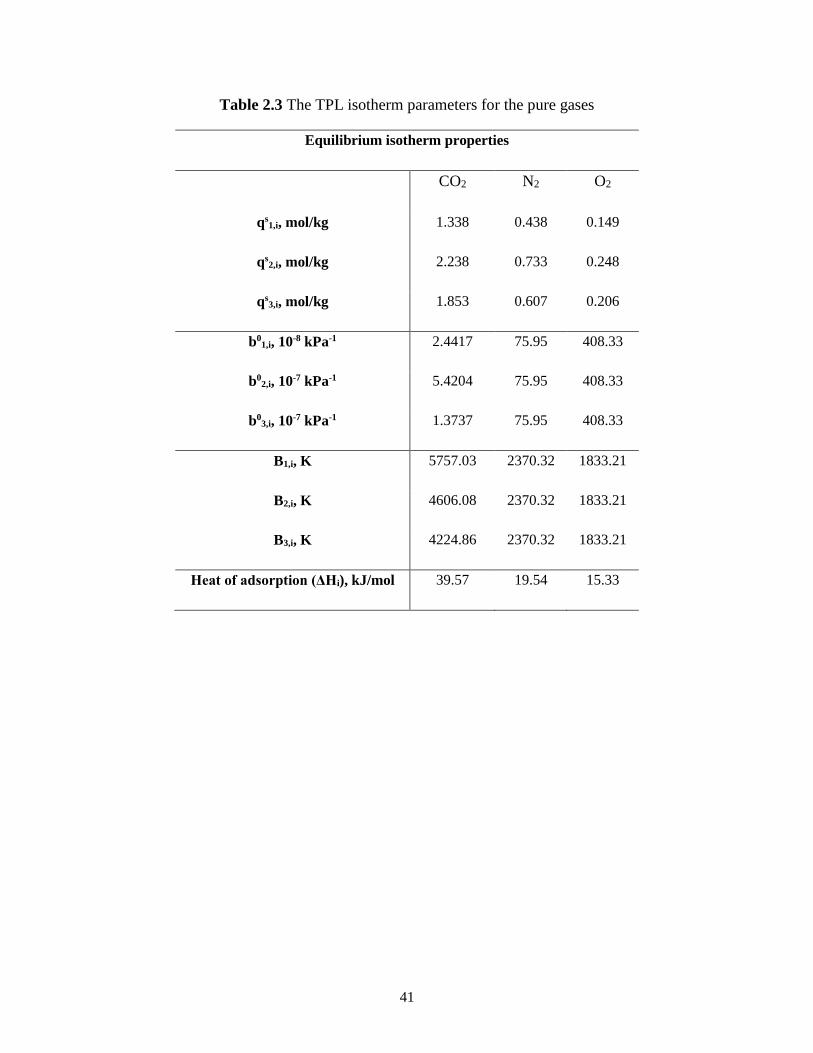
41
Table 2.3 The TPL isotherm parameters for the pure gases
Equilibrium isotherm properties
CO2 N2 O2
qs1,i, mol/kg 1.338 0.438 0.149
qs2,i, mol/kg 2.238 0.733 0.248
qs3,i, mol/kg 1.853 0.607 0.206
b01,i, 10-8 kPa-1 2.4417 75.95 408.33
b02,i, 10-7 kPa-1 5.4204 75.95 408.33
b03,i, 10-7 kPa-1 1.3737 75.95 408.33
B1,i, K 5757.03 2370.32 1833.21
B2,i, K 4606.08 2370.32 1833.21
B3,i, K 4224.86 2370.32 1833.21
Heat of adsorption (ΔHi), kJ/mol 39.57 19.54 15.33

42
Table 2.4 Kinetic properties, used in LDF approach both for macropore and micropore
limited diffusion.
Kinetic Properties
CO2 N2 O2
Macropore mass transfer coefficient, kM,i, s-1 47 70 70
Micropore mass transfer coefficients, km,i, s-1 1.0 1.0 -
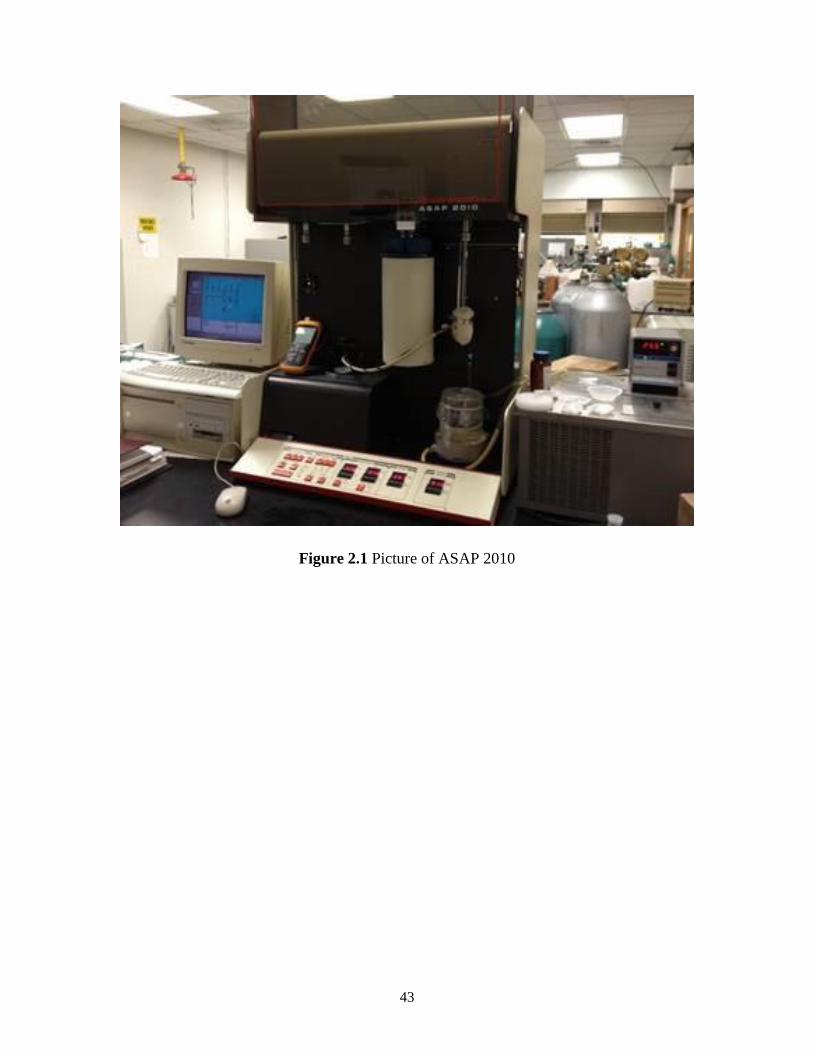
43
Figure 2.1 Picture of ASAP 2010
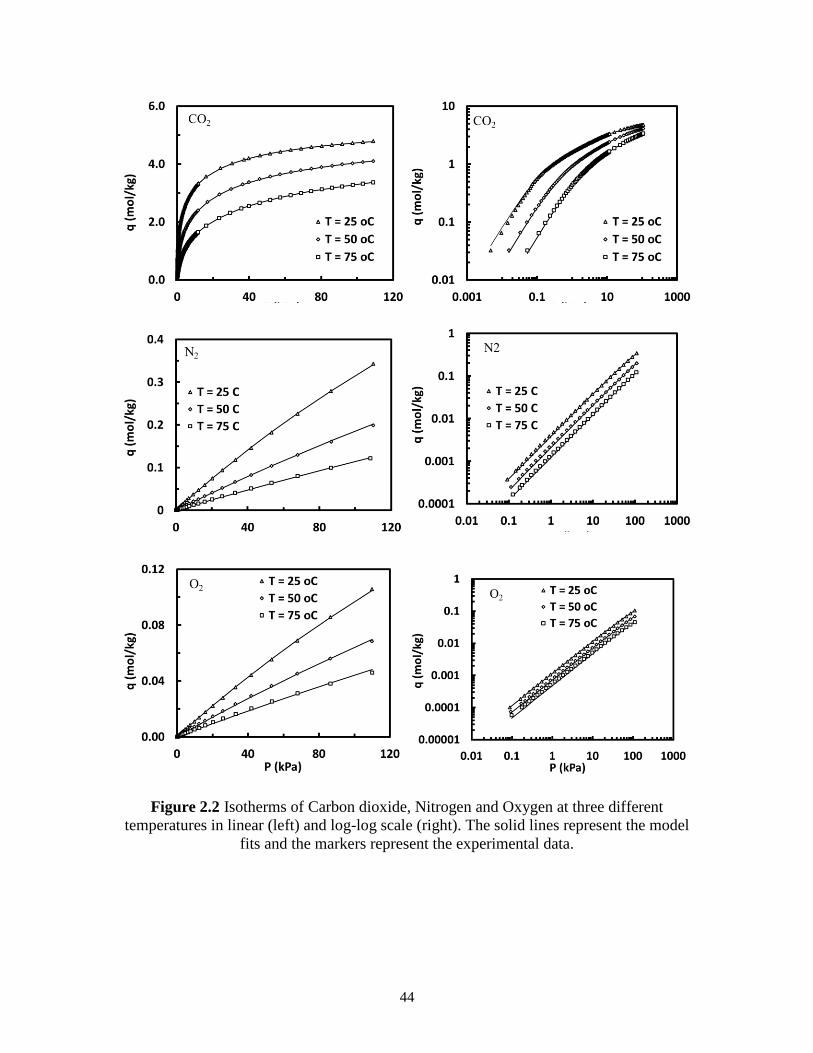
44
Figure 2.2 Isotherms of Carbon dioxide, Nitrogen and Oxygen at three different
temperatures in linear (left) and log-log scale (right). The solid lines represent the model
fits and the markers represent the experimental data.
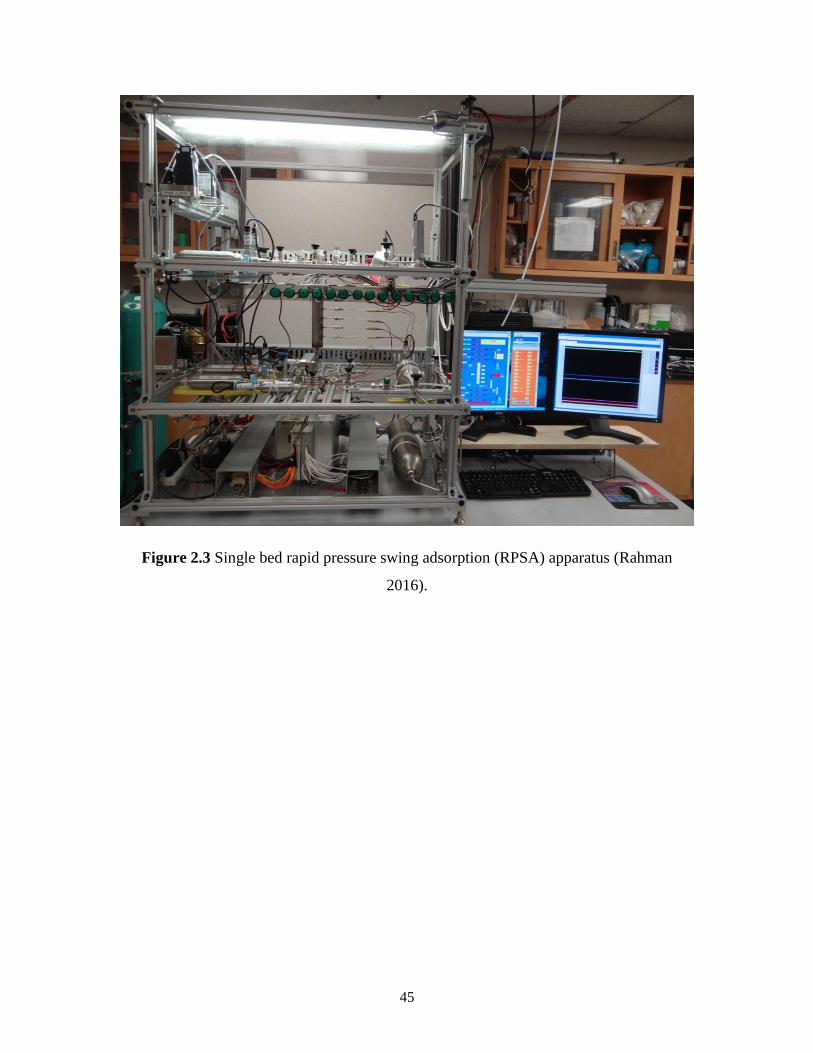
45
Figure 2.3 Single bed rapid pressure swing adsorption (RPSA) apparatus (Rahman
2016).
46
CHAPTER 3
A PARAMETRIC STUDY ON PRESSURE SWING ADSORPTION
PROCESS TO ENRICH TRACE AMOUNT OF CO2 FROM AIR BY
USING 13X ZEOLITE
3.1 Summary
Simulations of a 3-bed 9-step pressure swing adsorption (PSA) cycles were carried
out to study the enrichment and recovery trace amount of CO2 from a CO2-air mixture
using 13X zeolite using dynamic adsorption process simulator DAPS. The PSA sequence
includes feed (F), idle (I), heavy reflux (HR), co-current equalization depressurization (Eq),
co-current depressurization (CoD), counter-current depressurization (CnD), light reflux
(LR), counter-current equalization pressurization (Eq*) and Light Product Pressurization
(LPP) steps. These 3-bed DAPS simulations were carried out at high feed flow rate with
0.4% CO2 concentration in air. Extensive parametric studies were investigated using an in-
house built dynamic adsorption process simulator (DAPS) in order to determine how
process performances are affected by process parameters such as HR/LR step time (thus
cycle time), light reflux ratio, co-current and counter-current depressurization pressures,
and light reflux pressure. Simulation results show that more than 96% CO2 purity with
more than 87% CO2 recovery have been achieved with this new PSA cycle as a preliminary
study. The best run resulted in this PSA process performance of 96.26% CO2 purity, 87.76
47
% CO2 recovery, 0.017% N2 loss in the heavy product with the conditions of 4500s cycle
time, PCnD = 1kPa, LRR = 0.1, PLR = 3kPa, PCoD = 5kPa and 570slpm feed flow rate.
3.2 PSA Cycle Description
A typical PSA process involves a cyclic process where a number of interconnected
vessels containing adsorbent/adsorbents undergo successive pressurization and
depressurization steps in order to produce a continuous stream of purified product. The
steps of the PSA cycle include feed (F), idle (I), heavy reflux (HR), equalization down (E),
co-current depressurization (CoD), counter-current depressurization (CnD), light reflux
(LR), equalization up (E*) and light product pressurization (LPP). The operation of 3-bed
9-step PSA cycle is described in Figure 3.1 along with the cycle sequence. Each row in the
cycle sequence represents all the different cycle steps a given bed undergoes over the entire
cycle, whereas each column represents which cycle step is being run by which bed at a
particular ts. The sequence of operation is developed by following a simple methodology
called graphical approach (Mehrotra et al., 2011). The unit block shown in the Figure 3.1
by a shaded area consists of four (ts,1, ts,2, ts,3 and ts,4) unit step times where all steps are
being run by one of the three beds and the total cycle time is composed of multiple
consecutive unit blocks where the operations are repeated again and again. Therefore, the
cycle shown in Figure 3.1 with the unit block is used to perform the parametric study.
The operation of first unit block, bed 1 is fed from bottom at atmospheric pressure
for a period equivalent to the sum of all unit step times (ts,1, ts,2, ts,3 and ts,4). The reason of
covering all the unit step times by feed (F) step during the operation of bed 1 is to maintain
a continuous feed flow throughout the cycle. During this operation, the preferentially
48
adsorbed species (CO2) is captured by the adsorbent in the bed and a product stream is
collected from the top of bed 1.
Next, bed 2 undergoes an idle (I) step for a period of ts,1 where valves at both ends
of the bed is physically closed so that no gas can come in or go out of the bed. The reason
of having an idle step in a cycle sequence is to maintain the alignment of coupled steps
heavy reflux (HR) and light reflux (LR) in this case. During ts,2, the bed has heavy reflux
(HR) step which is ringed with heavy gas providing from another bed undergoing light
reflux (LR) step. Heavy reflux (HR) step is operated in this case at atmospheric pressure
like feed step. The purpose of having HR step in the sequence is to enhance the loading of
heavy component in the column by using heavy product enriched stream coming from light
reflux (LR) step. It is important to mention that a compressor is necessary to provide feed
to HR step by pulling gas from LR step. During ts,3, bed 2 undergoes a co-current
equalization depressurization (E) step where it is co-currently blown down to another
intermediate pressure to provide gas from its light end to another bed undergoing
equalization pressurization (E*) step. Finally, bed 2 is co-currently blown down (CoD)
from an atmospheric pressure to an intermediate pressure for a period of ts,4. The rate of
CoD is controlled by a valve coefficient (CvCoD) in order to reduce the loss of adsorbent
material due to attrition.
Finally, bed 3 is in counter-current blow down (CnD) step during ts,1, which bed 3
is depressurized counter-currently to a low pressure and the pressure at the end of this step
is controlled by a valve coefficient (CvCnD). During CnD, heavy gas is collected as product
from the bottom of bed. Next during ts,2, the bed undergoes light reflux (LR) step. In this
step, the bed is fed from light end with a portion of the light gas (LRR) coming from another
49
bed undergoing feed (F) step. The pressure at the end of this step is controlled by a valve
coefficient (CvLR) associated with the step. The entire heavy product collected during LR
step is sent back to HR step. The purpose of having LR step in the sequence is to regenerate
the bed. Then during ts,3, the bed is equalized with another bed from the light end to bring
the pressure up to an intermediate level. This equalization pressurization (E*) step helps to
reduce operating cost as well to improve PSA performance. Finally during ts,4, the bed is
re-pressurized to atmospheric pressure using the light gas from the light end of the bed
undergoing feed step to prepare the bed to the next cycle. After this phase same operation
is repeated to complete the overall cycle.
Simulations of a 3-bed 9-step PSA cycles were carried out using a FORTRAN
based in house dynamic adsorption process simulator (DAPS), detailed information is
given in Chapter 2.
In the current PSA cycle, the desired product is CO2 which is the preferentially
adsorbed species. Therefore, the performance of the process is evaluated on the basis of
CO2 recovery and CO2 purity in the heavy product. Recovery of CO2 is defined as the
number of moles of CO2 withdrawn as product during production step (CnD) divided by
the number of moles of CO2 fed to the PSA process during the feed step. On the other hand,
CO2 purity is defined as the mole fraction of CO2 leaving the bed during the CnD step.
Finally, the performance of a PSA process is calculated in terms of purity, recovery
and productivity. In this study, these are defined are follows:
𝑇ℎ𝑟𝑜𝑢𝑔ℎ𝑝𝑢𝑡 [𝐿(𝑆𝑇𝑃)
𝑘𝑔.ℎ] =
𝐹𝑟𝑒𝑠ℎ 𝑡𝑜𝑡𝑎𝑙 𝐹𝑒𝑒𝑑(𝑆𝐿𝑃𝑀) 𝑖𝑛 𝐹𝑒𝑒𝑑 𝑠𝑡𝑒𝑝∗60
𝑀𝑎𝑠𝑠 𝑜𝑓 𝑎𝑑𝑠𝑜𝑟𝑏𝑒𝑛𝑡(𝑘𝑔)𝑖𝑛 𝑎𝑙𝑙 𝑏𝑒𝑑𝑠 (3-1)
50
𝑃𝑢𝑟𝑖𝑡𝑦[%] =𝐶𝑂2(𝑚𝑜𝑙)𝑜𝑏𝑡𝑎𝑖𝑛𝑒𝑑 𝑎𝑠 𝑝𝑟𝑜𝑑𝑢𝑐𝑡 𝑑𝑢𝑟𝑖𝑛𝑔 𝐶𝑛𝐷 𝑠𝑡𝑒𝑝
𝑡𝑜𝑡𝑎𝑙 𝑃𝑟𝑜𝑑𝑢𝑐𝑡(𝑚𝑜𝑙)𝑜𝑏𝑡𝑎𝑖𝑛𝑒𝑑 𝑑𝑢𝑟𝑖𝑛𝑔 𝐶𝑛𝐷 𝑠𝑡𝑒𝑝∗ 100 (3-2)
𝑅𝑒𝑐𝑜𝑣𝑒𝑟𝑦[%] =𝐶𝑂2(𝑚𝑜𝑙)𝑜𝑏𝑡𝑎𝑖𝑛𝑒𝑑 𝑎𝑠 𝑝𝑟𝑜𝑑𝑢𝑐𝑡 𝑑𝑢𝑟𝑖𝑛𝑔 𝐶𝑛𝐷 𝑠𝑡𝑒𝑝
𝐹𝑟𝑒𝑠ℎ 𝐶𝑂2(𝑚𝑜𝑙)𝑓𝑒𝑑 𝑖𝑛 𝐹𝑒𝑒𝑑 𝑠𝑡𝑒𝑝× 100 (3-3)
In addition to recovery and purity, energy which is an indicator of the operation
cost of the process was calculated by following equations for a given step:
𝐸[𝐽] = ∑ ∫ (𝛾
𝛾−1) 𝑅𝑇 [(
𝑃𝐻
𝑃(𝑡))
𝛾−1
𝛾− 1]
1
𝜂𝑚𝑠𝑡𝑒𝑝(𝑡)𝑑𝑡
𝑡𝑠𝑡𝑒𝑝
𝑡=0𝑠𝑖 (3-4)
𝑚𝑠𝑡𝑒𝑝(𝑡)[𝑚𝑜𝑙𝑠⁄ ] =
𝑃𝑠𝑡𝑒𝑝(𝑡) 1000 𝑣𝑠𝑡𝑒𝑝(𝑡) 𝐴 𝜀𝑏
𝑅 𝑇(𝑡) (3-5)
𝑃[𝑊] =𝐸[𝐽]
𝑡𝑐𝑦𝑐𝑙𝑒
𝑛𝑢𝑚𝑏𝑒𝑟 𝑜𝑓 𝑏𝑒𝑑⁄
(3-6)
In the cycle studied in this work, the energy consuming steps are CnD, LR, and
CoD and the value of 𝑃𝐻 is 101.325 kPa.
Cumulative CO2 gas phase concentration equation, given in below, has been used
to explain the CO2 breaking through during the particular step.
𝑦𝐶𝑂2,𝑐𝑢𝑚̅̅ ̅̅ ̅̅ ̅̅ ̅̅ ̅ =∫ 𝑦𝐶𝑂2(𝑡).𝑣(𝑡).𝐶𝑇(𝑡)𝑑𝑡
𝑡𝑠𝑡𝑒𝑝0
∫ 𝑣(𝑡).𝐶𝑇(𝑡).𝑑𝑡𝑡𝑠𝑡𝑒𝑝
0
, 𝐶𝑇(𝑡) =𝑃𝑠𝑡𝑒𝑝(𝑡)∗1000
𝑅𝑇𝑠𝑡𝑒𝑝(𝑡) (3-7)
3.3 Bed and Adsorbent Characteristics
An overview of the bed and adsorbent characteristics used as input parameters in
the simulations as well as process characteristics are summarized in Table 3.1. The feed
stream contains 0.4vol % CO2 with 79 vol % N2, and 20.6 vol % O2 (given in Table 3.1).
51
The adsorbent utilized here is 13X zeolite. The TPL isotherm parameters were obtained
by fitting the experimental data and the fitted equilibrium parameters are summarized in
Table 2.3. The mass transfer coefficients for CO2, N2 and O2 were obtained experimentally
from the single bed rapid PSA apparatus and macropore mass transfer parameters are
summarized in Table 2.4.
3.4 Parametric Study
A detailed parametric study is conducted in order to investigate the effects of
various process parameters on process performance indicators such as purity and recovery
of heavy component. The parameters studied include HR/LR/F step time, thus cycle time
(by variable x in Table 3.2), light reflux ratio (LRR), counter-current depressurization
pressure (PCnD), light reflux pressure (PLR), and co-current depressurization pressure (PCoD).
The ranges of all the parameters during the parametric study are summarized in Table 3.2.
3.5 Result and Discussion
The PSA cycles performances at the periodic behavior for 13 different simulations
are summarized in Table 3.3. In the simulation the varied conditions include HR/LR/F step
time (thus cycle time), light reflux ratio (LRR), counter-current depressurization pressure
(PCnD), light reflux pressure (PLR), and co-current depressurization pressure (PCoD). The
overall process performance was judged in terms of the purity and recovery of CO2 in the
heavy product and the required energies. The CO2 purity was defined as the average mole
fraction of CO2 in the heavy product, equation 3.2. CO2 recovery was defined as the moles
of CO2 in the heavy product divided by the moles of CO2 fed to the process cumulatively
52
during the feed, equation 3.3. Another process performance, required energy which is an
indicator of the operation cost of the process was calculated by equations 3.4-3.6.
3.5.1 Effect of HR/LR/F Step Time, (Thus Cycle Time)
To study this effect the parameters that being held constant are light reflux ratio
(0.1), counter-current blow down pressure (1kPa), light reflux pressure (5kPa), and co-
current blow down pressure (5kPa) as shown in Table 3.2. To have different the HR/LR/F
step time, x values in Table 3.2 has been changed 0, 250, 500, and 750s (run numbers: 1-
4). The pressures for other steps are 101.325kPa at the end of feed, heavy reflux and light
product pressurization steps, 44.13kPa for Run1, 42.88kPa for RuN2, 41.68kPa for Run3
and 40.50kPa for Run4 at the end of equalizations steps as shown in Table 3.6.
In a typical PSA process, cycle time determines the length of operation of a
particular step in a fixed cycle schedule. As increasing the cycle time increases
proportionally the length of associated cycle steps for a fixed cycle schedule; HR/LR steps
as well as feed step in this paper. Results shown in Figure 3.2-a) indicate that the purity of
heavy product increases with increasing x. Longer cycle time helps to increase the length
of corresponding step proportionally, the longer duration forces more CO2 to adsorb by the
adsorbent at a certain temperature and pressure. In other words, the bed gets saturated
higher with CO2 at the end of HR step as shown in Figure 3.3, which shows bed profiles at
the end of HR step for each run at periodic steady state. From Figure 3.3, it can be easily
seen that the front is moving through the end of bed by increasing x. Hence, the purity
shows an increasing trend with increasing x.
53
On the other hand, recovery of CO2 increases for x = 250s then decreases by
increasing x as shown in Figure 3.2-b). In a typical PSA cycle, recovery of heavy product
decreases by increasing cycle time. It is important to notice that feed step time, heavy reflux
step time and light reflux step time, thus cycle time have been changed at the same time by
changing x value in Table 3.2. A likely explanation for the observed trend is that the depth
of penetration of mass transfer zone of CO2 into the bed increases with the increase of cycle
time which in turn enhances the loss of CO2 in the light end. To understand which particular
step is causing an increase in heavy product recovery, CO2 losses from light end for each
step (Feed, HR, CoD, LR, and LPP) can be seen from Figure 3.4, which shows relative
CO2 losses versus x for aforementioned steps. In Figure 3.4, a relative loss of CO2 in HR
step is increasing by increasing x. A basic explanation for this increase is that the bed is
saturated with more CO2, which can be seen from (Figure 3.3) that causes CO2 to break
through from light end. Therefore, CO2 loss increases by increasing x. CO2 loss during
CoD step decreases slightly by increasing x (Figure 3.4). CoD step time for these runs is
not changing so the amount of CO2 leaving the bed at the end of CoD step does not have a
big change, but the amount of CO2 into the bed during feed step is increasing as can be
seen form Table 3.4. Therefore, CO2 loss during CoD decreases by increasing x. These two
steps do not have the same trend that CO2 recovery has, so these steps are not the main
reason of the king in CO2 recovery. The other steps that cause the loss of CO2 from light
end are feed, LR, and LPP. Since some portion of light product from feed end goes to light
reflux and light product pressurization steps, the combination of these steps needs to be
count to investigate CO2 losses in light end as shown in Figure 3.4. In this combination
step, CO2 losses decrease at the beginning of increased x, then increase as well as CO2
54
recovery increases first then decreases by increased x, so it can be said that the main reason
for the trend that CO2 recovery has is feed steps. To better understanding, cumulative CO2
gas phase concentration (ȳCO2, cum) from the beginning to the end of feed step needs to be
investigated deeply for the runs 1-4 as shown in Figure 3.5. It can be seen from Figure 3.5
that ȳCO2, cum at the end of feed step is decreasing for x = 250s compare to x = 0s, which
causes an increase in CO2 recovery that means that the bed gets better saturated with CO2
in the feed step by increasing x. For x = 500s, ȳCO2, cum is decreasing slightly compare to
x = 250s, so CO2 recovery is increasing slightly; CO2 recoveries are 76.94 and 77.01 for x
= 250s and for x = 500s, respectively. For x = 750s in Figure 3.5, ȳCO2, cum increasing
compare to x = 250 and 500s, which causes a decrease in CO2 recovery that means that
CO2 starts breaking through during the feed steps and the bed loses some of the CO2 from
light end. It is important to notice that ȳCO2, cum for x = 750 is still lower that the value for
x = 0, so the CO2 recovery for x = 750 is still higher than the one x = 0. Therefore, the
recovery of CO2 increases for x = 250 and 500s compare to x = 0s, then it decreases for
further increased x (750s). To explain the main reason that CO2 starts breaking through for
x=750s, which is Run number 4, during the feed step the time ratios of feed step and light
reflux step for all four x values have an essential role. The time ratios of these two steps
are 0.7, 0.76, 0.8, and 0.83 for run number 1 through 4, respectively. The increase of this
ratio decreases by increasing x values. It can be said that during the light reflux step, the
bed is regenerated as much as like clean bed for x=500s, run number 3, but for x=750s, run
number 4, the bed has the maximum regeneration level that achieved at x=500s while still
increasing time for both light reflux and feed steps. That situation leads CO2 to breaking
through during feed step.
55
The total energy for run numbers 1-4 is increasing by increasing x as can be seen
from Figure 3.2-b). This figure shows the effect of x in all energy consuming steps, which
are CnD, CoD, and LR in this work. CoD and CnD energies are decreasing slightly by
increasing x compare to the LR energy. For this parametric study, CoD and CnD time is
not changing while total cycle time increasing, so the time fractions of these steps are
decreasing which causes a decrease in energy for these steps. The main time portion of the
cycle from energy consumption steps is LR. LR energy is increasing by increasing x
(Figure 3.2-b)). Time fractions of LR to total cycle are 0.23, 0.25, 0.27, and 0.28 for run 1
through run 4, respectively. Since the pump pulls gases which are coming from LR in 5kPa
to HR in 101.325kPa for longer time, more energy is needed with the increasing time
fraction of LR. Therefore, energy needed for LR step is increasing, so total energy increases
by increasing x.
3.5.2 Effect of Light Reflux Ratio (LRR)
Figure 3.6 summarizes the net results for CO2 recovery and purity in heavy product
and energies as a function of light reflux ratio (LRR). The parameters that are held constant
during the simulation include x (500s), counter-current blow down pressure (1kPa), light
reflux pressure (5kPa), flow rate (570 slpm), and co-current blow down pressure (5kPa) as
shown in Table 3.2. The pressures for those runs are 101.325kPa at the end of feed, heavy
reflux and light reflux pressurization steps, 42.37kPa for Run5, 41.68kPa for Run3,
41.15kPa for Run6 and 40.71 for Run7 at the end of equalizations steps (Table 3.6). The
light reflux ratio values for this parametric study are 0.08, 0.1, 0.12, and 0.14;
corresponding runs are 5, 3, and 6, and 7 in Table 3.2.

56
Figure 3.6-a) shows that purity of CO2 increases slight while recovery of CO2
increases dramatically with increasing light reflux ratio. As HR and LR steps are coupled
together, any increase in the number of moles produced from LR step will increase the
partial pressure of CO2 during the constant total pressure operation of HR step. This
increased partial pressure of CO2 causes the higher saturated bed with CO2 in HR step, so
the front is moving to the end of bed during HR step as can be seen from Figure 3.7.
Operating the light reflux step with higher flow rate of light product regenerated the
adsorbent better but might be diluted the heavy product. That might be the reason of having
a slight increase in purity of heavy product compare to recovery. The other reason of
increasing recovery of heavy product by increasing light reflux ratio is having more
regenerated bed during HR step; less CO2 is leaving the bed at the end of HR step by
increasing light reflux ratio as can be seen from Table 3.5. The capacity of the bed has been
used more with increasing light reflux ratio. Therefore, recovery of CO2 increases by
increasing light reflux ratio.
Figure 3.6-b) shows the effect of LRR in all energy consuming steps. The total
energy for the corresponding runs (3, 5-7) is increasing by increasing light reflux ratio.
Total energy means in this work is required energies for CoD, CnD, and LRR to increase
the stream pressure from the pressure at the end of these steps to atmospheric pressure.
Required energy for CoD from 5kPa to 101.325 kPa is decreasing slightly by increasing
LRR because the amount of CO2 leaving the bed at the end of CoD is decreasing as can be
seen from Table 3.5. Since the amount of CO2 leaving the bed at the end of CnD is
increasing, as can be seen from Table 3.5, energy required for CnD step from 1kPa to
101.325kPa is increasing slightly by increasing LRR. The other step that causes energy
57
consumption is LR step; LR energy is increasing dramatically by increasing light reflux
ratio. The amount of gases leaving the bed during the LR step is increasing by increasing
light reflux ratio (Table 3.5). That causes the pump to pull more gases, which need more
energy. Therefore, total energy increases by increasing light reflux ratio.
3.5.3 Effect of Counter-Current Depressurization Pressure (PCnD)
Figure 3.8 shows the effect of counter-current desorption pressure (PCnD) on cyclic
steady state performance for the PSA cycle. To study the effect of PCnD, the simulations
were performed at a constant x (500s), light reflux ratio (0.1), co-current blow down
pressure (5kPa), light reflux pressure (5kPa), flow rate (570 slpm) as shown in Table 3.2.
The only parameter that is changed was PCnD (0.8, 1, 1.2kPa); corresponding simulations
are Run numbers 8, 3, and 9, respectively. The other pressures for those runs are
101.325kPa at the end of feed, heavy reflux and light reflux pressurization steps, 42.04kPa
for Run8, 41.68kPa for Run3, 41.42kPa for Run9 at the end of equalizations steps as can
be seen from Table 3.6.
In general, the bed is better regenerated by lowering the desorption pressure. In
other words, the desorption pressure enhances the working capacity of the bed for a fixed
high pressure. The valve coefficient during CnD step in adjusted in such a way that the
final pressure at the end of step reaches a desired low pressure. It can be seen from Figure
3.8-a) purity of CO2 decreases with the decrease of desorption pressure for a particular
cycle time. The observed behavior in Figure 3.8-a) for CO2 purity can be described with
the help of Figure 3.9, which shows bed profiles at the end of HR step. The CO2 front is
moving backward by decreasing low pressure, which causes decrease in purity of CO2. On
the other hand, recovery of CO2 increases by decreasing CnD final pressure. To decrease
58
the low pressure, more CO2 is leaving the bed as a heavy product as can be seen from Table
3.5, which leads increasing CO2 recovery.
The total energy for run numbers 3, 8, and 9 stays almost constant by decreasing
CnD final pressure as can be seen from Figure 3.8-b). This figure shows the effect of PCoD
in all energy consuming steps, which are CnD, CoD, and LR in this work. The energy
required for CoD is almost constant and for LR step is decreasing slightly while for CnD
step is increasing slightly by decreasing CnD final pressure. Required energy for CnD step
is increasing by decreasing CnD final pressure because the pumps needs to pull more gases
to get the lower pressures at the end of CnD step. Since the next step after CnD is LR, there
was less gasses in the bed pulled by the pump during LR, energy required for LR decreases
by decreasing PCnD. Because of the neutral effect of these two steps total energy stays
almost constant.
3.5.4 Effect of Light Reflux Pressure (PLR)
Figure 3.10 summarizes the net results for CO2 recovery and purity in heavy
product and energies as a function of light reflux pressure (PLR). The parameters that are
held constant during the simulation include x (500s), light reflux ratio (0.1), counter-current
blow down pressure (1kPa), flow rate (570 slpm), and co-current blow down pressure
(5kPa) as shown in Table 3.2. The only parameter that is changed was PLR (3, 4, 5kPa);
corresponding simulations are Run11, 10, 3, respectively. The other pressures for those
runs are 101.325kPa at the end of feed, heavy reflux and light reflux pressurization steps,
39.51kPa for Run11, 40.56kPa for Run10 and 41.68kPa for Run3 at the end of
equalizations steps (Table 3.6).
59
From Figure 3.10-a), purity of CO2 increases slight while recovery of CO2 increases
dramatically by decreasing the pressure at the end of the light reflux. Low pressure for light
reflux step means more regenerated bed with light product gases, in other words, more CO2
is coming from the bed. Since heavy reflux step is being fed from this stream that causes
moving the CO2 front to the end of bed during heavy reflux step (Figure 3.11). That means
that the bed is being used more than with high PLR case which causes an increase in purity
and recovery of CO2. It can be also seen from Table 3.5 that amount of CO2 leaving the
bed at the end of HR step from light end decreasing by increasing PLR, which causes
increase in recovery of CO2. The reason of having a slight increase in purity of heavy
product might be diluted the heavy product stream with light products (N2, O2) to reach
lower pressures.
Figure 3.10-b) shows the effect of PLR in all energy consuming steps. The total
energy for the corresponding runs is increasing by decreasing LR pressure. Required
energy for CoD and CnD is increasing slightly by decreasing PLR. Required energy for LR
step is increasing with decreasing PLR. The pump is pulling more gases to reach the low
LR pressures, so energy needed for LR increases by decreasing LR final pressure.
Therefore, total energy increases by decreasing PLR.
3.5.5 Effect of Co-Current Depressurization Pressure (PCoD)
The parameters that are held constant during the simulations to study this effect
include x (500s), light reflux ratio (0.1), counter-current blow down pressure (1kPa), light
reflux pressure (5kPa), flow rate (570 slpm) as shown in Table 3.2. The pressures at the
end of each step for these three simulations (Run #3, 12, and 13) were constant except PCoD.
Those pressures are 101.325kPa at the end of feed, heavy reflux and light reflux
60
pressurization steps, 41.7kPa at the end of equalizations steps, 1kPa at the end of counter-
current blowdown, 5kPa at the end of light reflux (Table 3.5). In other words, the only
parameter that is changed was PCoD; 4, 5, 7kPa for runs 12, 3, and 13, respectively. Figure
3.12 shows the effect of co-current blow down pressure (PCoD) on purity and recovery of
CO2 and energies.
It is clear from Figure 3.12-a) that purity of heavy product stream is dramatically
increasing while recovery of CO2 is slightly decreasing by decreasing the final pressure of
co-current depressurization. The decrease in final pressure of CoD step results desorption
of more CO2 (heavy component) along with the light components (N2 and O2). In other
words, the reason of decreasing the recovery of CO2 with decreasing CoD final pressure is
that the bed is losing adsorbed phase CO2 in light end to reach the low pressures (Table
3.5). Besides CO2, more N2 and O2 are also leaving the bed from light end by decreasing
CoD final pressure that causes less N2 and O2 in the system at the end of CoD. Since the
next step after CoD is CnD, which is production step, more pure CO2 is coming out from
the bed as heavy product. That causes an increase in purity of heavy product.
The total energy for run numbers 3, 12, and 13 stays almost constant by decreasing
CoD final pressure as can be seen from Figure 3.12-b). This figure shows the effect of PCoD
in all energy consuming steps, which are CnD, CoD, and LR in this work. The energies
required for CnD and LR steps are almost constant while for CoD step is increasing slightly
by decreasing CoD final pressure. The reason of an increase of required energy for CoD
step is that the pump pulls more gases from the bed to reach low pressures at the end of
CoD step. Since the time portion of CoD step to cycle time is very low (0.02), total energy
stays almost constant by decreasing CoD final pressure.
61
3.6 Conclusion
An in-house process simulator was used to study 3 beds 9 steps PSA process for
the enrichment and recovery trace amount of CO2 from a CO2-air mixture using 13X
zeolite. The practical feasibility of carbon dioxide separation and recovery from air-CO2
mixtures was demonstrated by means of a new PSA cycle. A 3-bed 9-step PSA system was
configured and utilized to study concentration and separation of CO2 from air (0.4% CO2,
79% N2, and 20.6% O2) using Zeolite 13X as adsorbent. PSA Cycle, which included feed
(F), idle (I), heavy reflux (HR), co-current equalization depressurization (Eq), co-current
depressurization (CoD), counter-current depressurization (CnD), light reflux (LR),
counter-current equalization pressurization (Eq*) and Light Product Pressurization (LPP)
steps was able to produce carbon dioxide with purities more than 96.2% and recoveries
more than 87.7%.
The effects of HR/LR step time (thus cycle time), light reflux ratio, co-current and
counter-current depressurization pressures, and light reflux pressure were investigated. The
simulations revealed that the purity of heavy product increases with increasing HR/LR step
time while recovery of CO2 increases first then starts decreasing by increasing HR/LR step
time. This trend in recovery of CO2 is because CO2 starts breaking through during the feed
steps and the bed loses some of the CO2 from light end. This is the reason of picking the
run3 as a base case with 95.75% CO2 purity and 77% CO2 recovery process performances.
The effect of light reflux ratio study indicated that the CO2 purity is not sensitive to this
parameter while it has a relatively big effect on recovery of CO2. Parametric study on PCnD
shows that purity of CO2 decreases while recovery of CO2 increases by decreasing CnD
final pressure. Purity of heavy product stream is dramatically increasing while recovery of
62
CO2 is slightly decreasing by decreasing the final pressure of co-current depressurization.
The final parametric study on PLR indicated that purity of CO2 increases slight while
recovery of CO2 increases dramatically by decreasing the pressure at the end of the light
reflux. And that also revealed that optimizing this parameter (PLR) is vital for the best
performance.
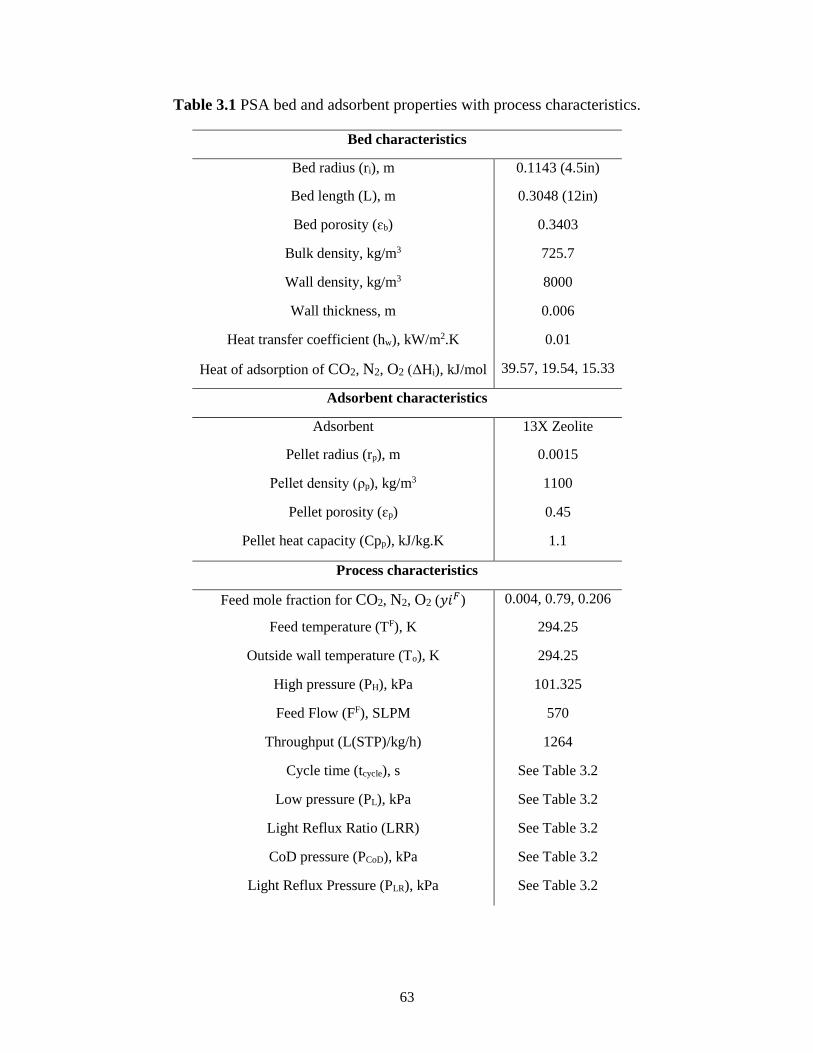
63
Table 3.1 PSA bed and adsorbent properties with process characteristics.
Bed characteristics
Bed radius (ri), m 0.1143 (4.5in)
Bed length (L), m 0.3048 (12in)
Bed porosity (ɛb) 0.3403
Bulk density, kg/m3 725.7
Wall density, kg/m3 8000
Wall thickness, m 0.006
Heat transfer coefficient (hw), kW/m2.K 0.01
Heat of adsorption of CO2, N2, O2 (ΔHi), kJ/mol 39.57, 19.54, 15.33
Adsorbent characteristics
Adsorbent 13X Zeolite
Pellet radius (rp), m 0.0015
Pellet density (ρp), kg/m3 1100
Pellet porosity (ɛp) 0.45
Pellet heat capacity (Cpp), kJ/kg.K 1.1
Process characteristics
Feed mole fraction for CO2, N2, O2 (𝑦𝑖𝐹) 0.004, 0.79, 0.206
Feed temperature (TF), K 294.25
Outside wall temperature (To), K 294.25
High pressure (PH), kPa 101.325
Feed Flow (FF), SLPM 570
Throughput (L(STP)/kg/h) 1264
Cycle time (tcycle), s See Table 3.2
Low pressure (PL), kPa See Table 3.2
Light Reflux Ratio (LRR) See Table 3.2
CoD pressure (PCoD), kPa See Table 3.2
Light Reflux Pressure (PLR), kPa See Table 3.2
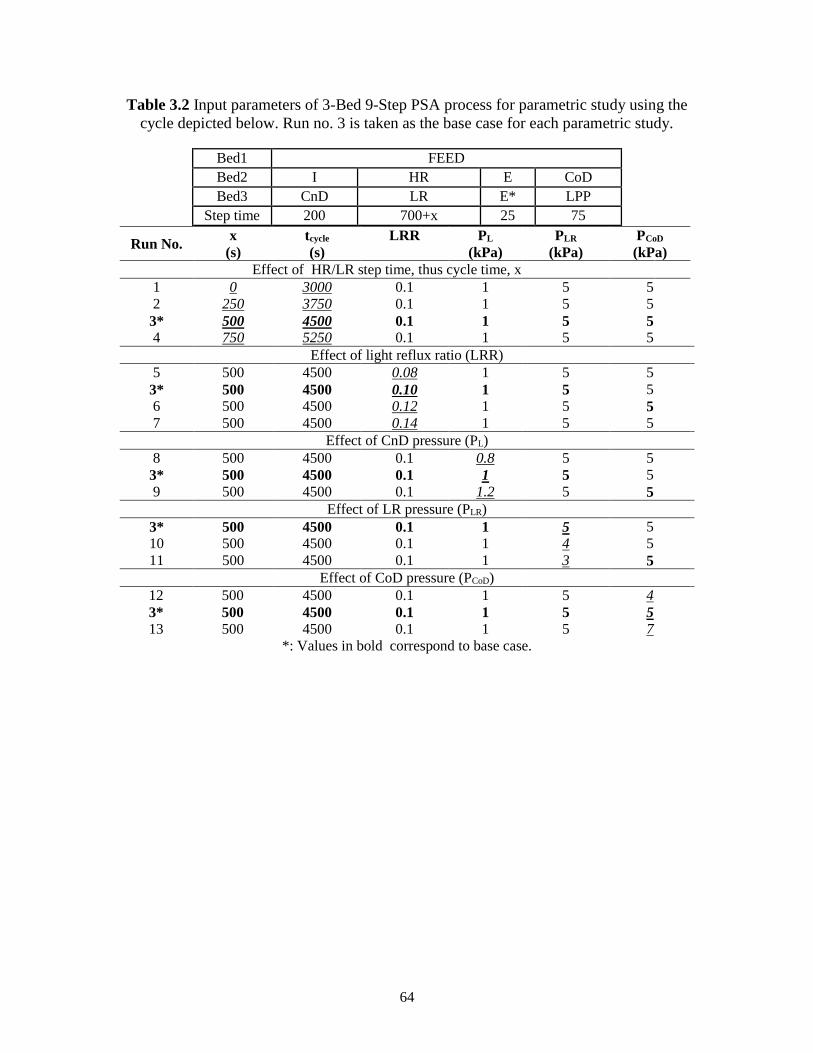
64
Table 3.2 Input parameters of 3-Bed 9-Step PSA process for parametric study using the
cycle depicted below. Run no. 3 is taken as the base case for each parametric study.
Bed1 FEED
Bed2 I HR E CoD
Bed3 CnD LR E* LPP
Step time 200 700+x 25 75
Run No. x
(s)
tcycle
(s)
LRR
PL
(kPa)
PLR
(kPa)
PCoD
(kPa)
Effect of HR/LR step time, thus cycle time, x
1 0 3000 0.1 1 5 5
2 250 3750 0.1 1 5 5
3* 500 4500 0.1 1 5 5
4 750 5250 0.1 1 5 5
Effect of light reflux ratio (LRR)
5 500 4500 0.08 1 5 5
3* 500 4500 0.10 1 5 5
6 500 4500 0.12 1 5 5
7 500 4500 0.14 1 5 5
Effect of CnD pressure (PL)
8 500 4500 0.1 0.8 5 5
3* 500 4500 0.1 1 5 5
9 500 4500 0.1 1.2 5 5
Effect of LR pressure (PLR)
3* 500 4500 0.1 1 5 5
10 500 4500 0.1 1 4 5
11 500 4500 0.1 1 3 5
Effect of CoD pressure (PCoD)
12 500 4500 0.1 1 5 4
3* 500 4500 0.1 1 5 5
13 500 4500 0.1 1 5 7
*: Values in bold correspond to base case.
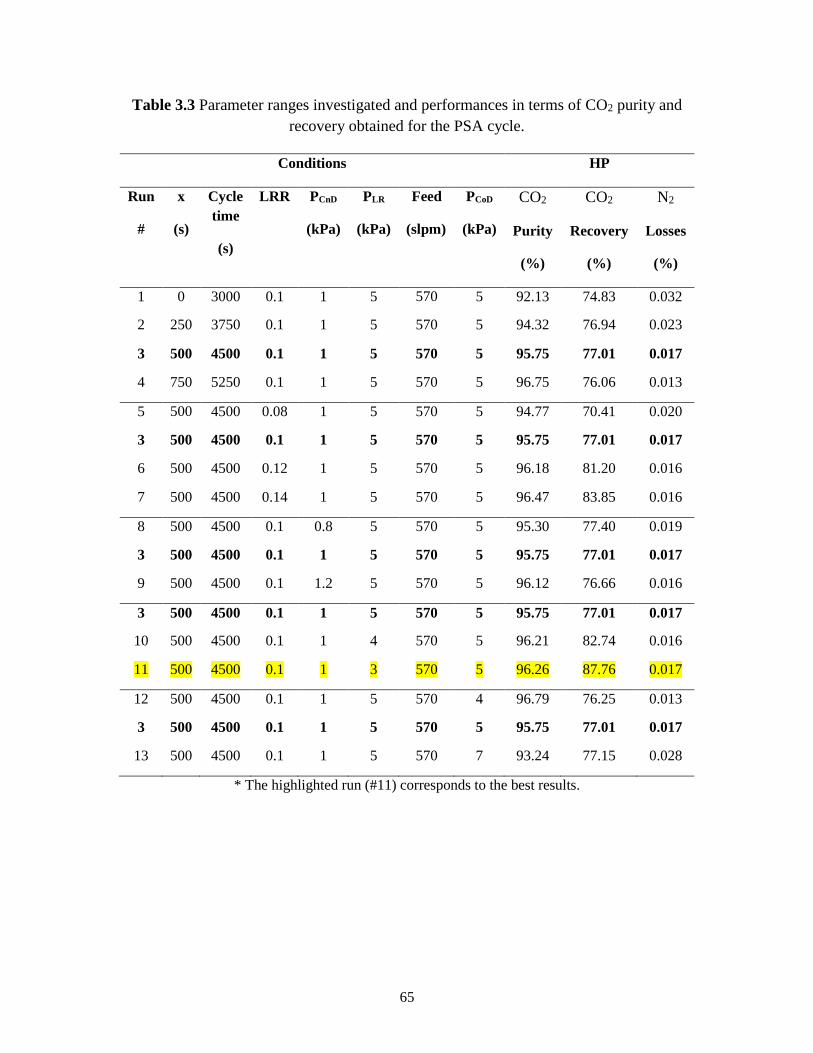
65
Table 3.3 Parameter ranges investigated and performances in terms of CO2 purity and
recovery obtained for the PSA cycle.
Conditions HP
Run
#
x
(s)
Cycle
time
(s)
LRR PCnD
(kPa)
PLR
(kPa)
Feed
(slpm)
PCoD
(kPa)
CO2
Purity
(%)
CO2
Recovery
(%)
N2
Losses
(%)
1 0 3000 0.1 1 5 570
5
92.13 74.83 0.032
2 250 3750 0.1 1 5 570 5 94.32 76.94 0.023
3 500 4500 0.1 1 5 570 5 95.75 77.01 0.017
4 750 5250 0.1 1 5 570 5 96.75 76.06 0.013
5 500
4500 0.08 1 5 570 5 94.77 70.41 0.020
3 500 4500 0.1 1 5 570 5 95.75 77.01 0.017
6 500 4500 0.12 1 5 570 5 96.18 81.20 0.016
7 500 4500 0.14 1 5 570 5 96.47 83.85 0.016
8 500 4500 0.1 0.8 5 570 5 95.30 77.40 0.019
3 500 4500 0.1 1 5 570 5 95.75 77.01 0.017
9 500 4500 0.1 1.2 5 570 5 96.12 76.66 0.016
3 500 4500 0.1 1 5 570 5 95.75 77.01 0.017
10 500 4500 0.1 1 4 570 5 96.21 82.74 0.016
11 500 4500 0.1 1 3 570 5 96.26 87.76 0.017
12 500 4500 0.1 1 5 570 4 96.79 76.25 0.013
3 500 4500 0.1 1 5 570 5 95.75 77.01 0.017
13 500 4500 0.1 1 5 570 7
93.24 77.15 0.028
* The highlighted run (#11) corresponds to the best results.
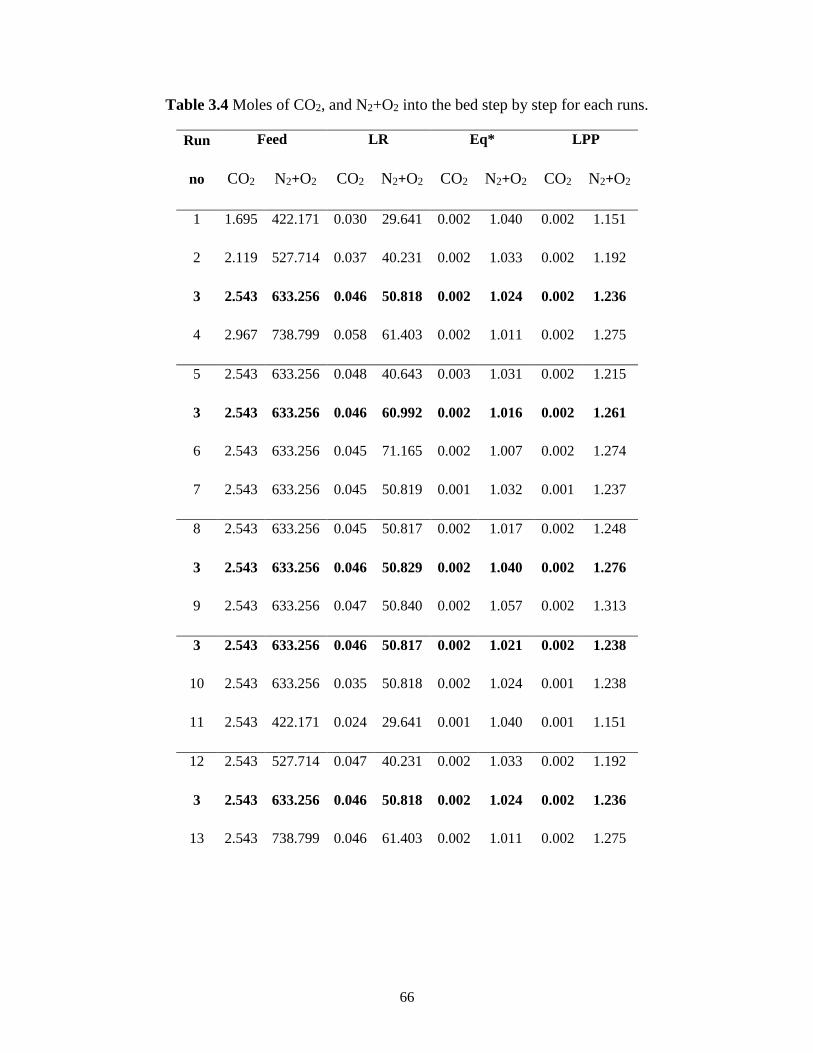
66
Table 3.4 Moles of CO2, and N2+O2 into the bed step by step for each runs.
Run
no
Feed LR Eq* LPP
CO2 N2+O2 CO2 N2+O2 CO2 N2+O2 CO2 N2+O2
1 1.695 422.171 0.030 29.641 0.002 1.040 0.002 1.151
2 2.119 527.714 0.037 40.231 0.002 1.033 0.002 1.192
3 2.543 633.256 0.046 50.818 0.002 1.024 0.002 1.236
4 2.967 738.799 0.058 61.403 0.002 1.011 0.002 1.275
5 2.543 633.256 0.048 40.643 0.003 1.031 0.002 1.215
3 2.543 633.256 0.046 60.992 0.002 1.016 0.002 1.261
6 2.543 633.256 0.045 71.165 0.002 1.007 0.002 1.274
7 2.543 633.256 0.045 50.819 0.001 1.032 0.001 1.237
8 2.543 633.256 0.045 50.817 0.002 1.017 0.002 1.248
3 2.543 633.256 0.046 50.829 0.002 1.040 0.002 1.276
9 2.543 633.256 0.047 50.840 0.002 1.057 0.002 1.313
3 2.543 633.256 0.046 50.817 0.002 1.021 0.002 1.238
10 2.543 633.256 0.035 50.818 0.002 1.024 0.001 1.238
11 2.543 422.171 0.024 29.641 0.001 1.040 0.001 1.151
12 2.543 527.714 0.047 40.231 0.002 1.033 0.002 1.192
3 2.543 633.256 0.046 50.818 0.002 1.024 0.002 1.236
13 2.543 738.799 0.046 61.403 0.002 1.011 0.002 1.275
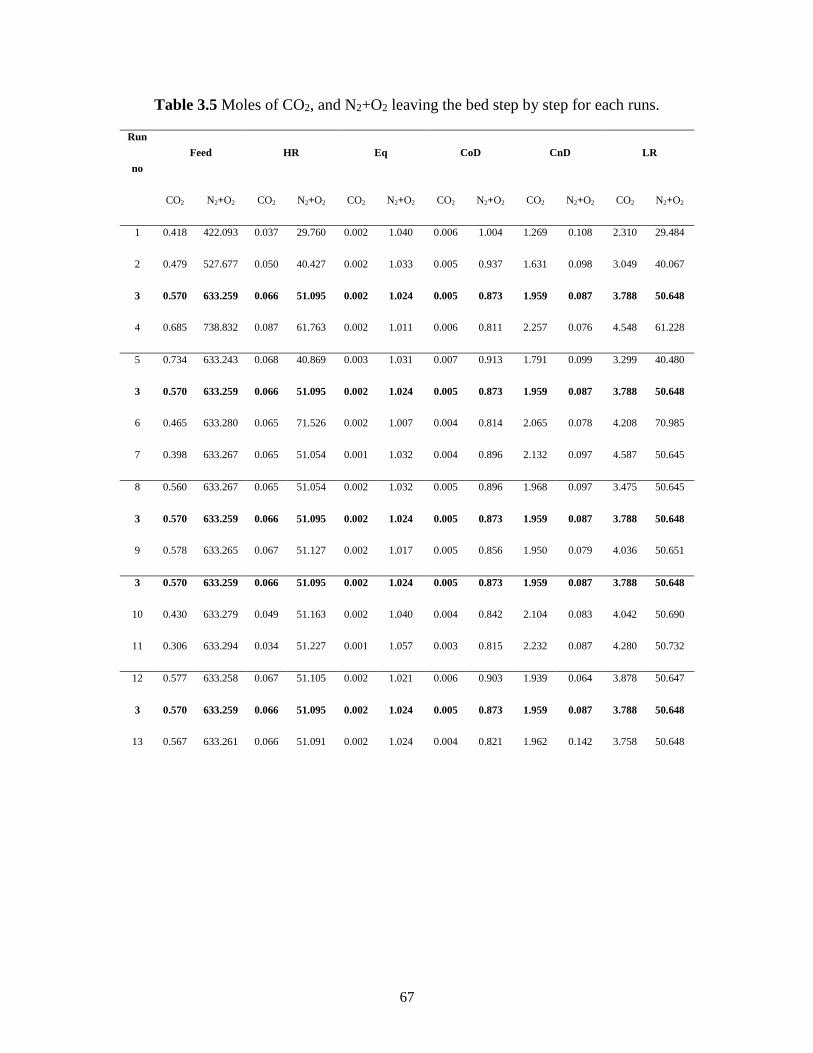
67
Table 3.5 Moles of CO2, and N2+O2 leaving the bed step by step for each runs.
Run
no
Feed HR Eq CoD CnD LR
CO2 N2+O2 CO2 N2+O2 CO2 N2+O2 CO2 N2+O2 CO2 N2+O2 CO2 N2+O2
1 0.418 422.093 0.037 29.760 0.002 1.040 0.006 1.004 1.269 0.108 2.310 29.484
2 0.479 527.677 0.050 40.427 0.002 1.033 0.005 0.937 1.631 0.098 3.049 40.067
3 0.570 633.259 0.066 51.095 0.002 1.024 0.005 0.873 1.959 0.087 3.788 50.648
4 0.685 738.832 0.087 61.763 0.002 1.011 0.006 0.811 2.257 0.076 4.548 61.228
5 0.734 633.243 0.068 40.869 0.003 1.031 0.007 0.913 1.791 0.099 3.299 40.480
3 0.570 633.259 0.066 51.095 0.002 1.024 0.005 0.873 1.959 0.087 3.788 50.648
6 0.465 633.280 0.065 71.526 0.002 1.007 0.004 0.814 2.065 0.078 4.208 70.985
7 0.398 633.267 0.065 51.054 0.001 1.032 0.004 0.896 2.132 0.097 4.587 50.645
8 0.560 633.267 0.065 51.054 0.002 1.032 0.005 0.896 1.968 0.097 3.475 50.645
3 0.570 633.259 0.066 51.095 0.002 1.024 0.005 0.873 1.959 0.087 3.788 50.648
9 0.578 633.265 0.067 51.127 0.002 1.017 0.005 0.856 1.950 0.079 4.036 50.651
3 0.570 633.259 0.066 51.095 0.002 1.024 0.005 0.873 1.959 0.087 3.788 50.648
10 0.430 633.279 0.049 51.163 0.002 1.040 0.004 0.842 2.104 0.083 4.042 50.690
11 0.306 633.294 0.034 51.227 0.001 1.057 0.003 0.815 2.232 0.087 4.280 50.732
12 0.577 633.258 0.067 51.105 0.002 1.021 0.006 0.903 1.939 0.064 3.878 50.647
3 0.570 633.259 0.066 51.095 0.002 1.024 0.005 0.873 1.959 0.087 3.788 50.648
13 0.567 633.261 0.066 51.091 0.002 1.024 0.004 0.821 1.962 0.142 3.758 50.648
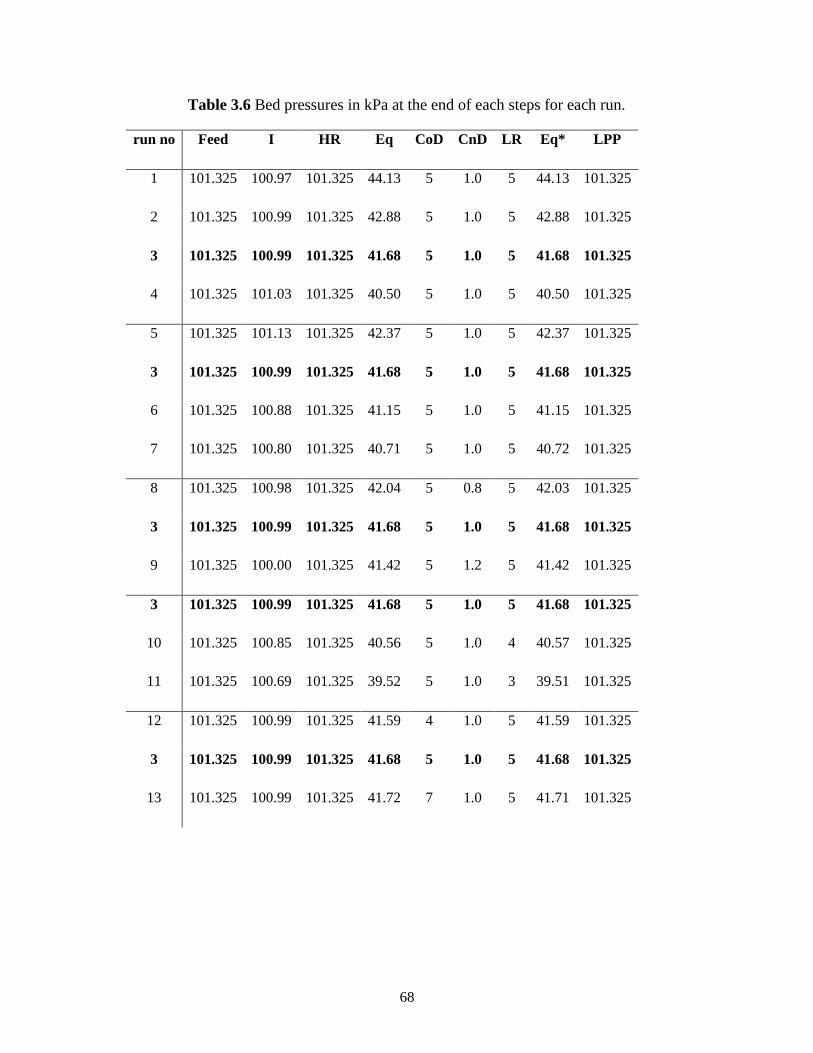
68
Table 3.6 Bed pressures in kPa at the end of each steps for each run.
run no Feed I HR Eq CoD CnD LR Eq* LPP
1 101.325 100.97 101.325 44.13 5 1.0 5 44.13 101.325
2 101.325 100.99 101.325 42.88 5 1.0 5 42.88 101.325
3 101.325 100.99 101.325 41.68 5 1.0 5 41.68 101.325
4 101.325 101.03 101.325 40.50 5 1.0 5 40.50 101.325
5 101.325 101.13 101.325 42.37 5 1.0 5 42.37 101.325
3 101.325 100.99 101.325 41.68 5 1.0 5 41.68 101.325
6 101.325 100.88 101.325 41.15 5 1.0 5 41.15 101.325
7 101.325 100.80 101.325 40.71 5 1.0 5 40.72 101.325
8 101.325 100.98 101.325 42.04 5 0.8 5 42.03 101.325
3 101.325 100.99 101.325 41.68 5 1.0 5 41.68 101.325
9 101.325 100.00 101.325 41.42 5 1.2 5 41.42 101.325
3 101.325 100.99 101.325 41.68 5 1.0 5 41.68 101.325
10 101.325 100.85 101.325 40.56 5 1.0 4 40.57 101.325
11 101.325 100.69 101.325 39.52 5 1.0 3 39.51 101.325
12 101.325 100.99 101.325 41.59 4 1.0 5 41.59 101.325
3 101.325 100.99 101.325 41.68 5 1.0 5 41.68 101.325
13 101.325 100.99 101.325 41.72 7 1.0 5 41.71 101.325
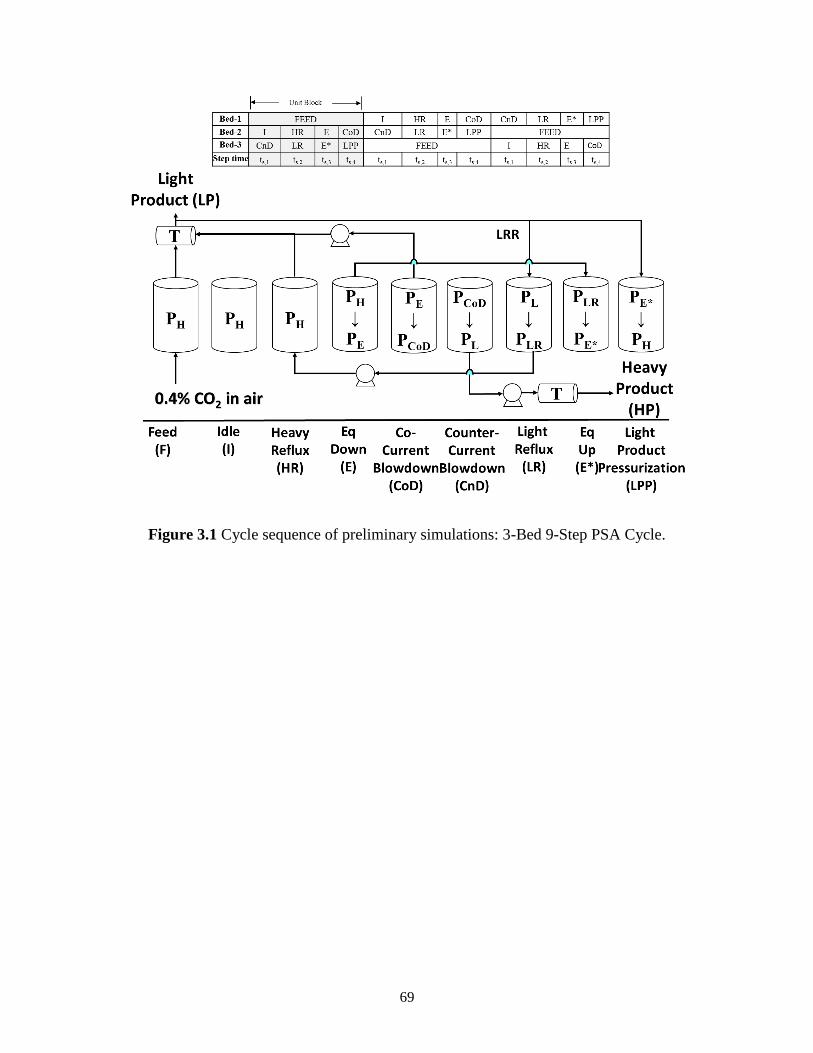
69
Figure 3.1 Cycle sequence of preliminary simulations: 3-Bed 9-Step PSA Cycle.
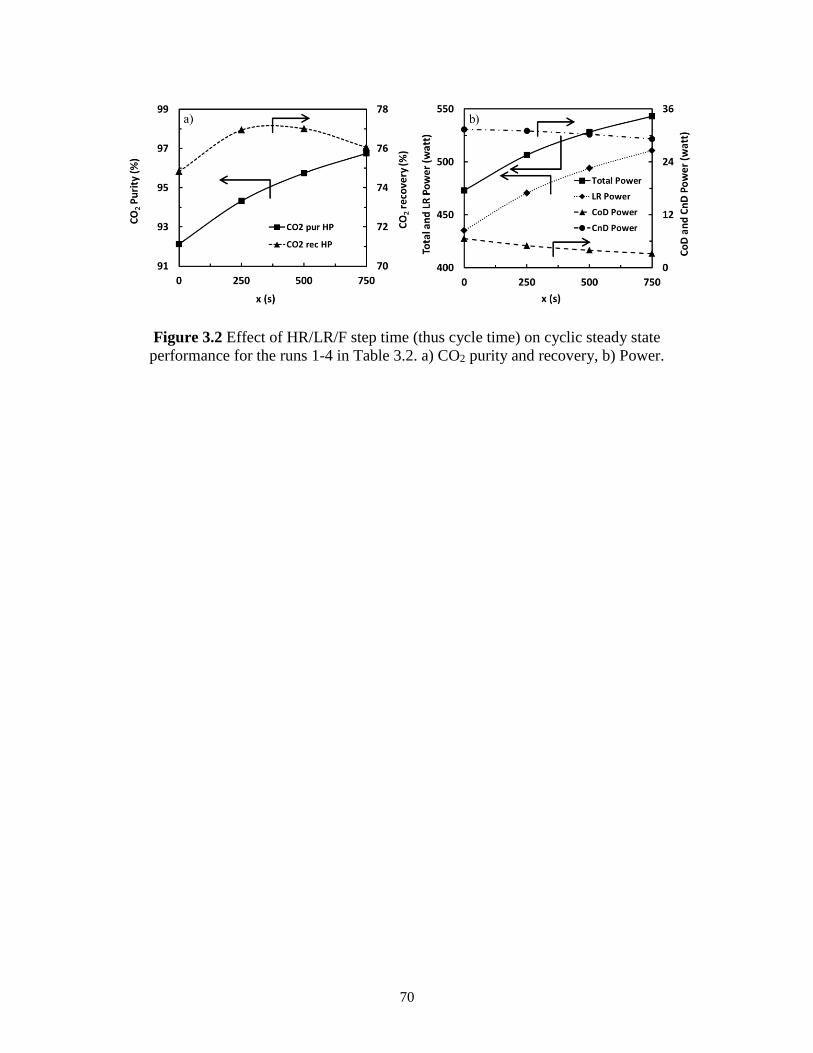
70
Figure 3.2 Effect of HR/LR/F step time (thus cycle time) on cyclic steady state
performance for the runs 1-4 in Table 3.2. a) CO2 purity and recovery, b) Power.
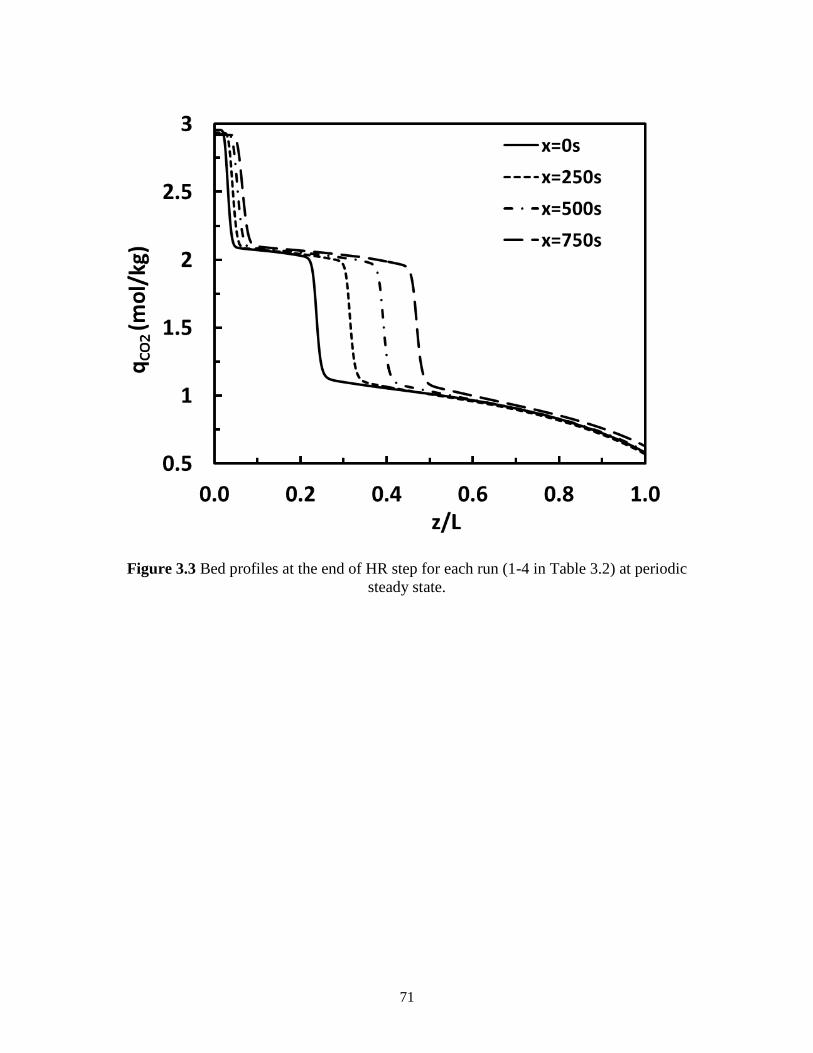
71
Figure 3.3 Bed profiles at the end of HR step for each run (1-4 in Table 3.2) at periodic
steady state.
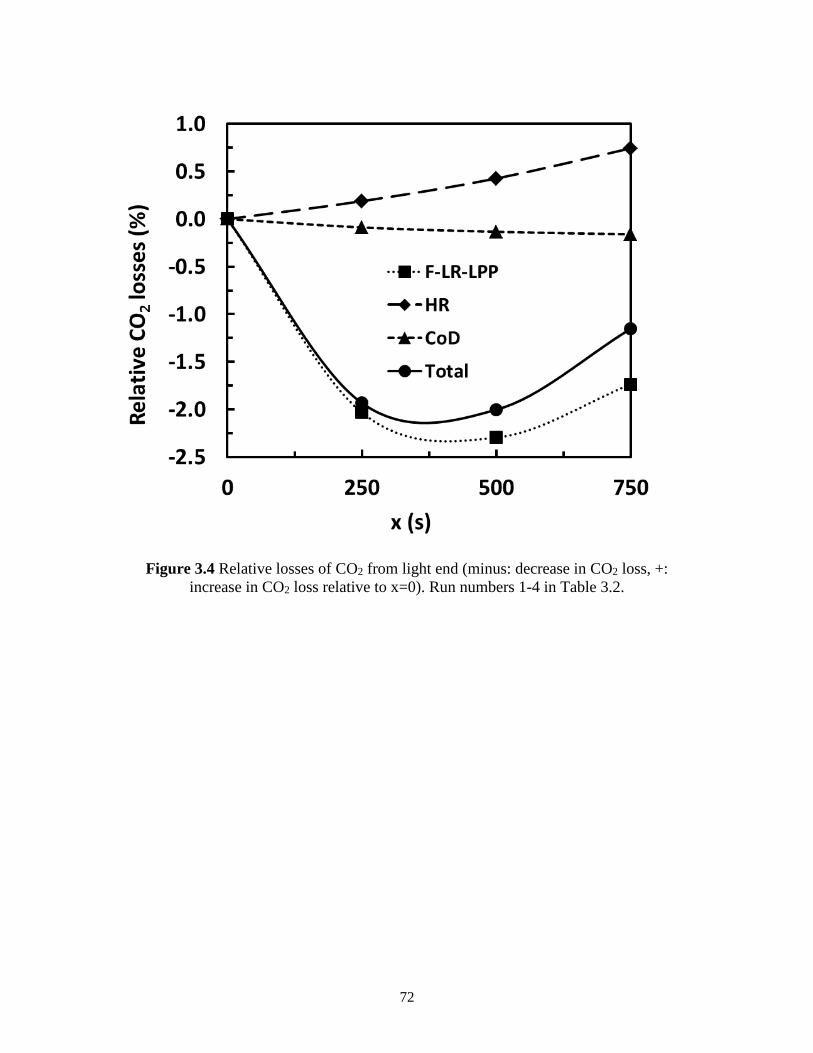
72
Figure 3.4 Relative losses of CO2 from light end (minus: decrease in CO2 loss, +:
increase in CO2 loss relative to x=0). Run numbers 1-4 in Table 3.2.
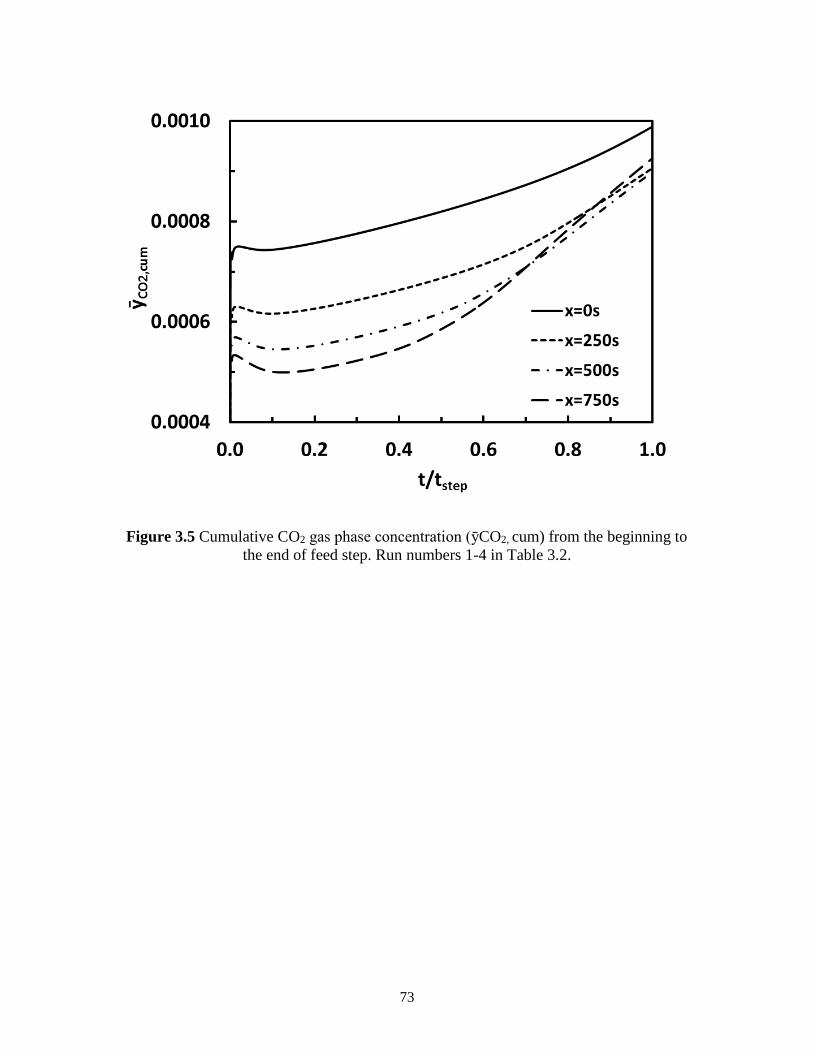
73
Figure 3.5 Cumulative CO2 gas phase concentration (ȳCO2, cum) from the beginning to
the end of feed step. Run numbers 1-4 in Table 3.2.
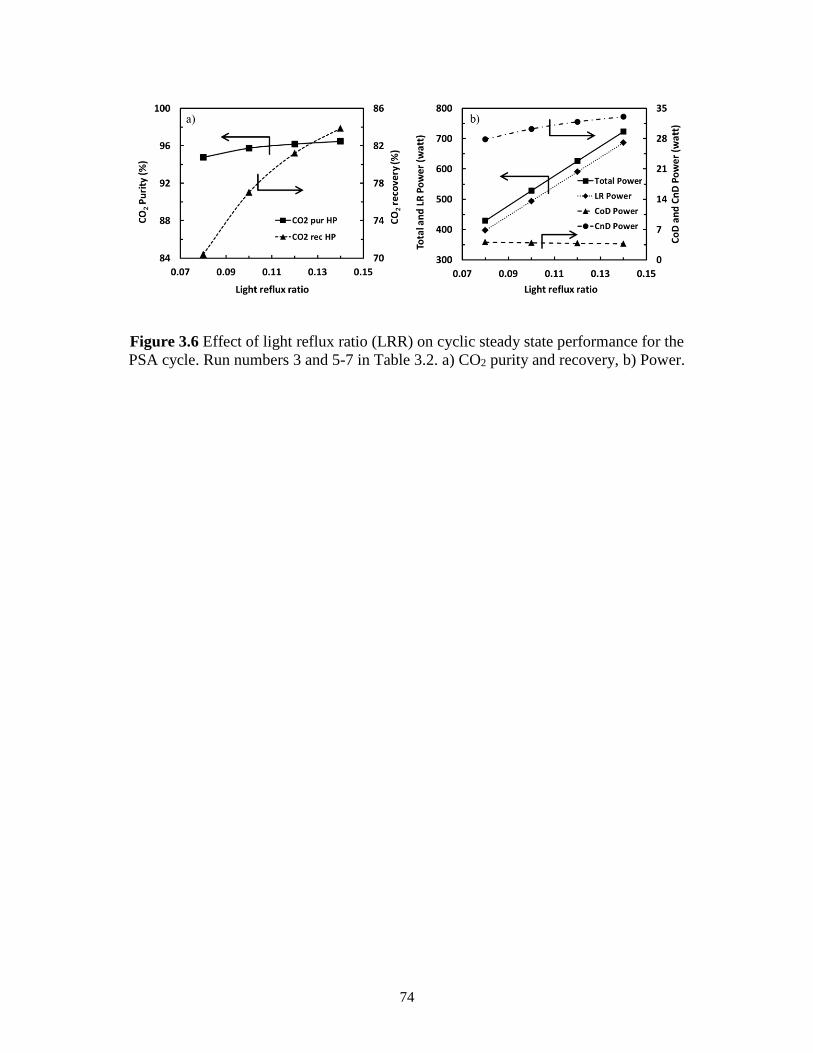
74
Figure 3.6 Effect of light reflux ratio (LRR) on cyclic steady state performance for the
PSA cycle. Run numbers 3 and 5-7 in Table 3.2. a) CO2 purity and recovery, b) Power.
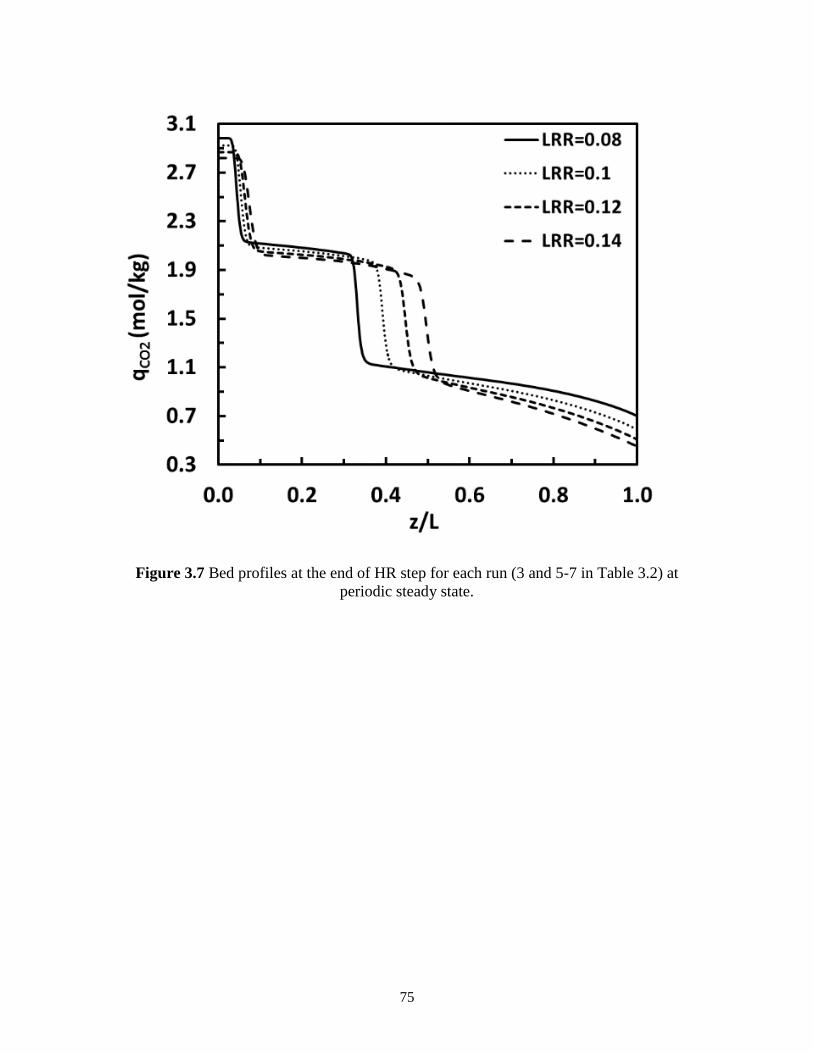
75
Figure 3.7 Bed profiles at the end of HR step for each run (3 and 5-7 in Table 3.2) at
periodic steady state.
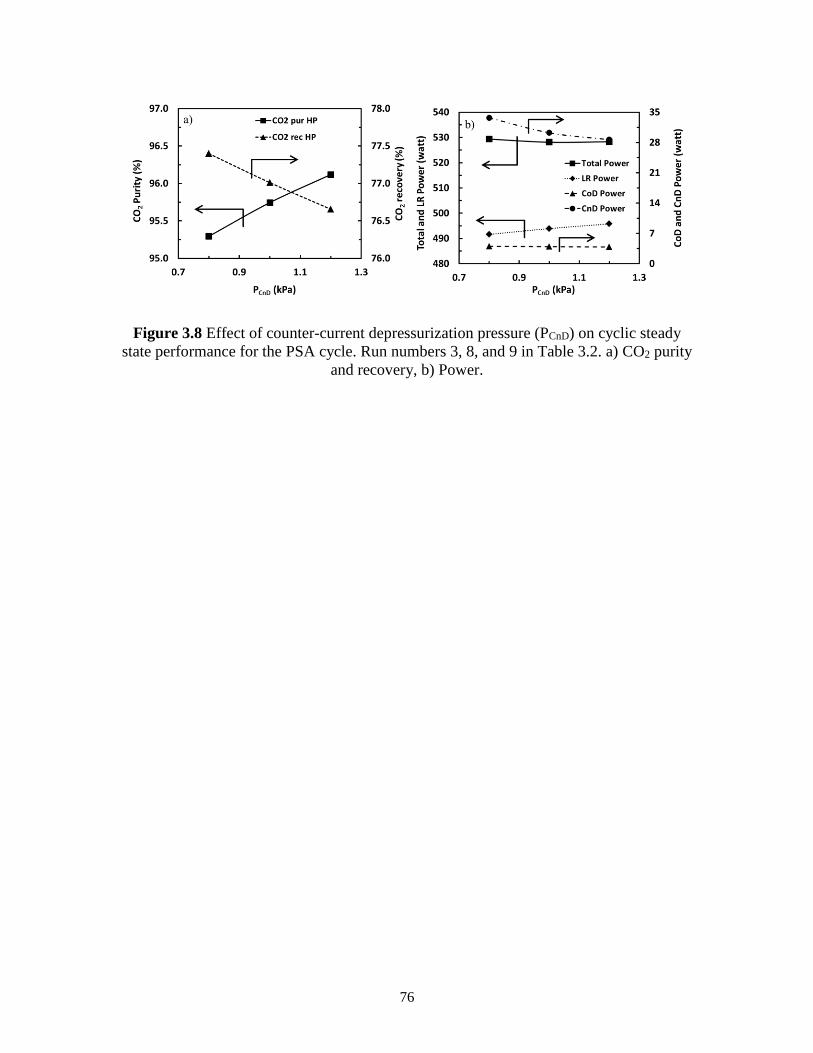
76
Figure 3.8 Effect of counter-current depressurization pressure (PCnD) on cyclic steady
state performance for the PSA cycle. Run numbers 3, 8, and 9 in Table 3.2. a) CO2 purity
and recovery, b) Power.
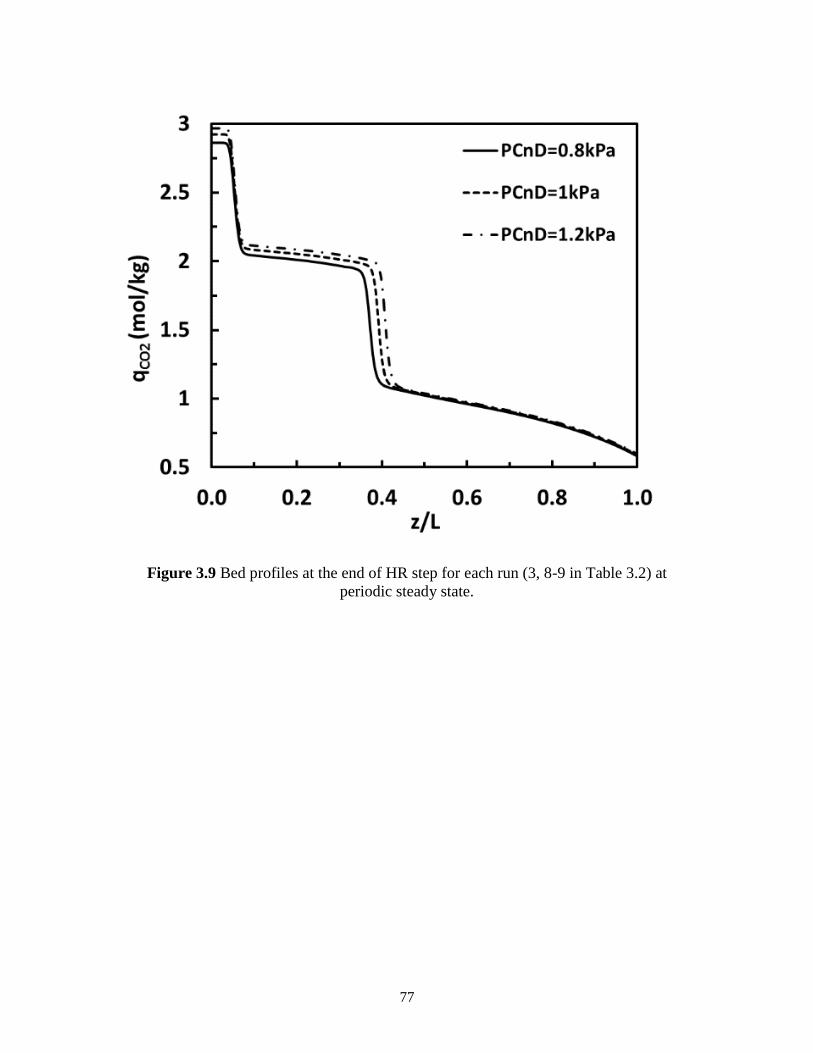
77
Figure 3.9 Bed profiles at the end of HR step for each run (3, 8-9 in Table 3.2) at
periodic steady state.
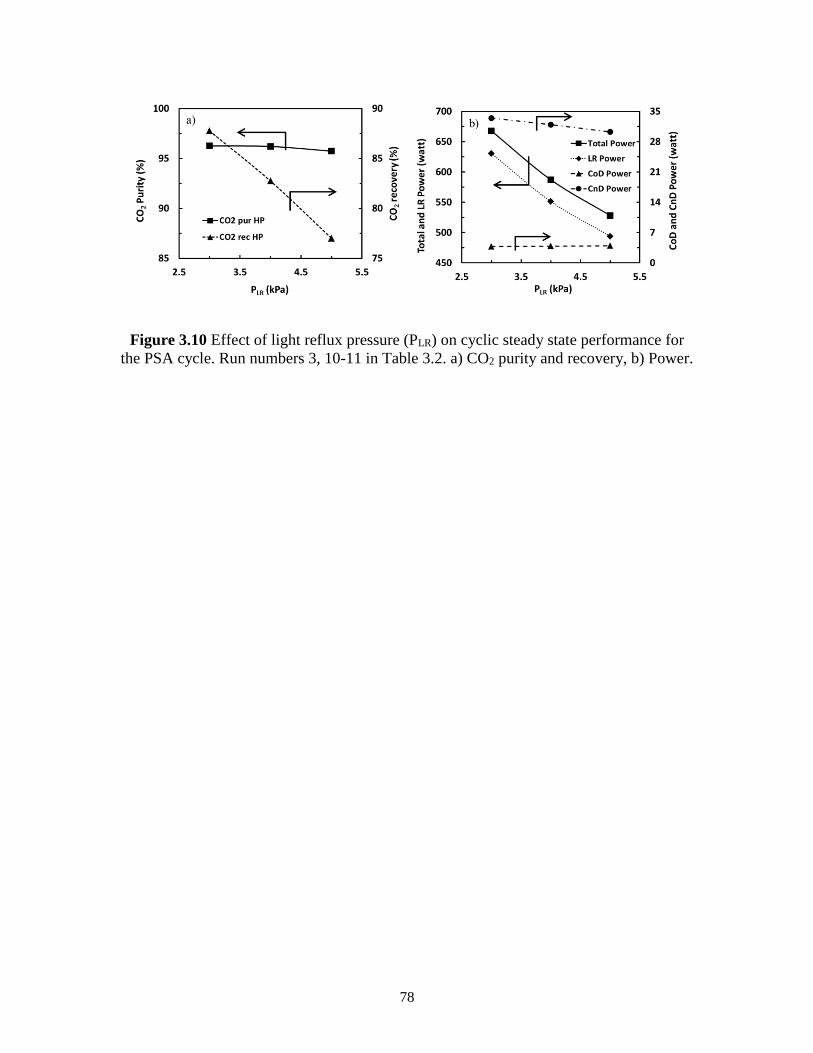
78
Figure 3.10 Effect of light reflux pressure (PLR) on cyclic steady state performance for
the PSA cycle. Run numbers 3, 10-11 in Table 3.2. a) CO2 purity and recovery, b) Power.
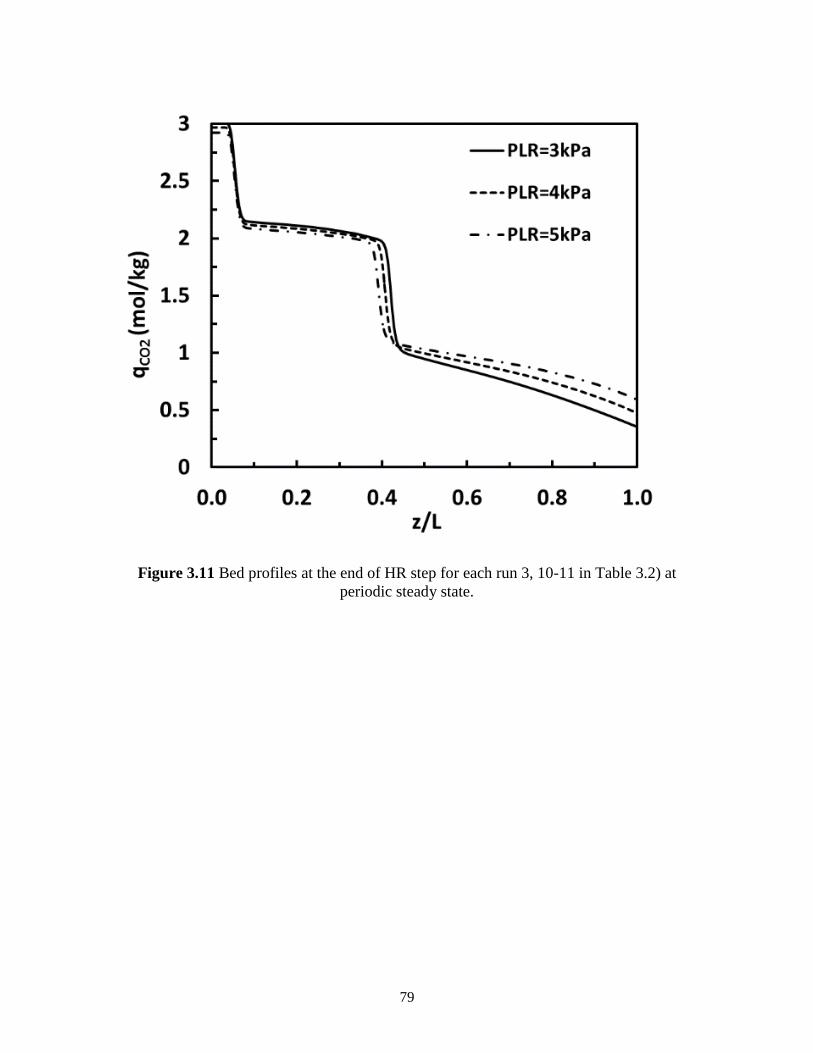
79
Figure 3.11 Bed profiles at the end of HR step for each run 3, 10-11 in Table 3.2) at
periodic steady state.
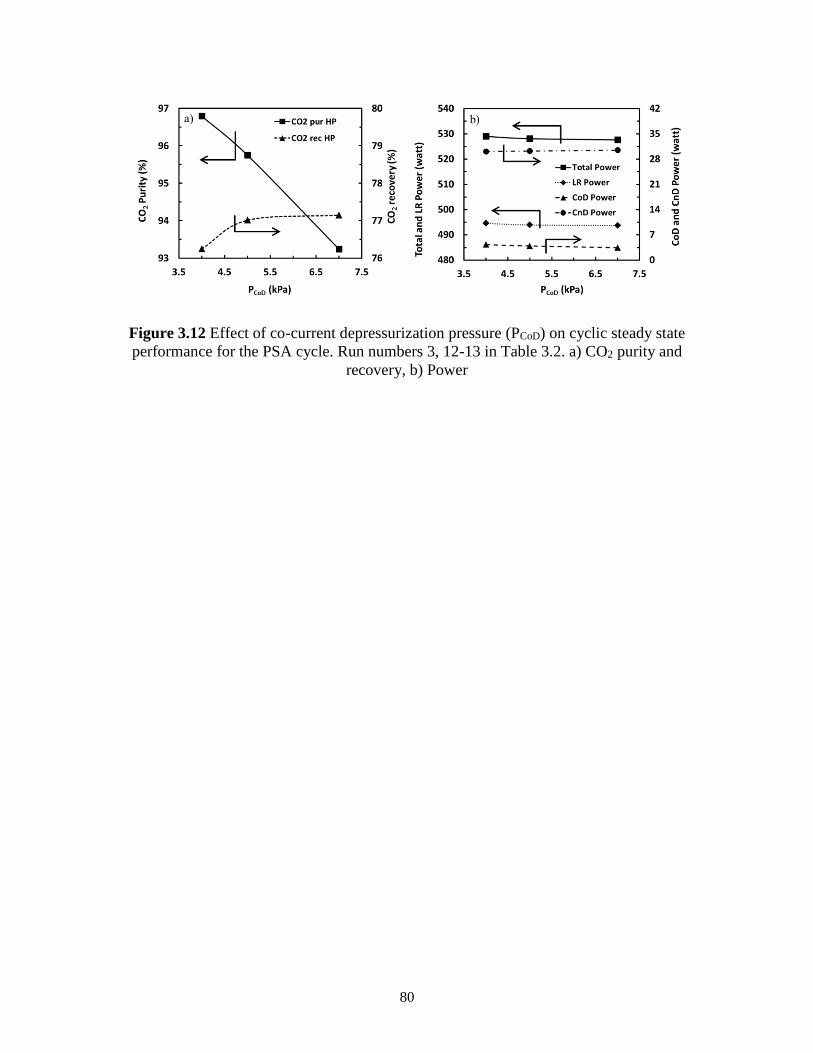
80
Figure 3.12 Effect of co-current depressurization pressure (PCoD) on cyclic steady state
performance for the PSA cycle. Run numbers 3, 12-13 in Table 3.2. a) CO2 purity and
recovery, b) Power
81
CHAPTER 4
PRELIMINARY STUDY TO DEVELOP A NEW PSA CYCLE FOR
CO2 REMOVAL AND CONCENTRATION DURING CLOSED-LOOP
HUMAN SPACE EXPLORATION MISSIONS
4.1 Summary
In this study, a new 3-bed PSA cycle sequence and schedule were developed and
studied using dynamic adsorption process simulator DAPS. This novel PSA application is
being evaluated as part of an effort to develop a next generation CO2 Removal system,
which is part of the life support system that will be used on future long duration
spaceflights. Initial results obtained with a dynamic adsorption process simulator (DAPS)
utilizing a beaded 13X zeolite. The preliminary DAPS results were then used to determine
the 3-bed experimental conditions. 3-bed experiments were carried out, accordingly. After
having the experimental results model validation has been done by DAPS.
A next generation CO2 removal system for life support is to separate, enrich and
recover CO2 from spacecraft cabin air for current and future long duration spaceflights.
The current ISS CO2 removal system that utilizes zeolite 5A in a temperature swing
adsorption (TSA) process did not operate as designed, so replacements are being
82
explored. So, the next generation air revitalization system may utilize a PSA process with
13X zeolite to remove CO2 from cabin air. Because of these reasons a new 3-bed PSA
cycle step sequence and schedule were thus conceived and studied using DAPS. Initial
simulations using the full scale flow rates in search of the bed size, light reflux ratio, cycle
time and vacuum pressure that lead to the desired performance with a 3-bed 8-step pressure
swing adsorption (PSA) cycles (0.4% CO2 from a CO2-N2 mixture) were carried out by
using 13X zeolite as an adsorbent using dynamic adsorption process simulator DAPS. The
initial DAPS results were then used to determine the 3-bed experimental conditions.
Experimental runs have been done by using a 4-bed PSA apparatus using the PSA schedule
and conditions determined from the initial simulations but restricted by conditions defined
by the unit (namely, bed size, vacuum pump capacity and vacuum level). Model validation
was carried out via running simulations with no adjustable parameters against experimental
results. The PSA sequence includes feed (F), heavy reflux (HR), co-current equalization
depressurization (Eq), co-current depressurization (CoD), counter-current depressurization
(CnD), light reflux (LR), counter-current equalization pressurization (Eq*) and Light
Product Pressurization (LPP) steps. The main goal of this chapter is to remove 6kg CO2/day
(>93% recovery) with more than 97% CO2 enrichment. Full scale feed flow rate is 570slpm
with 0.4% CO2 and 99.6%N2. As an overall conclusion of this study, large enrichments
(>90%) of CO2 from 0.4% can be achieved via adequate PSA schedule and this process
has to be designed in two stages with first stage focusing on 100% recovery of CO2 to
achieve NASA objectives.
83
4.2 PSA Cycle Description
A typical PSA process involves a cyclic process where a number of interconnected
vessels containing adsorbent/adsorbents undergo successive pressurization and
depressurization steps in order to produce a continuous stream of purified product. The
steps of the PSA cycle include feed (F), heavy reflux (HR), equalization down (E), co-
current depressurization (CoD), counter-current depressurization (CnD), light reflux (LR),
equalization up (E*) and light product pressurization (LPP). The operation of 3-bed 8-step
PSA cycle is described in Figure 4.1 along with the cycle sequence. Each row in the cycle
sequence represents all the different cycle steps a given bed undergoes over the entire cycle,
whereas each column represents which cycle step is being run by which bed at a particular
ts. The sequence of operation is developed by following a simple methodology called
graphical approach (Mehrotra et al., 2011). The unit block shown in the Figure 4.1 by a
shaded area consists of four (ts,1, ts,2, ts,3 and ts,4) unit step times where all steps are being
run by one of the three beds and the total cycle time is composed of multiple consecutive
unit blocks where the operations are repeated again and again.
The operation of first unit block, bed 1 is fed from bottom at atmospheric pressure
for a period equivalent to the sum of all unit step times (ts,1, ts,2, ts,3 and ts,4). The reason of
covering all the unit step times by feed (F) step during the operation of bed 1 is to maintain
a continuous feed flow throughout the cycle. During this operation, the preferentially
adsorbed species (in this case CO2) is captured by the adsorbent in the bed and a product
stream is collected from the top of bed 1.
84
Next, bed 2 undergoes a heavy reflux (HR) step for a period of ts,1 and ts,2 which is
ringed with heavy gas providing from another bed undergoing light reflux (LR) step. Heavy
reflux (HR) step is operated in this case at atmospheric pressure like feed step. The purpose
of having HR step in the sequence is to clean the bed and to enhance the loading of heavy
component in the column. It is important to mention that a compressor is necessary to
provide feed to HR step by pulling gas from LR step. During ts,3, bed 2 undergoes a co-
current equalization depressurization (E) step where it is co-currently blown down to
another intermediate pressure to provide gas from its light end to another bed undergoing
equalization pressurization (E*) step. Finally, bed 2 is co-currently blown down (CoD) to
another intermediate pressure for a period of ts,4. The rate of CoD is controlled by a valve
coefficient (CvCoD) in order to reduce the loss of adsorbent material due to attrition.
Finally, bed 3 is in counter-current blow down (CnD) step during ts,1, which bed 3
is depressurized counter-currently to a low pressure and he pressure at the end of this step
is controlled by a valve coefficient (CvCnD). During CnD, heavy gas is collected as product
from the bottom of bed. Next during ts,2, the bed undergoes light reflux (LR) step. In this
step, the bed is fed from light end with a portion of the light gas (LRR) coming from another
bed undergoing feed (F) step. The pressure at the end of this step is controlled by a valve
coefficient (CvLR) associated with the step. The entire heavy product collected during LR
step is sent back to HR step. The purpose of having LR step in the sequence is to regenerate
the bed. Then during ts,3, the bed is equalized with another bed from the light end to bring
the pressure up to an intermediate level. This equalization pressurization (E*) step helps to
reduce operating cost as well to improve PSA performance. Finally during ts,4, the bed is
re-pressurized to atmospheric pressure using the light gas from the light end of the bed
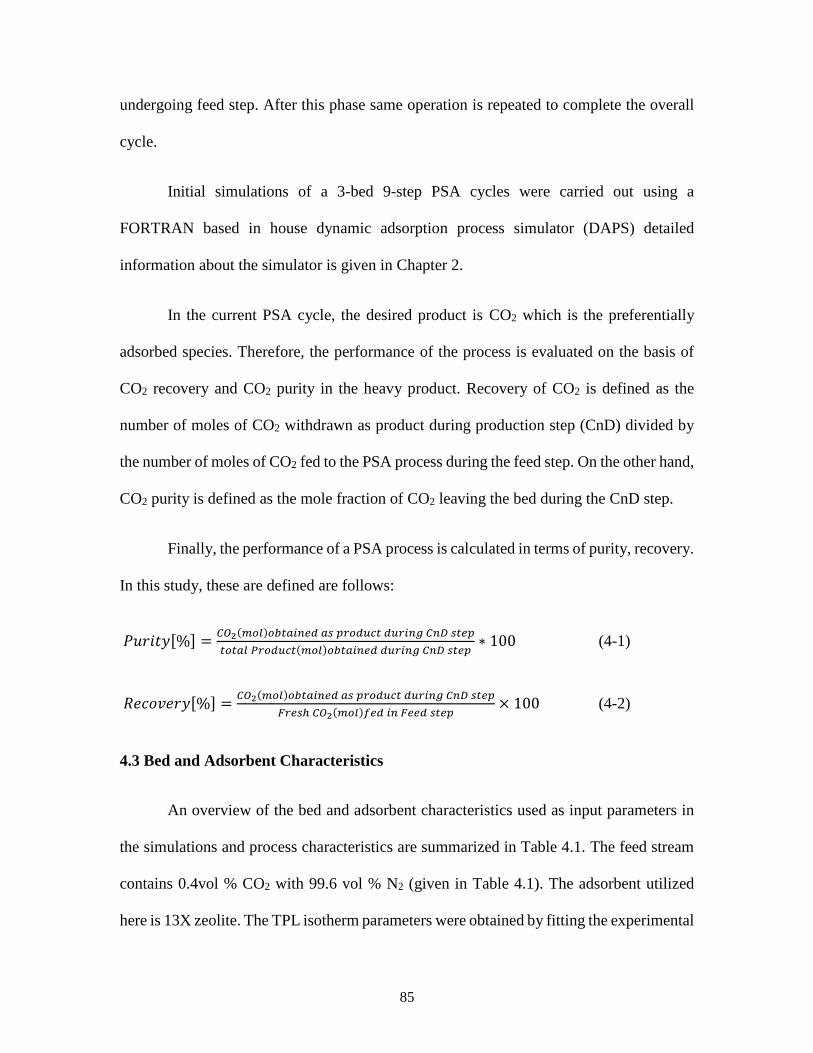
85
undergoing feed step. After this phase same operation is repeated to complete the overall
cycle.
Initial simulations of a 3-bed 9-step PSA cycles were carried out using a
FORTRAN based in house dynamic adsorption process simulator (DAPS) detailed
information about the simulator is given in Chapter 2.
In the current PSA cycle, the desired product is CO2 which is the preferentially
adsorbed species. Therefore, the performance of the process is evaluated on the basis of
CO2 recovery and CO2 purity in the heavy product. Recovery of CO2 is defined as the
number of moles of CO2 withdrawn as product during production step (CnD) divided by
the number of moles of CO2 fed to the PSA process during the feed step. On the other hand,
CO2 purity is defined as the mole fraction of CO2 leaving the bed during the CnD step.
Finally, the performance of a PSA process is calculated in terms of purity, recovery.
In this study, these are defined are follows:
𝑃𝑢𝑟𝑖𝑡𝑦[%] =𝐶𝑂2(𝑚𝑜𝑙)𝑜𝑏𝑡𝑎𝑖𝑛𝑒𝑑 𝑎𝑠 𝑝𝑟𝑜𝑑𝑢𝑐𝑡 𝑑𝑢𝑟𝑖𝑛𝑔 𝐶𝑛𝐷 𝑠𝑡𝑒𝑝
𝑡𝑜𝑡𝑎𝑙 𝑃𝑟𝑜𝑑𝑢𝑐𝑡(𝑚𝑜𝑙)𝑜𝑏𝑡𝑎𝑖𝑛𝑒𝑑 𝑑𝑢𝑟𝑖𝑛𝑔 𝐶𝑛𝐷 𝑠𝑡𝑒𝑝∗ 100 (4-1)
𝑅𝑒𝑐𝑜𝑣𝑒𝑟𝑦[%] =𝐶𝑂2(𝑚𝑜𝑙)𝑜𝑏𝑡𝑎𝑖𝑛𝑒𝑑 𝑎𝑠 𝑝𝑟𝑜𝑑𝑢𝑐𝑡 𝑑𝑢𝑟𝑖𝑛𝑔 𝐶𝑛𝐷 𝑠𝑡𝑒𝑝
𝐹𝑟𝑒𝑠ℎ 𝐶𝑂2(𝑚𝑜𝑙)𝑓𝑒𝑑 𝑖𝑛 𝐹𝑒𝑒𝑑 𝑠𝑡𝑒𝑝× 100 (4-2)
4.3 Bed and Adsorbent Characteristics
An overview of the bed and adsorbent characteristics used as input parameters in
the simulations and process characteristics are summarized in Table 4.1. The feed stream
contains 0.4vol % CO2 with 99.6 vol % N2 (given in Table 4.1). The adsorbent utilized
here is 13X zeolite. The TPL isotherm parameters were obtained by fitting the experimental
86
data and the fitted equilibrium parameters are summarized in Table 2.3. The mass transfer
coefficients for CO2, N2 and O2 were obtained experimentally from the single bed rapid
PSA apparatus and macropore mass transfer parameters are summarized in Table 2.4.
4.4 Experimental Section
4.4.1 Description of 4-Bed Pressure Swing Adsorption Apparatus
A typical schematic diagram of the PSA experimental system used in this study is
shown in Figure 4.4. The system is equipped with four adsorption beds (1, 2, 3 and 4),
seven mass flow controllers (FC), F21, F22, F23, F24, F25, F31, F32 in Figure 4.4, three
mass flow meters (FM), F11, F12, F13 in Figure 4.4, one light product tank, two heavy
product tanks, eighteen thermocouples (nine connected with first three beds and seven with
last bed, one with light product tank and one with large heavy product tank), seven pressure
transducers (four of them are coupled with four beds and the remaining two are with light
product tank and large heavy product tank, and one with vacuum pumps), vacuum pumps
and valves (1 to 50). In lower part of the columns, the line connected with the valves 6, 12,
18 and 24 is used to provide feed to the adsorption columns whereas the lines coupled with
valves 5, 11, 17, 23 and valves 4, 10, 16, 22 are used as counter-current blow down/light
reflux (CnD/LR) and heavy reflux (HR) lines, respectively. Similarly in the upper trend of
the columns, the line incorporated with the valves 1, 7, 13 and 19 is used as the product
line during feed step, the one coupled with the valves 38, 39, 40, 41, and 25 is for the
product line during heavy reflux (HR) step and the line connected with the valves 3, 9, 15,
21 and 28 is used for light product pressurization (LPP) as well as light reflux (LR) steps
by closing 28 while opening 27. In addition, the current system has the facility to operate
87
the PSA cycle by incorporating equalization (EQ) step which is accomplished by using the
line connected with the valves 2, 8, 14 and 20, and finally the line with valve 49 in addition
to the valves 2, 8, 14, 20 is used for co-current blow down (CoD).
The thermocouples used in the experimental set-up shown in Figure 4.4 are K-type
thermocouples which are used to measure the centerline temperatures of the beds as well
as the temperatures of the light and heavy product tanks. In each bed, a series of three
thermocouples are distributed axially throughout the bed which shows the bed temperature
profiles at one quarter, half way and three quarters into the bed from the feed end. In
addition, a fifteenth thermocouple which is not shown in the schematic diagram is used to
measure the ambient temperature. Also, a total of three heaters coupled with each
adsorption bed provided the facility of heating the bed uniformly. The power input to all
the heaters is controlled by using twelve variable autotransformers (range 0 to 120/140V,
type 3PN1O1O). The signals from all the thermocouples are sent to the signal conditioner
as input to the computer which displays real time temperature as the system is running
(Bhadra 2012).
The mass flow controllers and mass flow meters used in the system are supplied by
Tylan General/Brooks/MKS which have the ability to measure and/or control the mass
flow rates of the gas accurately and reliably. All the meters and controllers are digitally
controlled by two DX-5 Digital Power Supply instruments from UNIT instruments, Inc
and one Hasting Power Supply-Model 200. Each unit of this instrument from UNIT
instruments, Inc has five individual channels (eight of them have been using) and Hasting
Power Supply unit has two. Each mass flow controller channel controls and displays the
set point and actual flow for the channel as a percentage of full scale units. All the seven
88
pressure transducers used as pressure sensors are supplied by Omega Dyne Inc. The outputs
from all the pressure transducers are converted to absolute pressures which are displayed
on the screen of the computer. The valves used for the system are all from Swagelok which
are opened or closed depending on the duration of each step of a cycle. Valves 1 through
26 are Swagelok® U series bellows-sealed valves which provide enhanced reliability,
versatility, and safety with a secondary containment system that prevents leaks to
atmosphere even if the primary seal fails. These valves have a very high operating
temperature and pressure (343 oC and 2500 psig) and are operated on double actuation
mode (opened and closed by air). On the other hand, the rest of the valves are operated on
single actuation mode (opened by air but closed by spring) except the valves with handle
which are metering valves. The pressure and temperature ratings of these valves are about
3220 psig and 65 oC, respectively. It is worthwhile to note that all the instruments and
devices are controlled by a single CPU which is used to save the outputs from all the
devices, if necessary (Bhadra 2012).
The system is designed in such a way that provides the facility to measure the feed
(F), light product (LP) during feed, light product (LP) during heavy reflux, mixed light
product (LP), heavy product (HP) and heavy reflux (HR) concentrations using a 6-port
valve manufactured by Swagelok. This valve is connected to a residual gas analyzer
(RGA), a small and usually rugged mass spectrometer, which is basically a vacuum
instrument that operates near 10-6 mbar pressure. At high or atmospheric pressure, the
aperture assembly of RGA is insufficient to reduce the pressure while maintaining the
response time. In order to facilitate the sampling at this pressure, a pressure reduction
device which is actually a capillary is coupled with the RGA. The length of the capillary is
89
selected on a trial and error basis in order to maintain fast response time (Bhadra 2012).
Back and front views of 4-Bed PSA apparatus are shown in Figure 4.5.
LabVIEW program controls the valves and recording pressures, temperatures, and
flowrates from different locations of the PSA experimental system. Front Panel of
LabVIEW Program is shown in Figure 4.6. MS Excel file is being used for input file in
which user can define PSA step properties by deciding flowrates, timing, and on/off
position of each valve.
4.4.2. PSA Cycle Description for experiments
PSA cycle steps used in the experiments consist of feed (F), idle (I), heavy reflux
(HR), equalization down (E), co-current depressurization (CoD), counter-current
depressurization (CnD), light reflux (LR), equalization up (E*) and light reflux
pressurization (LPP). The operation of 3-bed 8-step PSA cycle is described in Figure 4.1
along with the cycle sequence. As shown in the figure, the cycle sequence is divided into
9 unequally long unit step times of length. The flow schematic of the unit block depicted
in gray in cyclic schedule is also described in the figure. The other three unit blocks are
just the repetition of the same steps but with different sequence. Therefore, it is noteworthy
to describe the cyclic operation of the present cycle more specifically on the basis of the
unit block. It is important to mention that only bed number 2, 3, and 4 have been used for
3-bed 8-step PSA experiments from available in-house 4-bed PSA experimental set-up,
shown in Figure 4.4.
The adsorption beds 1, 2, 3 and 4 are filled with Zeolite 13X adsorbent. Bed, adsorbent
properties for the experiments and model validation were given in Table 4.1. The adsorbent
90
was prepared for cycling by first regenerating with heating under continuous upward
Helium flow (~ 0.1 SLPM) up to 350 oC at 101.325kPa and the regenerated (i.e., dry)
weight of the adsorbent was obtained from the regeneration data. The adsorbent beds were
further regenerated in-situ, under vacuum and continuous Helium flow (~0.1 SLPM) by
increasing the temperature around 350oC via 8 band heaters connected around the beds
prior to each experiment. At the end of regeneration period, the beds were cooled down to
the room temperature. The feed gas mixture (0.4% CO2 in N2) has been obtained by using
two mass flow controllers for CO2 and N2 separately. These feed stream gases are
introduced to the upstream of bed 1 (z/L = 0) at high pressure (PH) through opened valves
12 and 7 and is allowed to pass through for a duration of ts,1 s to have preferentially
adsorbed species (CO2) adsorbed and the high pressure product stream enriched with less
strongly adsorbed species (N2) leaves the column from the other end (z/L = 1.0) of the bed
which is sent to the light product tank through needle valves N-9 and N-10. At this
moment, bed 2 is under idle step (I) when it is separated from rest of the processes by
closing all the valves incorporated with the bed 2. During this operation, ts,1, beds 3
undergoes countercurrent blow down step. During this step, one end of the column is closed
while the other is exposed to a vacuum pump. Valves 19, 20, 21, 22, 24, 41, and 48 are
kept closed and the bed is depressurized to a low pressure (PL) through opened valve 23
and all the desorbed gas is sent to the heavy product tank. As a result of pressure decrease,
CO2 from the adsorbent gets desorbed and exits the bed. At the end of the operation in first
unit step time of ts,1 s, beds 1 undergoes feed step which is conducted according to the
procedure described above for duration of next unit step time of ts,2 s. During this operation
time, ts,2, bed 2 undergoes light reflux step (LR) by opening valve 23, 21, and 28 while
91
valves 19, 20, 41, 22, and 24 are kept closed. Bed 3, light reflux step operated at PLR to
facilitate desorption of CO2. This light reflux step helps to clean the bed from heavy product
by sending light product gases; therefore, breaking through of heavy gases from light end
can be prevented by the help of light reflux step. The CO2 rich effluent from the light reflux
purge step enters the heavy reflux step. Bed 2 undergoes this heavy reflux step by closing
valves 13, 14, 15 17, 18, and 47 while opening valves 17, 40, and 25. In heavy reflux (HR)
step, the blow down gas emanating from this light reflux step is fed to the feed end of the
column at high pressure (PH) usually. The purpose of this step is to increase the loading of
heavy component in the solid phase. Also, undesirable light gas present in the void space
is flushed out of the bed as it is replaced with pure CO2. These factors cumulatively help
to increase the enrichment of heavy component during CnD step. During the operation of
the next unit step time of the unit block, ts,3, bed 1 is at feed step and beds 2 and 3 are at
equalization step. The operating procedure of feed step is the same to the procedure
described above. With valves 16, 17, 18, 13, 40, 15 of bed 2, valves 22, 23, 24, 19, 41, 21
of bed 3 closed and the remaining valves 14 and 20 of beds 2 and 4 opened, the two beds
are connected through their product ends to equalize pressure. In this case, beds 2 and 3
are at co-current equalization pressurization (E) and equalization depressurization (E*),
respectively. This equalization pressurization step helps to save energy because the gas,
partially depleted of strongly adsorbed species from high pressure bed is used to pressurize
the other bed at low pressure to an intermediate pressure. In the last unit step, ts,4 bed 1
again undergoes feed step with the same to the procedure described above. Continuous
feed flow during entire PSA cycle has been achieved with this way. Bed 2 is at co-current
depressurization step while bed 1 is at feed step. In the CoD step, valves 16, 17, 18, 13, 40,
92
15 closed and the remaining valves 14 and 49 opened. During CoD step, bed 2 goes from
an atmospheric pressure to an intermediate pressure. The main purpose of having CoD step
in PSA cycle is to purity and recovery of heavy product by getting rid of the light product
gases from light end. Bed 3 is at light product pressurization (LPP) step during last unit
step time of unit block. The light product pressurization (LPP) step is conducted on bed 3
by closing valves 22, 23, 24, 19, 20, 41 and 27 while opening valves 21 and 28. The light
product from light product tank is used for LPP. The purpose of incorporating light product
pressurization (LPP) step is to push the concentration wave towards the feed end of the
column thereby, enhancing the performance of the process. Similarly, the consecutive
operation in each bed of corresponding unit block for particular step is repeated until the
periodic steady state is reached. With setting a 6-port valve, the transient as well as periodic
steady state concentration profiles of light and heavy products can be monitored by using
RGA. An in-house built LabView program and National Instruments data acquisition and
control system were used to control valve operation, cycle sequencing, and mass flow
controller and to monitor the temperature, pressure and flow rate profiles with time.
Depending on the value of parameters and length of step change in parameter values from
previous steady state condition, huge numbers of cycles were required to reach a new
periodic steady state. To decrease the number of cycle to reach steady state because of
having long cycle time, all 4 experiments have been started with 10% CO2 saturated bed.
Initial simulations show that starting with clean bed or saturated bed has no effect on the
process performance in terms of purity and recovery of CO2 in the heavy product and N2
in the light product. The periodicity was verified by observing the steady temperature
93
profiles of all thermocouples at different locations of the bed as well as by monitoring the
steady heavy and light product concentrations profiles by RGA.
4.5. Result and Discussion
4.5.1 Initial Simulations Results
A parametric study was conducted to evaluate the effects of various parameters,
especially HR/LR time, on the cyclic steady state PSA performance. The conditions of
initial simulations have been run in this study and all the initial simulation process
performances were given in Table 4.1. In the initial simulations, the varied conditions
include HR/LR/F step time (thus cycle time), two different light reflux ratios (LRR),
counter-current depressurization pressure (PCnD) and time, light reflux pressure (PLR), and
co-current depressurization pressure (PCoD). It can be seen from the Table 4.2 that added
HR/LR time x has important role in CO2 concentration in HP for run numbers 1, 5, 9, 13,
17. That effect can be explained by the bed profiles at the end of HR step for these runs,
shown in Figure 4.2. From the figure, it can be easily seen that CO2 front in the bed is
moving through the end of bed by increasing x. Hence, the purity shows an increasing
trend with increasing x. It is important to notice that other parameters such as light reflux
ratio (LRR), counter-current depressurization pressure (PCnD) and time, light reflux
pressure (PLR), and co-current depressurization pressure (PCoD) have not much effect on
purity of CO2 (still around 90%) in heavy product while have negative effect on CO2
recoveries (drop to 60%) in heavy product beside HR/LR time parameter. However in the
overall picture, modelling results show that one gets close to the desired performance,
94
which is Run#18 in Table 4.2. Run #18 has been chosen as a base case for the experiments.
However, vacuum pressures for the flows needed are prohibitive in experimental set up.
4.5.2 Experimental Results
Four experiments were conducted on the 3-bed PSA system to reach the overall
process performance for closed-loop human space exploration missions. In those four
experiments, flow and pressures adjusted to smaller beds while maintaining PSA schedule
and throughput, shown in Table 4.4. The main difference between experiments and the
initial simulations is the final pressure of light reflux step (PLR). PLR was the same with
PCnD, which is lowest pressure (PL), in the initial simulations, while it is little bit higher
than the lowest pressure in the experiments. The reason of that situation is mainly because
of having high flow rates during light reflux step, thus the vacuum pump cannot reach the
lowest pressure during the light reflux step that it can reach during the counter-current
depressurization step because there was no flow feeding the bed.
4.5.2.1. PSA Cycle Process Performance Indicators
Once the system was reached to periodic steady state for a particular set of
operating conditions, all the temperature, pressure, flow rate, heavy product and light
product profiles were captured to evaluate the periodic state performance indicators. The
process performance indicators for the PSA process were evaluated on the basis of
enrichment, recovery and throughput. The overall process performance was judged in
terms of the purity and recovery of CO2 in the heavy product and N2 in the light product.
The CO2 purity was defined as the average mole fraction of CO2 in the heavy product. CO2
recovery was defined as the moles of CO2 in the heavy product divided by the moles of
95
CO2 fed to the process cumulatively during the feed (Eqn 1, 2). The enrichment and
recovery of both heavy and light components were calculated from the concentration
profiles captured by RGA after the steady state situation was reached. After every set of
experiment, the RGA was trained with running different CO2-N2 standards namely 0, 0.2,
0.5, 1, and 2 % CO2 and from 10% CO2 to 100% CO2 with increment of 10% by using two
mass flow controllers for CO2 and N2.
A total of four runs were carried out to study the effect of various process
parameters. The parameters studied include the heavy reflux/light reflux, thus total cycle
time and CnD time, light reflux ratio, feed flow rate, PCoD and PCnD. The conditions used
during each run (E1 to 4) are shown in Table 4.4. The process performance in terms of
purities and recoveries of CO2 in the heavy product and N2 in the light product is shown in
Table 4.5. From Table 4.5, 3-bed 9-step PSA process only recovers ~ 50% CO2 at original
model throughputs but higher LR pressures while it can recover ~ 80 % CO2 at half of the
original model throughputs. In addition, it is quite significant that the system is able to
enrich CO2 from 0.4 to ~ 90%. Therefore, this process will be focused in fully recovering
CO2 as a first of a two-step process while enriching less CO2 and utilizing less power for
vacuum.
Temperature and Pressure histories of the experiments have been shown in Figure
4.7 and 4.8, respectively. From temperature history of Experiment 4, Figure 4.7, it can be
easily seen that major temperatures rises during HR step (35-65) minutes and during this
step CO2 front reaches anywhere between 60.75% and 73.41% of the bed. Pressure history
during one entire cycle (a) and a zoomed-in view of pressure when equalization down,
CoD, CnD steps (b) and when light reflux, equalization up and light product pressurization
96
steps (c) have shown in Figure 4.8. Small drops at the upper part of the pressure are due
to the idle step. After evaluating the recoveries and enrichments of all the components in
both heavy and light ends, a material balance calculation was performed to calculate the
error associated with the system. In each case, the resulting total error was generally less
than 3% for either component. This magnitude of error was considered acceptable for such
a process.
4.6. Model Validation
The DAPS model was validated against experimental data obtained from
Experiment 1-4. Figure 4.9 shows the experimental data and the model predictions for the
pressure profiles at periodic state for the entire PSA cycle (top) and zoomed-in (left, right)
which encompasses 9 cycle steps namely feed step, idle step, heavy reflux step,
equalization down step, counter-current blowdown step, light reflux purge step,
equalization up step and a pressurization step. The dashed line indicates the experimental
data whereas the solid line shows the model predictions. The Model was adjusted to match
the experimental pressures by changing Cvs of valves. From the figure it can be easily seen
that model and experimental pressure history overlaps for feed, heavy reflux, equalization
down, CnD, and light reflux steps while having little bit difference in equalization up and
light product pressurization steps. However, in LPP step the final bed pressure of model at
the end of step is the same with experiment. Figure 4.10 shows the temperature profiles at
periodic state for seven different thermocouples in the bed for experiment 4. The black
solid line indicates the experimental data whereas the gray solid line shows the model
predictions. As Figure 4.10 shows, the higher concentration wave front reaches
thermocouple T-7 in experiment but T-6 in model validation. Thus, the front’s location for
97
experiment is 86.07% in the bed and for model is anywhere between 73.41% and 86.07%
in the bed. The main reason having higher maximum temperature in the model than the
experiment is having only one lumped heat transfer coefficient with only one energy
balance equation for all gas and solid phases, and the wall. Thus, the model was able to
mostly predict the temperature profiles and position of the higher concentration front
during the Heavy Reflux step for the entire PSA cycle of experiments without any fitting
parameters (kinetic and thermodynamic) and for a wide range of concentrations (0.4-90.0%
CO2). The CO2 purity and CO2 recovery in the heavy component and N2 recovery in the
light component calculated by DAPS is compared to the experimental results in Table 4.6.
The results show a close agreement between experiment and model without any fitting
parameters (kinetic and thermodynamic) and for a wide range of concentrations (0.4-90.0%
CO2).
The differences between experiment and model performances might be because of
not exactly reaching steady state in the experiments due to long cycle times. Model results
give more meaningful results than experiments based on the theory. More detailed
explanation is in the following: (a) the first comparison is between E1 and E2: the
difference is the CnD step time, tCnD, thus PCnD, by decreasing heavy reflux time at constant
cycle time. Recovery of heavy product, here is CO2, increases for both experiments and
model, which is expected because more CO2 is coming out from the bed during the CnD
step due to longer time. However, purity of heavy product is decreasing in the model results
while increasing in the experimental results. The expectation is a decrease in purity because
the pump is pulling more gases, CO2 and also more N2 and O2, to reach the lower pressure
with having less time for heavy reflux step. That less time in heavy reflux step causes less

98
CO2 saturation in the bed, which means the bed, is having less CO2. Since the bed is having
less CO2 to reach the lower pressure light products are also coming out from the bed. That
dilutes the heavy product with light product, which causes a decrease in purity. Bed profiles
at end of HR step of modelling results for experiments 1 through 4 have shown in Figure
4.11. As it can be seen from the figure CO2 front at the end of the heavy reflux step is
moving backward by increasing CnD step time, which is an another prof of a decrease in
purity; (b) Comparison of E1 and E3: the difference is the CnD step time and heavy reflux
step time. Recovery of heavy product decreases for both experiments and model because
most probably the bed is losing some portion of CO2 during feed step due to having more
CO2 saturated bed at the end of heavy reflux step by the time increases. On the other hand,
there is again a conflict between model and experimental results. Purity of heavy product
is increasing in the model results while decreasing in the experimental results. From Figure
4.11, it can be seen that CO2 front at the end of HR step is moving forward through the end
of the bed, which causes an increase in purity of CO2. Therefore, model results seem more
reliable than experiments because of not reaching the steady state in the experiments; (c)
next comparison is between E1 and E4, with the difference having half feed flow. Recovery
of heavy product increases for both experiments and model because having less feed flow
rates causes CO2 to not breaking through from light end, so an increase in recovery. Purities
for E1 and E4 are almost constant for both modeling and experimental result. From the
Figure 4.11, since CO2 front at the end of HR step for the modeling results are the same
for experiment 1 and 4, purity stays almost constant.
99
Therefore, the model behind DAPS was validated and will now be used to simulate
a variety of PSA cycles and process conditions for removal and concentrating CO2 during
closed-loop human space exploration missions.
4.7. Conclusion
The practical feasibility of carbon dioxide separation and recovery from N2-CO2
mixtures was demonstrated by means of a new PSA cycle by using an in-house process
simulator and experimentally by using 4-bed PSA experimental set-up. Thereafter, model
validation has been done with DAPS, in house simulator. A 3-bed 8-step PSA system was
configured and utilized to study concentration and separation of CO2 from N2 (0.4% CO2,
99.6% N2) using Zeolite 13X as adsorbent. PSA Cycle included feed (F), idle (I), heavy
reflux (HR), co-current equalization depressurization (Eq), co-current depressurization
(CoD), counter-current depressurization (CnD), light reflux (LR), counter-current
equalization pressurization (Eq*) and Light Product Pressurization (LPP) steps. Based on
initial modeling and experimental efforts, a 3-bed PSA system was developed for metabolic
CO2 removal from spacecraft cabin air. Initial simulation runs with the new PSA cycle
were able to produce carbon dioxide with purities more than 97% and recoveries more than
90%. Those initial simulation results show that added LR time, X, has important role in
CO2 concentration in HP, however, vacuum pressures for the flows needed are prohibitive.
Some experiments have been done with 4-bed PSA experimental set up with the help of
initial simulation runs. Flow and pressures adjusted to smaller beds while maintaining PSA
schedule and throughput. Experimental results pointed that process only recovers around
50% CO2 at original model throughputs but higher LR pressures while recovery of CO2 is
around 80 % at half of the original model throughputs. On the other hand it is quite
100
significant that the system is able to enrich CO2 from 0.4 to around 90%. Model validation
has been done via running simulations with no adjustable parameters against experimental
results. The Model was adjusted to match the experimental pressures by changing Cvs of
valves of pressure changing steps. Results show excellent match between modeling and
experiments without any fitting parameters (kinetic and thermodynamic) and for a wide
range of concentrations (0.4-90.0% CO2). As an overall conclusion, large enrichments
(>90%) of CO2 from 0.4% can be achieved via adequate PSA Schedule and this process
has to be designed in two stages with first stage focusing on 100% recovery of CO2 to
achieve NASA objectives. Overall, results indicate that objectives cannot be achieved in
one stage and that future focus should be given toward the complete recovery of CO2 with
more modest enrichments (60-80%) from stage one, with a subsequent stage 2 to reach the
desired performances.
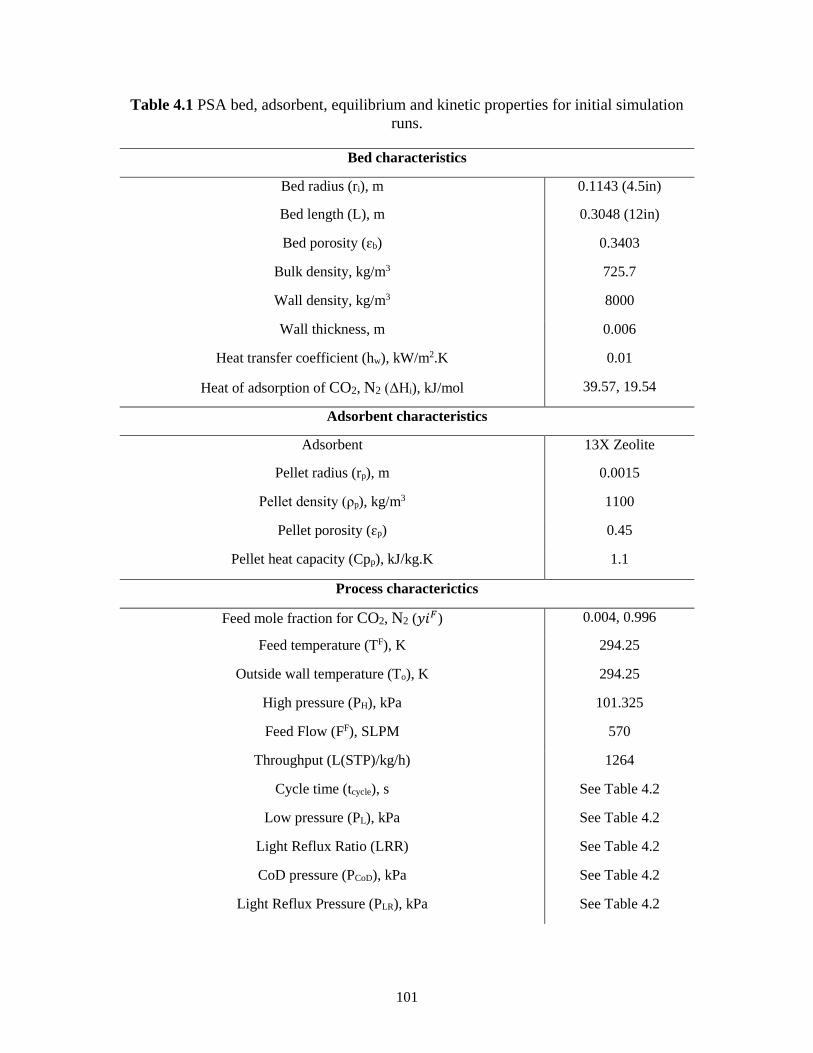
101
Table 4.1 PSA bed, adsorbent, equilibrium and kinetic properties for initial simulation
runs.
Bed characteristics
Bed radius (ri), m 0.1143 (4.5in)
Bed length (L), m 0.3048 (12in)
Bed porosity (ɛb) 0.3403
Bulk density, kg/m3 725.7
Wall density, kg/m3 8000
Wall thickness, m 0.006
Heat transfer coefficient (hw), kW/m2.K 0.01
Heat of adsorption of CO2, N2 (ΔHi), kJ/mol 39.57, 19.54
Adsorbent characteristics
Adsorbent 13X Zeolite
Pellet radius (rp), m 0.0015
Pellet density (ρp), kg/m3 1100
Pellet porosity (ɛp) 0.45
Pellet heat capacity (Cpp), kJ/kg.K 1.1
Process characterictics
Feed mole fraction for CO2, N2 (𝑦𝑖𝐹) 0.004, 0.996
Feed temperature (TF), K 294.25
Outside wall temperature (To), K 294.25
High pressure (PH), kPa 101.325
Feed Flow (FF), SLPM 570
Throughput (L(STP)/kg/h) 1264
Cycle time (tcycle), s See Table 4.2
Low pressure (PL), kPa See Table 4.2
Light Reflux Ratio (LRR) See Table 4.2
CoD pressure (PCoD), kPa See Table 4.2
Light Reflux Pressure (PLR), kPa See Table 4.2
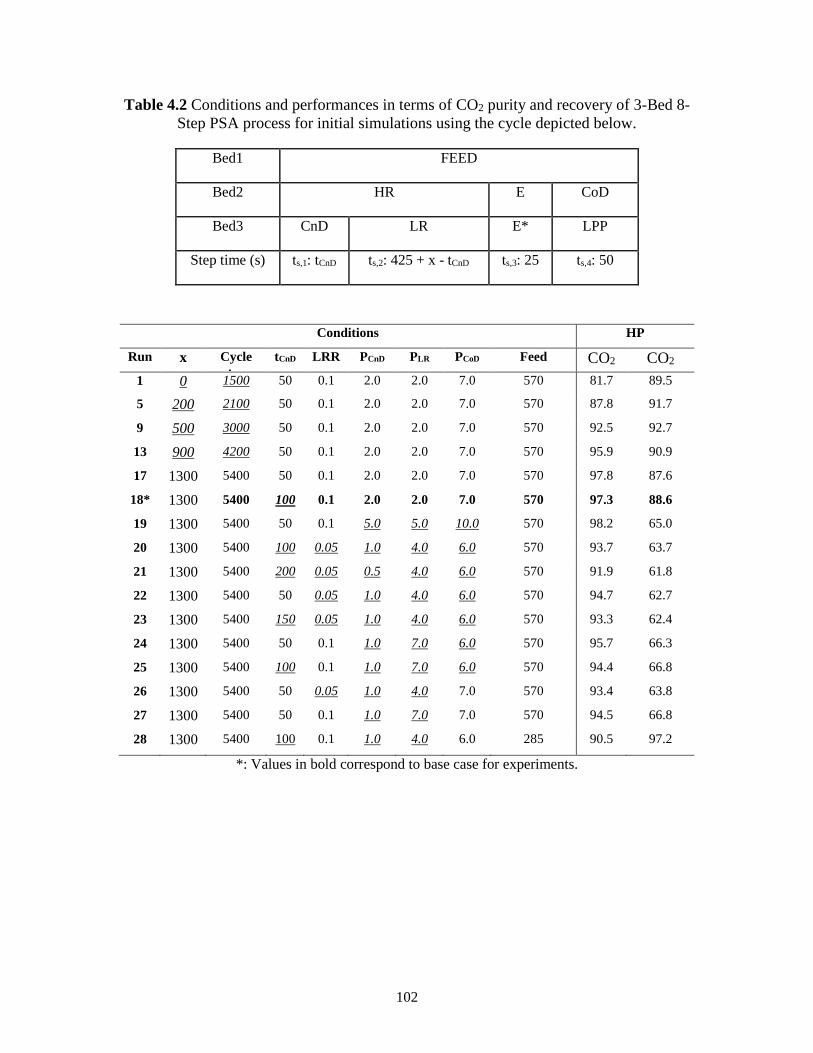
102
Table 4.2 Conditions and performances in terms of CO2 purity and recovery of 3-Bed 8-
Step PSA process for initial simulations using the cycle depicted below.
Bed1 FEED
Bed2 HR E CoD
Bed3 CnD LR E* LPP
Step time (s) ts,1: tCnD ts,2: 425 + x - tCnD ts,3: 25 ts,4: 50
Conditions HP
Run
#
x
(s)
Cycle
time
(s)
tCnD
(s)
LRR PCnD
(kPa)
PLR
(kPa)
PCoD
(kPa)
Feed
(slpm)
CO2
Purity
(%)
CO2
Recovery
(%)
1 0 1500 50 0.1 2.0 2.0 7.0 570 81.7 89.5
5 200 2100 50 0.1 2.0 2.0 7.0 570 87.8 91.7
9 500 3000 50 0.1 2.0 2.0 7.0 570 92.5 92.7
13 900 4200 50 0.1 2.0 2.0 7.0 570 95.9 90.9
17 1300 5400 50 0.1 2.0 2.0 7.0 570 97.8 87.6
18* 1300 5400 100 0.1 2.0 2.0 7.0 570 97.3 88.6
19 1300 5400 50 0.1 5.0 5.0 10.0 570 98.2 65.0
20 1300 5400 100 0.05 1.0 4.0 6.0 570 93.7 63.7
21 1300 5400 200 0.05 0.5 4.0 6.0 570 91.9 61.8
22 1300 5400 50 0.05 1.0 4.0 6.0 570 94.7 62.7
23 1300 5400 150 0.05 1.0 4.0 6.0 570 93.3 62.4
24 1300 5400 50 0.1 1.0 7.0 6.0 570 95.7 66.3
25 1300 5400 100 0.1 1.0 7.0 6.0 570 94.4 66.8
26 1300 5400 50 0.05 1.0 4.0 7.0 570 93.4 63.8
27 1300 5400 50 0.1 1.0 7.0 7.0 570 94.5 66.8
28 1300 5400 100 0.1 1.0 4.0 6.0 285 90.5 97.2
*: Values in bold correspond to base case for experiments.
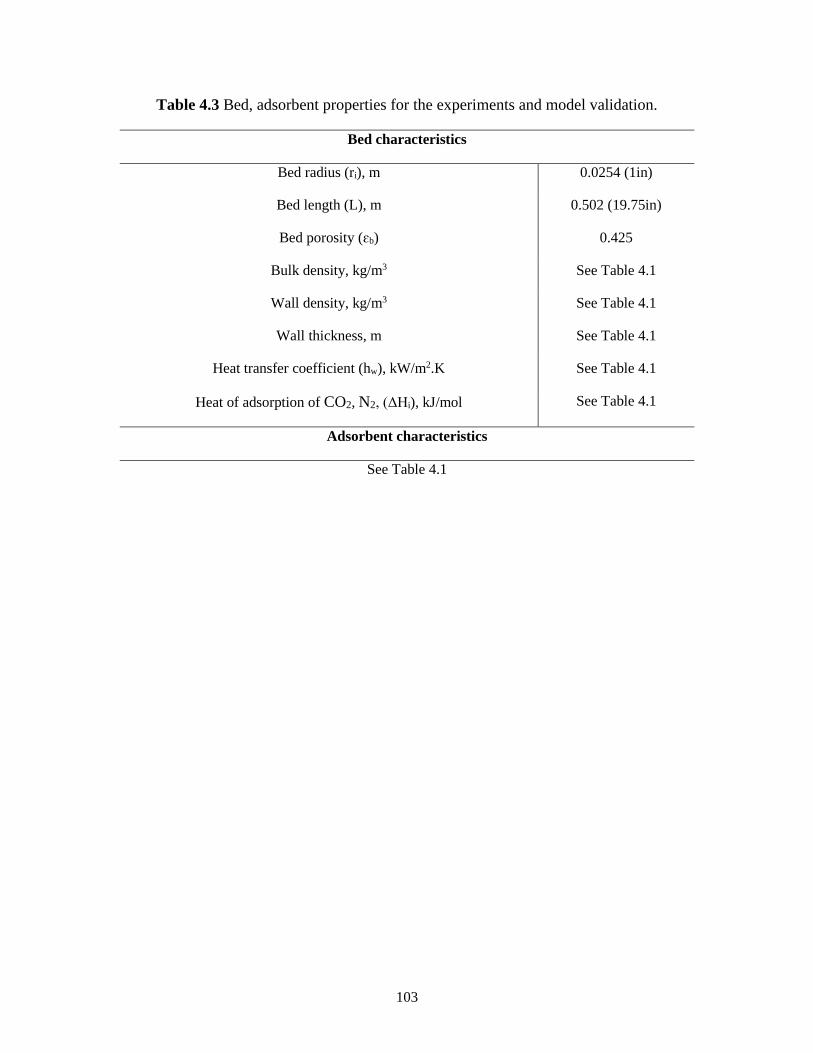
103
Table 4.3 Bed, adsorbent properties for the experiments and model validation.
Bed characteristics
Bed radius (ri), m 0.0254 (1in)
Bed length (L), m 0.502 (19.75in)
Bed porosity (ɛb) 0.425
Bulk density, kg/m3 See Table 4.1
Wall density, kg/m3 See Table 4.1
Wall thickness, m See Table 4.1
Heat transfer coefficient (hw), kW/m2.K See Table 4.1
Heat of adsorption of CO2, N2, (ΔHi), kJ/mol See Table 4.1
Adsorbent characteristics
See Table 4.1
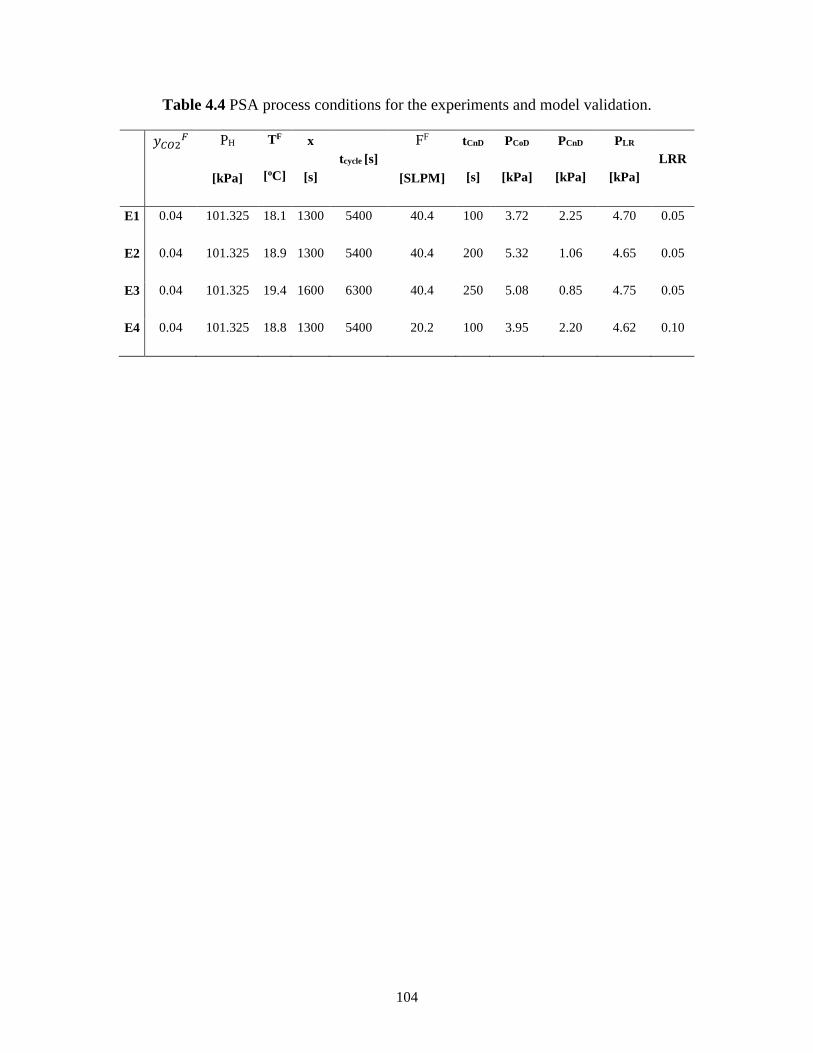
104
Table 4.4 PSA process conditions for the experiments and model validation.
𝑦𝐶𝑂2𝐹 PH
[kPa]
TF
[oC]
x
[s]
tcycle [s]
FF
[SLPM]
tCnD
[s]
PCoD
[kPa]
PCnD
[kPa]
PLR
[kPa]
LRR
E1 0.04 101.325 18.1 1300 5400 40.4 100 3.72 2.25 4.70 0.05
E2 0.04 101.325 18.9 1300 5400 40.4 200 5.32 1.06 4.65 0.05
E3 0.04 101.325 19.4 1600 6300 40.4 250 5.08 0.85 4.75 0.05
E4 0.04 101.325 18.8 1300 5400 20.2 100 3.95 2.20 4.62 0.10
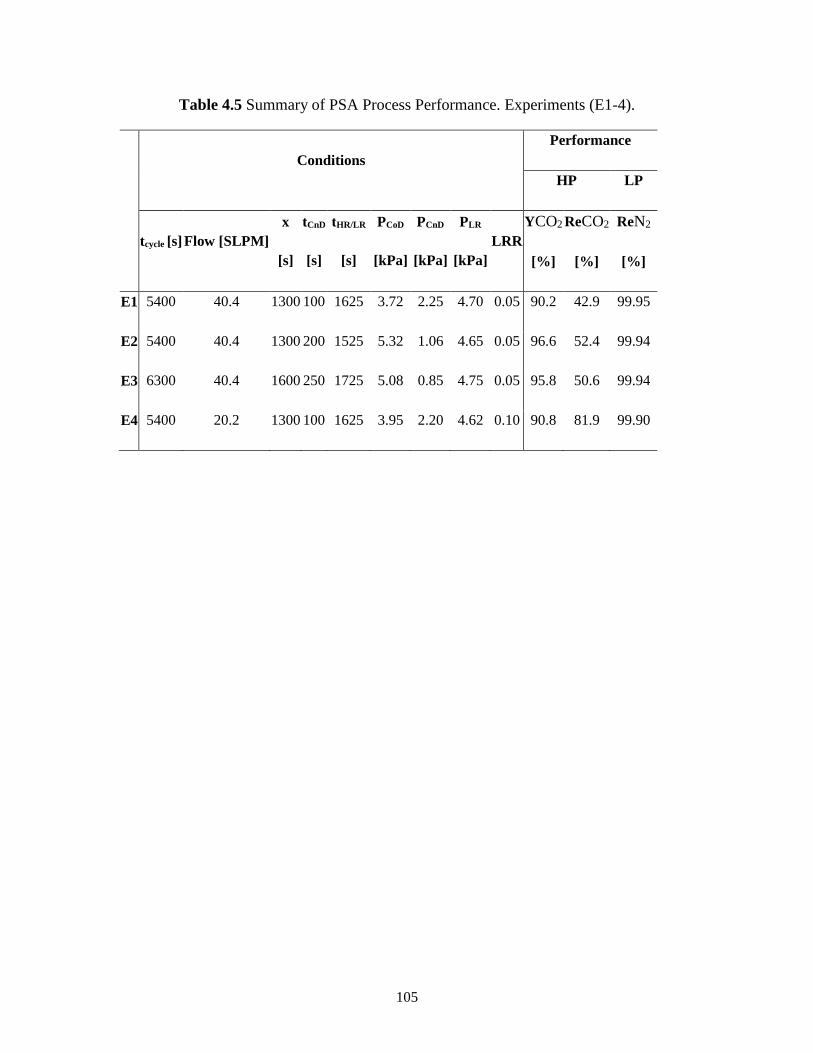
105
Table 4.5 Summary of PSA Process Performance. Experiments (E1-4).
Conditions
Performance
HP LP
tcycle [s] Flow [SLPM]
x
[s]
tCnD
[s]
tHR/LR
[s]
PCoD
[kPa]
PCnD
[kPa]
PLR
[kPa]
LRR
YCO2
[%]
ReCO2
[%]
ReN2
[%]
E1 5400 40.4 1300 100 1625 3.72 2.25 4.70 0.05 90.2 42.9 99.95
E2 5400 40.4 1300 200 1525 5.32 1.06 4.65 0.05 96.6 52.4 99.94
E3 6300 40.4 1600 250 1725 5.08 0.85 4.75 0.05 95.8 50.6 99.94
E4 5400 20.2 1300 100 1625 3.95 2.20 4.62 0.10 90.8 81.9 99.90
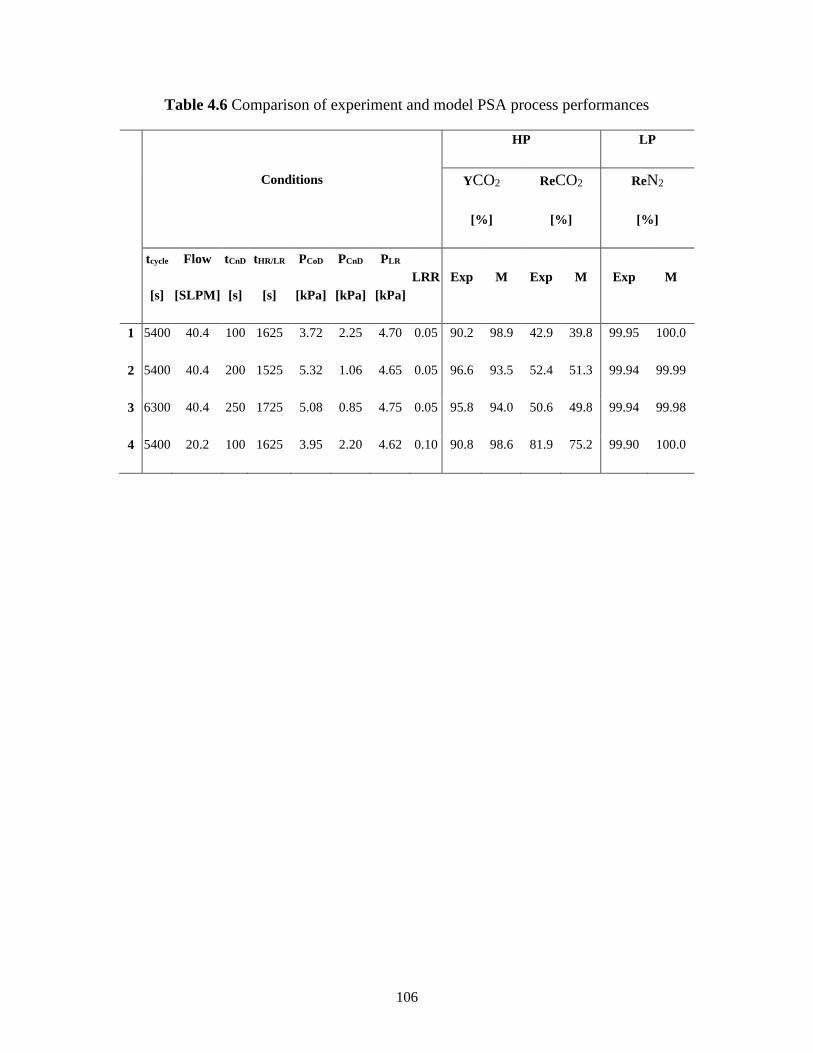
106
Table 4.6 Comparison of experiment and model PSA process performances
Conditions
HP LP
YCO2
[%]
ReCO2
[%]
ReN2
[%]
tcycle
[s]
Flow
[SLPM]
tCnD
[s]
tHR/LR
[s]
PCoD
[kPa]
PCnD
[kPa]
PLR
[kPa]
LRR Exp M Exp M Exp M
1 5400 40.4 100 1625 3.72 2.25 4.70 0.05 90.2 98.9 42.9 39.8 99.95 100.0
2 5400 40.4 200 1525 5.32 1.06 4.65 0.05 96.6 93.5 52.4 51.3 99.94 99.99
3 6300 40.4 250 1725 5.08 0.85 4.75 0.05 95.8 94.0 50.6 49.8 99.94 99.98
4 5400 20.2 100 1625 3.95 2.20 4.62 0.10 90.8 98.6 81.9 75.2 99.90 100.0
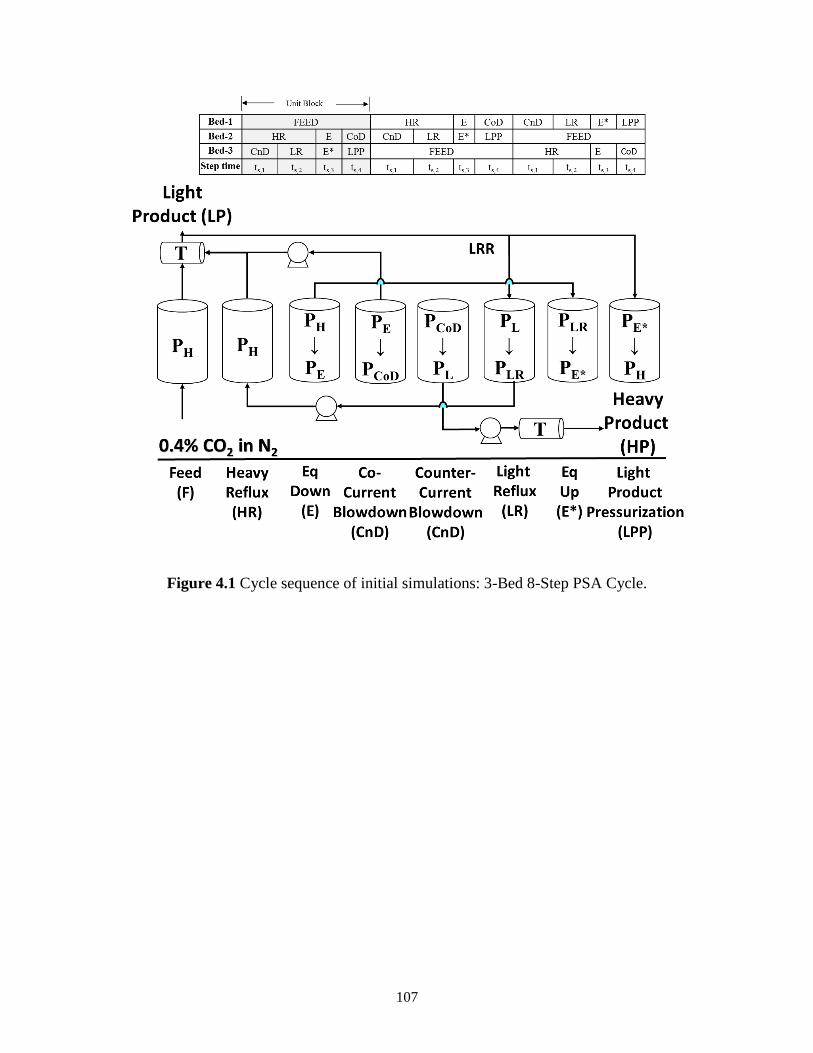
107
Figure 4.1 Cycle sequence of initial simulations: 3-Bed 8-Step PSA Cycle.
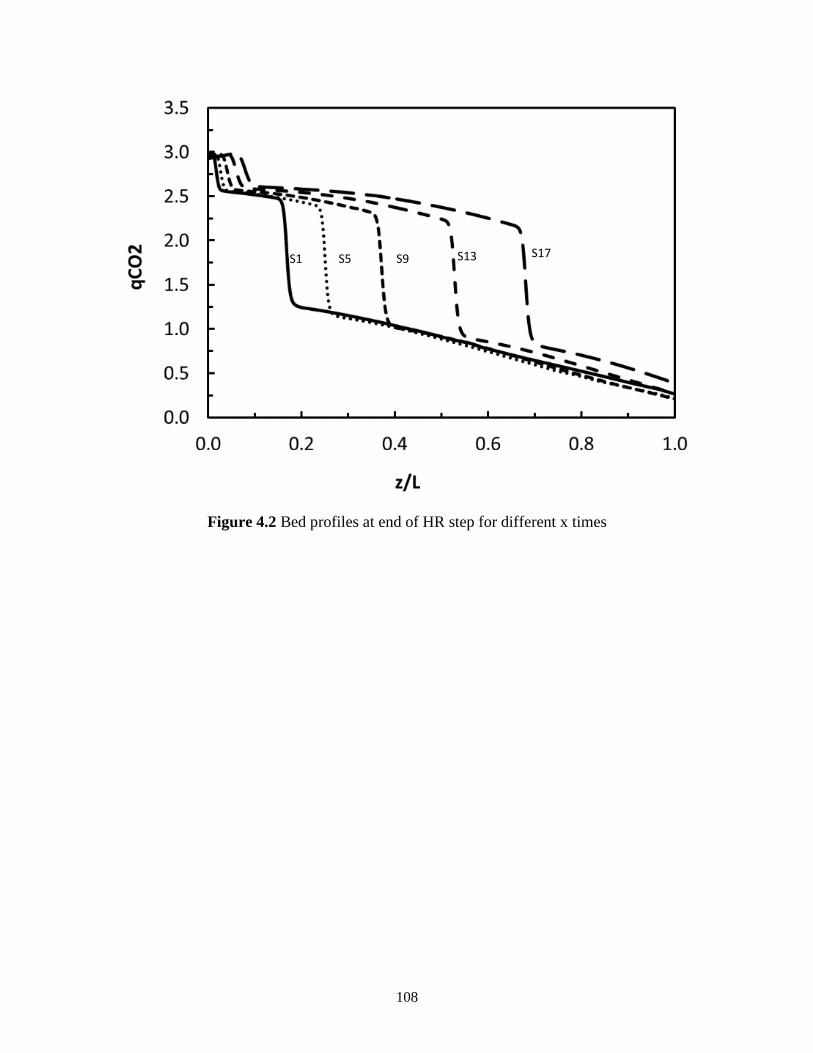
108
Figure 4.2 Bed profiles at end of HR step for different x times
S1 S5 S9 S13 S17
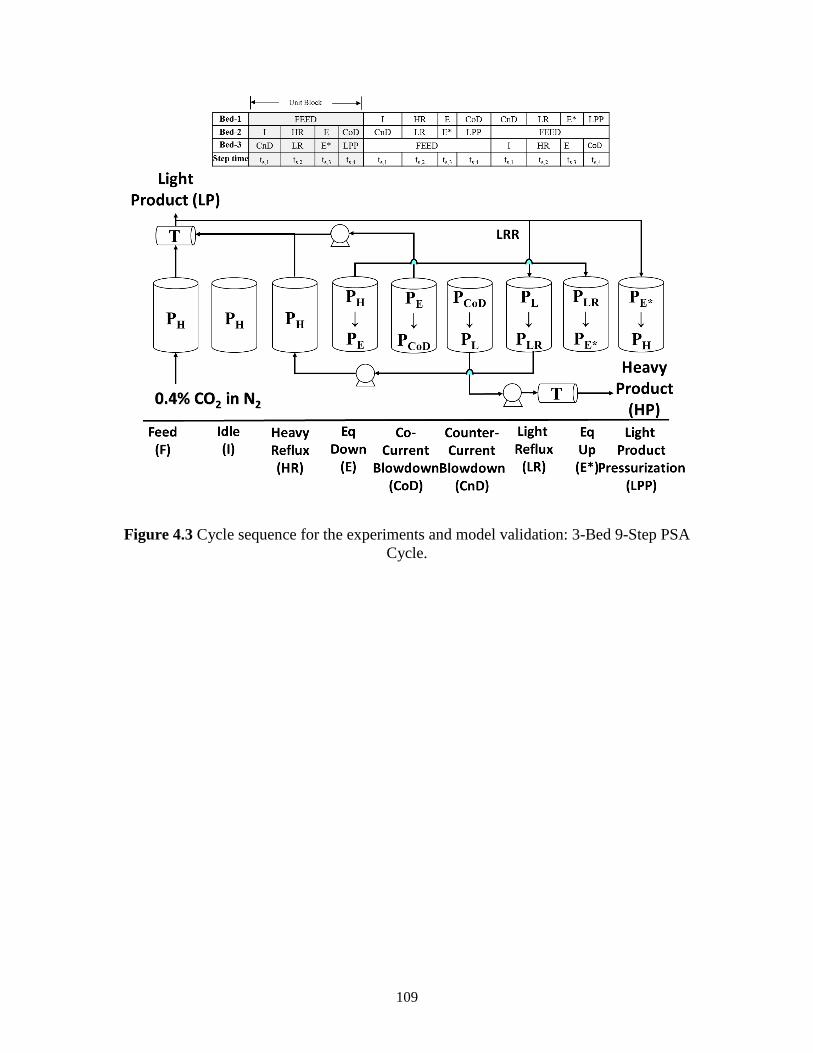
109
Figure 4.3 Cycle sequence for the experiments and model validation: 3-Bed 9-Step PSA
Cycle.
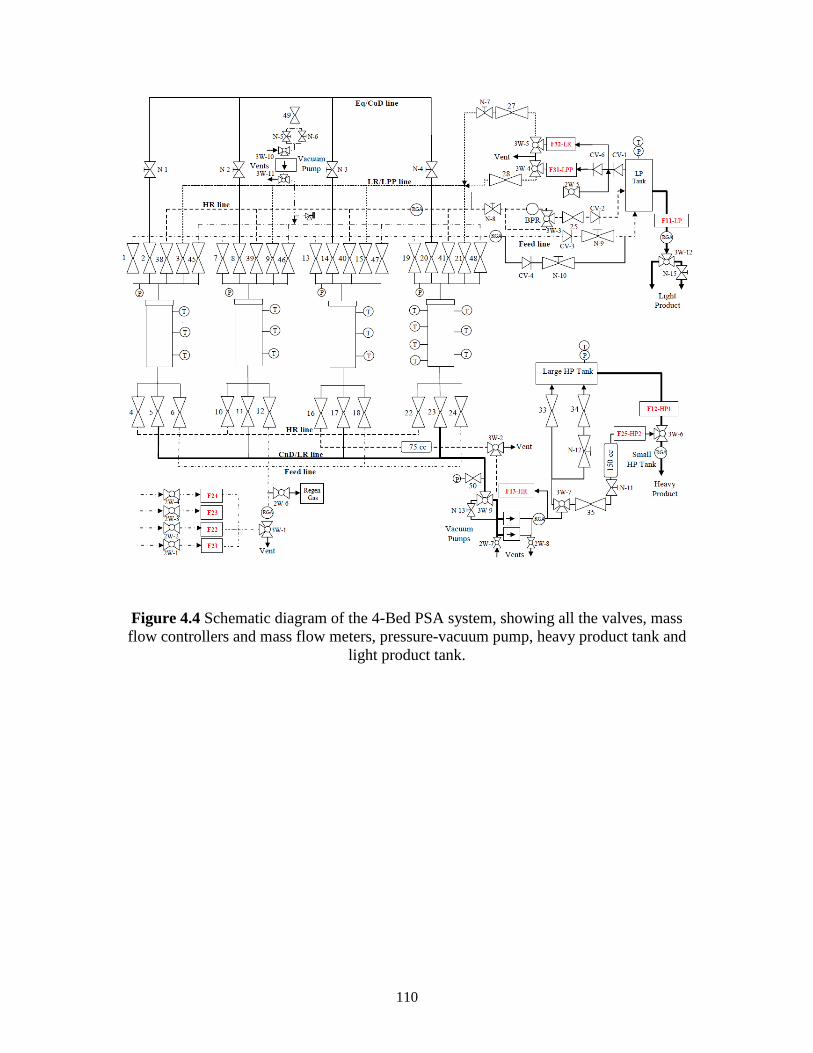
110
Figure 4.4 Schematic diagram of the 4-Bed PSA system, showing all the valves, mass
flow controllers and mass flow meters, pressure-vacuum pump, heavy product tank and
light product tank.
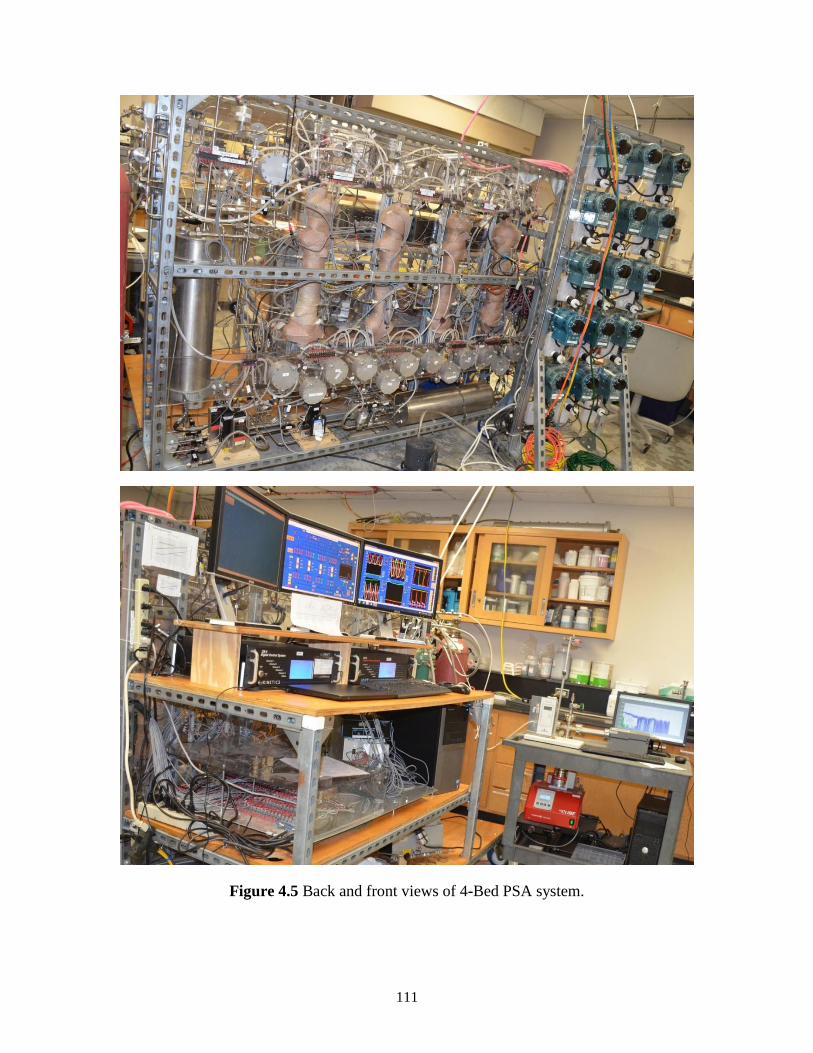
111
Figure 4.5 Back and front views of 4-Bed PSA system.
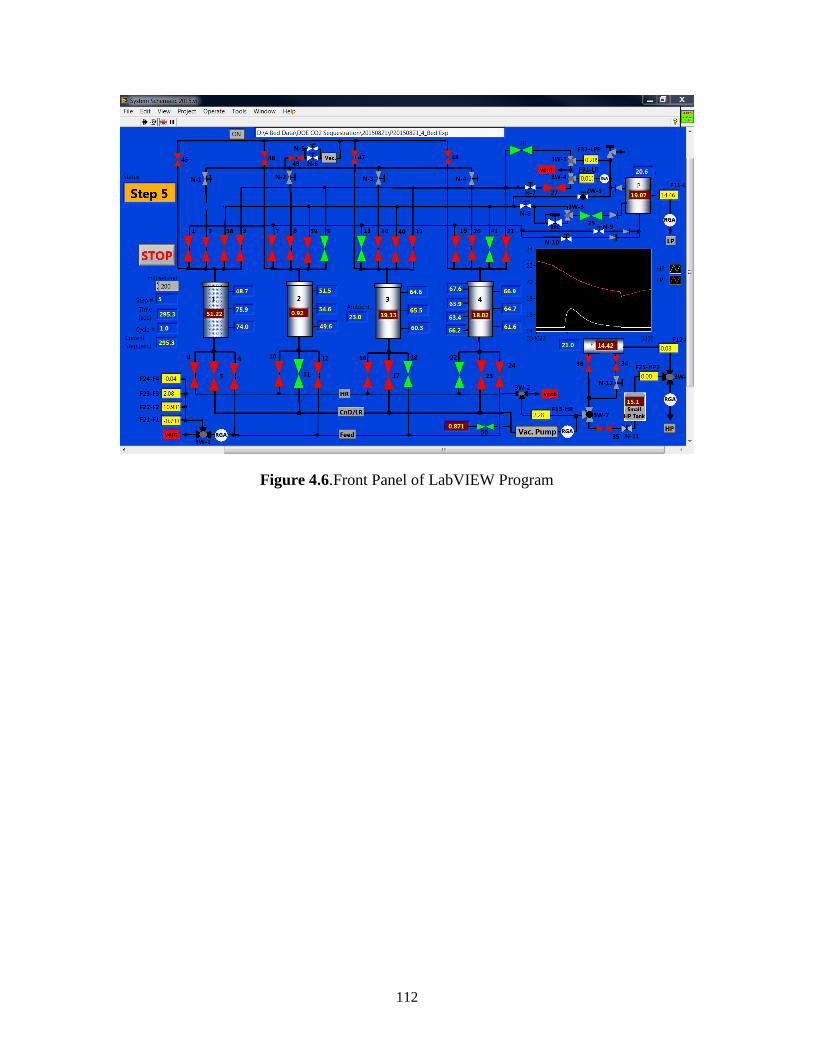
112
Figure 4.6.Front Panel of LabVIEW Program
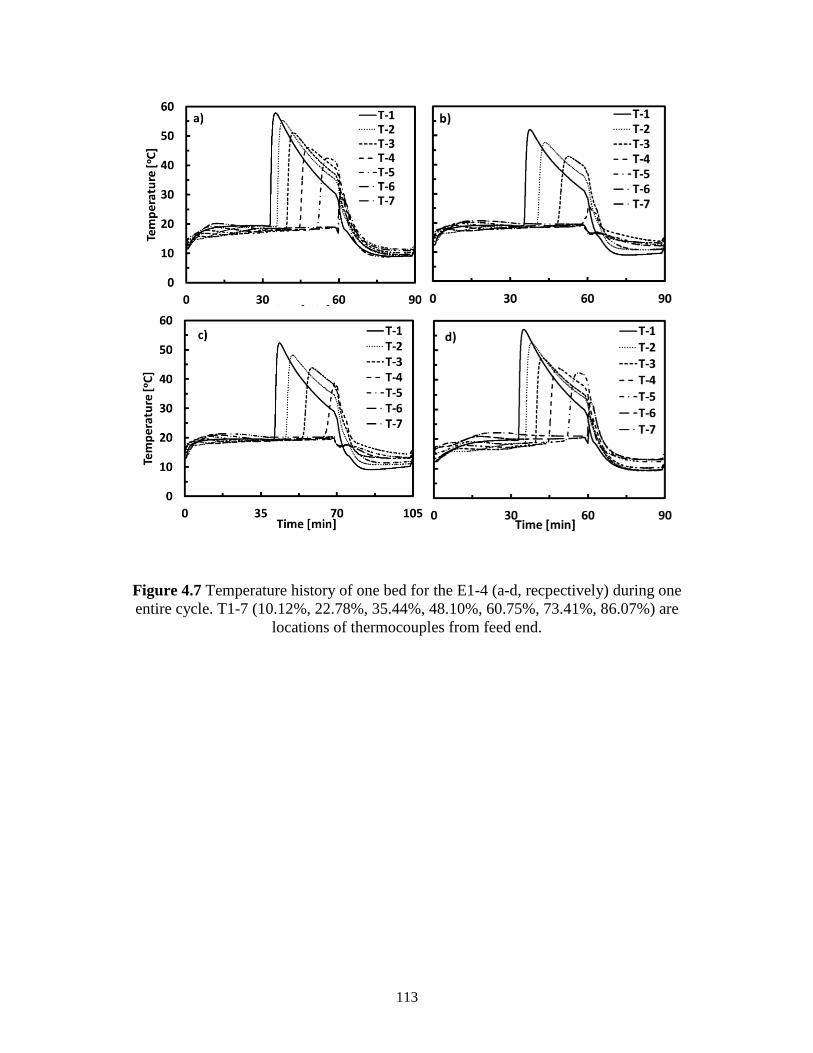
113
Figure 4.7 Temperature history of one bed for the E1-4 (a-d, recpectively) during one
entire cycle. T1-7 (10.12%, 22.78%, 35.44%, 48.10%, 60.75%, 73.41%, 86.07%) are
locations of thermocouples from feed end.
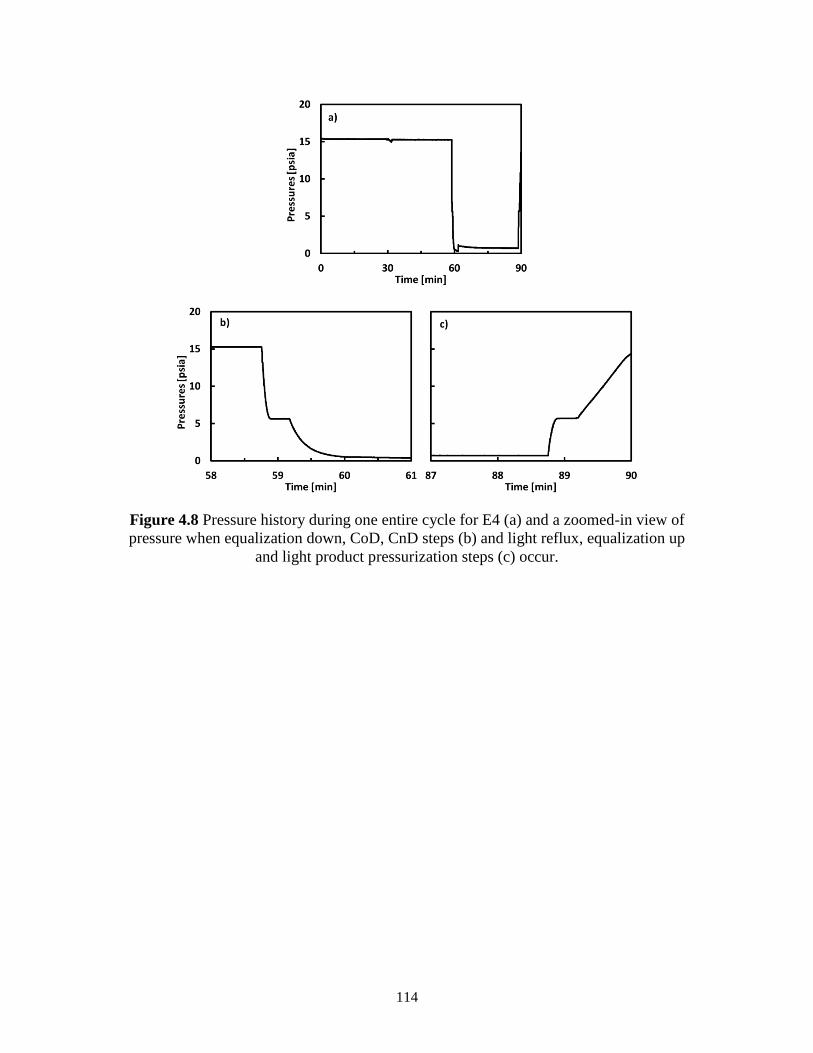
114
Figure 4.8 Pressure history during one entire cycle for E4 (a) and a zoomed-in view of
pressure when equalization down, CoD, CnD steps (b) and light reflux, equalization up
and light product pressurization steps (c) occur.

115
Figure 4.9 Pressure history during one bed with one-third of entire cycle (Top) and
zoomed-in view of pressure during Eq down, CoD and CnD steps (left) and zoomed-in
view during Eq up and LPP steps (right) for E4&M4.
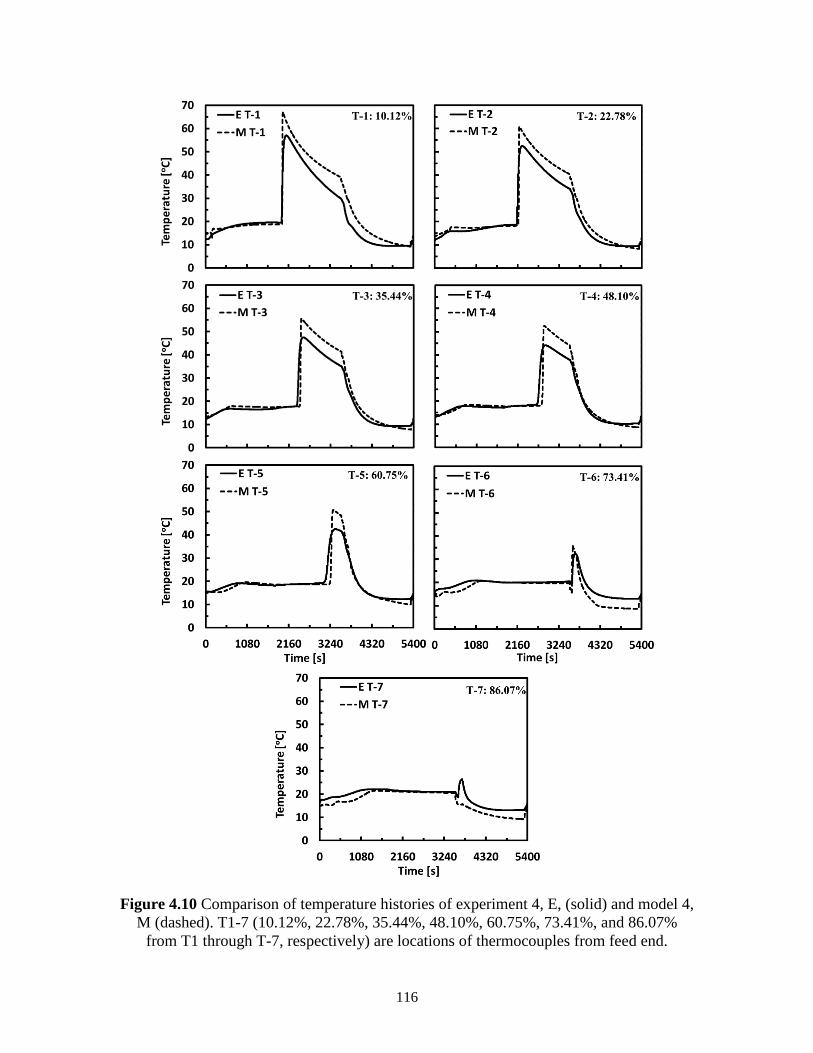
116
Figure 4.10 Comparison of temperature histories of experiment 4, E, (solid) and model 4,
M (dashed). T1-7 (10.12%, 22.78%, 35.44%, 48.10%, 60.75%, 73.41%, and 86.07%
from T1 through T-7, respectively) are locations of thermocouples from feed end.
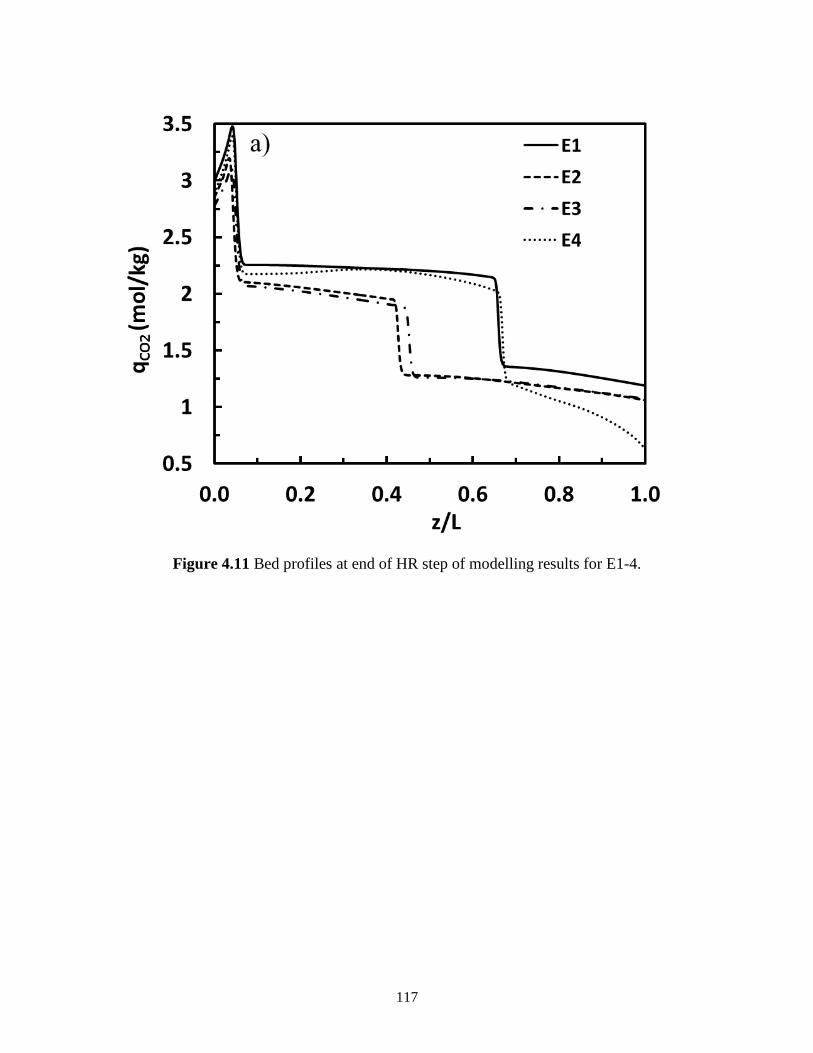
117
Figure 4.11 Bed profiles at end of HR step of modelling results for E1-4.
118
CHAPTER 5
TWO-STAGE PSA SYSTEM FOR CO2 REMOVAL DURING
CLOSED-LOOP HUMAN SPACE EXPLORATION MISSIONS
5.1 Summary
A novel two-stage pressure swing adsorption (PSA) system has been developed to
remove metabolic CO2 removal from the spacecraft cabin air of the International Space
Station (ISS). This PSA system enriches and recovers the CO2 to make it suitable for use
in a Sabatier reactor (CO2 reduction). This two-stage PSA process utilizes Stage 1 to
concentrate metabolic CO2 from about 0.2667 vol% to about 40 to 60 vol% and Stage 2 to
further enrich the CO2 product from Stage 1 up to > 97 vol% CO2, while recovering at least
95% of it, which corresponds to removing 4.0 kg/day of CO2. Each stage of this PSA
system utilizes a combination of equalization, cocurrent depressurization, heavy and light
reflux cycle steps to facilitate significant heavy component enrichment and recovery (i.e.,
CO2) from a dilute feed stream. The first generation of this two-stage PSA process utilizes
beaded commercial adsorbent, i.e., 13X zeolite, in both stages. These two PSA systems
were designed via simulation using the Dynamic Adsorption Process Simulator (DAPS).
The DAPS results were validated using an experimental multi-bed PSA system. DAPS was
then used to scale up Stage 1 and scale down stage 2 to size the full scale two-stage PSA
system that might someday be used on the ISS. The modeling results from
119
Stage 1 revealed that longer heavy and light reflux step times played an important role in
concentrating the CO2 in the heavy product and modeling results from Stage 2 showed that
a heavy reflux step was essential to achieving the desired performance. Implications from
these modeling and experimental results began to hint at the possibility of significantly
concentrating CO2 from ambient air up to around 10 to 15 vol% at relatively high recovery
using a simple PSA cycle.
The objectives of Stage 1 PSA system are to demonstrate a novel Stage 1 PSA
process that utilizes with aforementioned objectives via DAPS and to do a parametric study
to reach the desired performances with minimal loss on N2 and utilizing less power for
vacuum. In addition to Stage 1 PSA system objectives, the objectives of Stage 2 PSA
system are to determine PSA cycle schedules that satisfactorily meet desired requirements
for Stage 2 (aforementioned above) with minimal losses of N2, via simulations, and to
demonstrate experimentally a selected PSA from preliminary study using 4 bed PSA
system, and to validate the model against the experimental results from the 4 bed system
with no adjustable parameters.
5.2. 1st Stage PSA System for CO2 Removal During Closed-Loop Human Space
Exploration Missions
The main objective of the sub chapter is to demonstrate a novel Stage 1 PSA process
that utilizes with modified objectives, the complete recovery of CO2 with more modest
enrichments (60-80%) from 0.2667 vol. % CO2 concentration in feed stream, via DAPS,
and do parametric study to reach the desired performances with minimal loss on N2 and
utilizing less power for vacuum. Since the new goal is to have better recoveries with modest
120
purities, the PSA schedule coming from Chapter 3 has been adjusted to recover more CO2
with less purities by adding production light reflux step.
5.2.1 1st Stage PSA Cycle Description
A typical PSA process involves a cyclic process where a number of interconnected
vessels containing adsorbent/adsorbents undergo successive pressurization and
depressurization steps in order to produce a continuous stream of purified product.
The steps of the 1st stage PSA cycle include feed (F), idle (I), heavy reflux (HR),
equalization down (E), co-current depressurization (CoD), counter-current
depressurization (CnD), light reflux (LR), equalization up (E*) and light reflux
pressurization (LPP). The operation of 3-bed 10-step PSA cycle is described in Figure 5.1
along with the cycle sequence. Each row in the cycle sequence represents all the different
cycle steps a given bed undergoes over the entire cycle, whereas each column represents
which cycle step is being run by which bed at a particular ts. The sequence of operation is
developed by following a simple methodology called graphical approach (Mehrotra et al.,
2011). The unit block shown in the Figure 5.1 by a shaded area consists of five (ts,1, ts,2, ts,3,
ts,4 and ts,5) unit step times where all steps are being run by one of the three beds and the
total cycle time is composed of multiple consecutive unit blocks where the operations are
repeated again and again. Therefore, the cycle shown in Figure 5.1 with the unit block is
used to perform the parametric study for stage one.
The operation of first unit block, bed 1 is fed from bottom at atmospheric pressure
for a period equivalent to the sum of all unit step times (ts,1, ts,2, ts,3, ts,4 and ts,5). The reason
of covering all the unit step times by feed (F) step during the operation of bed 1 is to
121
maintain a continuous feed flow throughout the cycle. During this operation, the
preferentially adsorbed species (in this case CO2) is captured by the adsorbent in the bed
and a product stream is collected from the top of bed 1.
Next, bed 2 undergoes an idle (I) step for a period of ts,1 and ts,2 where valves at
both ends of the bed is physically closed so that no gas can come in or go out of the bed.
The reason of having an idle step in a cycle sequence is to maintain the alignment of
coupled steps. During ts,3, the bed undergoes a heavy reflux (HR) step which is ringed with
heavy gas providing from another bed undergoing light reflux (LR2) step. Heavy reflux
(HR) step is operated in this case at atmospheric pressure like feed step. The purpose of
having HR step in the sequence is to enhance the loading of heavy component in the
column. It is important to mention that a compressor is necessary to provide feed to HR
step by pulling gas from LR2 step. During ts,4, bed 2 undergoes a co-current equalization
depressurization (E) step where it is co-currently blown down to another intermediate
pressure to provide gas from its light end to another bed undergoing equalization
pressurization (E*) step. Finally, bed 2 is co-currently blown down (CoD) to another
intermediate pressure for a period of ts,5. The rate of CoD is controlled by a valve coefficient
(CvCoD) in order to reduce the loss of adsorbent material due to attrition.
Finally, bed 3 is in counter-current blow down (CnD) step during ts,1, which bed 3
is depressurized counter-currently to a low pressure and the pressure at the end of this step
is controlled by a valve coefficient (CvCnD). During CnD, heavy gas is collected as product
from the bottom of bed. Next during ts,2, the bed undergoes light reflux (LR1) step. In this
step, the bed is fed from light end with a portion of the light gas (LRR1) coming from
another bed undergoing feed (F) step. The pressure at the end of this step is controlled by
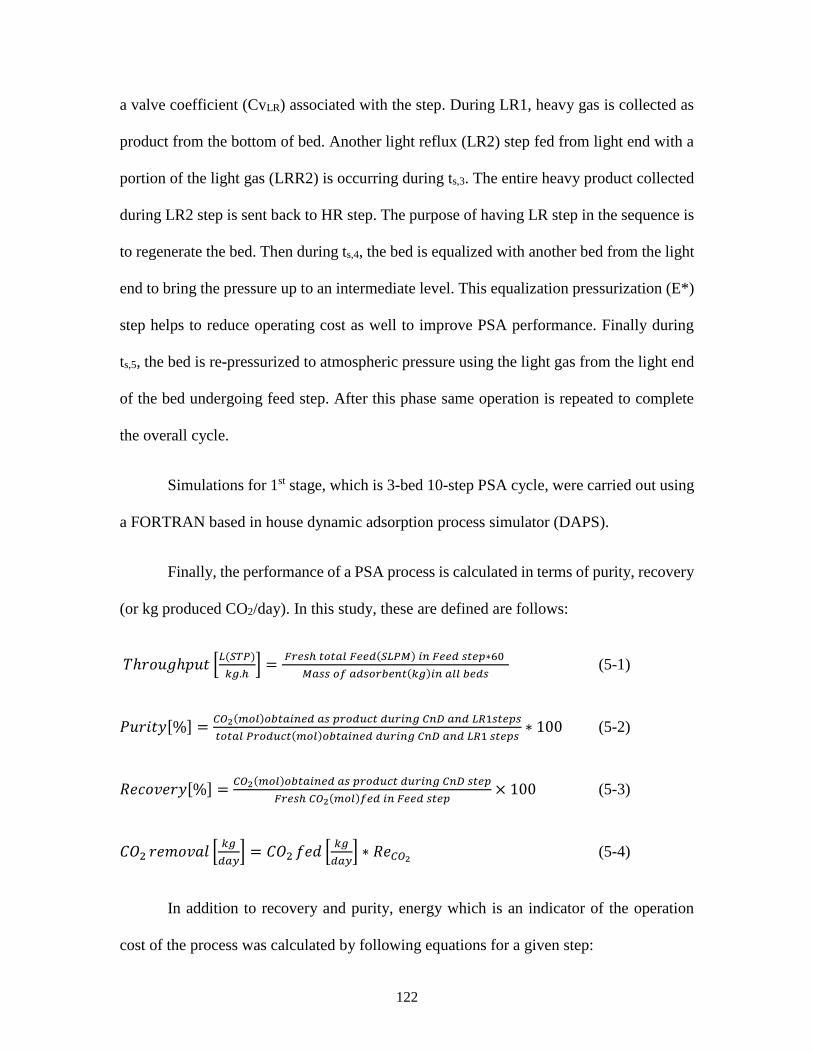
122
a valve coefficient (CvLR) associated with the step. During LR1, heavy gas is collected as
product from the bottom of bed. Another light reflux (LR2) step fed from light end with a
portion of the light gas (LRR2) is occurring during ts,3. The entire heavy product collected
during LR2 step is sent back to HR step. The purpose of having LR step in the sequence is
to regenerate the bed. Then during ts,4, the bed is equalized with another bed from the light
end to bring the pressure up to an intermediate level. This equalization pressurization (E*)
step helps to reduce operating cost as well to improve PSA performance. Finally during
ts,5, the bed is re-pressurized to atmospheric pressure using the light gas from the light end
of the bed undergoing feed step. After this phase same operation is repeated to complete
the overall cycle.
Simulations for 1st stage, which is 3-bed 10-step PSA cycle, were carried out using
a FORTRAN based in house dynamic adsorption process simulator (DAPS).
Finally, the performance of a PSA process is calculated in terms of purity, recovery
(or kg produced CO2/day). In this study, these are defined are follows:
𝑇ℎ𝑟𝑜𝑢𝑔ℎ𝑝𝑢𝑡 [𝐿(𝑆𝑇𝑃)
𝑘𝑔.ℎ] =
𝐹𝑟𝑒𝑠ℎ 𝑡𝑜𝑡𝑎𝑙 𝐹𝑒𝑒𝑑(𝑆𝐿𝑃𝑀) 𝑖𝑛 𝐹𝑒𝑒𝑑 𝑠𝑡𝑒𝑝∗60
𝑀𝑎𝑠𝑠 𝑜𝑓 𝑎𝑑𝑠𝑜𝑟𝑏𝑒𝑛𝑡(𝑘𝑔)𝑖𝑛 𝑎𝑙𝑙 𝑏𝑒𝑑𝑠 (5-1)
𝑃𝑢𝑟𝑖𝑡𝑦[%] =𝐶𝑂2(𝑚𝑜𝑙)𝑜𝑏𝑡𝑎𝑖𝑛𝑒𝑑 𝑎𝑠 𝑝𝑟𝑜𝑑𝑢𝑐𝑡 𝑑𝑢𝑟𝑖𝑛𝑔 𝐶𝑛𝐷 𝑎𝑛𝑑 𝐿𝑅1𝑠𝑡𝑒𝑝𝑠
𝑡𝑜𝑡𝑎𝑙 𝑃𝑟𝑜𝑑𝑢𝑐𝑡(𝑚𝑜𝑙)𝑜𝑏𝑡𝑎𝑖𝑛𝑒𝑑 𝑑𝑢𝑟𝑖𝑛𝑔 𝐶𝑛𝐷 𝑎𝑛𝑑 𝐿𝑅1 𝑠𝑡𝑒𝑝𝑠∗ 100 (5-2)
𝑅𝑒𝑐𝑜𝑣𝑒𝑟𝑦[%] =𝐶𝑂2(𝑚𝑜𝑙)𝑜𝑏𝑡𝑎𝑖𝑛𝑒𝑑 𝑎𝑠 𝑝𝑟𝑜𝑑𝑢𝑐𝑡 𝑑𝑢𝑟𝑖𝑛𝑔 𝐶𝑛𝐷 𝑠𝑡𝑒𝑝
𝐹𝑟𝑒𝑠ℎ 𝐶𝑂2(𝑚𝑜𝑙)𝑓𝑒𝑑 𝑖𝑛 𝐹𝑒𝑒𝑑 𝑠𝑡𝑒𝑝× 100 (5-3)
𝐶𝑂2 𝑟𝑒𝑚𝑜𝑣𝑎𝑙 [𝑘𝑔
𝑑𝑎𝑦] = 𝐶𝑂2 𝑓𝑒𝑑 [
𝑘𝑔
𝑑𝑎𝑦] ∗ 𝑅𝑒𝐶𝑂2
(5-4)
In addition to recovery and purity, energy which is an indicator of the operation
cost of the process was calculated by following equations for a given step:
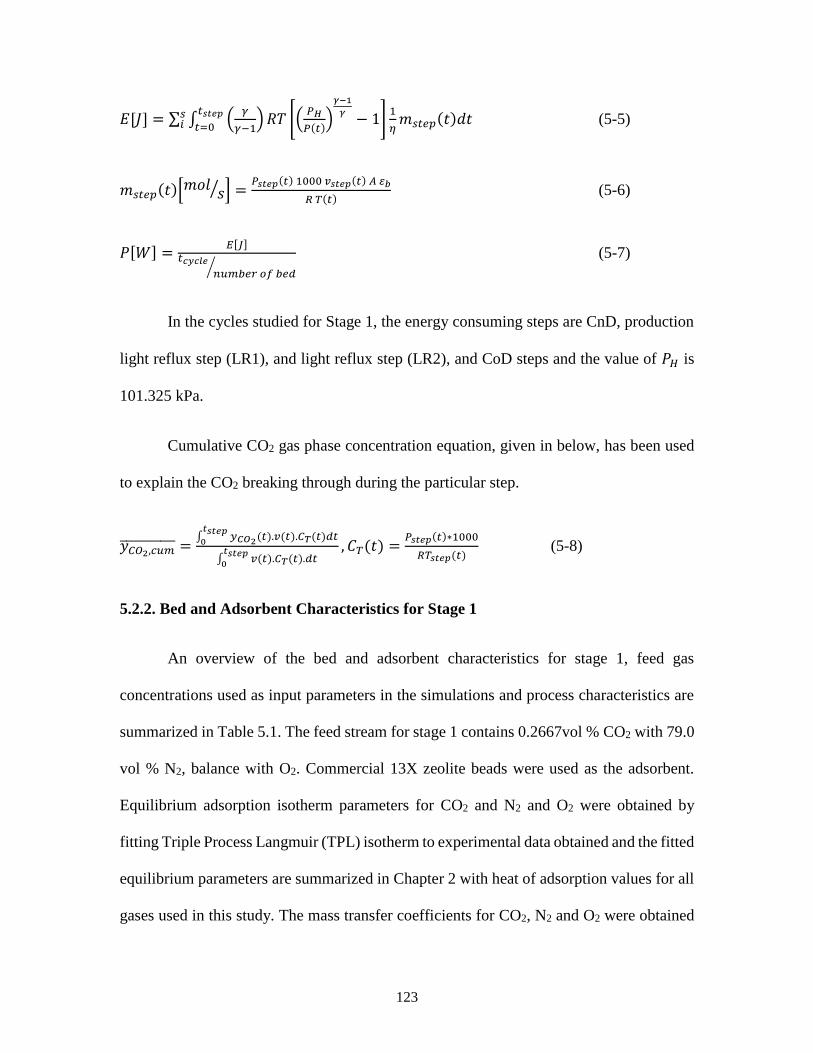
123
𝐸[𝐽] = ∑ ∫ (𝛾
𝛾−1) 𝑅𝑇 [(
𝑃𝐻
𝑃(𝑡))
𝛾−1
𝛾− 1]
1
𝜂𝑚𝑠𝑡𝑒𝑝(𝑡)𝑑𝑡
𝑡𝑠𝑡𝑒𝑝
𝑡=0𝑠𝑖 (5-5)
𝑚𝑠𝑡𝑒𝑝(𝑡)[𝑚𝑜𝑙𝑠⁄ ] =
𝑃𝑠𝑡𝑒𝑝(𝑡) 1000 𝑣𝑠𝑡𝑒𝑝(𝑡) 𝐴 𝜀𝑏
𝑅 𝑇(𝑡) (5-6)
𝑃[𝑊] =𝐸[𝐽]
𝑡𝑐𝑦𝑐𝑙𝑒
𝑛𝑢𝑚𝑏𝑒𝑟 𝑜𝑓 𝑏𝑒𝑑⁄
(5-7)
In the cycles studied for Stage 1, the energy consuming steps are CnD, production
light reflux step (LR1), and light reflux step (LR2), and CoD steps and the value of 𝑃𝐻 is
101.325 kPa.
Cumulative CO2 gas phase concentration equation, given in below, has been used
to explain the CO2 breaking through during the particular step.
𝑦𝐶𝑂2,𝑐𝑢𝑚̅̅ ̅̅ ̅̅ ̅̅ ̅̅ ̅ =∫ 𝑦𝐶𝑂2(𝑡).𝑣(𝑡).𝐶𝑇(𝑡)𝑑𝑡
𝑡𝑠𝑡𝑒𝑝0
∫ 𝑣(𝑡).𝐶𝑇(𝑡).𝑑𝑡𝑡𝑠𝑡𝑒𝑝
0
, 𝐶𝑇(𝑡) =𝑃𝑠𝑡𝑒𝑝(𝑡)∗1000
𝑅𝑇𝑠𝑡𝑒𝑝(𝑡) (5-8)
5.2.2. Bed and Adsorbent Characteristics for Stage 1
An overview of the bed and adsorbent characteristics for stage 1, feed gas
concentrations used as input parameters in the simulations and process characteristics are
summarized in Table 5.1. The feed stream for stage 1 contains 0.2667vol % CO2 with 79.0
vol % N2, balance with O2. Commercial 13X zeolite beads were used as the adsorbent.
Equilibrium adsorption isotherm parameters for CO2 and N2 and O2 were obtained by
fitting Triple Process Langmuir (TPL) isotherm to experimental data obtained and the fitted
equilibrium parameters are summarized in Chapter 2 with heat of adsorption values for all
gases used in this study. The mass transfer coefficients for CO2, N2 and O2 were obtained
124
experimentally from the single bed rapid PSA apparatus and macropore mass transfer
parameters are summarized in Chapter 2.
5.2.3. Parametric Study
A detailed parametric study for Stage 2 via running simulations is conducted in
order to investigate the effects of various process parameters on process performance
indicators such as purity and recovery. The parameters studied include HR/LR/F step time,
thus cycle time, light reflux ratio (LRR) or light reflux flows for LR1 and LR2 steps,
counter-current depressurization pressure (PCnD), light reflux pressure (PLR1&2), and
production light reflux step (LR1) time (ts,2). The ranges of all the parameters during the
parametric study are summarized in Table 5.2.
5.2.4 Result and Discussion for Stage 1 PSA System
A parametric study was conducted to evaluate the effects of various parameters on
the cyclic steady state PSA performance. The conditions of 1st stage simulations, S1-15,
have been run in this study were given in Table 5.2 with cycle sequence. In the 1st stage
simulations, base case in the Table 5.2 comes from the previous Chapter. The varied
conditions of 1st stage simulations include HR/LR/F step time (thus cycle time), different
light reflux ratios (LRR), thus LR flows, counter-current depressurization pressure (PCnD),
light reflux pressure (PLR&2), and production light reflux (LR1) step time, while keeping
counter-current depressurization step time (ts, 1 = tCnD = 200s) and co-current
depressurization pressurization pressure (PCoD = 10kPa) constant in the parametric study
as can be seen from Table 5.2. Stage 1 PSA process performance with required power
results from DAPS was given in Table 5.3. Three Pfeiffer vacuum pumps have been used
125
in the Stage 1. The performance curve for Pfeiffer vacuum pump model ACP 40 has been
shown in Figure 5.2. The LR operating pressures for Stage 1 are 4 and 5 kPa for parametric
study, can be seen from Table 5.2. This particular pump can handle maximum 65slpm and
55slpm at 4kPa and 5kPa respectively, calculated from the vacuum pump performance
figure.
The overall process performance was judged in terms of the purity and recovery of
CO2 in the heavy product and the required energies. The CO2 purity was defined as the
average mole fraction of CO2 in the heavy product, Equation 5-2. CO2 recovery was
defined as the moles of CO2 in the heavy product divided by the moles of CO2 fed to the
process cumulatively during the feed, Equation 5-3, with CO2 removal equation, Equation
5-4. Another process performance, required energy which is an indicator of the operation
cost of the process was calculated by Equations from 5-5 to 5-7.
5.2.4.1 Effect of HR/LR/F step time, (thus cycle time)
To study this effect the parameters that being held constant are production light
reflux (LR1) flow rate (15.5slpm), light reflux (LR2) flow rate (55.0slpm), counter-current
blow down pressure (0.5kPa), light reflux (LR1&2) pressures (5kPa), and co-current blow
down pressure (10kPa), production light reflux time (50s), and counter-current
depressurization step time (200s) as shown in Table 5.2. The values for ts, 3 are given in
Table 5.2; 1475s, 1575s, 1675s, 1975s, 2475s, and 3475s. The pressures for other steps
are 101.325kPa at the end of feed, heavy reflux and light product pressurization steps,
between 43 and 45kPa at the end of equalizations steps as shown in Table 7.
126
In a typical PSA process, cycle time determines the length of operation of a
particular step in a fixed cycle schedule. As increasing the cycle time increases
proportionally the length of associated cycle steps for a fixed cycle schedule; HR/LR steps
as well as feed step in this paper. Results shown in Figure 5.3-a) indicate that the purity of
heavy product increases with increasing ts, 3. Longer cycle time helps to increase the length
of corresponding step proportionally, the longer duration forces more CO2 to adsorb by the
adsorbent at a certain temperature and pressure. In other words, the bed gets saturated
higher with CO2 at the end of HR step as shown in Figure 5.4, which shows bed profiles at
the end of HR step for each run at periodic steady state. From Figure 5.4, it can be easily
seen that the front is moving through the end of bed by increasing ts, 3. Hence, the purity
shows an increasing trend with increasing ts, 3.
On the other hand, recovery of CO2 increases up to ts, 3 = 1975s then stays almost
constant for ts, 3 = 2475s, and then decreases by increasing ts, 3 as shown in Figure 5.3-a).
In a typical PSA cycle, recovery of heavy product decreases by increasing cycle time. It is
important to notice that feed step time, heavy reflux step time and light reflux step time,
thus cycle time have been changed at the same time by changing ts, 3 value in Table 5.2. A
likely explanation for the observed trend is that the depth of penetration of mass transfer
zone of CO2 into the bed increases with the increase of cycle time which in turn enhances
the loss of CO2 in the light end. To understand which particular step is causing an increase
in heavy product recovery, CO2 losses from light end for each step (Feed, HR, CoD, LR,
and LPP) can be seen from Figure 5.5, which shows relative CO2 losses versus ts, 3 for
aforementioned steps. In Figure 5.5, a relative loss of CO2 in HR step is increasing by
increasing ts, 3. A basic explanation for this increase is that the bed is saturated with more
127
CO2, which can be seen from (Figure 5.4) that causes CO2 to break through from light end.
Therefore, CO2 loss increases by increasing ts, 3. CO2 loss during CoD step decreases
slightly by increasing ts, 3 (Figure 5.5). CoD step time for these runs is not changing so the
amount of CO2 leaving the bed at the end of CoD step does not have a big change, but the
amount of CO2 into the bed during feed step is increasing by increasing ts, 3. Therefore,
CO2 loss during CoD decreases by increasing ts, 3. These two steps do not have the same
trend that CO2 recovery has, so these steps are not the main reason of the king in CO2
recovery. The other steps that cause the loss of CO2 from light end are feed, LR, and LPP.
Since some portion of light product from feed end goes to light reflux and light product
pressurization steps, the combination of these steps needs to be count to investigate CO2
losses in light end as shown in Figure 5.5. In this combination step, CO2 losses decrease at
the beginning of increased ts, 3, then increase as well as CO2 recovery increases first then
decreases by increased ts, 3, so it can be said that the main reason for the trend that CO2
recovery has is feed steps. To better understanding, cumulative CO2 gas phase
concentration (ȳCO2, cum), given in Equation (5-8), from the beginning to the end of feed
step needs to be investigated deeply for the runs base and S1-5 as shown in Figure 5.6. It
can be seen from Figure 5.6 that ȳCO2, cum at the end of feed step is decreasing when ts, 3
values are increasing up to 2475s, compare to ts, 3 is 1475s (base case), which causes an
increase in CO2 recovery that means that the bed gets better saturated with CO2 in the feed
step by increasing ts, 3. For ts, 3 = 2475s, ȳCO2, cum is decreasing slightly or almost the same
compare to base case, so CO2 recovery stays almost constant. For ts, 3 = 3475s, ȳCO2, cum
starts increasing compare to ts, 3 = 2475s, 1975s, 1675s and 1575s, which causes a decrease
in CO2 recovery that means that CO2 starts breaking through during the feed steps and the
128
bed loses some of the CO2 from light end during that specific run, which is S5. It is
important to notice that ȳCO2, cum for ts, 3 = 3475s is still lower that the value for base case,
so the CO2 recovery for ts, 3 = 3475s is still higher than the one ts, 3 = 1475s. Therefore, the
recovery of CO2 increases up tu run number S3, and stays almost constant for S4, then it
decreases for further increased ts, 3 (S5). To explain the main reason that CO2 starts breaking
through for further increased ts, 3, during the feed step the time ratios of feed step and light
reflux step for all four ts, 3 values have an essential role. The time ratios of these two steps
are increasing by increasing ts, 3, 0.82, 0.83, 0.84, 0.86, 0.88 and 0.91 for base and S1
through 5, respectively. It can be said that during the light reflux step, the bed is regenerated
as much as like a clean bed for particular ts, 3, S4, but further increase of ts, 3, run number 5,
the bed has the maximum regeneration level that already achieved at the previous ts, 3 value
while still increasing time for both light reflux and feed steps. That situation leads CO2 to
breaking through during feed step.
The total energy for run numbers base and S1-5 is increasing by increasing ts, 3 as
can be seen from Figure 5.3-b). This figure shows the effect of ts, 3 in total required energy,
which is summation of required energies of CnD, CoD, and LR1&2 in this work. The main
time portion of the cycle from energy consumption steps is light reflux 2 step, LR2. Time
fractions of LR2 to total cycle are increasing by increased ts, 3. Since the pump pulls gases
which are coming from LR in 5kPa to HR in 101.325kPa for longer time, more energy is
needed with the increasing time fraction of LR. Therefore, total required energy increases
by increasing ts, 3.
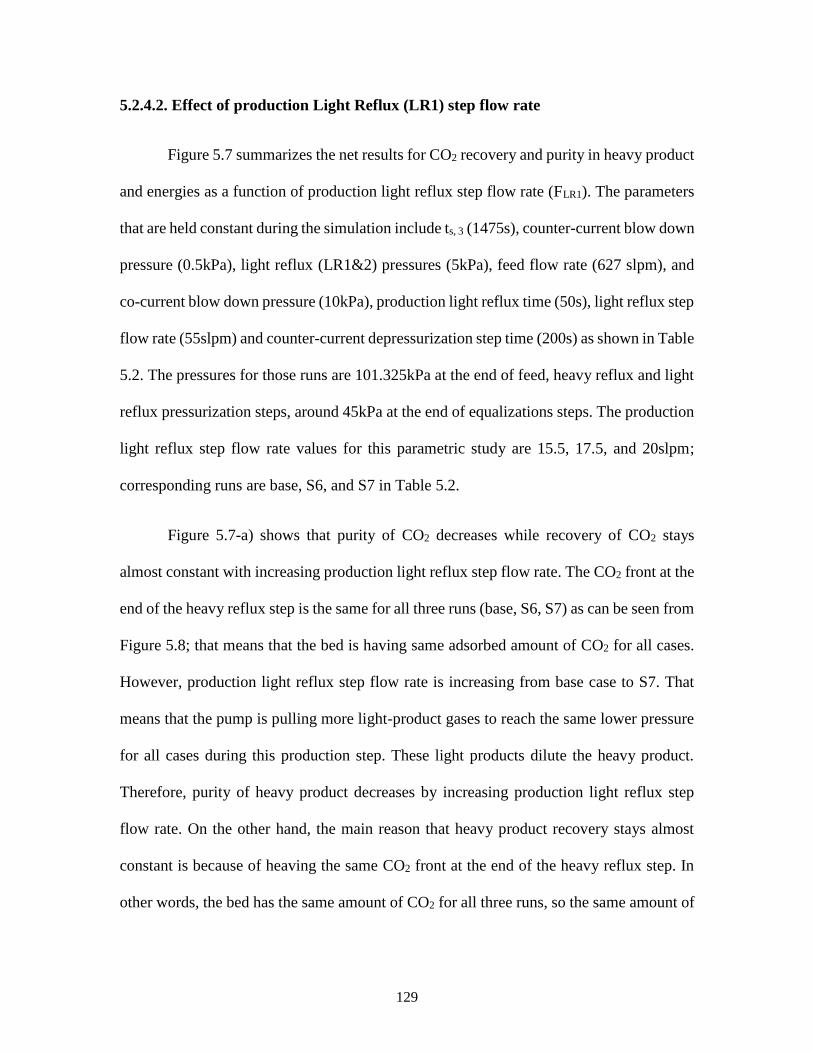
129
5.2.4.2. Effect of production Light Reflux (LR1) step flow rate
Figure 5.7 summarizes the net results for CO2 recovery and purity in heavy product
and energies as a function of production light reflux step flow rate (FLR1). The parameters
that are held constant during the simulation include ts, 3 (1475s), counter-current blow down
pressure (0.5kPa), light reflux (LR1&2) pressures (5kPa), feed flow rate (627 slpm), and
co-current blow down pressure (10kPa), production light reflux time (50s), light reflux step
flow rate (55slpm) and counter-current depressurization step time (200s) as shown in Table
5.2. The pressures for those runs are 101.325kPa at the end of feed, heavy reflux and light
reflux pressurization steps, around 45kPa at the end of equalizations steps. The production
light reflux step flow rate values for this parametric study are 15.5, 17.5, and 20slpm;
corresponding runs are base, S6, and S7 in Table 5.2.
Figure 5.7-a) shows that purity of CO2 decreases while recovery of CO2 stays
almost constant with increasing production light reflux step flow rate. The CO2 front at the
end of the heavy reflux step is the same for all three runs (base, S6, S7) as can be seen from
Figure 5.8; that means that the bed is having same adsorbed amount of CO2 for all cases.
However, production light reflux step flow rate is increasing from base case to S7. That
means that the pump is pulling more light-product gases to reach the same lower pressure
for all cases during this production step. These light products dilute the heavy product.
Therefore, purity of heavy product decreases by increasing production light reflux step
flow rate. On the other hand, the main reason that heavy product recovery stays almost
constant is because of heaving the same CO2 front at the end of the heavy reflux step. In
other words, the bed has the same amount of CO2 for all three runs, so the same amount of
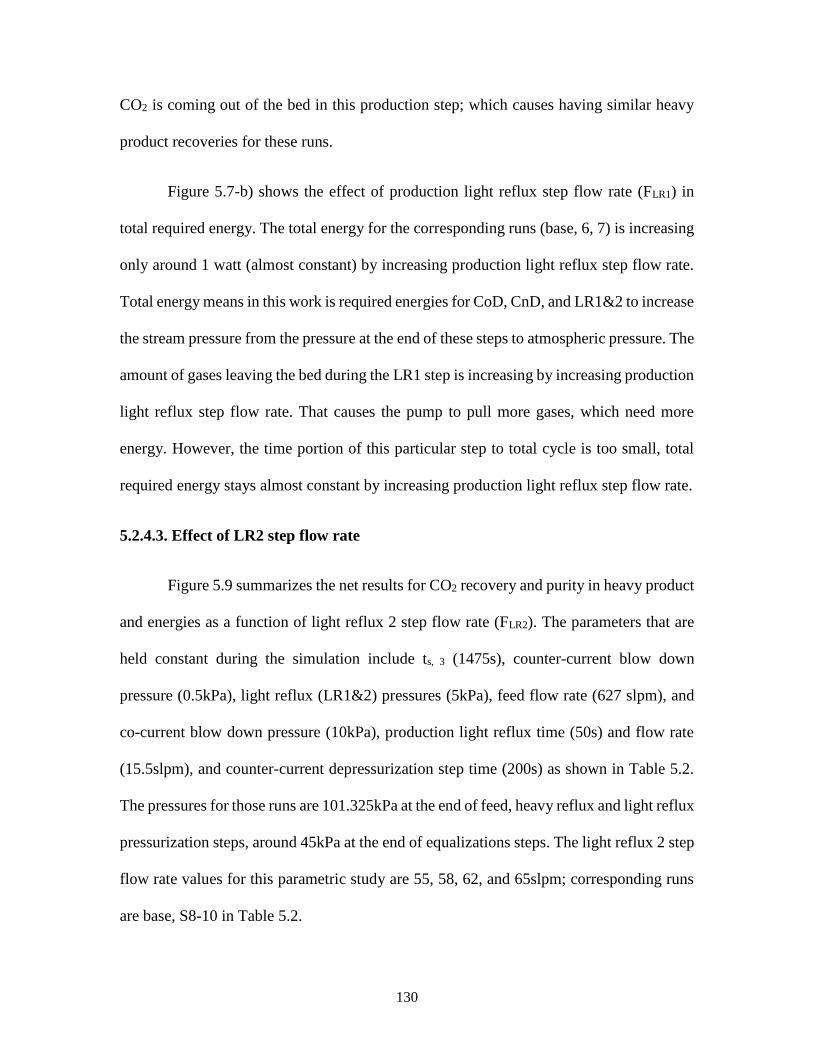
130
CO2 is coming out of the bed in this production step; which causes having similar heavy
product recoveries for these runs.
Figure 5.7-b) shows the effect of production light reflux step flow rate (FLR1) in
total required energy. The total energy for the corresponding runs (base, 6, 7) is increasing
only around 1 watt (almost constant) by increasing production light reflux step flow rate.
Total energy means in this work is required energies for CoD, CnD, and LR1&2 to increase
the stream pressure from the pressure at the end of these steps to atmospheric pressure. The
amount of gases leaving the bed during the LR1 step is increasing by increasing production
light reflux step flow rate. That causes the pump to pull more gases, which need more
energy. However, the time portion of this particular step to total cycle is too small, total
required energy stays almost constant by increasing production light reflux step flow rate.
5.2.4.3. Effect of LR2 step flow rate
Figure 5.9 summarizes the net results for CO2 recovery and purity in heavy product
and energies as a function of light reflux 2 step flow rate (FLR2). The parameters that are
held constant during the simulation include ts, 3 (1475s), counter-current blow down
pressure (0.5kPa), light reflux (LR1&2) pressures (5kPa), feed flow rate (627 slpm), and
co-current blow down pressure (10kPa), production light reflux time (50s) and flow rate
(15.5slpm), and counter-current depressurization step time (200s) as shown in Table 5.2.
The pressures for those runs are 101.325kPa at the end of feed, heavy reflux and light reflux
pressurization steps, around 45kPa at the end of equalizations steps. The light reflux 2 step
flow rate values for this parametric study are 55, 58, 62, and 65slpm; corresponding runs
are base, S8-10 in Table 5.2.
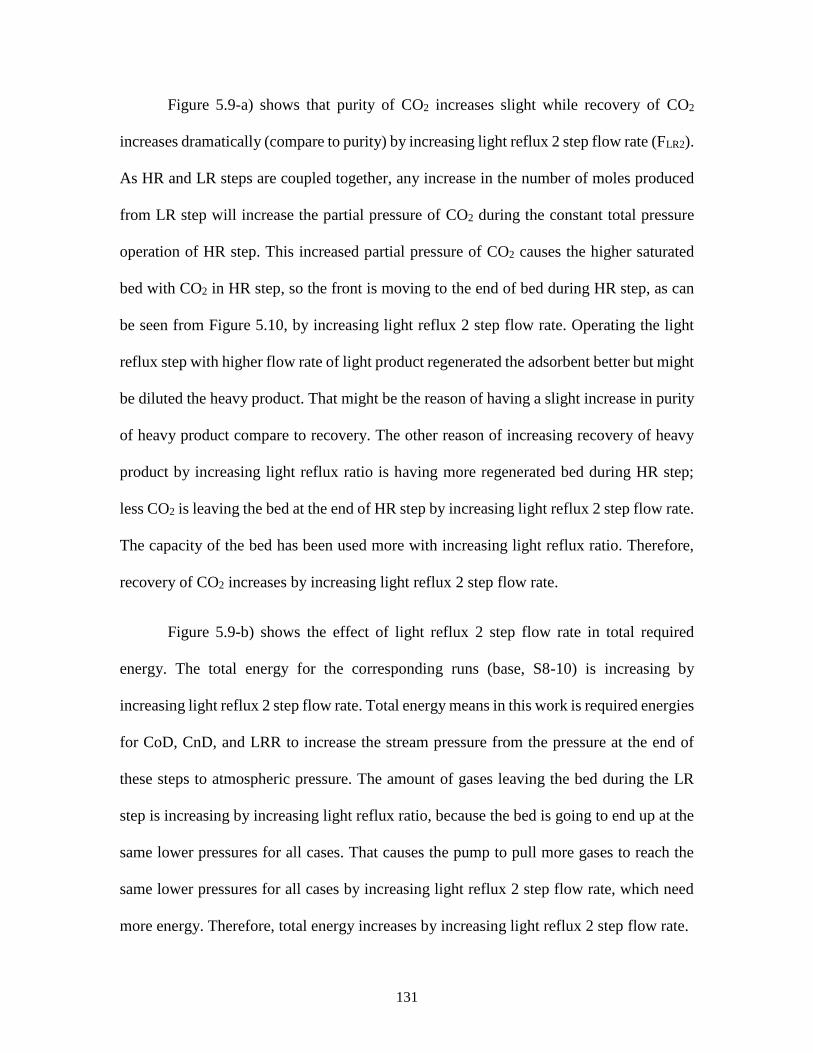
131
Figure 5.9-a) shows that purity of CO2 increases slight while recovery of CO2
increases dramatically (compare to purity) by increasing light reflux 2 step flow rate (FLR2).
As HR and LR steps are coupled together, any increase in the number of moles produced
from LR step will increase the partial pressure of CO2 during the constant total pressure
operation of HR step. This increased partial pressure of CO2 causes the higher saturated
bed with CO2 in HR step, so the front is moving to the end of bed during HR step, as can
be seen from Figure 5.10, by increasing light reflux 2 step flow rate. Operating the light
reflux step with higher flow rate of light product regenerated the adsorbent better but might
be diluted the heavy product. That might be the reason of having a slight increase in purity
of heavy product compare to recovery. The other reason of increasing recovery of heavy
product by increasing light reflux ratio is having more regenerated bed during HR step;
less CO2 is leaving the bed at the end of HR step by increasing light reflux 2 step flow rate.
The capacity of the bed has been used more with increasing light reflux ratio. Therefore,
recovery of CO2 increases by increasing light reflux 2 step flow rate.
Figure 5.9-b) shows the effect of light reflux 2 step flow rate in total required
energy. The total energy for the corresponding runs (base, S8-10) is increasing by
increasing light reflux 2 step flow rate. Total energy means in this work is required energies
for CoD, CnD, and LRR to increase the stream pressure from the pressure at the end of
these steps to atmospheric pressure. The amount of gases leaving the bed during the LR
step is increasing by increasing light reflux ratio, because the bed is going to end up at the
same lower pressures for all cases. That causes the pump to pull more gases to reach the
same lower pressures for all cases by increasing light reflux 2 step flow rate, which need
more energy. Therefore, total energy increases by increasing light reflux 2 step flow rate.
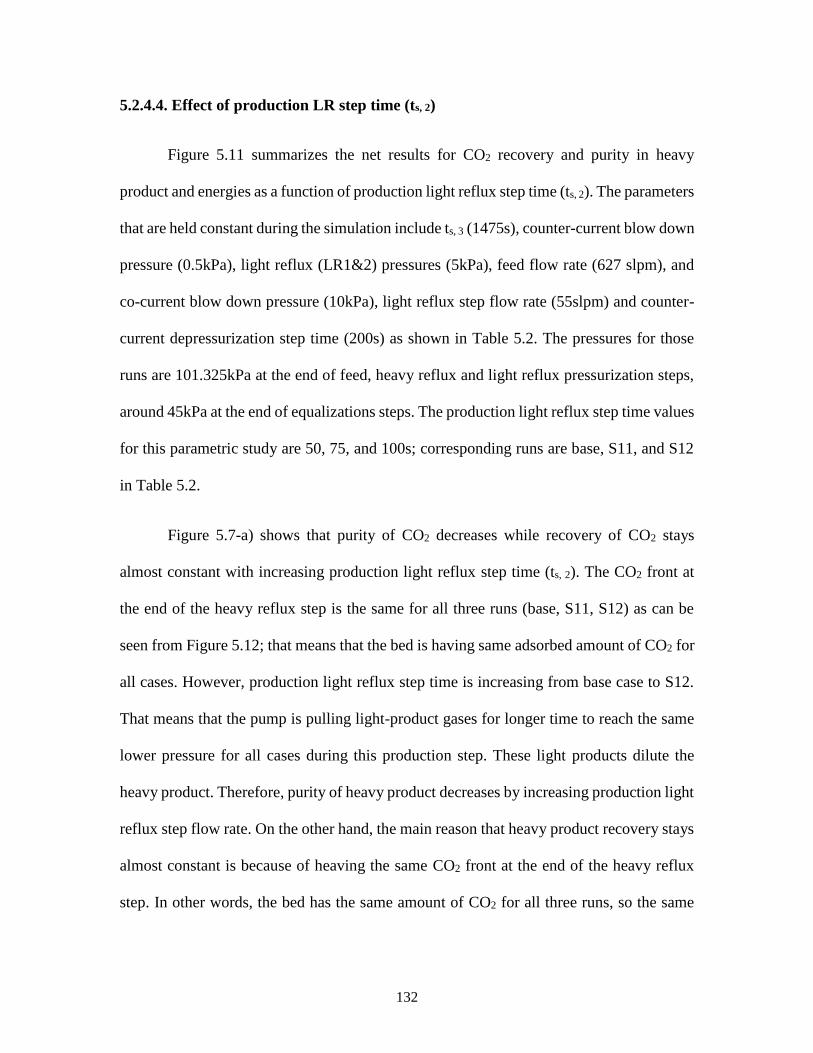
132
5.2.4.4. Effect of production LR step time (ts, 2)
Figure 5.11 summarizes the net results for CO2 recovery and purity in heavy
product and energies as a function of production light reflux step time (ts, 2). The parameters
that are held constant during the simulation include ts, 3 (1475s), counter-current blow down
pressure (0.5kPa), light reflux (LR1&2) pressures (5kPa), feed flow rate (627 slpm), and
co-current blow down pressure (10kPa), light reflux step flow rate (55slpm) and counter-
current depressurization step time (200s) as shown in Table 5.2. The pressures for those
runs are 101.325kPa at the end of feed, heavy reflux and light reflux pressurization steps,
around 45kPa at the end of equalizations steps. The production light reflux step time values
for this parametric study are 50, 75, and 100s; corresponding runs are base, S11, and S12
in Table 5.2.
Figure 5.7-a) shows that purity of CO2 decreases while recovery of CO2 stays
almost constant with increasing production light reflux step time (ts, 2). The CO2 front at
the end of the heavy reflux step is the same for all three runs (base, S11, S12) as can be
seen from Figure 5.12; that means that the bed is having same adsorbed amount of CO2 for
all cases. However, production light reflux step time is increasing from base case to S12.
That means that the pump is pulling light-product gases for longer time to reach the same
lower pressure for all cases during this production step. These light products dilute the
heavy product. Therefore, purity of heavy product decreases by increasing production light
reflux step flow rate. On the other hand, the main reason that heavy product recovery stays
almost constant is because of heaving the same CO2 front at the end of the heavy reflux
step. In other words, the bed has the same amount of CO2 for all three runs, so the same
133
amount of CO2 is coming out of the bed in this production step; which causes having similar
heavy product recoveries for these runs.
Figure 5.11-b) shows the effect of production light reflux step time (ts, 2) in total
required energy. The total energy for the corresponding runs (base, 11, 12) is increasing
only around 4 watt by increasing production light reflux step time. Total energy indicates
required energies for CoD, CnD, and LR1&2 to increase the stream pressure from the
pressure at the end of these steps to atmospheric pressure. The pump needs to pull gases
for longer time during production light reflux step; this situation causes an increase of
required energy. However, the time portion of this particular step to total cycle is too small
even if it increases for those runs, total required energy increases slightly by increasing
production light reflux step time (ts, 2).
5.2.4.5. Effect of Counter-Current Depressurization Pressure (PCnD)
Figure 5.13 shows the effect of counter-current desorption pressure (PCnD) on cyclic
steady state performance for the PSA cycle. To study the effect of PCnD, the simulations
were performed at a constant HR/LR sime, ts, 3 (1475s), light reflux (LR1&2) pressures
(5kPa), feed flow rate (627 slpm), and co-current blow down pressure (10kPa), light reflux
step flow rate (55slpm) and counter-current depressurization step time (200s), and
production light reflux time (50s) as shown in Table 5.2. The only parameter that is
changed was PCnD (0.5, 0.2, 0.1kPa); corresponding runs are base, S13, and S14,
respectively. The other pressures for those runs are 101.325kPa at the end of feed, heavy
reflux and light reflux pressurization steps, around 45kPa at the end of equalizations steps.
134
In general, the desorption pressure enhances the working capacity of the bed for a
fixed high pressure. The valve coefficient during CnD step in adjusted in such a way that
the final pressure at the end of step reaches a desired low pressure. It can be seen from
Figure 5.13-a) purity of CO2 stays constant with the decrease of desorption pressure for a
particular cycle time. The observed behavior in Figure 5.13-a) for CO2 purity can be
described with the help of Figure 5.14, which shows the bed profiles at the end of heavy
reflux step. In the figure, the CO2 front is moving backward by decreasing low pressure,
which causes decrease in purity of CO2. The pump is pulling more light-product gases to
reach the lower pressure at the end of the CnD step; that dilutes the heavy product stream
with light products. On the other hand, recovery of CO2 increases by decreasing CnD final
pressure. To decrease the low pressure, more CO2 is leaving the bed as a heavy product,
which leads an increase on heavy product (CO2) recovery.
The total energy for runs (base, S13, and S14) increases by decreasing CnD final
pressure as can be seen from Figure 5.13-b). This figure shows the effect of PCoD in total
required energy, which is the summation of required energies for CnD, CoD, and LR1&2
steps in this work. Required energy for CnD step is increasing by decreasing CnD final
pressure because the pumps needs to pull more gases to get the lower pressures at the end
of CnD step. Therefore, total required energy increases by decreasing counter-current
desorption pressure (PCnD).
5.2.4.6. Effect of Light Reflux Pressures (PLR1&2)
Figure 5.15 summarizes the net results for CO2 recovery and purity in heavy
product and energies as a function of light reflux pressures (PLR1&2). The parameters that
135
are held constant during the simulation include HR/LR sime, ts, 3 (1475s), counter-current
blow down pressure (0.5kPa), feed flow rate (627 slpm), co-current blow down pressure
(10kPa), light reflux step flow rate (55slpm) and counter-current depressurization step time
(200s), and production light reflux time (50s) as shown in Table 5.2. The only parameter
that is changed was PLR (5, 4kPa); corresponding simulations are base and S15,
respectively. The other pressures for those runs are 101.325kPa at the end of feed, heavy
reflux and light reflux pressurization steps, around 45kPa at the end of equalizations steps.
From Figure 5.15-a), purity of heavy product (CO2) increases slightly (almost
constant) while recovery of heavy product (CO2) increases dramatically by decreasing the
pressure at the end of the light reflux steps (LR1&2). Low pressure for light reflux step
means more regenerated bed with light product gases. Since heavy reflux step is being fed
from light reflux-2 step product stream that causes moving the CO2 front to the end of bed
during heavy reflux step (Figure 5.16). That means that the bed is being used more than
with high PLR case which causes an increase in purity and recovery of CO2. The reason of
having a slight increase in purity of heavy product might be diluted the heavy product
stream with light products (N2, O2) to reach lower pressures.
Figure 5.15-b) shows the effect of PLR in total required energy. The total energy for
the corresponding runs is increasing by decreasing LR pressure. The pump is pulling more
gases to reach the low LR pressures during this step, so energy needed for LR increases by
decreasing LR final pressure. Therefore, total energy increases by decreasing PLR.
136
5.3. 2nd Stage PSA System for CO2 Removal during Closed-Loop Human Space
Exploration Missions
The main objectives of the sub chapter are to develop a Stage 2 PSA process that
utilizes more than 4kg CO2 removal / day (recoveries >95%) with purities are more than
97 vol. % and with minimal losses of N2 from 40-60 vol. % CO2 concentration in feed
stream, and to demonstrate experimentally a selected PSA using 4 bed PSA system, and to
validate the model against the experimental results from the 4 bed system with no
adjustable parameters. As a starting point to develop a new PSA cycle for Stage 2, the
available Sequal PSA cycle, which was used for air separation before by the author with
smaller pellets and with micropore limited diffusion LDF approach, has been modified by
adding heavy reflux (HR) step and converted to 4-bed system in order to experimentally
demonstrate modified Sequal PSA process by using 4-bed PSA apparatus, which has bigger
pellets with macropore limited diffusion LDF approach, to reach the desired performance,
via simulations. A new 4-bed PSA cycle step sequence and schedule has been thus
conceived and studied using DAPS. The preliminary DAPS results have been then used to
determine the 4-bed experimental conditions. Three 4-bed experiments were carried out by
using 4-bed PSA apparatus.
5.3.1 2nd Stage PSA Cycle Description
The steps of the 2nd stage PSA cycle include feed (F), equalization down (E1),
heavy reflux (HR), equalization down (E2), counter-current depressurization (CnD), light
reflux (LR), equalization up (E2*), equalization up (E1*) and light product pressurization
(LPP). The operation of 4-bed 9-step PSA cycle is described in Figure 5.17 along with the
137
cycle sequence. The unit block shown in the Figure 5.17 by a shaded area consists of three
(ts,1, ts,2, and ts,3) unit step times. Therefore, the cycle shown in Figure 5.17 with the unit
block is used to perform the parametric study for stage two.
The operation of first unit block, bed 1 is fed from bottom at atmospheric pressure
for a period equivalent to the sum of all unit step times (ts,1, ts,2, and ts,3). During feed step
CO2 is captured by the adsorbent in the bed and a product stream is collected from the top
of bed 1. Next, bed 2 undergoes a co-current equalization depressurization (E) step for a
period of ts,1 where it is co-currently blown down to an intermediate pressure to provide
gas from its light end. During ts,2, the bed undergoes a heavy reflux (HR) step which is
ringed with heavy gas providing from another bed undergoing light reflux (LR) step. Heavy
reflux (HR) step is operated in this case at an intermediate pressure. During ts,3, bed 2
undergoes a second co-current equalization depressurization (E) step where it is co-
currently blown down to another intermediate pressure to provide gas from its light end.
Bed 3 is in counter-current blow down (CnD) step during ts,1, which bed 3 is depressurized
counter-currently. During CnD, heavy gas is collected as product from the bottom of bed.
Next during ts,2, the bed undergoes light reflux (LR) step with a portion of the light gas
(LRR). The entire heavy product collected during LR step is sent back to HR step. Then
during ts,3, the bed is equalized with another bed from the light end to bring the pressure up
to an intermediate level (E2*). Finally, bed 4 is having equalization up step (E1*). Then
during ts,2 and ts,3, the bed is re-pressurized to atmospheric pressure using the light gas from
the light end of the bed undergoing feed step. After this phase same operation is repeated
to complete the overall cycle.
138
In the current PSA cycle, the desired product is CO2 which is the preferentially
adsorbed species. Therefore, the performance of the process is evaluated on the basis of
CO2 recovery and CO2 purity in the heavy product. Recovery of CO2 is defined as the
number of moles of CO2 withdrawn as product during production step (CnD) divided by
the number of moles of CO2 fed to the PSA process during the feed step. On the other hand,
CO2 purity is defined as the mole fraction of CO2 leaving the bed during the CnD step.
Simulations for 2nd stage (4-bed 9-step PSA cycles) were carried out using a
FORTRAN based in house dynamic adsorption process simulator (DAPS).
Finally, the performance of a PSA process is again calculated in terms of purity,
recovery (or kg produced CO2/day) by using Equations 5-2 through 5-4 given in section
5.2.1.
In addition to recovery and purity, energy which is an indicator of the operation
cost of the process was calculated by following equations 5-5 through 5-7 given in section
5.2.1. In the cycles studied for Stage 2, the energy consuming steps are CnD, LR, and HR
steps (HR pressure in at intermediate pressure in that particular PSA cycle) the value of 𝑃𝐻
is 101.325 kPa.
5.3.2. Bed and Adsorbent Characteristics
An overview of the bed and adsorbent characteristics for stage 2 preliminary DAPS
simulations, feed gas concentrations, and kinetic properties used as input parameters in the
simulations and process characteristics are summarized in Table 5.4. The bed radius and
length as well as the cycle time for stage 2 preliminary DAPS simulations have been chosen
in such a way that CO2 not breaking through. The feed flows and light reflux ratios (LRR)
139
for stage 2 preliminary DAPS simulations have been chosen with the idea that the CO2 net
flow into the feed step and the N2 net flow into LR step were maintained the same. In
addition to Stage 2 preliminary DAPS simulation the bed and adsorbent characteristics, an
overview of the bed and adsorbent characteristics for stage 2 scale-up simulations,
experiments and model validation, feed gas concentrations, equilibrium and kinetic
properties used as input parameters in the simulations and process characteristics are
summarized in Table 5.5. The feed stream for stage 2 consists of 40.0vol % CO2 with 60.0
vol % N2. Commercial 13X zeolite beads were used as the adsorbent. Equilibrium
adsorption isotherm parameters for CO2 and N2 and O2 were obtained by fitting Triple
Process Langmuir (TPL) isotherm to experimental data obtained and the fitted equilibrium
parameters are summarized in Chapter 2 with heat of adsorption values for all gases used
in this study. The mass transfer coefficients for CO2, N2 and O2 were obtained
experimentally from the single bed rapid PSA apparatus and macropore mass transfer
parameters are summarized in Chapter 2.
5.3.3. Experimental Section
A typical schematic diagram of the PSA experimental system used in this study is
shown in Figure 4.4. The system is equipped with four adsorption beds (1, 2, 3 and 4),
seven mass flow controllers (FC), F21, F22, F23, F24, F25, F31, F32 in Figure 4.4, three
mass flow meters (FM), F11, F12, F13 in Figure 4.4, one light product tank, two heavy
product tanks, eighteen thermocouples (nine connected with first three beds and seven with
last bed, one with light product tank and one with large heavy product tank), seven pressure
transducers (four of them are coupled with four beds and the remaining two are with light
product tank and large heavy product tank, and one with vacuum pumps), vacuum pumps
140
and valves (1 to 50). In lower part of the columns, the line connected with the valves 6, 12,
18 and 24 is used to provide feed to the adsorption columns whereas the lines coupled with
valves 5, 11, 17, 23 and valves 4, 10, 16, 22 are used as counter-current blow down/light
reflux (CnD/LR) and heavy reflux (HR) lines, respectively. Similarly in the upper trend of
the columns, the line incorporated with the valves 1, 7, 13 and 19 is used as the product
line during feed step, the one coupled with the valves 38, 39, 40, 41, and 25 is for the
product line during heavy reflux (HR) step and the line connected with the valves 3, 9, 15,
21 and 28 is used for light product pressurization (LPP) as well as light reflux (LR) steps.
In addition, the current system has the facility to operate the PSA cycle by incorporating
equalization (EQ) step which is accomplished by using the line connected with the valves
2, 8, 14 and 20, and finally the line with valve 49 in addition to the valves 2, 8, 14, 20 is
used for co-current blow down (CoD).
The thermocouples used in the experimental set-up shown in Figure 4.4 are K-type
thermocouples which are used to measure the centerline temperatures of the beds as well
as the temperatures of the light and heavy product tanks. In each bed, a series of three
thermocouples are distributed axially throughout the bed which shows the bed temperature
profiles at one quarter, half way and three quarters into the bed from the feed end. In
addition, a fifteenth thermocouple which is not shown in the schematic diagram is used to
measure the ambient temperature. Also, a total of three heaters coupled with each
adsorption bed provided the facility of heating the bed uniformly. The power input to all
the heaters is controlled by using twelve variable autotransformers (range 0 to 120/140V,
type 3PN1O1O). The signals from all the thermocouples are sent to the signal conditioner
141
as input to the computer which displays real time temperature as the system is running
(Bhadra 2012).
The mass flow controllers and mass flow meters used in the system are supplied by
Tylan General/Brooks/MKS which have the ability to measure and/or control the mass
flow rates of the gas accurately and reliably. All the meters and controllers are digitally
controlled by two DX-5 Digital Power Supply instruments from UNIT instruments, Inc
and one Hasting Power Supply-Model 200. Each unit of this instrument from UNIT
instruments, Inc has five individual channels (eight of them have been using) and Hasting
Power Supply unit has two. Each mass flow controller channel controls and displays the
set point and actual flow for the channel as a percentage of full scale units. All the seven
pressure transducers used as pressure sensors are supplied by Omega Dyne Inc. The outputs
from all the pressure transducers are converted to absolute pressures which are displayed
on the screen of the computer. The valves used for the system are all from Swagelok which
are opened or closed depending on the duration of each step of a cycle. Valves 1 through
26 are Swagelok® U series bellows-sealed valves which provide enhanced reliability,
versatility, and safety with a secondary containment system that prevents leaks to
atmosphere even if the primary seal fails. These valves have a very high operating
temperature and pressure (343 0C and 2500 psig) and are operated on double actuation
mode (opened and closed by air). On the other hand, the rest of the valves are operated on
single actuation mode (opened by air but closed by spring) except the valves with handle
which are metering valves. The pressure and temperature ratings of these valves are about
3220 psig and 65 oC, respectively. It is worthwhile to note that all the instruments and

142
devices are controlled by a single CPU which is used to save the outputs from all the
devices, if necessary (Bhadra 2012).
The system is designed in such a way that provides the facility to measure the feed
(F), light product (LP) during feed, light product (LP) during heavy reflux, mixed light
product (LP), heavy product (HP) and heavy reflux (HR) concentrations using a 6-port
valve manufactured by Swagelok. This valve is connected to a residual gas analyzer
(RGA), a small and usually rugged mass spectrometer, which is basically a vacuum
instrument that operates near 10-6 mbar pressure. At high or atmospheric pressure, the
aperture assembly of RGA is insufficient to reduce the pressure while maintaining the
response time. In order to facilitate the sampling at this pressure, a pressure reduction
device which is actually a capillary is coupled with the RGA. The length of the capillary is
selected on a trial and error basis in order to maintain fast response time (Bhadra 2012).
Back and front views of 4-Bed PSA apparatus are shown in Figure 4.5.
LabVIEW program controls the valves and recording pressures, temperatures, and
flowrates from different locations of the PSA experimental system. Front Panel of
LabVIEW Program is shown in Figure 4.6. MS Excel file is being used for input file in
which user can define PSA step properties by deciding flowrates, timing, and on/off
position of each valve (Bhadra 2012).
5.3.4. Result and Discussion
5.3.4.1. Preliminary Study to Develop a PSA System for Stage 2
Firstly, it is important to indicate that enormous simulations with again extensive
parametric study to reach the desired performances had been run before deciding the
143
conditions as well as the bed dimensions and especially the PSA cycle. Those simulations
are not given in this thesis. A new 4-bed PSA cycle step sequence and schedule with two
different feed flow rates and light reflux ratios to maintain the same the CO2 net flow into
the feed step and the N2 net flow into LR step for both cases were conceived and studied
using DAPS. They are referred to as Feed I and II. These 4-bed preliminary DAPS
simulations were carried out based on to reach desired performances, which are more than
97 vol% CO2 enrichment while recovering at least 95% of it, which corresponds to
removing 4.0 kg/day of CO2. The process performances for both Feed I and II are given in
Table 5.6. The results in the table show very clearly that Feed II simulation resulted with
both better purities and recoveries. Feed II simulation has ended up with 98.1 vol% CO2
purity, and 96.1 % CO2 recovery, which means 4.07 kg CO2 removal / day. The
corresponding Stage 2 bed size for preliminary study was 3.0 inches long and 2.0 inches in
diameter (ID). It utilized a modest vacuum pressure of 5.0 kPa and intermediate heavy
reflux pressure of 55kPa. From the preliminary study with smaller pellets, which means by
using micropore limited linear driving force (LDF) approach, Feed II conditions selected
for model validation through the 4-bed PSA apparatus.
5.3.4.2. Scale-up the Selected PSA Cycle to 4-bed PSA Apparatus
Before start running the experiments by using the dimensions and properties of
available 4-bed PSA apparatus for model validation, the feed flow rate coming from the
preliminary simulation was scaled up to 4-bed PSA experimental set-up. The dimensions
and properties of the 4-bed PSA experimental apparatus were given in Table 5.5. So, the
feed flow rate was scaled up based on the ratio of the total mass of adsorbent per bed in
each system. This increased the feed flow rate from 3.75 SLPM to 24.5 SLPM for a feed
144
containing the same CO2 concentration with the Feed II simulation in feed stream; 40 vol%
CO2 (given in Table 5.7). Effect of scaled up feed flow rate and step times used in DAPS
simulations and corresponding performances were given in Table 5.8. Four preliminary
DAPS results with the scale-up flows are shown in Table 5.8 from S-1 to S-4. Since S-1
did not meet the desired performance because preliminary simulations with micropore
limited LDF approach were based on high mass transfer 0.3 mm beads, the feed flow rate
was decreased as shown for S-2 to S-4 because of losing CO2, which is heavy product,
from light end. However, the desired performance was still not attained at the end of S-4.
Then, the step times (ts, 1, ts, 2, ts, 3) were increased by decreasing the total feed flow with
the same ratio in order to reach the desired performance. So, the cycle step times of
equalization down 1, E1, (ts, 1), heavy reflux , HR, (ts, 2), and equalization down 2, E2, (ts,
3) were changed from 10-20-10 s to 15-30-15 s, and then to 20-40-20 s. This change also
changed the total cycle time. The results of four simulations using 15-30-15 s for the E1,
HR and E2 cycle step times, and using 20-40-20 s for the E1, HR and E2 cycle step times
are shown in Table 5.8. Decreasing feed flow rate as well as increasing cycle time helped
to avoid from CO2 (heavy product) breaking though from light end, which causes an
increase in the heavy product (CO2) recovery. As can be seen from S-1 to S-4 in Table
5.8, recovery increases by decreasing the feed flow rates because high flow rates at the
same working pressures might cause high CO2 saturation in the bed, which leads CO2 to
break through from light end. CO2 purities for those cases are decreasing by decreasing
feed flow rates because the bed is fully saturated with CO2 for the case with higher flows,
it is even losing some from light end, and so more CO2 pure stream can be obtained during
the production step with higher feed flows. Same explanation is valid for S-5 through S-8,
145
which has longer step times (ts, 1, ts, 2, ts, 3: 15-30-15s) than S-1 thought S-4, with lower feed
flow rates. The combination of increase in step times as well as a decrease in feed flow rate
work fine until S-10 in Table 5.8, after S-10 recovery starts decreasing. The most likely
explanation for this behavior is that the feed flow rates and unequally step times are not
enough for CO2 to adsorb on the solid surface. That means that the bed does not have
enough CO2 in solid phase that can obtain as a heavy product, thus purity is also decreasing
for those cases. Among those simulations, Only S-6 met the desired performance.
Therefore, The S-6 process conditions have been chosen as a starting point to run the
experiments in 4-bed PSA apparatus, but restricted by conditions defined by the unit.
5.3.4.3. Experiments
Three experiments for the 2nd stage were conducted on the 4-bed PSA experimental
set-up to reach the overall process performance, more than 4kg CO2 produced/day with
over 97% CO2 purity, for closed-loop human space exploration missions.
5.3.4.3.1. PSA Cycle Description for Experiments
PSA cycle steps used in the experiments consist of feed (F), idle (I), heavy reflux
(HR), equalization down (E), co-current depressurization (CoD), counter-current
depressurization (CnD), light reflux (LR), equalization up (E*) and light reflux
pressurization (LPP). The operation of 4-bed 9-step PSA cycle is described in Figure 5.17
along with the cycle sequence. As shown in the figure, the cycle sequence is divided into
12 unequally unit step times of length. The flow schematic of the unit block depicted in
gray in cyclic schedule is also described in the figure. The other four unit blocks are just
the repetition of the same steps but with different sequence. Therefore, it is noteworthy to

146
describe the cyclic operation of the present cycle more specifically on the basis of the unit
block. 4-bed 10-step PSA experiments have been done by using available in-house 4-bed
PSA experimental set-up, shown in Figure 4.4.
The adsorption beds 1, 2, 3 and 4 are filled with Zeolite 13X adsorbent. Bed,
adsorbent properties for the experiments and model validation were given in Table 5.5. The
adsorbent was prepared for cycling by first regenerating with heating under continuous
upward Helium flow (~ 0.1 SLPM) up to 350 oC at 101.325kPa and the regenerated (i.e.,
dry) weight of the adsorbent was obtained from the regeneration data. The adsorbent beds
were further regenerated in-situ, under vacuum and continuous Helium flow (~0.1 SLPM)
by increasing the temperature around 350oC via 8 band heaters connected around the beds
prior to each experiment. At the end of regeneration period, the beds were cooled down to
the room temperature. The feed gas mixture (0.4% CO2 in N2) has been obtained by using
two mass flow controllers for CO2 and N2 separately. These feed stream gases are
introduced to the upstream of bed 1 (z/L = 0) at high pressure (PH) through opened valves
6 and 1 and is allowed to pass through for a duration of ts,1 s (shown as tCnD in Figure 5.17)
to have preferentially adsorbed species (CO2) adsorbed and the high pressure product
stream enriched with less strongly adsorbed species (N2) leaves the column from the other
end (z/L = 1.0) of the bed which is sent to the light product tank through needle valves N-
9 and N-10. At this moment, with valves 10, 11, 12, 7, 39, 9, and 46 of bed 2, valves 22,
23, 24, 19, 41, 21, and 48 of bed 4 closed and the remaining valves 8 and 20 of beds 2 and
4 opened, the two beds are connected through their product ends to equalize pressure. In
this case, beds 2 and 4 are at co-current equalization pressurization 1 (E1) and equalization
depressurization 1 (E1*), respectively. This equalization pressurization step helps to save
147
energy because the gas, partially depleted of strongly adsorbed species from high pressure
bed is used to pressurize the other bed at low pressure to an intermediate pressure. During
this operation, ts,1, beds 3 undergoes countercurrent blow down step. During this step, one
end of the column is closed while the other is exposed to a vacuum pump. Valves 13, 14,
40, 15, 16 and 18 are kept closed and the bed is depressurized to a low pressure (PL) through
opened valve 17 and all the desorbed gas is sent to the heavy product tank. As a result of
pressure decrease, CO2 from the adsorbent gets desorbed and exits the bed. At the end of
the operation in first unit step time of ts,1 s, beds 1 undergoes feed step which is conducted
according to the procedure described above for duration of next unit step time of ts,2 s.
During this operation time, ts,2 s, bed 3 undergoes light reflux step (LR) by opening valve
17, 15, and 27 while valves 10, 12, 7, 8, 39, and 46 are kept closed. Bed 3, light reflux step
operated at PLR to facilitate desorption of CO2. This light reflux step helps to clean the bed
from heavy product by sending light product gases; therefore, breaking through of heavy
gases from light end can be prevented by the help of light reflux step. The CO2 rich effluent
from the light reflux purge step enters the heavy reflux step, which bed 2 undergoes to this
HR step by opening valves 10, 8 and 49 (to use the vacuum pump to maintain the
intermediate pressure that the bed has from equalization down 1 step). The intermediate
pressure for HR step is adjusted by using manual needle valve. In heavy reflux (HR) step,
the blow down gas emanating from this light reflux step is fed to the feed end of the column
at intermediate pressure (PHR) usually. The purpose of this step is to increase the loading
of heavy component in the solid phase. Also, undesirable light gas present in the void space
is flushed out of the bed as it is replaced with pure CO2. These factors cumulatively help
to increase the enrichment of heavy component during CnD step. During ts, 2, bed 4
148
undergoes light product pressurization step by closing valves 22, 23, 24, 19, 20, 41 and 27
while opening valves 21 and 28. The purpose of incorporating light product pressurization
(LPP) step is to push the concentration wave towards the feed end of the column thereby,
enhancing the performance of the process. During the operation of the next unit step time
of the unit block, ts,3, bed 1 is at feed step and beds 2 and 3 are at second equalization step
and bed 4 is again light product pressurization step. Continuous feed flow during entire
PSA cycle has been achieved with this way. The operating procedure of feed step is the
same to the procedure described above. With valves 10, 11, 12, 7, 39, 9, and 46 of bed 2,
and valves 16, 17, 18, 13, 40, 15 of bed 3 closed and the remaining valves 8 and 14 of beds
2 and bed 3 opened, the two beds are connected through their product ends to equalize
pressure. And bed 4 is at light product pressurization step with the same operating
procedure for bed 4 shown above. In this case, beds 2 and 3 are at co-current equalization
pressurization 2 (E2) and equalization depressurization 2 (E2*), respectively. This
equalization pressurization step helps to save energy because the gas, partially depleted of
strongly adsorbed species from high pressure bed is used to pressurize the other bed at low
pressure to an intermediate pressure. Similarly, the consecutive operation in each bed of
corresponding unit block for particular step is repeated until the periodic steady state is
reached. With setting a 6-port valve, the transient as well as periodic steady state
concentration profiles of light and heavy products can be monitored by using RGA. An in-
house built LabView program and National Instruments data acquisition and control
system were used to control valve operation, cycle sequencing, and mass flow controller
and to monitor the temperature, pressure and flow rate profiles with time. The periodicity
was verified by observing the steady temperature profiles of all thermocouples at different
149
locations of the bed as well as by monitoring the steady heavy and light product
concentrations profiles by RGA.
5.3.4.3.2. PSA Cycle Process Performance Indicators
Once the system was reached to periodic steady state for a particular set of
operating conditions, all the temperature, pressure, flow rate, heavy product and light
product profiles were captured to evaluate the periodic state performance indicators. The
process performance indicators for the PSA process were evaluated on the basis of
enrichment, recovery and throughput. The overall process performance was judged in
terms of the purity and recovery of CO2 in the heavy product and N2 in the light product.
The CO2 purity was defined as the average mole fraction of CO2 in the heavy product, and
CO2 recovery was defined as the moles of CO2 in the heavy product divided by the moles
of CO2 fed to the process cumulatively during the feed (Eqn 5-2 and 5-3). The enrichment
and recovery of both heavy and light components were calculated from the concentration
profiles captured by RGA after the steady state situation was reached. After every set of
experiment, the RGA was trained with running different CO2-N2 standards namely 0, 0.5,
1, and 2 % CO2 and from 10% CO2 to 100% CO2 with increment of 10% by using two
mass flow controllers for CO2 and N2.
A total of three runs were carried out to study the effect of some process parameters.
A few experiments have been run before these three experiments. However, the process
performance was not met because a 5 kPa vacuum pressure was not achieved
experimentally under those conditions. To remedy this situation the feed flow rate was
halved (6.67slpm) and the cycle time was doubled (ts,1-ts,2-ts,3: 30-60-30s) compare to S-6
simulation conditions. Thereafter, CnD step time, which is ts, 1, was increased by decreasing
150
E2 step time, which is ts, 3, (to maintain same cycle time) in order to reach lower pressures
with the 4-bed PSA experimental set-up. The parameters studied include the heavy
reflux/light reflux, thus total cycle time and CnD step time, light reflux ratio, and PCnD. The
4-bed Stage 2 experimental conditions and parameters for E1-3 are shown in Table 5.9.
The process performance in terms of purities and recoveries of CO2 in the heavy product
and N2 in the light product is shown in Table 5.10.
All three experimental runs in Table 5.10 gave respectable performances, as all of
them achieved a vacuum pressure of 5 kPa during the LR step. However, only Experiment
3 met the desired criteria. This run resulted in a Stage 2 PSA process performance of 98.10
vol% CO2 purity and 97.46% CO2 recovery (4.13kg CO2 removal/day) at a feed flow rate
of 6.67 SLPM. The full scale Stage 2 PSA process only requires a feed flow rate of 3.75
SLPM when the feed concentration is 40 vol% CO2 and 60 vol% N2. Accordingly, when
scaled by keeping the same experimental bed length and the feed velocity fixed, the new
bed dimensions for the 4-bed Stage 2 PSA process were 0.5017 m long and 0.0381 m in
diameter. From Table 5.10, after experiment 1, CO2 breaking thorough has been observed,
which causes losing heavy product from light end, thus less purities. That why HR/LR
time, ts, 2 has been started to decrease for the case for experiment 2 and 3 in order to increase
CO2 recovery or in order to avoid losing CO2 from light end. Therefore, this decrease
helped to observe an increase in CO2 recoveries as can be seen from Table 5.10.
Temperature and pressure histories of one of the experiments are shown in Figure
5.18 and Figure 5.19, respectively. From temperature history figure, Figure 5.18, it can be
easily seen that major temperatures start rising during feed step and at the end of
equalization down 2 step (E2) CO2 front reaches the end of the bed. The temperature
151
increase, which is observing in T-5 trough T-7 thermocouples in Figure 5.18, is because
CO2 is adsorbing again the location at the end of the bed. During equalization down-2 step
light end is opening, and so mostly light product is sending to another bed, which causes a
decrease in the bed pressure but an increase in CO2 partial pressure. That increase in CO2
partial pressure causes CO2 to re-adsorb again. As can be seen from the Figure 5.18,
temperatures in the feed end are decreasing because of desorption of the gas species but
temperatures in the light end are increasing because of the CO2 adsorption. Pressure history
of one bed for the E3 run during one entire cycle at steady state is shown in Figure 5.19.
Small drops during feed in Figure 5.19 is because one of the other beds is starting to light
product pressurization step (LPP). The reason to have a king during heavy reflux step is
because the ends of the bed was closed during previous step, the equalization down 1 step
(E1), and then during the heavy reflux step both ends opened, flows starts flowing. Thefore,
that flow causes the instant increase in pressure.
After evaluating the recoveries and enrichments of all the components in both
heavy and light ends, a material balance calculation was performed to calculate the error
associated with the system. In each case, the resulting species errors were given in Table
5.10.
5.3.4.4. Model Validation
The DAPS model was validated against experimental data obtained from
Experiment 1-3. Figure 5.20 shows the experimental data and the model predictions for the
pressure profiles at periodic state for the entire PSA cycle which encompasses 9 cycle steps
namely feed step, equalization down 1 step, heavy reflux step, equalization down 2 step,
counter-current blowdown step, light reflux purge step, equalization up 2 step, equalization
152
up 1 step and a light product pressurization step as can be seen from Figure 5.20. The solid
line indicates the experimental data whereas the dashed line shows the model predictions.
The Model was adjusted to match the experimental pressures by changing Cvs of valves
of pressure changing steps. From the figure it can be easily seen that model and
experimental pressure history overlaps for feed, heavy reflux, equalization down, CnD, and
light reflux steps while having little bit difference in equalization steps. Figure 5.21 shows
the temperature profiles at periodic state for seven different thermocouples in the bed for
experiment 3. The solid line indicates the experimental data whereas the dashed line shows
the model predictions. Results show good match between modeling and experiments
especially the time that temperature starts rising up. As Figure 5.21 shows, the higher
concentration wave front reaches thermocouple T-7 in experiment but T-6 in model
validation. Thus, the front’s location for experiment is 86.07% in the bed and for model is
anywhere between 73.41% and 86.07% in the bed. The main reason having higher
maximum temperature in the model than the experiment is having only one lumped heat
transfer coefficient with only one energy balance equation for all gas and solid phases, and
the wall. And the other reasons might be having small heat transfer coefficient and
assuming no wall thickness in the model. These the differences in the model cause less heat
to escape from the bed, which causes having higher temperatures in the model. Thus, the
model was able to mostly predict the temperature profiles and position for the entire PSA
cycle of experiments without any fitting parameters such as kinetic and thermodynamic.
The CO2 purity and CO2 recovery in the heavy component and N2 recovery in the light
component calculated by DAPS is compared to the experimental results in Table 5.11.
153
The results show a close agreement between experiment and model without any
fitting parameters (kinetic and thermodynamic) and for a wide range of concentrations (0.4-
90.0% CO2). Therefore, the model behind DAPS was validated and will now be used to
simulate a variety of PSA cycles and process conditions for removal and concentrating CO2
during closed-loop human space exploration missions.
5.4. Conclusion
5.4.1. Conclusion of 1st Stage PSA Cycle Simulations
The practical feasibility of carbon dioxide separation and recovery from air-CO2
mixtures was demonstrated by means of a new Stage 1 PSA cycle by using an in-house
process simulator. A 3-bed 10-step Stage 1 PSA system was configured and utilized to
study concentration and separation of CO2 from air (0.2667% CO2, 79.0% N2, and balanced
O2) using Zeolite 13X as adsorbent. PSA Cycle included feed (F), idle (I), heavy reflux
(HR), co-current equalization depressurization (Eq), co-current depressurization (CoD),
counter-current depressurization (CnD), production light reflux (LR1), light reflux-2
(LR2), counter-current equalization pressurization (Eq*) and Light Product Pressurization
(LPP) steps. The best run (S15) ended up with producing a heavy product stream containing
67.3 vol% CO2, 91.7% CO2 recovery (4.34 kg/day of CO2 being removed) and with only
0.13% N2 loss to the heavy product. The vacuum utilized during regeneration step was
within the specified level and flow rate. The main objectives of Stage 1 PSA system are
fully recovery CO2, at least more than 4 kg CO2 removal/day) with more modest CO2
enrichments. Therefore, the objectives could be reached with 3-bed 10-step Stage 1 PSA
system and with the specific vacuum pumps.
154
5.4.2. Conclusion of 2nd stage PSA System
The practical feasibility of carbon dioxide separation and recovery from N2-CO2
mixtures was demonstrated by means of a new PSA cycle for Stage 2 by using an in-house
process simulator and experimentally by using 4-bed PSA experimental set-up. Thereafter,
model validation has been done with DAPS, in house simulator. A 4-bed 9-step Stage 2
PSA process was configured and utilized to study concentration and separation of CO2
from N2 (40% CO2, 60% N2) using Zeolite 13X as adsorbent. PSA Cycle included feed
(F), co-current equalization depressurization 1 (E1), heavy reflux (HR), co-current
equalization depressurization 2 (E2), counter-current depressurization (CnD), light reflux
(LR), counter-current equalization pressurization 2 (E2*), counter-current equalization
pressurization 1 (E1*), and Light Product Pressurization (LPP) steps. Preliminary study to
develop a PSA process for Stage 2 has been done via simulation. Experiments (E1-3) for
Stage 2 with 4-bed PSA apparatus have been done with achievable experimental conditions
at scale. Model validation that required no adjustment of kinetic or thermodynamic
parameters has been done for 2nd stage.
Overall, target process performance for NASA has been achieved with two-stage
PSA system. Overall two-stage PSA process is shown in Figure 5.22. Two-stage PSA
performances are 98.10% CO2 purity with 97.46% CO2 recovery, (4.13kg CO2 removal /
day) from 0.2667 vol. % CO2 concentration in feed stream. Stage 1bed dimensions are I.D:
10.62 in with L: 19.75 in, while Stage 2 bed dimensions are I.D: 1.5 in with L: 19.75 in.
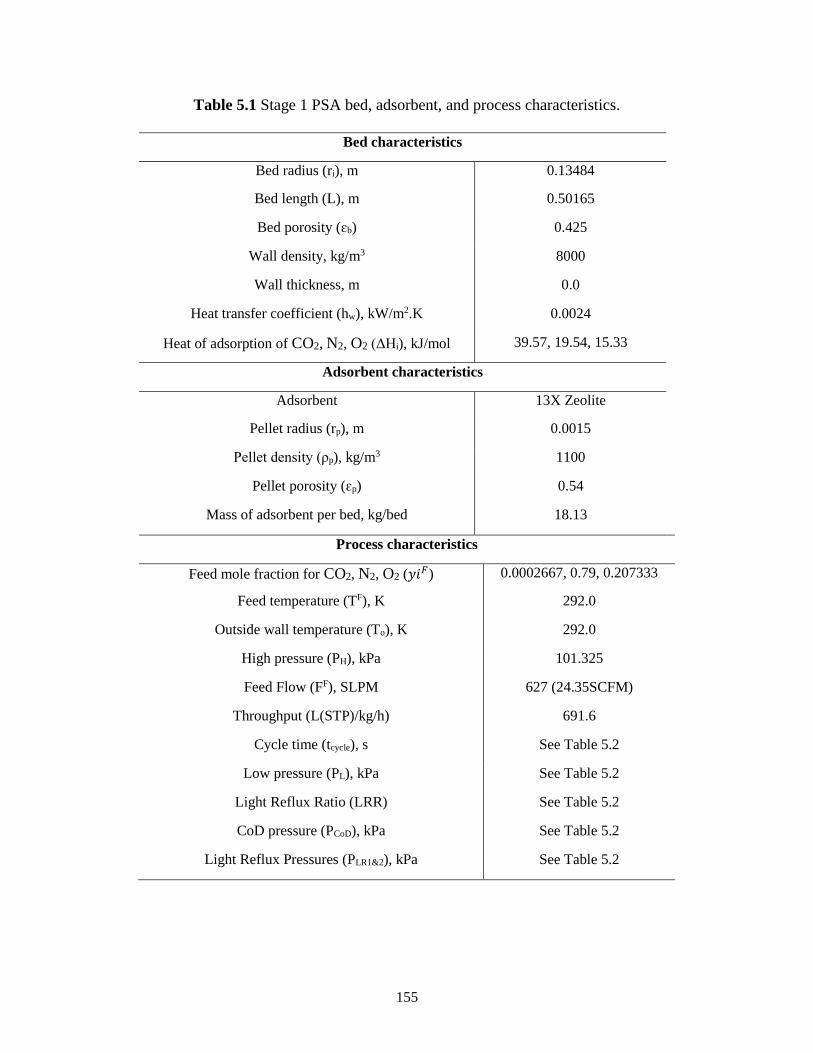
155
Table 5.1 Stage 1 PSA bed, adsorbent, and process characteristics.
Bed characteristics
Bed radius (ri), m 0.13484
Bed length (L), m 0.50165
Bed porosity (ɛb) 0.425
Wall density, kg/m3 8000
Wall thickness, m 0.0
Heat transfer coefficient (hw), kW/m2.K 0.0024
Heat of adsorption of CO2, N2, O2 (ΔHi), kJ/mol 39.57, 19.54, 15.33
Adsorbent characteristics
Adsorbent 13X Zeolite
Pellet radius (rp), m 0.0015
Pellet density (ρp), kg/m3 1100
Pellet porosity (ɛp) 0.54
Mass of adsorbent per bed, kg/bed 18.13
Process characteristics
Feed mole fraction for CO2, N2, O2 (𝑦𝑖𝐹) 0.0002667, 0.79, 0.207333
Feed temperature (TF), K 292.0
Outside wall temperature (To), K 292.0
High pressure (PH), kPa 101.325
Feed Flow (FF), SLPM 627 (24.35SCFM)
Throughput (L(STP)/kg/h) 691.6
Cycle time (tcycle), s See Table 5.2
Low pressure (PL), kPa See Table 5.2
Light Reflux Ratio (LRR) See Table 5.2
CoD pressure (PCoD), kPa See Table 5.2
Light Reflux Pressures (PLR1&2), kPa See Table 5.2
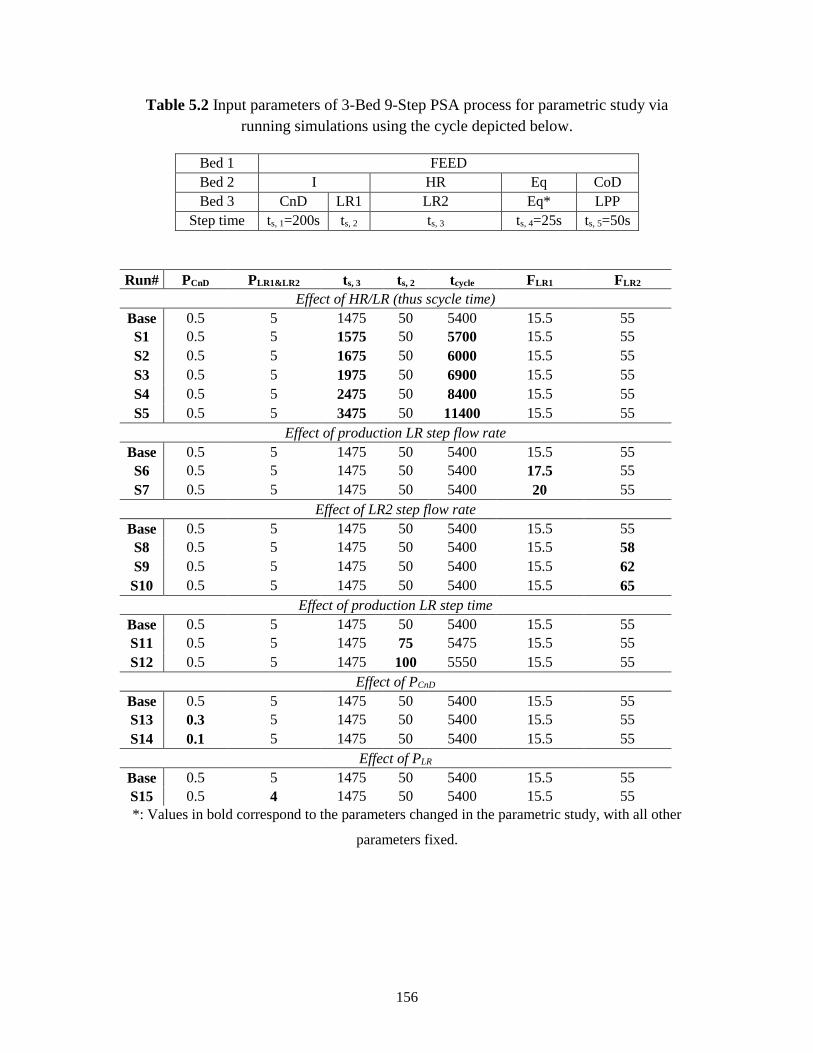
156
Table 5.2 Input parameters of 3-Bed 9-Step PSA process for parametric study via
running simulations using the cycle depicted below.
Bed 1 FEED
Bed 2 I HR Eq CoD
Bed 3 CnD LR1 LR2 Eq* LPP
Step time ts, 1=200s ts, 2 ts, 3 ts, 4=25s ts, 5=50s
Run# PCnD
(kPa)
PLR1&LR2
(kPa)
ts, 3
(s)
ts, 2
(s)
tcycle
(s)
FLR1
(SLPM)
FLR2
(SLPM) Effect of HR/LR (thus scycle time)
Base 0.5 5 1475 50 5400 15.5 55
S1 0.5 5 1575 50 5700 15.5 55
S2 0.5 5 1675 50 6000 15.5 55
S3 0.5 5 1975 50 6900 15.5 55
S4 0.5 5 2475 50 8400 15.5 55
S5 0.5 5 3475 50 11400 15.5 55
Effect of production LR step flow rate
Base 0.5 5 1475 50 5400 15.5 55
S6 0.5 5 1475 50 5400 17.5 55
S7 0.5 5 1475 50 5400 20 55
Effect of LR2 step flow rate
Base 0.5 5 1475 50 5400 15.5 55
S8 0.5 5 1475 50 5400 15.5 58
S9 0.5 5 1475 50 5400 15.5 62
S10 0.5 5 1475 50 5400 15.5 65
Effect of production LR step time
Base 0.5 5 1475 50 5400 15.5 55
S11 0.5 5 1475 75 5475 15.5 55
S12 0.5 5 1475 100 5550 15.5 55
Effect of PCnD
Base 0.5 5 1475 50 5400 15.5 55
S13 0.3 5 1475 50 5400 15.5 55
S14 0.1 5 1475 50 5400 15.5 55
Effect of PLR
Base 0.5 5 1475 50 5400 15.5 55
S15 0.5 4 1475 50 5400 15.5 55
*: Values in bold correspond to the parameters changed in the parametric study, with all other
parameters fixed.
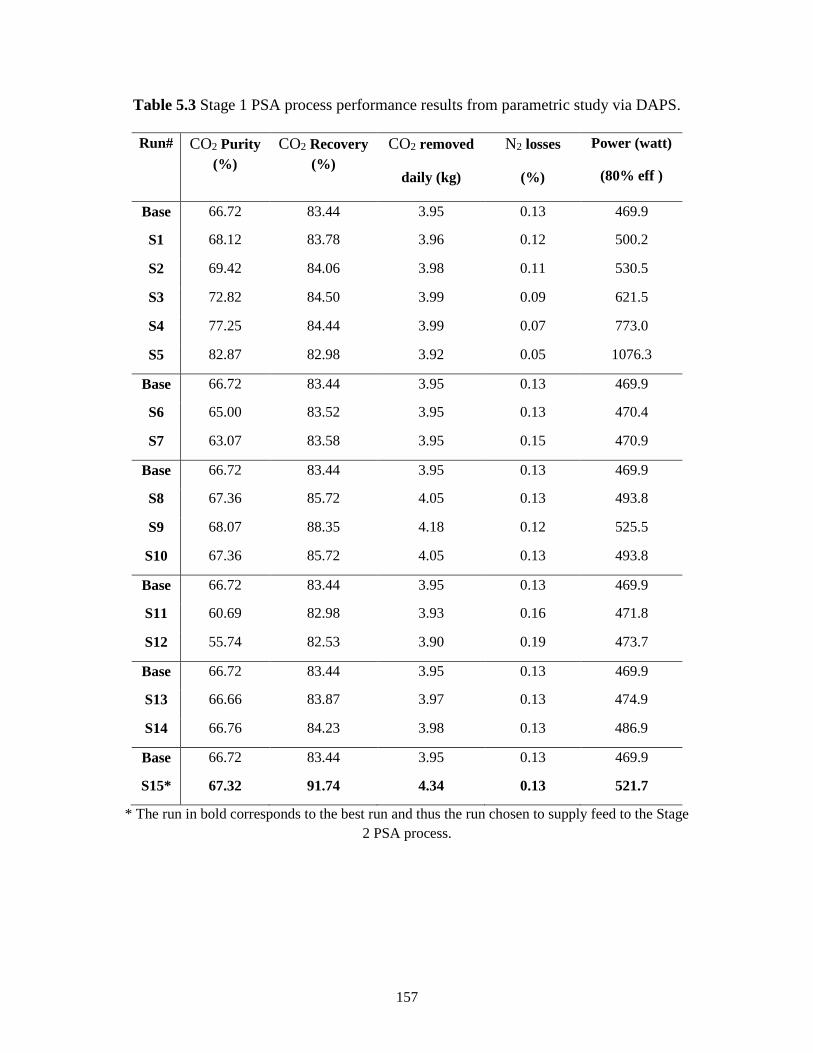
157
Table 5.3 Stage 1 PSA process performance results from parametric study via DAPS.
Run# CO2 Purity
(%)
CO2 Recovery
(%)
CO2 removed
daily (kg)
N2 losses
(%)
Power (watt)
(80% eff )
Base 66.72 83.44 3.95 0.13 469.9
S1 68.12 83.78 3.96 0.12 500.2
S2 69.42 84.06 3.98 0.11 530.5
S3 72.82 84.50 3.99 0.09 621.5
S4 77.25 84.44 3.99 0.07 773.0
S5 82.87 82.98 3.92 0.05 1076.3
Base 66.72 83.44 3.95 0.13 469.9
S6 65.00 83.52 3.95 0.13 470.4
S7 63.07 83.58 3.95 0.15 470.9
Base 66.72 83.44 3.95 0.13 469.9
S8 67.36 85.72 4.05 0.13 493.8
S9 68.07 88.35 4.18 0.12 525.5
S10 67.36 85.72 4.05 0.13 493.8
Base 66.72 83.44 3.95 0.13 469.9
S11 60.69 82.98 3.93 0.16 471.8
S12 55.74 82.53 3.90 0.19 473.7
Base 66.72 83.44 3.95 0.13 469.9
S13 66.66 83.87 3.97 0.13 474.9
S14 66.76 84.23 3.98 0.13 486.9
Base 66.72 83.44 3.95 0.13 469.9
S15* 67.32 91.74 4.34 0.13 521.7
* The run in bold corresponds to the best run and thus the run chosen to supply feed to the Stage
2 PSA process.
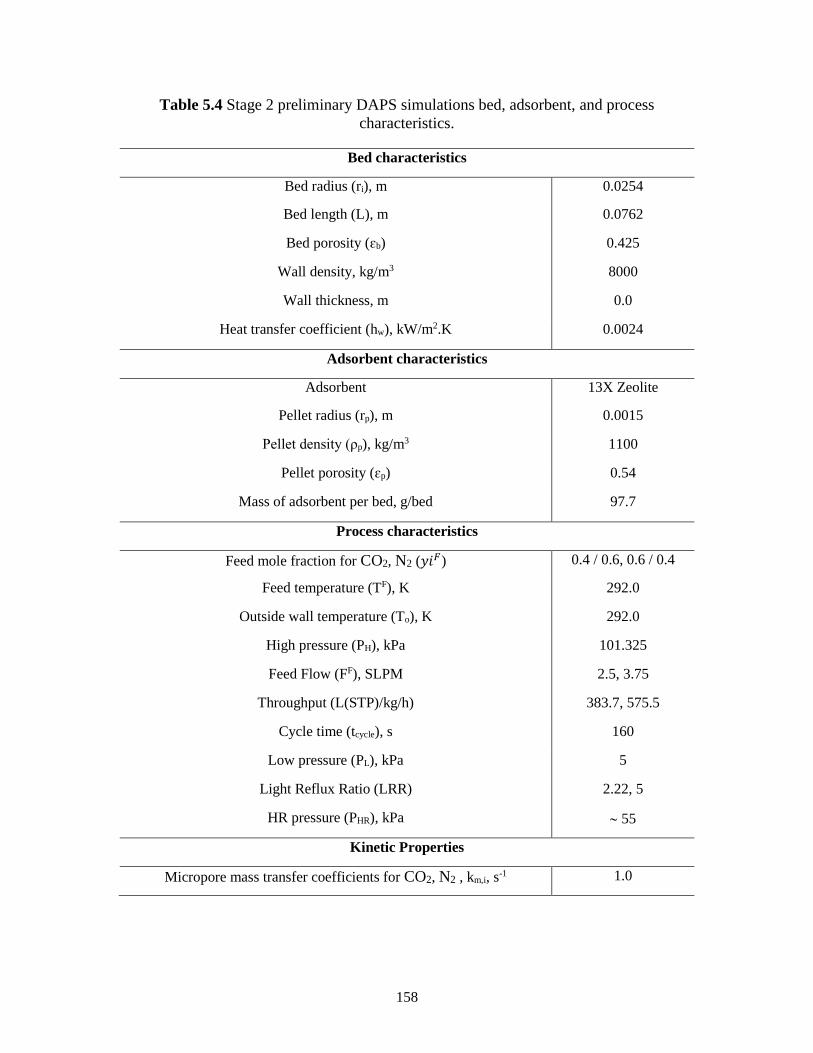
158
Table 5.4 Stage 2 preliminary DAPS simulations bed, adsorbent, and process
characteristics.
Bed characteristics
Bed radius (ri), m 0.0254
Bed length (L), m 0.0762
Bed porosity (ɛb) 0.425
Wall density, kg/m3 8000
Wall thickness, m 0.0
Heat transfer coefficient (hw), kW/m2.K 0.0024
Adsorbent characteristics
Adsorbent 13X Zeolite
Pellet radius (rp), m 0.0015
Pellet density (ρp), kg/m3 1100
Pellet porosity (ɛp) 0.54
Mass of adsorbent per bed, g/bed 97.7
Process characteristics
Feed mole fraction for CO2, N2 (𝑦𝑖𝐹) 0.4 / 0.6, 0.6 / 0.4
Feed temperature (TF), K 292.0
Outside wall temperature (To), K 292.0
High pressure (PH), kPa 101.325
Feed Flow (FF), SLPM 2.5, 3.75
Throughput (L(STP)/kg/h) 383.7, 575.5
Cycle time (tcycle), s 160
Low pressure (PL), kPa 5
Light Reflux Ratio (LRR) 2.22, 5
HR pressure (PHR), kPa 55
Kinetic Properties
Micropore mass transfer coefficients for CO2, N2 , km,i, s-1 1.0
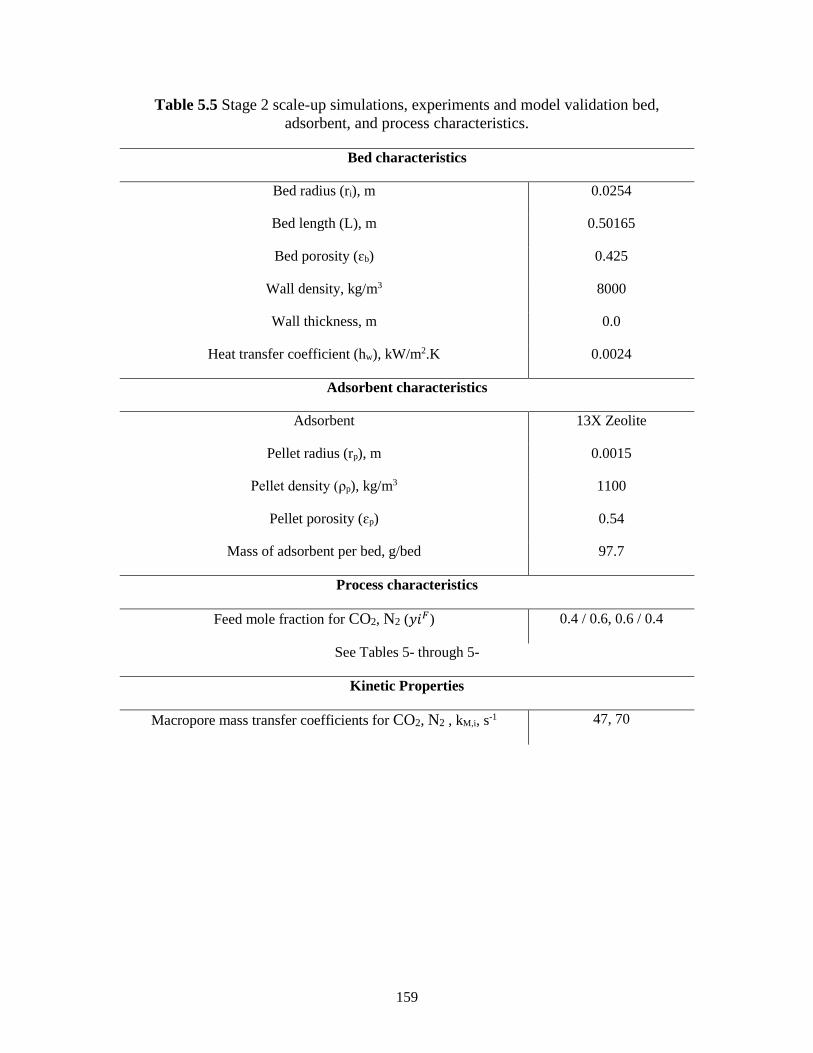
159
Table 5.5 Stage 2 scale-up simulations, experiments and model validation bed,
adsorbent, and process characteristics.
Bed characteristics
Bed radius (ri), m 0.0254
Bed length (L), m 0.50165
Bed porosity (ɛb) 0.425
Wall density, kg/m3 8000
Wall thickness, m 0.0
Heat transfer coefficient (hw), kW/m2.K 0.0024
Adsorbent characteristics
Adsorbent 13X Zeolite
Pellet radius (rp), m 0.0015
Pellet density (ρp), kg/m3 1100
Pellet porosity (ɛp) 0.54
Mass of adsorbent per bed, g/bed 97.7
Process characteristics
Feed mole fraction for CO2, N2 (𝑦𝑖𝐹) 0.4 / 0.6, 0.6 / 0.4
See Tables 5- through 5-
Kinetic Properties
Macropore mass transfer coefficients for CO2, N2 , kM,i, s-1 47, 70
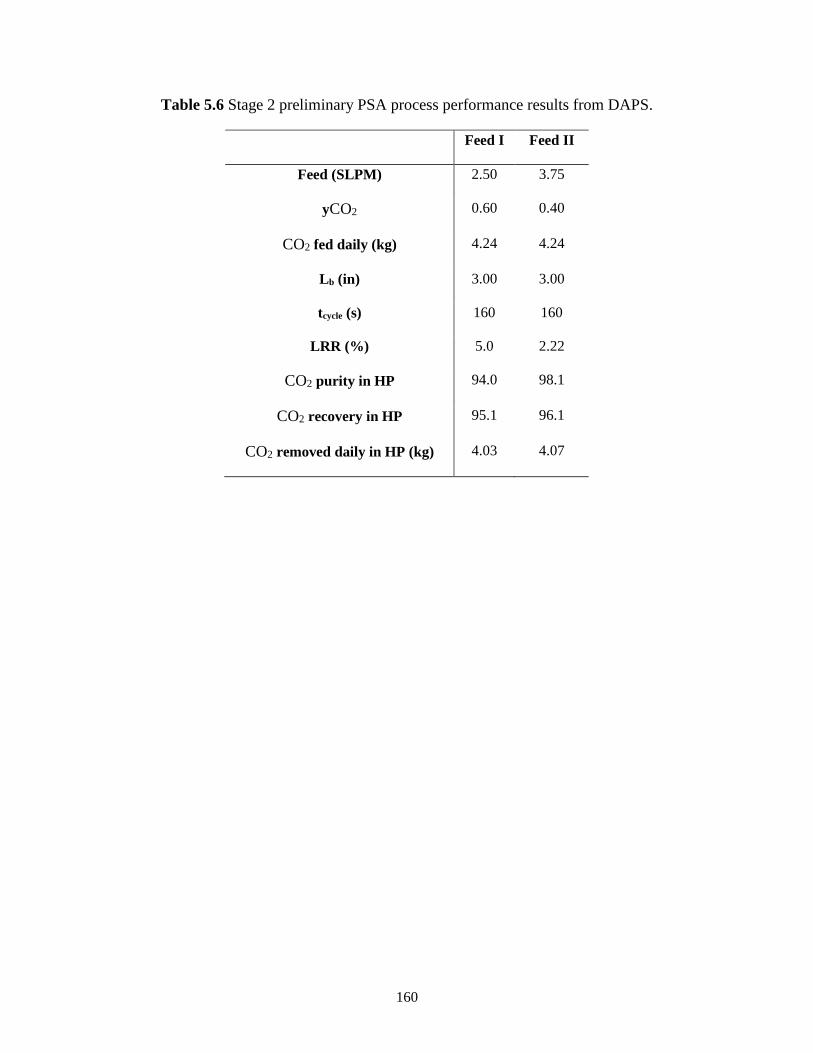
160
Table 5.6 Stage 2 preliminary PSA process performance results from DAPS.
Feed I Feed II
Feed (SLPM) 2.50 3.75
yCO2 0.60 0.40
CO2 fed daily (kg) 4.24 4.24
Lb (in) 3.00 3.00
tcycle (s) 160 160
LRR (%) 5.0 2.22
CO2 purity in HP 94.0 98.1
CO2 recovery in HP 95.1 96.1
CO2 removed daily in HP (kg) 4.03 4.07
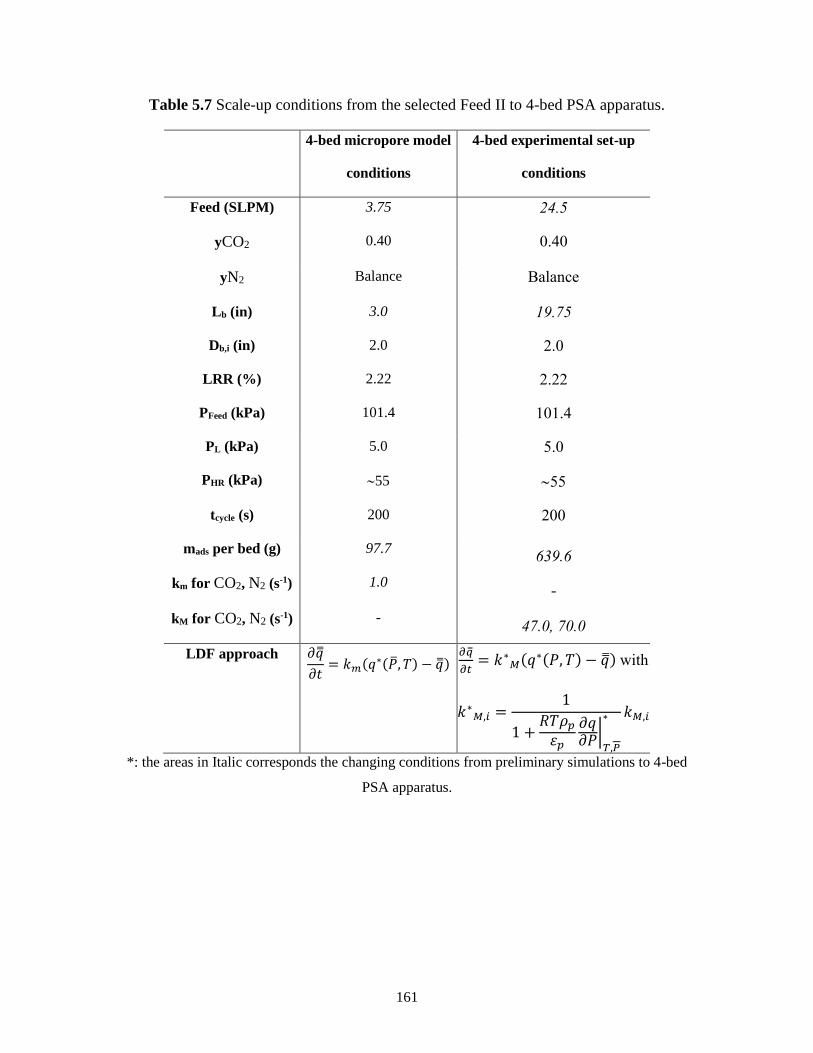
161
Table 5.7 Scale-up conditions from the selected Feed II to 4-bed PSA apparatus.
4-bed micropore model
conditions
4-bed experimental set-up
conditions
Feed (SLPM) 3.75 24.5
yCO2 0.40 0.40
yN2 Balance Balance
Lb (in) 3.0 19.75
Db,i (in) 2.0 2.0
LRR (%) 2.22 2.22
PFeed (kPa) 101.4 101.4
PL (kPa) 5.0 5.0
PHR (kPa) 55 55
tcycle (s) 200 200
mads per bed (g) 97.7 639.6
km for CO2, N2 (s-1) 1.0 -
kM for CO2, N2 (s-1) - 47.0, 70.0
LDF approach 𝜕�̿�
𝜕𝑡= 𝑘𝑚(𝑞∗(�̅�, 𝑇) − �̿�)
𝜕�̿�
𝜕𝑡= 𝑘∗
𝑀(𝑞∗(𝑃, 𝑇) − �̿�) with
𝑘∗𝑀,𝑖 =
1
1 +𝑅𝑇𝜌𝑝
𝜀𝑝
𝜕𝑞𝜕𝑃
|𝑇,𝑃
∗ 𝑘𝑀,𝑖
*: the areas in Italic corresponds the changing conditions from preliminary simulations to 4-bed
PSA apparatus.
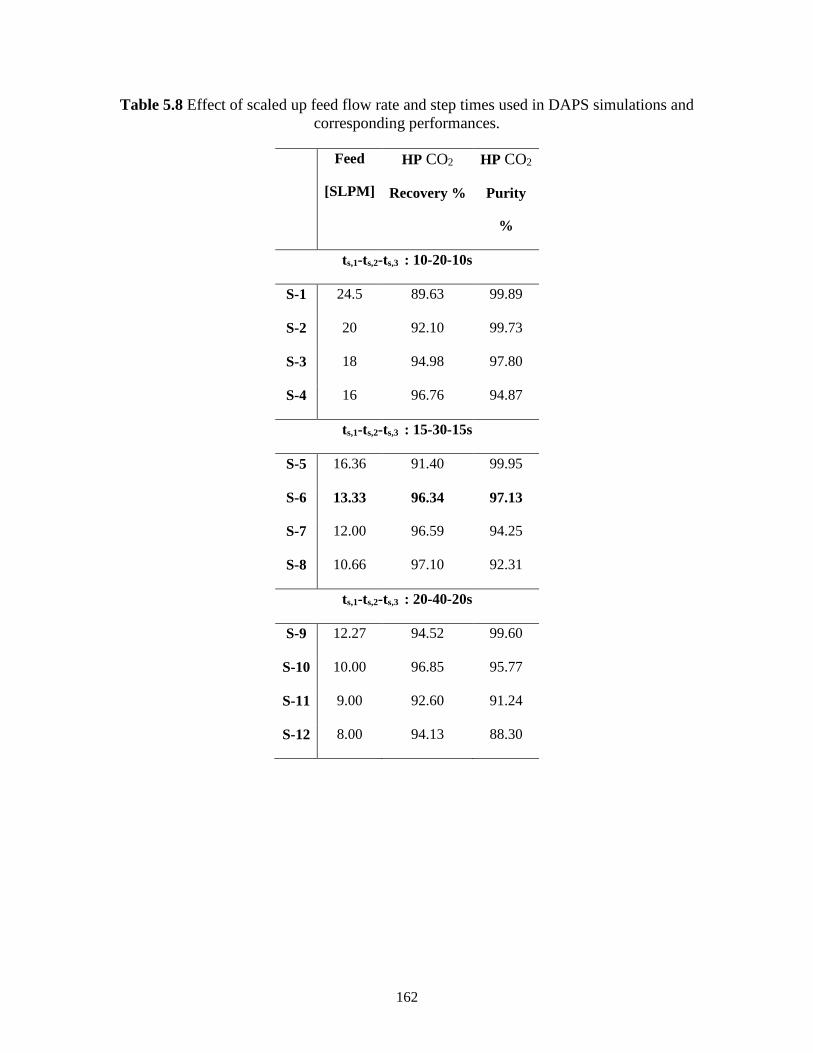
162
Table 5.8 Effect of scaled up feed flow rate and step times used in DAPS simulations and
corresponding performances.
Feed
[SLPM]
HP CO2
Recovery %
HP CO2
Purity
%
ts,1-ts,2-ts,3 : 10-20-10s
S-1 24.5 89.63 99.89
S-2 20 92.10 99.73
S-3 18 94.98 97.80
S-4 16 96.76 94.87
ts,1-ts,2-ts,3 : 15-30-15s
S-5 16.36 91.40 99.95
S-6 13.33 96.34 97.13
S-7 12.00 96.59 94.25
S-8 10.66 97.10 92.31
ts,1-ts,2-ts,3 : 20-40-20s
S-9 12.27 94.52 99.60
S-10 10.00 96.85 95.77
S-11 9.00 92.60 91.24
S-12 8.00 94.13 88.30
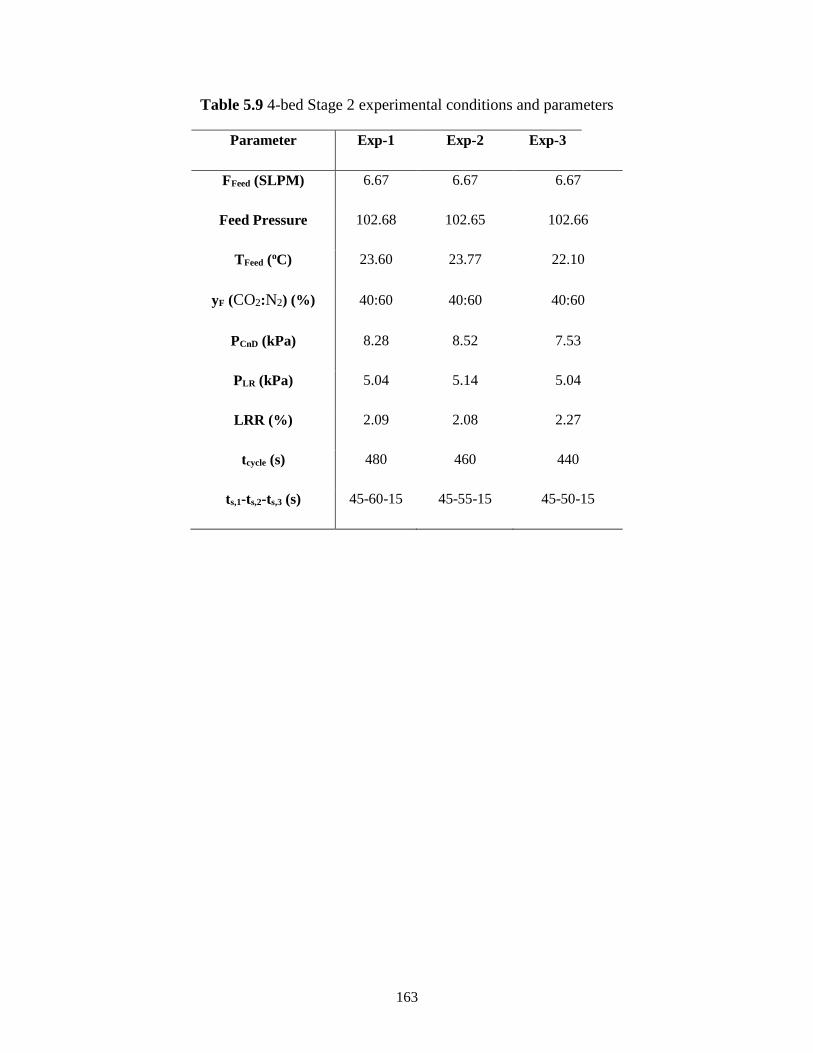
163
Table 5.9 4-bed Stage 2 experimental conditions and parameters
Parameter Exp-1 Exp-2 Exp-3
FFeed (SLPM) 6.67 6.67 6.67
Feed Pressure 102.68 102.65 102.66
TFeed (oC) 23.60 23.77 22.10
yF (CO2:N2) (%) 40:60 40:60 40:60
PCnD (kPa) 8.28 8.52 7.53
PLR (kPa) 5.04 5.14 5.04
LRR (%) 2.09 2.08 2.27
tcycle (s) 480 460 440
ts,1-ts,2-ts,3 (s) 45-60-15 45-55-15 45-50-15
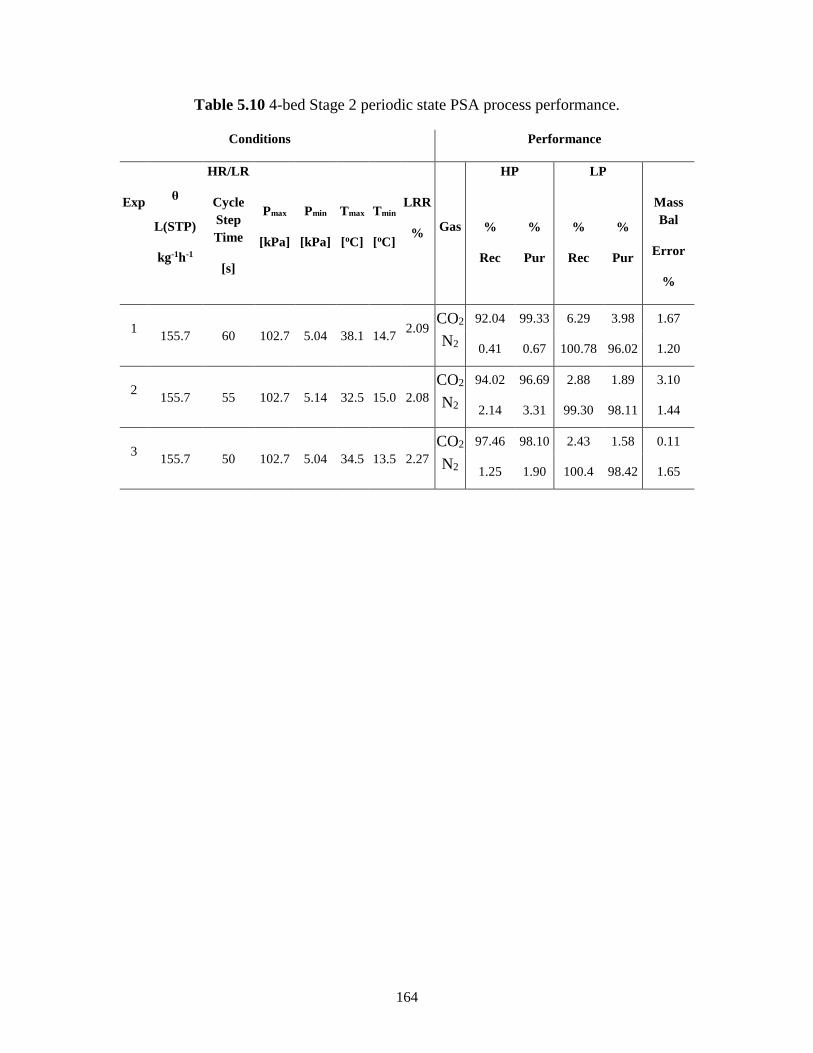
164
Table 5.10 4-bed Stage 2 periodic state PSA process performance.
Conditions Performance
Exp
θ
L(STP)
kg-1h-1
HR/LR
Cycle
Step
Time
[s]
Pmax
[kPa]
Pmin
[kPa]
Tmax
[oC]
Tmin
[oC]
LRR
% Gas
HP LP
Mass
Bal
Error
%
%
Rec
%
Pur
%
Rec
%
Pur
1 155.7 60 102.7 5.04 38.1 14.7
2.09 CO2 92.04 99.33 6.29 3.98 1.67
N2 0.41 0.67 100.78 96.02 1.20
2 155.7 55 102.7 5.14 32.5 15.0 2.08
CO2 94.02 96.69 2.88 1.89 3.10
N2 2.14 3.31 99.30 98.11 1.44
3 155.7 50 102.7 5.04 34.5 13.5 2.27
CO2 97.46 98.10 2.43 1.58 0.11
N2 1.25 1.90 100.4 98.42 1.65
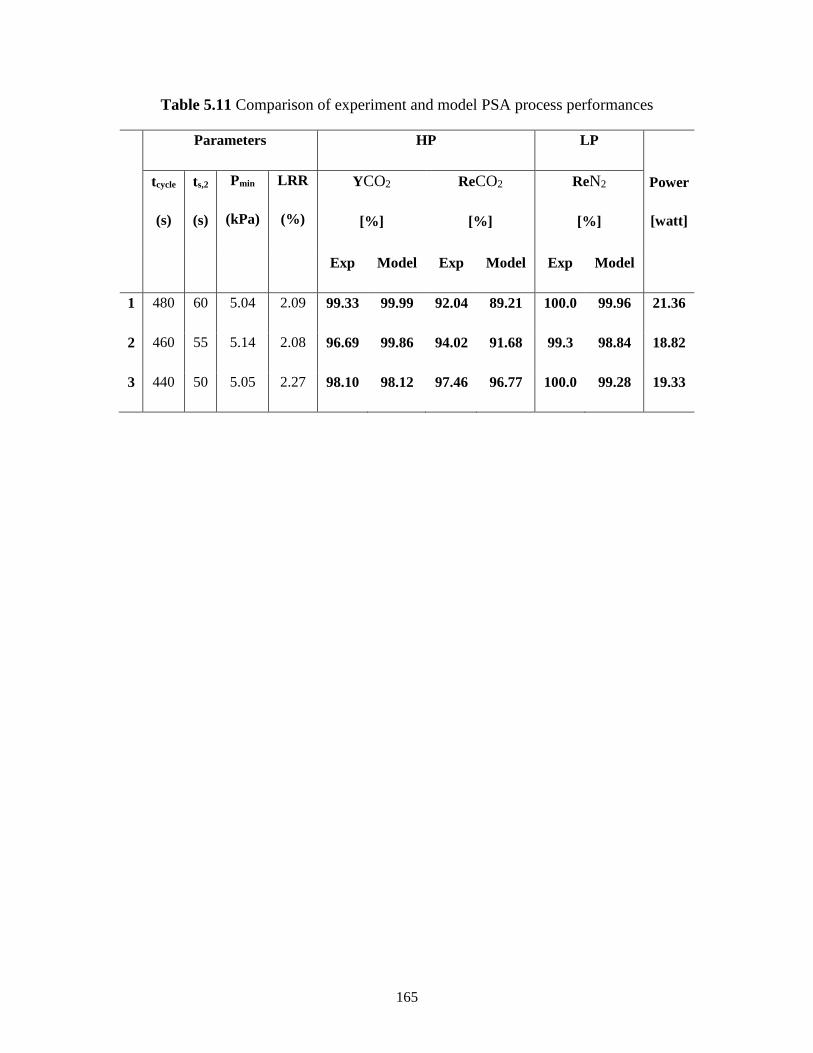
165
Table 5.11 Comparison of experiment and model PSA process performances
Parameters HP LP
Power
[watt]
tcycle
(s)
ts,2
(s)
Pmin
(kPa)
LRR
(%)
YCO2
[%]
ReCO2
[%]
ReN2
[%]
Exp Model Exp Model Exp Model
1 480 60 5.04 2.09 99.33 99.99 92.04 89.21 100.0 99.96 21.36
2 460 55 5.14 2.08 96.69 99.86 94.02 91.68 99.3 98.84 18.82
3 440 50 5.05 2.27 98.10 98.12 97.46 96.77 100.0 99.28 19.33
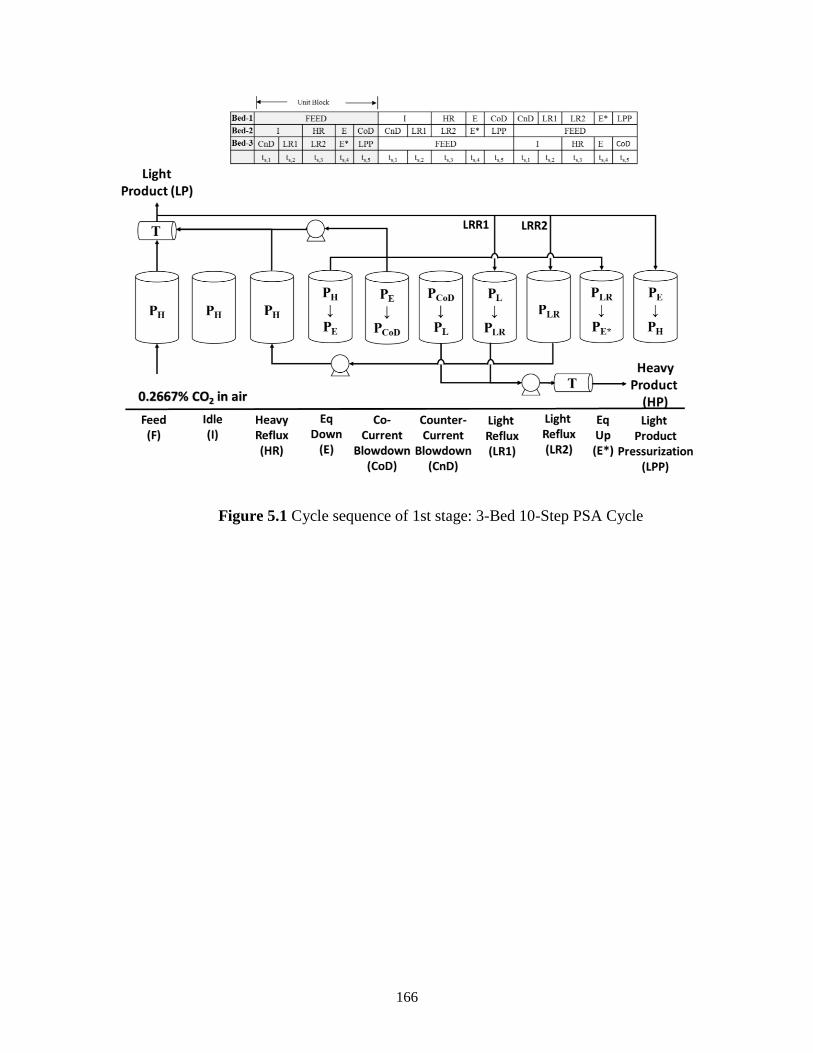
166
Figure 5.1 Cycle sequence of 1st stage: 3-Bed 10-Step PSA Cycle
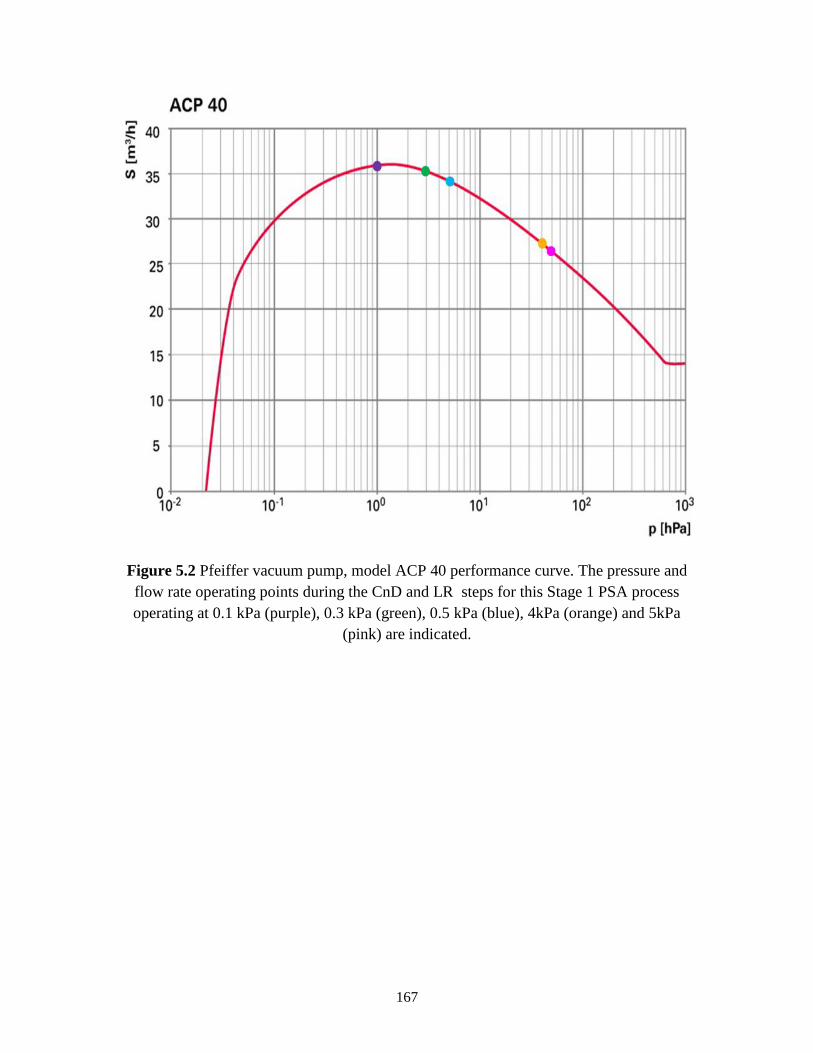
167
Figure 5.2 Pfeiffer vacuum pump, model ACP 40 performance curve. The pressure and
flow rate operating points during the CnD and LR steps for this Stage 1 PSA process
operating at 0.1 kPa (purple), 0.3 kPa (green), 0.5 kPa (blue), 4kPa (orange) and 5kPa
(pink) are indicated.

168
Figure 5.3 Effect of HR/LR/F step time (thus cycle time) on cyclic steady state
performance for the runs base and S1-5 in Table 5.2. a) CO2 purity and recovery, b) Total
Power.

169
Figure 5.4 Bed profiles at the end of HR step for each run (base and S1-5 in Table 5.2) at
periodic steady state.
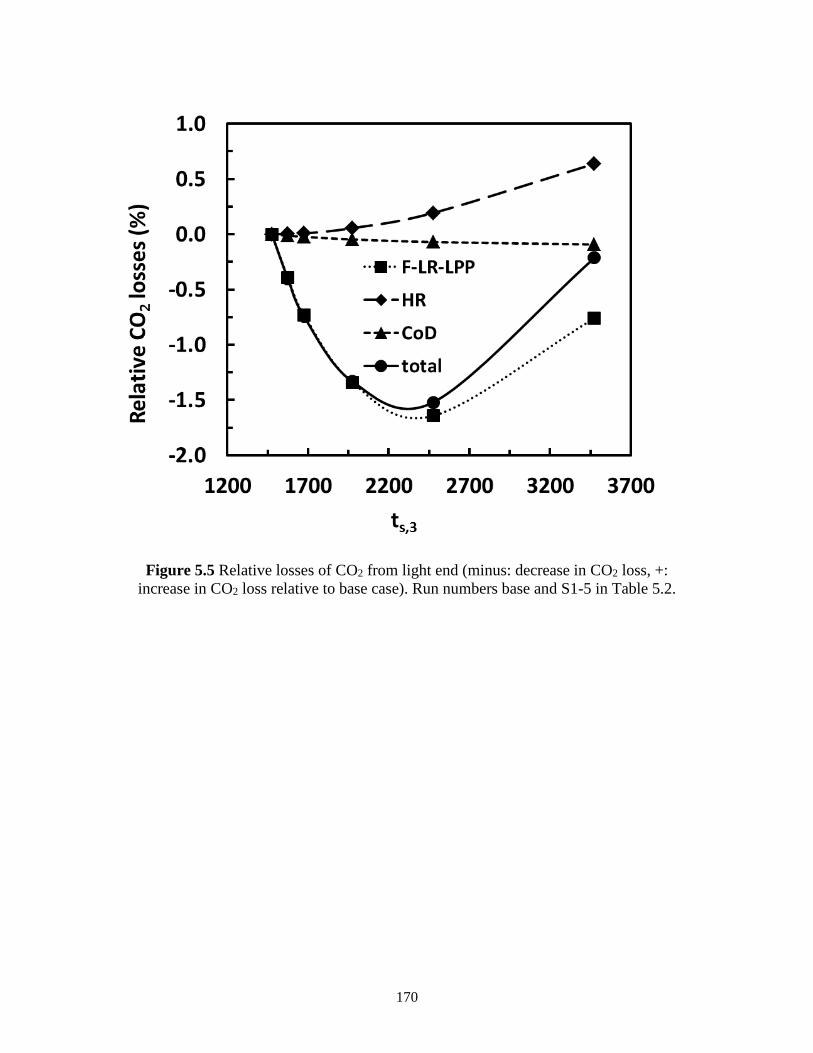
170
Figure 5.5 Relative losses of CO2 from light end (minus: decrease in CO2 loss, +:
increase in CO2 loss relative to base case). Run numbers base and S1-5 in Table 5.2.
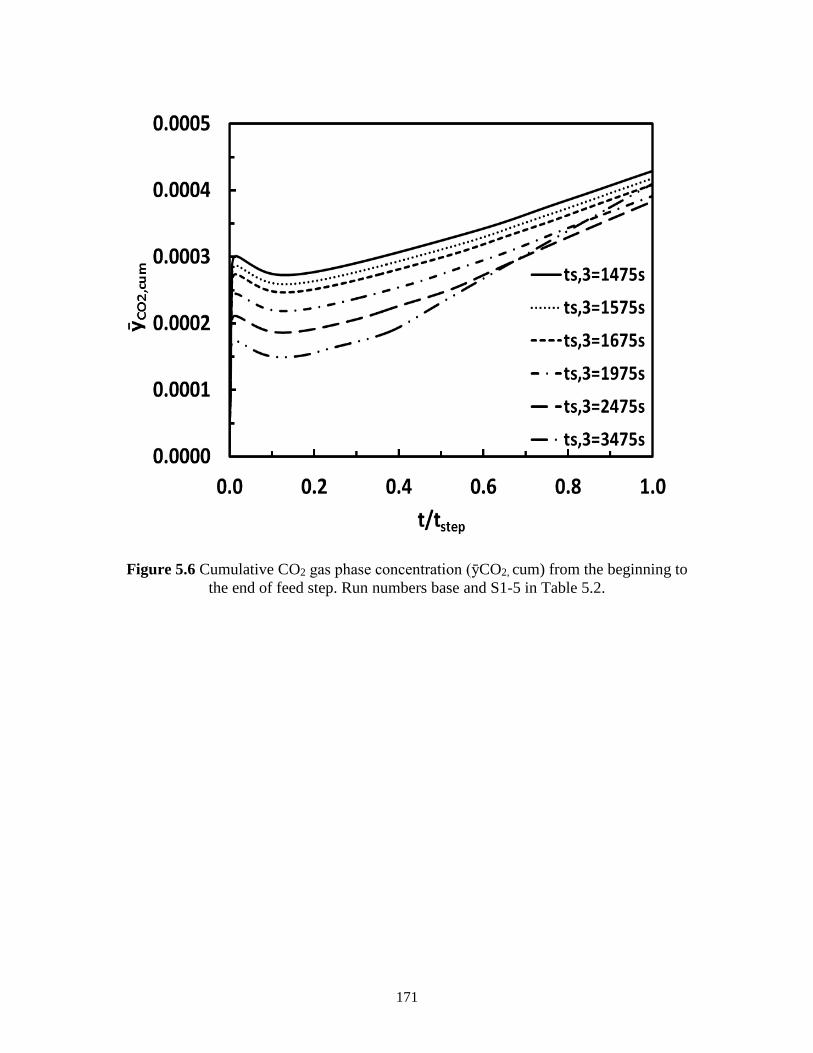
171
Figure 5.6 Cumulative CO2 gas phase concentration (ȳCO2, cum) from the beginning to
the end of feed step. Run numbers base and S1-5 in Table 5.2.
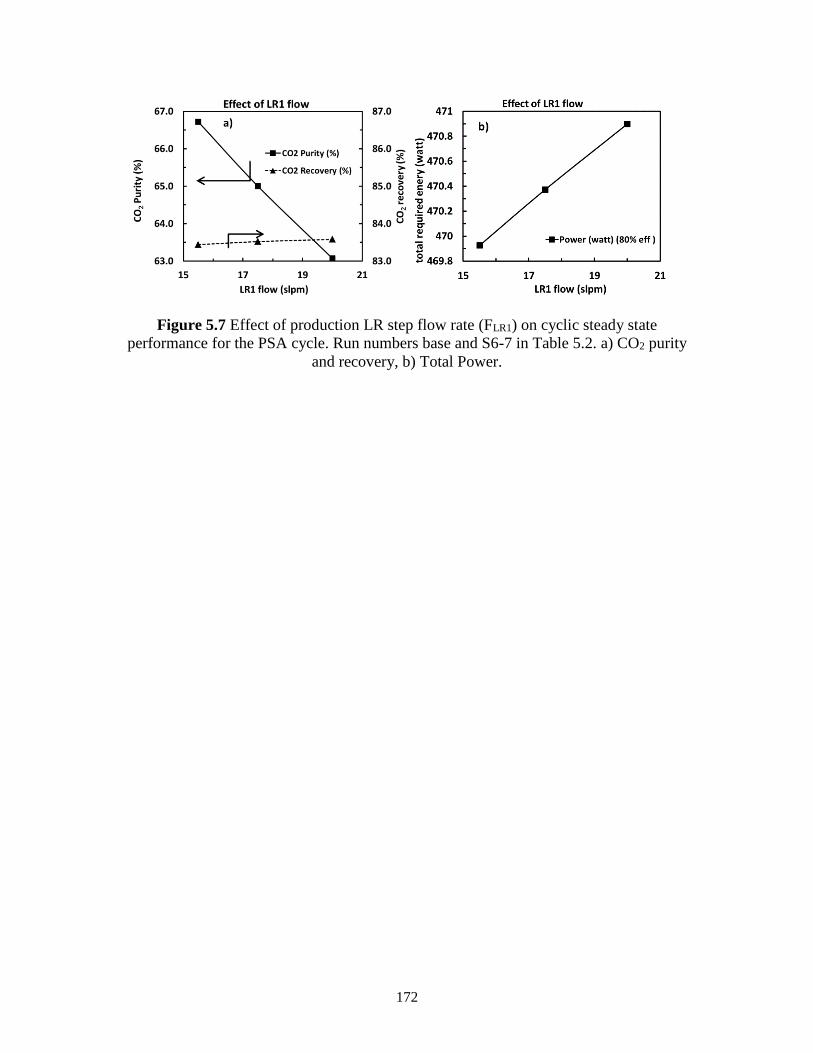
172
Figure 5.7 Effect of production LR step flow rate (FLR1) on cyclic steady state
performance for the PSA cycle. Run numbers base and S6-7 in Table 5.2. a) CO2 purity
and recovery, b) Total Power.
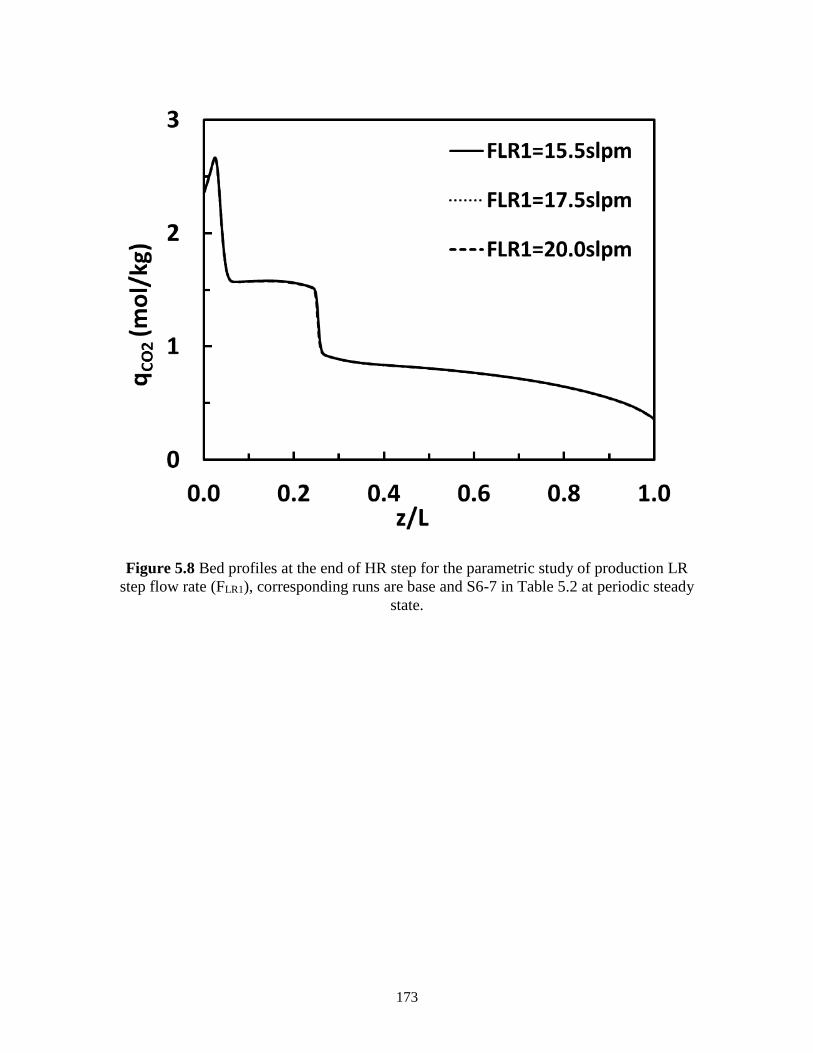
173
Figure 5.8 Bed profiles at the end of HR step for the parametric study of production LR
step flow rate (FLR1), corresponding runs are base and S6-7 in Table 5.2 at periodic steady
state.

174
Figure 5.9 Effect of light reflux 2 step flow rate (FLR2) on cyclic steady state
performance for the PSA cycle. Run numbers base and S8-10 in Table 5.2. a) CO2 purity
and recovery, b) Total Power.
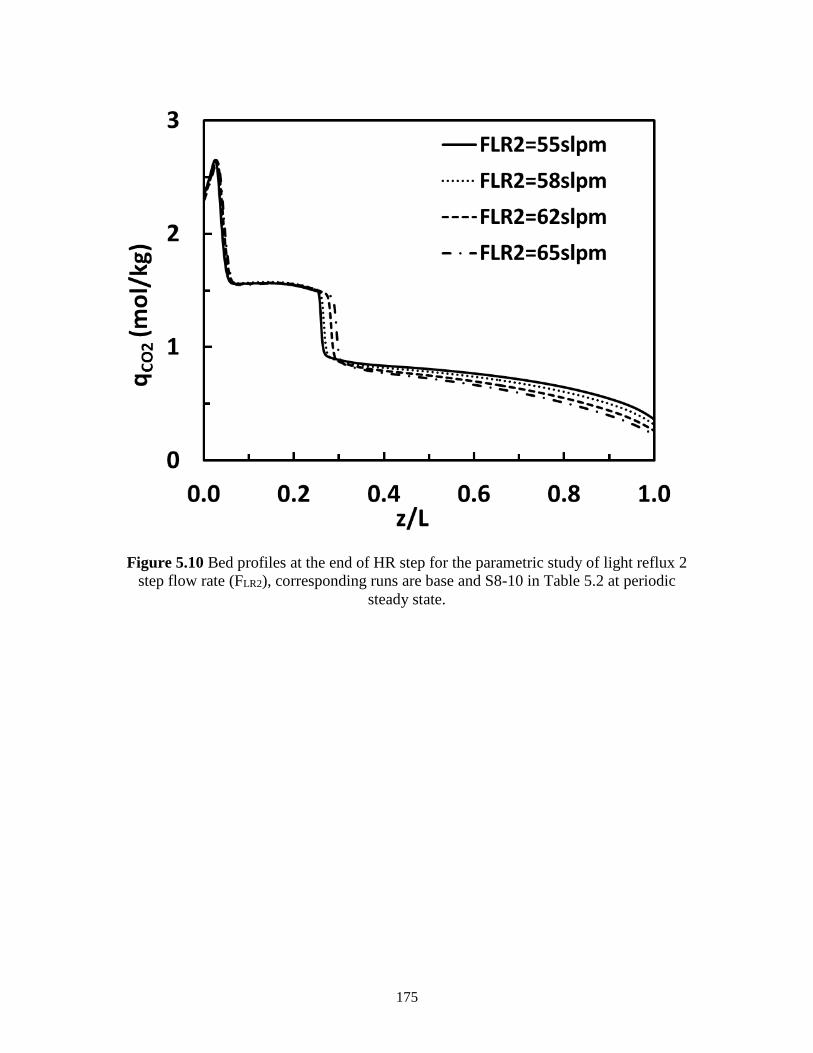
175
Figure 5.10 Bed profiles at the end of HR step for the parametric study of light reflux 2
step flow rate (FLR2), corresponding runs are base and S8-10 in Table 5.2 at periodic
steady state.
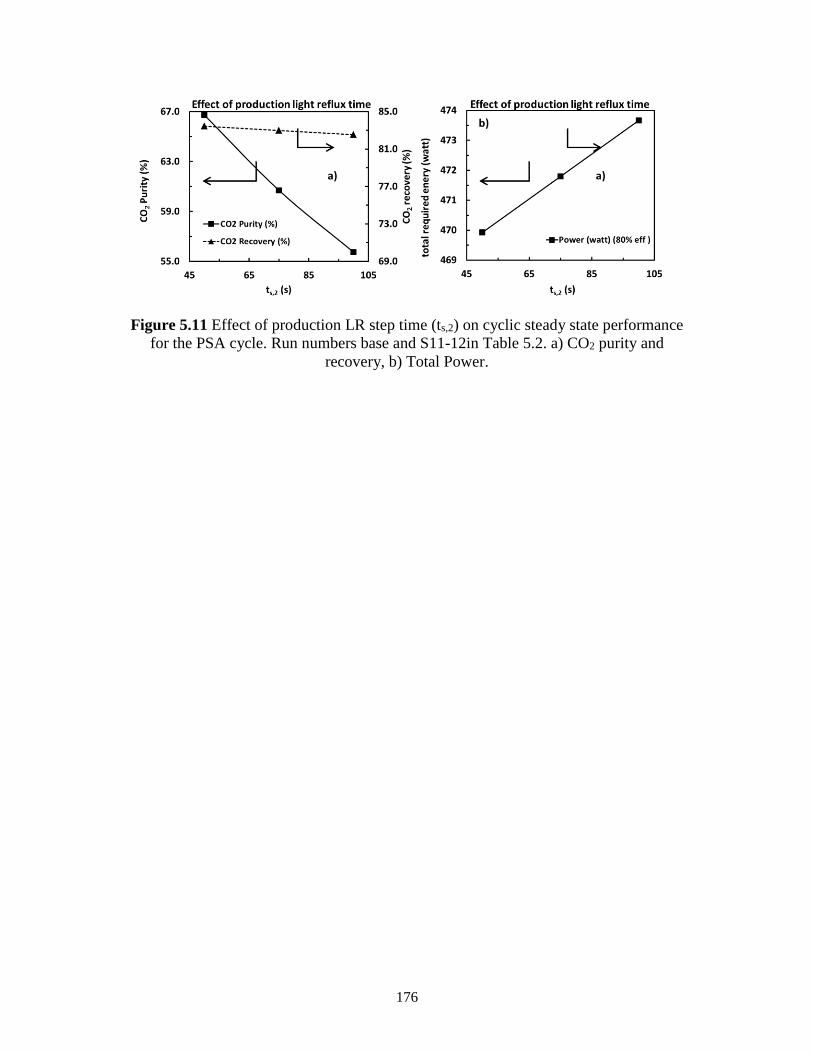
176
Figure 5.11 Effect of production LR step time (ts,2) on cyclic steady state performance
for the PSA cycle. Run numbers base and S11-12in Table 5.2. a) CO2 purity and
recovery, b) Total Power.
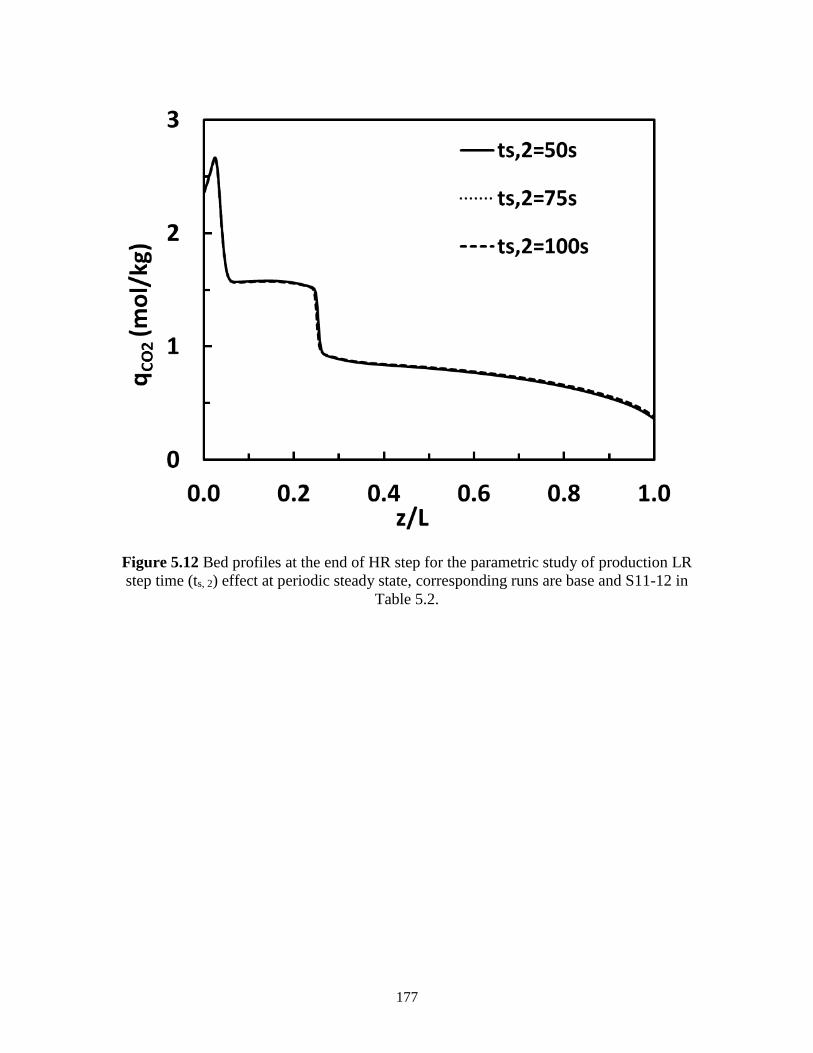
177
Figure 5.12 Bed profiles at the end of HR step for the parametric study of production LR
step time (ts, 2) effect at periodic steady state, corresponding runs are base and S11-12 in
Table 5.2.
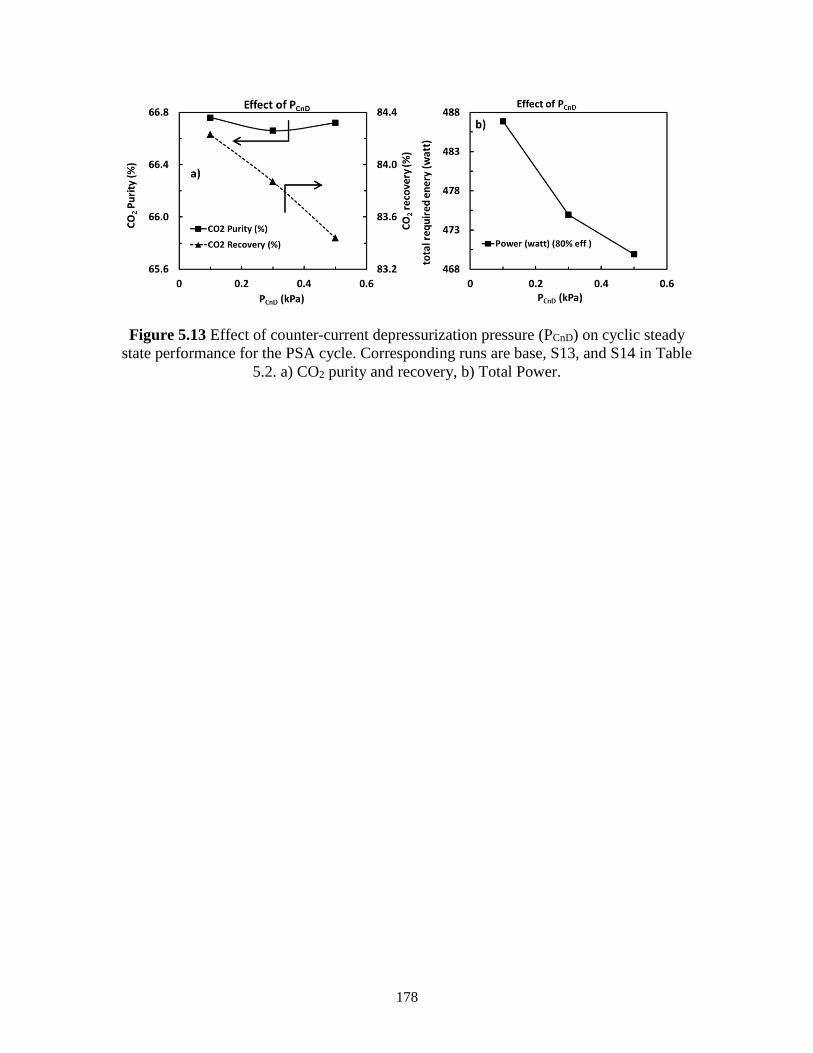
178
Figure 5.13 Effect of counter-current depressurization pressure (PCnD) on cyclic steady
state performance for the PSA cycle. Corresponding runs are base, S13, and S14 in Table
5.2. a) CO2 purity and recovery, b) Total Power.
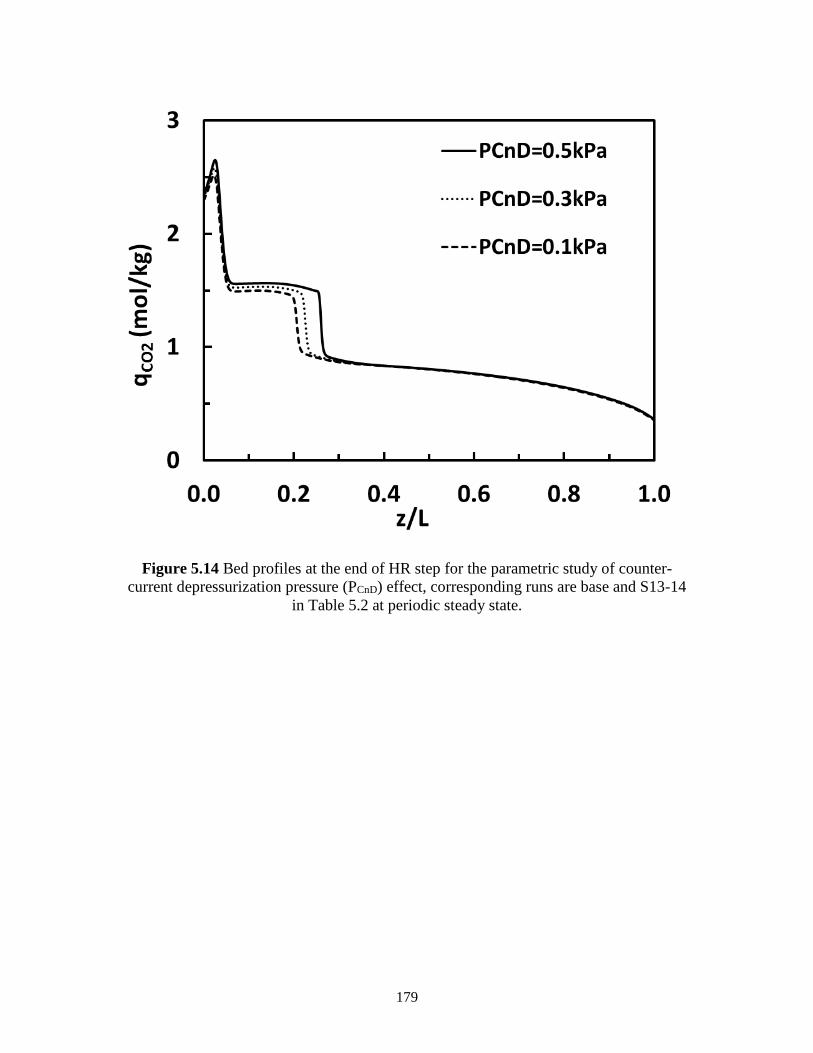
179
Figure 5.14 Bed profiles at the end of HR step for the parametric study of counter-
current depressurization pressure (PCnD) effect, corresponding runs are base and S13-14
in Table 5.2 at periodic steady state.
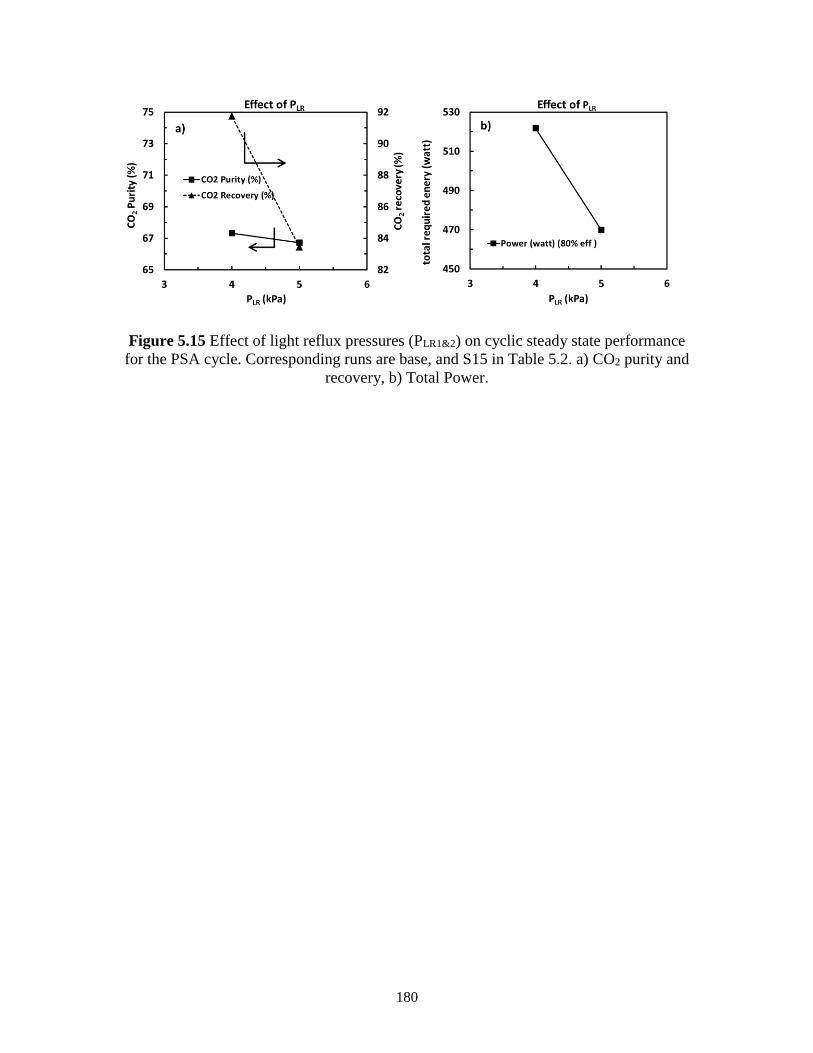
180
Figure 5.15 Effect of light reflux pressures (PLR1&2) on cyclic steady state performance
for the PSA cycle. Corresponding runs are base, and S15 in Table 5.2. a) CO2 purity and
recovery, b) Total Power.
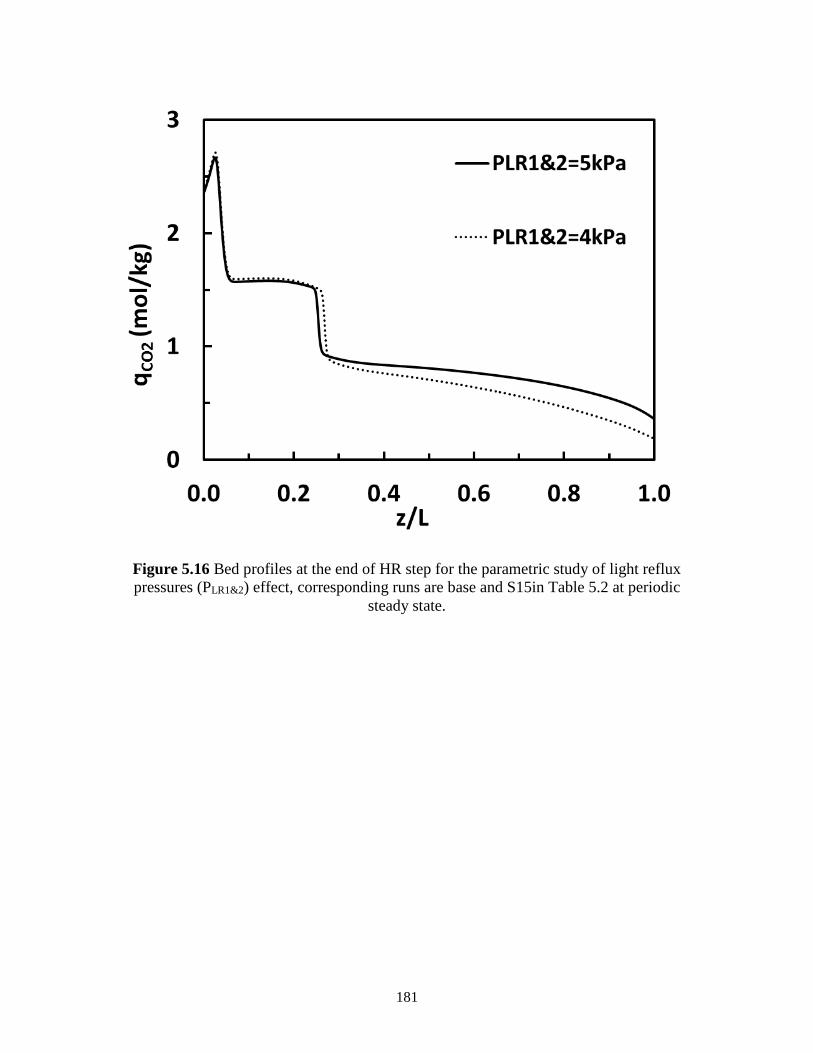
181
Figure 5.16 Bed profiles at the end of HR step for the parametric study of light reflux
pressures (PLR1&2) effect, corresponding runs are base and S15in Table 5.2 at periodic
steady state.
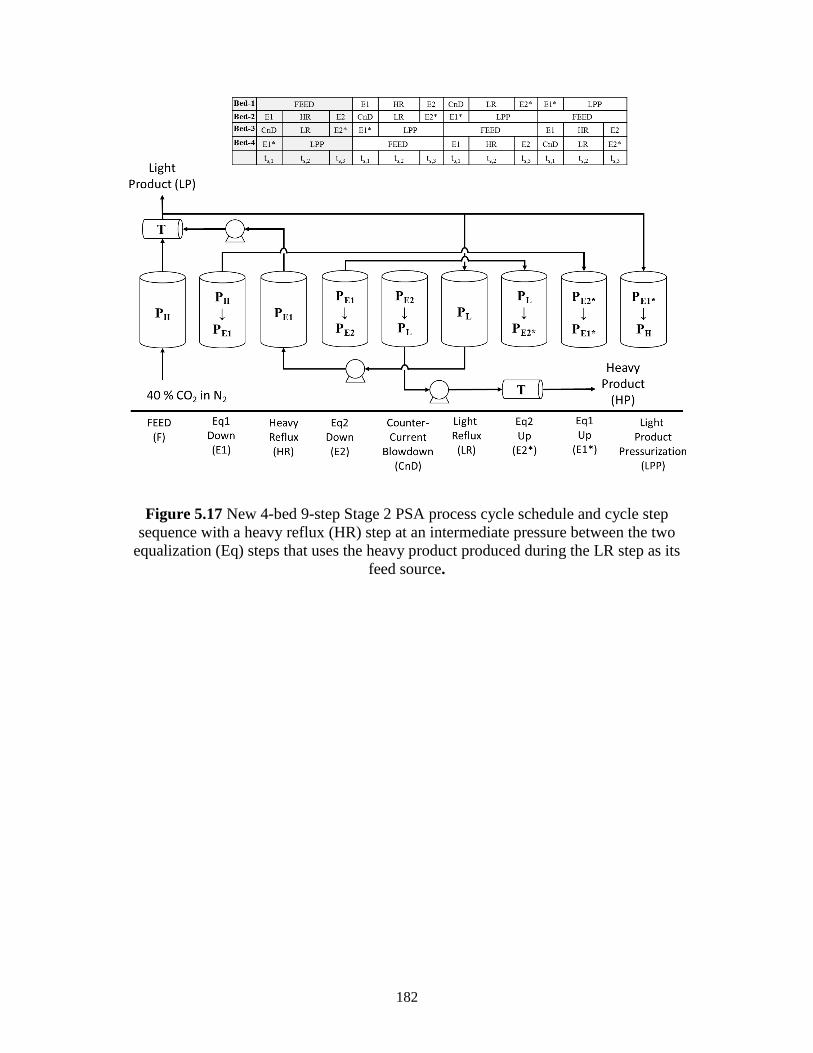
182
Figure 5.17 New 4-bed 9-step Stage 2 PSA process cycle schedule and cycle step
sequence with a heavy reflux (HR) step at an intermediate pressure between the two
equalization (Eq) steps that uses the heavy product produced during the LR step as its
feed source.
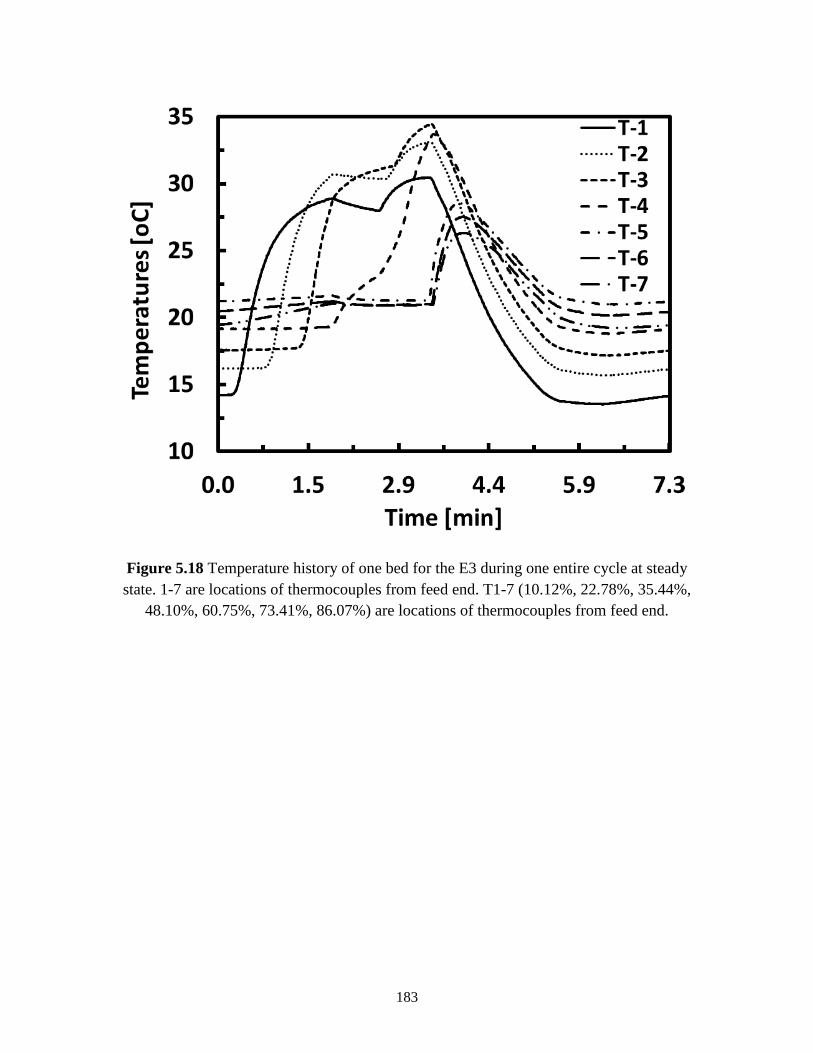
183
Figure 5.18 Temperature history of one bed for the E3 during one entire cycle at steady
state. 1-7 are locations of thermocouples from feed end. T1-7 (10.12%, 22.78%, 35.44%,
48.10%, 60.75%, 73.41%, 86.07%) are locations of thermocouples from feed end.
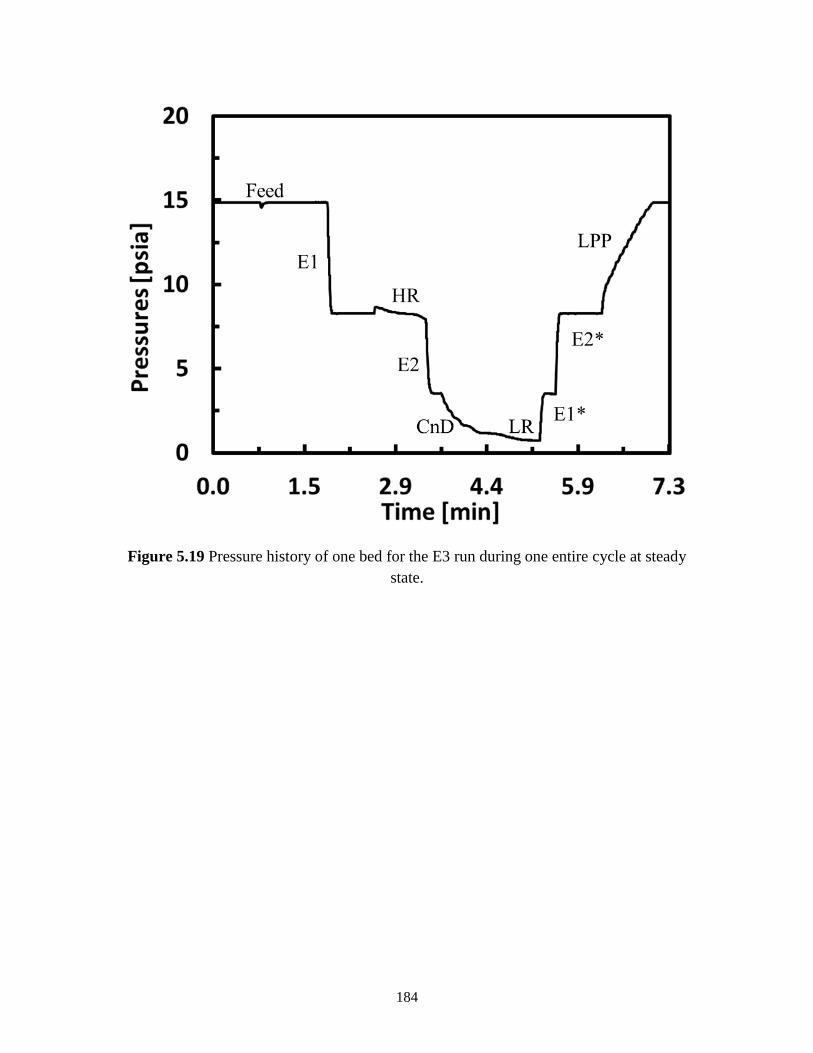
184
Figure 5.19 Pressure history of one bed for the E3 run during one entire cycle at steady
state.
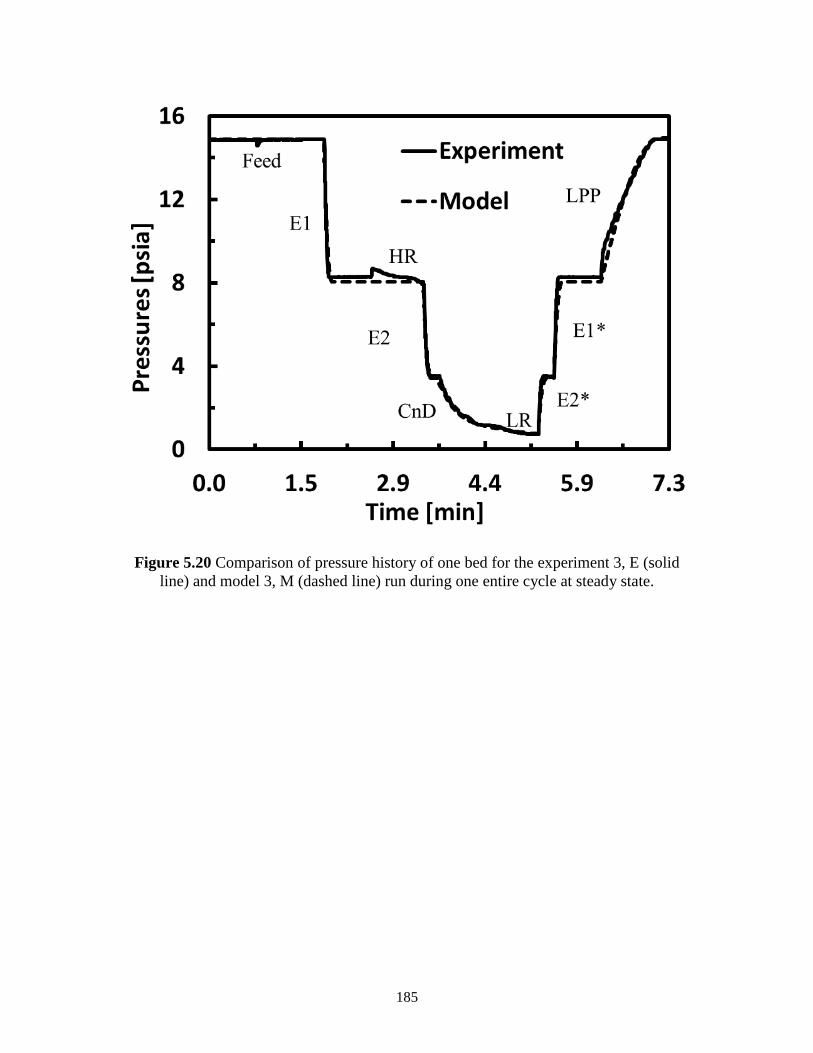
185
Figure 5.20 Comparison of pressure history of one bed for the experiment 3, E (solid
line) and model 3, M (dashed line) run during one entire cycle at steady state.
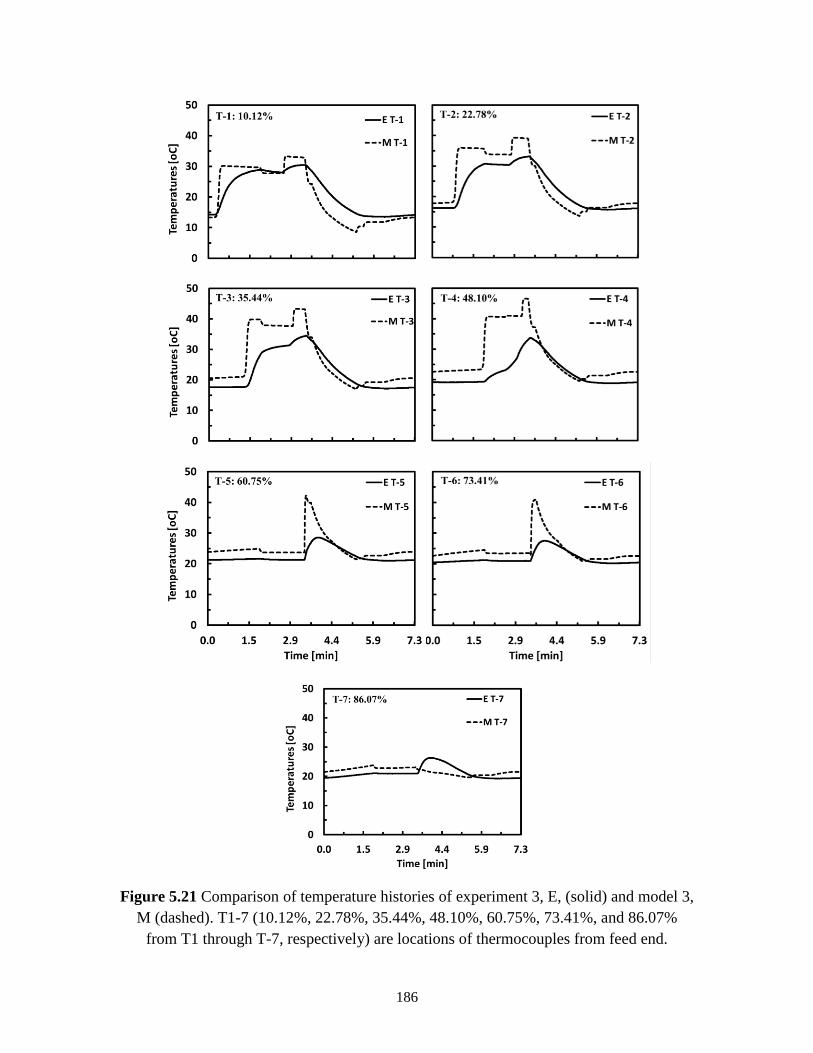
186
Figure 5.21 Comparison of temperature histories of experiment 3, E, (solid) and model 3,
M (dashed). T1-7 (10.12%, 22.78%, 35.44%, 48.10%, 60.75%, 73.41%, and 86.07%
from T1 through T-7, respectively) are locations of thermocouples from feed end.

187
Figure 5.22 Schematic of the two-stage PSA system designed to remove 4.0 kg/day of
metabolic CO2 from cabin air. Stage 1 is a 3-bed 10-step PSA process with the
dimensions of I.D: 10.62 in, L: 19.75 in and Stage 2 is a 4-bed 9-step PSA process the
dimensions of I.D: 1.5 in, L: 19.75in.
188
REFERENCES
Baciocchi, Renato, Giuseppe Storti, and Marco Mazzotti. 2006. “Process Design and
Energy Requirements for the Capture of Carbon Dioxide from Air.” Chemical
Engineering and Processing: Process Intensification 45 (12): 1047–58.
doi:10.1016/j.cep.2006.03.015.
Belmabkhout, Youssef, Rodrigo Serna-Guerrero, and Abdelhamid Sayari. 2010. “Amine-
Bearing Mesoporous Silica for CO2 Removal from Dry and Humid Air.” Chemical
Engineering Science 65 (11). Elsevier: 3695–98. doi:10.1016/j.ces.2010.02.044.
Bhadra, Shubhra Jyoti. 2012. “Purification of Ammonia by Pressure Swing Adsorption.”
Bowman, W. H., and R. M. Lawrence. 1971. “Life-Support Systems for Manned Space
Flights.” Space Resources for Teachers 1: 526–28.
Brown, Peter n., Alan c. Hindmarsh, and r. Petzold Linda. 1994. “Using Krylov Methods
in the Solution of Large-Scale Differential Algebraic Systems.”
Carey, R., A. Gomezplata, and A. Sarich. 1983. “An Overview into Submarine CO2
Scrubber Development.” Ocean Engineering 10 (4): 227–33. doi:10.1016/0029-
8018(83)90010-0.
Carrasquillo, Robyn. 2013. “ISS Environmental Control and Life Support System
(ECLSS) Future Development for Exploration.” In 2nd Annual ISS Research and
Development Conference.
Carrasquillo, Robyn L. 2008. “ISS ECLSS Technology Evolution for Exploration.”
American Institute of Aeronautics and Astronautics.
Casaburri, Angelo A., Cathy A. Gardner, and Jane A. George. 1999. “Space Food and
Nutrition: An Educator’s Guide with Activities in Science and Mathematics.”
Choi, SD, JH Drese, PM Eisenberger, and CW Jones. 2009. “A New Paradigm of
Anthropogenic CO2 Reduction: Adsorptive Fixation of CO2 from the Ambient Air
as a Carbon Negative Technology.” In Presented at AIChE Annu. Meet.
Council, National Research. 1997. Advanced Technology for Human Support in Space.
The National Academies Press.
DallBauman, L A, and J E Finn. 1999. “Adsorption Processes in Spacecraft
Environmental Control and Life Support Systems.” Stud Surf Sci Catal 120: 455–71.
http://www.ncbi.nlm.nih.gov/entrez/query.fcgi?cmd=Retrieve&db=PubMed&dopt=
Citation&list_uids=12741388.
189
Daues, K. 2006. “A History of Spacecraft Environmental Control and Life Support
Systems.” NASA Johnson Space Center.
Diagne, Doudou, Motonobu Goto, and Tsutomu Hirose. 1995. “Parametric Studies on
CO2 Separation and Recovery by a Dual Reflux PSA Process Consisting of Both
Rectifying and Stripping Sections.” Industrial Engineering and Chemical Research
34 (9): 3083–89. doi:10.1021/ie00048a020.
Do, Duong D. 1998. Adsorption Analysis: Equilibria and Kinetics.
Dosch, M.P. 2006. “The Anesthesia Gas Machine.”
Ebner, Armin D, M L Gray, N G Chisholm, Q T Black, D D Mumford, M A Nicholson,
and J A Ritter. 2011. “Suitability of a Solid Amine Sorbent for CO2 Capture by
Pressure Swing Adsorption.” Industrial & Engineering Chemistry Research 50:
5634–41.
Ebner, Armin D, and James A Ritter. 2009. “State-of-the-Art Adsorption and Membrane
Separation Processes for Carbon Dioxide Production from Carbon Dioxide Emitting
Industries.” Separation Science and Technology 44 (6): 1273–1421.
doi:10.1080/01496390902733314.
Ernsting, J. 1999. “Breathing Systems in Aerospace.” In Institute of Electrical Engineers
(IEE) Colloquium, 24–27.
Ewert, Michael K, Daniel J Barta, and Jeff Mcquillan. 2009. “Exploration Life Support
Technology Development for Lunar Missions.” Space.
Filburn, T., W.C. Dean, and G. Thomas. 1998. “Development of a Pressure Swing
CO2/H2O Removal System for an Advanced Sapcesuit.” SAE Paper No. 981673.
Gatens, Robyn, and Gary A. Ruff. 2013. “Environmental Control & Life Support / Fire
Safety Systems Maturation Team Status.”
Hodgson, E., D. Converse, M. Duggan, and G. Gentry. 2012. “Flexible Path
Environmental Control and Life Support Technology—Possible First Steps to Move
Beyond LEO.” In AIAA 42nd International Conference on Environmental Systems.
Howard, D., Perry, J., and Roman, M. 2014. “Lessons Learned from the Development
and Implementation of the Atmosphere Re-Source Recovery and Environmental
Monitoring Project.” In AIAA Space 2014 Conference and Exposition.
Hwang, Hyun Tae, Aadesh Harale, Paul K T Liu, Muhammad Sahimi, and Theodore T.
Tsotsis. 2008. “A Membrane-Based Reactive Separation System for CO2 Removal
in a Life Support System.” Journal of Membrane Science 315 (1–2): 116–24.
doi:10.1016/j.memsci.2008.02.018.
Johnson, S. R. 1992. “Regenerative Trace Contaminant Control: New Test Method for
Effects on Solid Amine.” ICES Paper 921349.
190
Johnson, scott R., george g. Garrad, and shirley m. Mitchell. 1993. “Multifunction Air
Revitalization Systems: Combined CO2-Trace Contaminant Removal Using Solid
Amines.” In 30th Space Congress Proceedings.
Jones, Christopher W. 2011. “CO(2) Capture from Dilute Gases as a Component of
Modern Global Carbon Management.” Annual Review of Chemical and
Biomolecular Engineering 2: 31–52. doi:10.1146/annurev-chembioeng-061010-
114252.
Kawai, T. 1986. “Monograph of PSA Technology.”
Keith, David, Minh Ha-duong, and Joshua Stolaroff. 2006. “Climate Strategy with CO2
Capture from the Air To Cite This Version : Climate Strategy with CO 2 Capture
from the Air.” Climatic Change 74 (1–3): 17–45.
Knox, J.C. and Howard, D. 2007. “New Methods for the Adsorption of Carbon Dioxide
and Water Vapor from Manned Spacecraft Atmospheres: Applications and
Modeling.” In Comsol Conference.
Knox, J. C. 2000. “International Space Station Carbon Dioxide Removal Assembly
TestingNo Title.” Society of Automotive Engineers.
Knox, J. C., R. Booth, H. Gauto, D. Trinh, R. Gostowski, R. Bush, C. Stanley, D.
Watson, J. Thomas, and L. A. Miller. 2014. “Development of Carbon Dioxide
Removal Systems for Advanced Exploration Systems 2012-2013.” In International
Conference on Environmental Systems.
Knox, J. C., R. Gostowski, D. Watson, J. A. Hogan, E. King, and J Thomas. 2012.
“Development of Carbon Dioxide Removal Systems for Advanced Exploration
Systems.” In International Conference on Environmental Systems.
Knox, J. C., L. A. Knox, J. C., Gauto, H., Trinh, D., Winard, D., Gostowski, R., Watson,
D., Kittredge, K., King, E., Thomas, J., and Miller, H. Gauto, D. Trinh, D. Winard,
R. Gostowski, D. Watson, et al. 2013. “Development of Carbon Dioxide Removal
Systems for Advanced Exploration Systems 2012-2013.” In International
Conference on Environmental Systems.
Knox, James C., Robert Coker, Timothy L. Huff, Robyn Gatens, Lee A. Miller, and
Christine Stanley. 2015. “Development of Carbon Dioxide Removal Systems for
Advanced Exploration Systems 2014-2015.” In 45th International Conference on
Environmental Systems.
Knox, James C, Melissa Campbell, Karen Murdoch, Lee A Miller, and Frank Jeng. 2005.
“Integrated Test and Evaluation of a 4-Bed Molecular Sieve (4BMS) Carbon
Dioxide Removal System (CDRA), Mechanical Compressor Engineering
Development Unit (EDU), and Sabatier Engineering Development Unit (EDU).” In
International Conference on Environmental Systems.

191
L., Ingelfinger A., and Secord T. C. 1970. “Life Support for Large Space Stations.”
ASTRONAUTICS AND AERONAUTICS 8: 56–64.
Lackner, K. S., S. Brennan, J. M. Matter, a.- H. a. Park, a. Wright, and B. van der Zwaan.
2012. “The Urgency of the Development of CO2 Capture from Ambient Air.”
Proceedings of the National Academy of Sciences 109 (33): 13156–62.
doi:10.1073/pnas.1108765109.
Lackner, K S. 2009. “Capture of Carbon Dioxide from Ambient Air” 106: 93–106.
doi:10.1140/epjst/e2009-01150-3.
Lackner, Klaus, P Grimes, and H Ziock. 1999. “Capturing Carbon Dioxide from Air.”
http://www.netl.doe.gov/publications/proceedings/01/carbon_seq/7b1.pdf.
Lackner, Klaus S, and Sarah Brennan. 2009. “Envisioning Carbon Capture and Storage :
Expanded Possibilities due to Air Capture , Leakage Insurance , and C-14
Monitoring,” 357–78. doi:10.1007/s10584-009-9632-0.
Lackner, Klaus, Hans-Joachim Ziock, and Patrick Grimes. 1999. “Carbon Dioxide
Extraction From Air: Is It An Option?” In 24th Annual Technical Conference on
Coal Utilization & Fuel Systems.
Mattox, E M, and D.M. Bardot. 2011. “Carbon Dioxide Removal System For Closed
Loop Atmosphere Revitalization, Candidate Sorbents Screening And Test Results.”
62nd International Astronautical Congress, Cape Town, SA., 1–8.
Matty, Christopher M. 2010. “Overview of Carbon Dioxide Control Issues During
International Space Station / Space Shuttle Joint Docked Operations.”
Mohammadi, Nima, Lutfi Erden, Armin D Ebner, and James A. Ritter. 2016.
“Adsorption Equilibrium of Nitrogen, Oxygen, Argon, Carbon Dioxide, Carbon
Monoxide, Methane, Ethane, Propane, Ethylene and Propylene on 13X Zeolite.” To
Be Submitted.
Moore, P. 2007. “Miner Protection.” Min. Mag. 196.
Mulloth, Lila M, and John E Finn. 1998. “Carbon Dioxide Adsorption on a 5A Zeolite
Designed for CO2 Removal in Spacecraft Cabins.” Nasatm1998208752, no.
November: 1–12.
http://www.scubaengineer.com/documents/carbon_dioxide_absorption_using_molec
ular_sieve.pdf.
Murdock, K. 2010. “Integrated Evaluation of Closed Loop Air Revitalization System
Components.”
NASA. n.d. “Life Support Reference Guide: ECLS System Components, Oxygen,
Carbon Dioxide.” E-Mission Space Station Alpha. http://www.e-
missions.net/ssa/pdf/ReferenceGuide Life Support.pdf.
———. 2001. “Staying Cool on the ISS.”
192
NASA Facts. 2004. “International Space Station: Environmental Control and Life
Support System.” National Aeronautics and Space Administration.
http://www.nasa.gov/centers/marshall/pdf/104840main_eclss.pdf.
Nikulshina, V, N Ayesa, and A Steinfeld. 2008. “Feasibility of Na-Based
Thermochemical Cycles for the Capture of CO 2 from Air — Thermodynamic and
Thermogravimetric Analyses” 140: 62–70. doi:10.1016/j.cej.2007.09.007.
Pearson A.O., Jackson J.K. 1971. “Summary of a 90-Day Manned Test of a Regenerative
Life Support SystemNo Title.” Astronautical Research, 149–62.
Perry, J., J. Knox, K. Parrish, M. Roman, D. Jan, and M. Abney. 2012. “Integrated
Atmosphere Resource Recovery and Environmental Monitoring Technology
Demonstration for Deep Space Exploration.” In AIAA 42nd International Conf. on
Env.Systems.
Perry, Jay L, Morgan B Abney, Ruth E Conrad, Kenneth R Frederick, Zachary W
Greenwood, Matthew J Kayatin, James C Knox, et al. 2015. “Evaluation of an
Atmosphere Revitalization Subsystem for Deep Space Exploration Missions.” In
45th International Conference on Environmental Systems.
Rahman, Md Atikur. 2016. “Development of a Pressure Swing Adsorption (PSA) Process
for CO2 Capture from Flue Gas.” University of South Carolina.
Rudolph, H., G. Hebestreit, and D. Harzer. 2000. “Porous Foils Filled With Active
Substances in Life Support Systems of Manned Space Flight.” Journal of Plastic
Film and Sheeting 16 (4): 301–11. doi:10.1106/768H-PXC4-CHVC-3LRL.
Ruthven, D. M.; Farooq, S. 1994. Pressure Swing Adsorption.
Satyapal, Sunita, Thomas Filburn, H. Harvey Michels, and John Graf. 1999. “A Unique
Solid Amine Sorbent Useful for Capturing Low Concentrations of Carbon Dioxide.”
Greenhouse Gas Control Technologies, 113–18.
Satyapal, Sunita, Tom Filburn, John Trela, and Jeremy Strange. 2000. “NOVEL SOLID
AMINE SORBENTS AND APPLICATIONS FOR CARBON Dioxide Removal,”
655–59.
———. 2001. “Performance and Properties of a Solid Amine Sorbent for Carbon
Dioxide Removal in Space Life Support Applications.” Energy and Fuels 15 (2):
250–55. doi:10.1021/ef0002391.
Sherif, Dina El, James C Knox, Nasa Marshall, and Space Flight. 2005. “International
Space Station Carbon Dioxide Removal Assembly ( ISS CDRA ) Concepts and
Advancements.”
Stolaroff, Joshuah K, and David W Keith. 2008. “Carbon Dioxide Capture from
Atmospheric Air Using Sodium Hydroxide Spray” 42 (8): 2728–35.
193
Suzuki, M. 1991. Adsorption Engineering. Reactive Polymers. Vol. 14.
doi:10.1016/0923-1137(91)90043-N.
Tondeur, D.; Wankat, P. C. 1985. “Gas Purification by Pressure Swing Adsorption.” Sep.
Purif. Methods 14 (2): 157.
Tsai, Chung-Yi A., Ipek Guray, Xia Tang, Tim Nalette, Catherine Thibaud‐Erkey, C.
Jeffrey Brinker, and George Xomerita. 2003. “Novel Amine-Functional Membrane
for Metabolic CO2 Removal from Spacesuit Breathing Loop.” In AIP Conference
Proceedings, 654:861–68. doi:10.1063/1.1541378.
Wieland, Paul. 1994. “Designing for Human Presence in Space : An Introduction to
Environmental Control and Life.”
Yang, R. T. 1987. Gas Separation by Adsorption Processes.
Yoshida, Masayuki, James a. Ritter, Akio Kodama, Motonobu Goto, and Tsutomu
Hirose. 2003. “Enriching Reflux and Parallel Equalization PSA Process for
Concentrating Trace Components in Air.” Industrial & Engineering Chemistry
Research 42 (8): 1795–1803. doi:10.1021/ie010114z.
Zeman, Frank S, and Klaus S Lackner. 2004. “Capturing Carbon Dioxide Directly from
the Atmosphere.” World Resource Review 16 (2): 157–72.
http://wordpress.ei.columbia.edu/lenfest/files/2012/11/ZEMAN_LACKNER_2004.p
df.