Embed Size (px)
Citation preview

Two Sides of the Same Coin: How Category Ambiguity Affects Multiple Audience Evaluations
Elizabeth G. Pontikes
University of Chicago Booth School of Business
January 2010
Word count: 11,472
Acknowledgements: I would like to thank Mike Hannan, Huggy Rao, Bill Barnett, Greta Hsu, Giacomo Negro, Amanda Sharkey, Damon Phillips, and Ron Burt for helpful comments and suggestions, Eunjun Hyun for assisting with data collection, and the University of Chicago Booth School of Business for Support.

1
Two Sides of the Same Coin: How Category Ambiguity Affects Multiple Audience Evaluations
Abstract
Recent research indicates that when organizations are hard to categorize they will suffer
in terms of external evaluations. Here, I suggest this depends on the type of audience that is
evaluating the organization. Some audiences have little influence over organizations and look for
products and services that fulfill particular requirements. They use classification systems as maps
to navigate an organizational world and are put off by unclear categorical affiliations. Other
audiences have a voice in shaping organizations and seek novelty. Members of these audiences
are motivated to understand organizations that do not easily fit into a category structure. For the
first type of audience, ambiguous categories make organizations unclear and less appealing. For
the second type, the same ambiguity is flexible and more appealing. I test these ideas in the
context of the software industry for audiences of consumers as opposed to venture capitalists. As
predicted, organizations in ambiguous categories are less appealing to consumers, but more
appealing to venture capitalists. Differences between category-level and organization-level
measures of ambiguity, and implications for the emergence of category structures are discussed.

2
Researchers are becoming increasingly interested in how categorization affects organizations.
Observers use categories to make sense of the organizational world, and categories help define
what people should expect from an organization. Important performance outcomes are
influenced by how organizations are categorized. Specifically, a consensus has been building that
organizations that span multiple categories are hard to understand, and therefore are less likely to
be successful on a range of outcomes, as compared to more focused competitors. This has been
demonstrated in a number of contexts, from discounted valuations on the stock market
(Zuckerman, 1999) to reduced sales on eBay (Hsu, Hannan, and Koçak, 2009), to lower ratings
for feature films (Hsu, 2006). It seems that when organizations muddy their identities by
spanning categories, they reduce the appeal of their offerings.
Yet, despite this organizations in many contexts continue to expand their offerings across
categories. In addition, organizations also identify with ambiguous categories that have a
relatively unclear social meaning. This is especially evident in the software industry where the
category structure is a network of overlapping labels (see figure 2). In this industry,
organizations frequently belong to more than one category, and many categories have ambiguous
social meaning. If part of an organization’s identity is derived from its category affiliation, and
previous research that shows organizations suffer when they do not have clear identities, then
how does a category structure like the software industry come to be?
I suggest that both affiliating with ambiguous categories and identifying with multiple
categories can increase an organization’s appeal to certain types of audiences. Previous research
that documents hazards of spanning multiple categories takes the perspective of an audience that
has little influence over an organization, such as a typical consumer. Members of this type of
audience evaluate an organization depending on whether its products or services meet specific

3
needs. Categories are used as cognitive structures that facilitate this goal. This kind of audience
is not interested in spending cognitive energy trying to understand an organization that does not
easily fit into a category. Organizations with ambiguous categorical identities may not come up
when an individual is searching for a specific product or service. When people do evaluate the
offerings of these organizations, they may use the wrong criteria and so the organization will
come up short. As a result, this type of audience devalues organizations that claim to be in many
different categories or those that are in ambiguous categories.
At the same time, studies also indicate that some groups are less put off than others by
organizations that are hard to classify. Rather than advocating conformity, institutional
entrepreneurs changed the default form for art museums (DiMaggio, 1991) and drew on
previously unconnected cultural beliefs to create consumer watchdog organizations (Rao, 1998).
Enthusiast users of an online review site did not devalue organizations in ambiguous categories
as much as casual users (Kovács and Hannan, 2009). These findings indicate that when people
are actively involved in a domain, they may not be as averse to organizations that are not
coherently classified.
In this paper, I show that some audiences prefer organizations that do not have clear
categorical identities. Audiences that have influence over an organization and that prize novelty
will be motivated to spend time understanding organizations that are hard to classify. Therefore,
organizations with unclear identities will not be devalued because they violate categorical
expectations. Rather, they may benefit as a result of multivocality and brokerage. Organizations
with ambiguous identities can adapt their offerings if there are unforeseen changes in an
industry, and have the potential to appeal to many different tastes. Research in the network
tradition suggests that multivocality – or the ability be interpreted in different ways by different

4
audiences – is beneficial (Padgett and Ansell, 1993). Brokerage, or linking otherwise
unconnected groups, is also advantageous (Burt, 1992). Thus, the way an organization with an
unclear identity is regarded depends on the perspective of the person evaluating the organization.
For an audience with little influence that is looking for specific functionality, categorical
ambiguity makes organizations unclear. But for an audience with voice that is looking for the
next “new thing,” this same ambiguity is flexible.
This investigation contributes to extant literature on categorization in two ways. First, it
reconciles two disparate views regarding whether it is more beneficial to have a clear identity
that fits a well-defined category, or to cultivate a flexible identity that can fit multiple
perspectives. Findings here show that the same category affiliations are evaluated differently
depending on the audience. In this way, this study brings the relational nature of categories
squarely into view. Theories of categorization emphasize the importance of defining a relevant
audience for a particular set of categories (Zuckerman, 1999; Hannan, Pólos, and Carroll, 2007).
However, previous literature does not explicitly examine when two different audiences will have
opposing reactions to the same categorical claims. In this study, I show that unclear identities
result in divergent evaluations by two distinct audiences.
Second, this study looks at both organizational- and category-level characteristics to
examine how unclear identities affect evaluations. Much previous research uses category
spanning to indicate whether an organization has an unclear identity, and assumes that the
underlying categories have the same strength of meaning. Recent work indicates that category-
level characteristics are also influential. All categories convey social meaning, but some are
more ambiguous, lenient, and have fuzzier boundaries than others. This can impact member
organizations. Spanning categories did not affect an organization’s credit ratings when category

5
boundaries were blurred, but those in ambiguous categories were consistently less likely to
receive high ratings (Ruef and Patterson, 2009). In another study, users of an online review site
preferred organizations in unambiguous categories (Kovács and Hannan, 2009). These studies
indicate that an unclear organizational identity can arise from category and organizational
factors. In this paper, both category ambiguity (category-level) and category spanning
(organization-level) are used to indicate whether an organization has an unclear identity.
I investigate these ideas within the context of the software industry, for the time period
from 1990 to 2002. Software companies classify themselves in meaningful ways in order to
attract investors and customers. Boundary setting is one of the most important tasks for a
software entrepreneur (Santos and Eisenhardt, 2009), and it continues to be critical as companies
grow. Some organizations claim membership in well-defined categories to establish a clear and
focused identity, while others affiliate with ambiguous categories. In some organizations,
managers create an original label in an attempt to establish a new market for a new class of
goods. The resulting classification structure is a network of overlapping categories used to
classify organizations.1
There are two audiences that are vital to software organizations: consumers and venture
capitalists. Consumers tend to have less direct influence and focus on finding a product or
service that fulfills a specific goal. Venture capitalists have much more influence over the
companies they are involved with, and they seek out innovative organizations that have the
potential to change an industry. Below, I suggest that while affiliating with ambiguous categories
1 Previous research on categorization distinguishes between labels for a class of organizations, and categories, which are schematized and have a consensual social meaning (Hannan, Pólos, and Carroll, 2007). The data in this study contain labels that organizations affiliate with to establish their identities. Many are categories by the above definition but others, especially those that are very ambiguous, are not. Because it is difficult to assign a threshold that distinguishes labels from categories, I use the term “category”, and employ continuous measures to indicate whether categories are ambiguous.

6
and spanning multiple categories will reduce an organization’s appeal to an audience of
consumers, this same diluted identity will increase its appeal to venture capitalists.
Category Spanning, Ambiguity, and Audience Evaluations
Categorization is a natural human process that allows people to access large amounts of
information with minimal effort (Rosch, 1978). Once a category structure is established, it
influences evaluations (Osherson and Smith, 1982). Expectations that arise from categorization
can be thought of as a set of codes to which organizations are supposed to comply (Hsu and
Hannan, 2005; Hannan, Pólos, and Carroll, 2007). Category codes may be enforced explicitly,
such as by critics who rate and classify organizations or gatekeepers who determine whether
something is included in a consideration set. They also are enforced implicitly. For example, if
customers expect that products in a category will have specific features (Rosa et al., 1999), or
that some types of organizations will refrain from offering taboo services (Phillips and
Zuckerman, 2001), organizations that do not meet expectations will not be as highly regarded.
Managers use categories to convey an organization’s scope and its set of competitors.
They affiliate with categories to place their organizations within a competitive landscape (White,
1981; Porac and Thomas, 1990), often responding to rivals through the media (Kennedy, 2005).
Different categories are associated with different logics of competition (Barnett, 2008). There
tends to be stronger rivalry among competitors that are members of the same category (Porac et
al., 1995), and organizations that are experienced competing in one context may not be equipped
to face rivals in another (Barnett and Pontikes, 2008). By conforming to category codes, rivals
help define boundaries. At the extreme, two categories may be oppositional, so that an
organization cannot legitimately belong to both (Carroll and Swaminathan, 2000). However, the

7
more that rivals cross category boundaries, the more acceptable it becomes for others to do so
(Rao, Monin, and Durand, 2005). By conforming or not conforming to categorical expectations,
competitive rivals help to construct categories and maintain their boundaries.
Category Spanning
Once categories are established, what happens to organizations that do not conform to
categorical expectations? Because observers use categories to make sense of organizations, those
that do not neatly fit into existing categories are often ignored or devalued. Thus, analysts tend to
overlook firms whose industries do not match their specializations (Zuckerman, 1999), actors
that have worked in many different genres have a harder time finding employment (Zuckerman
et al., 2003), films that span genres are less appealing to both critics and general audiences (Hsu,
2006), and category generalists do not receive as many auction bids as do category specialists
(Hsu, Hannan, and Koçak, 2009). Niche-width theory suggests that organizations need to devote
a fixed amount of resources towards “fitting in” to any particular category, and so organizations
that span multiple categories have fewer resources to devote to any one (Freeman and Hannan,
1983; Dobrev, Kim, and Hannan, 2001). A similar resource-based argument is used in the
literature on strategic management, which shows that widely diversified firms have lower
average rents (Montgomery and Wernerfelt, 1988; Wernerfelt and Montgomery, 1988), an effect
that is exacerbated when organizations diversify into unrelated markets (Berger and Ofek, 1996).
In resource-based explanations, it is possible that what drives the increased performance
of specialists is underlying technical requirements for products and services associated with that
category. But research also shows that category labels themselves can affect how an organization
is evaluated. Increasing the number of categories that partition a set of products leads to

8
increased satisfaction with a person’s choice, even when the categories do not provide any
information about the products (Mogilner, Rudnick, and Iyengar, 2008). Before the category for
“minivans” emerged, a wide range of “minivan”-type automobiles were equally as appealing to
consumers, but when the “minivan” category became defined by specific elements, models that
did not fit the new expectations were less acceptable to consumers (Rosa et al., 1999). Indeed,
the mere act of labeling an entity as spanning categorical boundaries can have harmful effects.
On a peer-to-peer lending site, when individuals were labeled as members of multiple categories
they were less likely to receive a bid. When labels were removed from customer view, the same
boundary spanners suffered no penalty (Leung and Sharkey, 2009). Categories are helpful in that
they allow people to reduce a space of infinite dimensions into one that is finite and comparable.
At the same time, they can interfere with how people evaluate entities that bridge categorical
boundaries.
Category Ambiguity
The research cited above investigates contexts where categories are well defined, and
shows that when organizations span these categories audiences have difficulty making sense of
their identities. Recent research indicates that category-level measures are also important. When
categorization systems were in flux for credit ratings in 19th Century America, boundary
spanning was not problematic, but in this same context organizations that belonged to ambiguous
categories consistently suffered lowered ratings (Ruef and Patterson, 2009). When category
boundaries in the Italian wine industry were blurred, returns to specialism were not as great
(Negro, Hannan, and Rao, 2008), and restaurants in low-contrast categories were less likely to be
favorably evaluated on an online review site (Kovács and Hannan, 2009). Category ambiguity

9
also affects how classification systems evolve. When product categories become ambiguous,
new categories are more likely to emerge (Lounsbury and Rao, 2004). On the other hand,
because ambiguous categories present fewer constraints they are less likely to push out specific
organizations. So, for organizations that develop a new technology, it is those that belong to low
leniency categories that are more likely to start a new market category (Pontikes, 2008).
Together, these studies suggest that category characteristics can lead to unclear identities for
organizational members.
As a result I use ambiguity, a category-level measure, in addition to boundary spanning,
an organization-level measure, to indicate the extent to which an organization has a clear or
unclear identity. An ambiguous category may be widely recognized and adopted, but it does not
have a well-defined boundary, broadly accepted social meaning, nor does it elicit strong
expectations of what members should or should not do. These categories are not especially
constraining and provide flexibility to organizational members. Examples of these in the
software industry include “e-business applications,” “enterprise,” “platform,” and “portal.”
Unambiguous categories are more constraining, have clearer boundaries, and elicit strong
expectations about what a member will be. Examples of these in the software industry are
“expense management,” “entertainment software,” and “digital imaging.”
Audiences Without Voice: Consumers
The literature that documents the hazards of having an unclear categorical identity tends
to take the perspective of audiences that interact with an organization as outsiders. They have
little influence over the organization and tend to seek out products or services that meet a
specific need. The studies cited above investigate consumers (Rosa et al., 1999; Hsu, 2006; Hsu,

10
Hannan, and Koçak, 2009; Kovács and Hannan, 2009), critics and gatekeepers (Zuckerman et
al., 2003; Rao, Monin, and Durand, 2005; Hsu, 2006), and stock market investors (Zuckerman,
1999). These audiences evaluate an entity either by choosing it or rating it, but do not anticipate
having a voice in shaping it.
If an audience has little influence over an organization, it is unlikely that the organization
will modify its offerings if they do not meet an audience member’s expectations. For example,
end-users cannot expect that Oracle will add desired features into its product; if a user chooses
Oracle, she will expect to use the product as is. Because there is little opportunity to modify the
offering after the fact, it is important to choose the right organization before hand. Organizations
that are clearly categorized are easier to understand, place, and compare. These organizations
will be more appealing to an audience without voice.
Further, an audience with the goal of finding a product or service that meets a specific
need may find offerings that have the potential to be many things unappealing. There is evidence
from social psychological research that when an individual is focused on a specific goal, he is
less likely to favorably evaluate a multi-functional product. For example, once people are made
aware that a pen can also be used as a laser pointer, they are less likely to use that pen for the
purpose of writing (Zhang, Fishbach, and Kruglanski, 2007). Audiences with task-oriented goals
tend to use categories as cognitive maps to find an organization that can satisfy these goals. If
they were motivated to try and understand the social construction of a category structure then
categorically unclear identities might not be a problem. However, decoding the category
structure is not an appealing task for someone looking for a particular product. This type of
audience member is not interested in becoming an anthropological expert of an industry; rather,
she wants to find organizations whose offerings can meet her needs.

11
Therefore, organizations that are clearly categorized should be more appealing to an
audience without voice that has the goal of finding an offering that meets particular
requirements. Indeed, previous research which documents the hazards of spanning categories or
being in ambiguous categories investigates contexts with these types of audiences. Consumers in
the software industry are another example of such an audience. A consumer is one voice of many
in terms of his influence over an organization. Consumers can request that an organization move
in a certain direction, but except for cases where a small organization is reliant on one major
client, they have little assurance that these appeals will be heeded. In addition, consumers tend to
look for software products that meet a specific need. They use categories to understand the
software domain, and so organizations with ambiguous identities are more likely to be confusing.
As a result, the above arguments suggest that for an audience of consumers, organizations with
clear identities are more appealing than those with unclear identities. Therefore, I expect:
H1a: Organizations that are members of more ambiguous categories will be less
appealing to consumers, as compared to organizations in less ambiguous categories.
H1b: Organizations that span many categories will be less appealing to consumers, as
compared to organizations that span fewer categories.
Audiences with Voice: Venture Capitalists
Audiences with voice will take a substantially different perspective on organizations.
Previous studies on categorization indicate that audiences of enthusiasts, who are invested in a
domain, are less negatively influenced by unclear categorization. For example, active users of an
online review site did not devalue organizations in ambiguous categories as strongly (Kovács
and Hannan, 2009). For people familiar with a domain, increasing the number of categories that

12
group a set of objects does not affect satisfaction with their choice (Mogilner, Rudnick, and
Iyengar, 2008). In addition, studies also show how enthusiasts create new markets and redefine
existing domains, indicating that such an audience is not put off by organizations that defy the
existing category structure. For example, institutional entrepreneurs worked to shape the way art
museums functioned to define a new organizational form (DiMaggio, 1991). Activists drew on
existing cultural materials to construct a new form for nonprofit Consumer Watchdog
Organizations (Rao, 1998). Enthusiast audiences are embedded in the same categorical structures
as more passive audiences, but are motivated to question these categories in the quest for
novelty.
These studies suggest that audiences that have influence over organizations, who are
looking to establish the next “new thing,” are less likely to devalue those that are not clearly
categorized. In fact, they may find such organizations more appealing. An identity that is unclear
is also flexible. Previous research in the network tradition suggests that individuals and
organizations can benefit from having flexible identities. Multivocality, or cultivating an identity
that can be interpreted differently from multiple perspectives, can facilitate an individual’s rise to
power (Padgett and Ansell, 1993). Actors that broker otherwise unconnected groups can realize
benefits from access to diverse information (Burt, 1992). Organizations that are members of
ambiguous categories or that span multiple categories retain the flexibility to be interpreted in
multiple ways. They can more easily initiate change or adapt to changes in an industry, and they
have more leeway to modify how they position their offerings without appearing to be
chameleon. There is also potential to shape the definition of an ambiguous category or to
construct a new category at the intersection of existing categories. Therefore organizations with

13
flexible identities are more likely to be seen as having the potential to establish unique market
niche, which will appeal to audiences with voice that seek novelty.
Venture capitalists are an example of such an audience in the software industry. First,
they have a great deal of influence over investment companies. Venture capitalists invest in
risky, early stage companies that have little performance history. Some ways they manage risk
are by staging investments so that future funding is tied to performance goals, and by
participating on the company’s board (Norton and Tenenbaum, 1993). In this way, venture
capitalists are also involved in managing the direction of their companies. Many see their
investments more as business partnerships than as a stock portfolio; the average holding period
for a venture capital investment is five years (Sahlman, 1990), and once a venture capitalist
invests in a company, she is more likely to re-invest even if expected returns are declining
(Guler, 2007). Venture capitalists do not simply pull out of investments when changes within an
industry make them less financially attractive; rather, they work with managers to help the
organization succeed. Therefore it is important for venture capitalists to consider at the outset
how easily an organization can reframe its products or services responding to potential changes
in an industry. Organizations with flexible identities will be better able to respond to such
changes without as much disruption, and venture capitalists can actively direct how the company
reacts. An audience with influence has the power to shape an organization. As a result,
organizations with flexible identities, that can be easily shaped, will appeal to this audience.
Second, venture capitalists look to invest in organizations that have produced something
novel and that have the potential to make a large impact in their industry. Most investments
result in losses, but a few generate such large returns such that a handful of companies in a
venture capitalist’s portfolio result in over half of the investor’s profits (Sahlman, 1990).

14
Previous research which surveys venture capitalists indicates that they prefer organizations that
are “market makers,” (MacMillan, Zemann, and Subbanarasimha, 1987), or one with a “unique
product, which create[s] a new niche for itself,” (Hisrich and Jankowicz, 1990). Venture
capitalists do not just invest in an organization, but also in the “future of a particular technology
or market,” (Tyebjee and Bruno, 1984). Unlike consumers, venture capitalists do not use existing
industry categories to find an organization that can best meet a specific goal. Rather, they
attempt to invest in a company that can redefine the category structure. As a result, venture
capitalists are motivated to deeply understand and think beyond the limitations presented by
existing categories within an industry. This type of audience, which seeks novelty, will not
devalue organizations that are members ambiguous categories and that span categories. First,
because this audience scouts for an organization that is innovative, this type of organization will
not be ignored. Second, because they are willing to put cognitive energy into understanding an
organization, it will not be devalued simply because of its categorical affiliations.
Finally, organizations with unclear identities are more likely to make it through the
selection process of an audience looking for young innovative organizations. Industry lists that
group organizations by category are not a fruitful place to look for the next “new thing.” Venture
capitalists tend to find out about promising investments through contacts. In order to attract
financing, organizations must first get “on the radar” of an interested venture capitalist. Those
that span categories and that are in ambiguous categories are in positions of brokerage in the
category structure. By occupying “structural holes,” brokers have access to a wide range of
diverse contacts (Burt, 1992; Fernandez and Gould, 1994). In biotechnology, organizations with
many different connections had the most power in shaping their field (Powell et al., 2005).
Further, positions of brokerage are especially advantageous when networks serve as conduits of

15
resources (Podolny and Baron, 1997), which is the case for venture capital financing. Positions
of brokerage make organizations in ambiguous categories or that span multiple categories more
likely to have contact with a larger number of potential investors. In addition, after an
organization is in the consideration set, it must gain approval by all or a subset of the general
partners of a fund (Guler, 2007), and many investments are made through syndication, or co-
investment among multiple venture capital funds, increasing the number of perspectives that
evaluate (and must come to consensus on) a prospective venture. Organizations with flexible
identities are more likely to appeal to this variety of outlooks.
Together, these arguments suggest that audiences with influence that prize novelty, such
as venture capitalists, will not be put off by organizations that are categorically hard to
understand. Rather, organizations with flexible identities will be seen as potential market makers.
In addition, these organizations will be more likely to attract interest from this type of audience.
As a result, I hypothesize:
H2a: Organizations that are members of more ambiguous categories will be more
appealing to venture capitalists, as compared to organizations in less ambiguous
categories.
H2b: Organizations that span multiple categories will be more appealing to venture
capitalists, as compared to organizations that span fewer categories.
The above hypotheses propose that two distinct audiences, consumers and venture
capitalists, have opposing reactions to organizations that are not clearly categorized. This may
seem ironic, since venture capitalists aim to invest in companies that will at some point be
appealing to consumers. However, it is important to remember that venture capitalists invest in

16
early stage companies, which do not yet have broad consumer appeal. The reactions to
categorization from these two audiences may form a complementary two-stage process. Venture
capitalists first sort through organizations that are difficult to understand and choose the most
promising. In the second stage, consumers choose from among survivors which organizations to
patronize. Organizations that are able to define or co-opt a niche may thrive at both stages,
whereas those that remain in an ambiguous categorical state may not be as successful.
Categorization in the Software Industry
I test these ideas in the empirical context of the software industry during the period from 1990
through 2002. Software has been around since computers were commercialized in the 1950’s,
although initially it was not considered a separate industry. Early software programs were hard
coded in machine language that was specific to a computer. The first higher-level programming
language, FORTRAN, was created in 1957. It allowed programmers to code software that would
run on many different machines, which set the stage for software to be viewed as an independent
product. In 1968, under fear of anti-trust regulation, IBM announced that it was unbundling its
hardware and software, facilitating the entry of many independent software vendors into the
industry (Steinmueller, 1995; Campbell-Kelly, 2003).
The software industry emerged under the public radar. From 1966 until 1980,
Businessweek did not publish any articles that focused on the software industry, and thereafter its
next article on the industry was published in 1984 (Campbell-Kelly, 2003). Perhaps because of
the lack of attention from the mainstream press, specialized publications such as Computerworld
and Software Magazine, and publications from industry analysts such as Forrester Research,

17
IDC, and Gartner were important sources of information about the industry. Rankings such as
Software Magazine’s Software 500 also helped to publically define the industry.
Initial classifications for software companies began to emerge in the 1970s. At that time,
the main division was between “system” and “application” software, which was subdivided into
industry classifications. After the invention of the personal computer in the 1980’s, the software
industry grew and its category structure became more complex. In 1982 the label “productivity
application” appeared, which included spreadsheets, word processing, and personal databases.
Later in the decade growing hardware markets for printers, modems, and hard disks gave rise to
the category of “utility software,” (Steinmueller, 1995). In the 1990’s a number of new
categories emerged including “network management tools”, “ERP”, “security software”, “object
management software”, “middleware”, “financial applications”, “human resource management”,
“CAD”, and “integrated voice response systems,” (Frye and Melewski, 1995). Data from firm
press releases gathered for this study indicate that from 1990 to 2002, software organizations
used over 400 categories to assert their identities within the industry.
The categories that emerged in the software industry ranged from extremely well defined
to very ambiguous. Categories that were well defined had distinct boundaries and a strong
consensus around what types of offerings, services, or activities were expected from
organizational members. Often, boundaries were created and maintained by software
organizations and other activists lobbying the press to promote a specific definition for the
category. For instance, when the category for “relational database” emerged in the early 1980s, a
wide range of organizations began adopting the label without providing comprehensive relational
software. In response Edgar Codd, the pioneer of relational technology, published an article in

18
Computerworld called “Is your DBMS Really Relational?” where he outlined 12 rules as a test to
determine whether a company could call themselves a “relational database” provider.
Other categories grew to become relatively ambiguous. For these categories, there was
not strong consensus on what types of offerings members should provide, nor on which
organizations could credibly claim an affiliation. For example, a decade after the category
“knowledge management software” first appeared, it was described by Forrester Research as “an
unhelpful term that describes a broad range of software products and enterprise services,”
(Walker and Schadler, 2002). Another ambiguous category, “e-business applications”, was one
of the most widely adopted labels during this time period, as it could apply to any company that
provides products and services that were at all related to business on the internet. Despite the
“unhelpfulness” of ambiguous categories, they proliferated. Why would organizations claim
membership in ambiguous categories? There is a trade-off to being affiliated with a well defined
as opposed to an ambiguous category. Membership in a well-defined category makes an
organization easy to identify and understand. However, the strong expectations associated with
these categories are constraining. Ambiguous categories do not provide as strong a signal, but
they are more lenient. Organizations in these categories can engage in a wide range of activities
and still be considered credible members. At any point in time, active software categories ranged
from very unambiguous to very ambiguous.
Venture capital financing was critical to the development of the software industry. The
annual amount of venture capital investment in the United States tripled from 1991 to 1996, and
information technology companies received between 50% and 60% of these investments. In
addition, the software industry was the largest or second largest recipient of venture capital
investments for each year in the 1990’s (Onorato, 1997). Typically, companies would seek

19
venture capital funding to grow; rarely did a software company make it “big” without venture
financing. So venture capital investment fueled the growth of this industry, and this audience was
as important as potential customers.
In sum, categorization was important to organizations in the software industry, and
categories ranged from well defined to very ambiguous. In addition, both customers and venture
capitalists were important audiences for software organizations. This makes the software
industry a good context to investigate the ideas in this study.
Data and Methods
This study uses data on categories, consumer evaluations, and venture capitalist evaluations of
software companies from 1990 to 2002. Data on categorization come from press releases issued
by the organizations themselves, which include identity statements where companies self-
categorize. Data on consumer evaluations come from an annual ranking of software companies
from Software Magazine. Data on venture capital evaluations, measured by whether an
organization received venture capital funding, come from the VentureXpert database maintained
by Thomson Financial.
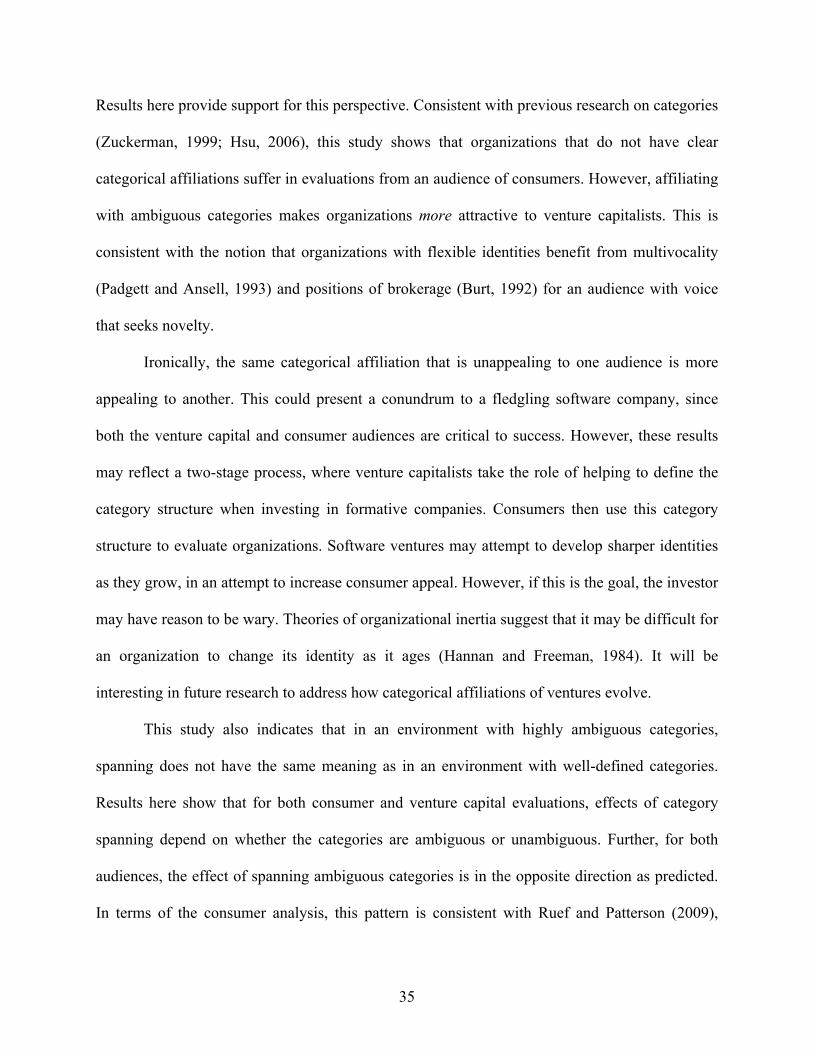
Categorization: Data for software organizations and categories were collected using press
releases issued by software companies from 1990 to 2002. Software companies actively used
press releases to distribute news and create a public face for media analysts, potential venture
capitalists, and consumers. Because press releases are not especially costly to produce, they
provide a good source of data that include small and young organizations that are otherwise
difficult to track. Within press releases companies would claim an affiliation with a category. For
example, in a press release from February 2000, Citrix systems states, “Citrix Systems, Inc. is a

20
global leader in application server software and services,” (figure 1 lists other examples of
identity statements from press releases in these data). Press releases map software organizations
to categories over time, and they capture category labels organizations may have tried out but
that did not gain traction. Therefore the data include prominent categories, early stage categories,
and potential categories that did not catch on.
---Insert figure 1 about here ---
This study uses a data set of software companies and categories created from the 268,963
press releases issued between 1990 and 2002 that contain at least three mentions of the word
“software.” From these press releases, company names and the categories in which they claim
membership were extracted. The final data contain 4,835 companies and 467 categories. Figure 2
shows the category map of the software industry for selected years. These are network plots
where the number of overlapping members links categories. The size of each node depicts
category leniency. Leniency, defined in detail below, is one measure of category ambiguity. It
takes into account both the percentage of members that overlap with another category, and the
number of other categories in the industry with which the category has overlap. These plots show
that high-leniency categories are more central, as expected. Some low-leniency categories also
cluster together, but are less centrally located. These plots show the extensive the category
structure of the software industry, and how rapidly it changes over time.
---Insert figure 2 about here ---
Consumer Evaluation: Data measuring consumer evaluations were collected from Software
Magazine’s annual ranking of software organizations. This report ranks software companies in
terms of their software revenues taking into account revenue from software licenses,
maintenance and support, training, software-related services, and consulting. This list includes

21
both public and private companies.2 Software Magazine is a well-respected specialized industry
publication that began ranking software companies in 1982. Initially, it ranked the top 50
companies. The list expanded as the industry expanded, first to the top 100, and in 1996, to the
top 500, where it remained steady. Thus the report is dubbed “The Software 500.” During the
time period of this study, the Software 500 rankings were highly regarded. Making it onto the
list, or rising in rank, was a source of status that was publicized by organizations in press
releases. Because rank in the Software 500 is based on software revenues, it is an indicator of
how appealing a software company is to the audience of consumers. Although venture capital
funding could keep a company alive, revenues measure whether consumers were actually
purchasing their offerings.
Venture Capitalist Evaluation: I measure venture capitalist evaluations of companies in terms of
whether they received venture capital funding in a given year. Data come from the VentureXpert
database from Thomson Financial.
Measures
Dependent and Independent Variables: To investigate the hypotheses, I estimate the effects of
category ambiguity and category spanning on consumer evaluations and venture capitalist
evaluations.
Consumer evaluation: I use rank in Software Magazine’s Software 500 as a measure of consumer
evaluation. I use inverse rank, which is the number of companies ranked minus the rank of the
organization, so that a higher inverse rank is associated with more positive consumer evaluation.
2 The Software 500 includes software specialists, hardware vendors that also produced software, and consulting companies that created some custom software. Rankings are based on software revenue. For the purposes of this study, consulting companies were not included.

22
Thus, high inverse rank means an organization is more highly ranked. Note that I separately test
results for 1996 – 2002, to check if expanding the number of companies ranked affects results.
Venture capitalist evaluation: I use received venture capital funding in the current year as the
dependent variable to measure venture capitalist evaluation. This is a binary variable where 0
indicates the organization did not receive venture capital funding in the focal year, and 1
indicates that it did receive funding.
Category Spanning: I use the number of categories in which the organization claims to be a
member in the given year to measure its degree of category spanning, to test H1b and H2b.
Category Ambiguity: I use two measures of category ambiguity: fuzziness and leniency to test
H1a and H2a. Fuzziness indicates whether a category overlaps with other categories and leniency
measures how constraining a fuzzy category is. Both indicate category ambiguity; a category that
is not differentiated from other categories and that does not constrain its members does not have
a consensually agreed upon definition.
To measure the fuzziness of an organization’s categories and leniency of an
organization’s categories, I first create measures for fuzziness and leniency at the category level.
Previous research shows that when members of a label have unfocused identities, such as if they
are de alio firms that primarily identify with another category, the label is less likely to gain
legitimacy and develop a social meaning (McKendrick and Carroll, 2001; McKendrick et al.,
2003). Building on this, I use fuzziness, the proportion of category members that also identify
with other categories (Hannan, Pólos, and Carroll, 2007), as one measure of ambiguity. When a
fuzziness is high, it means a large number of members also identify with at least one other
category.

23
Some categories not only have a high percentage of members that identify with one or
two other categories, but their members also identify with almost any other category. For
example, organizations that affiliated with the category “Portal” also were members of 160 other
categories. These categories are in the center of the category maps shown in figure 2. Categories
with such broad overlap do not impose strong constraints on members. To distinguish between
categories that overlap with a handful of others in a cluster, and categories that overlap with
almost every other category in the industry, I also use a metric for leniency, which measures the
lack of constraint imposed by a category. Leniency is computed as fuzziness times the number of
distinct other identities a category’s members take on. When leniency is high, it indicates that a
large portion of members not only identify with other categories, but also that they identify with
many other categories. Leniency is a nuanced measure of ambiguity that considers not only
whether a category’s members affiliate with other categories, but also where else they identify.
Mathematically, to create these measures I first determine which categories an
organization affiliates with in each year using press release data. Following Hannan, Pólos and
Carroll (2007), I conceive of categories as fuzzy sets, so that an organization can be a partial
member of a category. Research in cognitive psychology indicates that this is the way people
think of categories (Rosch and Mervis, 1975). Thus, an organization can be “sort of” a
“database” company, but primarily in “security software.” An organization’s grade of
membership in a category indicates the extent to which it identifies with the category, and is
calculated based on the number of times it mentions the category in press releases, divided by the
number of times it mentions any category, for each year. Grade of membership takes values
between 0 and 1. I then compute the fuzzy density (NC ) for a category as a sum of the grades of
membership of organizations that claim membership in it. The “support” for a category, (N), is

24
defined as the number of organizations who have non-zero membership in the category and can
be thought of as the category’s potential membership. A category’s contrast, or its fuzzy density
divided by its support (NC
N), measures the extent to which a category’s members have focused
identities. The opposite of contrast is fuzziness:
fuzzC = 1− contrastC (1)
Fuzziness measures the extent to which a category’s members identify elsewhere (Hannan,
Pólos, and Carroll, 2007). To compute leniency, I multiply the category’s fuzziness by the
(natural log of the) number of distinct other categories with which members identify:
leniencyC = fuzzCx ln(Nocat ) (2)
The distribution of fuzziness in these data is shown in figure 3, the distribution of leniency in
figure 4, and the relationship between leniency and fuzziness in figure 5. Categories that have
low fuzziness also have low leniency. However, categories with high fuzziness can either be
high-leniency or low-leniency.
--- Insert figure 3, figure 4, and figure 5 about here ---
To measure the fuzziness and leniency of an organization’s categories, I compute a weighted
average that sums the product of the organization’s grade of membership in a category with the
category’s fuzziness and leniency:
Average fuzziness = gomixfuzzii∈C∑ (3)
Average leniency = gomixleniencyii∈C∑ (4)
Control Variables: I include a number of control variables to account for other factors that may
influence the dependent variables. I include the number of times the organization has received
venture capital funding over its history, whether it has previously appeared in the Software

25
Magazine rankings, its inverse rank (based on revenue), whether the organization is public, and
whether the organization is the only member of its category to account for differences in quality
and size among organizations. I use the fuzzy density of an organization’s categories (sum of the
number of members weighted by grade of membership) to control for whether audiences prefer
organizations in popular categories. I include a tenure variable that measures the time since the
organization is tracked in the data as a proxy for age, and time since organization last received
venture capital funding as a clock in the venture capital funding estimation. All independent
variables are measured at the start of each time period.
Statistical Methodology
To test hypotheses 1a and 1b, I estimate the effects of category ambiguity and category
spanning on an organization’s Software Magazine inverse rank. The range of values for inverse
rank is between 1 and 500, and so is left and right censored. I use Tobit estimation, which is
appropriate for modeling a variable that covers a limited range of values. The Tobit model
combines a probit estimate of the probability that a case will have a limit value with an OLS
estimate of the effects of the independent and control variables on inverse rank. An organization
may be ranked in multiple years, which departs from standard assumptions of statistical
independence. Therefore I cluster the standard errors by organization. I estimate this model using
Stata 11.
To test hypotheses 2a and 2b, I investigate the time it takes for an organization to receive
venture capital funding. To estimate this, I use a piecewise continuous hazard rate model. This
model estimates the instantaneous likelihood of an event, here the probability that the
organization receives venture capital funding during time period in the limit where
�
t→ 0.

26
This instantaneous hazard rate of receiving funding can be operationalized as:
r(t) = limΔt→0
Pr(t ≤ T < t + Δt |T ≥ t)Δt
(5)
Where is a random variable representing the time to receiving funding, and t is time (years)
since the organization has last received funding. The piecewise exponential specification allows
the base rate of receiving funding to vary in time “pieces” according to the number of years in
which the organization has been “waiting” for funding. Therefore this specification does not
require a strong assumption about the form of time dependence. I estimate this rate as a function
of the independent and control variables listed above:
r(t) = exp(τ + β ⋅x + γ ⋅ z) + ε (6)
where x is a vector of covariates to test the hypotheses, z is a vector of control variables, and is
the set of duration-specific effects. I cluster standard errors by organization to correct for
departures from statistical independence of the observations. I estimate this in Stata 11 using the
stpiece procedure written by Jesper Sørensen.
Results
Consumer Evaluations
Descriptive statistics for the variables used in the consumer evaluation estimations are
presented in table 1, and correlations are presented in table 2. Leniency and fuzziness are highly
correlated, and they also are highly correlated with some of the control variables. This could
raise concerns about multicollinearity. Therefore I ran separate estimations that do not include
correlated variables, which are reported in the Appendix.
Results testing hypotheses H1a and H1b are reported in table 3. Models 1-6 are Tobit
models with inverse rank as the dependent variable. Model 1 contains controls only. Fuzzy

27
density is non significant in this model, although it becomes positive and significant when
category ambiguity is included. This indicates that holding ambiguity fixed, consumers prefer
organizations that are in popular categories. An organization that is the only member of its
category is less likely to rank highly. This indicates that being in a recognized category may
increase an organization’s exposure, leading to higher revenue. As expected, having a longer
tenure, being public, and having a higher inverse rank in the previous year are also associated
with high inverse rank. These variables indicate whether an organization has been successful
previously, and the organization’s size in terms of revenues.
Models 2-3 test hypothesis H1a, which asserts that the more ambiguous an organization’s
categories, the lower the appeal to an audience of consumers. Category ambiguity is represented
by category leniency in model 1 and fuzziness in model 2. Results show strong support for this
hypothesis using both measures. Leniency has a negative effect of -23.42 (3.41), significant at
p<0.001 in model 2, and fuzziness has a negative effect of -92.61 (14.26), significant at p<0.001
in model 3. Both model 2 and model 3 are improvements in fit over model 1, significant at
p<0.001. This pattern of results holds when leniency and fuzziness are included in models
without highly correlated controls, illustrated in models A1-A2 in the Appendix. These results
show that organizations in ambiguous categories are less appealing to customers, in support of
hypothesis 1a. For an organization at the mean value of all control variables, decreasing category
ambiguity by one standard deviation can result in an increase in inverse rank of over twenty
points.3
Model 4 tests H1b, and results do not support this hypothesis. The number of categories
in which an organization is a member has a positive effect on inverse rank, significant at
3 This estimate is based on results from models 2 and 3, using the means and standard deviations for leniency (2.448/1.156) and fuzziness (0.562/0.225) in these data.

28
p<0.001. This effect holds in model 5, which includes all variables: category ambiguity, leniency
and fuzziness. Note that even though leniency and fuzziness are highly correlated, when they are
included together in model 5 the negative effects of both hold, significant at p<0.05 for leniency,
and p<0.10 for fuzziness. This shows that the two measures of category ambiguity have
compounding effects on reducing consumer appeal. Organizations in fuzzy categories, that have
a high degree of overlap with one or more other categories, suffer in terms of consumer
evaluations. If these categories are lenient and overlap with a large swath of the category map,
the organizations are devalued even more. These findings lend strong support for hypothesis 1a.
Consumer audiences find organizations in ambiguous categories less appealing.
These results do not show support for hypothesis 1b, regarding category spanning. In
fact, category spanning has a positive and significant effect on inverse rank. This is surprising,
since previous research shows that organizations in multiple categories suffer in terms of
audience appeal in many different contexts. Ruef and Patterson (2009) show that category
spanning is not problematic when classification systems are in flux, because there is no boundary
violation if there is no boundary. Similarly, Kovács and Hannan (2009) show that category
spanning is problematic only for categories with low fuzziness. Building on these results, in
model 6 I test whether spanning ambiguous categories has a different impact on consumer
appeal, as opposed to spanning unambiguous categories.
Results show that the positive effect is driven by organizations in ambiguous categories.
Perhaps once an organization identifies with an ambiguous category the harm that arises from
having an unfocused identity is already done and expanding into other ambiguous categories
simply expands the organization’s reach. Category spanning for organizations in unambiguous
categories is non-significant, indicating that there is not a measurable benefit to spanning these

29
categories. But this model still does not yield the expected negative effect. This may be because
this study uses total software revenues to measure consumer appeal. There is a trade-off to being
highly appealing to a narrow range of potential consumers, or moderately appealing to a broad
base. Even if a generalist organization is not likely to attract customers of a particular category,
the sum of its revenues across all categories might make up for its lack of appeal in any one. This
explanation is consistent with Hsu (2006)’s findings that although movies that spanned genres
had lower ratings, genre spanning did not have a significant effect on box office gross. When
outcome variables are based on measures that are summed across categories (such as total
revenues), category ambiguity may be a better measure for how unfocused identities affect
evaluations.
Consumer Evaluations: Supplementary Analyses
Table 4 contains results of supplementary analyses and tests against alternative
hypotheses for the consumer analysis.
Are these findings influenced by changes to the Software 500 methodology? One question is
whether the findings presented here are robust to changes in the methodology of the Software
500 rankings. Initially, Software Magazine ranked independent software vendors only. In 19964,
Software Magazine expanded its rankings to include non-independent companies, and ranked
500 (as opposed to 100) organizations. To test whether these findings are robust to these
changes, models 7 and 8 are run on data for the years between 1996 and 2002. Results show that
both leniency and fuzziness have negative effects on ranking, significant at p<0.001, providing
additional support for hypothesis 1a.
4 Note the 1997 issue of Software Magazine provides data for 1996.

30
Does category ambiguity negatively affect public and private organizations? One question that
may arise is whether category ambiguity has detrimental affects on consumer evaluations for
both public and private organizations. Public organizations are accountable to shareholders and
are required to broadcast statements about their companies, providing an opportunity to explain
their categorical affiliations. So it is possible that membership in an ambiguous category has a
different effect on consumer evaluations for private as opposed to public organizations. Models 9
– 12 test effects of leniency and fuzziness on private as opposed to public organizations. Results
show that there are strong negative effects from both measures of category ambiguity on private
and public organizations, all significant at p<0.01. However, the magnitude of the leniency effect
is twice as large for private as opposed to public organizations. These results show that category
ambiguity results in lower consumer evaluations for all organizations and that private
organizations, which do not disclose as much company information, may be more strongly
affected.
Venture Capitalist Evaluations
Descriptive statistics for the variables used in the venture capitalist evaluation estimations
are presented in table 5, and correlations are presented in table 6. The risk set for this analysis is
private organizations. Leniency and fuzziness are highly correlated, and they also present high
correlations with some of the control variables. This could raise concerns about multicollinearity.
Therefore I ran separate estimations that do not include correlated variables, which are reported
in the Appendix.
Results testing hypotheses H2a and H2b are reported in table 7. Model 13 contains
controls only. The fuzzy density of an organization’s categories has a positive and significant

31
effect, indicating that venture capitalists prefer organizations in popular categories. Being the
only member of a category has a positive and significant effect on being funded in some models,
although this effect is not robust across all specifications. This may indicate that venture
capitalists prefer organizations that pioneer a new category. An organization’s tenure is negative
and significant at p<0.05, which shows that the longer that an organization has not received
funding, the less likely that it is to do so. As expected, the number of times an organization has
previously received funding is positive and highly significant (p<0.001). This is consistent with
Guler (2007)’s findings that venture capitalists are more likely to sequentially invest in
companies even when expected returns decline. Having appeared in the Software Magazine
ranking has a negative effect, significant at p<0.001 on receiving funding. Software Magazine
ranks organizations based on revenue, and organizations with higher revenues are less likely to
seek additional funding.
Models 14-15 test hypothesis 2a, which proposes that organizations in more ambiguous
categories are more appealing to venture capitalists. They show strong support for this
hypothesis. When included independently in these models, category leniency has a positive
effect on the likelihood of receiving venture capital funding, significant at p<0.001 in model 14,
and category fuzziness has a positive effect, significant at p<0.001 in model 15. This pattern of
results holds when leniency and fuzziness are included in models without highly correlated
controls, illustrated in models A1-A2 in the Appendix. Models 13 and 14 show an organization
that is in a category one standard deviation above the mean for leniency or fuzziness is over 1.5
times more likely to receive venture capital funding, compared to an organization in a category at
the mean values of leniency or fuzziness.5 The same category ambiguity that makes
5 This estimate is based on results from models 14 and 15, using the means and standard deviations for leniency (1.91/1.39) and fuzziness (0.45/0.29) in these data.

32
organizations less appealing to consumers makes them more appealing to venture capitalists.
These effects are illustrated in figure 6. This figure shows the relationship between category
ambiguity and both consumer and venture capitalist evaluations.
--- Figure 6 about here ---
The thin lines show the relationship between category fuzziness and leniency to rank in the
Software 500, which measures consumer evaluations, and the thick lines show the relationship
between these variables and venture capital funding. As category ambiguity increases,
organizations are less appealing to consumers but more appealing to venture capitalists.
Model 16 tests hypothesis 2b, which predicts that organizations that span categories will
be more appealing to venture capitalists. Results do not show support for this hypothesis. The
effect of category spanning is negative and significant at p<0.05. The effect remains negative
when category ambiguity measures are included in model 17, but it is not robust across all
specifications. To investigate this effect further, in model 18, I test whether the effect of category
spanning is consistent for organizations in ambiguous and unambiguous categories. As in the
consumer analysis, the surprising effect of category spanning is driven by organizations in
ambiguous categories. For unambiguous categories, the effect is no longer significant. Therefore,
results do not support the hypothesis that venture capitalists prefer category spanners. Further,
they indicate that although venture capitalists prefer organizations with flexible identities, it may
be detrimental to have multiple flexible identities.
Model 17 also shows that venture capitalist preferences for organizations in ambiguous
categories are driven by category fuzziness. When fuzziness and leniency are included in the
model together, the effect of leniency becomes negative and significant at p<0.01. This indicates
that venture capitalist preference for ambiguity is motivated by categories that have high overlap

33
with a limited number of other categories, as opposed to very lenient categories that overlap with
almost any other category in the industry. However, it is important to remember that fuzziness
and leniency are highly correlated, and this result does not indicate that venture capitalists are
averse to organizations in highly lenient categories. Rather, for a given level of fuzziness the rate
of venture capital funding decreases with leniency. The effects of fuzziness and leniency on
venture capital funding rates for the range of observable data are plotted in figure 7.
--- Insert Figure 7 about here ---
This plot shows that the multiplier of the rate of receiving venture capital funding is
above one for all combinations of fuzziness and leniency in these data, indicating that venture
capitalists prefer organizations in ambiguous categories. Overall, the funding rate increases as
category leniency increases, so that organizations in high leniency categories are generally
preferred to those in low leniency categories. But for a given level of category fuzziness, the
more lenient the category, the less likely the organization will receive venture capital funding.
This may be because during this time period in the software industry, some of the categories that
have the highest leniency also happen to be very prominent, such as “enterprise,” “e-business,”
and “CRM.” It also may indicate that there is a limit to the amount of ambiguity venture
capitalists seek. On the whole venture capitalists prefer ambiguous categories, but the preference
does not increase with rising ambiguity. This contrasts with the results from model 5 in the
consumer analysis, where fuzziness and leniency retain their negative effects on Software 500
rank even when included together. Consumers are put off by ambiguity, and the more ambiguous
the category, the more extreme the effect. Venture capitalists are attracted to ambiguity, but the
effect is tempered as ambiguity increases.

34
In sum, these models provide support for hypothesis 2a: organizations in ambiguous
categories are more likely to receive venture capital funding. Together with the consumer
analysis, these results indicate that the audience of venture capitalists is quite different than the
audience of consumers in terms of how they respond to organizations with unclear identities.
Venture Capitalist Evaluations: Supplementary Analysis
Are these effects driven by category novelty? One objection to the results presented on venture
capitalist evaluations may be that ambiguous categories tend to be younger, and that venture
capitalists are interested in organizations that pioneer a new category. For this explanation, it is
the newness of the category that is driving the venture capitalist preference. To test against this
alternative, models 19 and 20 include a covariate that measures the tenure of an organization’s
categories, and the positive effects of leniency and fuzziness, significant at p<0.001, are robust to
this inclusion.6 This provides additional support for hypothesis 2a.
Discussion
Despite evidence that organizations with unclear identities are less appealing – and less
successful – than their focused counterparts, organizations continue to expand their footprints
across multiple categories, and highly ambiguous categories abound. Why? This paper suggests
that whether organizations with unfocused identities are appealing or unappealing depends on the
audience that is evaluating the organization. Categorical ambiguity makes an organization
unclear to an audience without influence that uses categories to find a specific product, but this
same ambiguity makes an organization flexible to an audience with influence that prizes novelty.
6 The inclusion of category tenure in a model that includes both leniency and fuzziness yields the same effects as reported in model 17.
35
Results here provide support for this perspective. Consistent with previous research on categories
(Zuckerman, 1999; Hsu, 2006), this study shows that organizations that do not have clear
categorical affiliations suffer in evaluations from an audience of consumers. However, affiliating
with ambiguous categories makes organizations more attractive to venture capitalists. This is
consistent with the notion that organizations with flexible identities benefit from multivocality
(Padgett and Ansell, 1993) and positions of brokerage (Burt, 1992) for an audience with voice
that seeks novelty.
Ironically, the same categorical affiliation that is unappealing to one audience is more
appealing to another. This could present a conundrum to a fledgling software company, since
both the venture capital and consumer audiences are critical to success. However, these results
may reflect a two-stage process, where venture capitalists take the role of helping to define the
category structure when investing in formative companies. Consumers then use this category
structure to evaluate organizations. Software ventures may attempt to develop sharper identities
as they grow, in an attempt to increase consumer appeal. However, if this is the goal, the investor
may have reason to be wary. Theories of organizational inertia suggest that it may be difficult for
an organization to change its identity as it ages (Hannan and Freeman, 1984). It will be
interesting in future research to address how categorical affiliations of ventures evolve.
This study also indicates that in an environment with highly ambiguous categories,
spanning does not have the same meaning as in an environment with well-defined categories.
Results here show that for both consumer and venture capital evaluations, effects of category
spanning depend on whether the categories are ambiguous or unambiguous. Further, for both
audiences, the effect of spanning ambiguous categories is in the opposite direction as predicted.
In terms of the consumer analysis, this pattern is consistent with Ruef and Patterson (2009),

36
which finds that boundary spanning is not problematic when category definitions are in flux, and
with Kovács and Hannan (2009), which shows that penalties associated with category spanning
decrease with category fuzziness. Findings here provide further evidence that spanning
categories is perceived differently when categories do not have a well-defined, consensual
meaning. Category-level measures of ambiguity may be more precise indicators of whether an
organization has an unclear (or flexible) identity in environments where categories are
ambiguous. Therefore, this study also illustrates the importance of considering category-level
variables like fuzziness and leniency when characterizing an organization’s identity.
These findings also provide insight into how classification structures evolve differently
across industries. In the software industry, there is an important audience that has influence over
organizations and that prizes novelty: venture capitalists. Receiving financing was crucial for the
industry’s development and for the survival of most firms. Given the results presented above, it
is not surprising that the resulting category map evolved to the picture illustrated in figure 2, as
an overlapping network of ambiguous categories. Industries are consumer driven might evolve to
have very well defined categories. In other industries, there may be important audiences such as
large business-to-business clients who have more influence over organizations than do a typical
software consumer, and who may be less averse to ambiguous identities. Taking into account the
structure of important audiences is critical to understanding the evolving category structure in an
industry. As with many things, it seems the effects of a clear or diluted identity depend on who is
watching.

37
References
Barnett, W. P. 2008 The Red Queen among Organizations: How Competitiveness Evolves. Princeton, NJ:
Princeton University Press. Barnett, W. P. and E. G. Pontikes 2008 "The Red Queen, Success Bias, and Organizational Inertia." Management Science: 1237-
1251. Berger, P. and E. Ofek 1996 "Diversification's Effect on Firm Value." Journal of Financial Economics, 37: 39-65. Burt, R. 1992 Structural Holes: Harvard University Press. Campbell-Kelly, M. 2003 From Airline Reservations to Sonic the Hedgehog: A History of the Software Industry.
Cambridge, Massachusetts: The MIT Press. Carroll, G. and A. Swaminathan 2000 "Why the Microbrewery Movement? Organizational Dynamics of Resource Partitioning
in the U.S. Brewing Industry." American Journal of Sociology, 106: 715-762. DiMaggio, P. J. 1991 "Constructing an Organizational Field as a Professional Project: U.S. Art Museums,
1920-1940." In W. J. Powell, and P. J. DiMaggio (eds.), The New Institutionalism in Organizational Analysis. Chicago: The University of Chicago Press.
Dobrev, S., T. Kim, and M. Hannan 2001 "Dynamics of Niche Width and Resource Partitioning." American Journal of Sociology,
106: 1299-1337. Fernandez, R. and R. Gould 1994 "A Dilemma of State Power: Brokerage and Influence in the National Health Policy
Domain." American Journal of Sociology, 99: 1455-1491. Freeman, J. and M. T. Hannan 1983 "Niche Width and the Dynamics of Organizational Mortality." American Journal of
Sociology, 88: 1116 - 1145. Frye, C. and D. Melewski 1995 "Wide Window Beckons to Suppliers: Just Do It." Software Magazine. Guler, I. 2007 "Throwing Good Money after Bad? Political and Institutional Influences on Sequential
Decision Making in the Venture Capital Industry." Administrative Science Quarterly, 52: 248-285.
Hannan, M. T. and J. Freeman 1984 "Structural Inertia and Organizational Change." American Sociological Review, 49: 149-
164. Hannan, M. T., L. Pólos, and G. Carroll 2007 Logics of Organization Theory: Audiences, Codes and Ecologies. Princeton: Princeton
University Press. Hisrich, R. D. and A. D. Jankowicz 1990 "Intuition in Venture Capital Decisions: An Exploratory Study Using a New Technique."
Journal of Business Venturing, 5.

38
Hsu, G. 2006 "Jacks of All Trades and Masters of None: Audiences' Reactions to Spanning Genres in
Feature Film Production." Administrative Science Quarterly, 51. Hsu, G. and M. T. Hannan 2005 "Identities, Genres and Organizational Forms." Organization Science, 16: 474-490. Hsu, G., M. T. Hannan, and Ö. Koçak 2009 "Multiple Category Memberships in Markets: An Integrative Theory and Two Empirical
Tests." American Sociological Review, 74: 150-169. Kennedy, M. T. 2005 "Behind the One-Way Mirror: Refraction in the Construction of Product Market
Categories." Poetics, 33: 201-226. Kovács, B. z. and M. T. Hannan 2009 "The Consequences of Category Spanning Depend on Contrast." Working Paper. Leung, M. and A. Sharkey 2009 "Out of Sight, out of Mind: The Mere Labeling Effect of Multiple-Category
Membership." Working Paper. Lounsbury, M. and H. Rao 2004 "Sources of Durability and Change in Market Classifications: A Study of the
Reconstitution of Product Categories in the American Mutual Fund Industry, 1944-1985." Social Forces, 82: 969-999.
MacMillan, I. C., l. Zemann, and P. N. Subbanarasimha 1987 "Criteria Distinguishing Successful from Unsuccessful Ventures in the Venture Screening
Process." Journal of Business Venturing, 2: 123-137. McKendrick, D. and G. Carroll 2001 "On the Genesis of Organizational Forms: Evidence from the Market for Disk Drive
Arrays." Organization Science, 12: 661-682. McKendrick, D., J. Jaffee, G. Carroll, and O. Khessnia 2003 "In the Bud? Disk Array Producers as a (Possibly) Emergent Organizational Form."
Administrative Science Quarterly, 48: 60-93. Mogilner, C., T. Rudnick, and S. Iyengar 2008 "The Mere Categorization Effect: How the Presence of Categories Increases Choosers’
Perceptions of Assortment Variety and Outcome Satisfaction." 35: 202-215. Montgomery, C. A. and B. Wernerfelt 1988 "Diversification, Ricardian Rents, and Tobin's Q." The RAND Journal of Economics, 19:
623-632. Negro, G., M. T. Hannan, and H. Rao 2008 "Categorical Contrast and Audience Appeal: Niche Width and Critical Success in
Winemaking." Working Paper, Stanford Graduate School of Business. Norton, E. and B. Tenenbaum 1993 "Specialization Versus Diversification as a Venture Capital Investment Strategy." Journal
of Business Venturing, 8: 431-442. Onorato, N. 1997 "Trends in Venture Capital Funding in the 1990s." U.S. Small Business Administration
Office of Advocacy. Osherson, D. and E. Smith 1982 "Gradedness and Conceptual Combination." Cognition, 12: 299-318.
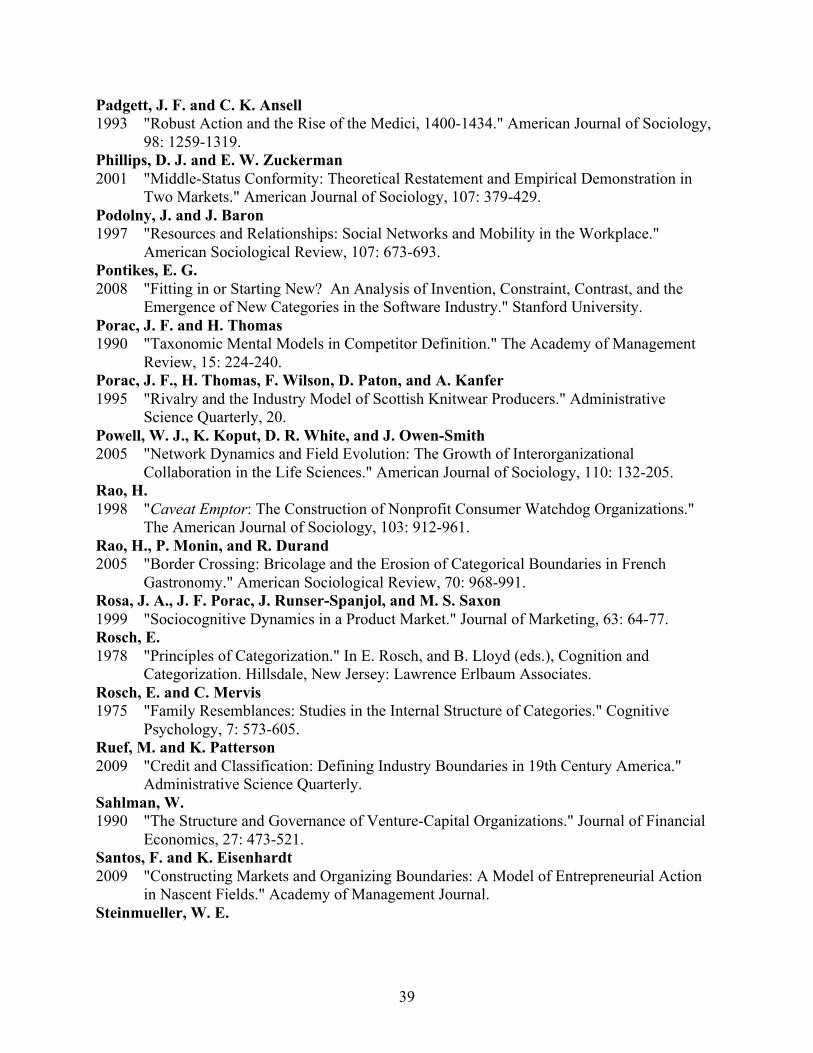
39
Padgett, J. F. and C. K. Ansell 1993 "Robust Action and the Rise of the Medici, 1400-1434." American Journal of Sociology,
98: 1259-1319. Phillips, D. J. and E. W. Zuckerman 2001 "Middle-Status Conformity: Theoretical Restatement and Empirical Demonstration in
Two Markets." American Journal of Sociology, 107: 379-429. Podolny, J. and J. Baron 1997 "Resources and Relationships: Social Networks and Mobility in the Workplace."
American Sociological Review, 107: 673-693. Pontikes, E. G. 2008 "Fitting in or Starting New? An Analysis of Invention, Constraint, Contrast, and the
Emergence of New Categories in the Software Industry." Stanford University. Porac, J. F. and H. Thomas 1990 "Taxonomic Mental Models in Competitor Definition." The Academy of Management
Review, 15: 224-240. Porac, J. F., H. Thomas, F. Wilson, D. Paton, and A. Kanfer 1995 "Rivalry and the Industry Model of Scottish Knitwear Producers." Administrative
Science Quarterly, 20. Powell, W. J., K. Koput, D. R. White, and J. Owen-Smith 2005 "Network Dynamics and Field Evolution: The Growth of Interorganizational
Collaboration in the Life Sciences." American Journal of Sociology, 110: 132-205. Rao, H. 1998 "Caveat Emptor: The Construction of Nonprofit Consumer Watchdog Organizations."
The American Journal of Sociology, 103: 912-961. Rao, H., P. Monin, and R. Durand 2005 "Border Crossing: Bricolage and the Erosion of Categorical Boundaries in French
Gastronomy." American Sociological Review, 70: 968-991. Rosa, J. A., J. F. Porac, J. Runser-Spanjol, and M. S. Saxon 1999 "Sociocognitive Dynamics in a Product Market." Journal of Marketing, 63: 64-77. Rosch, E. 1978 "Principles of Categorization." In E. Rosch, and B. Lloyd (eds.), Cognition and
Categorization. Hillsdale, New Jersey: Lawrence Erlbaum Associates. Rosch, E. and C. Mervis 1975 "Family Resemblances: Studies in the Internal Structure of Categories." Cognitive
Psychology, 7: 573-605. Ruef, M. and K. Patterson 2009 "Credit and Classification: Defining Industry Boundaries in 19th Century America."
Administrative Science Quarterly. Sahlman, W. 1990 "The Structure and Governance of Venture-Capital Organizations." Journal of Financial
Economics, 27: 473-521. Santos, F. and K. Eisenhardt 2009 "Constructing Markets and Organizing Boundaries: A Model of Entrepreneurial Action
in Nascent Fields." Academy of Management Journal. Steinmueller, W. E.

40
1995 "The U.S. Software Industry: An Analysis and Interpretive History." In D. Mowery (ed.), The International Computer Software Industry: Oxford University Press.
Tyebjee, T. and A. Bruno 1984 "A Model of Venture Capitalist Investment Activity." Management Science, 30: 1051-
1066. Walker, J. and T. Schadler 2002 "The New Knowledge Management Landscape." Forrester Research. Wernerfelt, B. and C. Montgomery 1988 "Tobin's Q and the Importance of Focus in Firm Performance." American Economic
Review. White, H. 1981 "Where Do Markets Come From?" American Journal of Sociology, 87: 517-547. Zhang, Y., A. Fishbach, and A. W. Kruglanski 2007 "The Dilution Model: How Additional Goals Undermine the Perceived Instrumentality of
a Shared Path." Journal of Personality and Social Psychology, 389: 389-401. Zuckerman, E. 1999 "The Categorical Imperative: Securities Analysts and the Illegitimacy Discount."
American Journal of Sociology, 104: 1398-1438. Zuckerman, E., T. Kim, K. Ukanwa, and J. von Rittman 2003 "Robust Identities or Nonentities? Typecasting in the Feature-Film Labor Market."
American Journal of Sociology, 108: 1018-1074.
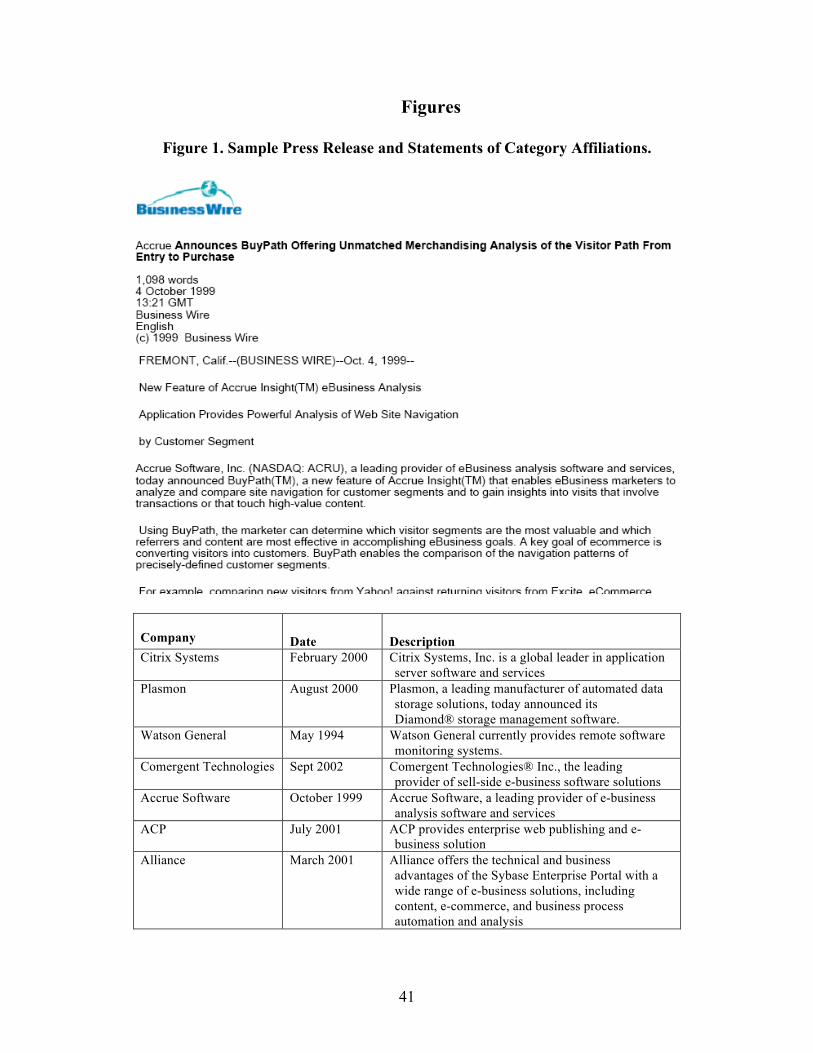
41
Figures
Figure 1. Sample Press Release and Statements of Category Affiliations.
Company Date Description Citrix Systems February 2000 Citrix Systems, Inc. is a global leader in application
server software and services Plasmon August 2000 Plasmon, a leading manufacturer of automated data
storage solutions, today announced its Diamond® storage management software.
Watson General May 1994 Watson General currently provides remote software monitoring systems.
Comergent Technologies Sept 2002 Comergent Technologies® Inc., the leading provider of sell-side e-business software solutions
Accrue Software October 1999 Accrue Software, a leading provider of e-business analysis software and services
ACP July 2001 ACP provides enterprise web publishing and e-business solution
Alliance March 2001 Alliance offers the technical and business advantages of the Sybase Enterprise Portal with a wide range of e-business solutions, including content, e-commerce, and business process automation and analysis
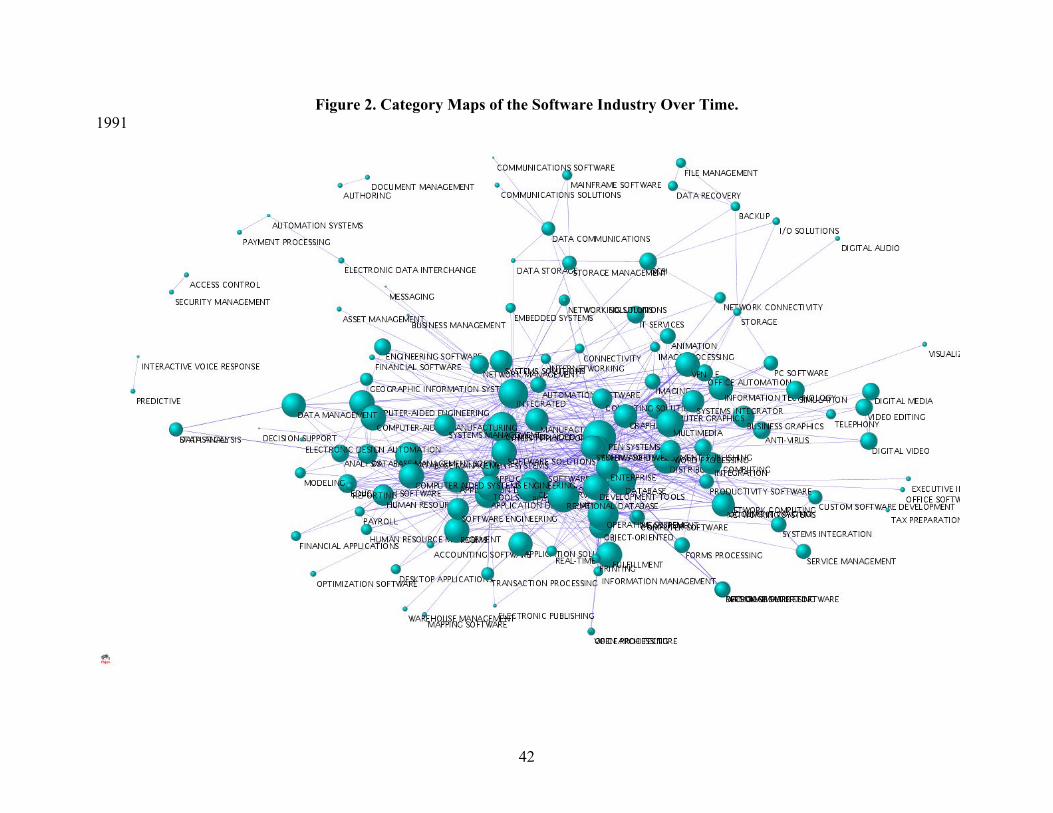
42
Figure 2. Category Maps of the Software Industry Over Time. 1991

43
1995

44
1999

45
Figure 3. Distribution of Category Fuzziness

46
Figure 4. Distribution of Category Leniency

47
Figure 5. Relationship between Category Leniency and Fuzziness.

48
Figure 6. Consumer and Venture Capital Evaluations by Category Ambiguity. 1
1This plot is based on results from models 2 and 3 for Software 500 Rank evaluated at mean levels for all control variables. It is based on models 14 and 15 for venture capital funding.

49
Figure 7. Combined Effects of Fuzziness and Leniency on Venture Capital Fundings. 1
1This plot is based on results from model 17. The multiplier rate is evaluated for fuzziness values at the midpoint of each range.

50
Tables Table 1. Descriptive Statistics for the Consumer Analysis.
Mean Standard Deviation Minimum Maximum
Inverse Rank (dependent variable) 246 149 1 500 Category Leniency 2.448 1.156 0 4.242 Category Fuzziness 0.5620 0.2246 0 0.8229 Number of Categories Organization is "in" 4.104 4.554 0 47 Number of Categories Organization is "in" - high leniency 3.990 4.621 0 47 Number of Categories Organization is "in" - low leniency 0.1144 0.5400 0 8 Fuzzy Density of Categories Organization is "in" (logged) 3.929 1.954 0 7.355 Organization is the Only Member of its Category 0.0040 0.0631 0 1 Organization is Public 0.3828 0.4861 0 1 Tenure 4.012 3.162 0 13 Inverse Rank (previous year) 166 173 0 500 Year 1998 2.885 1990 2002
N=3,007
Table 2. Correlations for the Consumer Analysis.
(1) (2) (3) (4) (5) (6) (7) (8) (9) (10) (11) Inverse Rank (dependent variable) (1) Category Leniency (2) 0.27 Category Fuzziness (3) 0.31 0.92 Number of Categories Organization is "in" (4) 0.35 0.42 0.41 Number of Categories Organization is "in" - high leniency (5) 0.36 0.44 0.42 0.99 Number of Categories Organization is "in" - low leniency (6) -0.13 -0.25 -0.11 -0.07 -0.18 Density of Categories Organization is "in" (logged) (7) 0.38 0.86 0.81 0.63 0.64 -0.15 Organization is the Only Member of its Category (8) -0.05 -0.13 -0.16 -0.04 -0.05 0.10 -0.10 Organization is Public (9) 0.23 0.20 0.21 0.23 0.22 0.03 0.27 -0.01 Tenure (10) 0.49 0.50 0.49 0.46 0.47 -0.07 0.54 -0.04 0.27 Inverse Rank (previous year) (11) 0.65 0.47 0.42 0.45 0.45 -0.11 0.50 -0.03 0.27 0.56 Year (12) 0.38 0.49 0.30 0.23 0.25 -0.28 0.40 -0.07 0.01 0.33 0.38
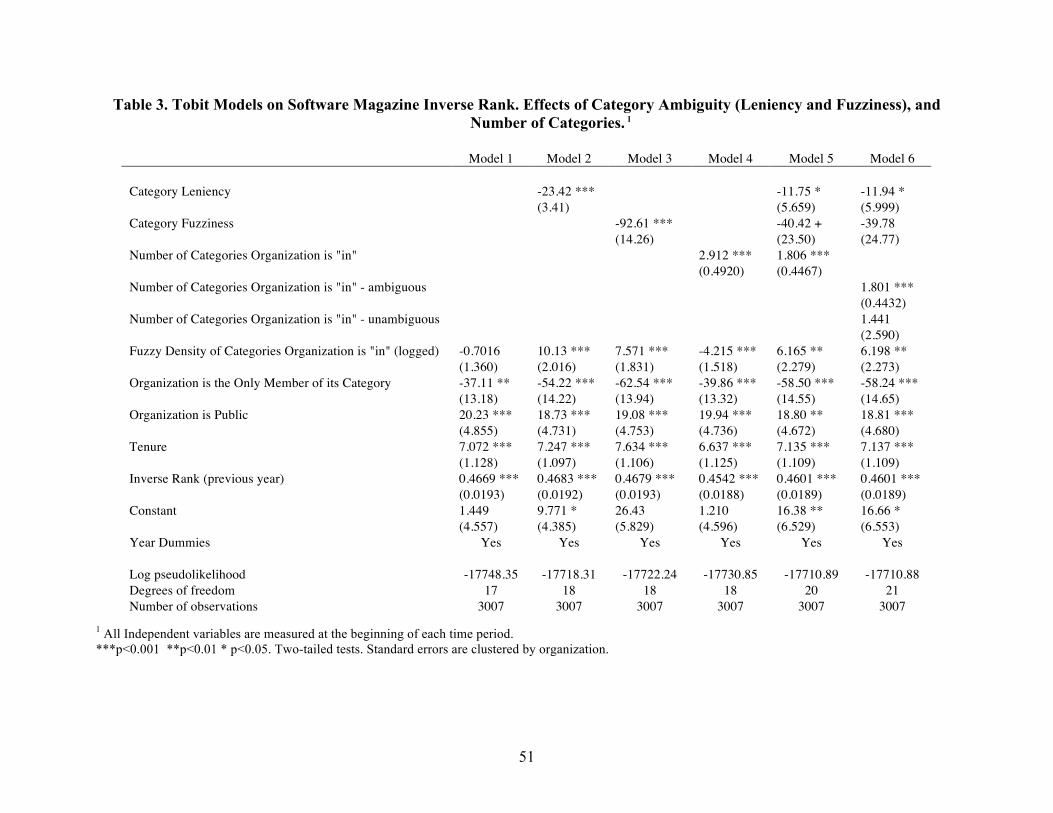
51
Table 3. Tobit Models on Software Magazine Inverse Rank. Effects of Category Ambiguity (Leniency and Fuzziness), and Number of Categories. 1
Model 1 Model 2 Model 3 Model 4 Model 5 Model 6 Category Leniency -23.42 *** -11.75 * -11.94 * (3.41) (5.659) (5.999) Category Fuzziness -92.61 *** -40.42 + -39.78 (14.26) (23.50) (24.77) Number of Categories Organization is "in" 2.912 *** 1.806 *** (0.4920) (0.4467) Number of Categories Organization is "in" - ambiguous 1.801 *** (0.4432) Number of Categories Organization is "in" - unambiguous 1.441 (2.590) Fuzzy Density of Categories Organization is "in" (logged) -0.7016 10.13 *** 7.571 *** -4.215 *** 6.165 ** 6.198 ** (1.360) (2.016) (1.831) (1.518) (2.279) (2.273) Organization is the Only Member of its Category -37.11 ** -54.22 *** -62.54 *** -39.86 *** -58.50 *** -58.24 *** (13.18) (14.22) (13.94) (13.32) (14.55) (14.65) Organization is Public 20.23 *** 18.73 *** 19.08 *** 19.94 *** 18.80 ** 18.81 *** (4.855) (4.731) (4.753) (4.736) (4.672) (4.680) Tenure 7.072 *** 7.247 *** 7.634 *** 6.637 *** 7.135 *** 7.137 *** (1.128) (1.097) (1.106) (1.125) (1.109) (1.109) Inverse Rank (previous year) 0.4669 *** 0.4683 *** 0.4679 *** 0.4542 *** 0.4601 *** 0.4601 *** (0.0193) (0.0192) (0.0193) (0.0188) (0.0189) (0.0189) Constant 1.449 9.771 * 26.43 1.210 16.38 ** 16.66 * (4.557) (4.385) (5.829) (4.596) (6.529) (6.553) Year Dummies Yes Yes Yes Yes Yes Yes Log pseudolikelihood -17748.35 -17718.31 -17722.24 -17730.85 -17710.89 -17710.88 Degrees of freedom 17 18 18 18 20 21 Number of observations 3007 3007 3007 3007 3007 3007
1 All Independent variables are measured at the beginning of each time period. ***p<0.001 **p<0.01 * p<0.05. Two-tailed tests. Standard errors are clustered by organization.

52
Table 4. Tobit Models on Software Magazine Rank. Effects of Category Ambiguity (Leniency and Fuzziness), and Number of Categories for 1996 – 2002 and for Private vs. Public Organizations. 1
Model 7 Model 8 Model 9 Model 10 Model 11 Model 12
Risk Set: Years: 1996 – 2002 All Organizations2
Private Organizations
Public Organizations
Private Organizations
Public Organizations
Category Leniency -20.97 *** -22.16 *** -12.92 ** (3.907) (4.739) (4.969) Category Fuzziness -86.62 *** -85.25 *** -79.50 *** (17.60) (18.84) (22.89) Number of Categories Organization is "in" 1.805 *** 2.170 *** 2.048 ** 1.935 *** 2.605 ** 2.130 *** (0.4683) (0.4998) (0.7131) (0.4776) (0.7475) (0.5094) Fuzzy Density of Categories Organization is "in" (logged) 7.054 ** 4.471 + 5.574 + 5.235 + 2.428 4.576 + (2.541) (2.354) (3.238) (2.862) (2.892) (2.702) Organization is the Only Member of its Category -77.64 *** -83.49 *** -34.77 * -79.74 *** -42.80 *** -97.08 *** (21.14) (21.48) (14.60) (20.61) (14.40) (21.99) Organization is Public 21.84 *** 22.26 *** (5.487) (5.502) Tenure 7.164 *** 7.440 *** 8.110 *** 4.866 ** 8.488 *** 4.966 ** (1.145) (1.151) (1.454) (1.601) (1.473) (1.605) Inverse Rank (previous year) 0.4539 *** 0.4529 *** 0.4830 *** 0.4263 *** 0.4799 *** 0.4270 *** (0.0194) (0.0195) (0.0240) (0.0322) (0.0239) (0.0324) Constant 143.42 *** 142.01 *** 19.45 *** 12.28 + 35.07 *** 30.93 *** (8.964) (9.086) (4.119) (7.069) (6.261) (9.532) Year Dummies Yes Yes Yes Yes Yes Yes Log pseudolikelihood -15350.95 -15351.93 -11090.29 -6537.08 -11090.87 -6534.53 Degrees of freedom 13 13 18 18 18 18 Number of observations 2571 2571 1856 1151 1856 1151
1 All Independent variables are measured at the beginning of each time period. 2 These model contains fewer year dummies, thus the reduced degrees of freedom. ***p<0.001 **p<0.01 * p<0.05. Two-tailed tests. Standard errors are clustered by organization.

53
Table 5. Descriptive Statistics for Venture Capitalist Evaluation Analysis. 1
Mean Standard Deviation Minimum Maximum
Organization Receives Venture Capital Funding 0.0681 0.2519 0 1 Category Leniency 1.912 1.391 0 4.242 Category Fuzziness 0.4460 0.2893 0 0.8620 Number of Categories Organization is "in" 2.005 2.342 0 35 Number of Categories Organization is "in" - high leniency 1.869 2.395 0 35 Number of Categories Organization is "in" - low leniency 0.1360 0.5092 0 14 Age of Categories Organization is "in" 4.981 3.856 0 12 Fuzzy Density of Categories Organization is "in" (logged) 2.846 2.097 0 7.174 Organization is the Only Member of its Category 0.0070 0.0836 0 1 Tenure 2.492 2.669 0 13 Number of Times Organization Has Received VC Funding 0.1688 0.5873 0 7 Organization is in Software Magazine rankings 0.0840 0.2773 0 1
N=17,031
Table 6. Correlations for Venture Capitalist Evaluation Analysis. 1
(1) (2) (3) (4) (5) (6) (7) (8) (9) (10) (11) Organization Receives Venture Capital Funding (1) Category Leniency (2) -0.05 Category Fuzziness (3) -0.05 0.95 Number of Categories Organization is "in" (4) -0.02 0.55 0.58 Number of Categories Organization is "in" - high leniency (5) -0.02 0.58 0.57 0.98 Number of Categories Organization is "in" - low leniency (6) -0.02 -0.18 -0.04 0.00 -0.21 Fuzzy Density of Categories Organization is "in" (logged) (7) -0.04 0.91 0.87 0.71 0.71 -0.08 Organization is the Only Member of its Category (8) -0.01 -0.12 -0.13 -0.04 -0.07 0.14 -0.09 Tenure (9) -0.08 0.50 0.54 0.40 0.39 0.02 0.50 0.00 Number of Times Organization Has Received VC Funding (10) 0.26 0.19 0.19 0.17 0.17 0.00 0.19 -0.01 0.20 Organization is in Software Magazine rankings (11) -0.03 0.20 0.21 0.28 0.28 -0.02 0.22 -0.01 0.20 0.03 Tenure of Categories Organization is "in" (12) -0.08 0.86 0.82 0.46 0.47 -0.11 0.80 -0.06 0.57 0.14 0.16
1 Private Companies Only.

54
Table 7. Piecewise Continuous Hazard Rate Models on Likelihood to Receive Venture Capital Funding. Effects of Category Ambiguity (Leniency and Fuzziness) and Number of Categories. 1
Model 13 Model 14 Model 15 Model 16 Model 17 Model 18 Model 19 Model 20 Category Leniency 0.3644 *** -0.2880 ** -0.2901 ** 0.3879 *** (0.0630) (0.1017) (0.1062) (0.0771) Category Fuzziness 2.377 *** 3.273 *** 3.280 *** 2.536 *** (0.2296) (0.3856) (0.3950) (0.2482)
-0.0377 * -0.0455 * 0.0013 -0.0311 Number of Categories Organization is "in" (0.0186) (0.0221) (0.0196) (0.0202) -0.0456 * Number of Categories Organization is "in"
- ambiguous (0.0220) -0.0491 Number of Categories Organization is "in"
- unambiguous (0.0739) Tenure of Categories Organization is "in" -0.0134 -0.0358 + (0.0216) (0.0187)
0.2643 *** 0.0735 + 0.0277 0.2954 *** 0.1243 ** 0.1247 ** 0.0746 0.0748 * Fuzzy Density of Categories Organization is "in" (logged) (0.0201) (0.0383) (0.0280) (0.0258) (0.0451) (0.0454) (0.0497) (0.0368)
0.5388 0.7661 + 1.113 ** 0.563 1.177 ** 1.179 ** 0.777 + 1.165 ** Organization is the Only Member of its Category (0.4040) (0.4094) (0.4161) (0.4044) (0.4172) (0.4117) (0.4106) (0.4188)
Tenure -0.0576 * -0.0627 * -0.0735 ** -0.0552 * -0.0726 ** -0.0726 ** -0.0604 * -0.0656 * (0.0271) (0.0258) (0.0258) (0.0269) (0.0262) (0.0262) (0.0261) (0.0261)
0.4320 *** 0.3954 *** 0.3094 *** 0.4315 *** 0.2953 *** 0.2953 *** 0.3944 *** 0.3068 Number of Times Organization Has Received VC Funding (0.0471) (0.0477) (0.0499) (0.0470) (0.0507) (0.0508) (0.0479) (0.0503)
-0.4439 *** -0.4199 ** -0.4437 *** -0.4208 ** -0.4335 *** -0.4336 *** -0.4251 ** -0.4395 ** Organization is in Software Magazine rankings (0.1394) (0.1375) (0.1344) (0.1408) (0.1354) (0.1353) (0.1394) (0.1370)
Log Pseudolikelihood -3438.24 -3422.17 -3398.31 -3436.57 -3394.41 -3394.41 -3421.97 -3396.45 Degrees of Freedom 22 23 23 23 25 26 25 25
1 There are 1,160 events for 4,623 private organizations over 17,031 organization-years. All independent variables are measured at the beginning of each time period. ***p<0.001 **p<0.01 * p<0.05 +p<0.10. Two-tailed tests. Standard errors are clustered by organization

55
Table 7 (cont’d). Piecewise Continuous Hazard Rate Models on Likelihood to Receive Venture Capital Funding. Effects of Time Pieces. 1
Model 13 Model 14 Model 15 Model 16 Model 17 Model 18 Model 19 Model 20 Time Since Last Funding: 0-1 Year -1.754 *** -1.733 *** -1.877 *** -1.747 *** -1.940 *** -1.939 *** -1.925 *** -1.977 *** (0.1803) (0.1813) (0.1851) (0.1806) (0.1900) (0.1946) (0.1887) (0.1927) Time Since Last Funding: 1-2 Years -3.462 *** -3.585 *** -3.972 *** -3.484 *** -4.090 *** -4.088 *** -4.021 *** -4.118 *** (0.2129) (0.2180) (0.2272) (0.2143) (0.2347) (0.2411) (0.2287) (0.2356) Time Since Last Funding: 2-5 Years -4.174 *** -4.270 *** -4.646 *** -4.192 *** -4.768 *** -4.767 *** -4.689 *** -4.792 *** (0.2332) (0.2368) (0.2493) (0.2336) (0.2579) (0.2637) (0.2514) (0.2595) Time Since Last Funding: 5-10 Years -4.208 *** -4.294 *** -4.644 *** -4.226 *** -4.761 *** -4.760 *** -4.688 *** -4.786 *** (0.3120) (0.3108) (0.3184) (0.3101) (0.3233) (0.3279) (0.3185) (0.3243) Time Since Last Funding: 10+ Years -3.988 *** -4.081 *** -4.363 *** -3.992 *** -4.444 *** -4.443 *** -4.409 *** -4.477 *** (0.5738) (0.5731) (0.5768) (0.5730) (0.5802) (0.5830) (0.5781) (0.5810) Year Dummies Yes Yes Yes Yes Yes Yes Yes Yes
1 There are 1,160 events for 4,623 private organizations over 17,031 organization-years. All independent variables are measured at the beginning of each time period. ***p<0.001 **p<0.01 * p<0.05 +p<0.10. Two-tailed tests. Standard errors are clustered by organization

Appendix
Table A. Tobit Models on Software 500 Rank and Piecewise continuous hazard rate models on likelihood to receive venture capital. Highly Correlated Controls Excluded.1
Model A1 Model A2 Model A3 Model A4
Model: Consumer: Tobit VC: Piecewise Continuous Category Leniency -4.467 + 0.4576 *** (2.344) (0.0321) Category Fuzziness -18.83 + 2.486 *** (10.93) (0.1521) Organization is the Only Member of its Category -46.24 *** -47.33 *** 0.793 + 1.120 ** (14.86) (15.09) (0.4067) (0.4109) Organization is Public 26.16 *** 26.04 *** (4.80) (4.79) Inverse Rank (previous year) 0.5428 *** 0.5417 *** (0.0162) (0.0162) Number of Times Organization Has Received VC Funding 0.3245 *** 0.2212 *** (0.0332) (0.0361) Organization is in Software Magazine rankings -0.4184 ** -0.4599 *** (0.1349) (0.1313) Time Since Last Funding: 0-1 Year -1.725 *** -1.879 *** (0.1815) (0.1845) Time Since Last Funding: 1-2 Years -3.611 *** -4.016 *** (0.2155) (0.2229) Time Since Last Funding: 2-5 Years -4.393 *** -4.811 *** (0.2225) (0.2331) Time Since Last Funding: 5-10 Years -4.646 *** -5.073 *** (0.2566) (0.2652) Time Since Last Funding: 10+ Years -4.683 *** -5.078 *** (0.5412) (0.5412) Constant 6.863 9.828 + (4.740) (5.972) Year Dummies Yes Yes Yes Yes Log pseudolikelihood -17798.67 -17799.25 -3426.70 -3402.53 Degrees of freedom 16 16 21 21 Number of Observations 3007 3007 17031 17031 1 All independent variables are measured at the beginning of each time period. ***p<0.001 **p<0.01 * p<0.05 +p<0.10. Two-tailed tests. Standard errors are clustered by organization