Embed Size (px)
Citation preview

Two short stories on atmospheric composition
• Re-evaluation on the role of N2O5
• A ‘cheeky’ bottom-up evaluation of global mean OH

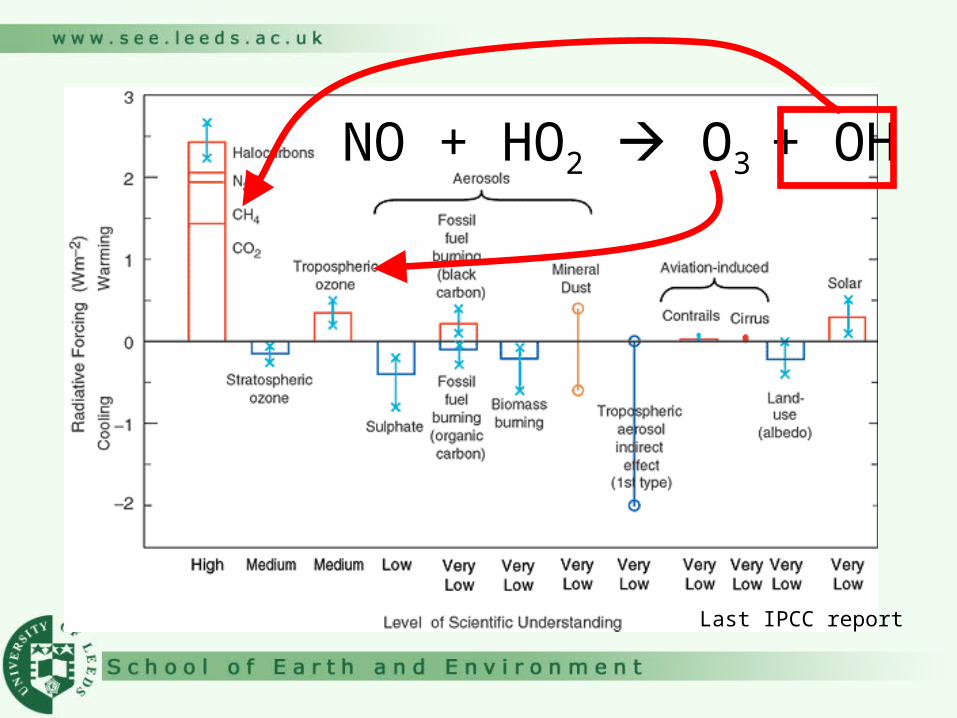
Last IPCC report
NO + HO2 O3 + OH

Sources of oxides of nitrogen
Last IPCC report

Sinks of oxides of nitrogen
• Lots of inter-conversions between different species
NO, NO2, NO3, N2O5, HONO, HO2NO2, HNO3, PAN, PPN, MPAN, ‘other PANs’, organic nitrates …….
• Loss mechanisms dominated by wet and dry deposition of HNO3

How do we make HNO3 1
1. OH + NO2 HNO3
Looks simple but has caused at least a decade of controversy
OH+NO2 HOONO HNO3
OH+NO2 HNO3
Missing chemistry – ‘magic aerosol’ reactions

How do we make HNO3 2
• NO + O3 NO2
• NO2 + h NO + O3
• NO2 + O3 NO3
• NO3 + h NO2 + O3
• NO3 + NO2 N2O5
• N2O5 + h / T NO3 + NO2
• N2O5 2 HNO3 (on aerosols)

N2O5
N2O5
How do we parameterize the uptake?

How do we parameterize the uptake?
• How many molecules hit the surface of the aerosol per second?– Gas kinetics – mean free path etc etc
etc
• What fraction of the molecules that hit the surface of the aerosol react

How do we find the • Lab studies
• For N2O5 important in the stratosphere
• Lots of work done
• = 0.1 ish

What impact does this have on the tropospheric
composition?• REACTION OF N2O5 ON TROPOSPHERIC AEROSOLS - IMPACT ON THE GLOBAL DISTRIBUTIONS OF NOX, O3, AND OH, Dentener FJ, CRUTZEN PJ, J.G.R. 1993
• Abstract:Using a three-dimensional global model of the troposphere, we show that the heterogeneous reactions of NO3 and N2O5 on aerosol particles have a substantial influence on the concentrations of NO(x), O3, and OH. Due to these reactions, the modeled yearly average global NO(x) burden decreases by 50% (80% in winter and 20% in summer). The heterogeneous removal of NO(x) in the northern hemisphere (NH) is dominated by reactions on aerosols; in the tropics and southern hemisphere (SH), with substantial smaller aerosol concentrations, liquid water clouds can provide an additional sink for N2O5 and NO3. During spring in the NH subtropics and at mid-latitudes, O3-concentrations are lowered by 25%. In winter and spring in the subtropics of the NH calculated OH concentrations decreased by up to 30%. Global tropospheric average O3 and OH burden (the latter weighted with the amount of methane reacting with OH) can drop by about 9% each. By including reactions on aerosols, we are better able to simulate observed nitrate wet deposition patterns in North America and Europe. 03 concentrations in springtime smog situations are shown to be affected by heterogeneous reactions, indicating the great importance of chemical interactions resulting from NO(x) and SO2 emissions. However, a preliminary analysis shows that under present conditions a change in aerosol concentrations due to limited SO2 emission control strategies (e.g., reductions by a factor of 2 in industrial areas) will have only a relatively minor influence on O3 concentrations. Much larger reductions in SO2 emissions may cause larger increases in surface O3 concentrations, up to a maximum of 15%, if they are not accompanied by a reduction in NO(x) or hydrocarbon emission.
• Cited 234 times

End of story?
• Well were derived for stratospheric conditions.
• Cold
• Pure sulfuric acid
• Troposphere though is– Warm and sulfuric acid aerosol is
neutralized

Rumblings of discontent
• Tie et al., [2003] found N2O5<0.04 gave a better simulation of NOx concentrations during TOPSE
• Photochemical box model analyses of observed NOx/HNO3 ratios in the upper troposphere suggested that N2O5 is much less than 0.1 [McKeen et al., 1997; Schultz et al., 2000]

2000HETEROGENEOUS CHEMISTRY AND TROPOSPHERIC OZONEJacob, Atmos. Env., 2000
Ozone is produced in the troposphere by gas-phase oxidation of hydrocarbons and CO catalyzed by hydrogen oxide radicals (HOx º OH + H + peroxy radicals) and nitrogen oxide radicals (NOx º NO+NO2). Heterogeneous chemistry involving reactions in aerosol particles and cloud droplets may affect O3 concentrations in a number of ways including production and loss of HOx and NOx, direct loss of O3, and production of halogen radicals. Current knowledge and hypotheses regarding these processes are reviewed. It is recommended that standard O3 models include in their chemical mechanisms the following reaction probability parameterizations for reactive uptake of gases by aqueous aerosols and clouds: gHO2 = 0.2 (range 0.1-1) for HO2 ® 0.5 H2O2, gNO2 = 10-4 (10-6-10-3) for NO2 ® 0.5 HONO + 0.5 HNO3, gNO3 = 10-3 (2x10⁻⁴-10-2) for NO3 ® HNO3, and N2O5 = 0.1 (0.01-1) for N2O5 2 HNO3. Current knowledge does not appear to warrant a more detailed approach. Hypotheses regarding fast O3 loss on soot or in clouds, fast reduction of HNO3 to NOx in aerosols, or heterogeneous loss of CH2O are not supported by evidence. Halogen radical chemistry could possibly be significant in the marine boundary layer but more evidence is needed. Recommendations for future research are presented. They include among others (1) improved characterization of the phase and composition of atmospheric aerosols, in particular the organic component; (2) aircraft and ship studies of marine boundary layer chemistry; (3) measurements of HONO vertical profiles in urban boundary layers, and of the resulting HOx source at sunrise; (4) laboratory studies of the mechanisms for reactions of peroxy radicals, NO2, and HNO3 on surfaces representative of atmospheric aerosol; and (4) laboratory studies of O3 reactivity on organic aerosols and mineral dust.

2003 / 2004
• Working on TRACE-P
• NOx too low in the model
• What could we do about it?
• Normally look at sources
• But also look at sinks
• New literature
New lab studies
• Warmer temperatures
• More humid conditions
• Tropospherically applicable aerosols

New literature
• Kane et al., 2001 - Sulfate – RH– JPL
• Hallquist et al., 2003 - Sulfate - temp– Tony Cox’s group in Cambridge
• Thornton et al., 2003 - Organics - RH– Jon Abbatt’s group at U Torontio

Parameterization based on best available literature
Aerosol type Reaction probabilityb Reference
Sulfatea =(RH)10T)
= 2.7910-4 + 1.310-4 RH -3.4310-6 RH2 +
7.5210-8 RH3 = 410-2(T-294) (T ≥ 282K)= -0.48 (T < 282K)
[Kane et al., 2001] [Hallquist et al., 2003]c
Organic Carbon = RH 5.210-4 (RH < 57%) = 0.03 (RH ≥ 57%)
[Thornton et al., 2003]d
Black Carbon = 0.005 [Sander et al., 2003]
Sea-salt = 0.005 (RH < 62%) = 0.03 (RH ≥ 62%)
[Sander et al., 2003]e
Dust = 0.01 [Bauer et al., 2004]f

What s do we get?
• Much lower than 0.1• Dry low values• Higher at the surface

What is the impact on composition?
Lower N2O5 = higher NOx
Higher NOx = Higher O3
Higer NOx = Higher OH

Does this make the model better?
• Complexity in model isn’t automatically a good thing
• More complex models are not necessarily better at simulating the atmosphere
• Complex models take longer to run and confuse the issue

Compare with observations
Emmons et al. [2000] climatology of NOx
Mass weighted model bias changes from –14.0 pptv to –7.9 pptv
Mean ratio changes from 0.77 to 0.86
Middle troposphere (3-10km) changes from 0.79 to 0.91

Compare with observations
Logan [1998] Ozonesonde climatologyMass weighted model bias
-2.9 ppbv to -1.4 ppbv Mean ratio changes from
0.94 to 0.99. Ox (odd oxygen) budget
Chemical production increases 7% 3900 Tg O3 yr-1 to 4180 Tg O3 yr-1

Compare with observations
Global annual mean tropospheric OH 0.99106 cm-3 to 1.08106 cm-3 8% increase.
Both values are consistent with the current constraints on global mean OH concentrations based on methyl-chloroform observations:
1.07 (+0.09 -0.17) 106 cm-3 [Krol et al., 1998] 1.16 0.17 106 cm-3 [Spivakovsky et al., 2000] 0.94 0.13 106 cm-3 [Prinn et al., 2001]

Conclusions
• Aerosol reaction of N2O5 is very important for the atmosphere
• Previous estimates have been too high
• New laboratory data allows a better constraint
• Sorting out old problems although not ‘sexy’ is important

A ‘cheeky’ bottom-up evaluation of global mean
OH
Last IPCC report
NO + HO2 O3 + OH

Global mean OH

How do they calculate global mean OH
• Methyl chloroform – solvent in Tippex
• Made by a few large chemical companies
• Sources are known (nearly)
• Can measure concentrations across the globe

Measured across the world
• (1) Ireland, Mace Head
• (2) USA Cape Meares, California
• (3) Barbados
• (4) American Samoa
• (5) Tasmania

Observations

Inversion
• Have emissions in your Chemistry – Transport
• Emit the MCF
• Blow it around
• Compare to the observations
• Optimize the OH concentration to get best possible fit

Top down approach
• Don’t directly observe the OH
• Indirect method
• Can directly observe OH
• But lifetime of OH is ~ 1s
• So measurements at one site don’t tell you much about global concentrations
• Is this true?

NAMBLEX, EASE ’97, SOAPEX
• OH measured by the FAGE group in chemistry
• Time series of OH
• Can we use this to provide information about global OH
• ‘Couple’ global atmospheric chemistry model and the observations

Observed vs Modelled OHObservations dominated by day
Mac
e H
ead
- Ir
elan
d

What have we learnt?
• In general high OH at solar noonModel
• Low OH at nightModel
• Daily variability Model ?

More useful comparisonMeasured mean is 1.8 × 106 cm-3, Modelled mean is 2.3 × 106 cm-3
Ratio of 1.56 ± 1.62.
The statistical distribution of the ratio is not normal and so more appropriate metrics such as the median (1.13) or the geometric mean (1.13 +1.44
-0.64 ),
The model simulates 30% of the linear variability of OH (as defined by the R2).
The uncertainty in the observations (13%) suggests that the model systematically overestimates the measured OH concentrations.
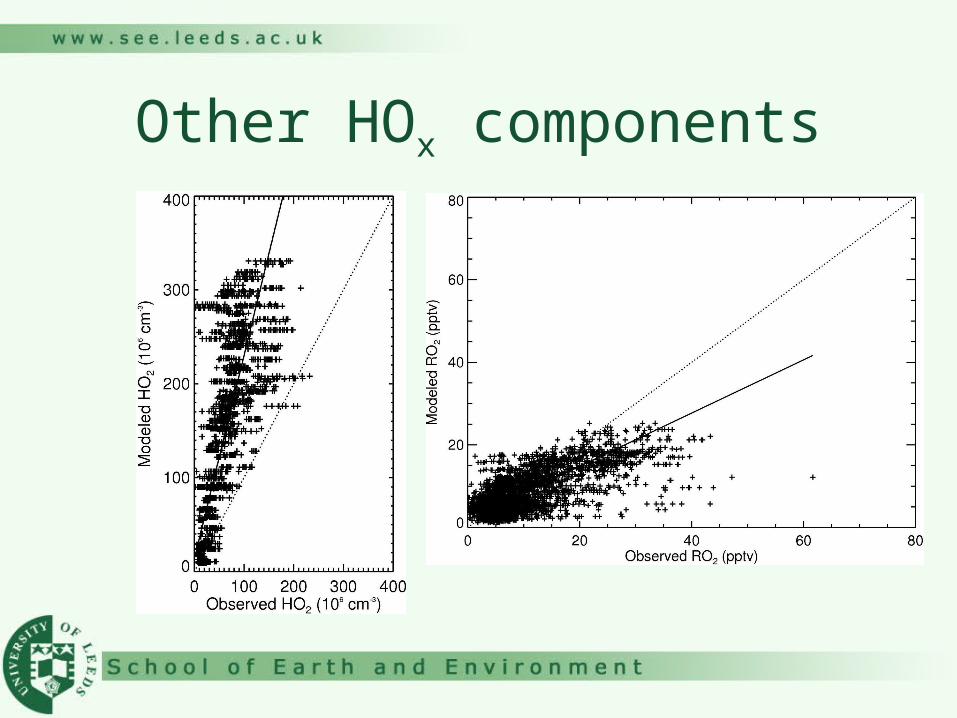
Other HOx components

Over a yearSmoothed mean OH from
modelSampled for the
NAMBLEX campaign
Sampled for the EASE ‘97 campaign
Observed Campaign means

Why the annual variability?
All data over a yearR=0.92
All data over a yearSmoothed R=0.98

Is this only at the surface?

Other places
Cap
e G
rim
- A
ust
ralia

So what have we learnt?
• Mace Head we tend to over estimate
• Cape Grim doesn’t seem so bad
• Can we combine this information and the model to get a global number?
• Very Cheeky!

What do we get?A Priori
(Model)
Compare
FAGE
A Posteri Prinn et al.
NH 1.12 -19% 0.91 0.90 ± 0.20
SH 1.02 +1% 1.03 0.99 ± 0.20
Global 1.07 -9 % 0.97 0.95

What does this mean
• Very, very lucky!!!!
• The FAGE OH and the MCF inversions seem consistent
• Model transfer seems to work
• Uncertainties suggest it could have gone the other way

Can we do this better?
• Include more data– Aircraft campaign– Surface sites– Ships
• How do we incorporate this information?

One approach
• Have the modelled concentrations
• But want to reduce the dimensionality
• Principal Components Analysis
• Takes concentrations from model
• Comes up with different way of thinking about the model gridboxes

Component 1

Component 2

Component 3

Component 4

How might we use this?• Compare OH modelled with OH measured• For each point workout the fraction of that box
represented by each component
• R (Box Model / Measured) = Σ Cstrength Rcomponent
• Find the Rs• Reapply to the model OH field• Calculate a global OH
Conclusions
• CTM comparison with OH looks pretty good
• We can use this information to constrain the model OH and this gives a reasonable result
• To take this further requires a bit more thought