Embed Size (px)
Citation preview
FIBER PROPERTIES AND CARBOHYDRATE AND NITROGENLEVELS OF COTTON PLANTS AS INFLUENCED BY
MOISTURE SUPPLY AND FRUITFULNESS
FRAN K M. EATON AND DAVID R. ERGLE
(WITH TWO FIGURES)
Received October 8, 1951
As distinct from the cereal crops and the spring-flowering fruits, whichare characterized by a reproductive climax, cotton is like the tomato andcucurbits in its indeterminate growth; but it is different in the minor extentto which fruit size is influenced by environment and fruitfulness. In aregional variety study (3), 16 varieties of cotton planted during each ofthree years at eight locations showed locational variations in the varietalmeans of only 8%c in fiber length, 6%c in fiber weight-per-inch and 9%0 infiber strength. In terms of use value, however, such differences have highsignificance. The tendency toward uniformity in the bolls of cotton is ac-counted for by the extent to which young bolls are shed as the plant be-comes heavily fruited. Within varieties and environments, the number ofdeveloping bolls per unit of vegetative weight (11) has been found to beremarkably uniform.
From California irrigation experiments, ADAMS et al. (1) record thatreductions in water supply result generally in losses in staple length (usu-ally within 1/32 inch), seed index (usually within 1.0 gram) and lint index(usually within 0.5 gram). Drought has been observed to decrease thelength of cotton lint (2, 5, 18); with this effect, an increase in fiber strengthwas usually found. BERKLEY et al. (4), as well as others, have associatedthe increased strength of fibers with a narrowing of the angle of the cellu-lose crystallites (x-ray angles).
Increased nitrogen supply has been found to result in some increase inlength of fiber (7, 16, 19). On the other hand, little effect upon length wasfound by STURKIE (18), whereas, in the presence of inadequate supplies ofsome other elements, BROWN (6) reported length reductions to result fromnitrogenous fertilizers. As has been the general experience with other plants,WADLEIGH (19) found increased nitrogen supply to result in lower carbo-hydrate accumulations. He associated as causal the plus and minus changesin carbohydrate or nitrogen with the changes in boll properties and in fiberlength that corresponded in sign.
CROWTHER (7) and NELSON (16) have shown phosphate to increase bollsize but not to alter fiber properties. Nelson also found that potash addi-tions which greatly increased yield also increased fiber length and weightper inch; the x-ray angles were increased and the strength of fiber and yarndecreased. YOUNGE (20) has shown sulphur deficiency that reduced bollproduction had little effect on fiber properties.
541
www.plantphysiol.orgon June 4, 2018 - Published by Downloaded from Copyright © 1952 American Society of Plant Biologists. All rights reserved.
PLANT PHYSIOLOGY
Variation in moisture supply is perhaps the maj or cause of variation incotton production in the United States. Second, in this regard, is the dam-age to the cotton crop caused by attacks of bud, boll, and leaf destroyinginsects and diseases. Disease and insect attacks alter the number of bollsproduced and the leaf area and weight of the vegetative parts of the plant.Changes in relative fruitfulness are a general result of the cotton plant's de-velopment from the first boll to advanced fruiting.
This paper gives the results from a series of experiments in which themajor experimental variables were fruitfulness and moisture supply. Theeffects of variation in these two factors were measured in terms of boll andfiber properties and in terms of associated responses in the carbohydrateand nitrogen accumulations within the plant. Response of the two variablesin Texas are compared with results in California, and inter-varietal correla-tions between carbohydrates and fiber properties are reported. The influ-ence of relative fruitfulness on fiber properties has been mentioned previ-ously (8). Only in the case of nitrogen supply (19) has the intermediatemetabolism of the plant been studied in relation to boll development andfiber length.
Methods
Except as noted, the experiments were of factorial design arranged toyield data for two levels of fruitfulness at each of two moisture levels.During the summers of 1944 and 1945, the plants were grown at CollegeStation, Texas, and during 1946 and 1947 at Shafter, California. In 1947plants at the higher moisture level were deflorated (maintained with buttwo bolls per plant). Additional data on moisture supply, but not on fruit-fulness, are included from experiments at Temple, Texas, in 1944 and atShafter in 1948. Several of the experiments included additional treatmentsand amplifications that are not pertinent to the present subject.
The chemical analyses were made on oven-dried tissues (750 C) groundto pass an 80-mesh screen by methods heretofore described (12, 14). Alldata are expressed as percentages of fresh weight. At the time of the 1944work there was a concurrent interest in the susceptibility of cotton plantsto Phymatotricum root rot. For this reason the root bark was analyzed.In 1945 and later, the middle third of the main stalk was always used asthe principal tissue; but in some instances, the leaves from the middle thirdof the main stalk and the entire roots, as lifted with a shovel, were analyzedas well.
Results
The primary data are presented in four summary tables each calculatedon the basis of factorial analysis, i.e., the means of the two-bolls per planttreatment in wet and dry plots versus full-load plants in wet and dry plotsand the means of full-load and two-boll plants in irrigated plots versusthose in drier plots except in two experiments (Temple, 1944 and Shafter,1947) when there was no defloration in the dry plots. Tables I and II re-
542
www.plantphysiol.orgon June 4, 2018 - Published by Downloaded from Copyright © 1952 American Society of Plant Biologists. All rights reserved.
EATON AND ERGLE: COTTON 543
port, respectively, the percentage changes in the chemical constituents andin the fiber properties resulting from partial defloration. Tables III and IVreport the corresponding changes resulting from low water supply.
EFFECTS OF PARTIAL DEFLORATION
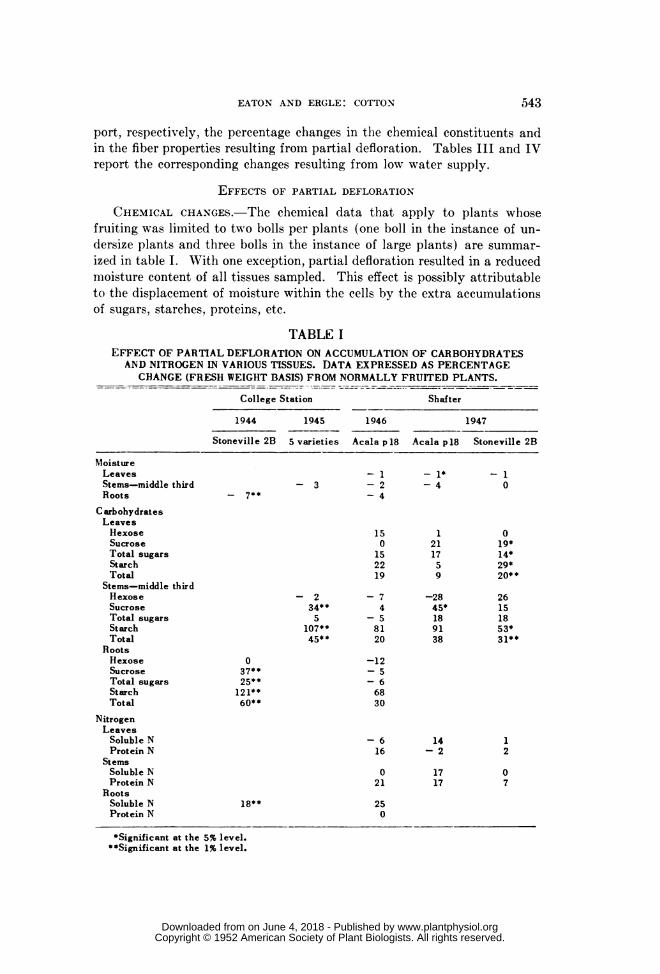
CHEMICAL CHANGES.-The chemical data that apply to plants whosefruiting was limited to two bolls per plants (one boll in the instance of un-dersize plants and three bolls in the instance of large plants) are summar-ized in table I. With one exception, partial defloration resulted in a reducedmoisture content of all tissues sampled. This effect is possibly attributableto the displacement of moisture within the cells by the extra accumulationsof sugars, starches, proteins, etc.
TABLE IEFFECT OF PARTIAL DEFLORATION ON ACCUMULATION OF CARBOHYDRATESAND NITROGEN IN VARIOUS TISSUES. DATA EXPRESSED AS PERCENTAGECHANGE (FRESH WEIGHT BASIS) FROM NORMALLY FRUITED PLANTS.
College Station Shafter
1944 1945 1946 1947
Stoneville 2B 5 varieties Acala p18 Acala p18 Stoneville 2B
MoistureLeavesStems-middle thirdRoots
CarbohydratesLeavesHexoseSucroseTotal sugarsStarchTotal
Stems-middle thirdHexoseSucroseTotal sugarsStarchTotal
RootsHexoseSucroseTotal sugarsStarchTotal
- 7**- 3
- 1- 2-4
- 1*-4
15 10 21
15 1722 519 9
- 234**
107**45* *
037**25* *
121**60**
NitrogenLeavesSoluble NProtein N
StemsSoluble NProtein N
RootsSoluble N 18**Protein N
*Significant at the 5% level.**Significant at the 1% level.
-74
-58120
-2845*189138
- 10
019*14*29*20* *
26151853*31**
-12- 5- 66830
- 616
14- 2
12
07
0 1721 17
250
www.plantphysiol.orgon June 4, 2018 - Published by Downloaded from Copyright © 1952 American Society of Plant Biologists. All rights reserved.
PLANT PHYSIOLOGY
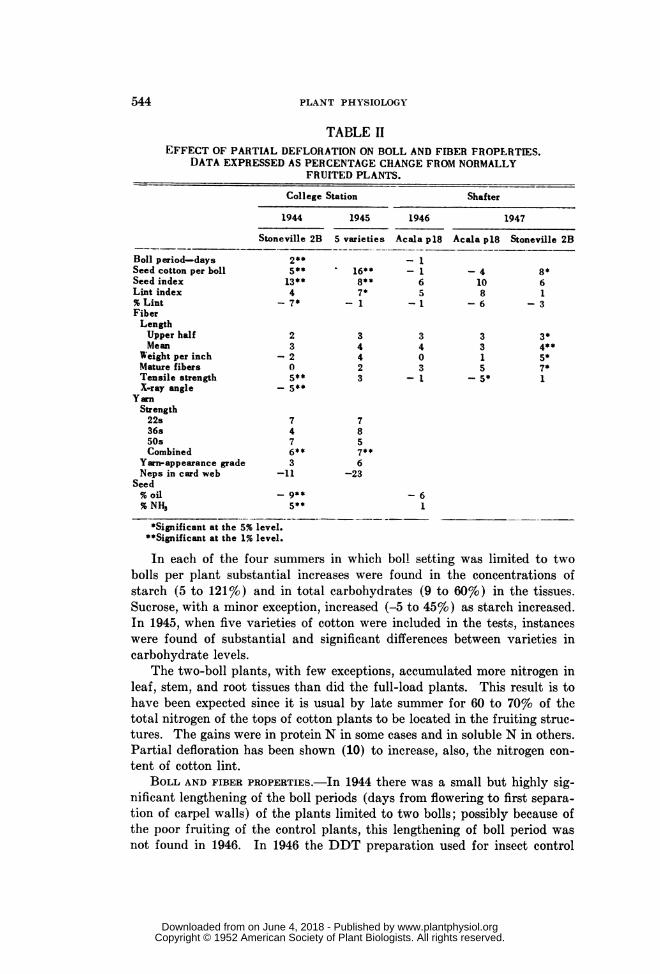
TABLE IIEFFECT OF PARTIAL DEFLORATION ON BOLL AND FIBER FROPERTIES.
DATA EXPRESSED AS PERCENTAGE CHANGE FROM NORMALLYFRUITED PLANTS.
College Station Shafter
1944 1945 1946 1947
Stoneville 2B 5 varieties Acala pl8 Acala pl8 Stoneville 2B
Boll period-days 2** - 1Seed cotton per boll S** 16** -1 - 4 8*Seed index 13** 8** 6 10 6Lint index 4 7* 5 8 1%Lint -7 -1 -1 -6 -3FiberLengthUpper half 2 3 3 3 3*Mean 3 4 4 3
Weight per inch -2 4 0 1 5*Mature fibers 0 2 3 5 7*Tensile strength 5** 3 -1 -5* 1X-ray angle -5**
YarnStrength22s 7 736s 4 850s 7 5Combined 6** 7**
Yarn-appearance grade 3 6Neps in card web -11 -23
Seed% oil - 9** -6% NH3 5** 1
*Significant at the 5% level.*Significant at the 1% level.
In each of the four summers in which boll setting was limited to twobolls per plant substantial increases were found in the concentrations ofstarch (5 to 121%o) and in total carbohydrates (9 to 60%o) in the tissues.Sucrose, with a minor exception, increased (-5 to 45%o) as starch increased.In 1945, when five varieties of cotton were included in the tests, instanceswere found of substantial and significant differences between varieties incarbohydrate levels.
The two-boll plants, with few exceptions, accumulated more nitrogen inleaf, stem, and root tissues than did the full-load plants. This result is tohave been expected since it is usual by late summer for 60 to 70% of thetotal nitrogen of the tops of cotton plants to be located in the fruiting struc-tures. The gains were in protein N in some cases and in soluble N in others.Partial defloration has been shown (10) to increase, also, the nitrogen con-tent of cotton lint.
BOLL AND FIBER PROPERTIES.-In 1944 there was a small but highly sig-nificant lengthening of the boll periods (days from flowering to first separa-tion of carpel walls) of the plants limited to two bolls; possibly because ofthe poor fruiting of the control plants, this lengthening of boll period wasnot found in 1946. In 1946 the DDT preparation used for insect control
544
www.plantphysiol.orgon June 4, 2018 - Published by Downloaded from Copyright © 1952 American Society of Plant Biologists. All rights reserved.
E.A-TON AND ERGLE: COTTON
was not effective and as a consequence the control plants were sparselyfruited. With aji varieties other than Acala p18, the limiitation of fruitingcaused an increase in weight of seed cotton per boll. In all years and vari-eties, the seed index (weight of 100 seeds) and the lint index (lint on 100seeds) were increased. The foregoing responses indicate that partial deflor-ation gave the bolls on the two-boll plants a nutritional advantage. Thereduced percentages of lint are due to seed index having been increasedmore than lint index.
Partial defruiting reduced the percentage of oil in the seed whereas thepercentage of NH3 was increased. Calculations from the data show that interms of oil and protein per seed (1944) there was a gain of 1.8% in oil and16.5% in protein which indicates that with extra nitrogen in the boll, pro-tein synthesis is favored over oil synthesis.
In all experiments partial defloration increased fiber length but onlywithin the range of about 3%7. The gains both in upper-half mean lengthand in mean length were consistent. Fiber weight per inch was increasedsignificantly by 5% in one test; when the results in all tests are averaged,the gain was about 2%. Increases in the percentage of mature fibers (thosewith wall thickness greater than lumen diameter) occurred in four of thefive trials, the average gain amounted to about 3%.
In the five varieties used in 1945, the tensile strength of the fibers wasincreased in three trials by partial defloration, but in both trials with Acalap18 the strength was decreased. The x-ray angles were measured only in1944. In this test, the angle was narrowed by 5% which corresponded witha 5% gain in fiber strength. Yarn strength was measured in two of thetests; there was a gain of 6%7 in 1944 and 7% in 1945 and both increaseswere significant.
EFFECTS OF DROUTH
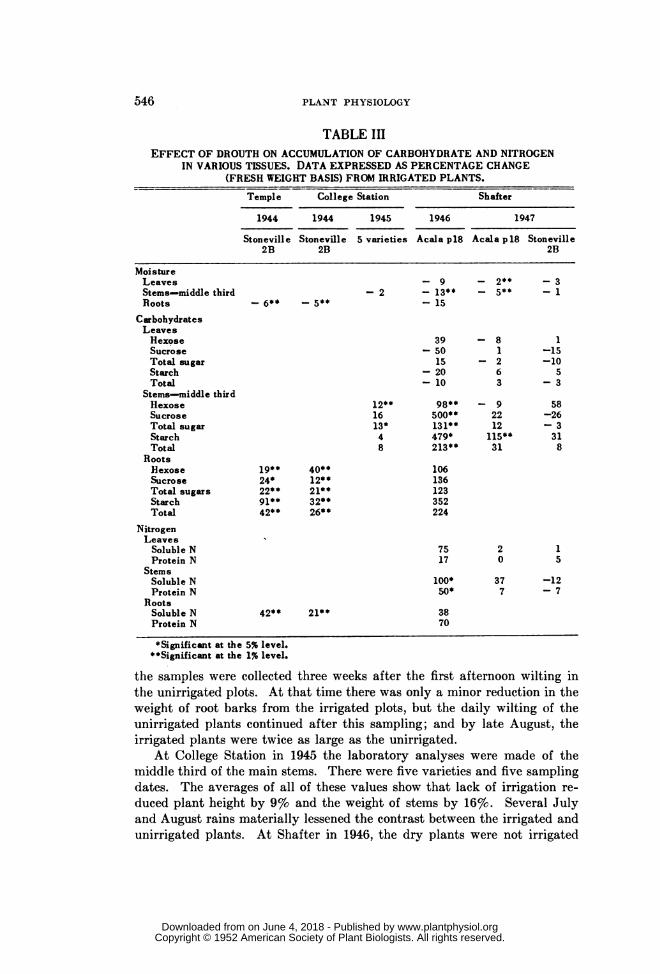
The data on the influence of drouth on carbohydrate and nitrogen ac-cumulation are summarized in table III, and those on fiber properties aresummarized in table IV. The extent of effects of drouth on the carbohy-drate and nitrogen levels and on boll and fiber properties are relatedthroughout the series of tests to the severity of the water deficiency. Forthis reason growth will be reviewed before considering the data of thesetables.
GROWTH.-For the years 1944, 1945, and 1946, an index to the growthreductions caused by moisture deficiency is afforded by the weights of thesamples collected for laboratory analyses. A series of detailed plant meas-urements were made in conjunction with the experiments of 1947 and 1948.In 1944 at Temple, Texas, laboratory samples were collected at five datesbetween July 17 and August 20. The average weight of root bark of plantswithout irrigation over the entire sampling period was reduced by an aver-age of 31%o relative to the plants irrigated; at the last sampling the reduc-tion was much greater. At College Station, during the same dry summer,
545
www.plantphysiol.orgon June 4, 2018 - Published by Downloaded from Copyright © 1952 American Society of Plant Biologists. All rights reserved.
PLANT PHYSIOLOGY
TABLE IIIEFFECT OF DROUTH ON ACCUMULATION OF CARBOHYDRATE AND NITROGEN
IN VARIOUS TISSUES. DATA EXPRESSED AS PERCENTAGE CHANGE(FRESH WEIGHT BASIS) FROM IRRIGATED PLANTS.
Temple College Station Shafter
1944 1944 1945 1946 1947
Stoneville Stoneville 5 varieties Acala p18 Acala p18 Stoneville2B 2B 2B
MoistureLeavesStems-middle thirdRoots
CarbohydratesLeavesHexoseSucroseTotal sugar
StarchTotal
Stems-middle thirdHexoseSucroseTotal sugar
StarchTotal
RootsHexoseSucroseTotal sugarsStarchTotal
NitrogenLeavesSoluble NProtein N
StemsSoluble NProtein N
RootsSoluble NProtein N
- 6** - 5**
9
- 2 - 13**- 15
12**1613*48
19**24*22* *91**42**
40**12**21**32**26**
3950152010
98**500**131**479*213**
- 2** - 3- 5** - 1
- 81
- 263
9
2212
115**31
1
-15-10
5-3
58-26-3318
106136123352224
75 2 117 0 5
100*50*
3870
42** 21**
37 -127 - 7
*Significant at the 5% level.**Significant at the 1% level.
the samples were collected three weeks after the first afternoon wilting inthe unirrigated plots. At that time there was only a minor reduction in theweight of root barks from the irrigated plots, but the daily wilting of theunirrigated plants continued after this sampling; and by late August, theirrigated plants were twice as large as the unirrigated.
At College Station in 1945 the laboratory analyses were made of themiddle third of the main stems. There were five varieties and five samplingdates. The averages of all of these values show that lack of irrigation re-duced plant height by 9%o and the weight of stems by 16%o. Several Julyand August rains materially lessened the contrast between the irrigated andunirrigated plants. At Shafter in 1946, the dry plants were not irrigated
546
www.plantphysiol.orgon June 4, 2018 - Published by Downloaded from Copyright © 1952 American Society of Plant Biologists. All rights reserved.
EATON AND ERGLE: COTTON 547
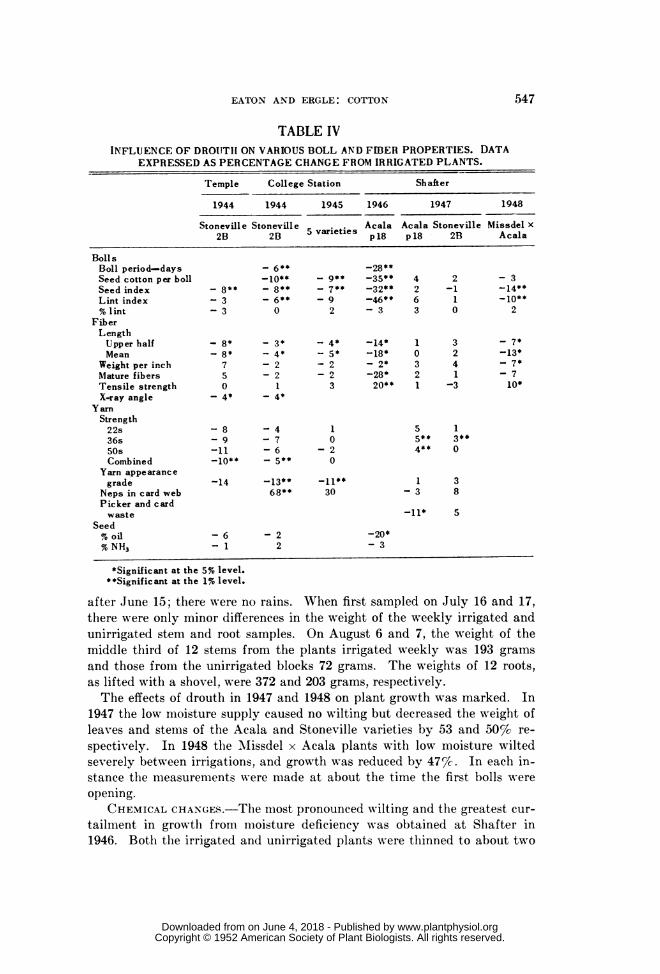
TABLE IVINFLUENCE OF DROIUTI1 ON VARIOUS BOLL AND FIBER PROPERTIES. DATA
EXPRESSED AS PERCENTAGE CHANGE FROM IRRIGATED PLANTS.
Temple College Station Shafter
1944 1944 1945 1946 1947 1948
Stoneville Stoneville ieties Acala Acala Stoneville Missdel)x2B 2B p18 p18 2B Acala
Boll sBoll period-days -6** -28**Seed cotton per boll -10** - 9** -35** 4 2 - 3Seed index - 8** - 8** - 7** -32** 2 -1 -14**Lint index - 3 - 6** - 9 -46** 6 1 -10**% lint - 3 0 2 - 3 3 0 2
FiberLengthUpper half - 8* - 3* - 4* -14* 1 3 - 7*Mean -8* - 4* . 5* -18* 0 2 -13*
Weight per inch 7 - 2 -2 - 2* 3 4 7*Mature fibers 5 - 2 2 -28* 2 1 7Tensile strength 0 1 3 20** 1 -3 10*X-ray angle - 4* - 4*
Y arnStrength22s - 8 - 4 1 5 136s - 9 - 7 0 5** 3**50s -11 - 6 -2 4** 0Combined -10** - 5** 0
Yarn appearancegrade -14 -13** -11** 1 3
Neps in card web 68** 30 - 3 8Picker and cardwaste 11* 5
Seed% oil -6 -2 -20*% NH3 -1 2 -3
*Significant at the 5%o level.**Significant at the 1% level.
after June 15; there were no rains. When first sampled on July 16 and 17,there were only minor differences in the weight of the weekly irrigated andunirrigated stem and root samples. On August 6 and 7, the weight of themiddle third of 12 stems from the plants irrigated weekly was 193 gramsand those from the unirrigated blocks 72 grams. The weights of 12 roots,as lifted with a shovel, were 372 and 203 grams, respectively.The effects of drouth in 1947 and 1948 on plant growth was marked. In
1947 the low moisture supply caused no wilting but decreased the weight ofleaves and stems of the Acala and Stoneville varieties by 53 and 50% re-spectively. In 1948 the Mlissdel x Acala plants with low moisture wiltedseverely between irrigations, and growth was reduced by 47%c. In each in-stance the measurements were made at about the time the first bolls wereopening.
CHEMICAL CHANGES.-The most pronounced wilting and the greatest cur-tailment in growth from moisture deficiency was obtained at Shafter in1946. Both the irrigated and unirrigated plants were thinned to about two
www.plantphysiol.orgon June 4, 2018 - Published by Downloaded from Copyright © 1952 American Society of Plant Biologists. All rights reserved.
PLANT PHYSIOLOGY
feet to allow extra soil volume per plant. Relative to the irrigated cotton,table III, there were large reductions in the percentage of inoisture in leaves(9%c), stems (13%o) and roots (15%).
The hexose sugars of the leaves in 1946 showed a slight increase but thisincrease failed to offset larger losses that occurred in the concentrations ofsucrose and starch. Very different results were found in stem and roottissues. Total sugars were three times as high in the stems of the dry plantsas in those irrigated weekly (3.26%c and 0.98% respectively). There wasan average of 1.68% of starch in the stems of the dry plants against 0.29%in irrigated stems. The effect of drouth on the carbohydrates of the rootswas only slightly less pronounced. In this experiment drouth also causedgains of 38 to 100% in the amounts of soluble nitrogen of the leaves, stems,and roots. The moisture deficiency was less in the other years and effectsof drouth on carbohydrate accumulations were also less. In the relativelydry summer of 1944, the gains in sugars plus starch in root tissues were sub-stantial at both Temple and College Station. In the rainy summer of 1945at College Station, however, the unirrigated plants accumulated only a littlemore sugar and starch in their stems than the irrigated plants and the lattermade only a little more growth. At Shafter in 1947, moisture deficienciesthat reduced growth to about half, but which caused no wilting, did notresult in significant differences in sugars or starch in the leaf tissues (meansof six sample collections) of either Acala p18 or Stoneville 2B. In thestems, both varieties showed gains in starch of substantial magnitude.
The effect of drouth on the nitrogen content of leaves and stems wasmore often positive than negative and in 1946 the gain was large.
BOLL AND FIBER PROPERTIES.-With a few minor exceptions, drouth re-sulted in losses in seed cotton per boll and in reduced seed and lint indexes,table IV. These reductions were 8 to 10%o in both 1944 and 1945, and 30to 40%o under the extreme conditions of the 1946 experiment. In the latteryear, the bolls under dry treatment opened at an average age of 42 dayscompared with 59 days for the irrigated plants.
Under drouth there were reductions in fiber length, weight per inch andpercentage of mature fibers. These reductions were most marked in yearswhen the severity of wilting was most marked. In 1947 when there was nowilting, but a great reduction in plant growth, there were small gains, ratherthan losses, in the foregoing properties. Yarn appearance was improvedsubstantially by drouth in those instances when the differences were signifi-cant. In each of these instances, the numbers of neps were also increased.It was evident that the reduced fiber length with drouth improved yarnappearance more than it was injured by neps.
Fiber tensile strength under the severe moisture deficiency of 1946showed a significant gain of 20%. In 1948, when there was also much wilt-ing, there was a significant 10% gain. In Texas, the water deficiencies of1944 at College Station and at Temple had little effect on fiber tensilestrength. In the two years when there were significant increases in tensile
548
www.plantphysiol.orgon June 4, 2018 - Published by Downloaded from Copyright © 1952 American Society of Plant Biologists. All rights reserved.
EATON AND ERGLE: COTTON
strengt-h, it was accompanied by significant decreases in fiber length, uni-formity ratio, weight per inch, and percentage of mature fibers. In twoexperiments of 1944 (Temple and College Station), the x-ray angles weremeasured and found to have been significantly decreased by drouth. In thetests of 1944 at Temple and College Station, yarn strength was significantlydecreased by drouth. In the five varieties in 1945 there was no effect onyarn strength. In 1947, water limitation resulted in increased yarn strengthof both Acala and Stoneville varieties. The years when yarn strength de-creased were years when drouth shortened the fibers but had little effectupon fiber strength.
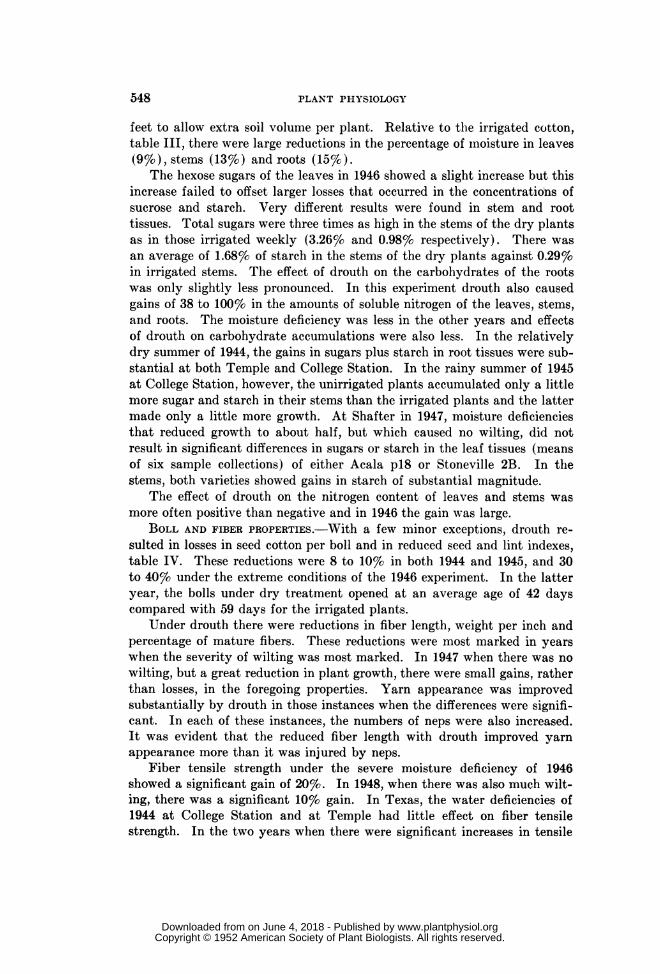
CARBOHYDRATE LEVELS AND FIBER PROPERTIES OF COTTON IN TEXASAND CALIFORNIA
Substantial differences were found both in the moisture and carbohy-drate levels of the stem samples, table V, and in the fiber properties, tableVI, of plants grown in Texas and in California. College Station has ahigher relative humidity than Shafter (in the late afternoon, 75%o comparedwith 35%o). The two locations have similar mlaximum temperatures, butCollege Station has a higher minimum temperature (71 compared with 61).College Station has occasional cloudy days; the Shafter sky varies between
TABLE VCARBOHYDRATES IN NORNMALLY FRUITED AND IRRIGATED PLANTS IN'TEXAS AND CALIFORNIA. PERCENTAGES ON FRESH WEIGHT BASIS.
Year Location, variety Nloisture Carbohydratesand tissue Ilexose Sucrose Starch Total
1944 TempleRoot bark, Stoneville 2B 75.2 1.01 1.70 1.11 3.82
College StationRoot bark, Stoneville 2B 75.7 0.92 1.75 1.56 4.25
1945 College StationStemsArkansas Rowden B4 67.2 1.40 .35 1.19 2.94Delta and Pine Land 14 66.2 1.65 .49 1.09 3.23Ili-Bred 67.2 1.64 .24 1.45 3.33Stoneville 2B 67.0 1.96 .33 1.27 3.55Oklahoma Triumph 92-1-1 65.9 1.69 .22 1.65 3.56
1946 ShafterAcala p18Leaves 78.6 .14 .09 .36 0.60Stems 76.8 .85 .08 .27 1.20Large roots 72.0 .49 .45 .68 1.62
1947 ShafterAcala p18Leaves 77.0 .13 .29 .44 0.85Stems 75.0 .46 .76 .40 1.61
Stoneville 2BLeaves 76.8 .12 .37 .41 0.91Stems 72.1 .36 .94 .77 2.08
549
www.plantphysiol.orgon June 4, 2018 - Published by Downloaded from Copyright © 1952 American Society of Plant Biologists. All rights reserved.
PLANT PHYSIOLOGY
TABLE VIBOLL AND FIBER PROPERTIES OF NORMALLY FRUITED PLANTS IN
IRRIGATED PLOTS IN TEXAS AND CALIFORNIA.
Seed Seed Lint Fiber length Wt. Mature TensileYear Location and variety cotton index index Upper er fibers stength
per boll half Mean M.
gin. gm./100 gn./1X00 in. in. . 1000 lbs.sq. in.
1944 Temple, TexasStoneville 2B .... 11.4 6.0 0.98 0.76 4.1 78 88
1944 College Station, TexasStoneville 2B 5.8 12.2 6.2 1.04 .81 4.2 76 88
1945 College Station, TexasArkansas Rowden B4 6.6 12.3 7.0 1.07 .90 4.3 85 82Oklahoma Triumph 92 5.5 11.5 6.3 1.02 .83 4.5 81 71Delta and PineLand 14 5.4 10.7 6.8 1.11 .90 4.5 88 77
Hi-Bred 6.5 10.7 7.4 0.85 .71 5.8 86 79Stoneville 2B 5.9 12.3 6.7 1.10 .88 4.1 83 81
1946 Shafter, CaliforniaAcala p18 8.4 15.7 8.8 1.10 .92 4.2 84 74
1947 Shafter, CaliforniaAcala p18 7.2 14.1 9.8 1.04 .79 5.9 76 67Stoneville 2B 6.6 14.0 8.7 .98 .74 3.8 74 76
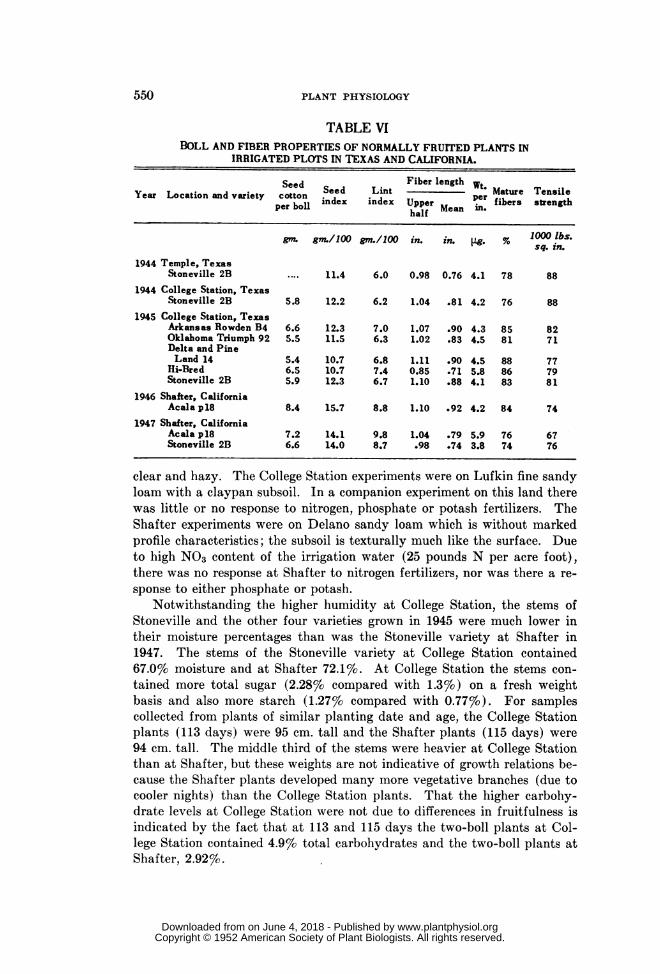
clear and hazy. The College Station experiments were on Lufkin fine sandyloam with a claypan subsoil. In a companion experiment on this land therewas little or no response to nitrogen, phosphate or potash fertilizers. TheShafter experiments were on Delano sandy loam which is without markedprofile characteristics; the subsoil is texturally much like the surface. Dueto high N03 content of the irrigation water (25 pounds N per acre foot),there was no response at Shafter to nitrogen fertilizers, nor was there a re-sponse to either phosphate or potash.
Notwithstanding the higher humidity at College Station, the stems ofStoneville and the other four varieties grown in 1945 were much lower intheir moisture percentages than was the Stoneville variety at Shafter in1947. The stems of the Stoneville variety at College Station contained67.0%v moisture and at Shafter 72.1%o. At College Station the stems con-tained more total sugar (2.28%v compared with 1.3%) on a fresh weightbasis and also more starch (1.27% compared with 0.77%o). For samplescollected from plants of similar planting date and age, the College Stationplants (113 days) were 95 cm. tall and the Shafter plants (115 days) were94 cm. tall. The middle third of the stems were heavier at College Stationthan at Shafter, but these weights are not indicative of growth relations be-cause the Shafter plants developed many more vegetative branches (due tocooler nights) than the College Station plants. That the higher carbohy-drate levels at College Station were not due to differences in fruitfulness isindicated by the fact that at 113 and 115 days the two-boll plants at Col-lege Station contained 4.9%o total carbohydrates and the two-boll plants atShafter, 2.92%.
550
www.plantphysiol.orgon June 4, 2018 - Published by Downloaded from Copyright © 1952 American Society of Plant Biologists. All rights reserved.
EATON AND ERGLE: COTTON
In 1944 and 1945, the Stoneville variety at College Station contained5.8 and 5.9 grams of seed cotton per boll and at Shafter in 1947, 6.6 grams;the differences in seed index and lint index were greater. The Stonevillefibers at College Station were longer, weighed more per inch, and werestronger than at Shafter; but the yarn strength was the same at the twolocations. As calculated from seed cotton per boll, seed index, and lint in-dex, there were 31.5 seeds per boll at College Station and 29.0 at Shafter;thus there were many more fibers per seed at Shafter since the lint indexwas much higher there and the length of fibers and weight per inch wereless.
TABLE VIITOAL CARBOHYDRATES (SUGARS AND STARCH) IN THE STEMS OF FIVE
VARIETIES OF COTTON SAMPLED AT FIVE DATES. VALUESEXPRESSED AS PERCENTAGES OF FRESH WEIGHT.
COLLEGE STATION, 1945.
Variety DatesTreatments
MeanWet Dr-y Wet Dry
full load full load two-boll two-boll
7-17 2.58 2.91 2.86 2.50 2.717-25 3.20 3.48 2.81 3.15 3.168-1 3.55 4.14 4.12 5.93 4.448-8 3.58 3.50 6.11 6.63 4.968-20 3.69 4.00 8.23 7.95 5.97Mean 3.32 3.61 4.83 5.23 4.25
Arkansas Rowden B-4 2.94 3.21 3.95 4.47 3.64Delta and Pine Land 14 3.23 3.31 4.23 5.24 4.00Hi-Bred 3.33 3.56 4.78 4.65 4.08Stoneville 2B 3.55 4.00 4.96 5.83 4.58Oklahoma Triumph 92-1-1 3.56 3.96 6.22 5.97 4.93
Mean 3.32 3.61 4.83 5.23 4.25
DF Mean square LSD between any tut meansTreatment 3 21.43Dry vs. Wet 1 2.98Full vs. Two-boll 1 61.23Interactions 1 0.08
Varieties 4 5.14Dates 4 35.17Variety X treatment 12 0.65Variety X date 16 0.42Treatment X date 12 7.05Error (TX DX V) 48 0.37Total 99 3.46Treatment 3 21.43* 0.35Variety 4 5.14J* 0.89Error (TX DX V) 48 0.37Treatment 3 21.43* 1.64Date 4 35.17* 1.83Error (T x D) 12 7.05Variety 4 5.14** 0.39Date 4 35.17** 0.39Error (Tx Dx V) 48 0.37
*Significant at the 5% level.**Significant at the 1% level.
551
www.plantphysiol.orgon June 4, 2018 - Published by Downloaded from Copyright © 1952 American Society of Plant Biologists. All rights reserved.
552 PLANT PHYSIOLOGY
' 0 leto co -4 t-s#
O > C . s.Ot+
0~~~~~~
O -X ).= \° coV : °
4, 0 0 coXz>;;X ,c S cc cci - u.
0
E-4~ ~ ±C)U,q5
c o¢c>2.E Eo
W(/ 024 o 'oco £ O
e )U, 0 * - \@--- -
> .20 ccl o c0-4=~~~~~~~~~~~0=C) ~ C C~\ U
02
4)
U, 02
E-4~024
C/)~ -4
0 ~~~ 1 '\0coot)
4u)
www.plantphysiol.orgon June 4, 2018 - Published by Downloaded from Copyright © 1952 American Society of Plant Biologists. All rights reserved.
EATO-N AND ERGLE: COTTON5
CARBOHYDRATE LEVELS AND FIBER PROPERTIES OF FIXE VARIETIES OF COTTONY
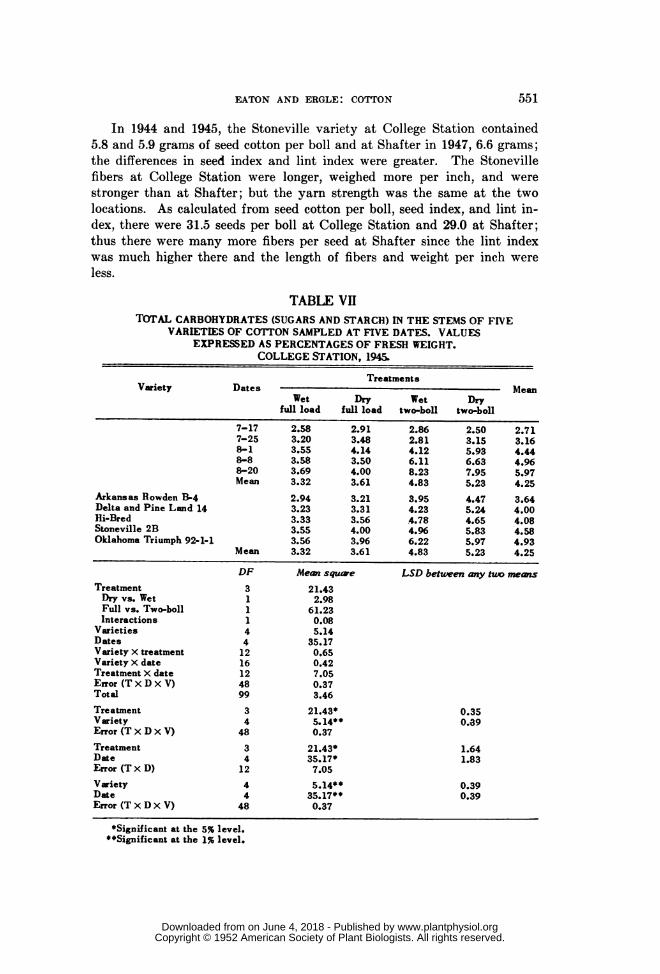
Five varieties were included in the 1945 experiment to determine if vari-eties might be characterized by their carbohydrate levels as well as by planttype, vigor of growth, and fiber properties and to compare the reactions ofthese varieties to partial defloration and drouth with the responses observedin Stoneville 2B in 1944. Only the middle thirds of the main stems were
analyzed. As shown in table VII, there were significant differences betweena number of the varieties in the accumulation of sugar plus starch but no
significant difference in the reactions of the five varieties (item 7 of themean squares) to the four treatments.
In all treatments, Arkansas Rowden had the lowest carbohydrate andeither Oklahoma Triumph or Stoneville 2B was highest. No interactionwas found between varieties and dates of sampling. A significant interac-tion between treatment and date of sampling was found, i.e., with the ad-vance of the summer, plants in the two-boll treatment gained more in car-
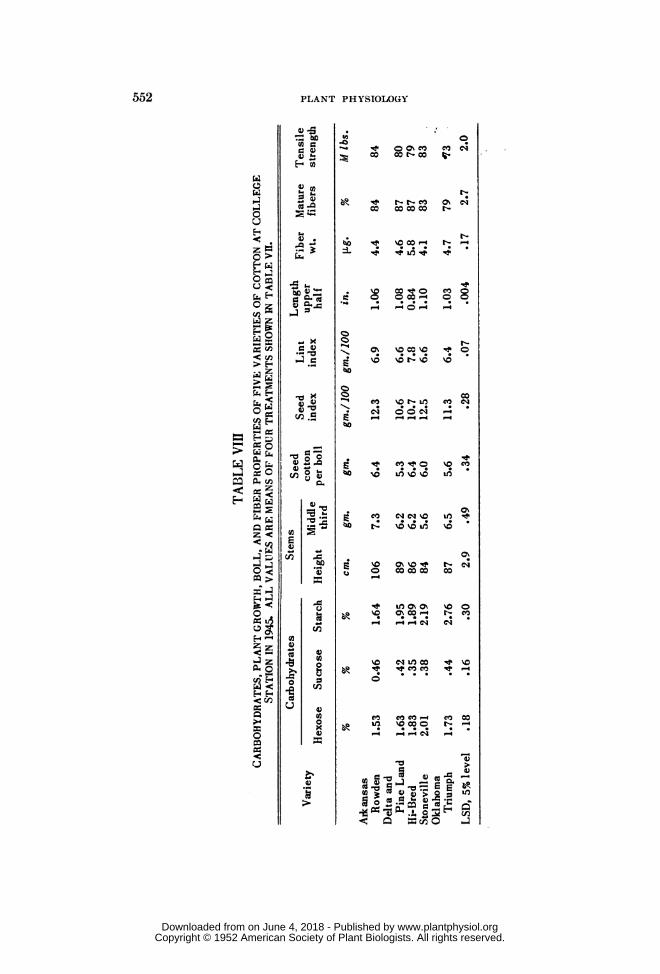
bohydrate level than those in the full-load treatIment. In all varieties andtreatments there were increases in carbohydrate level with the advance ofthe summer. The mean concentrations of hexose, sucrose and starch forall treatments and dates in each of the five varieties are reported in tableVIII. There were significant differences between some of the varieties inhexose sugars and in starch but not in sucrose; Stoneville had the highesthexose content and Triumph the highest starch. The ratio of starch to hex-ose was extra high in the latter variety.
Plant heights, mean weights of the middle third of the stems and themean values for the fiber properties are reported in table VIII. In all ofthese characters there were significant differences between some of the
TABLE IXINTER-VARIETAL SIMPLE CORRELATIONS* FOR SUGARS, STARCH, AND TOTAL
CARBOHYDRATES WITH VARIOUS PLANT, BOLL, AND FIBER PROPERTIES.COLLEGE STATION, 1945,
Full-load plants Two-boll plantsCharacters
Sugars Starch Carbohydrates Sugars Starch Carbohydrates
PlantIleight -0.83 -0.37 -0.78 -0.39 -.61 -0.65Stem weight - .82 - .17 .56 - .44 -.47 - .54
BollSeed cotton per boll - .66 - .20 - .54 .28 -.48 - .34Seed index - .28 .07 - .13 .07 -.18 - .13Lint index - .44 - .48 - .59 .04 -.52 -.44
FiberFiber length - .01 - .18 -.12 - .25 .18 .07Fiber weight - .24 - .01 - .16 .05 -.27 .25Mature fibers - .46 - .80 - .81 .01 -.69 - .59Tensile strength - .08 - .60 - .44 .20 -.64 - .48
*Required for significance: 5% level 0.63, 1% level 0.76.
553
www.plantphysiol.orgon June 4, 2018 - Published by Downloaded from Copyright © 1952 American Society of Plant Biologists. All rights reserved.
PLANT PHYSIOLOGY
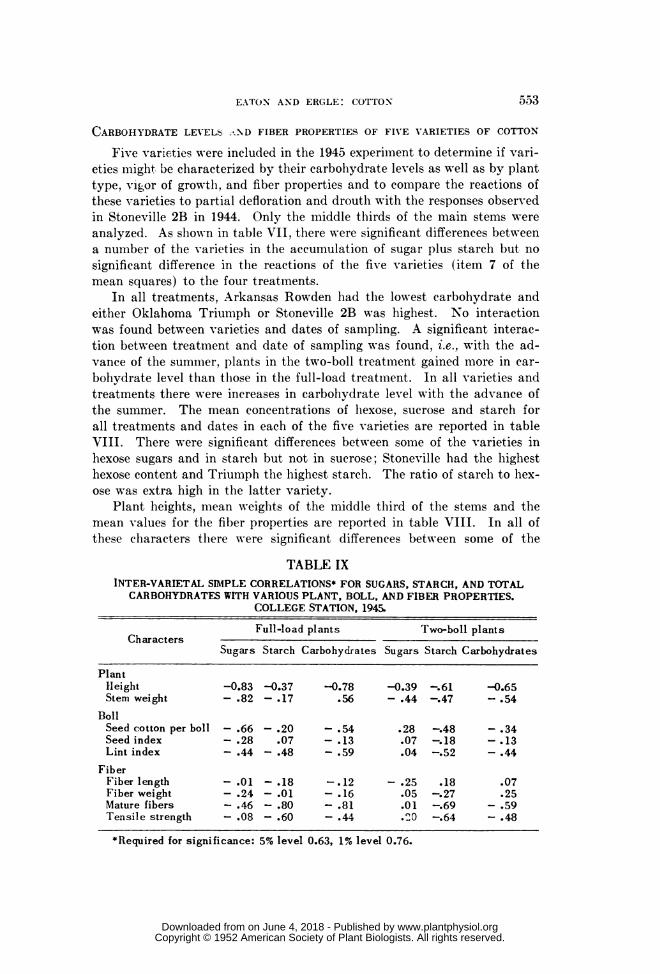
varieties. Carbohydrate levels in a selected tissue can at best be only abalance between such diverse processes as rates of photosynthesis, translo-cation, and utilization; all of which are undoubtedly influenced by a varietyof factors. For this reason, it had not occurred to us that there might beinter-varietal correlations of carbohydrate levels with either growth or fiberproperties. Some of the inter-relations apparent in the tabulated data,however, prompted the calculation of the simple correlation coefficients re-ported in table IX. The differences in carbohydrate levels between the wetand dry treatments being relatively small, there seemed to be some justifi-cation for combining these treatments in one array for the full load valuesand in one for the two-boll values. The most salient feature brought out bytable IX is that all significant correlation coefficients had negative signs,both in the full load and in the two-boll groups. These negative correla-tions show that between varieties, differences in rate of carbohydrate userather than differences in level of carbohydrate supply dominated the de-velopmental responses.
The values for total sugars and total carbohydrate gave higher correla-tions with plant height, stem weight, and boll size than did starch; butstarch gave higher values with mature fibers and fiber strength. Betweenvarieties, neither starch nor sugar content showed significant relations withfiber length or fiber weight. When account is taken of the high carbohy-drate levels in the two-boll plants, it seems surprising that the rate of usecould have made enough of an inroad into the carbohydrate supply fornegative correlations to exist with any of the plant or boll properties. Itwill be observed in table IX that as a group, the two-boll coefficients tendedto be less negative than the full-boll coefficients. The sugar and starch re-lations under the two treatments appear to be somewhat different. In thecoefficients for sugars, the full load plants are more negative than the two-boll in eight of the nine comparisons. On the other hand for starch, the re-verse is found; the two-boll coefficients are more negative in seven out ofthe nine comparisons.
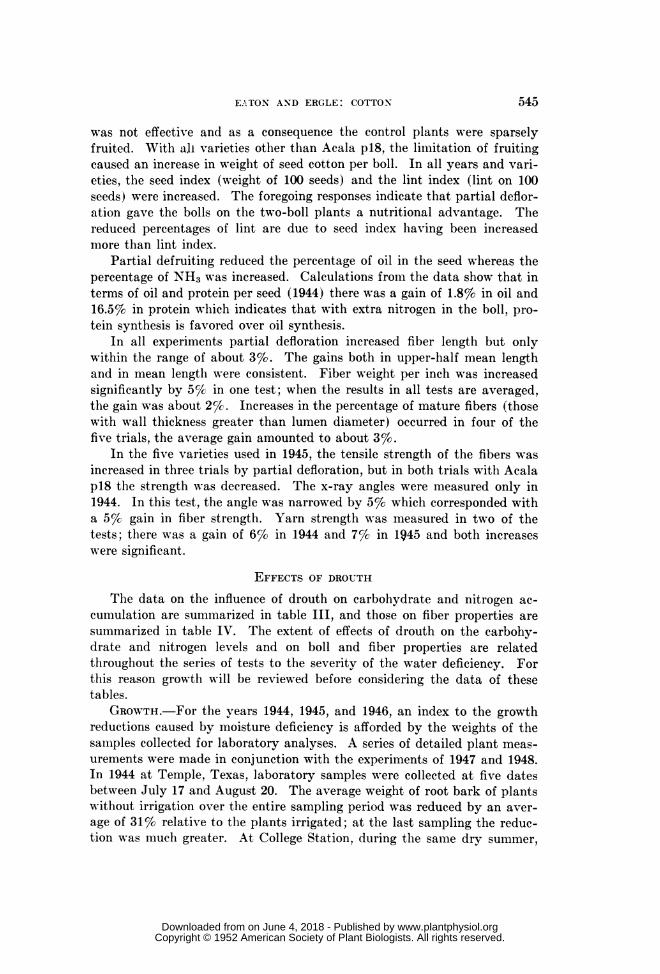
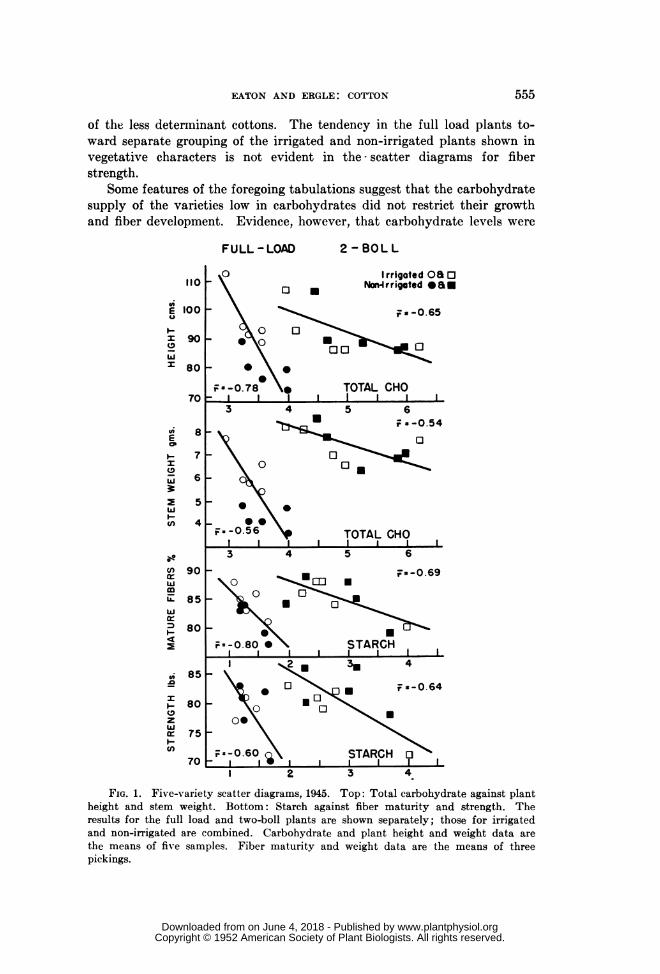
A number of relations are brought out in figure 1. The narrow rangein carbohydrate levels between the five varieties in the full load series be-comes a wide range in the two-boll series; this spread is two or three timesas great in the latter. The segregation of the points for irrigated and non-irrigated plants (actually two groups of values) that is notable for heightand weight in the full-load plants disappears in the two-boll plants. Buteven without the segregation, the coefficient for carbohydrate with heightwas significant. In an earlier paper (9), it was shown that removing thefloral buds throughout a summer doubled the ratio of roots to tops. It ap-pears here that the enlarged root systems of the two-boll plants enabledthem to get moisture that was not within the reach of the full load plants.Attention was called earlier (12) to an observation by J. W. Neally thatearly determinant strains of cotton in the Mississippi Delta did not with-stand drought nearly as well as later strains. This implies that a greaterroot development was associated with the greater vegetation development
554
www.plantphysiol.orgon June 4, 2018 - Published by Downloaded from Copyright © 1952 American Society of Plant Biologists. All rights reserved.
EATON AND ERGLE: COTTON 555
of the less determinant cottons. The tendency in the full load plants to-ward separate grouping of the irrigated and non-irrigated plants shown invegetative characters is not evident in the- scatter diagrams for fiberstrength.
Some features of the foregoing tabulations suggest that the carbohydratesupply of the varieties low in carbohydrates did not restrict their growthand fiber development. Evidence, however, that carbohydrate levels were
FULL - LOAD
110
E zoo
I 90
' 80
70
Ea,
ICD
3.
n
w
I-
z
cn
wCDG.'
8
7
6
5
4
90
85
80
85
80
75
70
2-BOLL
4 5 6
a F -.0
00.
FIG. 1. Five-variety scatter diagrams, 1945. Top: Total carbohydrate against plantheight and stem weight. Bottom: Starch against fiber maturity and strength. Theresults for the full load and two-boll plants are shown separately; those for irrigatedand non-irrigated are combined. Carbohydrate and plant height and weight data arethe means of five samples. Fiber maturity and weight data are the means of threepickings.
www.plantphysiol.orgon June 4, 2018 - Published by Downloaded from Copyright © 1952 American Society of Plant Biologists. All rights reserved.
PLANT PHYSIOLOGY
involved and that these did dampen growth expressions, and probably ws-sened the correlation coefficients, is provided by the ratl er consistent. im-provement in boll and fiber properties in the two-boll compared witlh thefull-load treatments (table II). Since within varieties, growthl and fiberproperties were improved by the greater carbohydrate supply in the two-boll plants, it seemed possible that a variety low in carbohydrates such asRowden or Delta and Pine Land would show greater improvement in thetwo-boll treatment than Stoneville or Triumph. Tabulations prepared toexamine this point failed to support the idea. Instead, the tissues that weremost responsive, and the extent of the response, appeared as further varietalcharacteristics. Delta and Pine Land, a small boll variety, had the secondto lowest hexose and starch; and yet it showed the smallest increases underthe two-boll treatment in height, seed cotton per boll, seed index, lint indexand fiber length. Stoneville, with a high carbohydrate level, showed thegreatest or second greatest response in height, stem weight, seed cotton perboll, lint index, fiber length, and mature fibers but the least response infiber strength. Hi-Bred, a large-boll, small-seed, coarse-fiber, short-staplevariety of intermediate carbohydrate level made the greatest gains of anyin stem weight, seed cotton per boll, seed index, and fiber weight per inch.
Discussion
The two variables used in the foregoing experiments, partial deflorationand limited water supply, were chosen because both would increase carbo-hydrate levels but at the same time with a distinction: Defloration imposesno limitation on carbohydrate use in vegetative expansion and in the re-maining bolls whereas drouth does. In cotton (13), drouth limits growthmore than it does photosynthesis. On the basis of findings with a numberof other plants by other investigators, low nitrogen supply might also havebeen selected as a means of carbohydrate increase through growth limita-tion. For a satisfactory low nitrogen experiment under field conditions, itwould be necessary to select soil that was without other complicating defi-ciencies. Also, under high light intensity (12) an increase in carbohydrateis not always found in cotton when nitrogen is limiting.
Water limitation increased sugar and starch accumulation in the stemsand roots but usually not in the leaves. In contrast to the two-boll treat-ment, drouth decreased growth, boll size, seed index, lint index, fiber length,fiber weight per inch, and fiber maturity. Drouth decreased the percentageof oil in the seed and, in two out of three experiments, the percentage ofNH3 as well. The 1947 experiments with Acala p18 and Stoneville 2B atShafter presented some exceptions. Irrigating on one side of the rows everytwo weeks with no wilting compared with irrigating both sides every weekresulted in 50% reductions in plant growth. The dry treatment reduced thephototropic responses. As viewed toward the late afternoon sun, the leavesof the dry plants were more nearly horizontal and reflected more light tothe eye than did the more heavily irrigated plants. All fiber properties,
-056
www.plantphysiol.orgon June 4, 2018 - Published by Downloaded from Copyright © 1952 American Society of Plant Biologists. All rights reserved.
EATON AND ERGLE: COTTON
otilcr than strength o. Acala fibers, were improved slightly in 1947 by in-sufficient water. These 1947 results with Acala and Stoneville varietiessuggest that. in the absence of wilting, the advantages of the higher carbo-hydrate le-,Tels on boll and fiber development may more than offset the dis-advantages of reduced moisture supply. In bolls of these two varieties, 13days old, the percentage of moisture was reduced 2 and 1% in the drouthtreatment and 1 and 07% in the two-boll treatment. These samples (a totalof 72 bolls for each treatment and variety) were collected during mid-morning and mid-afternoon on six days. The moisture reductions in theyoung bolls were only about half as great in both treatments as those foundin the leaves at the same hours.
The strength of fibers tended to be improved in both the two-boll anddrouth treatments with an increase in concentration of carbohydrate. Sincefiber strength represents a formative effect in the deposition of cellulosewhich is reflected in the x-ray pattern, rather than a growth effect, the fac-tors determining strength may exert their influence along different pathsfrom those influencing the growth of the plant and its bolls and fibers. Thefactorial analyses in table II show that the two-boll treatment resulted insignificant gains in the strength of Stoneville fibers in 1944, the strength offibers of the five varieties in 1945, and a small gain in Stoneville fiberstrength in 1947. Losses in fiber strength in the two-boll treatment werefound in both the 1946 and 1947 experiments with the Acala p18 variety(the 1947 analyses were not factorial). Drouth resulted in large and sig-nificant gains in the fiber strength of Acala p18 in 1946 and Missdel x Acalain 1948; in the remaining drouth tests the changes were mostly upward butlacked statistical significance. Stoneville stems contained only 45% asmuch carbohydrate at Shafter in 1947 as at College Station in 1945. Possi-bly associated with this lower carbohydrate content, the Stoneville fibers inCalifornia had a round-bundle fiber strength of 76 whereas in three trialsin Texas the strength was 88, 88, and 81.
The response of the variety Acala p18, to the two-boll treatment may besomewhat different from that of the other varieties. In support of this idea,it may be noted that in both tests with Acala p18 (in California only) therewas a loss in seed cotton per boll under the two-boll treatment whereas theother varieties showed significant gains (table II). Exclusive of the Acalap18 variety and two additional minor exceptions, there was a positive asso-ciation in the factorial summaries between carbohydrate level and tensilestrength irrespective of whether the gains in carbohydrate resulted from thetwo-boll or drouth treatment.
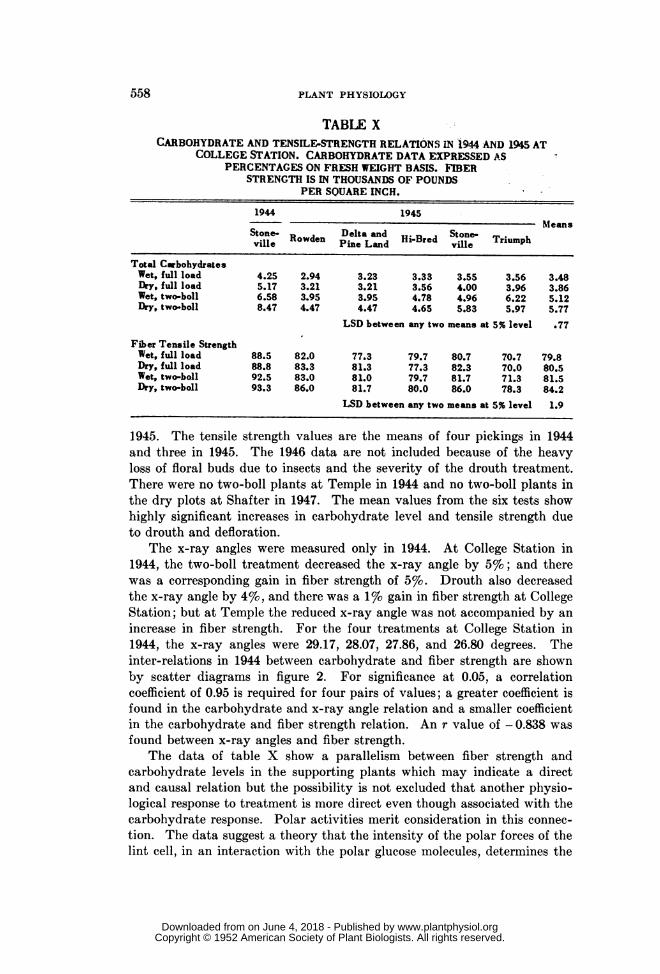
As a means of examining this relationship between carbohydrate contentand fiber strength apart from the averages of the factorial summaries, the1944 and 1945 data are reassembled for more direct examination in table X.In this table, the treatment values for carbohydrates represent the mean ofthe three root-bark collections within a single 24-hour period in 1944 andthe means of the five samples collected from each of the five varieties in
557
www.plantphysiol.orgon June 4, 2018 - Published by Downloaded from Copyright © 1952 American Society of Plant Biologists. All rights reserved.
PLANT PHYSIOLOGY
TABLE XCARBOHYDRATE AND TENSILE-STRENGTH RELATIONS IN 1944 AND 1945 AT
COLLEGE STATION. CARBOHYDRATE DATA EXPRESSED ASPERCENTAGES ON FRESH WEIGHT BASIS. FIBER
STRENGTH IS IN THOUSANDS OF POUNDSPER SQUARE INCH.
1944 1945Means
Stone. Rowden Delta and Hi-Bred Stone- Tiyulle RodnPine Land Ville Trup
Total CarbohydratesWet, full load 4.25 2.94 3.23 3.33 3.55 3.56 3.48Dry, full load 5.17 3.21 3.21 3.56 4.00 3.96 3.86Wet, two-boll 6.58 3.95 3.95 4.78 4.96 6.22 5.12Dry, two-boll 8.47 4.47 4.47 4.65 5.83 5.97 5.77
LSD between any two means at 5% level .77
Fiber Tensile StrengthWet, full load 88.5 82.0 77.3 79.7 80.7 70.7 79.8Dry, full load 88.8 83.3 81.3 77.3 82.3 70.0 80.5Wet, two-boll 92.5 83.0 81.0 79.7 81.7 71.3 81.5Dry, two-boll 93.3 86.0 81.7 80.0 86.0 78.3 84.2
LSD between any two means at 5% level 1.9
1945. The tensile strength values are the means of four pickings in 1944and three in 1945. The 1946 data are not included because of the heavyloss of floral buds due to insects and the severity of the drouth treatment.There were no two-boll plants at Temple in 1944 and no two-boll plants inthe dry plots at Shafter in 1947. The mean values from the six tests showhighly significant increases in carbohydrate level and tensile strength dueto drouth and defloration.
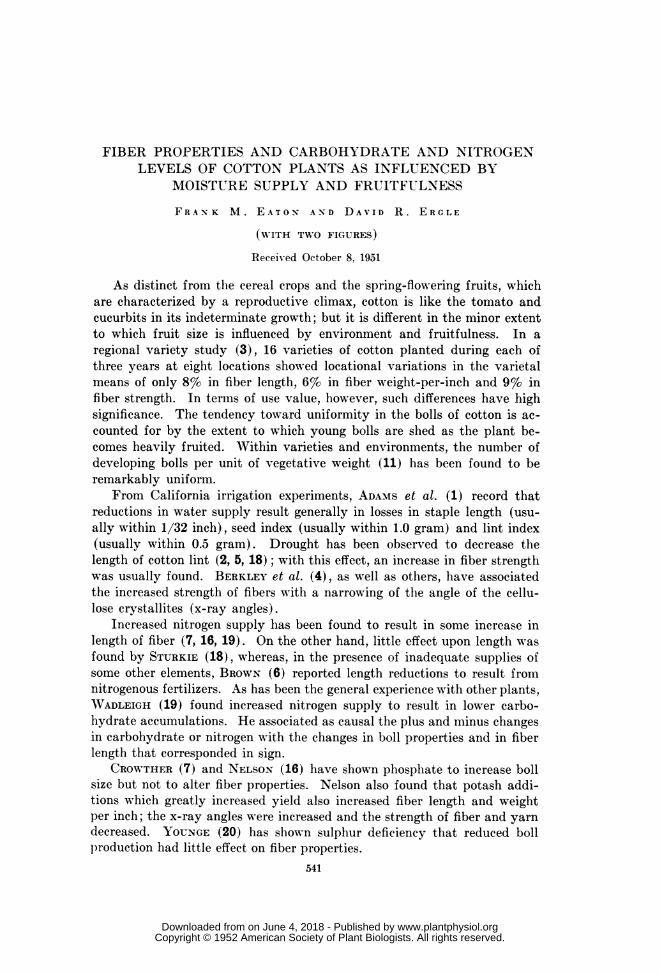
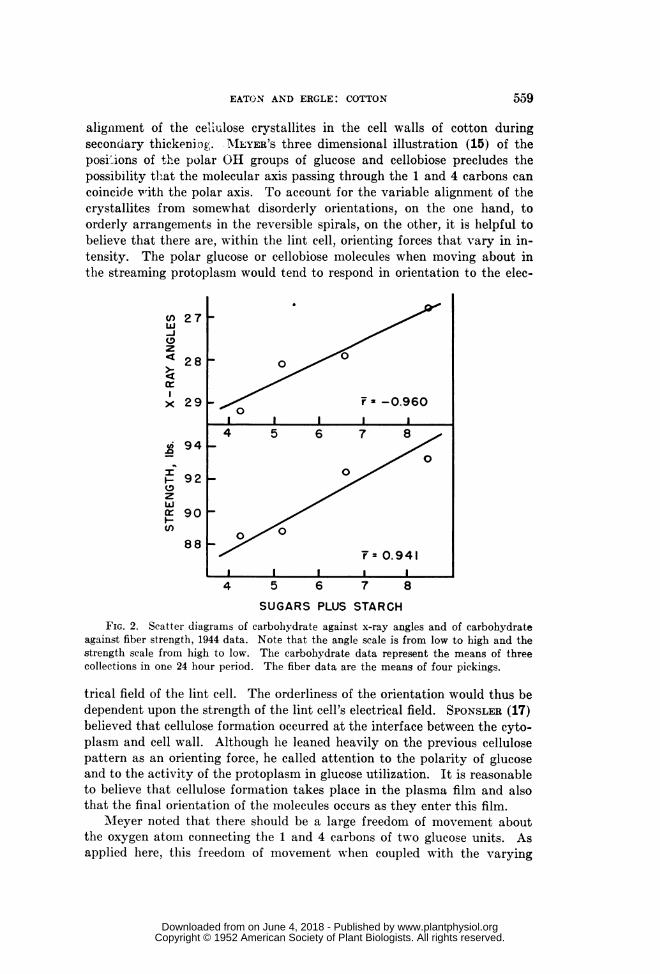
The x-ray angles were measured only in 1944. At College Station in1944, the two-boll treatment decreased the x-ray angle by 5%o; and therewas a corresponding gain in fiber strength of 5%o. Drouth also decreasedthe x-ray angle by 4%o, and there was a 1%o gain in fiber strength at CollegeStation; but at Temple the reduced x-ray angle was not accompanied by anincrease in fiber strength. For the four treatments at College Station in1944, the x-ray angles were 29.17, 28.07, 27.86, and 26.80 degrees. Theinter-relations in 1944 between carbohydrate and fiber strength are shownby scatter diagrams in figure 2. For significance at 0.05, a correlationcoefficient of 0.95 is required for four pairs of values; a greater coefficient isfound in the carbohydrate and x-ray angle relation and a smaller coefficientin the carbohydrate and fiber strength relation. An r value of - 0.838 wasfound between x-ray angles and fiber strength.
The data of table X show a parallelism between fiber strength andcarbohydrate levels in the supporting plants which may indicate a directand causal relation but the possibility is not excluded that another physio-logical response to treatment is more direct even though associated with thecarbohydrate response. Polar activities merit consideration in this connec-tion. The data suggest a theory that the intensity of the polar forces of thelint cell, in an interaction with the polar glucose molecules, determines the
558
www.plantphysiol.orgon June 4, 2018 - Published by Downloaded from Copyright © 1952 American Society of Plant Biologists. All rights reserved.
EATON AND ERGLE: COTTON 559
alignment of the cellXilose crystallites in the cell walls of cotton duringsecondary thickeni.og. MLYER'S three dimensional illustration (15) of theposi ions of thle polar OH groups of glucose and cellobiose precludes thepossibility that the molecular axis passing through the 1 and 4 carbons cancoincide with the polar axis. To account for the variable alignment of thecrystallites from somewhat disorderly orientations, on the one hand, toorderly arrangements in the reversible spirals, on the other, it is helpful tobelieve that there are, within the lint cell, orienting forces that vary in in-tensity. The polar glucose or cellobiose molecules when moving about inthe streaming protoplasm would tend to respond in orientation to the elec-
cn 27w
z28 o
x 29 _ -0.960
4 5 6 7 8(i 94.0
0~~~~~~9 2 °zwc1 90
88r= 0.941
L I II I_
4 5 6 7 8
SUGARS PLUS STARCHFIG. 2. Scatter diagrams of carbohydrate against x-ray angles and of carbohydrate
against fiber strength, 1944 data. Note that the angle scale is from low to high and thestrength scale from high to low. The carbohydrate data represent the means of threecollections in one 24 hour period. The fiber data are the means of four pickings.
trical field of the lint cell. The orderliness of the orientation would thus bedependent upon the strength of the lint cell's electrical field. SPONSLER (17)believed that cellulose formation occurred at the interface between the cyto-plasm and cell wall. Although he leaned heavily on the previous cellulosepattern as an orienting force, he called attention to the polarity of glucoseand to the activity of the protoplasm in glucose utilization. It is reasonableto believe that cellulose formation takes place in the plasma film and alsothat the final orientation of the molecules occurs as they enter this film.
MIeyer noted that there should be a large freedom of movement aboutthe oxygen atom connecting the 1 and 4 carbons of two glucose units. Asapplied here, this freedom of movement when coupled with the varying
www.plantphysiol.orgon June 4, 2018 - Published by Downloaded from Copyright © 1952 American Society of Plant Biologists. All rights reserved.
PLANT PHYSIOLOGY
intensity of metabolic activity provides for variations from hour to hourand day to day in the angle of deposition. Also, a rotation of 1800 aboutthe molecular axis within a chain of glucose molecules would result in achange in the direction of their polar axes with respect to the cell axis, butit would not change the angle of the polar axes with respect of the cell axis.A reversal of direction without change of angle is characteristic of thespirals in the walls of the cotton fiber.
The inter-varietal comparisons of 1945 (tables VII, VIII, IX) are perti-nent to a further discussion of the fiber strength relations. It will be re-called that between varieties the correlations of carbohydrate levels withfiber strength, as well as with plant, seed, and fiber growth, were negativerather than positive. Varieties that were low in carbohydrate, i.e., usedtheir carbohydrates most rapidly, had the greatest strength. And yet withineach of these varieties, fiber strength increased with treatments that in-creased carbohydrate levels. As regards the path of influence on x-rayangles and fiber strength, it is indicated that both the potential of carbo-hydrate supply and rate of its use are involved.
Summary
The effects of restricting the number of bolls per cotton plant to twoand limiting the water supply (on carbohydrate and nitrogen accumulationand on growth and fiber properties) were studied in a series of experimentsat College Station, Texas, and Shafter, California. Both of the treatmentsincreased carbohydrate levels and nitrogen in the plants, but there was thedistinction that partial defloration did not limit the rate of carbohydrateutilization in vegetative growth and in the remaining bolls, whereas drouthdid.
Under the two-boll treatment, increases occurred in plant growth, weightof seed cotton per boll, weight of 100 seeds, lint on 100 seeds, fiber length,fiber weight per inch, and fiber maturity. With extra nitrogen in the seed,protein synthesis proceeded at the expense of oil synthesis. For the mostpart, drouth reduced all of these characters; some exceptions were found,particularly in an experiment with the variety Acala p18, in which waterlimitation reduced plant growth by 50% but caused no wilting. The twotreatments increased carbohydrate levels and usually increased fiber strength.Fiber strength represents a formative effect on the fiber cellulose ratherthan a growth effect. A few measurements indicated an inverse relationbetween carbohydrate and the orientation of the cellulose crystallites withrespect to the fiber axis (x-ray angles).
In an experiment that included five varieties, those varieties showing thegreatest growth and having the greatest fiber strength had the lowest carbo-hydrate levels in the stems. Within the varieties, however, the treatmentsthat increased the carbohydrate levels (two-boll and drouth) also increasedthe fiber strength. The fiber strength was thus improved by the plantenzyme systems favoring rapid carbohydrate utilization and by the treat-ments that increased the carbohydrate supply.
560
www.plantphysiol.orgon June 4, 2018 - Published by Downloaded from Copyright © 1952 American Society of Plant Biologists. All rights reserved.
EATON AND ERGLE: COTTON
The orientation of the polar glucose molecule as it enters the plasmafilmii for polymerization into cellulose is apparently influenced by the in-tensity of the polar forces of the lint cell; and the intensity of this electricalfield evidently varies both with the level of supply and rate of utilization ofcarbohydrate.
Carbohydrate levels were much lower in plants grown in California com-pared with plants in Texas, and fiber strength, length, and weight per inchwere also lower; but in plants grown in California the weight of seed cottonper boll, weight per seed, and lint per seed were higher.
With the exception of the x-ray angles, the measurements of fiber andyarn properties were all made by the Cotton Branch of the Production andAI-arketing Administration. The measurements of x-ray angles and theanalyses of cotton seed were made by the Division of Cotton and OtherFiber Crops and Diseases of the U. S. Department of Agriculture under thesupervision, respectively of E. E. Berkley and W. H. Tharp.
The writers are obligated to C. B. Godbey and J. C. Gaines for adviceon methods of statistical analysis.
DEPARTMENT OF PLANT PHYSIOLOGY AND PATHOLOGYTEXAS AGRICULTURAL EXPERIMENT STATION
COLLEGE STATION, TEXAS
LITERATURE CITED1. ADAMS, F., VEIHMEYER, F. J., and BROWN, L. N. Cotton irrigation
investigations in San Joaquin Valley, California. California Agr.Exp. Bull. 668. 1942.
2. BARKER, H. D. Fiber and spinning properties of cotton, with specialreference to varietal and environmental effects. U. S. Dept. Agr.Tech. Bull. 931. 1946.
3. BARRE, H. W. Better Cottons. Report to congressional subcommitteeby Division of Cotton and Other Fiber Crops and Diseases. U. S.Dept. Agr. 1947.
4. BERKLEY, E. E., WOODYARD, 0. C., BARKER, H. D., and KERR, T. Struc-ture, determined by X-ray, and strength of cotton fiber. U. S.Dept. Agr. Tech. Bull. 949. 1948.
5. BONNE-N, C. A., KILLOUGH, D. T., PFEIFFENBERGER, G. W., PAULSON,W. E., JAYNES, MI. C., and GABBARD, L. P. Gearing Texas cottonto war needs. Texas Agr. Exp. Sta. Bull. 624. 1942.
6. BROWN, A. B. A study of the effect of fertilizers on various charactersof the cotton plant. Louisiana Agr. Exp. Sta. Bull. 406. 1946.
7. CROWTHER, F. Experiments in Egypt on the interaction of factors incrop growth. 7. Influence of manuring on the development ofthe cotton crop. Roy. Agr. Soc. Egypt Tech. Sec. Bull. 31. 1937.
8. EATON, F. 'M. Early defloration as a method of increasing cotton yieldsand the relation of fruitfulness to fiber and boll characters. Jour.Agr. Res. 42: 447-462. 1931.
561
www.plantphysiol.orgon June 4, 2018 - Published by Downloaded from Copyright © 1952 American Society of Plant Biologists. All rights reserved.
PLANT PHYSIOLOGY
9. EATON, F. M. Root development as related to character of growth andfruitfulness of the cotton plant. Jour. .Apr. Res. 43: 875-883.1931.
10. EATON, F. M. Nitrogen content of cotton in relation to other fiberproperties. Textile Res. Jour. 17: 568-575. 1947.
11. EATON, F. M. Physiology of the cotton plant. Adv. Agron. 2: 11-25.1950.
12. EATON, F. M. and RIGLER, N. E. Effect of light intensity, nitrogensupply and fruiting on carbohydrate utilization by the cottonplant. Plant Physiol. 20: 380-411. 1945.
13. EATON, F. M. and ERGLE, R. Carbohydrate accumulation in the cottonplant at low moisture levels. Plant Physiol. 23: 169-187. 1948.
14. ERGLE, D. R. and BLANK, L. M. A chemical study of the myceliumand sclerotia of Phymatotrichum omnivorum. Phytopath. 37:153-161. 1947.
15. MEYER, K. H. Natural and Synthetic High Polymers. IntersciencePublishers, Inc., New York. 1942.
16. NELSON, W. L. The effect of nitrogen, phosphorus, and potash on cer-tain lint and seed properties of cotton. Agron. Jour. 41: 289-293.1949.
17. SPONSLER, 0. L. Mechanism of cell wall formation. Plant Physiol. 4:329-335. 1929.
18. STURKIE, D. G. Effects of some environment factors on the seed andlint of cotton. Alabama Agr. Exp. Sta. Bull. 26. 1947.
19. WADLEIGH, C. H. Growth status of the cotton plant as influenced bythe supply of nitrogen. Arkansas Agr. Exp. Sta. Bull. 446. 1944.
20. YOUNGE, 0. R. Sulfur deficiency and its effect on cotton production onCoastal Plain soils. Proc. Soil Sci. Soc. Amer. 6: 215-218. 1941.
562
www.plantphysiol.orgon June 4, 2018 - Published by Downloaded from Copyright © 1952 American Society of Plant Biologists. All rights reserved.