Embed Size (px)
Citation preview

Two-Photon Microscopy: Imaging in Scattering Samplesand Three-Dimensionally Resolved Flash PhotolysisC. SOELLER AND M. B. CANNELL*Department of Physiology, School of Medicine and Health Sciences, University of Auckland, Auckland, New Zealand
KEY WORDS two-photon; flash photolysis; calcium signaling; confocal microscopy; cardiacmyocytes
ABSTRACT Two-photon molecular excitation microscopy has several advantages over conven-tional confocal fluorescence microscopy, including the ability to section deeper into scatteringsamples and to allow spatially resolved flash photolysis. We describe and examine the benefit ofincorporating non-descanned fluorescence detection in our microscope system. In a scatteringsample where almost no signal could be obtained at a depth of 50 µm with confocal detection,non-descanned detection resulted in an improvement of signal strength by more than an order ofmagnitude at depths .40 µm. The spatio-temporal properties of stationary spot two-photon excitedflash photolysis (TPEFP) in drops of test solutions and cardiac myocytes were also examined. Atinput powers that produce .10% of the maximum rate of DM-nitrophen photolysis, seriousphotodestruction of the reporter fluorochrome (Fluo-3) at the photolysis spot occurred. At powerlevels of ,4 mW for periods ,50 ms, we were able to produce small repeatable calcium releaseevents using DM-nitrophen in cardiac myocytes, which were similar to naturally occurring calciumsparks. The properties of these artifical calcium sparks were very similar to signals obtained fromdrops of test solutions, suggesting that the apparent rate of calcium diffusion in myocytes is similarto the rate of diffusion of Fluo-3 in solution. Using TPEFP, we also examined the ability of acombination of EGTA and a low-affinity calcium indicator to track the time course of calcium release.Although the addition of EGTA improved the temporal fidelity of the rise of the calcium signal, it didnot significantly reduce the spread of the fluorescence signal from the photolysis spot. Microsc. Res.Tech. 47:182–195, 1999. r 1999 Wiley-Liss, Inc.
INTRODUCTIONFluorescence microscopy has become an important
tool for the study of fixed and living biological samplesdue to the wide range of fluorescent probes for structureand function that are commercially available. A majorproblem in conventional fluorescence microscopy ofthick ($1 µm) biological samples is the loss of contrastdue to the significant contribution of fluorescence fromregions above and below the plane of focus. Reception ofthis out-of-focus fluorescence by the detector results ina blurred image and a serious loss of contrast forin-plane structures. This limitation can be overcome byconfocal microscopy, which employs a pinhole in front ofthe detector to significantly reject any out-of-focusfluorescence (Pawley, 1995). Using this approach theresolution of fluorescence imaging approaches diffrac-tion (i.e., sub-micron) limits (Wilson, 1989).
An alternative method for achieving three-dimension-ally resolved fluorescence microscopy uses high-inten-sity laser light to achieve optical sectioning via aprocess called two-photon excitation (Denk et al., 1990).Two-photon excitation of a visible or near UV fluoro-chrome results from the near simultaneous absorptionof two longer wavelength photons to achieve the excitedstate (Goppert-Mayer, 1931). From this state, which isthe same as that achieved by normal excitation, thefluorochrome can decay by emitting a photon (fluores-cence). Since the probability of two-photon excitationdepends on the square of the local light flux (if satura-tion effects are neglected), fluorescence excited by a
tightly focused beam of excitation light of appropriatewavelength is restricted to the immediate vicinity ofthe focal point. As a result, the technique achieves aresolution only slightly worse than confocal microscopy,but does so without the need for a pinhole in front of thedetector (Sheppard and Gu, 1990). Two-photon excita-tion, or more generally multiphoton microscopy(Schrader et al., 1997), has some unique advantages forthe study of biological preparations. Photodamage andphotobleaching are confined to the focal plane decreas-ing total photodamage compared with the situation inconfocal microscopy where photobleaching occursthroughout the thickness of the sample (Cannell andSoeller, 1997; Denk et al., 1990; Jones et al., 1998).Combined with the ability of two-photon excitation toexcite several fluorochromes simultaneously (Xu et al.,1996), two-photon excitation allows quantitative co-localisation studies of fluorescent probes at sub-micronresolution that do not suffer from chromatic aberration(Cannell and Soeller, 1997; Wan et al., 1999). Addition-ally, two-photon excitation allows imaging of UV-excited compounds with near-infrared light using con-
Contract grant sponsor: Wellcome Trust (UK); Contract grant sponsor: Auck-land Medical Research Foundation; Contract grant sponsor: University ofAuckland Research Fund; Contract grant sponsor: Health Research Council(NZ).
*Correspondence to: M.B. Cannell, Department of Physiology, School ofMedicine and Health Sciences, University of Auckland, Private Bag 92019,Auckland, New Zealand. E-mail: [email protected]
Received 28 July 1999; accepted in revised form 30 July 1999
MICROSCOPY RESEARCH AND TECHNIQUE 47:182–195 (1999)
r 1999 WILEY-LISS, INC.

ventional optics resulting in improved image quality(e.g., Jones et al., 1998; Piston et al., 1995) and theincreased penetration of infra-red light allows imagingat greater depths in scattering samples (Centonze andWhite, 1998).
In this paper, we will focus on two properties oftwo-photon excitation that are enabling new types ofbiological experiments that were near impossible withconventional techniques. First, the increased depthpenetration of multiphoton microscopy has opened upthe possibility of imaging in preparations that scatterlight (e.g., Svoboda et al., 1996, 1997) and here wedemonstrate advantages of a non-descanned detectorarrangement under strongly scattering conditions. Sec-ondly, we study two-photon excited flash photolysis(TPEFP) as a tool to probe subcellular signaling inbiological preparations. TPEFP is a unique techniquefor the spatially localised release of biologically activecompounds from inert precursor molecules (‘‘cages’’)within sub-femtoliter volumes. We examine TPEFP ofDM-Nitrophen, a photolabile calcium chelator thatreleases calcium upon photolysis (Ellies-Davies et al.,1996) and demonstrate application of TPEFP to studycalcium signaling in some intact cell preparations. Apreliminary account of some of these results has beenpublished elsewhere (Soeller and Cannell, 1999).
MATERIALS AND METHODSImaging and Flash Photolysis
A schematic of the optical apparatus is shown inFigure 1. A modified Zeiss LSM410 confocal microscope(Zeiss, Oberkochem) was used for imaging and TPEFP.Illumination for two-photon excitation was provided bya tunable, passively modelocked Ti:Sapphire (Ti:S)laser (Mira 900, Coherent, Santa Clara, CA) generatingultra-short (fs) pulses at 76 MHz. The Ti:S laser waspumped by two 5-W solid-state lasers (Verdi, Coherent)that were polarization coupled. For two-photon imag-ing, light from the Ti:S was coupled into one of the inputports of the LSM 410 after passing through a Pockelscell (Conoptics, Danbury, CT) for fast intensity modula-tion and a prism compressor for group velocity disper-sion compensation (Soeller and Cannell, 1996). Fluores-cence was measured with photomultiplier tubes (PMTs)internal to the LSM 410 or with an external PMTmounted on a side port that was added to the LSM 410close to the rear aperture of the microscope objective(for efficient non-descanned detection). Light for conven-tional confocal imaging was supplied by an air-cooledAr1 laser (Uniphase, San Jose, CA) that was coupledinto the LSM 410 via a suitable dichroic mirror. Forstationary spot TPEFP, light from the Ti:S laser wascoupled into the same side port that was also used fornon-descanned detection in other experiments. Fluores-cence changes in response to focal uncaging of DM-Nitrophen were monitored with the 488-nm line of theAr1 laser in confocal mode to allow for measurement ofthe spatio-temporal properties of the indicator signal.When images were acquired in confocal mode, thepinhole was adjusted to a diameter of ,1.2 Airey unitsresulting in a confocal point spread function with a fullwidth at half maximum (FWHM) diameter of 300 nm inplane and 700 nm in the axial direction. In some cases,images were acquired in the line scane mode of the
microscope where one line through the sample wasrepetitively scanned to retain some spatial information(along the scan line) while achieving a ms time resolu-tion (see Cannell et al., 1994, for a detailed descriptionof line scanning). An adjustable lens allowed accurateaxial alignment of the two-photon spot with the confo-cal resolution volume (see Results). A 403 1.2NA waterimmersion objective (Zeiss, Oberkochem, Germany)was used for imaging in the aqueous samples. Excita-tion and emission filters were custom made (Chroma,Brattleboro, NJ) to the authors’ specifications. Theprism compressor was adjusted so that pulse width atthe sample was below 80 fs. For imaging of fluorescein,the Ti:S laser was tuned to 850 nm and averageillumination power at the sample was estimated to be,4 mW. In TPEFP experiments, the laser center wave-length was set at 730 nm, which is close to the observedmaximum of the DM-Nitrophen action cross section(Brown et al., 1999). Illumination power for TPEFPvaried (depending on the experiment) between 8 and150 mW measured at the side port aperture. With athroughput of 36% (this loss arose from the need tooverfill the objective rear aperture), this corresponds topowers between 2.9 and 54 mW at the sample.
SolutionsSolutions for flash photolysis in drops were prepared
in a basic solution containing 140 mM KCl and 20 mMHEPES, pH 7.4. To this basic solution, 2 mM DM-Nitrophen (CalBiochem, Alexandria, Australia) and100 µM of the calcium indicator Fluo-3 (MolecularProbes, Eugene, OR) were added. In some experiments,the basic solution instead contained 2 mM DM-Nitrophen, 2 mM of the calcium chelator EGTA (Sigma,Auckland, NZ), and 1 mM of the low-affinity calciumindicator Fluo-5N (Molecular Probes, Nottingham, UK).Free calcium levels in the solution were set to ,100 nMby adding appropriate amounts of CaCl2. In experimentswith rat cells, 1 mM DM-Nitrophen and 100 µM Fluo-3were added to the pipette solution. In experimentsdesigned to measure the resolution of TPEFP DMNB-caged fluorescein dextran, 70 KDa (Molecular Probes)was embedded in a 15% acrylamide gel matrix to achievean effective cage concentration of ,1 mM (based on aconcentration of 8.5 mol caged fluorescein/mol).
Sample PreparationSmall pieces of cheese (hard cheddar) were immersed
in a solution containing 1 mM of fluorescein for ,1hour. Pieces were then removed from the solution,washed in water, cut, and the freshly cut surface placedon a cover slip in the microscope chamber to provide astrongly scattering fluorescent sample. Enzymaticallydissociated adult rat ventricular myocytes were pre-pared as described elsewhere (Evans and Cannell,1997). Cell suspensions were stored at room tempera-ture until being placed on the stage of the microscope.Cells were voltage clamped in the whole cell patchclamp configuration and indicator and cage introducedthrough the patch pipette.
Data EvaluationImage analysis was performed using custom routines
written in IDL (Research Systems, Boulder, CO) run-ning on Silicon Graphics computers (Mountain View, CA).
183TWO-PHOTON IMAGING AND PHOTOLYSIS

RESULTSPrinciples of Two-Photon Excitation
Figure 2 illustrates the fundamental difference be-tween conventional (one-photon) and two-photon excita-tion. The excited state (S*) is normally reached byabsorbing one photon of appropriate wavelength (Fig.2A). The excited molecule quickly relaxes to the lowestvibrational substate of S* from which it (usually)returns to the ground state by emitting a photon offluorescence. As a general rule, the emitted fluores-
cence has a longer wavelength than the excitation lightdue to the loss of energy associated with the thermalrelaxation (Stokes shift). As shown in Figure 2B, theexcited state can also be reached by the near simulta-neous absorption of two longer wavelength photons.Provided the ground state is not significantly depleted,the probability of molecules being raised to the excitedstate by this process will be proportional to the squareof the excitation intensity. However, unless the localphoton flux is very high, the probability of such a
Fig. 1. Schematic diagram of the combined confocal/two-photonmicroscope. Light for two-photon imaging and TPEFP was supplied bya mode-locked Ti:Sapphire laser (Ti:S) that was pumped by twopolarization coupled solid state 532-nm cw lasers. After passingthrough a Pockels cell for fast electro-optical intensity modulation anda prism compressor for group velocity dispersion (GVD) compensation,the pulse train from the Ti:S laser was coupled into the scanner of amodified LSM 410 confocal microscope through appropriate beamcombining dichroic mirrors. For conventional confocal imaging, lightfrom an air-cooled Argon ion laser was coupled into the beam path of
the Ti:S laser with a dicroic mirror. In some experiments that used astationary photolysis spot, the beam from the Ti:S laser was steeredalong the non-scanned illumination path to bypass the scanner opticsand coupled into a side port close to the rear aperture of the objective.An adjustable lens in the non-scanned beam path allowed accurateaxial alignment of the two-photon photolysis spot with the confocalresolution volume. In experiments to study non-descanned detection,a photomultiplier tube (PMT) was located at the side port and the rearaperture imaged onto its photocathode.
184 C. SOELLER AND M.B. CANNELL

Fig. 2.
185TWO-PHOTON IMAGING AND PHOTOLYSIS

two-photon transition will be very low. The need toachieve high photon fluxes while also minimizing totallight flux (to minimize cell damage) can be met by usinga train of brief, intense light pulses such as from a modelocked Ti:Sapphire laser that can produces pulsesshorter than 100 fs at a repetition rate of ,75 MHz.With such a light source, the probability of two-photonexcitation is increased by the ratio of the interpulsetime interval to the pulse duration (,105) compared toa continuous wave source (of the same mean intensity).As a result, the peak power during the pulse can be veryhigh (1–10 kW) while the average power is sufficientlylow to be tolerated by living cells.
When light from such a laser is focused into afluorescent sample, local excitation intensity increasesas the focal point is approached. At the focal point, thelocal light intensity and the probability for two-photonexcitation is highest (see Fig. 2C) and the probabilityfor two-photon excitation declines rapidly with thefourth power of distance from the focal point. This isquite different from one-photon excitation where totalfluorescence is constant in the axial direction (Fig. 2C).Figure 2D and E directly demonstrate this fundamen-tal difference in a bath of fluorescein solution. Whereaswith conventional illumination, excitation occursthroughout the sample (Fig. 2D), with two-photonillumination excitation is restricted to the vicinity ofthe focal point (Fig. 2E).
Imaging in Scattering PreparationsIn a scattering sample, fluorescence photons emitted
at the focal point may be deviated or scattered fromtheir normal path to the detector by optical discontinui-ties in the sample. This problem is illustrated in Figure3, which also shows how it can be reduced by differentimaging modalities. In the conventional confocal mode,the signal is reduced as scattered photons are blockedby the pinhole, even though they originated at the focalpoint. Note that, although the pinhole can be fullyopened when using two-photon excitation, even a smallangular deflection of the emitted light may lead toscattered photons being blocked by internal aperturesand fail to reach the de-scanned detector because of therelatively long optical path. In two-photon microscopy,the emitted light only originates in the focal volume(Fig. 2E) and so does not have to be imaged onto apinhole. Therefore, a non-descanned detector can beplaced near the objective to collect most of the fluores-cence from the sample that entered the objective. (Inpractice, it is still necessary to place some intermediateoptics to image the rear aperture of the microscope
objective onto the active detector area, but such lensescan have a high acceptance angle if near the objective.)This optical arrangement ensures that virtually all thefluorescence that enters the objective lens reaches thedetector.
The difference in collection efficiency for these threedifferent imaging modes is demonstrated in Figure 4 bymeasurements of the recorded fluorescence intensitywith depth into a scattering sample (cheese stainedwith fluorescein). Figure 4A shows that the signaldeteriorated most quickly in the confocal mode, decreas-ing to less than 10% in 30 µm and was essentiallyundetectable by 50 µm. By comparison, when thepinhole was fully opened the 10% point occurred at adepth of 40 µm. Using non-descanned detection, thesignal falls approximately exponentially within theplotted range and is still stronger than 10% of themaximum signal at a depth of 50 µm. Therefore, for thissample, non-descanned detection results in an improve-ment in signal strength by over an order of magnitudeat depths .40 µm. Sample images recorded from aplane 25 µm from the cover slip using the sameexcitation power in all three imaging modes are shownin Figure 4B, which illustrates the superior signal-to-noise ratio in the image recorded with the non-descanned detector.
Two-Photon Excited Flash PhotolysisFigure 5A shows the distribution of immobilized
fluorescein that was uncaged by a brief flash of IR light.The immobilized fluorescein was imaged in confocalmode using 488 nm argon light. Taking the blurringdue to the confocal imaging process into account, a fullwidth at half maximum (FWHM) diameter of 0.5 µm inplane (x-y) and of 1.4 µm in the axial direction (z) wasmeasured. These dimensions are a direct measure ofthe size of the photolysis spot achieved in our experi-ments. The size of the photolysis spot is somewhatlarger than would be expected from the diffraction limitset by the 1.2NA objective lens. This difference can beexplained by the fact that the rear aperture of theobjective was not adequately overfilled by the photoly-sis beam, a condition chosen to maximize power through-put to the sample.
Interpretation of fluorescence responses to TPEFPrequires that the confocal monitoring volume and thephotolysis spot accurately overlap. Figure 5B shows thesuperimposed signals recorded from a 0.5-µm fluores-
Fig. 2. Principles of one- and two-photon excitation. A: Jablonskidiagram for one-photon excitation of a fluorochrome. Note that theenergy loss associated with thermal relaxation from the excited state(S*) results in the emitted photon having a longer wavelength than theexciting photon (Stokes law of fluorescence). B: Near simultaneousabsorption of two long wavelength photons can achieve the excitedstate. K is a virtual state that is only permitted for very short timesand not an allowed energy level. Note that after achieving S*, theprocess leading to fluorescence is the same as for 1-photon excitation.C: Illumination from an objective coupled with the non-linear depen-dence for two-photon excitation can lead to spatially resolved excita-tion. The region of highest illumination intensity occurs at the waist ofthe excitation cone. The shape of this waist is determined by the
numerical aperture of the (diffraction limited) objective lens. As shownby the graph, the total fluorescence as a function of depth is propor-tional to the local fluorescence intensity times the area that isfluorescing. For fluorochromes that are not saturated, the localintensity will be proportional to 1/arean , where n is the number ofphotons needed to achieve the excited state. Thus for one-photonexcitation, total fluorescence is constant with depth whereas fortwo-photon excitation total fluorescence decays rapidly with increas-ing distance from the focal point. D,E: Fluorescence emission in asolution of fluorescein. With one-photon excitation, the cone of excita-tion leads to fluorescence emission throughout the depth of thesample. Using the same objective lens, two-photon excitation can beseen to be highly localised.
186 C. SOELLER AND M.B. CANNELL

Fig. 3. Principles of descanned and non-descanned detection. Notethat rays emitted at the focal point pass through the pinhole apertureof the confocal detector (solid rays) unless their path is altered byoptical discontinuities (dotted rays). If the dichroic mirror (DM) isplaced close to the rear aperture of the objective and a detector is
arranged to collect all the fluorescence passing through the rearaperture, scattered rays are still accepted. Note that the increaseddistance for the detector in the descanned system results in such raysmissing the detector even if the pinhole is opened.

Fig. 4. Imaging in a strongly scattering sample. A: Focussingdepth dependence of detected fluorescence for three imaging modali-ties using two-photon excitation. In confocal mode (2p confocal), thepinhole in front of the detector was adjusted to a diameter of 1.2 Aireyunits and almost no signal was detected at a depth of ,50 µm.Opening the pinhole (descanned detection) resulted in a clear improve-ment in detection efficiency. A further improvement was obtained by
bypassing the scanning system (non-descanned detection). This im-provement was depth dependent, showing that it was not solely due tothe increased optical simplicity of this detector arrangement (note thelogarithmic scale). B: Sample images at a depth of 25 µm. The relativeimage quality decreased with signal strength, and in 2p-confocal modethe photon noise obscured almost all image detail.
188 C. SOELLER AND M.B. CANNELL

cent latex bead as it was scanned in the axial directionby both the two-photon photolysis beam and the 488-nmprobe beam (used in confocal mode). These data showthat the 488-nm probe beam and the IR uncaging beamhave excellent overlap (to better than ,20 nm), indicat-ing that in our system the axial chromatic aberrationassociated with the different excitation beam wave-lengths was fully corrected.
Figure 6A shows the steady-state Fluo-3 fluorescencepattern recorded during continuous stationary spotTPEFP of DM-Nitrophen. The central dark spot wasdue to Fluo-3 being photo-bleached at the site ofphotolysis while the elevated fluorescence at other sitesarose from the photo-release of calcium, which thenbinds to Fluo-3 and diffuses (in free and bound forms).The extent of photobleaching at the photolysis spot canbe more clearly seen on the line profile through thecenter of the distribution in Figure 6B. (Note that thecentral photobleaching ‘‘hole’’ serves as a sensitivemarker of the lateral position of the photolysis spot.)
Figure 6C shows line scan fluorescence images result-ing from 10-ms flashes of various intensities (decreas-ing from left to right). The central photobleaching areais visible in the two images where higher uncagingpowers were used (54 and 18 mW) while it is absent inthe line scan image at an uncaging power of 8 mW (2.9mW at the sample). These images show that the spatialextent of the region of increased fluorescence is largerthan the size of the photolysis spot. This is confirmed ina plot of fluorescence profiles in Figure 6D. The timecourse of fluorescence at the center of the photolysisspot shows that fluorescence increases to the maximalvalue only after the uncaging flash terminated as freshindicator diffused into the photobleached region (Fig.6E). Figure 6F shows the rate of change of totalfluorescence (FT ) as a function of input power esti-mated from line scan images. FT was calculated fromthe profile along the scan line with the assumption ofspherical symmetry. The rate of change of FT increaseswith photolysis intensity, but the curvature of the
Fig. 6. TPEFP of DM-Nitrophen in test solutions. Ca release byTPEFP from the photolabile Ca chelator DM-Nitrophen was moni-tored by imaging Fluo-3 fluorescence. A: Pattern of fluorescence atsteady state (with continuous photo-release triggered by the focusedIR beam). Note the central ‘‘hole’’ of decreased fluorescence due tophoto-bleaching of Fluo-3 at the site of photolysis. B: Fluorescenceintensity along a line passing through the center of the photolysis spot.C: Line scan images of the spatio-temporal changes in Fluo-3 fluores-cence at three excitation powers. Note the presence of a centralphotobleached area for the two higher uncaging powers. D: Lineprofiles of fluorescence at the end of the photolysis period. As powerwas increased, the width of the profile increased while the fluorescenceat the center decreased. E: Photobleaching causes a reduction influorescence emission during the pulse and a ‘‘rebound’’ increase in
fluorescence after the pulse terminated. Note that such an effect couldeasily be misinterpreted as some active biological process if it wereobserved in intact cells. At low powers photobleaching does notproduce this effect. F: Power dependence of the photolysis rate. Theflux during photorelease was estimated by measuring the rate of riseof the spatially integrated Fluo-3 fluorescence. It is apparent that anapproximate square dependence (as expected for a two-photon pro-cess) was measured for the lowest excitation powers. G: Characterizesthe diffusion of Fluo-3-calcium from the photolysis spot. The curve at 8mW is as expected for simple diffusion from a diffraction limitedsource. As release terminates, the rapid decline in concentration at thecenter leads to an increase in FWHM. At higher powers, the photo-bleaching at the center prevents this effect.
Fig. 5. TPEFP resolution and alignment. The spatial resolution ofTPEFP was measured by releasing caged fluorescein dextran that wasimmobilised in a polyacrylamide gel (A). Taking the optical blurring ofthe imaging system into account, an x-y FWHM of 0.5 and z FWHM of1.4 µm were determined. For correct interpretation of TPEFP experi-ments, accurate axial alignment between photolysis spot (illuminationfrom the Ti:S laser) and the imaging plane (illumination from Ar-Ion
laser) is required. To achieve this, an adjustable correction lens wasinserted into the path of the IR beam (see Fig. 1) to compensate forchromatic aberration while ensuring that the rear aperture of theobjective lens was filled. Axial alignment was verified by imagingthrough a 0.5-µm diameter fluorescent latex bead. B: Excellentoverlap of the intensity profiles from imaging with the Ar-Ion (green)and Ti:S laser (red) to better than 20 nm.
189TWO-PHOTON IMAGING AND PHOTOLYSIS
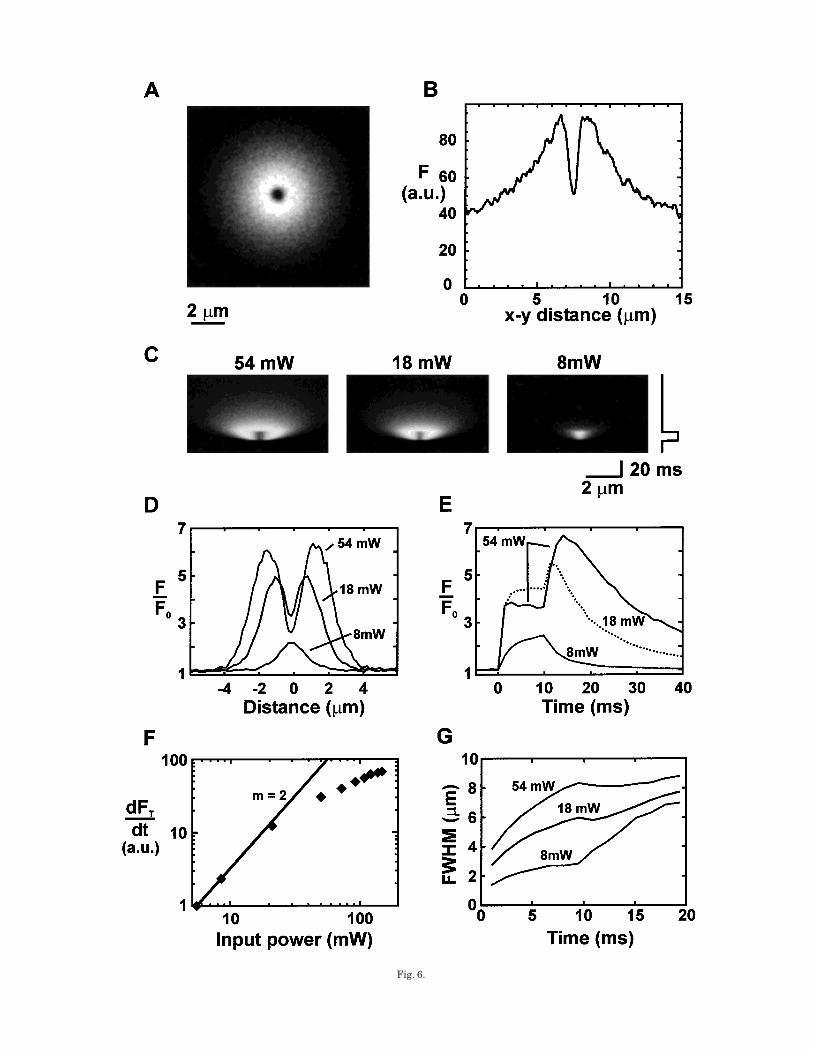
Fig. 6.

relationship suggests that the rate of calcium release isstarting to saturate at high powers. At lower powers,the rate of calcium release scales with the second powerof the flash intensity as expected for a two-photonprocess far from saturation. The spatial extent of thefluorescence signal in response to 10-ms flashes ofdifferent intensities is summarized in Figure 6G. Asalready described, the FWHM extent of the flash re-sponse is significantly wider than the diameter of therelease region and increases with time.
Figure 7 illustrates the spatio-temporal properties ofthe fluorescence response to the same photolysis pulsein two solutions with different indicator and bufferingproperties. Figure 7A shows two line scan imagesrecorded in response to a 10-ms lasting flash at 10 mW.The first solution contained a mixture of the slowcalcium chelator EGTA, the low affinity indicator Fluo-5N, and calcium cage while the second solution con-tained only the indicator Fluo-3 and calcium cage. It isapparent that the fluorescence change has a differenttime course in both cases. This is seen more clearly inFigure 7B. The Fluo-5N signal in the presence of EGTAhas a faster rising phase and tracks the flash timecourse more accurately than the Fluo-3 signal. Therising phase of the signal was essentially complete in 3ms, and this limited temporal resolution may still limitresolution of fast calcium release events in biologicalexperiments. In both cases, the decay of fluorescencewas considerably delayed with respect to the termina-tion of the photolysis flash. The time constant of thedecay of the Fluo-5N signal was approximately 4 mswhile that of the Fluo-3 signal was about 8 ms. Thespatial extent of the fluorescence signal also dependedon the photolysis solution; the Fluo-5N fluorescenceprofile FWHM was slightly larger than that of theFluo-3 signal (Fig. 7C). Since any saturation effects inthe indicator signal should increase the FWHM, theincreased width of the Fluo-5N must be due to theeffects of EGTA, which must diffuse more rapidly thanthe Fluo-5N to increase the FWHM. These data directlydemonstrate that the addition of a calcium chelator(EGTA) helps improve determination of the time courseof calcium release (Pape et al., 1995; Song et al., 1998).However, the addition of EGTA does not restrict thespatial spread of calcium so the recorded signal does notindicate the spatial extent of the release site.
Figure 8 shows two applications of stationary spotTPEFP in intact cells. In Figure 8A, a line scan imagethrough an intact ventricular myocyte is shown inwhich calcium has been released by TPEFP using aflash of 20-ms duration. The amplitude and time courseof the fluorescence transient (Fig. 8B) is similar to thatcaused by spontaneous microscopic calcium releaseevents from intracellular calcium stores in heart musclecalled ‘‘calcium sparks’’ (Cheng et al., 1993). The spatialspread (Fig. 8C) is again wider than the photolysis spotin the sample with initial FWHM diameter being ,2µm increasing to a diameter of ,4 µm at the end ofphoto-release period. The spatio-temporal properties ofthis ‘‘artificial’’ calcium spark are almost identical tonaturally occurring calcium sparks and, remarkably,also very similar to the time course of indicator signalsin drops of test solutions. This result demonstrates thatthe spatio-temporal properties of the fluorescence sparkis almost entirely dominated by the properties of the
indicator and diffusion rather than active cellular pro-cesses.
DISCUSSIONIn this paper, we have demonstrated some of the
unique advantages of two-photon excitation for experi-ments involving the use of fluorescent indicators andthe ability of this method to achieve photolysis of cagedcompounds at defined points in solutions. For mostfluorescent probes in current use, two-photon excita-tion is achieved in the near infra-red region of thespectrum which can be covered by Ti:Sapphire lasers.These lasers, although expensive, are relatively simpleto operate and present no major challenges in their use.In our experience, to achieve the full tuning range inour laser (680–1,060 nm) requires more power than canbe supplied by a single 5-W solid state pump laser andwe currently add extra power from a second pump laser.However, we do not consider this arrangement to beideal, an 8–10-W solid state pump laser would be moresuitable.
Imaging in Scattering SamplesThe data presented here show that the addition of a
non-descanned detector can allow a large improvementin the signal obtained from within scattering samples.Although the relative improvement depends on thenature of the scattering sample and the imaging depth,we have demonstrated improvements of over an orderof magnitude using this method. Most of this improve-ment resides in the ability to collect scattered photonsand, in fact, light could be collected in any directionfrom the specimen to further increase the collectionefficiency, i.e., it is not necessary to use the objectivelens. The only caveat to this principle is if the specimenhas significant absorption for the fluorescence emis-sion, then photon emission from the sides and top of thespecimen may be lost, in which case the objective mayprovide the best ‘‘window’’ for light collection. Anothersource of signal improvement with non-descanned detec-tion arises from the simplicity of the optical system.The optical trains in many commercial confocal micro-scopes are highly folded by mirrors and these mirrorsare not needed in the non-descanned detector arrange-ment. In our experience, most aluminium mirrorsdegrade with age (even when overcoated) and theirreflectivity may decline from about 98 to 90% over thecourse of a year or so. This would lead to about a 50%reduction in signal after 6 reflections.
Although not directly examined here, an additionaladvantage of two-photon excitation arises from thelonger excitation wavelength, which improves penetra-tion of the exciting light into the sample. This effectarises primarily from the wavelength dependence ofscattering (Centonze and White, 1998) but the shortduration of the pulse may also contribute. A 100 fs pulseis ,23 µm long in water so photons that are scatteredmay not be able to contribute to the dimensions of theexcitation volume (due to the non-linear power depen-dence of excitation). This property has been examinedby Szmacinski et al. (1998) who described the ‘‘ballistic’’nature of the exciting photon pulse, which can allowspatially restricted excitation deep inside scatteringsamples. However, this effect would be smaller for theshort working distance high numerical apertures used
191TWO-PHOTON IMAGING AND PHOTOLYSIS

Fig. 7. TPEFP of DM-Nitrophen in different buffer solutions. A:Line scan images for two calcium indicators. The low-affinity calciumindicator Fluo-5N was combined with EGTA to simulate conditionsthat should track the rate of photolytic calcium release (Song et al.,1998). B: Neither Fluo-3 nor Fluo-5N1EGTA track the time course
accurately but the speed of response to the rising edge of the pulse isincreased by the Fluo-5N1EGTA mixture. C: Spread of the fluores-cence signal as a function of time. It is clear that both indicatorsystems are similar and it is notable that the Fluo-5N1EGTA mixturedoes not improve the spatial resolution of the photolysis region.
192 C. SOELLER AND M.B. CANNELL

here where the pulse length represents ,10% of thenon-scattered working distance.
Two-Photon Excited Flash PhotolysisConventional illumination of fluorochromes results
in excitation throughout the depth of the specimen andgives no axial resolution for photolysis experiments(Wang and Augustine, 1995). Therefore, the ability oftwo-photon excitation to cause excitation in a three-dimensionally resolved volume is an important ad-vance for experiments involving flash photolysis. Theonly other method that achieves a spatially localizedphotorelease is the dual photon method (Pettit et al.,1997) where a ‘‘double’’ cage is employed whose photoly-sis requires the absorption of two photons. However,this novel approach suffers from two main disadvan-tages: (1) The method requires special caged com-pounds that are not readily available; (2) The spatialresolution is much worse than for TPEFP. The latter isdue to the probability of breaking both cages not scaling
with the square of the light intensity because they donot need to be broken simultaneously.
TPEFP allows the experimenter to examine both thetime course of biological responses as well as thelocalization of the transduction system. For exampleTPEFP of caged neurotransmitters has been used tomap receptor densities on intact neurons (Denk, 1994;Furuta et al., 1999). Within cells, calcium regulates avariety of processes at cellular and sub-cellular levels(Clapham, 1995) and TPEFP of caged calcium insidecardiac cells has recently been demonstrated (Lipp andNiggli, 1998). In the experiments reported here, wehave characterized the energy dependence of TPEFP aswell as showing a method for directly measuring thesize of the photolysis spot. We find that photobleachingof the indicator at the site of photolysis becomes signifi-cant at moderate excitation intensities. While thiseffect can confirm that the illumination system isproperly aligned, it may also introduce a problem forinterpretation of the time course of photorelease. Fig-
Fig. 8. Photorelease of Ca by TPEFP in cardiac myocytes. A: Linescan image of Fluo-3 fluorescence resulting from a 20-ms TPEFP pulsein an isolated rat ventricular myocyte. Note the similar spatio-temporal pattern to that observed in droplets of pipette solution
(compare Fig. 7). The plots show time courses of fluorescence intensity(B) and FWHM (C). The photolysis excitation light was centered at awavelength of 730 nm and power at the sample was ,4 mW.
193TWO-PHOTON IMAGING AND PHOTOLYSIS

ure 6F suggests that the maximum rate of photolysisshould be attained at input powers approaching 200mW, which would equate to ,72 mW at the sample.This figure is in good agreement with calculations byBrown et al. (1999) of the power needed to completelyphotolyse DM-nitrophen (74 mW). At lower powers,photolysis of the indicator became less of a problem butthe amount of cage broken was also reduced. Figure 6Fsuggests that at input powers of 10 mW (,3.6 mW atthe sample) the rate of photolysis was ,5% of thatobserved at higher powers. As a first order approxima-tion, we can ignore the transport properties of the cageand assume that the rate of photolysis was constantduring the pulse. With these simplifying assumptions,the above rate of cage photolysis suggests that ,5% ofthe cage molecules present in the focal volume can bebroken at an input power of 4 mW. This figure providesa useful benchmark for photolysis experiments withDM-type cages. For example, to achieve the release of100 µM calcium in the focal volume, about 2 mMDM-nitrophen will be needed inside the cell. To achievethis, ,4 mW at the sample will be needed, so the lasersystem must provide . 100 mW to correctly fill the rearaperture to achieve the necessary energy density in adiffraction limited photolysis volume. (This power fig-ure is a lower limit on what is needed as it ignores otherlosses in the system.).
It is our impression that cell damage starts to becomeapparent as soon as the laser power is raised to thepoint where photobleaching of indicators such as fluo-rescein and Fluo-3 can be seen. Nevertheless, we havebeen able to produce small calcium release signalsinside cells lasting between 10 and 50 ms withoutobvious cell damage. The calcium signals producedwere comparable in amplitude to the naturally occur-ring ‘‘calcium sparks’’ seen in cardiac cells (Cheng et al.,1993). Lipp and Niggli (1998) were also able to producespark sized events using 1 mM DM-nitrophen at pow-ers estimated to be somewhere between 4 and 20 mW atthe sample for 50– 200 ms. Despite the promise of suchpreliminary experiments, we would urge caution indesigning/interpreting such experiments as we cannotrule out the possibility of cell damage occurring, espe-cially in response to power levels above ,4 mW for .10ms. The situation would be further confounded if theexact position of the photolysis spot is unknown, sincethe effects of local (and unobserved) damage mayrelease calcium from membrane-bound stores such asmitochondria and the endoplasmic/sarcoplasmic reticu-lum (or some other factors). It may be difficult to designappropriate control experiments to rule out the possibil-ity of such damage effects. For example, the usualmaneuver employed to demonstrate calcium release isto simply remove all calcium or pharmacologicallydischarge calcium stores. However, such control experi-ments would also prevent the photolysis pulse directlycausing calcium release. Nevertheless, for the calciumrelease event shown in Figure 8A, the response washighly reproducible (i.e., for more than 20 flashes),which raises our confidence that the damage thresholdhad not been exceeded.
Our reservations about the possibility of cell damageat the powers needed to produce useful calcium triggersin cells could be removed by the development of moreefficient cages for two-photon excitation. Some progress
in this direction has been made by the development ofAzid-1 (Adams et al., 1997) whose two-photon cross-section is about two orders of magnitude larger thanDM-nitrophen, (Brown et al., 1999) implying that theinput power requirement should be reduced by a factorof 10. Unfortunately, Azid-1 has a lower calcium affin-ity, which will result in a significant increase in buffer-ing power and reduce the amplitude of a TPEFPcalcium signal that can be produced for the same inputpower. The Azid-1 calcium pulse produced by TPEFPwill also be shorter than that produced by DM-nitrophen, a possibly beneficial effect produced by theunbound fraction of Azid- molecules (see Brown et al.,1999, for calculations). Despite these problems, thedevelopment of such compounds offers great promisefor extending the utility of TPEFP in the future, andnew cages are currently being developed (Furuta et al.,1999).
Measuring the Time Course of Calcium ReleaseIt has been suggested that the combination of EGTA
with a low-affinity calcium indicator (Fluo-5N) mayprovide a direct measure of the rate of calcium releaseinside cells (Song et al., 1998) and we have been able todirectly test this idea using TPEFP. As shown in Figure7, this expectation is only partly met. Although theaddition of EGTA makes the fluorescence signal closerto the time course of the photolysis pulse, the pulsewaveform is clearly distorted by the kinetics of theindicator and EGTA calcium binding. This effect wasnot removed by using a lower affinity (faster) indicator.In addition, the spatial extent of the fluorescence signalwas much larger than the photolysis volume and hardlyaltered by the addition of EGTA (compare Figs. 6G and7C). There was also no difference between the spatialsize of the signal reported by either indicator in thepresence of EGTA between indicators either. This effectcan be explained by the fact that EGTA diffuses and sodoes not inhibit the movement of calcium from thephotolysis spot. It follows that to measure both thespatial and temporal properties of calcium release, amixture of fixed and mobile buffers with fast kineticsmay be needed. Although the ability to restrict calciumchanges to the calcium release site will be bufferconcentration dependent, simply increasing the effec-tive local buffer concentration may not help as this willalso reduce the amplitude of the recorded signal. Tocorrectly interpret the time course of calcium releasewith such methods will require more complete knowl-edge of the transport and buffering reaction present inthe system of interest as well as detailed computermodeling to interpret the resulting signals.
TPEFP and Calcium SparksSince the calcium spark produced by TPEFP in cells
was very similar to that occurring naturally, we antici-pate that TPEFP may be a useful tool to help under-stand the processes that shape the spatio-temporalevolution of the spark. Since the time course of calciumrelease and its spatial extent are known during TPEFP,deconvolution methods (e.g., Blatter et al., 1997; Luky-anenko et al., 1998) that seek to extract the time courseof calcium release during the spark can be directlytested with this method. In addition, calcium sparks
194 C. SOELLER AND M.B. CANNELL

produced by TPEFP can be produced at will to allowsignal averaging.
Current computer models do not correctly predict thespatial extent of calcium sparks (see Cannell andSoeller, 1999), which suggests that our understandingof the processes that are involved in the movement ofcalcium within cells is far from complete. It is, there-fore, interesting that the artificial calcium sparks pro-duced by TPEFP have almost the same spatial dimen-sions as those produced in our test solutions. Thisresult immediately suggests that the apparent diffu-sion coefficient for calcium in cardiac cells must becomparable to that of calcium in our test solution thatdid not include any immobile buffers. This raises aparadox, since the apparent diffusion coefficient of aligand should be reduced by the factor 1/(R11) where Ris the ratio [Bound]/[Free] (Crank, 1975) and this ratiois generally considered to be about 100 for calciuminside cells. This apparent paradox may be explainedby the presence of intrinsic buffers that diffuse quiterapidly and thereby transport calcium before it binds toimmobile buffers. The acceleration of calcium transportby this mechanism is further improved if the mobilecalcium buffer has faster kinetics than the immobilebuffer. In connection with this point, Baylor and Holling-worth (1998) have proposed that ATP may transportcalcium and help speed its diffusion. However, whetherATP alone can provide sufficient ‘‘shuttle’’ capacity toovercome the slowing due to fixed buffer sites remainsto be explored.
In conclusion, two-photon microscopy promises to bea powerful new tool for fluorescence imaging and flashphotolysis experiments. Although this new methodol-ogy suffers from the relatively poor excitation efficiencyof current fluorescent probes, as new probes are devel-oped multi-photon techniques should become even moreuseful (as the excitation powers should be reduced tothe point where cell damage is no longer a cause forconcern). Nevertheless, our data emphasizes the pointthat even something as fundamental as calcium diffu-sion within a cell is poorly understood. TPEFP allowsthe experimenter to generate known stimuli withinmicro volumes within the cell that should thereby helpunravel the complexities of cell signaling. The chal-lenge for the future is to correctly interpret suchspatially and temporally resolved indicator signals.
REFERENCESAdams SR, Lev-Ram Y, Tsien RY. 1997. A new caged Ca21 azid-1 is far
more photosensitive than nitrobenzyl-based chelators. Chem Biol4:867–878.
Baylor SM, Hollingworth S. 1998. Model of sarcomeric Ca21 move-ments, including ATP Ca21 binding and diffusion, during activationof frog skeletal muscle. J Gen Physiol 112:297–316.
Blatter LA, Huser J, Rios E. 1997. Sarcoplasmic reticulum Ca21
release flux underlying Ca21 sparks in cardiac muscle. Proc NatlAcad Sci USA 94:4176–4181.
Brown EB, Shear JB, Adams SR, Tsien RY, Webb WW. 1999. Photoly-sis of caged calcium in femtoliter volumes using two-photon excita-tion. Biophys J 76:489–499.
Cannell MB, Soeller C. 1997. High resolution imaging using confocaland two-photon molecular excitation microscopy. Proc R Microsc Soc32:3–8.
Cannell MB, Soeller C. 1999. Mechanisms underlying calcium sparksin cardiac muscle. J Gen Physiol 113:373–376.
Cannell MB, Cheng H, Lederer WJ. 1994. Spatial non-uniformities in[Ca21]i during excitation contraction coupling in cardiac myocytes.Biophys J 67:1942–1956.
Centonze VE, White JG. 1998. Multiphoton excitation provides optical
sections from deeper within scattering specimens than confocalimaging. Biophys J 75:2015–2024.
Cheng H, Lederer WJ, Cannell MB. 1993. Calcium sparks: Elemen-tary events underlying excitation-contraction coupling in heartmuscle. Science 262:740–744.
Clapham DE. 1995. Calcium signaling. Cell 80:259–268.Crank J. 1975. Diffusion and chemical reaction. In: The mathematics
of diffusion. Oxford: Oxford University Press. p 326–351.Denk W. 1994. Two-photon scanning photochemical microscopy: Map-
ping ligand-gated ion channel distributions. Proc Natl Acad Sci91:6629–6633.
Denk W, Strickler JH, Webb WW. 1990. Two-photon laser scanningfluorescence microscopy. Science 248:73–76.
Ellies Davies GCR, Kaplan JH, Barsotti RJ. 1996. Laser photolysis ofcaged calcium: rates of calcium release by nitrophenyl-EGTA andDM-Nitrophen. Biophys J 70:1006–1016.
Evans M, Cannell MB. 1997. The role of L-type Ca21 current and Na1
current-stimulated Na/Ca exchange in triggering SR calcium re-lease in guinea-pig cardiac ventricular myocytes. Cardiovasc Res35:294–302.
Furuta T, Wang SS, Dantzker JL, Dore TM, Bybee WJ, Callaway EM,Denk W, Tsien RY. 1999. Brominated 7-hydroxycoumarin-4-ylmethyls: Photolabile protecting groups with biologically usefulcross-sections for two-photon photolysis. Proc Natl Acad Sci 96:1193–1200.
Goppert-Mayer M. 1931 Uber Elementarakte mit zwei Quantensprun-gen. Ann Phys 9:273–294.
Jones KT, Soeller C, Cannell MB. 1998. The passage of Ca21 andfluorescent markers between the sperm and egg after fusion in themouse. Development 12:4627–4635.
Lipp P, Niggli, E. 1998. Fundamental calcium release events revealedby two-photon excitation photolysis of caged calcium in guinea pigcardiac myocytes. J Physiol 508:801–809.
Lukyanenko V, Wiesner TF, Gyorke S. 1998. Termination of Ca21
release during Ca21 sparks in rat ventricular myocytes. J Physiol507:667–677.
Pape PC, Jong DS, Chandler WK. 1995. Calcium release and itsvoltage dependence in frog cut muscle fibers equilibrated with 20mM EGTA. J Gen Physiol 106:259–336.
Pawley JB, editor. 1995. Handbook of biological confocal microscopy,2nd ed. New York: Plenum Press.
Pettit DL, Wang SS, Gee KR, Augustine GJ. 1997. Chemical two-photon uncaging: A novel approach to mapping glutamate receptors.Neuron 19:465–471.
Piston DW, Masters BR, Webb WW. 1995. Three-dimensionally re-solved NAD(P)H cellular metabolic redox imaging of the in situcornea with two-photon excitation laser scanning microscopy. JMicrosc 178:20–27
Schrader M, Bahlmann K, Hell SW. 1997. Three-photon-excitationmicroscopy: theory, experiment and applications. Optik 104:116–124.
Sheppard CJR, Gu M. 1990. Image formation in two-photon fluores-cence microscopy. Optik 86:104–106.
Soeller C, Cannell MB. 1996. Construction of a two-photon microscopeand optimisation of illumination pulse duration. Pflugers Arch432:555–561.
Soeller C, Cannell MB. 1999. Two-photon excited flash photolysis forthe study of model cell systems. Biophys J 76:A307.
Song L-S, Sham JSK, Stern MD, Lakatta EG, Cheng H. 1998. Directmeasurement of SR release flux by tracking ‘Ca21 spikes’ in ratcardiac myocytes. J Physiol 512:677–691.
Svoboda K, Tank DW, Denk W. 1996. Direct measurement of couplingbetween dendritic spines and shafts. Science 272:716–719.
Svoboda K, Denk W, Kleinfeld D, Tank DW 1997. In vivo dendriticcalcium dynamics in neocortical pyramidal neurons. Nature 385:161–165.
Szmacinski H, Gryczynski I, Lakowicz JR. 1998. Spatially localizedballistic two-photon excitation in scattering media. Biospectroscopy4:303–310.
Wan H, Winton HL, Soeller C, Tovet ER, Gruenert DC, Thompson PJ,Stewart GA, Taylor GW, Garrod DR, Cannell MB, Robinson C. 1999.Der p 1 facilitates transepithelial allergen delivery by disruption oftight junctions. J Clin Invest. 104:123–133.
Wang SS, Augustine GJ. 1995. Confocal imaging and local photolysisof caged compounds: Dual probes of synaptic function. Neuron15:755–760.
Wilson, T. 1989. Optical sectioning in confocal fluorescent microscopes.J Microsc 154:143–156.
Xu C, Zipfel W, Shear JB, Williams RM, Webb WW. 1996. Multiphotonfluorescence excitation: New spectral windows for biological nonlin-ear microscopy. Proc Natl Acad Sci 93:10763–10768.
195TWO-PHOTON IMAGING AND PHOTOLYSIS


![Impacts of aerosols and clouds on photolysis frequencies and ... of aerosols and cloud… · [2] Photolysis reactions play a very important role in atmospheric chemistry. Ozone photolysis](https://img.pdfslide.us/doc/110x75/5f07e35b7e708231d41f41d6/impacts-of-aerosols-and-clouds-on-photolysis-frequencies-and-of-aerosols-and.jpg)