Embed Size (px)
Citation preview
Two-phase Flow Distribution in Plate Heat
Exchanger and Bifurcation Channel
September 2014
Department of Science and Advanced Technology
Graduate School of Science and Engineering
Saga University
Muh. Anis Mustaghfirin
Two-phase Flow Distribution in Plate Heat Exchanger and
Bifurcation Channel
By
Muh. Anis Mustaghfirin
A dissertation submitted in partial fulfillment of the
requirements for the degree of
Doctor of Engineering (Dr. Eng.)
in
Mechanical Engineering
Department of Science and Advanced Technology
Graduate School of Science and Engineering
Saga University
Japan
September 2014
ACKNOWLEDGEMENTS
There is no special word to express this great bounty except Alhamdulillah, I should be
grateful to Allah, the Almighty Allah (God), the Gracious the Merciful. Allah, who has
given me the strength and the spirit to complete this task, without His help; I would not
achieved this goal.
I would like to express my sincere gratitude to Professor Akio Miyara, my thesis advisor,
who accepted me as his Ph.D student without any hesitation. It was my privilege to work
with him, who completely showed me what a wonderful advisor should be like. Without his
help, support, and trust, it would be impossible for me to achieve this milestone. My special
thanks are due to Dr. Koutaro Tsubaki for setting up computer and CFD software as well as
Dr. Keishi Kariya for making a number of helpful suggestions. Without their valuable input,
this thesis would not have been this current quality.
I also would like to extend my sincere thanks to the members of my dissertation committee,
Professor Yuichi Mitsutake, Professor Yoichi Kinoue and Dr. Keishi Kariya for their time,
comments and valuable ideas. I am grateful for their generous and suggestions that helped
improve this work significantly.
I would like to thank to my home institution, State Ship Building Polytechnics of Surabaya
(Politeknik Perkapalan Negeri Surabaya), especially to Director Ir. Muhammad Mahfud
M.MT, for allowing me the opportunity to continue my studies at the doctoral level. I
would also like to express special thanks to Indonesian Ministry of Education, Directorate
General of Higher Education to grant me as an Indonesian Government sponsored student.
Without their grant and support, this would not have been possible.
I wish to thank to my beloved and respected parents, my father, Mr. Misron Yunani, is the
person who put the fundament my learning character, showing me the joy of intellectual
pursuit ever since I was a child; and my mother, Mrs. Siti Syamsiah, is the one who
sincerely raised me with her caring and gently love. Their prayers, encouragement, and
advice have been and will always be a fortune for my life. I be obliged them everything and
wish I could show them just how much I love and appreciate them. I would like to convey
my heartfelt thanks to my beloved wife, Binti Sholihah Thohir, whose love, support,
patience, encouragement and sacrifice allowed me to finish this journey. Without love and

iv
sacrifice from her, I would not be able to complete my study today. I also want to be
thankful to my children, Hanna, Robith, Ahmad, Adam and new baby Da’i for their love,
patience and sacrifice.
Thanks are due to all the personnel at the Thermal Energy Engineering Miyara Lab. They
were a constant source of help when I was working with this work group. Thanks to
Fumiaki Sugino, Hirata Yuki, Yamato Eshima and Kawazoe Akitoshi for helping me to
collect experimental data for this study. Finally, I would like to thank all of my lab mates
for their supports. I would also like to express my gratitude to all Indonesian friends, Saga
Moslem Society and International students in Saga for making my Japan life more
comfortable and enjoyable. I also would like to thank everybody who was important to the
successful realization of my study, as well as expressing my apology that I could not
mention personally one by one.
By (the Token of) Time (through the ages)
Verily Man is in loss
Except such as have Faith, and do righteous deeds, and (join together) in the mutual teaching of
Truth, and of Patience and Constancy.
(Quran, Chapter 103 surat Al-Asr (The Declining Day), verse 1-3)
v
ABSTRACT
Distributor is an essential section for fluid distribution, moreover for heat exchanger,
reactor, fuel cell etc. Uniformity distribution must be reached, in order to get better heat
and mass transfer as well as hydraulic performance. For single-phase flow is easier, rather
than two-phase flow, due to complicated interaction between phases. There is anomaly in
two-phase flow. Usually, the when uniformity is enhanced, better heat transfer performance
is achieved. Unfortunately, this achievement followed by decreasing hydraulic performance,
specially increasing pressure loss. This problem comes to severer, because the behavior of
two-phase flow distribution has not been understood clearly.
Here, the investigation is directed to explore more detail about two-phase flow behavior
using both experimental and modelling approached. The works is emphasized on
bifurcation channel distributor and expanded to brazed plate heat exchanger. The
bifurcation channel distributor is the basic form of most of distributors including plate heat
exchanger. In the bifurcation channel distributor the phase not only passes straight along
channel but also some phases impacts to the wall as well as devises in different channel,
some phase devises without impacting the wall, in one region, junction section. Different
from bifurcation channel distributor, in the T-junction all phases impact and devise to
channels.
The bifurcation channel distributor, experiments have been carried out upon the distributor
constructed by acrylics resembling merged triple pipe, 8 mm in diameter of main channel
and two set 5 mm in diameter of each outlet channel. The test section had been tested in
three positions; horizontal, 45o inclined and vertical. Three flow patterns were fed i.e.;
bubble, slug and stratified flow and the phase as well as their distributions were observed
via high speed video camera. The pressure distribution was measured by series of U-tube
water gauge manometer. The flow patterns, phase distribution and pressure drop were
analyzed by CFD software, validated by experimental data and compared by existing
correlation, analytically.
vi
The plate heat exchanger, experiments have been done on acrylic corrugated channels as
mockup of brazed plate heat exchanger channel, having chevron angle 30o and corrugation
depth 1.5 mm. The stratified flow is fed to test section in similar total mass flux G=10.0
kg.s-1
.m-2
, in different mass quality from 0.1 to 0.6. The void fraction is weighed carefully
using digital scale, the phase distribution also are tracked by using same high speed video
camera
For modelling, the boundary condition for both of bifurcation channel distributor and plate
heat exchanger were set up similar to experiment setup condition, nevertheless there is
some simplification in corrugated channel geometry, in order to attain convergence in
iteration. Another modeling work also was done. There are comparison studies of hydraulic
and thermal performance for corrugated and dimple/protrusion plate of plate heat
exchanger on single phase mode.
There are revealed that; the uniformity of two phase flow distribution depends on flow
pattern, channel geometry and its orientation. The some flow patterns can transform to
another form while they impact and devise in junction distributor. There is oscillation and
damping effect in between two phases in flow field, caused by successive changing kinetic
energy and pressure energy when the phase impact the wall and devise in junction
distributor. The existing correlations of two-phase flow should be reconstructed, to provide
complicated problem in distributor.
For plate heat exchanger, it were discovered that; similar to the bifurcation channel
distributor for uniformity behavior and also the uniformity is depend on flow orientation.
The upward flow tends to has more lack uniformity of phase distribution than downward
flow, due to bigger slip factor and effect of damping of liquid and geometry as well as
buoyancy. The increasing gas quality drives increasing void fraction in certain trend line
quite different from existing correlations. The better expected correlation of void fraction
for plate heat exchanger is formulated based on drift flux model.
To support understanding to this study, here also supported relevant basic science of two-
phase flow and modelling for single-and two-phase flow.
vii
TABLE OF CONTENTS
Acknowledgements
Abstract
iii
v
Table of contents vii
List of figures xi
List of tables xv
Nomenclature xvi
1 Introduction 1
1.1 Background 1
1.2 Problems
1.3 Simplification of problem
8
8
1.4 Objective 9
References 10
2 The Fundamentals of Two-Phase Flow 13
2.1 Flow pattern 13
2.2 Flow patterns in vertical tube 13
2.3 Flow patterns in horizontal tubes 15
2.4 Flow patterns map 17
2.5 Two-phase flow model 19
2.6 Homogeneous model for pressure drop 23
2.6.1 The approaching homogeneous model 23
2.6.2 The two-phase friction factor 24
2.7 Separated model 25
2.7.1 The Lockhart-Martinelli correlation 26
2.7.2 Universal approach to predicting two-phase frictional
pressure drop, Kim, S.M and Mudawar (2012)
26
2.7.2 Other proper correlation 27
2.8 Void fraction 28
viii
2.9 Uniformity distribution 30
2.10 Pressure losses through bifurcation channel distributor 30
2.10.1 Pressure losses caused by area changes in a single-
Channel Flow, by Tapucu 1989.
31
2.10.2 Pressure drop by energy equation as T-Junction, Hwang et
al. (1988)
32
2.11 Modeling for Internal Flow 33
2.11.1 Single phase flow modeling 33
2.11.2 Generalizing conservative equation for two-phase flow 35
2.11.3 The VOF (Volume of Fluid) Model for two-phase flow 37
2.11.4 Steady-State and Transient VOF Calculations 38
2.11.5 Volume fraction equation 38
2.12 References
40
3 Two-phase Flow Distribution in Bifurcation Channel 41
3.1 Introduction 41
3.2 Uniformity of Two-phase Flow Distribution in Curved Round
Distributor Design and Analysis
46
3.2.1 Design 46
3.2.2 Analysis 48
3.2.3 Summary 51
3.3 Mal-uniformity of Two-phase Flow through Bifurcation channel
Distributor
51
3.3.1 Experimental apparatus 51
3.3.2 Volume of Fluid Model 54
3.3.2.1 Two-phase flow generator 55
3.3.2.2 Pressure drop 56
3.3.3 Results and discussion 57
3.3.3.1 Phase distribution 57
3.3.3.2 Static Pressure distribution 59
3.3.3.3 Effect of channel length 60
ix
3.3.4 Summary 64
3.4 Effect of Outlet Channel Length to Pressure Loss and Gain of Two-
phase Flow Distribution in Bifurcation channel Distributor
64
3.4.1 Entrance region of distributor 64
3.4.2 Junction region of distributor 67
3.4.3 Outlet channel region of distributor 71
3.4.4 Summary 74
3.5 References 76
4 Two-phase Flow Distribution in Plate Heat Exchanger 81
4.1 Introduction to plate heat exchanger
4.1.1 Heat exchanger classification
82
82
4.1.2 Plate-type heat exchanger 82
4.1.2.1 Gasketed plate heat exchangers 83
4.1.2.2 Welded plate heat exchangers 88
4.1.2.3 Brazed plate heat exchanger 89
4.2 References study 90
4.3 Performance of protrusion and corrugation plate for plate heat
exchanger
93
4.3.1 Modeling of plate heat exchanger channel 93
4.3.2 Results and discussion 96
4.3.3 Summary 102
4.4 Mal-uniformity distribution of fluid flow through corrugated
channel of brazed plate heat exchanger
102
4.4.1 Modeling and experimental setup 102
4.4.2 Results and discussion 104
4.4.3 Summary 106
4.5 Air-water flow behavior through corrugated channel of plate
heat exchanger
106
4.5.1 Experimental Setup 106
4.5.2 Results and discussion 107
x
4.5.3 Summary 112
4.6 Void Fraction and Uniformity Two-phase Flow Distribution in
Corrugated Channel of plate heat exchanger
112
4.6.1 Modeling of test section 112
4.6.2 Results and discussion 114
4.6.2.1 Phase distribution 114
4.6.2.2 Velocity distribution 115
4.6.2.2 Pressure distribution 116
4.6.2.3 Void fraction 117
4.6.3 Summary 118
4.7 References 119
5 Conclusions and recommendations
5.1 Conclusions
123
123
5.2 Recommendations 125
xi
List of Figures
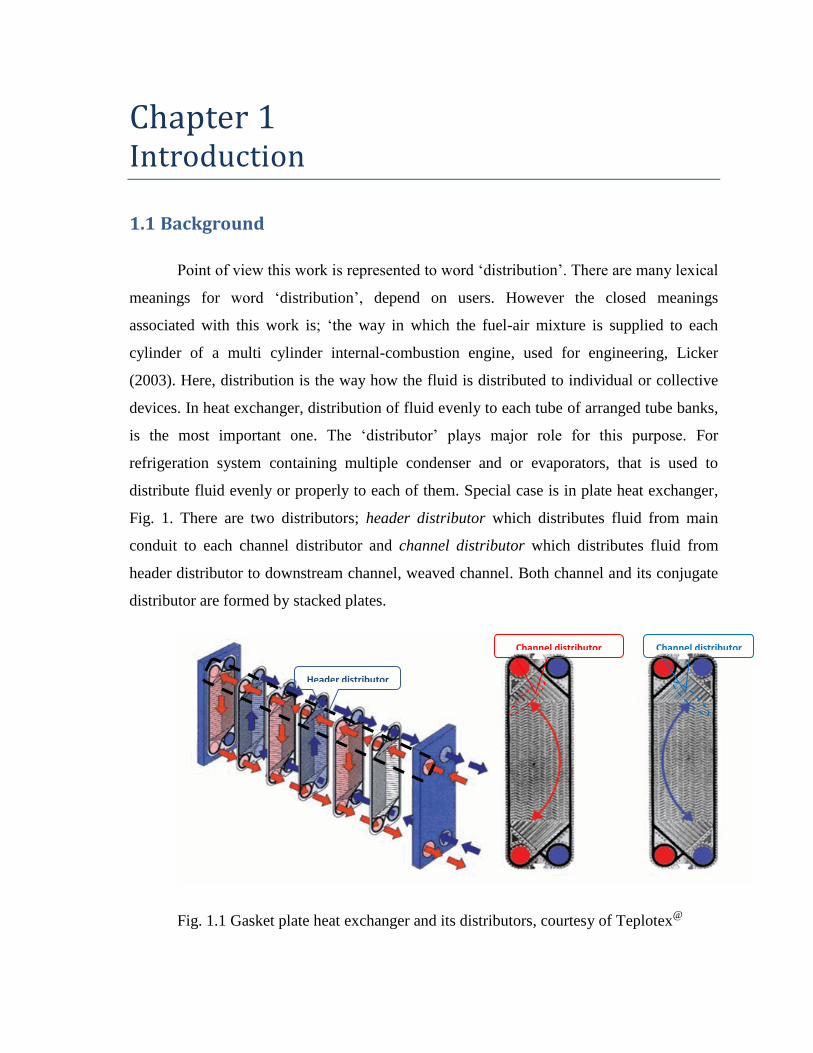
Fig. 1.1 Gasket plate heat exchanger and its distributors, courtesy of
Teplotex@
1
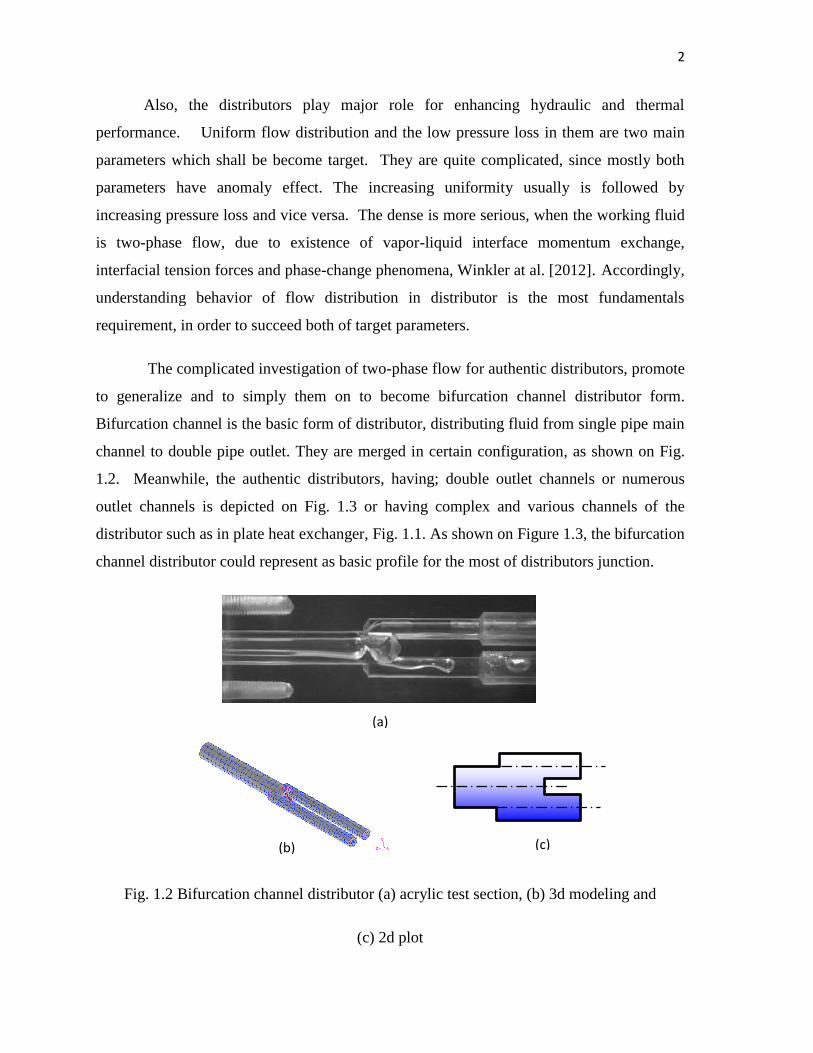
Fig. 1.2 Bifurcation channel distributor (a) acrylic test section, (b) 3d
modeling and (c) 2d plot
2
Fig. 1.3 Authentic distributors; (a) double outlet port (b) multiple outlet
port (c) multiple port header (d) shell and tube (f) binary
arborescense (g) constructal design (h) multiple structural
bifurcation
3
Fig. 2.1 Two-phase flow pattern in vertical upward flow, courtesy of
ThermopediaTM
15
Fig. 2.2 Two-phase flow pattern in horizontal flow 17
Fig. 2.3 Flow pattern map obtained by Hewitt and Roberts (1969) for
vertical two-phase co-current upwards flow in a vertical tube
18
Fig. 2.4 Flow pattern map for horizontal co-current flow obtained by
Taitel and Dukler (1976). (See Dukler and Taitel, 1986)
19
Fig. 2.5 Two-phase flow model, Collier (1981) 20
Fig. 2.6 Bifurcation channel distributor; (a) 2d sketch and Simplified as
Incline straight tube, (b) simplified as converging diverging
nozzle and (c) 3d sketch
30
Fig. 2.7 Sharp insert 31
Fig. 2.8 Sample solver menu in Fluent@ Ansys 14.5 academic version 35
Fig. 3.1 Types of distributor 46
Fig. 3.2 Two dimensional bifurcation channel distributor 46
Fig. 3.3 Flow around rectangular aerofoil, Mannini et al.[8]. 47
Fig. 3.4 Phase distribution. 49
Fig. 3.5 Velocity distribution. 49
Fig. 3.6 Pressure distribution through junction. 50
Fig. 3.7 Experimental setup for bifurcation channel distributor 52
xii
Fig. 3.8 Test section 52
Fig. 3.9 Pressure measurement setup 53
Fig. 3.10 Simplified model of two phase flow generator
56
Fig. 3.11 Various flow pattern in various channel length of horizontal
distributor.
57
Fig. 3.12 Stratified flow in various channel length of horizontal
distributor.
58
Fig. 3.13 Phase distribution in different inclination of distributor. 59
Fig. 3.14 Static pressure distribution in various two phase flow pattern. 60
Fig. 3.15 Static pressure distribution in different channel length. 61
Fig. 3.16 Magnitude of velocity of mixture distribution in different
channel length.
62
Fig. 3.17 Static pressure distribution in different inclination 63
Fig. 3.18 Pressure loss or gain in entrance region of distributor at
different flow patterns.
65
Fig. 3.19 Pressure loss or gain in junction to upper outlet channel of
distributor at different flow patterns.
69
Fig. 3.20 Pressure loss or gain in junction to lower outlet channel of
distributor at different flow patterns.
70
Fig. 3.21 Pressure loss or gain in upper outlet channel of distributor at
different flow patterns.
72
Fig. 3.22 Pressure loss or gain in lower outlet channel of distributor at
different flow patterns.
73
Fig. 4.1 Classification of heat exchangers (Shah, 1981) 82
Fig. 4.2 Gasketed plate-and-frame heat exchanger.
83
Fig. 4.3 Plates showing gaskets around the ports (Shah and Focke,
1988).
84
Fig. 4.4 Plate patterns: (a) washboard; (b) zigzag; (c) chevron or
herringbone; (d) protrusions and depressions; (e) washboard
with secondary corrugations; (f ) oblique washboard (Shah and
Focke, 1988).
85
xiii
Fig. 4.5 Three-fluid plate heat exchanger 86
Fig. 4.6 Single-and multi-pass plate heat exchanger arrangements.
Looped or single-pass arrangement: (a) U arrangement, (b) Z
arrangement Multi-pass arrangement: (c) 2 pass-1pass, (d)
3pass-1pass, (e) 4pass-2pass and (f) series flow
88
Fig. 4.7 Section of welded plate heat exchanger 89
Fig. 4.8 Construction of brazed plate heat exchanger by Danfoss@ with
corrugated plates
90
Fig. 4.9 Protrusion plate heat exchanger. 94
Fig. 4.10 Protrusion channels in mm; (a) Protrusion channel, odd layer,
(b) Dimple channel, even layer.
94
Fig. 4.11 Corrugation plate heat exchanger. 95
Fig. 4.12 Corrugation channel. 95
Fig. 4.13
Temperature distribution of water in center plane of channels;
(a) Odd layer protrusion, (b) Even layer protrusion,
(c) Corrugation
97
Fig. 4.14 Pressure distribution of water in center plane of channels;
(a) Odd layer protrusion, (b) Even layer protrusion, (c)
Corrugation
99
Fig. 4.15 Velocity Vector distribution of water in center plane of
channels; (a) Odd layer protrusion, (b) Even layer protrusion,
(c) Corrugation
101
Fig. 4.16 Original plate of brazed plate heat exchanger 102
Fig. 4.17 Molded acrylic test section and its detail drawing 103
Fig. 4.18 Full test Section model 103
Fig. 4.19 Experimental Setup 103
Fig. 4.20 Velocity distribution 104
Fig. 4.21 Temperature distribution 105
Fig. 4.22 Pressure distribution 105
Fig. 4.23 Phase distribution 106
Fig. 4.24 Experimental setup 107
xiv
Fig. 4.25 Two-phase distribution of downward flow at gas quality: (a)
0.1, (b) 0.2, (c) 0.4 and (d) 0.6.
108
Fig. 4.26 Two-phase distribution of upward flow at gas quality: (e) 0.1,
(f) 0.2, (g) 0.4 and (h) 0.6.
109
Fig. 4.27 Experiment based and analytical correlation of void fraction. 109
Fig. 4.28 Modeling setup; (a) total model domain, (b) inlet configuration
(c) test section model with mesh
113
Fig. 4.29 Experimental and CFD modeling of two-phase distribution of
downward flow at gas quality: (a) 0.1, (b) 0.4 and (c) 0.6.
114
Fig. 4.30 Velocity distribution for downward flow at gas quality: (a) 0.1,
(b) 0.4 and (c) 0.6.
116
Fig. 4.31 Pressure distribution for downward flow at gas quality: (a) 0.1,
(b) 0.4 and (c) 0.6.
116
Fig. 4.32 Experimental and analytical correlation as well as modeling of
void fraction.
117
xv
List of Tables
Table 1.1 Previous works related to distributor 4
Table 1.2 The works of flow through tee-junction 5
Table 2.1 General conservative equation for fluid flow 33
Table 4.1 Heat transfer area per volume (σ) of models section 96
Table 4.2 Total heat released over plates of models section 98
Table 4.3 Pressure drop per unit volume of models section 100
Table 4.4 Velocity inlet boundary conditions 114
xvi
Nomenclature
A cross sectional area (m2)
m mass flow rate (kg/s or kg/min)
C Martinelli coefficient, diverging ratio of venturi tube
cp specific heat (kJ/kg K)
d differential operator
D tube diameter (m), substantial derivative
F frictional, usually for two phase pressure drop
Fr Froude number, dimensionless
G Mass flux or mass velocity (kg/m2s)
g acceleration due to gravity (m/s2)
h height (m)
i enthalpy (kJ/kg)
j superficial velocity (m/s)
K slip ratio, dimensionless
L length (m)
p pressure (Pa)
Pr Prandtl number, dimensionless
Q volume flow rate (m3/s)
R result, uniformity ratio, deviation ratio, dimensionless
Re Reynolds number, dimensionless
RL liquid holdup or liquid fraction, dimensionless
S slip ratio, slip factor, source term momentum in CFD,
dimensionless
T temperature (K)
t time, instant time (s)
u velocity (m/s), superficial velocity (m/s), velocity in x direction
(m/s), uncertainty (%)
U drift velocity
xvii
v specific volume (m3/kg), velocity in y direction (m/s)
W mass flow rate (kg/s)
w velocity in z direction (m/s)
X Martinelli parameter, dimensionless
x quality or dryness fraction, dimensionless
Δz length of element in the finite-difference grid, m
Greeks symbols
void fraction, dimensionless
volumetric quality, dimensionless
partial derivative
del operator
density (kg/m3)
specific volume (m3/kg)
µ dynamic viscosity (Pa.s)
kinematic viscosity (Stoke, cm2/s)
phase compressibility factor, dimensionless
Beattie and Whalley correlation, dimensionless
two-phase frictional multipliers, dimensionless
parameter in Baker’s flow regime map
inclination angle of pipe
parameter in Baker’s flow regime map
surface tension (N/m), standard deviation, converging ratio of
nozzle/venturi
shear stress (N/m2)
The rate of production of phase mass from the phase changes at the
interfaces per unit volume
percentage error
xviii
Subscripts
viscous
a air, momentum component in pressure gradient
ave average
b based side
E energy
f frictional component in pressure gradient, liquid phase
fg gas liquid fraction different
G gas phase
g gravitational component in pressure gradient or gas phase
h homogenous
Hom Homogeneous model
i number of a variable
L liquid phase
M Momentum component
m mixture
o based on Fanning equation
q phase variable (gas or liquid)
R relative
SI area change effect for Tapucu correlation
t turbulent
TP two-phase
u upper side
W water
x x direction in Cartesian coordinate
y y direction in Cartesian coordinate
z gravitational component in pressure gradient
z z direction in Cartesian coordinate
Chapter 1 Introduction
1.1 Background
Point of view this work is represented to word ‘distribution’. There are many lexical
meanings for word ‘distribution’, depend on users. However the closed meanings
associated with this work is; ‘the way in which the fuel-air mixture is supplied to each
cylinder of a multi cylinder internal-combustion engine, used for engineering, Licker
(2003). Here, distribution is the way how the fluid is distributed to individual or collective
devices. In heat exchanger, distribution of fluid evenly to each tube of arranged tube banks,
is the most important one. The ‘distributor’ plays major role for this purpose. For
refrigeration system containing multiple condenser and or evaporators, that is used to
distribute fluid evenly or properly to each of them. Special case is in plate heat exchanger,
Fig. 1. There are two distributors; header distributor which distributes fluid from main
conduit to each channel distributor and channel distributor which distributes fluid from
header distributor to downstream channel, weaved channel. Both channel and its conjugate
distributor are formed by stacked plates.
Fig. 1.1 Gasket plate heat exchanger and its distributors, courtesy of Teplotex@
Header distributor
Channel distributor Channel distributor
2
Also, the distributors play major role for enhancing hydraulic and thermal
performance. Uniform flow distribution and the low pressure loss in them are two main
parameters which shall be become target. They are quite complicated, since mostly both
parameters have anomaly effect. The increasing uniformity usually is followed by
increasing pressure loss and vice versa. The dense is more serious, when the working fluid
is two-phase flow, due to existence of vapor-liquid interface momentum exchange,
interfacial tension forces and phase-change phenomena, Winkler at al. [2012]. Accordingly,
understanding behavior of flow distribution in distributor is the most fundamentals
requirement, in order to succeed both of target parameters.
The complicated investigation of two-phase flow for authentic distributors, promote
to generalize and to simply them on to become bifurcation channel distributor form.
Bifurcation channel is the basic form of distributor, distributing fluid from single pipe main
channel to double pipe outlet. They are merged in certain configuration, as shown on Fig.
1.2. Meanwhile, the authentic distributors, having; double outlet channels or numerous
outlet channels is depicted on Fig. 1.3 or having complex and various channels of the
distributor such as in plate heat exchanger, Fig. 1.1. As shown on Figure 1.3, the bifurcation
channel distributor could represent as basic profile for the most of distributors junction.
Fig. 1.2 Bifurcation channel distributor (a) acrylic test section, (b) 3d modeling and
(c) 2d plot
(a)
(b) (c)
3
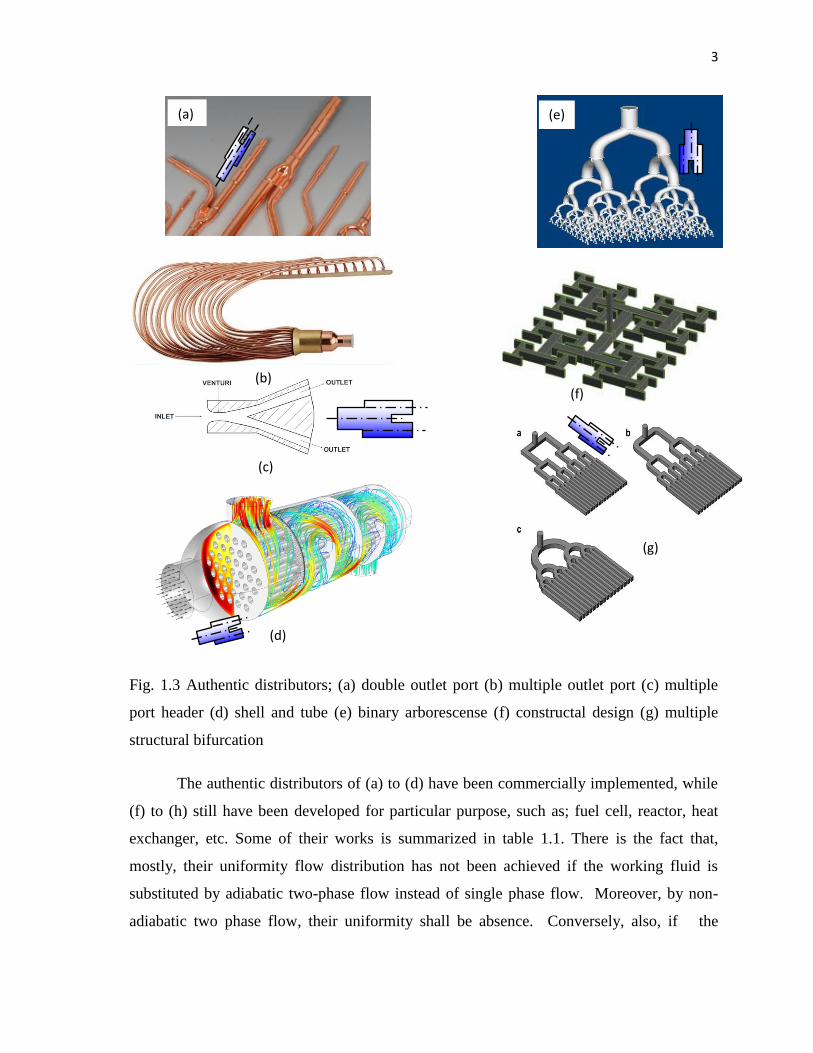
Fig. 1.3 Authentic distributors; (a) double outlet port (b) multiple outlet port (c) multiple
port header (d) shell and tube (e) binary arborescense (f) constructal design (g) multiple
structural bifurcation
The authentic distributors of (a) to (d) have been commercially implemented, while
(f) to (h) still have been developed for particular purpose, such as; fuel cell, reactor, heat
exchanger, etc. Some of their works is summarized in table 1.1. There is the fact that,
mostly, their uniformity flow distribution has not been achieved if the working fluid is
substituted by adiabatic two-phase flow instead of single phase flow. Moreover, by non-
adiabatic two phase flow, their uniformity shall be absence. Conversely, also, if the
(e)
(b)
(a)
(c)
(f)
(g)
(d)
4
distributor is designed for two-phase flow, their uniformity goes to lack when is
implemented for single phase flow. Accordingly, the distributor should be designed
referring to their working fluid.
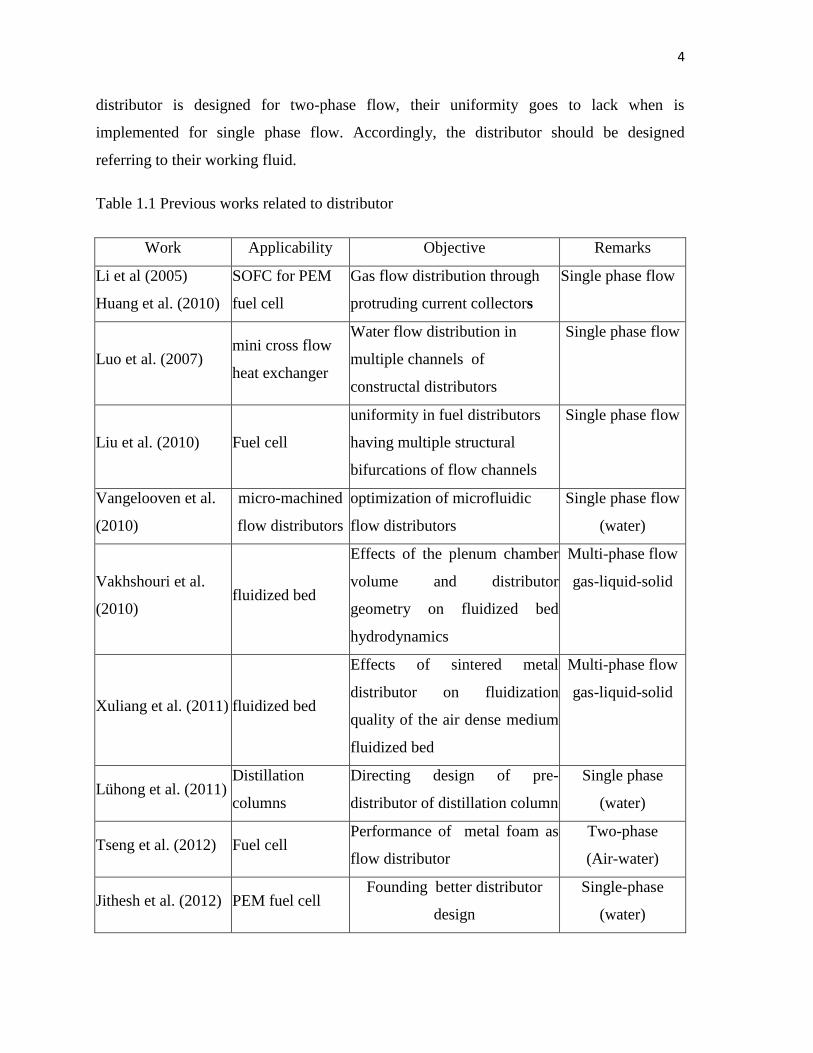
Table 1.1 Previous works related to distributor
Work Applicability Objective Remarks
Li et al (2005)
Huang et al. (2010)
SOFC for PEM
fuel cell
Gas flow distribution through
protruding current collectors
Single phase flow
Luo et al. (2007) mini cross flow
heat exchanger
Water flow distribution in
multiple channels of
constructal distributors
Single phase flow
Liu et al. (2010) Fuel cell
uniformity in fuel distributors
having multiple structural
bifurcations of flow channels
Single phase flow
Vangelooven et al.
(2010)
micro-machined
flow distributors
optimization of microfluidic
flow distributors
Single phase flow
(water)
Vakhshouri et al.
(2010) fluidized bed
Effects of the plenum chamber
volume and distributor
geometry on fluidized bed
hydrodynamics
Multi-phase flow
gas-liquid-solid
Xuliang et al. (2011) fluidized bed
Effects of sintered metal
distributor on fluidization
quality of the air dense medium
fluidized bed
Multi-phase flow
gas-liquid-solid
Lühong et al. (2011) Distillation
columns
Directing design of pre-
distributor of distillation column
Single phase
(water)
Tseng et al. (2012) Fuel cell Performance of metal foam as
flow distributor
Two-phase
(Air-water)
Jithesh et al. (2012) PEM fuel cell Founding better distributor
design
Single-phase
(water)
5
Work Applicability Objective Remarks
Zang et al. (2012)
heat exchanger,
catalytic, packed bed ,
array of
test tubes
to minimize the global power
requirement
subject to the total volume
and channel-material
constraints
Single-phase
(air)
Sukas et al. (2013)
Solid micro fabricated
column structures for
capillary
electrochromatography
Evaluation of injector/
distributor structures for solid
micro fabricated column
structures for CEC
Single-phase of
chemical solution
Hoang et al.
(2014)
multiphase
microreactors
To design and to operate a
multi- junction bubble
distributor
Two-phase flow
(HFE-7500 and
air)
As described on forgoing table 1.1, Most of them play on single-phase flow. The study
regarding two-phase flow distributor are only the Hoang’s (2014) and Tseng’s (2012)
works. Both of them direct to particular purpose; micro reactor and fuel cell. The basic
fundamental of two-phase flow distribution on them has not discovered, clearly. Instead,
the rather clear phenomenon come from tee-junction studies, as briefly described on
following table 1.2
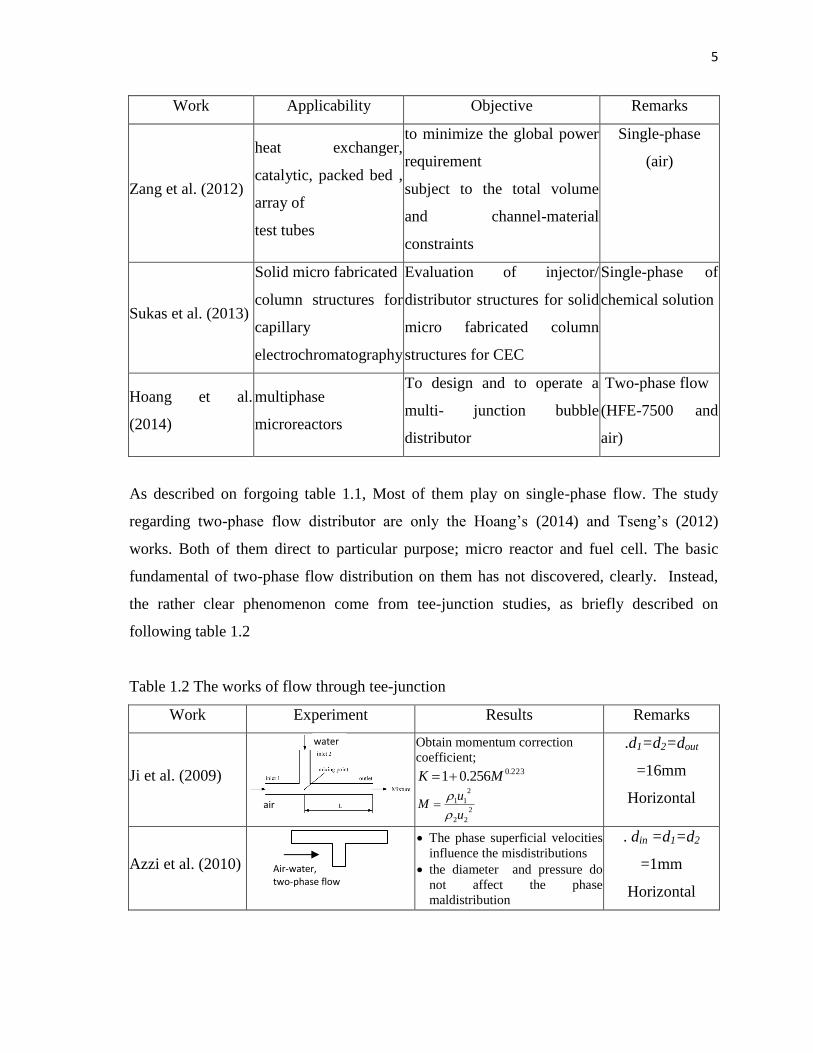
Table 1.2 The works of flow through tee-junction
Work Experiment Results Remarks
Ji et al. (2009)
Obtain momentum correction
coefficient; 223.0256.01 MK
2
22
2
11
u
uM
.d1=d2=dout
=16mm
Horizontal
Azzi et al. (2010)
The phase superficial velocities
influence the misdistributions
the diameter and pressure do
not affect the phase
maldistribution
. din =d1=d2
=1mm
Horizontal
water
air
Air-water, two-phase flow
6
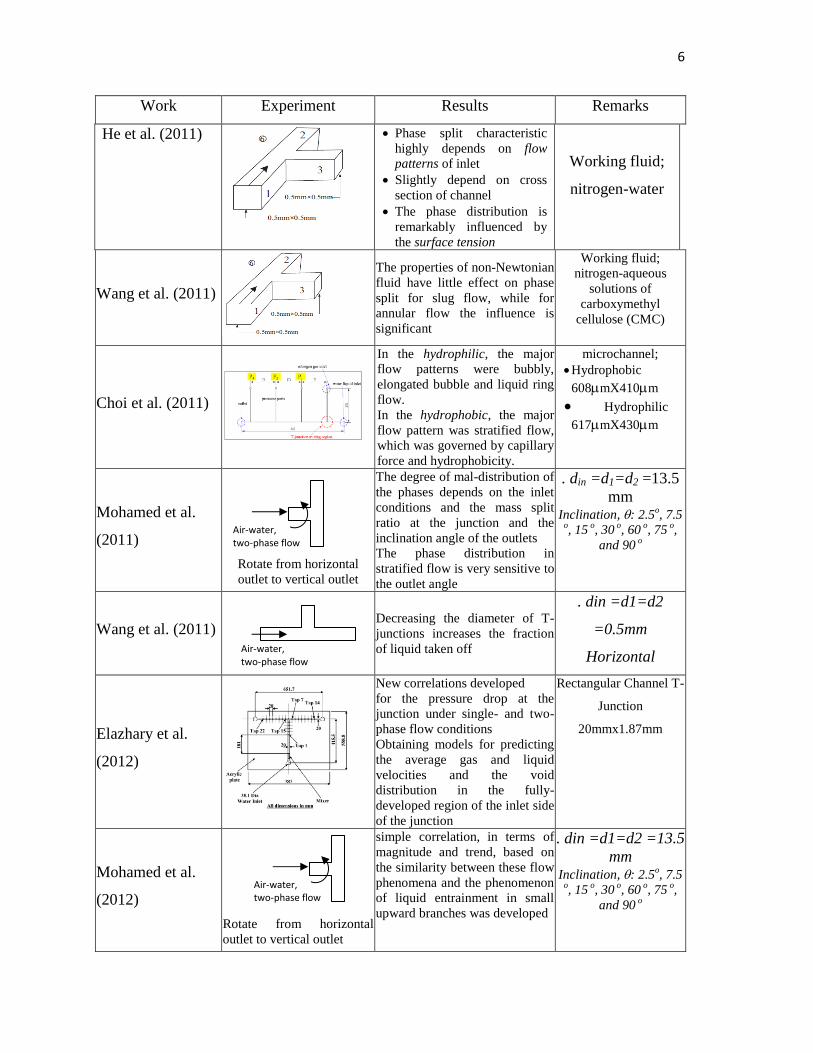
Work Experiment Results Remarks
He et al. (2011)
Phase split characteristic
highly depends on flow
patterns of inlet
Slightly depend on cross
section of channel
The phase distribution is
remarkably influenced by
the surface tension
Working fluid;
nitrogen-water
Wang et al. (2011)
The properties of non-Newtonian
fluid have little effect on phase
split for slug flow, while for
annular flow the influence is
significant
Working fluid;
nitrogen-aqueous
solutions of
carboxymethyl
cellulose (CMC)
Choi et al. (2011)
In the hydrophilic, the major
flow patterns were bubbly,
elongated bubble and liquid ring
flow.
In the hydrophobic, the major
flow pattern was stratified flow,
which was governed by capillary
force and hydrophobicity.
microchannel;
Hydrophobic
608mX410m
Hydrophilic
617mX430m
Mohamed et al.
(2011)
Rotate from horizontal
outlet to vertical outlet
The degree of mal-distribution of
the phases depends on the inlet
conditions and the mass split
ratio at the junction and the
inclination angle of the outlets
The phase distribution in
stratified flow is very sensitive to
the outlet angle
. din =d1=d2 =13.5
mm Inclination, : 2.5
o, 7.5
o, 15
o, 30
o, 60
o, 75
o,
and 90 o
Wang et al. (2011)
Decreasing the diameter of T-
junctions increases the fraction
of liquid taken off
. din =d1=d2
=0.5mm
Horizontal
Elazhary et al.
(2012)
New correlations developed
for the pressure drop at the
junction under single- and two-
phase flow conditions
Obtaining models for predicting
the average gas and liquid
velocities and the void
distribution in the fully-
developed region of the inlet side
of the junction
Rectangular Channel T-
Junction
20mmx1.87mm
Mohamed et al.
(2012)
Rotate from horizontal
outlet to vertical outlet
simple correlation, in terms of
magnitude and trend, based on
the similarity between these flow
phenomena and the phenomenon
of liquid entrainment in small
upward branches was developed
. din =d1=d2 =13.5
mm Inclination, : 2.5
o, 7.5
o, 15
o, 30
o, 60
o, 75
o,
and 90 o
Air-water, two-phase flow
Air-water, two-phase flow
Air-water, two-phase flow
7
Work Experiment Results Remarks
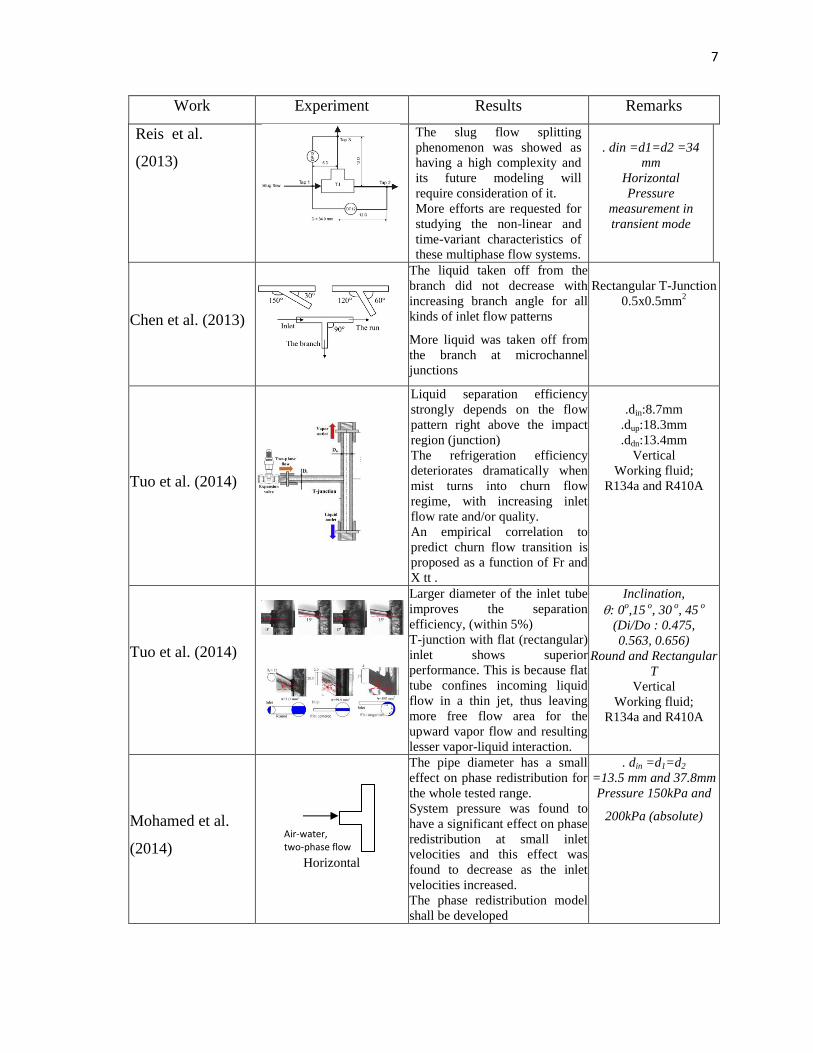
Reis et al.
(2013)
The slug flow splitting
phenomenon was showed as
having a high complexity and
its future modeling will
require consideration of it.
More efforts are requested for
studying the non-linear and
time-variant characteristics of
these multiphase flow systems.
. din =d1=d2 =34
mm
Horizontal
Pressure
measurement in
transient mode
Chen et al. (2013)
The liquid taken off from the
branch did not decrease with
increasing branch angle for all
kinds of inlet flow patterns
More liquid was taken off from
the branch at microchannel
junctions
Rectangular T-Junction
0.5x0.5mm2
Tuo et al. (2014)
Liquid separation efficiency
strongly depends on the flow
pattern right above the impact
region (junction)
The refrigeration efficiency
deteriorates dramatically when
mist turns into churn flow
regime, with increasing inlet
flow rate and/or quality.
An empirical correlation to
predict churn flow transition is
proposed as a function of Fr and
X tt .
.din:8.7mm
.dup:18.3mm
.ddn:13.4mm
Vertical
Working fluid;
R134a and R410A
Tuo et al. (2014)
Larger diameter of the inlet tube
improves the separation
efficiency, (within 5%)
T-junction with flat (rectangular)
inlet shows superior
performance. This is because flat
tube confines incoming liquid
flow in a thin jet, thus leaving
more free flow area for the
upward vapor flow and resulting
lesser vapor-liquid interaction.
Inclination,
: 0o,15
o, 30
o, 45
o
(Di/Do : 0.475,
0.563, 0.656)
Round and Rectangular
T
Vertical
Working fluid;
R134a and R410A
Mohamed et al.
(2014)
Horizontal
The pipe diameter has a small
effect on phase redistribution for
the whole tested range.
System pressure was found to
have a significant effect on phase
redistribution at small inlet
velocities and this effect was
found to decrease as the inlet
velocities increased.
The phase redistribution model
shall be developed
. din =d1=d2
=13.5 mm and 37.8mm
Pressure 150kPa and
200kPa (absolute)
Air-water, two-phase flow
8
1.2 Problems
As describe on table 1.2, the uniformity of two-phases flow distribution in tee-
junction depend on; superficial velocities, inlet flow pattern, surface tension, fluid
properties and channel orientation / angle of outlet channel. It slightly depends on; channel
diameter, cross section shape of channel, branch angle and system pressure. Also, there are
some phenomena; in micro channel the flow pattern is strongly depend on the wetness and
capillarity, the phase split is very complicated for slug flow due to high uncertainty of flow
pattern and fluctuating pressure.
Although many scientific proofs were discovered, the remaining questions have
been disclosed yet. These are;
Does outlet channel length affect to uniformity?
How does phase separation work?
Why does the flow pattern strongly affect uniformity?
Why in slug flow the phase separation comes to complex with time
variance?
If the channel diameter/cross section area varies along channel, what shall
be? etc.
The answer for all the questions are absolutely required for exploring two-phase flow
distribution phenomena in all type distributor, in which have not been revealed by others.
1.3 Simplification of Problems
To investigate two-phase flow behavior in plate heat exchanger is very complicated,
due to the complicated geometry of plates. Moreover, the basic fundamental of flow
distribution have not clearly disclosed yet. The bifurcation channel distributor is very
important as fundamental form of universal distributor instead of tee-junction. There is big
difference in between tee-junction and bifurcation channel distributor. In tee-junction, all
phase impact and separate to two channel or phase separate promoted by sucking phase
9
through branch channel. Meanwhile, the bifurcation channel distributor, the part of
phase/not all impact to junction and devise to two channels, downstream junction.
Basically, this impacting mechanism occurs in all type distributors from simple distributor
to complex distributor. Accordingly, the bifurcation channel distributor can represent as
basic fundamental form of universal distributor, Fig. 1.3, appropriate implemented for; heat
exchanger, reactor, fuel cell etc. The research regarding it is limited for both single and
two-phase flow.
1.4 Objective
Recent work firstly investigates briefly two-phase flow phenomena through
bifurcation channel distributor including effect of; flow pattern, shape of junction, length
channels, orientation, pressure distribution, fluctuating velocity and pressure. Also, here
was found the new phenomena in two-phase internal flow impingement such as; phase
transformation, pressure gain and loss, dumping and oscillation. Potentially, the new
phenomena shall complete establish three basic two phase flow model; homogenous,
separate and drift flux.
Secondly, here investigates single and two phase flow distribution in plate heat
exchanger channel, covering; thermal and flow distribution of single-phase through
corrugated channel and dimple-protrusion channel, two-phase flow distribution in
corrugated channel including; phases, quality and void fraction. Here is proofed, that two-
phase flow distribution phenomena in bifurcation channel distributor have better agreement
with those in plate heat exchanger.
10
References
Licker, M.D., (2003), McGraw-Hill Dictionary of Engineering, Second Edition, McGraw-
Hill, ISBN: 0071410503.
Winkler, J., Killion, J., Garimella, S. and Fronk, B.M., (2012), Void fractions for
condensing refrigerant flow in small channels: Part I literature review, Int. J.
Refrigeration 35, p. 219-245.
Li, P.W., Chen, S.P. and Chyu, M.K., (2005), Novel gas distributors and optimization for
high power density in fuel cells, J. Power Sources 140, p. 311–318.
Luo,L., Fana, Y., Zhang, W., Yuan, X. and Midoux, N., (2007), Integration of constructal
distributors to a mini crossflowheat exchanger and their assembly configuration
optimization, Chemical Engineering Science 62, p. 3605 – 3619
Huanga, C.M., Shya, S.S., Li, H.H. and Leec, C.H., (2010), The impact of flow distributors
on the performance of planar solid oxide fuel cell, J. Power Sources 195, pp. 6280–
6286
Liu, H., Li, P. and Lew, J.V., (2010), CFD study on flow distribution uniformity in fuel
distributors having multiple structural bifurcations of flow channels, Int. J.
Hydrogen Energy 35, p. 9186-9198.
Vangelooven, J. and Desmet, G., (2010), Computer aided design optimisation of
microfluidic flow distributors, J. Chromatography A 1217, p. 6724–6732
Ramos-Alvarado, B. , Hernandez-Guerrero, A., Elizalde-Blancas, F. and Ellis, M.W.,
(2011), Constructal flow distributor as a bipolar plate for proton exchange
membrane fuel cells, Int. J. Hydrogen Energy 36, p. 12965-12976
Vakhshouri, K. and Grace, J.R., (2010), Effects of the plenum chamber volume and
distributor geometry on fluidized bed hydrodynamics, J. Particuology 8, p. 2–12
Xuliang, Y., Yuemin, Z., Zhenfu, L., Zengqiang, C. and Shulei, S., (2011), Effects of
sintered metal distributor on fluidization quality of the air dense medium fluidized
bed, J. Mining Science and Technology (China) 21, p. 681–685
Lühong, Z., Guohua, G., Hong, S., Hong, L. and Xingang, L., (2011), CFD Simulation and
Experimental Validation of Fluid Flow in Pre-distributor, Chinese J. Chemical
Engineering, 19(5), p. 815-820
11
Tseng, C.J., Tsai, B.T., Liu, Z.S., Cheng, T.C., Chang, W.C. and Lo, S.K., (2012), A PEM
fuel cell with metal foam as flow distributor, J. Energy Conversion and
Management 62, p. 14–21
Jithesh, P.K., Bansode, A.S., Sundararajan, T. and Das, S.K., (2012), The effect of flow
distributors on the liquid water distribution and performance of a PEM fuel cell, Int.
J. Hydrogen Energy 37, p. 17158-17171
Zhang, X.H. and Lv, N., (2012), Three-dimensional multi-scale fluid distributor assembly
minimizing total viscous dissipation, Int. Comm.in Heat and Mass Transfer 39, p.
1535–1541
Sukas, S., Desmet, G. and Gardeniers, H.J.G.E., (2013), Design and implementation of
injector/distributor structures for microfabricated non-porous pillar columns for
capillary electrochromatography, J. Chromatography A, 1289, p. 80– 87
Hoang, D. A., Haringa, C., Portela, L.M., Kreutzer, M.T., Kleijn, C.R. and van Steijn V.,
(2014), Design and characterization of bubble-splitting distributor for scaled-out
multiphase microreactors, Chemical Engineering Journal 236 , p. 545–554
Ji, L., Wua, B., Chena, K., Zhua, J. and Liu, H., (2009), Momentum correction coefficient
for two jet flows mixing in a tee junction, Chemical Engineering research and
design 87, p. 1065–1068
Azzi, A., Al-Attiyah, A., Qi, L., Cheema, W. and Azzopardi, B.J., (2010), Gas–liquid two-
phase flow division at a micro-T-junction, Chemical Engineering Science 65, p.
3986–3993
He, K., Wang, S. and Huang, J., (2011), The effect of flow pattern on split of two-phase
flow through a micro-T-junction, Int. J. Heat and Mass Transfer 54, p. 3587–3593
He, K., Wang, S. and Huang, J., (2011), The effect of surface tension on phase distribution
of two-phase flow in a micro-T-junction, Chemical Engineering Science 66, p.
3962–3968
Wang, S., Huang, J., He, K. and Chen, J., (2011), Phase split of nitrogen/non-Newtonian
fluid two-phase flow at a micro-T-junction, Int. J. Multiphase Flow 37, p.1129–
1134
12
Mohamed, M.A., Soliman, H.M. and Sims, G.E., (2011), Experimental investigation of
two-phase flow splitting in an equal-sided impacting tee junction with inclined
outlets, Experimental Thermal and Fluid Science 35, p. 1193–1201
Wang, S., He, K. and Huang, J., (2011), Phase splitting of a slug–annular flow at a
horizontal micro-T-junction, Int. J. Heat and Mass Transfer 54, p. 589–596
Elazhary, A.M. and Soliman, H.M., (2012), Single- and two-phase pressure losses in a
horizontal mini-size impacting tee junction with a rectangular cross-section,
Experimental Thermal and Fluid Science 41, p. 67–76
Elazhary, A.M. and Soliman, H.M., (2012), Two-phase flow in a horizontal mini-size
impacting T-junction with a rectangular cross-section, Int. J. Multiphase Flow 42, p.
104–114
Mohamed, M.A., Soliman, H.M. and Sims, G.E., (2012), Conditions for complete phase
separation in an impacting tee junction at various inclinations of the outlet arms, Int.
J. Multiphase Flow 47, p. 66–72
Reis, d.E. and Goldstein Jr., L., (2013), Fluid dynamics of horizontal air–water slug flows
through a dividing T-junction, Int. J. Multiphase Flow 50, p. 58–70
Chen, J., Wang, S., Ke, H., Cai, S. and Zhao, Y., (2013), Gas–liquid two-phase flow
splitting at microchannel junctions with different branch angles, Chemical
Engineering Science 104, p. 881–890
Tuo, H. and Hrnjak, P., (2014), Vaporeliquid separation in a vertical impact T-junction for
vapor compression systems with flash gas bypass, Int. J. Refrigeration 40, p. 189-
200
Tuo, H. and Hrnjak, P., (2014), Enhancement of vapor-liquid separation in vertical impact
T-junctions for vapor compression systems with flash gas bypass, Int. J.
Refrigeration 40, p. 43-50
Mohamed, M.A., Soliman, H.M. and Sims, G.E., (2014), Effects of pipe size and system
pressure on the phase redistribution in horizontal impacting tee junctions,
Experimental Thermal and Fluid Science 54, p. 219–224
Teplotex@
, http://www.teplotex.ru/index.php?id=63
Chapter 2 Two-Phase Flow Model and Modeling 2.1 Flow pattern
Two-phase flow is flow of pair immiscible fluid. The flow can be encountered
external devices or internally. The pair immiscible fluid may content; liquid-liquid
(refrigerant-oil in refrigeration system), liquid-solid (water-slag in engine cooling system),
gas-solid (air-coal in pneumatic conveyor) or gas-liquid (steam-water in steam power
cycle). Here, the study is emphasized on two-phase flow of gas-liquid. Mostly, in the
authentic gas-liquid two-phase flow process sink or release heat. If the heat is sunk, called
evaporation and another one is condensation, in which the heat is discarded.
The evaporation and condensation is very complicated processes, since the fluid
transform from liquid to gas or vice versa. Therefore, the basic fundamentals two-phase
flow theory is derived from adiabatic two-phase flow. Air-water is the most pair immiscible
fluid, used as experiment since decades, due to their unique. Air and water have contras in
properties, appendix 1. Therefore, this combination promotes stability two-phase form,
resulting better investigation.
If the air and water pass through a tube in different velocity, than they form unique
gas-liquid configuration. It is termed; flow-pattern. It has been investigated since several
decades.
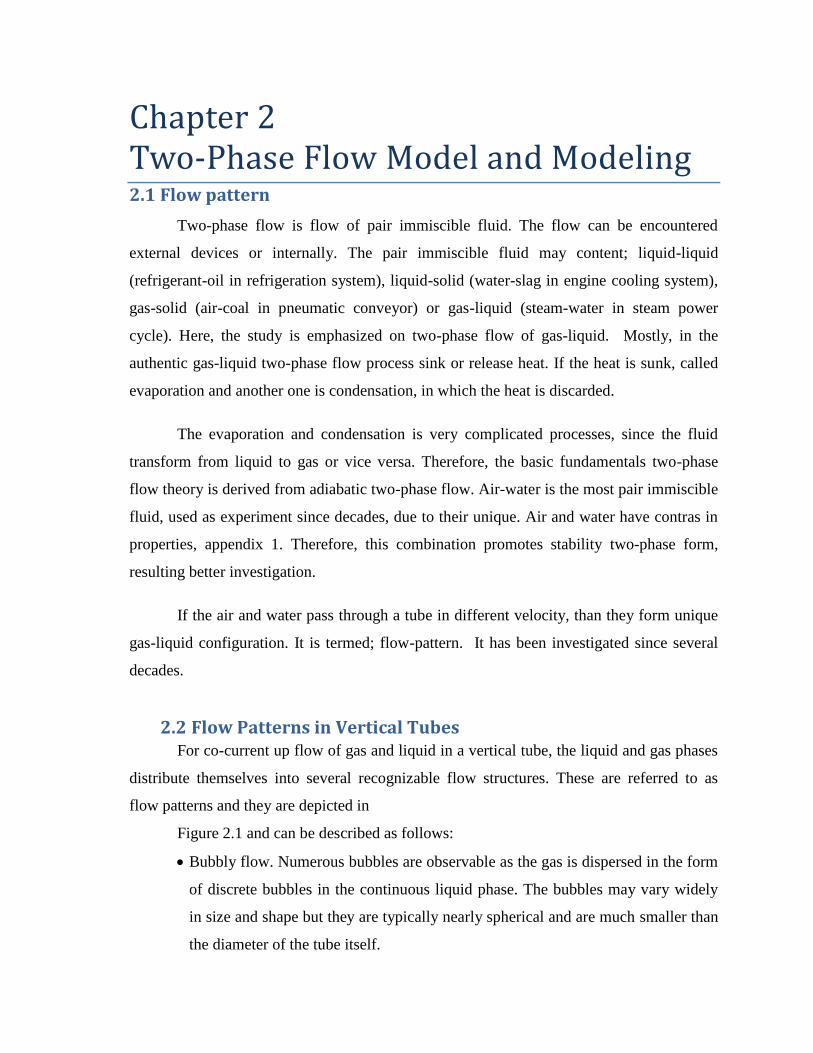
2.2 Flow Patterns in Vertical Tubes For co-current up flow of gas and liquid in a vertical tube, the liquid and gas phases
distribute themselves into several recognizable flow structures. These are referred to as
flow patterns and they are depicted in
Figure 2.1 and can be described as follows:
Bubbly flow. Numerous bubbles are observable as the gas is dispersed in the form
of discrete bubbles in the continuous liquid phase. The bubbles may vary widely
in size and shape but they are typically nearly spherical and are much smaller than
the diameter of the tube itself.
14
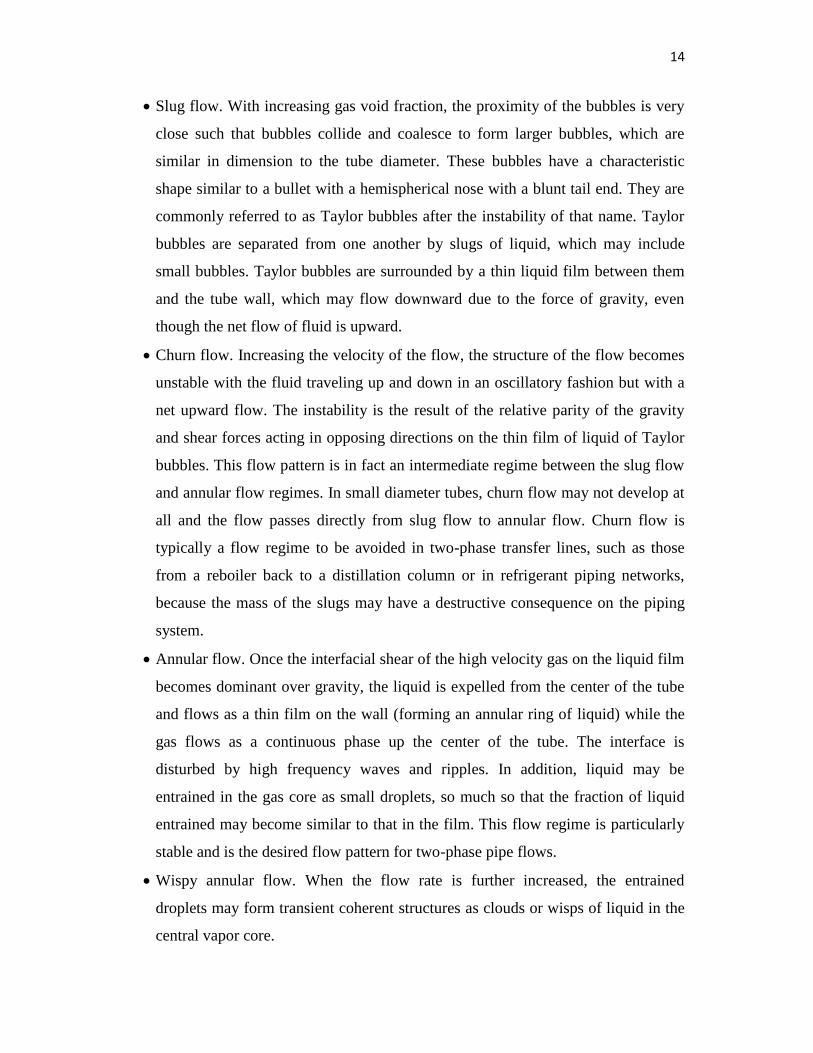
Slug flow. With increasing gas void fraction, the proximity of the bubbles is very
close such that bubbles collide and coalesce to form larger bubbles, which are
similar in dimension to the tube diameter. These bubbles have a characteristic
shape similar to a bullet with a hemispherical nose with a blunt tail end. They are
commonly referred to as Taylor bubbles after the instability of that name. Taylor
bubbles are separated from one another by slugs of liquid, which may include
small bubbles. Taylor bubbles are surrounded by a thin liquid film between them
and the tube wall, which may flow downward due to the force of gravity, even
though the net flow of fluid is upward.
Churn flow. Increasing the velocity of the flow, the structure of the flow becomes
unstable with the fluid traveling up and down in an oscillatory fashion but with a
net upward flow. The instability is the result of the relative parity of the gravity
and shear forces acting in opposing directions on the thin film of liquid of Taylor
bubbles. This flow pattern is in fact an intermediate regime between the slug flow
and annular flow regimes. In small diameter tubes, churn flow may not develop at
all and the flow passes directly from slug flow to annular flow. Churn flow is
typically a flow regime to be avoided in two-phase transfer lines, such as those
from a reboiler back to a distillation column or in refrigerant piping networks,
because the mass of the slugs may have a destructive consequence on the piping
system.
Annular flow. Once the interfacial shear of the high velocity gas on the liquid film
becomes dominant over gravity, the liquid is expelled from the center of the tube
and flows as a thin film on the wall (forming an annular ring of liquid) while the
gas flows as a continuous phase up the center of the tube. The interface is
disturbed by high frequency waves and ripples. In addition, liquid may be
entrained in the gas core as small droplets, so much so that the fraction of liquid
entrained may become similar to that in the film. This flow regime is particularly
stable and is the desired flow pattern for two-phase pipe flows.
Wispy annular flow. When the flow rate is further increased, the entrained
droplets may form transient coherent structures as clouds or wisps of liquid in the
central vapor core.
15
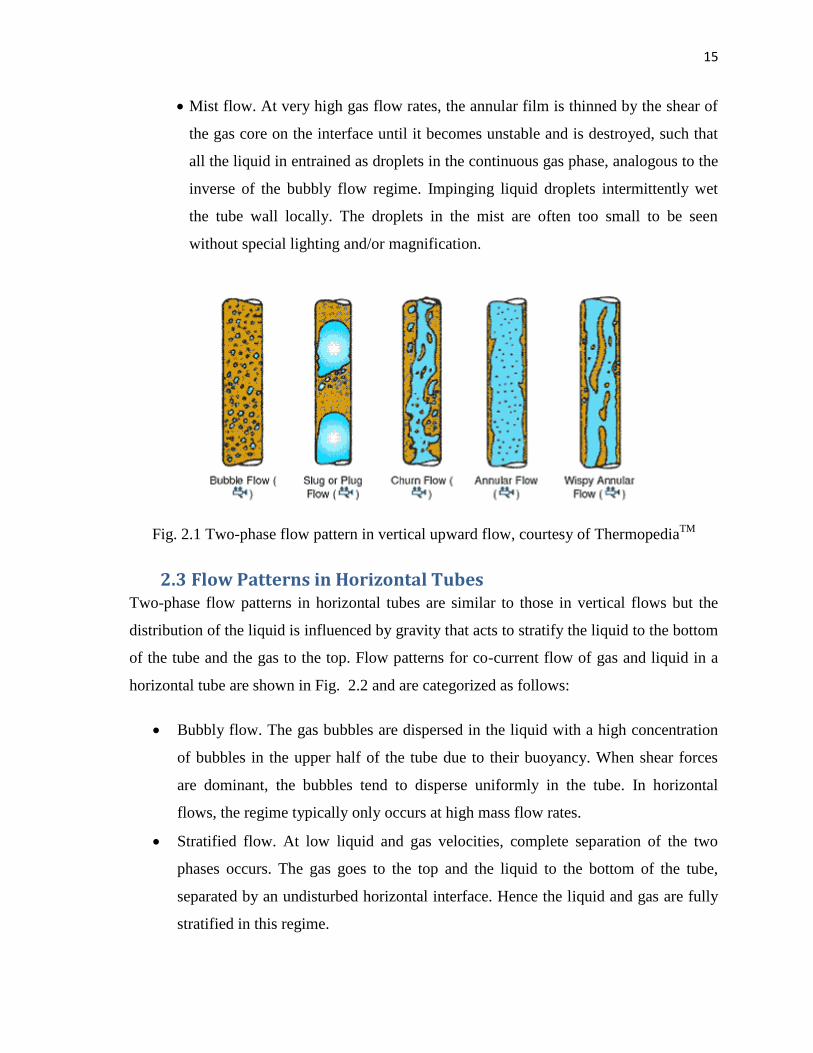
Mist flow. At very high gas flow rates, the annular film is thinned by the shear of
the gas core on the interface until it becomes unstable and is destroyed, such that
all the liquid in entrained as droplets in the continuous gas phase, analogous to the
inverse of the bubbly flow regime. Impinging liquid droplets intermittently wet
the tube wall locally. The droplets in the mist are often too small to be seen
without special lighting and/or magnification.
Fig. 2.1 Two-phase flow pattern in vertical upward flow, courtesy of ThermopediaTM
2.3 Flow Patterns in Horizontal Tubes Two-phase flow patterns in horizontal tubes are similar to those in vertical flows but the
distribution of the liquid is influenced by gravity that acts to stratify the liquid to the bottom
of the tube and the gas to the top. Flow patterns for co-current flow of gas and liquid in a
horizontal tube are shown in Fig. 2.2 and are categorized as follows:
Bubbly flow. The gas bubbles are dispersed in the liquid with a high concentration
of bubbles in the upper half of the tube due to their buoyancy. When shear forces
are dominant, the bubbles tend to disperse uniformly in the tube. In horizontal
flows, the regime typically only occurs at high mass flow rates.
Stratified flow. At low liquid and gas velocities, complete separation of the two
phases occurs. The gas goes to the top and the liquid to the bottom of the tube,
separated by an undisturbed horizontal interface. Hence the liquid and gas are fully
stratified in this regime.
16
Stratified-wavy flow. Increasing the gas velocity in a stratified flow, waves are
formed on the interface and travel in the direction of flow. The amplitude of the
waves is notable and depends on the relative velocity of the two phases; however,
their crests do not reach the top of the tube. The waves climb up the sides of the
tube, leaving thin films of liquid on the wall after the passage of the wave.
Intermittent flow. Further increasing the gas velocity, these interfacial waves
become large enough to wash the top of the tube. This regime is characterized by
large amplitude waves intermittently washing the top of the tube with smaller
amplitude waves in between. Large amplitude waves often contain entrained
bubbles. The top wall is nearly continuously wetted by the large amplitude waves
and the thin liquid films left behind. Intermittent flow is also a composite of the plug
and slug flow regimes. These subcategories are characterized as follows:
o Plug flow. This flow regime has liquid plugs that are separated by elongated
gas bubbles. The diameters of the elongated bubbles are smaller than the
tube such that the liquid phase is continuous along the bottom of the tube
below the elongated bubbles. Plug flow is also sometimes referred to as
elongated bubble flow.
o Slug flow. At higher gas velocities, the diameters of elongated bubbles
become similar in size to the channel height. The liquid slugs separating
such elongated bubbles can also be described as large amplitude waves.
Annular flow. At even larger gas flow rates, the liquid forms a continuous annular
film around the perimeter of the tube, similar to that in vertical flow but the liquid
film is thicker at the bottom than the top. The interface between the liquid annulus
and the vapor core is disturbed by small amplitude waves and droplets may be
dispersed in the gas core. At high gas fractions, the top of the tube with its thinner
film becomes dry first, so that the annular film covers only part of the tube
perimeter and thus this is then classified as stratified-wavy flow.
Mist flow. Similar to vertical flow, at very high gas velocities, all the liquid may be
stripped from the wall and entrained as small droplets in the now continuous gas
phase.
17
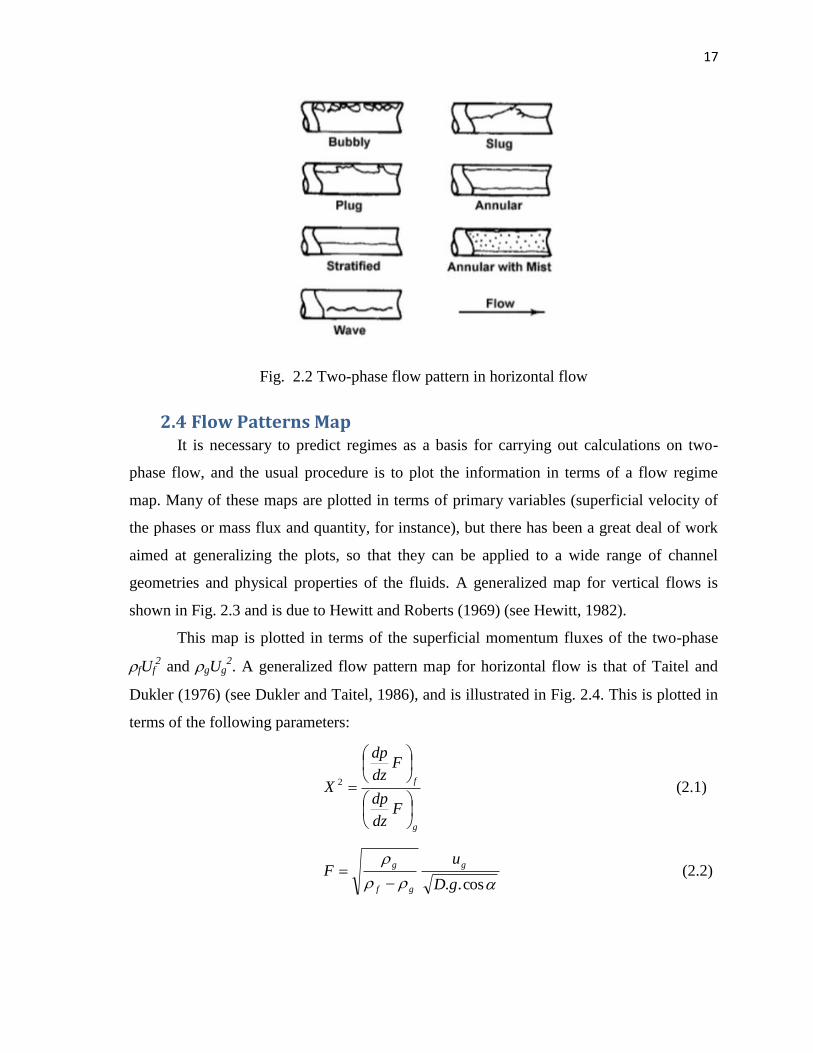
Fig. 2.2 Two-phase flow pattern in horizontal flow
2.4 Flow Patterns Map It is necessary to predict regimes as a basis for carrying out calculations on two-
phase flow, and the usual procedure is to plot the information in terms of a flow regime
map. Many of these maps are plotted in terms of primary variables (superficial velocity of
the phases or mass flux and quantity, for instance), but there has been a great deal of work
aimed at generalizing the plots, so that they can be applied to a wide range of channel
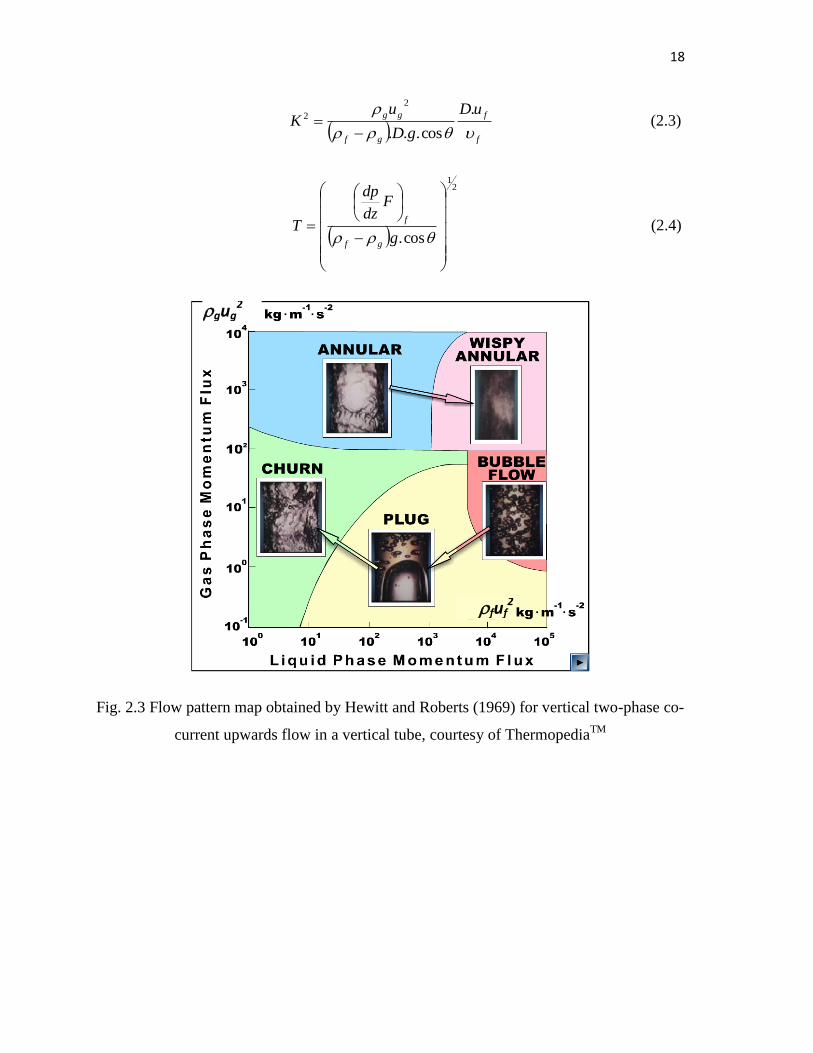
geometries and physical properties of the fluids. A generalized map for vertical flows is
shown in Fig. 2.3 and is due to Hewitt and Roberts (1969) (see Hewitt, 1982).
This map is plotted in terms of the superficial momentum fluxes of the two-phase
fUf2 and gUg
2. A generalized flow pattern map for horizontal flow is that of Taitel and
Dukler (1976) (see Dukler and Taitel, 1986), and is illustrated in Fig. 2.4. This is plotted in
terms of the following parameters:
g
f
Fdz
dp
Fdz
dp
X
2 (2.1)
cos..gD
uF
g
gf
g
(2.2)
18
f
f
gf
gg uD
gD
uK
.
cos...
2
2
(2.3)
21
cos.
g
Fdz
dp
Tgf
f (2.4)
Fig. 2.3 Flow pattern map obtained by Hewitt and Roberts (1969) for vertical two-phase co-
current upwards flow in a vertical tube, courtesy of ThermopediaTM
gug2
fuf2
19
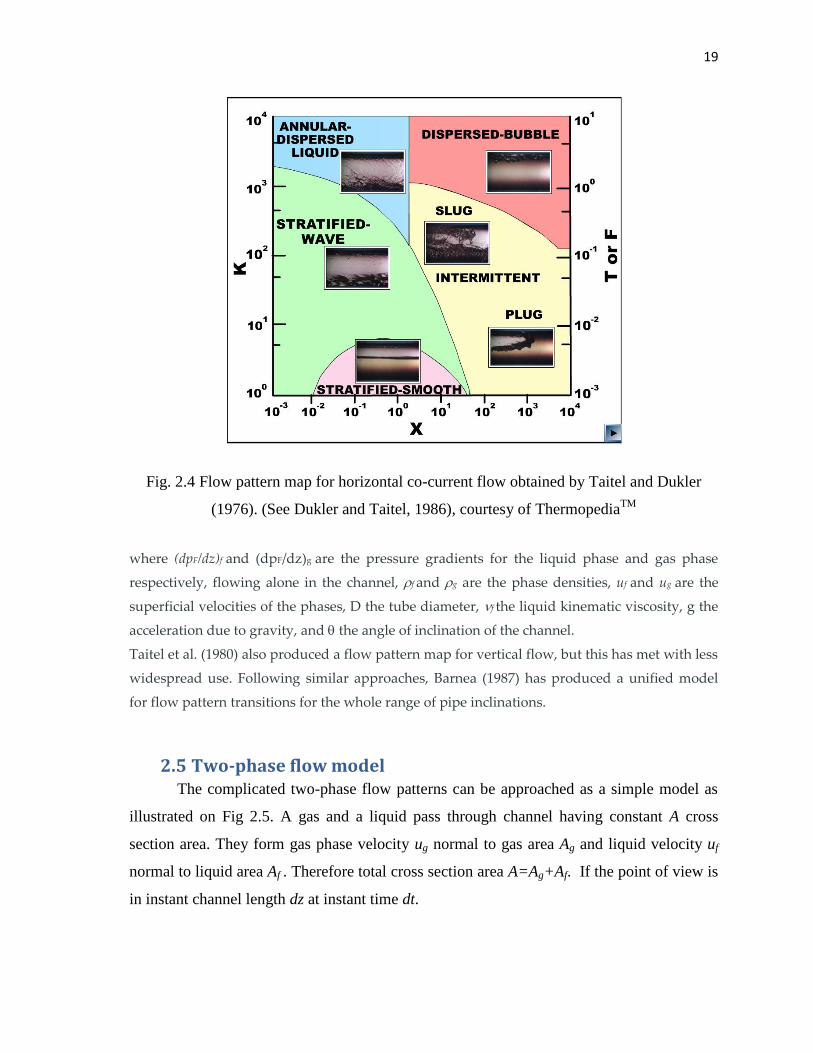
Fig. 2.4 Flow pattern map for horizontal co-current flow obtained by Taitel and Dukler
(1976). (See Dukler and Taitel, 1986), courtesy of ThermopediaTM
where (dpF/dz)f and (dpF/dz)g are the pressure gradients for the liquid phase and gas phase
respectively, flowing alone in the channel, f and g are the phase densities, uf and ug are the
superficial velocities of the phases, D the tube diameter, f the liquid kinematic viscosity, g the
acceleration due to gravity, and the angle of inclination of the channel.
Taitel et al. (1980) also produced a flow pattern map for vertical flow, but this has met with less
widespread use. Following similar approaches, Barnea (1987) has produced a unified model
for flow pattern transitions for the whole range of pipe inclinations.
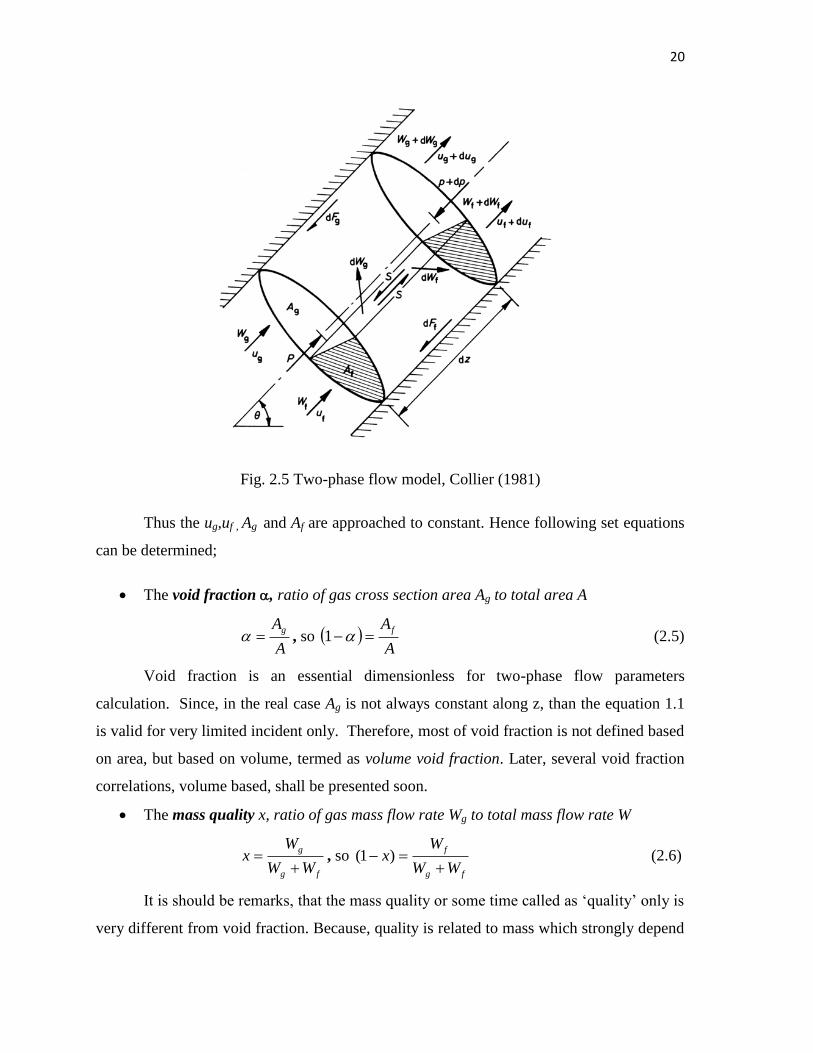
2.5 Two-phase flow model The complicated two-phase flow patterns can be approached as a simple model as
illustrated on Fig 2.5. A gas and a liquid pass through channel having constant A cross
section area. They form gas phase velocity ug normal to gas area Ag and liquid velocity uf
normal to liquid area Af . Therefore total cross section area A=Ag+Af. If the point of view is
in instant channel length dz at instant time dt.
20
Fig. 2.5 Two-phase flow model, Collier (1981)
Thus the ug,uf , Ag and Af are approached to constant. Hence following set equations
can be determined;
The void fraction , ratio of gas cross section area Ag to total area A
A
Ag , so
A
Af1 (2.5)
Void fraction is an essential dimensionless for two-phase flow parameters
calculation. Since, in the real case Ag is not always constant along z, than the equation 1.1
is valid for very limited incident only. Therefore, most of void fraction is not defined based
on area, but based on volume, termed as volume void fraction. Later, several void fraction
correlations, volume based, shall be presented soon.
The mass quality x, ratio of gas mass flow rate Wg to total mass flow rate W
fg
g
WW
Wx
, so
fg
f
WW
Wx
)1( (2.6)
It is should be remarks, that the mass quality or some time called as ‘quality’ only is
very different from void fraction. Because, quality is related to mass which strongly depend
21
on density . However, both of quality and void fraction have particular proportionality,
which will be discussed, later.
The mass velocity
u
uA
WG (2.7)
The mass flow rate
GAxWg and )1( xGAW f (2.8)
The phase velocity
gg
g
gA
Wu
and
ff
f
fA
Wu
(2.9)
Where, the mass flow W is proportional to quantity, volume flow rate Q than;
g
g
gA
Qu and
f
f
fA
Qu (2.10)
Therefore, the phase velocity can be formed as function of void fraction and quality,
u=f(, x);
g
g
Gxu and
)1(
)1(
f
f
xGu (2.11)
The volumetric quality
fg
g
Q
so
fg
f
Q
)1( (2.12)
All of forgoing equations are based on phase area (Ag and Af), in which is vary along
channel length z and time t. Accordingly, it is urgent to simply the equation based on total
cross section area A which is equal to tube cross section area, constant. This is superficial
velocity parameter j.
The volumetric flux or the superficial velocity, j
A
Qj , so
A
Qj
g
g and A
Qj
f
f (2.13)
g
gg
Gxjuj
and
f
ff
xGjuj
)1()1()1(
(2.14)
GxjG ggg , )1( xGjG fff in which fg GGG (2.15)
22
Superficial velocity is very important parameter for defining the phases velocity ug
and uf , by condition of which void fraction is known. Also, superficial velocity is easy
parameter to calculate, since the variables are easy to measure, as following measured
variables, quantity Q. This work, quantity of each phase was measured carefully, by means,
the phase is separated in separator tube, followed by quantifying liquid and gas volume Vg
and Vf in certain time interval and the last phase quantity is determined by;
g
g
gt
VQ and
f
f
ft
VQ (2.16)
Since the gas and liquid velocity is different. It is very important to define ratio in
between gas velocity ug and liquid velocity uf, termed as the slip factor S
The slip ratio
1
1 g
f
ggf
ffg
f
g
x
x
AW
AW
u
uS (2.17)
Later, the control volume of instant two-phase flow in Fig. 2.5 can be solved
analytically.
Total pressure drop (overall static pressure gradient) is ;
z
dz
dpa
dz
dpF
dz
dp
dz
dp
(2. 18)
The term
F
dz
dprepresent frictional pressure drop, while
The net frictional force acting on each phase;
dzgFdz
dpASdF gg
)( ; dzfF
dz
dpASdF ff
)( (2.19)
dzFdz
dpAdFdF fg
)( (2.20)
23
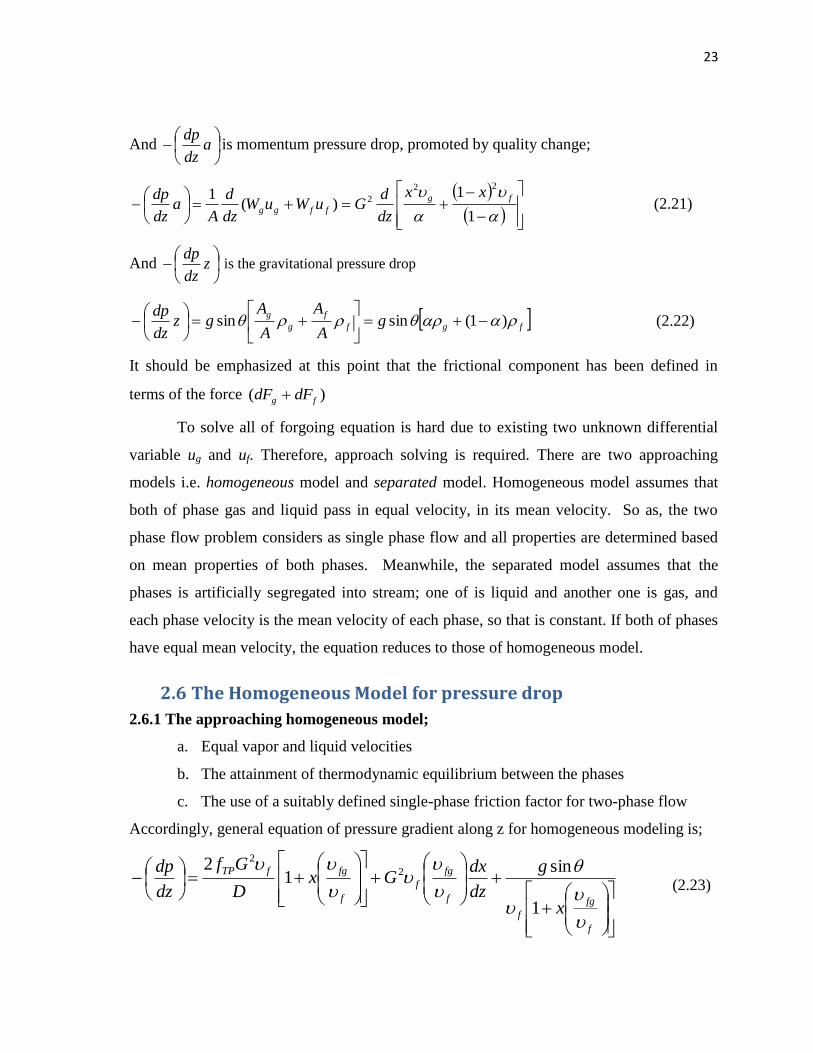
And
a
dz
dpis momentum pressure drop, promoted by quality change;
1
1)(
122
2 fg
ffgg
xx
dz
dGuWuW
dz
d
Aa
dz
dp (2.21)
And
z
dz
dp is the gravitational pressure drop
fgf
f
g
gg
A
A
A
Agz
dz
dp )1(sinsin
(2.22)
It should be emphasized at this point that the frictional component has been defined in
terms of the force )( fg dFdF
To solve all of forgoing equation is hard due to existing two unknown differential
variable ug and uf. Therefore, approach solving is required. There are two approaching
models i.e. homogeneous model and separated model. Homogeneous model assumes that
both of phase gas and liquid pass in equal velocity, in its mean velocity. So as, the two
phase flow problem considers as single phase flow and all properties are determined based
on mean properties of both phases. Meanwhile, the separated model assumes that the
phases is artificially segregated into stream; one of is liquid and another one is gas, and
each phase velocity is the mean velocity of each phase, so that is constant. If both of phases
have equal mean velocity, the equation reduces to those of homogeneous model.
2.6 The Homogeneous Model for pressure drop
2.6.1 The approaching homogeneous model;
a. Equal vapor and liquid velocities
b. The attainment of thermodynamic equilibrium between the phases
c. The use of a suitably defined single-phase friction factor for two-phase flow
Accordingly, general equation of pressure gradient along z for homogeneous modeling is;
f
fg
f
f
fg
f
f
fgfTP
x
g
dz
dxGx
D
Gf
dz
dp
1
sin1
22
2
(2.23)
24
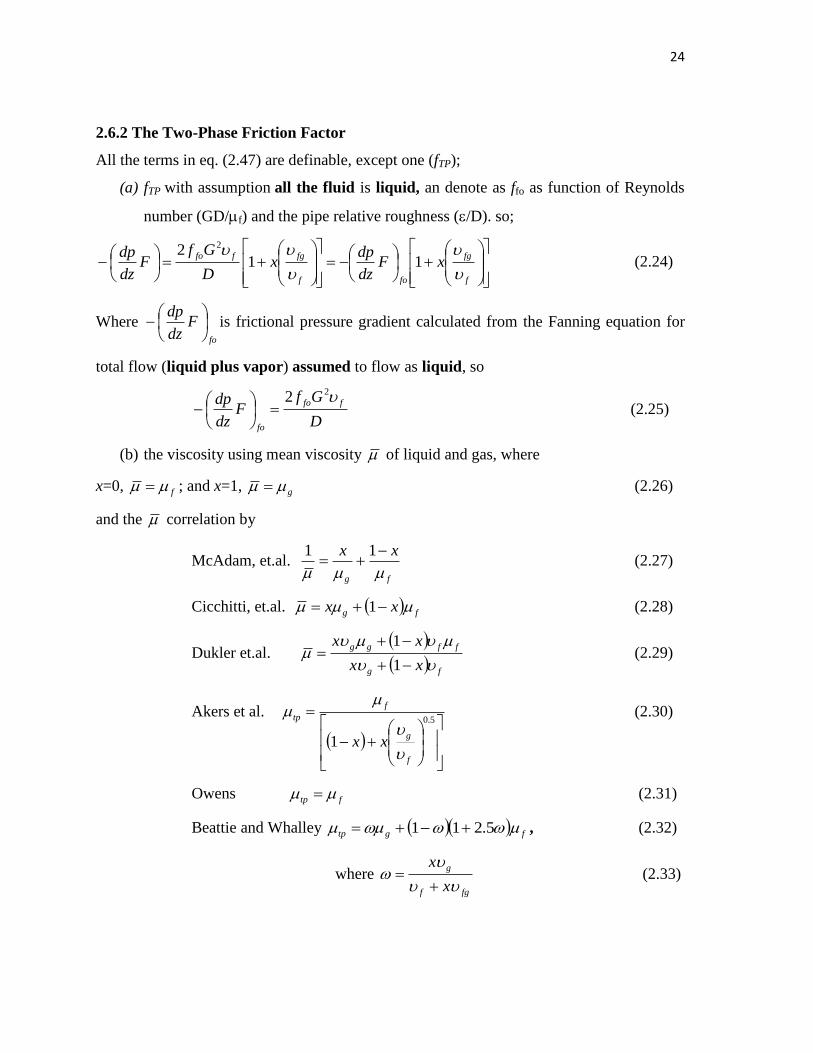
2.6.2 The Two-Phase Friction Factor
All the terms in eq. (2.47) are definable, except one (fTP);
(a) fTP with assumption all the fluid is liquid, an denote as ffo as function of Reynolds
number (GD/f) and the pipe relative roughness (/D). so;
f
fg
fof
fgffoxF
dz
dpx
D
GfF
dz
dp
11
2 2
(2.24)
Where fo
Fdz
dp
is frictional pressure gradient calculated from the Fanning equation for
total flow (liquid plus vapor) assumed to flow as liquid, so
D
GfF
dz
dp ffo
fo
22
(2.25)
(b) the viscosity using mean viscosity of liquid and gas, where
x=0, f ; and x=1, g (2.26)
and the correlation by
McAdam, et.al. fg
xx
11 (2.27)
Cicchitti, et.al. fg xx 1 (2.28)
Dukler et.al.
fg
ffgg
xx
xx
1
1 (2.29)
Akers et al.
5.0
1f
g
f
tp
xx
(2.30)
Owens ftp (2.31)
Beattie and Whalley fgtp 5.211 , (2.32)
where fgf
g
x
x
(2.33)
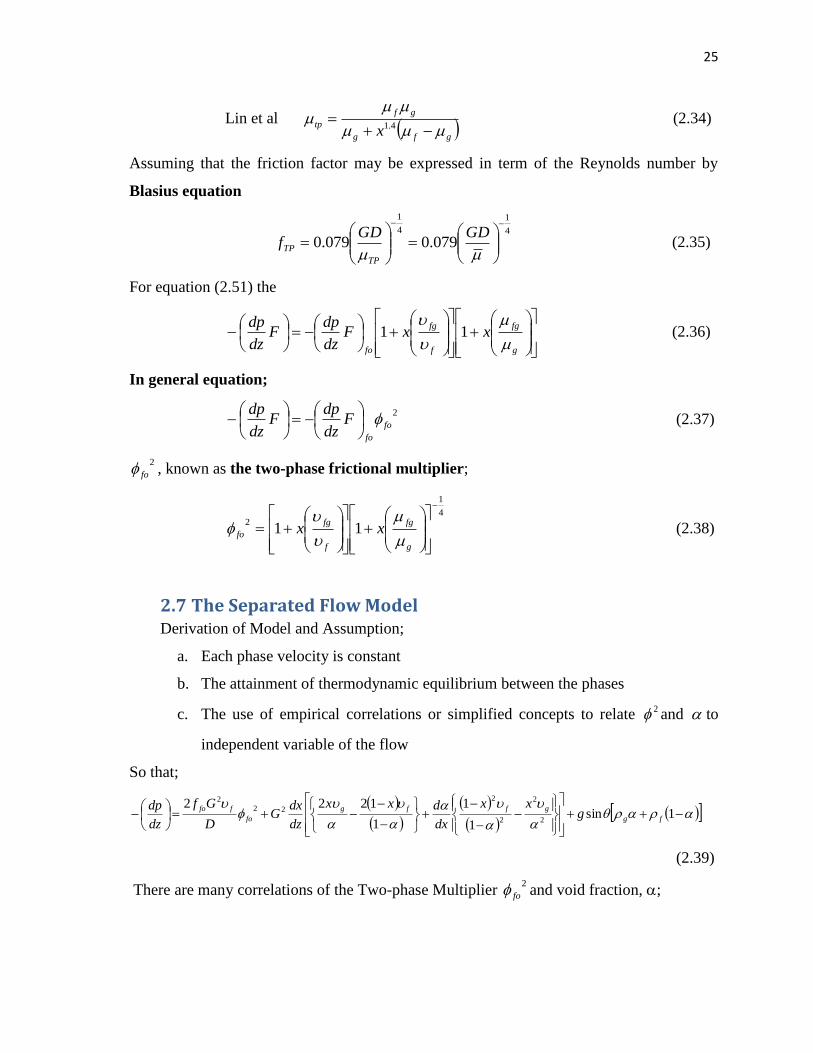
25
Lin et al gfg
gf
tpx
4.1 (2.34)
Assuming that the friction factor may be expressed in term of the Reynolds number by
Blasius equation
4
1
4
1
079.0079.0
GDGDf
TP
TP (2.35)
For equation (2.51) the
g
fg
f
fg
fo
xxFdz
dpF
dz
dp
11 (2.36)
In general equation;
2
fo
fo
Fdz
dpF
dz
dp
(2.37)
2
fo , known as the two-phase frictional multiplier;
4
1
211
g
fg
f
fg
fo xx
(2.38)
2.7 The Separated Flow Model Derivation of Model and Assumption;
a. Each phase velocity is constant
b. The attainment of thermodynamic equilibrium between the phases
c. The use of empirical correlations or simplified concepts to relate 2 and to
independent variable of the flow
So that;
1sin
1
1
1
12222
2
2
2
22
2
fg
gffg
fo
ffog
xx
dx
dxx
dz
dxG
D
Gf
dz
dp
(2.39)
There are many correlations of the Two-phase Multiplier 2
fo and void fraction, ;
26
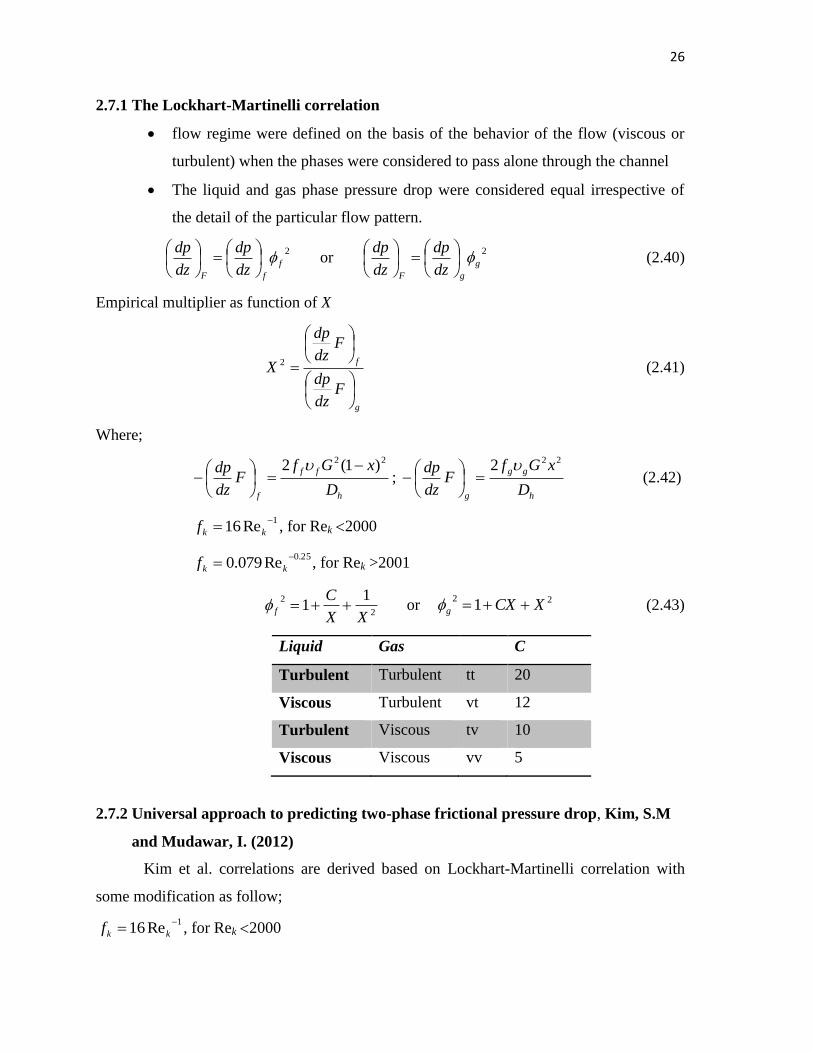
2.7.1 The Lockhart-Martinelli correlation
flow regime were defined on the basis of the behavior of the flow (viscous or
turbulent) when the phases were considered to pass alone through the channel
The liquid and gas phase pressure drop were considered equal irrespective of
the detail of the particular flow pattern.
2
f
fF dz
dp
dz
dp
or
2
g
gF dz
dp
dz
dp
(2.40)
Empirical multiplier as function of X
g
f
Fdz
dp
Fdz
dp
X
2 (2.41)
Where;
h
ff
f D
xGfF
dz
dp22 )1(2
;
h
gg
g D
xGfF
dz
dp222
(2.42)
1Re16
kkf , for Rek 2000
25.0Re079.0
kkf , for Rek >2001
2
2 11
XX
Cf or
221 XCXg (2.43)
Liquid Gas C
Turbulent Turbulent tt 20
Viscous Turbulent vt 12
Turbulent Viscous tv 10
Viscous Viscous vv 5
2.7.2 Universal approach to predicting two-phase frictional pressure drop, Kim, S.M
and Mudawar, I. (2012)
Kim et al. correlations are derived based on Lockhart-Martinelli correlation with
some modification as follow;
1Re16
kkf , for Rek 2000
27
25.0Re079.0
kkf , for 2000≤ Rek 20,000
2.0Re046.0
kkf , for Rek 20,000
For laminar flow in rectangular channel
)2537.09564.07012.19467.13553.11(24Re 5432 kkf (2.44)
Where subscript k denotes f or g for liquid and vapor phases, respectively
f
hf
DxG
1Re ,
g
hg
GxD
Re ,
f
hfo
GD
Re , Suratman number
2
g
hg
go
DSu
(2.45)
Liquid Gas(Vapor) C
Turbulent Turbulent
35.0
10.003.0Re39.0
g
f
gofo Su
(2.46)
Turbulent Laminar
14.0
50.017.04 Re107.8
g
f
gofo Sux
(2.47)
Laminar Turbulent
36.0
19.059.0Re0015.0
g
f
gofo Su
(2.48)
Laminar Laminar
48.0
50.044.05 Re105.3
g
f
gofo Sux
(2.49)
2.7.3 Other proper correlations
1. Friedel (D>4mm, air-water,air-oil,R-12)
2
fo
foF dz
dp
dz
dp
(2.50)
035.0045.0
7.019.091.0
224.078.02221124.31
tptp
f
g
f
g
f
g
fo
go
f
g
fo WeFrxxf
fxx
(2.51)
2
2
Hh
tpgD
GFr
,
H
htp
DGWe
2
, fg
Hxx
1
1,
g
hgo
GD
Re (2.52)
2. Muller-Steinhagen and Heck
28
(D=4-392 mm, air-water, water, hydrocarbon, refrigerant)
33/112 x
dz
dpxx
dz
dp
dz
dp
dz
dp
dz
dp
gofogofoF
(2.53)
3. Lee and Lee (Dh=0.78-6.67mm, Air-water)
2
f
fF dz
dp
dz
dp
(2.54)
2
2 11
XX
Cf ,
ff j ,
hf
f
D
2
(2.55)
557.0719.0317.18 Re10833.6 fovvC ,
174.0Re627.3 fotvC (2.56)
726.02 Re10185.6 fovtC ,
451.0Re048.0 fottC (2.57)
4. Chen (D=1.02-9mm, adiabatic, air-water, R410A, Ammonia)
FriedelfoF dz
dp
dz
dp
,
,
2
2/hgf
DgBo (2.58)
For Bo*<2.5 *09.0
45.0
4.01Re
Re0333.0
Bo
g
fo
e (2.59)
For Bo*2.5
Bo
Wetp
06.05.2
2.0
(2.60)
5. Sun and Mishima (Dh=0.506-12mm, Air-water, Refrigerant, CO2)
2
f
fF dz
dp
dz
dp
,
2
2 11
XX
Cf ,
5.04.0
1
Re
Re79.1
x
xC
f
g(2.61)
f
hf
DxG
1Re ,
g
hg
GxD
Re (2.62)
2.8 Void Fraction
1 Homogeneous Model
l
g
x
x
1
1
1 (2.63)
29
2 Zivi Void fraction
32
11
1
l
g
x
x
(2.64)
3 Smith Void fraction
1
14.01
14.0
6.04.01
1
x
x
x
x
x
x g
l
l
g
(2.65)
Homogenous model suitable for Bubbly and Disperse models
4. Local Void Fraction Using Drift Model
1
1
m
UxxC
x GU
LG
o
G
(2.66)
Valuable only if UUGU 05.0
At elevated pressure, Zuber (1967);
13.1oC With 4
1
241.1
L
GLGU
gU
(2.67)
Regardless flow regime.
This also can be implemented for bubbly flow, vertical up flow, with particular value of Co
Geometry In-dim (mm) Co Pr ,Reduced pressure
Tube 50 Co=1-0.5Pr Except for Pr0.5, where Co=1.2
Tube 50 Co=1.2 for Pr
Tube 50 Co=1.2-0.4(Pr-0.5) for Pr >0.5
Rectangular Co=1.4-0.4(Pr-0.5)
For bubbly flow, vertical up flow, Wallis (1969);
0.1oC ; 4
1
253.1
L
GLGU
gU
(2.68)
2
41
mcmc dA , 2
41
cc dA , ggg QW , fff QW
30
2.9 Uniformity Distribution
Uniformity distribution in between two outlet channels is equated
gcd
gcd
QQR
gcu
gcu
g
, and
fcdfcu
fcdfcu
fQQ
QQR
(2.69)
Rg and Rf is dimensionless. If Rg >0, gas phase tend to go to upper channel and vice versa. If
Rg=0, the gas is uniform. Similarly, for Rf is. If Rf >0, liquid phase tend to go to upper
channel and vice versa. If Rf=0, the liquid is uniform
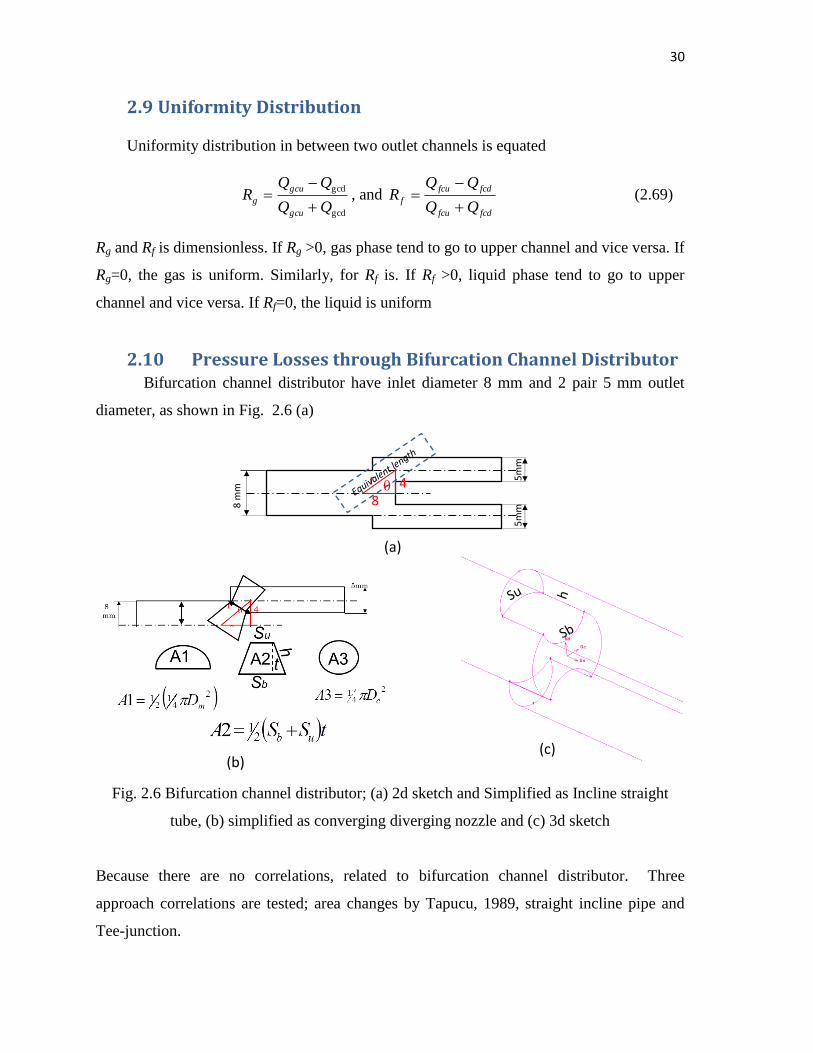
2.10 Pressure Losses through Bifurcation Channel Distributor Bifurcation channel distributor have inlet diameter 8 mm and 2 pair 5 mm outlet
diameter, as shown in Fig. 2.6 (a)
Fig. 2.6 Bifurcation channel distributor; (a) 2d sketch and Simplified as Incline straight
tube, (b) simplified as converging diverging nozzle and (c) 3d sketch
Because there are no correlations, related to bifurcation channel distributor. Three
approach correlations are tested; area changes by Tapucu, 1989, straight incline pipe and
Tee-junction.
5m
m
5m
m
8 m
m
8
4 r
(a)
(b) (c)
31
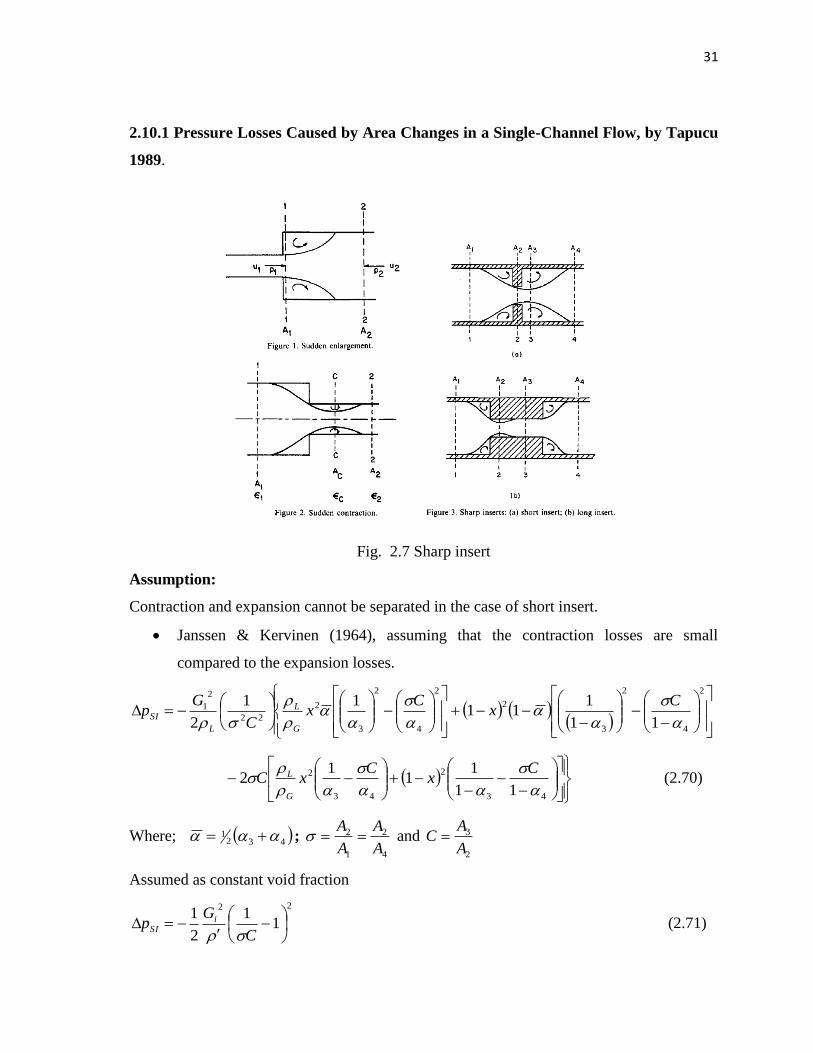
2.10.1 Pressure Losses Caused by Area Changes in a Single-Channel Flow, by Tapucu
1989.
Fig. 2.7 Sharp insert
Assumption:
Contraction and expansion cannot be separated in the case of short insert.
Janssen & Kervinen (1964), assuming that the contraction losses are small
compared to the expansion losses.
2
4
2
3
2
2
4
2
3
2
22
2
1
11
111
11
2
Cx
Cx
C
Gp
G
L
L
SI
43
2
43
2
11
11
12
Cx
CxC
G
L (2.70)
Where; 4321 ;
4
2
1
2
A
A
A
A and
2
3
A
AC
Assumed as constant void fraction
22
11
2
1
C
Gp i
SI
(2.71)
32
If use Momentum Energy Equation of Hewitt & Hall Taylor (1970) based on Jansen
assumption
2
4
2
3
2
2
1
43
2
1
111
2
111
C
G
CGp H
SI (2.72)
Where, 1
2
A
A , and
2
3
A
AC
Assumed as constant void fraction
1
11
12
222
2
1
CC
Gp H
SI
(2.73)
Where momentum specific volume and is defined as
LG
xx
1
122
(2.74)
And
22
3
22
32
1
1
LG
xx
(2.75)
LGH
xx
11 (2.76)
1 , is the momentum density
Assuming a constant void fraction along the duct,
2.10.2 Pressure drop by Energy equation as T-Junction, Hwang et al. (1988)
L
TPi
EiE
iiHom
TPi
GK
GGp
22
2
1,1
2
1,
1
2
,
,
,1
(2.77)
Where E is the energy density, defined as
21
22
3
2
3
1
1
GL
E
xx (2.78)
And K1-i,TP is a two-phase pressure loss coefficient formulated as
SPiTPi KK ,1,1 (2.79)
33
For Annular and churn flows, Rectangular Channel
586.0
1,2
,60.1
Hom
iHomL
(2.80a)
For plug and bubbly flow, Rectangular Channel
146.0
1,2
,57.2
Hom
iHomL
(2.80b)
For circular channel,
1,2
,
Hom
iHomL
(2.81)
For Re 5000, Rectangular channel
2
11
1 744.021.0477.0
W
W
W
Wk ii
i (2.82)
For low Re, round channel;
2
11
1 6924.08285.01
W
W
W
Wk ii
i (2.83)
.i:2,3: Upper chennel, lower channel
1
1
LG
Hom
xx
(2.84)
2.11 Modeling for Internal Flow
2.11.1 Single Phase Flow Modeling
Summarized general conservative equation for single phase flow modeling is described on
Table 2.1;
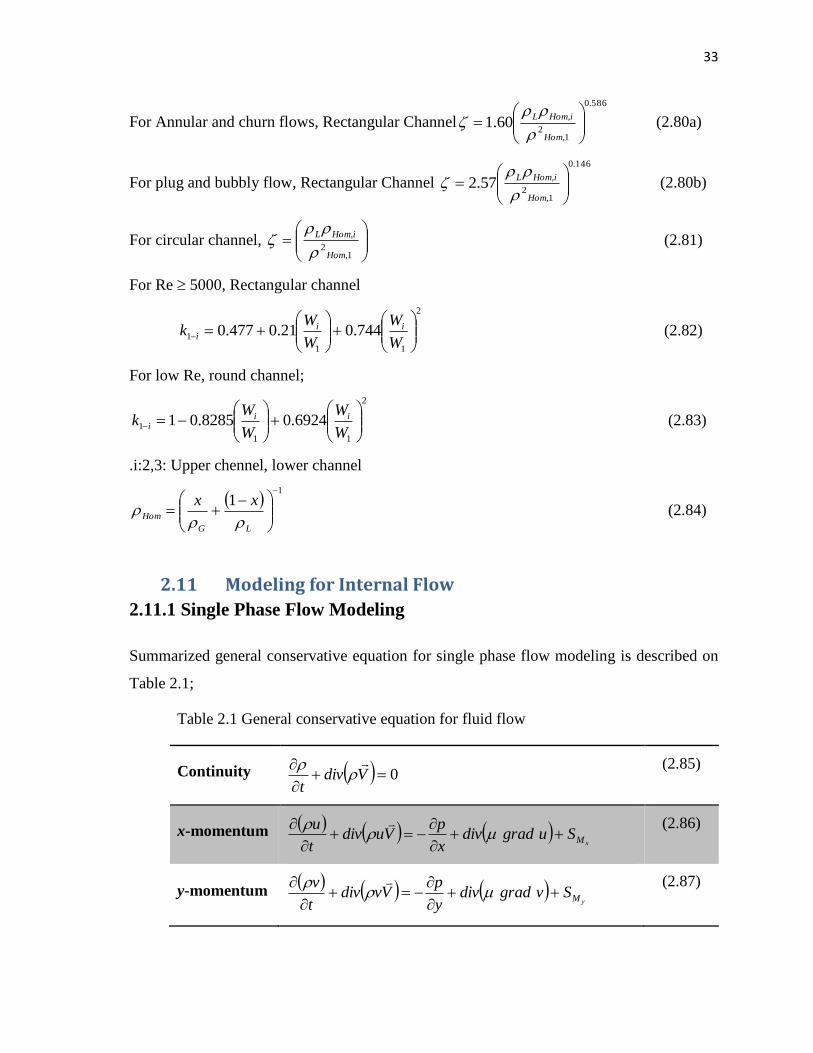
Table 2.1 General conservative equation for fluid flow
Continuity 0
Vdiv
t
(2.85)
x-momentum xMSugraddiv
x
pVudiv
t
u
(2.86)
y-momentum
yMSvgraddivy
pVvdiv
t
v
(2.87)
34
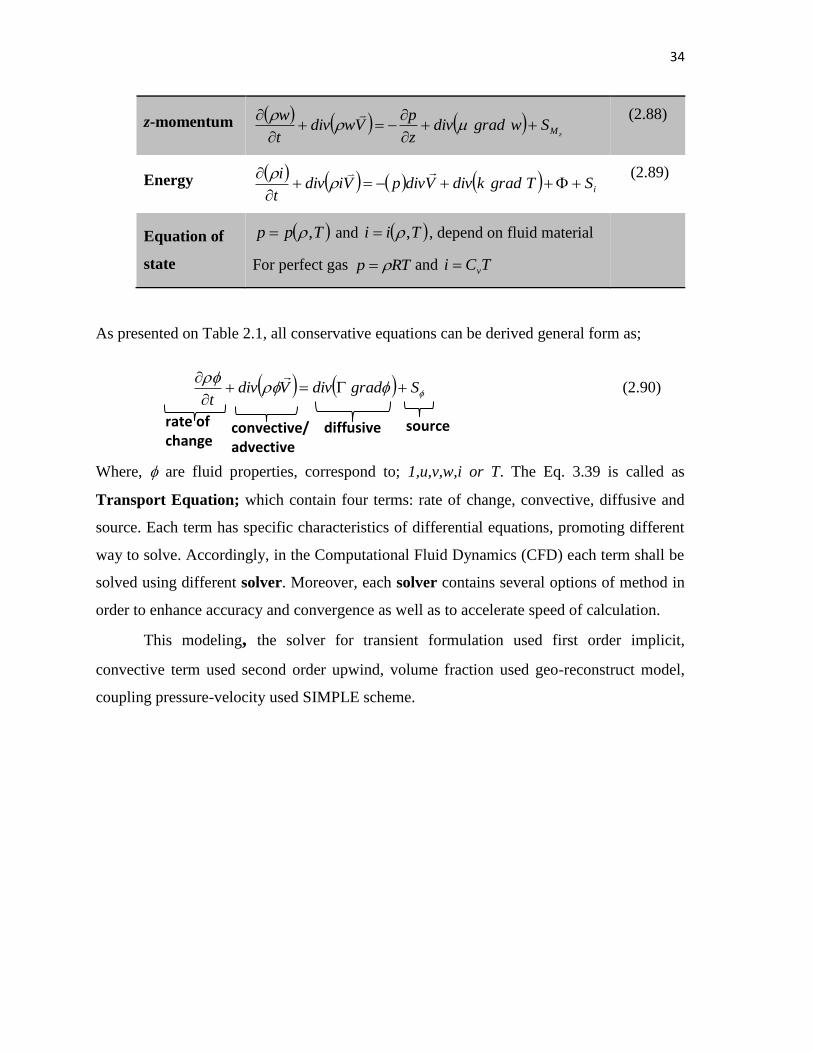
z-momentum zMSwgraddiv
z
pVwdiv
t
w
(2.88)
Energy iSTgradkdivVdivpVidivt
i
(2.89)
Equation of
state
Tpp , and Tii , , depend on fluid material
For perfect gas RTp and TCi v
As presented on Table 2.1, all conservative equations can be derived general form as;
SgraddivVdivt
(2.90)
Where, are fluid properties, correspond to; 1,u,v,w,i or T. The Eq. 3.39 is called as
Transport Equation; which contain four terms: rate of change, convective, diffusive and
source. Each term has specific characteristics of differential equations, promoting different
way to solve. Accordingly, in the Computational Fluid Dynamics (CFD) each term shall be
solved using different solver. Moreover, each solver contains several options of method in
order to enhance accuracy and convergence as well as to accelerate speed of calculation.
This modeling, the solver for transient formulation used first order implicit,
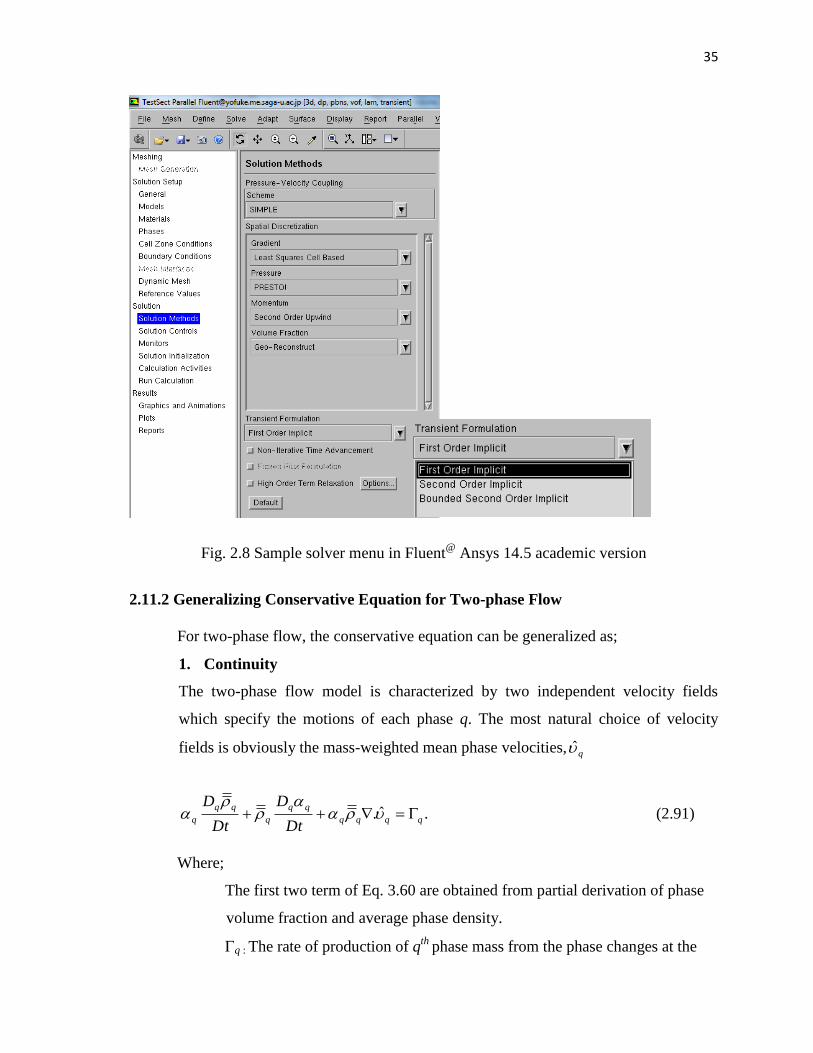
convective term used second order upwind, volume fraction used geo-reconstruct model,
coupling pressure-velocity used SIMPLE scheme.
rate of change
convective/ advective
diffusive source
35
Fig. 2.8 Sample solver menu in Fluent@
Ansys 14.5 academic version
2.11.2 Generalizing Conservative Equation for Two-phase Flow
For two-phase flow, the conservative equation can be generalized as;
1. Continuity
The two-phase flow model is characterized by two independent velocity fields
which specify the motions of each phase q. The most natural choice of velocity
fields is obviously the mass-weighted mean phase velocities, q̂
.ˆ. qqqq
q
qDt
D
Dt
D
(2.91)
Where;
The first two term of Eq. 3.60 are obtained from partial derivation of phase
volume fraction and average phase density.
q : The rate of production of qth
phase mass from the phase changes at the
36
interfaces per unit volume.
: Volume fraction
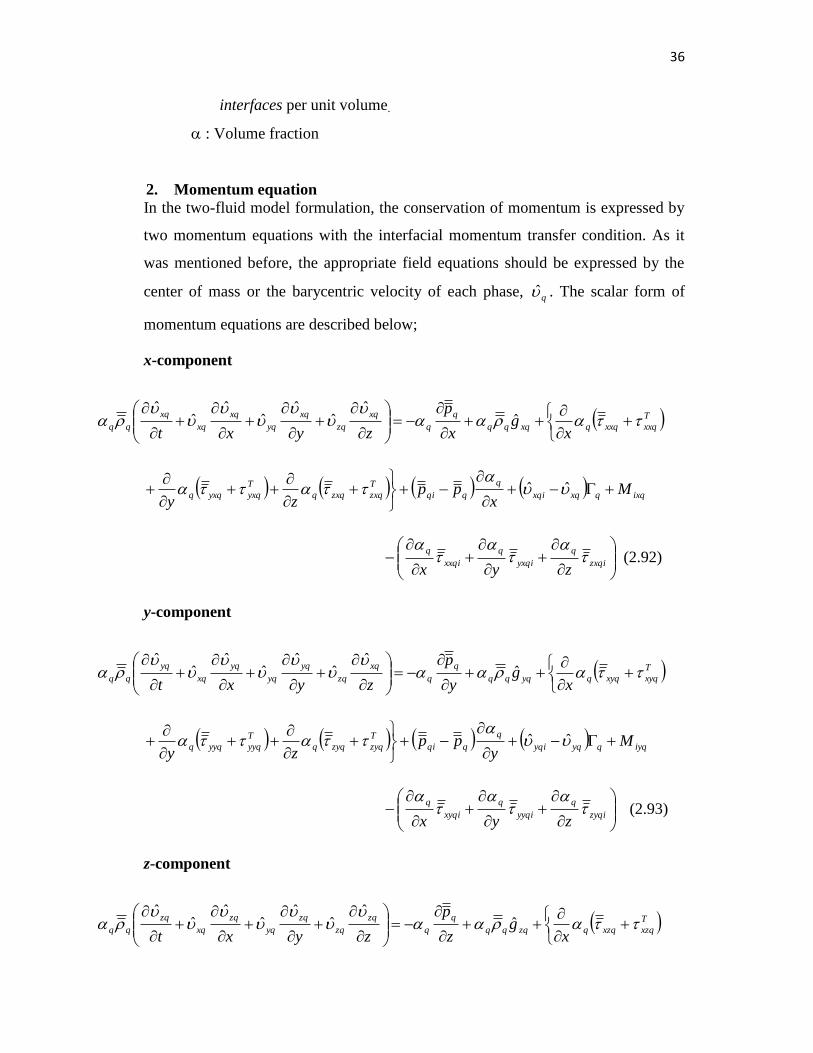
2. Momentum equation
In the two-fluid model formulation, the conservation of momentum is expressed by
two momentum equations with the interfacial momentum transfer condition. As it
was mentioned before, the appropriate field equations should be expressed by the
center of mass or the barycentric velocity of each phase, q̂ . The scalar form of
momentum equations are described below;
x-component
T
xxqxxqqxqqq
q
q
xq
zq
xq
yq
xq
xq
xq
qqx
gx
p
zyxt
ˆ
ˆˆ
ˆˆ
ˆˆ
ˆ
ixqqxqxqi
q
qqi
T
zxqzxqq
T
yxqyxqq Mx
ppzy
ˆˆ
zxqi
q
yxqi
q
xxqi
q
zyx
(2.92)
y-component
T
xyqxyqqyqqq
q
q
xq
zq
yq
yq
yq
xq
yq
qqx
gy
p
zyxt
ˆ
ˆˆ
ˆˆ
ˆˆ
ˆ
iyqqyqyqi
q
qqi
T
zyqzyqq
T
yyqyyqq My
ppzy
ˆˆ
zyqi
q
yyqi
q
xyqi
q
zyx
(2.93)
z-component
T
xzqxzqqzqqq
q
q
zq
zq
zq
yq
zq
xq
zq
qqx
gz
p
zyxt
ˆ
ˆˆ
ˆˆ
ˆˆ
ˆ
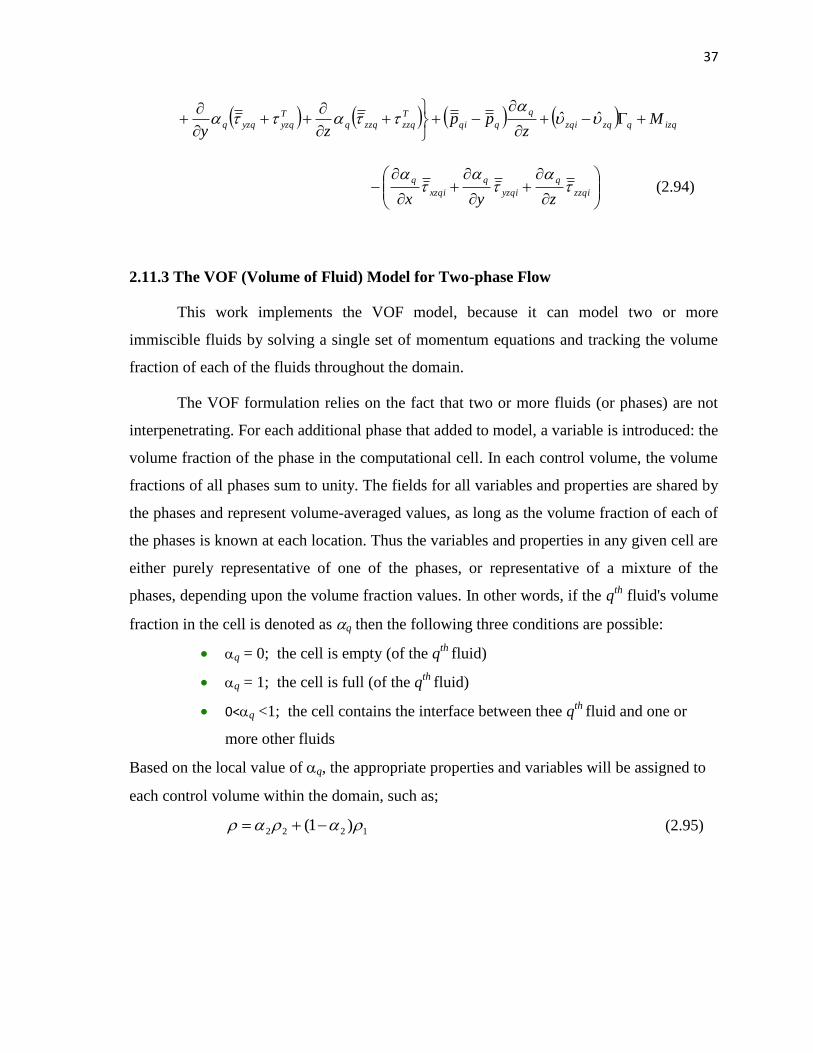
37
izqqzqzqi
q
qqi
T
zzqzzqq
T
yzqyzqq Mz
ppzy
ˆˆ
zzqi
q
yzqi
q
xzqi
q
zyx
(2.94)
2.11.3 The VOF (Volume of Fluid) Model for Two-phase Flow
This work implements the VOF model, because it can model two or more
immiscible fluids by solving a single set of momentum equations and tracking the volume
fraction of each of the fluids throughout the domain.
The VOF formulation relies on the fact that two or more fluids (or phases) are not
interpenetrating. For each additional phase that added to model, a variable is introduced: the
volume fraction of the phase in the computational cell. In each control volume, the volume
fractions of all phases sum to unity. The fields for all variables and properties are shared by
the phases and represent volume-averaged values, as long as the volume fraction of each of
the phases is known at each location. Thus the variables and properties in any given cell are
either purely representative of one of the phases, or representative of a mixture of the
phases, depending upon the volume fraction values. In other words, if the qth
fluid's volume
fraction in the cell is denoted as q then the following three conditions are possible:
q = 0; the cell is empty (of the qth
fluid)
q = 1; the cell is full (of the qth
fluid)
0<q <1; the cell contains the interface between thee qth
fluid and one or
more other fluids
Based on the local value of q, the appropriate properties and variables will be assigned to
each control volume within the domain, such as;
1222 )1( (2.95)
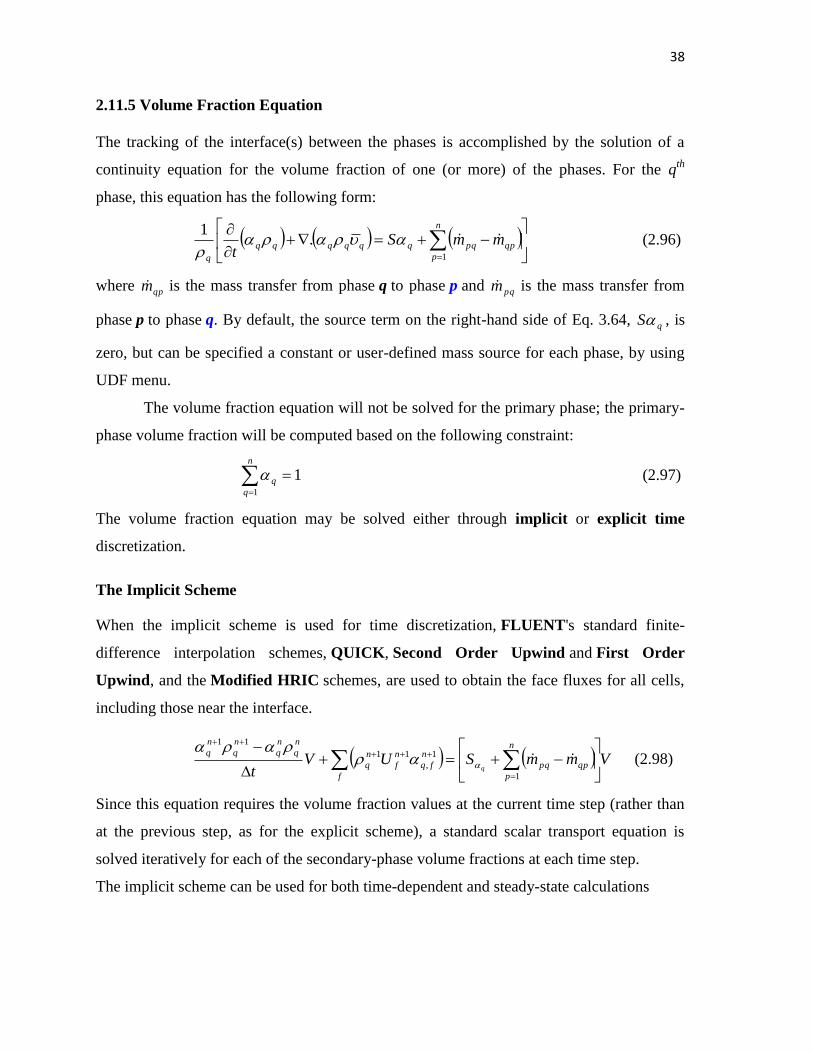
38
2.11.5 Volume Fraction Equation
The tracking of the interface(s) between the phases is accomplished by the solution of a
continuity equation for the volume fraction of one (or more) of the phases. For the qth
phase, this equation has the following form:
n
p
qppqqqqqqq
q
mmSt 1
.1
(2.96)
where qpm is the mass transfer from phase q to phase p and pqm is the mass transfer from
phase p to phase q. By default, the source term on the right-hand side of Eq. 3.64, qS , is
zero, but can be specified a constant or user-defined mass source for each phase, by using
UDF menu.
The volume fraction equation will not be solved for the primary phase; the primary-
phase volume fraction will be computed based on the following constraint:
(2.97)
The volume fraction equation may be solved either through implicit or explicit time
discretization.
The Implicit Scheme
When the implicit scheme is used for time discretization, FLUENT's standard finite-
difference interpolation schemes, QUICK, Second Order Upwind and First Order
Upwind, and the Modified HRIC schemes, are used to obtain the face fluxes for all cells,
including those near the interface.
VmmSUVt
n
p
qppq
f
n
fq
n
f
n
q
n
q
n
q
n
q
n
q
q
1
1
,
11
11
(2.98)
Since this equation requires the volume fraction values at the current time step (rather than
at the previous step, as for the explicit scheme), a standard scalar transport equation is
solved iteratively for each of the secondary-phase volume fractions at each time step.
The implicit scheme can be used for both time-dependent and steady-state calculations
n
q
q
1
1
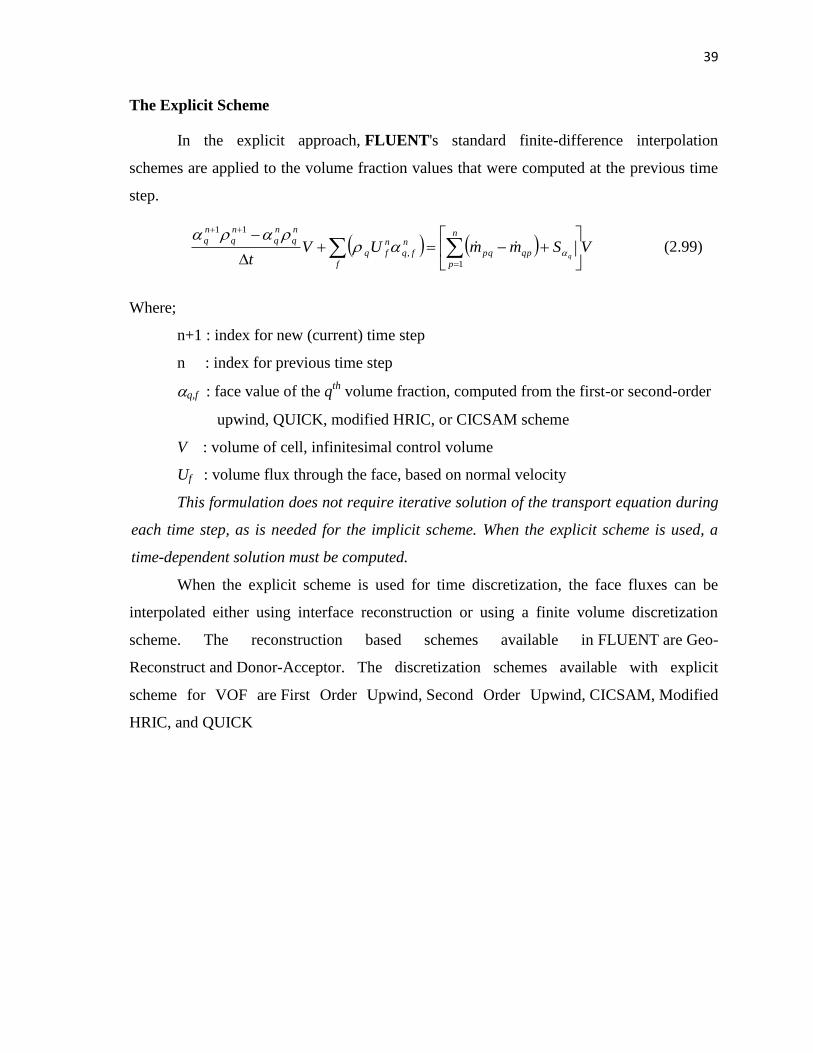
39
The Explicit Scheme
In the explicit approach, FLUENT's standard finite-difference interpolation
schemes are applied to the volume fraction values that were computed at the previous time
step.
VSmmUVt q
n
p
qppq
f
n
fq
n
fq
n
q
n
q
n
q
n
q
1
,
11
(2.99)
Where;
n+1 : index for new (current) time step
n : index for previous time step
q,f : face value of the qth
volume fraction, computed from the first-or second-order
upwind, QUICK, modified HRIC, or CICSAM scheme
V : volume of cell, infinitesimal control volume
Uf : volume flux through the face, based on normal velocity
This formulation does not require iterative solution of the transport equation during
each time step, as is needed for the implicit scheme. When the explicit scheme is used, a
time-dependent solution must be computed.
When the explicit scheme is used for time discretization, the face fluxes can be
interpolated either using interface reconstruction or using a finite volume discretization
scheme. The reconstruction based schemes available in FLUENT are Geo-
Reconstruct and Donor-Acceptor. The discretization schemes available with explicit
scheme for VOF are First Order Upwind, Second Order Upwind, CICSAM, Modified
HRIC, and QUICK
40
References
Collier, J.G., (1981), Convective boiling and condensation, Second Edition, McGraw-Hill,
ISBN: 0070117985.
Thome, J.R., (2010), Engineering data book III, Wolverine Tube, Inc.
ThermopediaTM
, A to z guide to thermodynamics, Heat and mass transfer, and fluid
engineering, http://www.thermopedia.com/
Hwang, S.T. and Lahey, R.T., (1988), A study on single- and two-phase pressure drop in
branching conduits, Exp. Therm. Fluid Sci. 1, p. 111–125
Tapucu, A., Teyssedou, A., Troche, N. and Merilo, M., (1989), Pressure losses caused by
changes in a single channel flow under two-phase flow, Int. J. Multiphase Flow 15-
1, p. 51-64
Kim, S.M. and Mudawar, I., (2012), Universal approach to predicting two-phase frictional
pressure drop for adiabatic and condensing mini/micro-channel flows, Int. J. Heat
and Mass Transfer 55, p. 3246–3261
Hewitt, G. F. & Hall Taylor, N. S. (1970), Annular Two-phase Flow, Pergamon Press,
Oxford.
FLUENT 6.3 Documentation, (2006), Choosing a General Multiphase Model,
http://aerojet.engr.ucdavis.edu/fluenthelp/html/ug/node875.htm, © Fluent Inc. 2006-
09-20
Ishi, M. and Hibiki, T., (2011), Thermo-Fluid Dynamics of Two-Phase Flow, Second
Edition, Springer New York Dordrecht Heidelberg London, ISBN 978-1-4419-
7984-1
Pritchard, P.J. and Leylegian, J.C., (2011), Fox and McDonald’s Introduction to Fluid
Mechanics, Eight Edition, John Wiley & Sons, Inc., ISBN:13 9780470547557
Versteeg, H.K. and Malalasekera, W., (2007), An Introduction to Computational Fluid
Dynamics, The finite Volume Methods, Second Edition, Pearson Education
Limited Edinburgh Gate Harlow Essex CM20 2JE England, ISBN: 978-0-13-
127498-3
Chapter 3 Two-phase Flow Distribution in Bifurcation Channel
Distributor plays a major role on uniformly of the fluid flow distribution through multiple channels, particularly in two phase
flow. Uniformity and low pressure drop are the major issue which shall be solved. The other hand, two-phase flow distribution in the
bifurcation channel distributor has still remained mal-uniformity problem and the causes have not clearly discovered yet. Therefore, the
enhancement study is needed, absolutely.
The study is initiated by comparing the bifurcation channel distributor with curved round distributor models with three types
of reducer namely; curve reducer, T-reducer and straight reducer, 2d modeling based by Fluent@ software. Second is modeling and
experimental study of the flow distribution in the bifurcation channel distributor, constructed by acrylics resembling merged triple pipe, 8
mm in diameter of inlet channel and two set 5 mm in diameter of each outlet channel, set horizontally sideways with three positions;
horizontal, 45o inclined and vertical. Three flow patterns were fed i.e.; bubble, slug and stratified flow, observed via high speed video
camera. Third is pressure loss study on sideways bifurcation channel distributor experimentally and the results are compared with several
existing correlation. The pressure distribution was measured by series of U-tube water gauge manometer. Forth is study of length channel
effect on bifurcation channel distributor by integrating flow patterns, phase distribution and pressure drop analysis. The experiment is
extended by modeling vary three outlet channel lengths with length ratio l/dc; 3.2, 10 and 70. The results are validated by experimental
data and compared by existing correlation, analytically.
It was revealed that the bifurcation channel distributor has tended to lack uniformity of phase distribution and slightly lower
pressure drop than curved reducer distributor. While the curve round distributor models with T-reducer has exhibited better performance
due to smaller pressure drop and optimum phase uniformity. The two-phase flow distribution tends to be mal-uniform and to transform to
different flow pattern in outlet channels. These are promoted by different; outlet channel length, feeding two-phase flow pattern in inlet
distributor and inclination angle. The changing of flow pattern is driven by fluctuating velocity in both upper and lower outlet channel.
There is only limited correlation have good agreement. They are Friedel (1979) for all domain and Hwang correlation for bubble flow in
junction distributor. Accordingly, new correlation shall be developed based on their correlation. It was shown that there is oscillation and
dumping effect when the two-phase flow impacts to an object.
3.1 Introduction
The lack of two-phase flow uniformity on the distributor is a major problem especially
in the multiple channels. If the mal-distribution occurred, the performance of heat
exchangers and other industrial devices tend to decreases. In order to achieve even
distribution, several works have been done and developed since constructal theory for fluid
flow was constructed by Bejan (1997), adopted from natural phenomenon. The fluid flow
path between one point and a finite-size volume (an infinite number of points) is optimized
by minimizing the overall flow resistance when the flow rate and the duct volume are fixed.
The optimizing step begin from the smallest block which have array of small duct to bigger
42
block which have bigger ones and continue toward bigger block ones. Optimizing couldn’t
be done inversely.
Based on constructal theory, such distributors design and model had been derived.
The early was ramified fluid distributor by Tondeur et al. (2004). Lou et al. (2005)
optimized multi-scale structures of distributors which dichotomic tree configuration. Lou et
al. (2007) had coupled constructal distributors/collectors with a mini cross flow heat
exchanger (MCHE) to solve the problem of flow mal-distribution. Fan et al. (2008) proved
that blocking one or two outlets of one branch will generally decrease the uniformity of the
flow distribution.
Miguel (2010) developed constructal equation of dendritic structures distributor for
fluid flow both Laminar and turbulent. Vascular design of constructal structures with low
flow resistance and non-uniformity was designed by Cho et al. (2010). Ramos-Alvarado et
al. (2011) investigated constructal flow distributor as a bipolar plate for proton exchange
membrane fuel cells. The uniformity in flow distributors having novel flow channel
bifurcation structures has been studied by Liu et al. (2010).
Almost of all foregoing studies have not involved two-phase flow in particular,
whereas is not a few systems involve it, as in evaporator and condenser. The uniformity of
phase distribution in them is absolutely urgent. If the phase distribution is uneven then the
performance of it will decrease significantly, moreover in a T-junction bifurcation, where
the gas phase tends to occupy the upper space while the liquid occupy lower channel space.
T-junction bifurcation must be designed accurately to prevent phase separation and to
minimize pressure drop, it will be supported by this work which is still little researcher
studying on it.
Al-Rawashdeh et al. (2012) had designed and tested the barrier-type distributor for
two-phase flow. His work was intended to mix gas and liquid flows at the entrance of each
of the parallel channels uniformly, before enter distributor. Accordingly, it was only be
implemented in the chemical process reactor. In the evaporator and condenser, the phase
was complicated to maintain and control. Therefore, it must be gained the breakthrough to
maintain uniformly of phase throughout the channels downstream of distributor. There isn’t
an easy matter since two-phase flow pattern vary uncertainly.
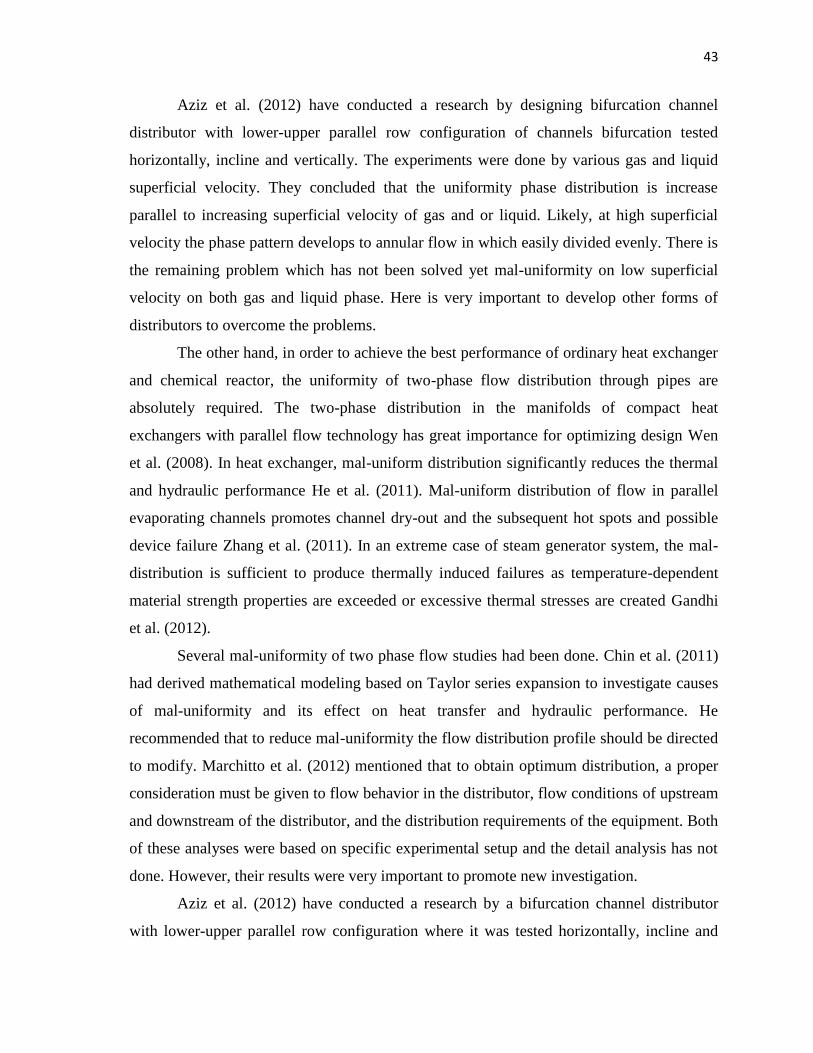
43
Aziz et al. (2012) have conducted a research by designing bifurcation channel
distributor with lower-upper parallel row configuration of channels bifurcation tested
horizontally, incline and vertically. The experiments were done by various gas and liquid
superficial velocity. They concluded that the uniformity phase distribution is increase
parallel to increasing superficial velocity of gas and or liquid. Likely, at high superficial
velocity the phase pattern develops to annular flow in which easily divided evenly. There is
the remaining problem which has not been solved yet mal-uniformity on low superficial
velocity on both gas and liquid phase. Here is very important to develop other forms of
distributors to overcome the problems.
The other hand, in order to achieve the best performance of ordinary heat exchanger
and chemical reactor, the uniformity of two-phase flow distribution through pipes are
absolutely required. The two-phase distribution in the manifolds of compact heat
exchangers with parallel flow technology has great importance for optimizing design Wen
et al. (2008). In heat exchanger, mal-uniform distribution significantly reduces the thermal
and hydraulic performance He et al. (2011). Mal-uniform distribution of flow in parallel
evaporating channels promotes channel dry-out and the subsequent hot spots and possible
device failure Zhang et al. (2011). In an extreme case of steam generator system, the mal-
distribution is sufficient to produce thermally induced failures as temperature-dependent
material strength properties are exceeded or excessive thermal stresses are created Gandhi
et al. (2012).
Several mal-uniformity of two phase flow studies had been done. Chin et al. (2011)
had derived mathematical modeling based on Taylor series expansion to investigate causes
of mal-uniformity and its effect on heat transfer and hydraulic performance. He
recommended that to reduce mal-uniformity the flow distribution profile should be directed
to modify. Marchitto et al. (2012) mentioned that to obtain optimum distribution, a proper
consideration must be given to flow behavior in the distributor, flow conditions of upstream
and downstream of the distributor, and the distribution requirements of the equipment. Both
of these analyses were based on specific experimental setup and the detail analysis has not
done. However, their results were very important to promote new investigation.
Aziz et al. (2012) have conducted a research by a bifurcation channel distributor
with lower-upper parallel row configuration where it was tested horizontally, incline and
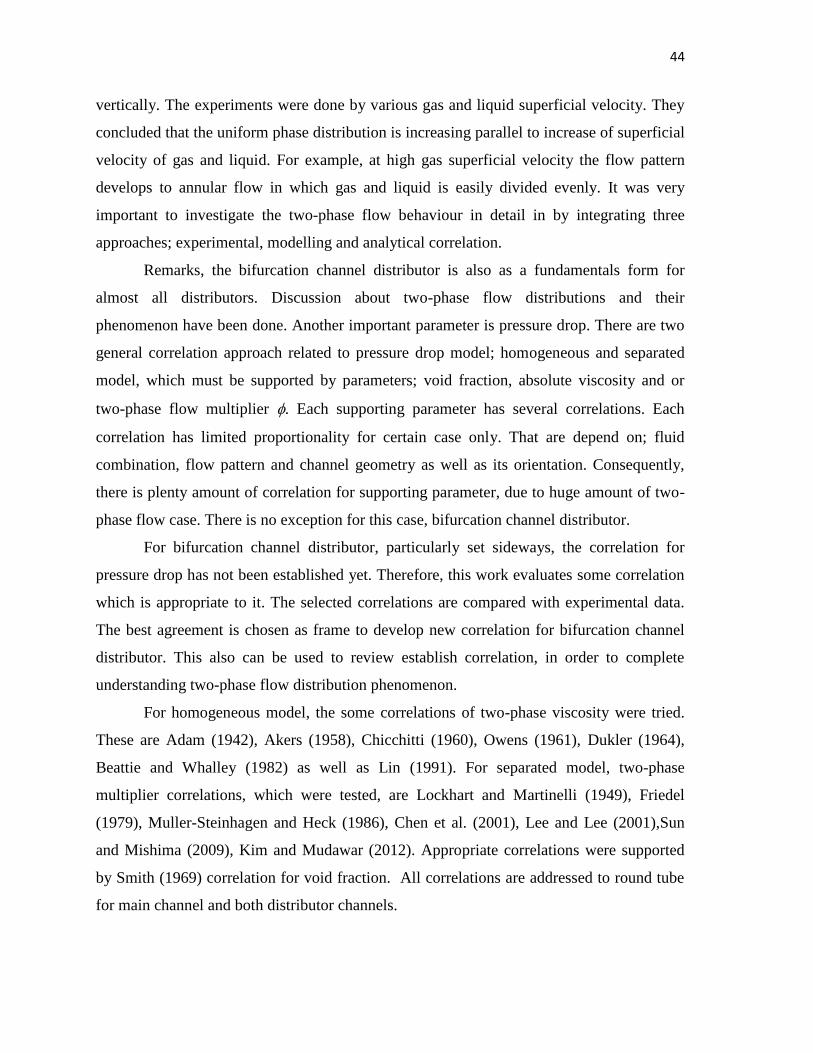
44
vertically. The experiments were done by various gas and liquid superficial velocity. They
concluded that the uniform phase distribution is increasing parallel to increase of superficial
velocity of gas and liquid. For example, at high gas superficial velocity the flow pattern
develops to annular flow in which gas and liquid is easily divided evenly. It was very
important to investigate the two-phase flow behaviour in detail in by integrating three
approaches; experimental, modelling and analytical correlation.
Remarks, the bifurcation channel distributor is also as a fundamentals form for
almost all distributors. Discussion about two-phase flow distributions and their
phenomenon have been done. Another important parameter is pressure drop. There are two
general correlation approach related to pressure drop model; homogeneous and separated
model, which must be supported by parameters; void fraction, absolute viscosity and or
two-phase flow multiplier . Each supporting parameter has several correlations. Each
correlation has limited proportionality for certain case only. That are depend on; fluid
combination, flow pattern and channel geometry as well as its orientation. Consequently,
there is plenty amount of correlation for supporting parameter, due to huge amount of two-
phase flow case. There is no exception for this case, bifurcation channel distributor.
For bifurcation channel distributor, particularly set sideways, the correlation for
pressure drop has not been established yet. Therefore, this work evaluates some correlation
which is appropriate to it. The selected correlations are compared with experimental data.
The best agreement is chosen as frame to develop new correlation for bifurcation channel
distributor. This also can be used to review establish correlation, in order to complete
understanding two-phase flow distribution phenomenon.
For homogeneous model, the some correlations of two-phase viscosity were tried.
These are Adam (1942), Akers (1958), Chicchitti (1960), Owens (1961), Dukler (1964),
Beattie and Whalley (1982) as well as Lin (1991). For separated model, two-phase
multiplier correlations, which were tested, are Lockhart and Martinelli (1949), Friedel
(1979), Muller-Steinhagen and Heck (1986), Chen et al. (2001), Lee and Lee (2001),Sun
and Mishima (2009), Kim and Mudawar (2012). Appropriate correlations were supported
by Smith (1969) correlation for void fraction. All correlations are addressed to round tube
for main channel and both distributor channels.
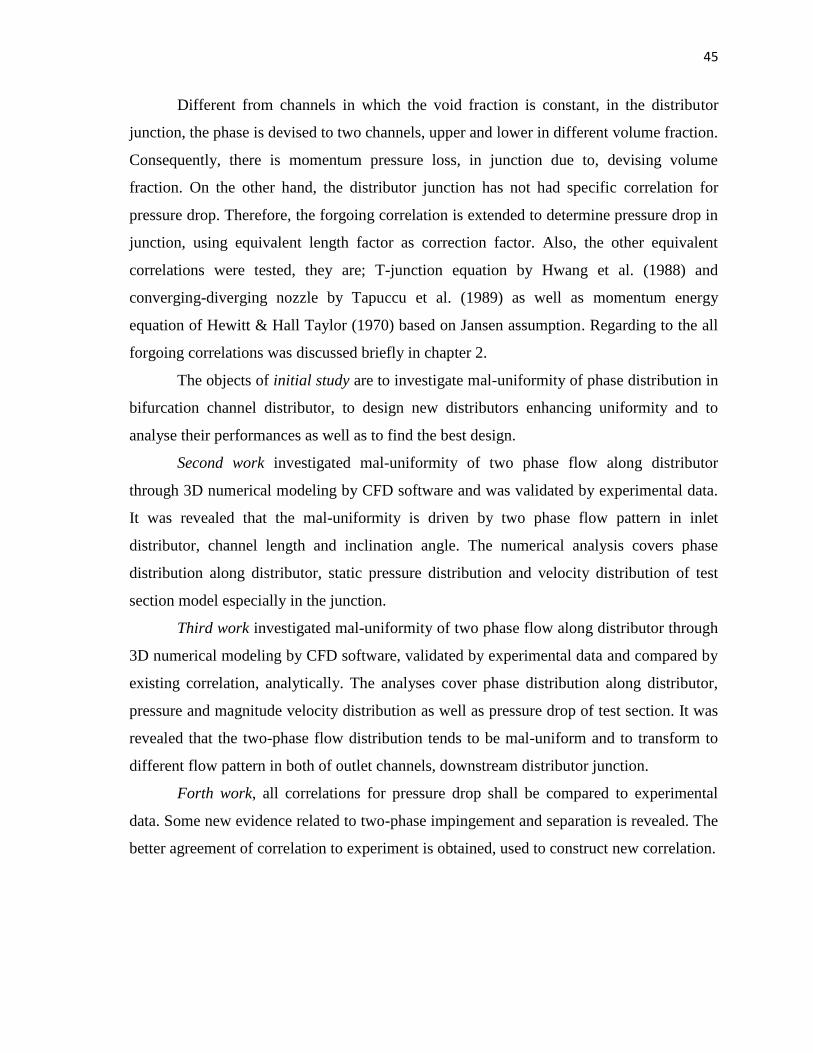
45
Different from channels in which the void fraction is constant, in the distributor
junction, the phase is devised to two channels, upper and lower in different volume fraction.
Consequently, there is momentum pressure loss, in junction due to, devising volume
fraction. On the other hand, the distributor junction has not had specific correlation for
pressure drop. Therefore, the forgoing correlation is extended to determine pressure drop in
junction, using equivalent length factor as correction factor. Also, the other equivalent
correlations were tested, they are; T-junction equation by Hwang et al. (1988) and
converging-diverging nozzle by Tapuccu et al. (1989) as well as momentum energy
equation of Hewitt & Hall Taylor (1970) based on Jansen assumption. Regarding to the all
forgoing correlations was discussed briefly in chapter 2.
The objects of initial study are to investigate mal-uniformity of phase distribution in
bifurcation channel distributor, to design new distributors enhancing uniformity and to
analyse their performances as well as to find the best design.
Second work investigated mal-uniformity of two phase flow along distributor
through 3D numerical modeling by CFD software and was validated by experimental data.
It was revealed that the mal-uniformity is driven by two phase flow pattern in inlet
distributor, channel length and inclination angle. The numerical analysis covers phase
distribution along distributor, static pressure distribution and velocity distribution of test
section model especially in the junction.
Third work investigated mal-uniformity of two phase flow along distributor through
3D numerical modeling by CFD software, validated by experimental data and compared by
existing correlation, analytically. The analyses cover phase distribution along distributor,
pressure and magnitude velocity distribution as well as pressure drop of test section. It was
revealed that the two-phase flow distribution tends to be mal-uniform and to transform to
different flow pattern in both of outlet channels, downstream distributor junction.
Forth work, all correlations for pressure drop shall be compared to experimental
data. Some new evidence related to two-phase impingement and separation is revealed. The
better agreement of correlation to experiment is obtained, used to construct new correlation.
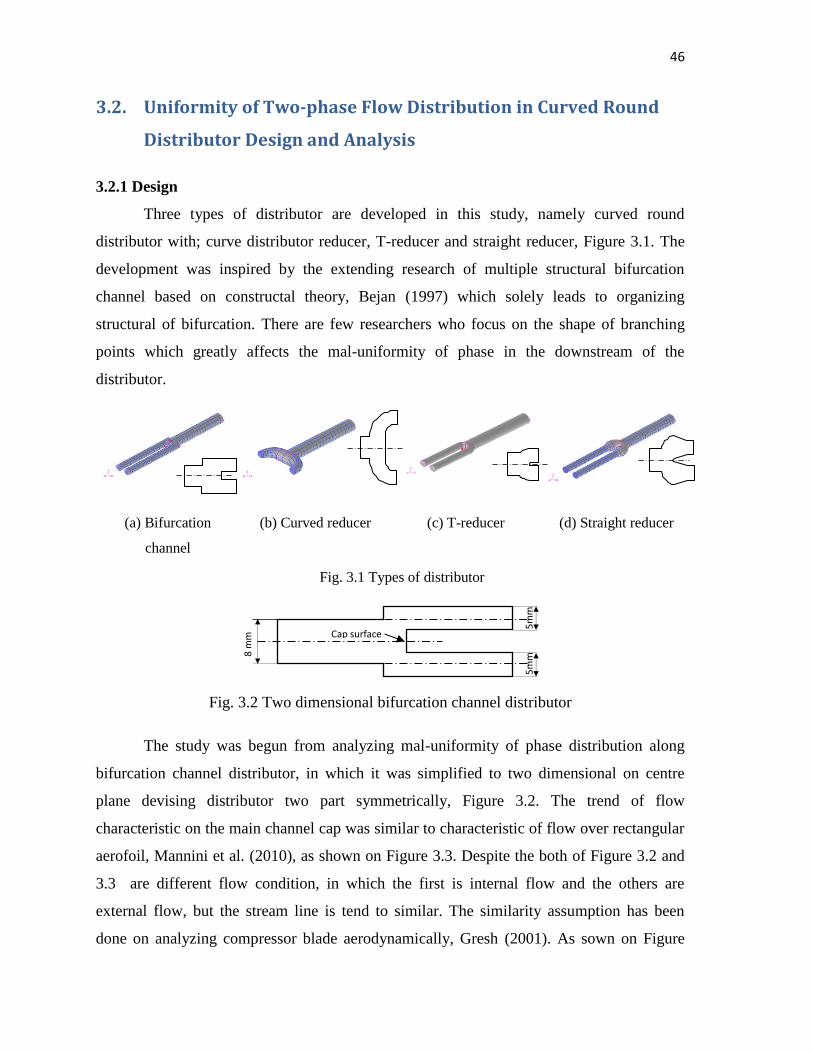
46
3.2. Uniformity of Two-phase Flow Distribution in Curved Round
Distributor Design and Analysis
3.2.1 Design
Three types of distributor are developed in this study, namely curved round
distributor with; curve distributor reducer, T-reducer and straight reducer, Figure 3.1. The
development was inspired by the extending research of multiple structural bifurcation
channel based on constructal theory, Bejan (1997) which solely leads to organizing
structural of bifurcation. There are few researchers who focus on the shape of branching
points which greatly affects the mal-uniformity of phase in the downstream of the
distributor.
(a) Bifurcation
channel
(b) Curved reducer (c) T-reducer (d) Straight reducer
Fig. 3.1 Types of distributor
Fig. 3.2 Two dimensional bifurcation channel distributor
The study was begun from analyzing mal-uniformity of phase distribution along
bifurcation channel distributor, in which it was simplified to two dimensional on centre
plane devising distributor two part symmetrically, Figure 3.2. The trend of flow
characteristic on the main channel cap was similar to characteristic of flow over rectangular
aerofoil, Mannini et al. (2010), as shown on Figure 3.3. Despite the both of Figure 3.2 and
3.3 are different flow condition, in which the first is internal flow and the others are
external flow, but the stream line is tend to similar. The similarity assumption has been
done on analyzing compressor blade aerodynamically, Gresh (2001). As sown on Figure
5m
m
5m
m
8 m
m
Cap surface
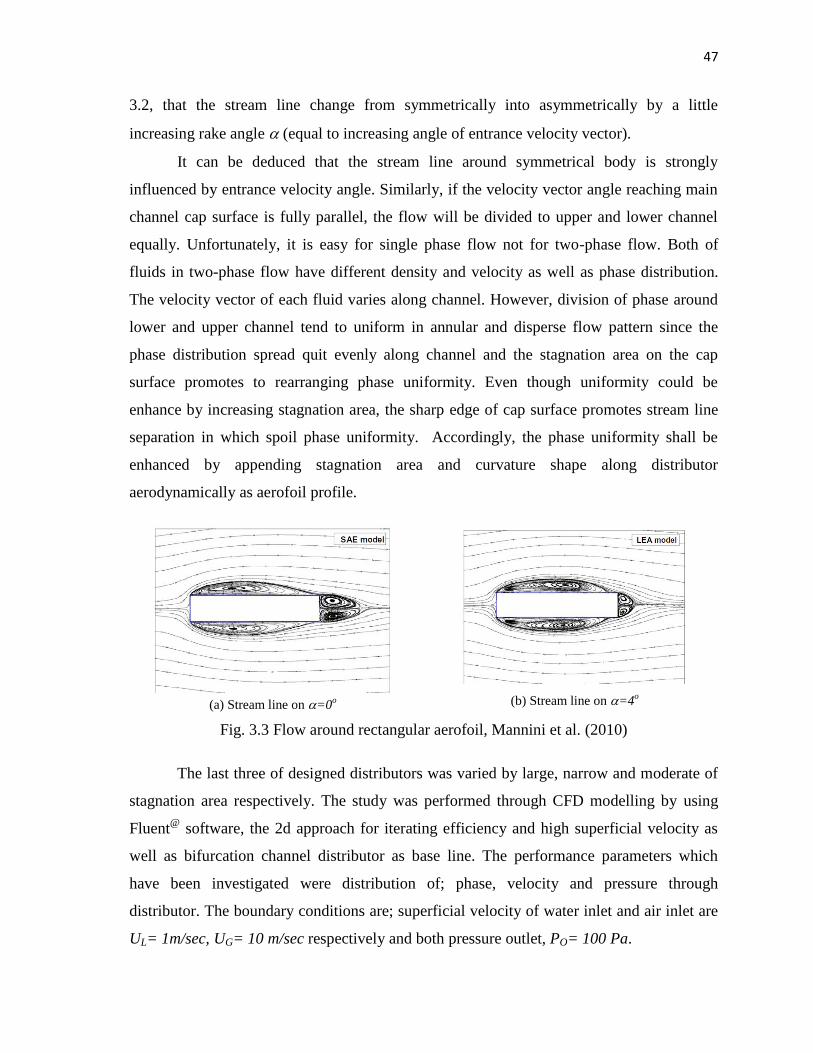
47
3.2, that the stream line change from symmetrically into asymmetrically by a little
increasing rake angle (equal to increasing angle of entrance velocity vector).
It can be deduced that the stream line around symmetrical body is strongly
influenced by entrance velocity angle. Similarly, if the velocity vector angle reaching main
channel cap surface is fully parallel, the flow will be divided to upper and lower channel
equally. Unfortunately, it is easy for single phase flow not for two-phase flow. Both of
fluids in two-phase flow have different density and velocity as well as phase distribution.
The velocity vector of each fluid varies along channel. However, division of phase around
lower and upper channel tend to uniform in annular and disperse flow pattern since the
phase distribution spread quit evenly along channel and the stagnation area on the cap
surface promotes to rearranging phase uniformity. Even though uniformity could be
enhance by increasing stagnation area, the sharp edge of cap surface promotes stream line
separation in which spoil phase uniformity. Accordingly, the phase uniformity shall be
enhanced by appending stagnation area and curvature shape along distributor
aerodynamically as aerofoil profile.
(a) Stream line on =0o (b) Stream line on =4
o
Fig. 3.3 Flow around rectangular aerofoil, Mannini et al. (2010)
The last three of designed distributors was varied by large, narrow and moderate of
stagnation area respectively. The study was performed through CFD modelling by using
Fluent@
software, the 2d approach for iterating efficiency and high superficial velocity as
well as bifurcation channel distributor as base line. The performance parameters which
have been investigated were distribution of; phase, velocity and pressure through
distributor. The boundary conditions are; superficial velocity of water inlet and air inlet are
UL= 1m/sec, UG= 10 m/sec respectively and both pressure outlet, PO= 100 Pa.
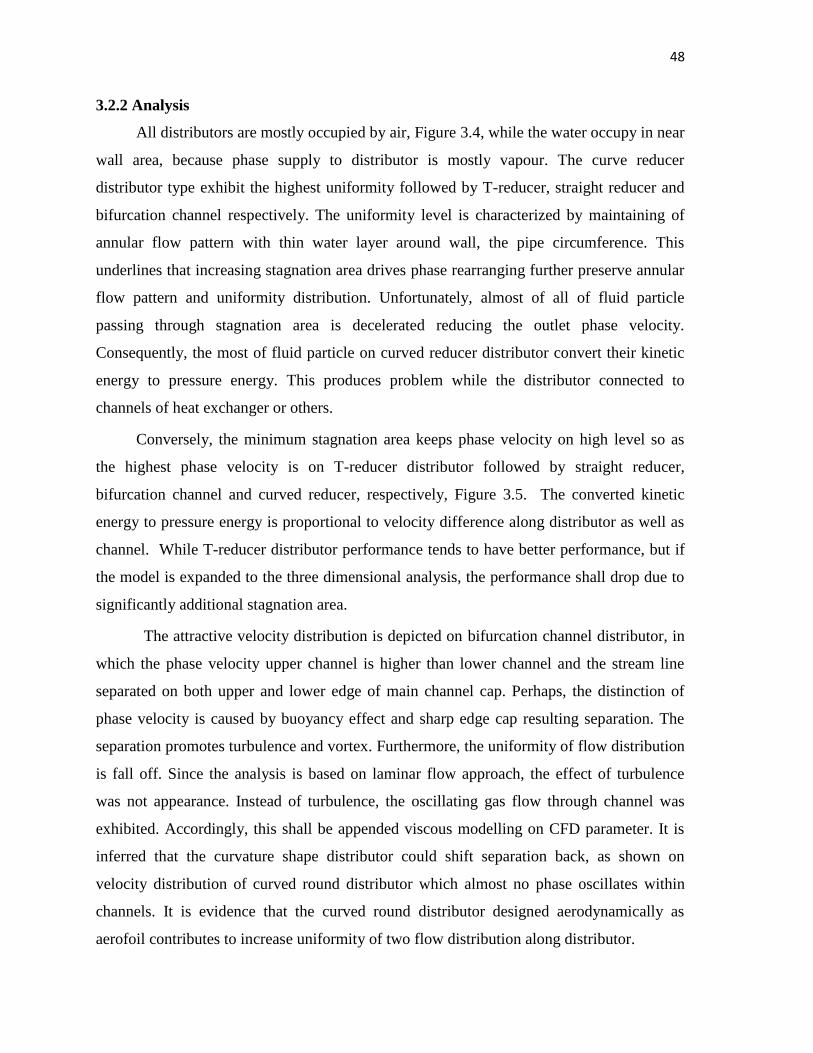
48
3.2.2 Analysis
All distributors are mostly occupied by air, Figure 3.4, while the water occupy in near
wall area, because phase supply to distributor is mostly vapour. The curve reducer
distributor type exhibit the highest uniformity followed by T-reducer, straight reducer and
bifurcation channel respectively. The uniformity level is characterized by maintaining of
annular flow pattern with thin water layer around wall, the pipe circumference. This
underlines that increasing stagnation area drives phase rearranging further preserve annular
flow pattern and uniformity distribution. Unfortunately, almost of all of fluid particle
passing through stagnation area is decelerated reducing the outlet phase velocity.
Consequently, the most of fluid particle on curved reducer distributor convert their kinetic
energy to pressure energy. This produces problem while the distributor connected to
channels of heat exchanger or others.
Conversely, the minimum stagnation area keeps phase velocity on high level so as
the highest phase velocity is on T-reducer distributor followed by straight reducer,
bifurcation channel and curved reducer, respectively, Figure 3.5. The converted kinetic
energy to pressure energy is proportional to velocity difference along distributor as well as
channel. While T-reducer distributor performance tends to have better performance, but if
the model is expanded to the three dimensional analysis, the performance shall drop due to
significantly additional stagnation area.
The attractive velocity distribution is depicted on bifurcation channel distributor, in
which the phase velocity upper channel is higher than lower channel and the stream line
separated on both upper and lower edge of main channel cap. Perhaps, the distinction of
phase velocity is caused by buoyancy effect and sharp edge cap resulting separation. The
separation promotes turbulence and vortex. Furthermore, the uniformity of flow distribution
is fall off. Since the analysis is based on laminar flow approach, the effect of turbulence
was not appearance. Instead of turbulence, the oscillating gas flow through channel was
exhibited. Accordingly, this shall be appended viscous modelling on CFD parameter. It is
inferred that the curvature shape distributor could shift separation back, as shown on
velocity distribution of curved round distributor which almost no phase oscillates within
channels. It is evidence that the curved round distributor designed aerodynamically as
aerofoil contributes to increase uniformity of two flow distribution along distributor.
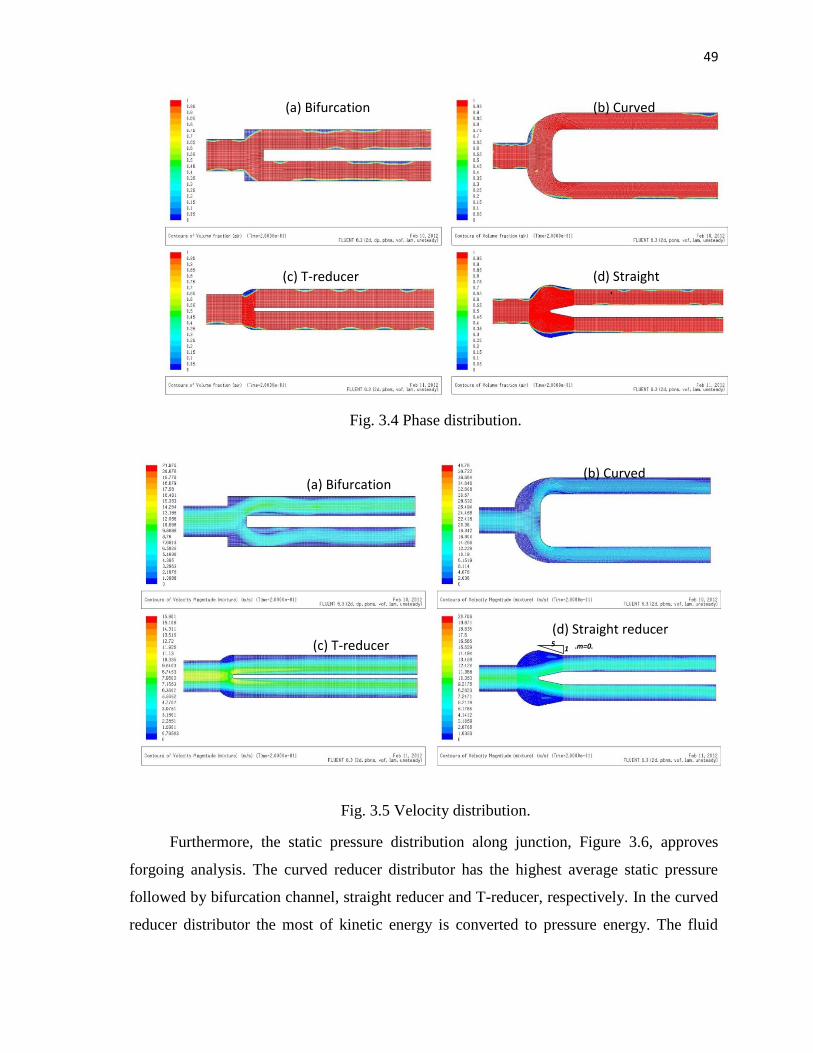
49
Fig. 3.4 Phase distribution.
Fig. 3.5 Velocity distribution.
Furthermore, the static pressure distribution along junction, Figure 3.6, approves
forgoing analysis. The curved reducer distributor has the highest average static pressure
followed by bifurcation channel, straight reducer and T-reducer, respectively. In the curved
reducer distributor the most of kinetic energy is converted to pressure energy. The fluid
(a) Bifurcation
channel
(b) Curved
reducer
(c) T-reducer (d) Straight reducer
1 5 .m=0.
2
(a) Bifurcation
channel
(b) Curved
reducer
(c) T-reducer (d) Straight
reducer
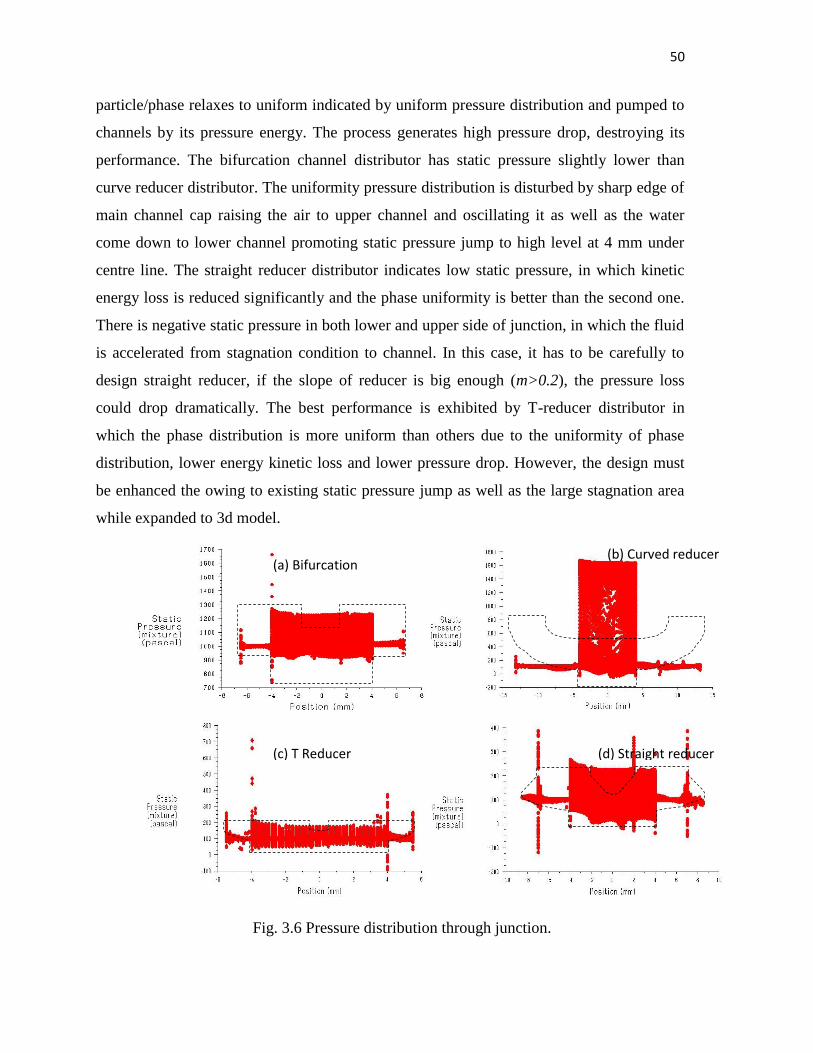
50
particle/phase relaxes to uniform indicated by uniform pressure distribution and pumped to
channels by its pressure energy. The process generates high pressure drop, destroying its
performance. The bifurcation channel distributor has static pressure slightly lower than
curve reducer distributor. The uniformity pressure distribution is disturbed by sharp edge of
main channel cap raising the air to upper channel and oscillating it as well as the water
come down to lower channel promoting static pressure jump to high level at 4 mm under
centre line. The straight reducer distributor indicates low static pressure, in which kinetic
energy loss is reduced significantly and the phase uniformity is better than the second one.
There is negative static pressure in both lower and upper side of junction, in which the fluid
is accelerated from stagnation condition to channel. In this case, it has to be carefully to
design straight reducer, if the slope of reducer is big enough (m>0.2), the pressure loss
could drop dramatically. The best performance is exhibited by T-reducer distributor in
which the phase distribution is more uniform than others due to the uniformity of phase
distribution, lower energy kinetic loss and lower pressure drop. However, the design must
be enhanced the owing to existing static pressure jump as well as the large stagnation area
while expanded to 3d model.
Fig. 3.6 Pressure distribution through junction.
(a) Bifurcation
channel
(b) Curved reducer
(c) T Reducer (d) Straight reducer
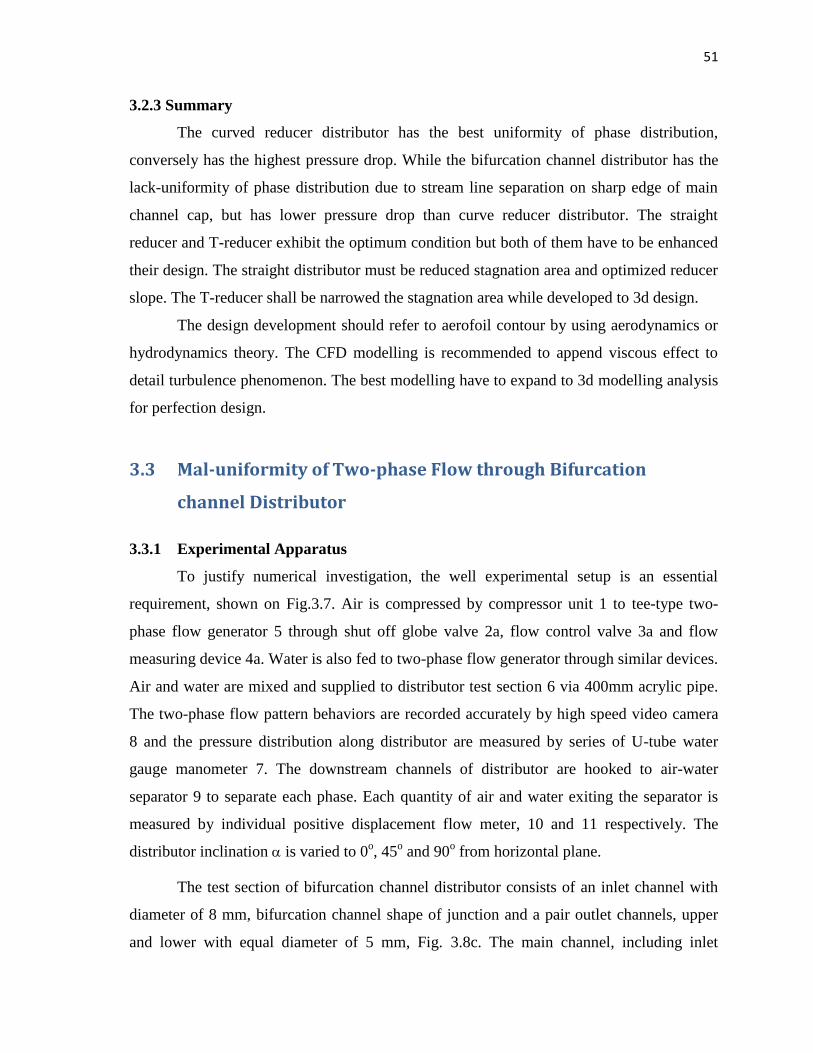
51
3.2.3 Summary
The curved reducer distributor has the best uniformity of phase distribution,
conversely has the highest pressure drop. While the bifurcation channel distributor has the
lack-uniformity of phase distribution due to stream line separation on sharp edge of main
channel cap, but has lower pressure drop than curve reducer distributor. The straight
reducer and T-reducer exhibit the optimum condition but both of them have to be enhanced
their design. The straight distributor must be reduced stagnation area and optimized reducer
slope. The T-reducer shall be narrowed the stagnation area while developed to 3d design.
The design development should refer to aerofoil contour by using aerodynamics or
hydrodynamics theory. The CFD modelling is recommended to append viscous effect to
detail turbulence phenomenon. The best modelling have to expand to 3d modelling analysis
for perfection design.
3.3 Mal-uniformity of Two-phase Flow through Bifurcation
channel Distributor
3.3.1 Experimental Apparatus
To justify numerical investigation, the well experimental setup is an essential
requirement, shown on Fig.3.7. Air is compressed by compressor unit 1 to tee-type two-
phase flow generator 5 through shut off globe valve 2a, flow control valve 3a and flow
measuring device 4a. Water is also fed to two-phase flow generator through similar devices.
Air and water are mixed and supplied to distributor test section 6 via 400mm acrylic pipe.
The two-phase flow pattern behaviors are recorded accurately by high speed video camera
8 and the pressure distribution along distributor are measured by series of U-tube water
gauge manometer 7. The downstream channels of distributor are hooked to air-water
separator 9 to separate each phase. Each quantity of air and water exiting the separator is
measured by individual positive displacement flow meter, 10 and 11 respectively. The
distributor inclination is varied to 0o, 45
o and 90
o from horizontal plane.
The test section of bifurcation channel distributor consists of an inlet channel with
diameter of 8 mm, bifurcation channel shape of junction and a pair outlet channels, upper
and lower with equal diameter of 5 mm, Fig. 3.8c. The main channel, including inlet
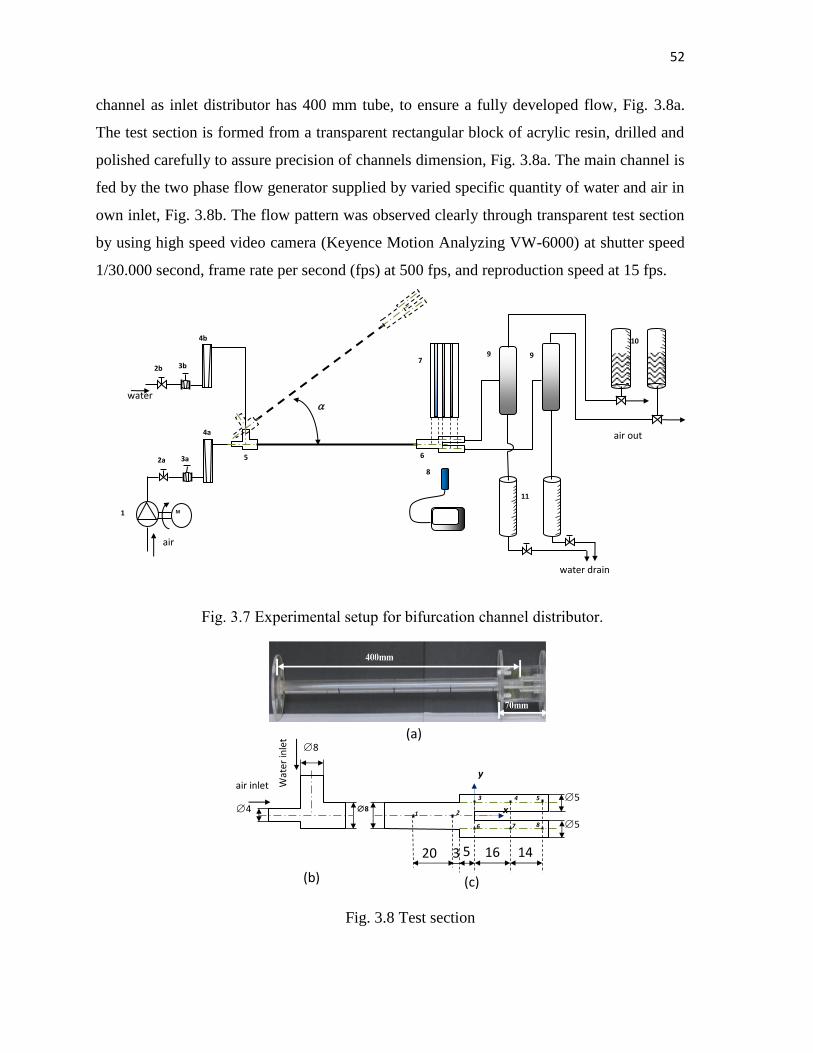
52
channel as inlet distributor has 400 mm tube, to ensure a fully developed flow, Fig. 3.8a.
The test section is formed from a transparent rectangular block of acrylic resin, drilled and
polished carefully to assure precision of channels dimension, Fig. 3.8a. The main channel is
fed by the two phase flow generator supplied by varied specific quantity of water and air in
own inlet, Fig. 3.8b. The flow pattern was observed clearly through transparent test section
by using high speed video camera (Keyence Motion Analyzing VW-6000) at shutter speed
1/30.000 second, frame rate per second (fps) at 500 fps, and reproduction speed at 15 fps.
Fig. 3.7 Experimental setup for bifurcation channel distributor.
Fig. 3.8 Test section
M
air
water
water drain
air out
1
2a
2b
3b
3a
4b
4a
5 6
7
8
9 9
10
11
Wat
er in
let
(b)
20 3 5 16 14
y
x
(c)
5
5
8
air inlet
4
8 (a)
1 2
3 4 5
6 7 8
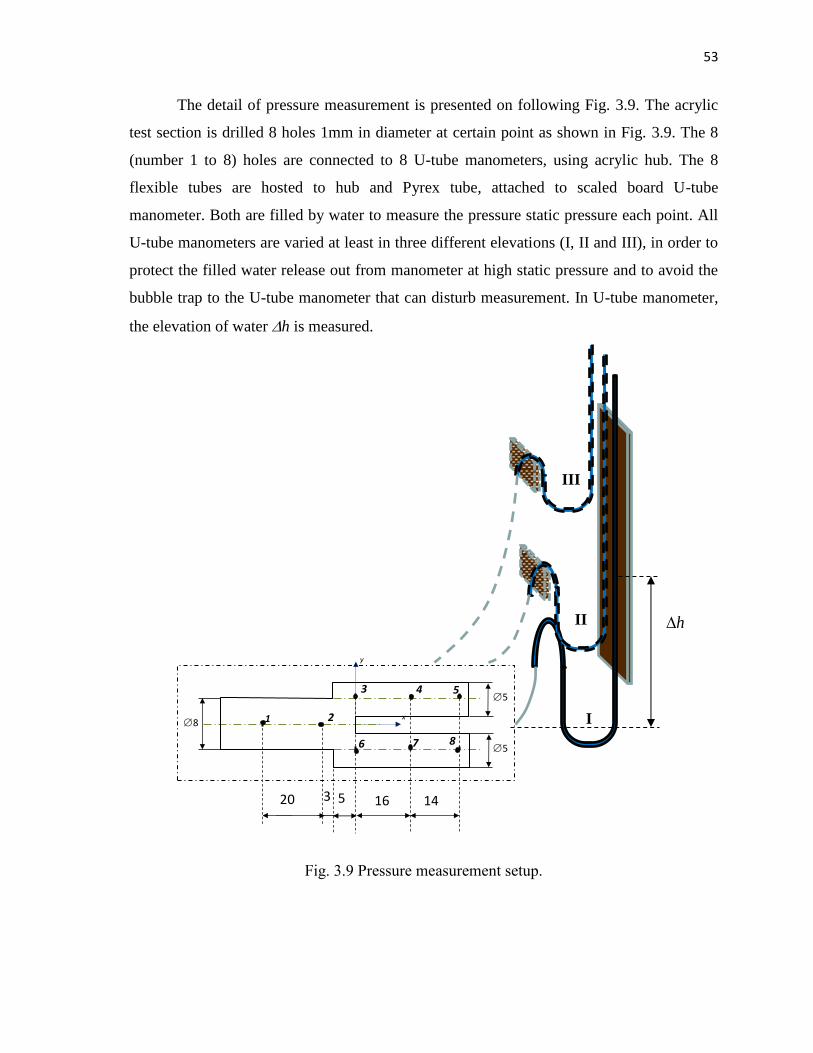
53
The detail of pressure measurement is presented on following Fig. 3.9. The acrylic
test section is drilled 8 holes 1mm in diameter at certain point as shown in Fig. 3.9. The 8
(number 1 to 8) holes are connected to 8 U-tube manometers, using acrylic hub. The 8
flexible tubes are hosted to hub and Pyrex tube, attached to scaled board U-tube
manometer. Both are filled by water to measure the pressure static pressure each point. All
U-tube manometers are varied at least in three different elevations (I, II and III), in order to
protect the filled water release out from manometer at high static pressure and to avoid the
bubble trap to the U-tube manometer that can disturb measurement. In U-tube manometer,
the elevation of water h is measured.
Fig. 3.9 Pressure measurement setup.
h
II
I
III
1 2
3 4 5
6 7 8
20 3 5 16 14
y
x
5
5
8
54
The static pressure is determined by hydrostatic equation 3.1
hgp water (3.1)
To achieve consistency, each measured point was repeated ten times and the measuring
uncertainty was analyzed by using a Moffat (1988) method. The maximum error of pressure
measurement is 6.27%, for bubble flow and slug flow, but for stratified flow the pressure
measurement error is larger, due to low static pressure and closing to minimum measuring
limit of instrument. The air and water flow rate is measured using positive displacement
bath flow meter. The maximum errors of the air and water flow rate measurements are
0.393% and 0.106%, respectively.
The experimental pressure loss is investigated on five zones or region; distributor
entrance, junction to upper and lower as well as upper and lower outlet channel. They are
denoted as pe, pju, pjl, pcu and pcl, respectively, formulated as following equation;
21 pppe (3.2)
32 ppp ju (3.3)
62 ppp jl (3.4)
431ppp
uc (3.5)
542ppp
uc (3.6)
761pppcl
(3.7)
872pppcl
(3.8)
3.3.2 Volume of Fluid Model
Based on work by Aziz et al. (2012), that in high superficial velocity for liquid or
gas the flow distribution tends to uniform in bifurcation channel distributor. Further, this
work is emphasized on low to moderate superficial velocity for both liquid and gas.
55
Accordingly, turbulence modeling is not necessary. Therefore, the VOF two-phase flow
model and unsteady solver could be applied. The domain model contains 218,476 T-grid
cells in which minimum volume of cell is 0.0258 mm3 and the maximum one is 0.5 mm
3.
The variables and properties of each cell are either representative of one phase or
representative of the mixture of the two phases, depending on the volume fraction value
Ahmad et al. (2007). The tracking of the interface between the two phases is accomplished
by the solution of the continuity equation for the volume fraction of one of the phases.
0.
q
q
t
(3.9)
A single momentum conservation equation is solved throughout the domain and the
resulting velocity field is shared among the two phases. The momentum equation, shown
below, is dependent on the volume fraction of all phases through the properties and .
FgPt
T
.).( (3.10)
where is the average mass density,
qq (3.11)
and is the average dynamic viscosity
qq (3.12)
3.3.2.1 Two-phase flow generator
Based on continuity law, the total measured quantity (volume flow rate) of water by
devices 10, QLo is equal to water quantity entering the two-phase flow generator, QLin.
Similarly, total measured quantity of air by devices 11, QGo is equal to air quantity entering
the two-phase flow generator, QGin.
Since the two-phase flow generator shown in Fig. 3.8(b) was simplified to model
Fig. 3.10. The superficial gas velocity of air, vGin enters center pipe by inlet diameter,
dGin=4mm, while the superficial liquid velocity of water, vLin enters coaxial surface with
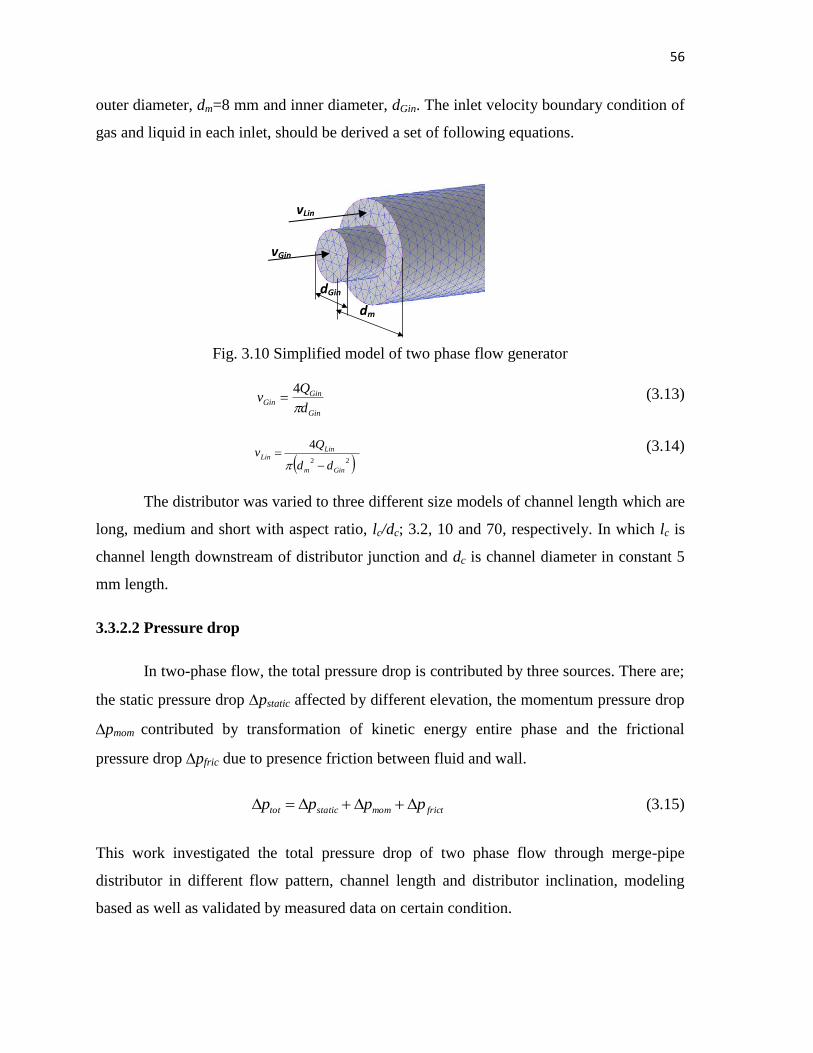
56
outer diameter, dm=8 mm and inner diameter, dGin. The inlet velocity boundary condition of
gas and liquid in each inlet, should be derived a set of following equations.
Fig. 3.10 Simplified model of two phase flow generator
Gin
GinGin
d
Qv
4 (3.13)
22
4
Ginm
LinLin
dd
Qv
(3.14)
The distributor was varied to three different size models of channel length which are
long, medium and short with aspect ratio, lc/dc; 3.2, 10 and 70, respectively. In which lc is
channel length downstream of distributor junction and dc is channel diameter in constant 5
mm length.
3.3.2.2 Pressure drop
In two-phase flow, the total pressure drop is contributed by three sources. There are;
the static pressure drop pstatic affected by different elevation, the momentum pressure drop
pmom contributed by transformation of kinetic energy entire phase and the frictional
pressure drop pfric due to presence friction between fluid and wall.
frictmomstatictot pppp (3.15)
This work investigated the total pressure drop of two phase flow through merge-pipe
distributor in different flow pattern, channel length and distributor inclination, modeling
based as well as validated by measured data on certain condition.
dGin
dm
vLin
vGin
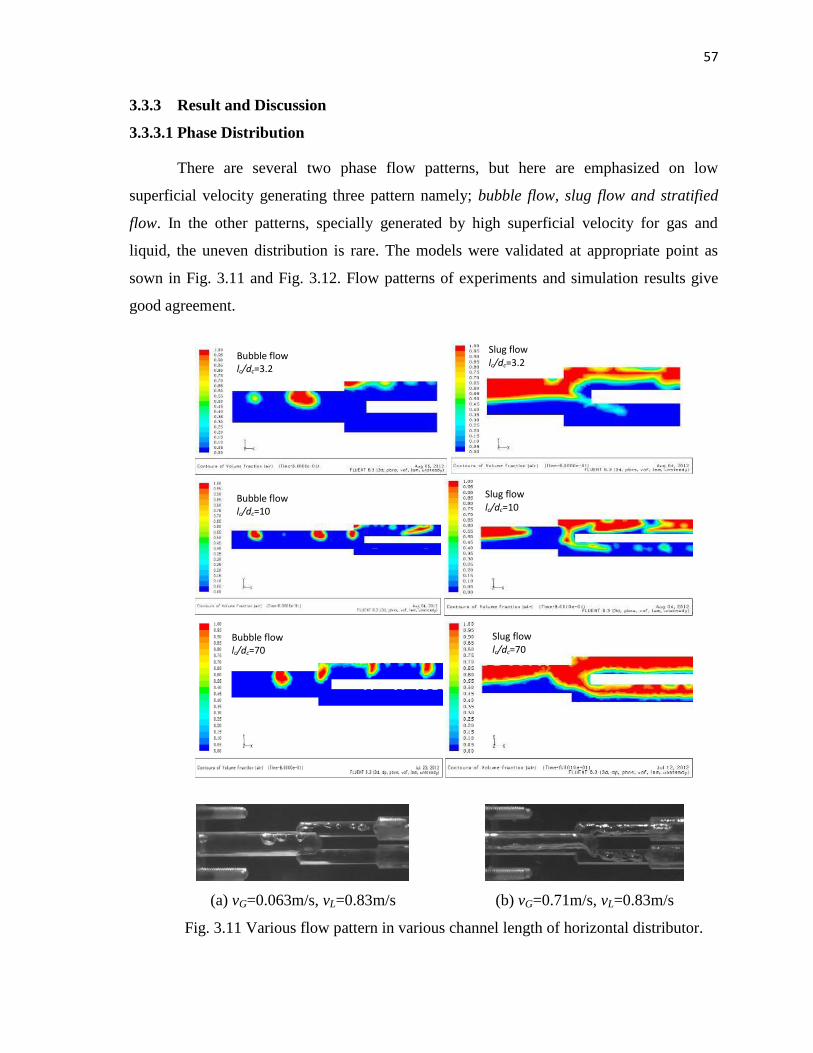
57
3.3.3 Result and Discussion
3.3.3.1 Phase Distribution
There are several two phase flow patterns, but here are emphasized on low
superficial velocity generating three pattern namely; bubble flow, slug flow and stratified
flow. In the other patterns, specially generated by high superficial velocity for gas and
liquid, the uneven distribution is rare. The models were validated at appropriate point as
sown in Fig. 3.11 and Fig. 3.12. Flow patterns of experiments and simulation results give
good agreement.
(a) vG=0.063m/s, vL=0.83m/s
(b) vG=0.71m/s, vL=0.83m/s
Fig. 3.11 Various flow pattern in various channel length of horizontal distributor.
Bubble flow lc/dc=3.2
Slug flow lc/dc=3.2
Slug flow lc/dc=70
Bubble flow lc/dc=70
Slug flow lc/dc=10
Bubble flow lc/dc=10
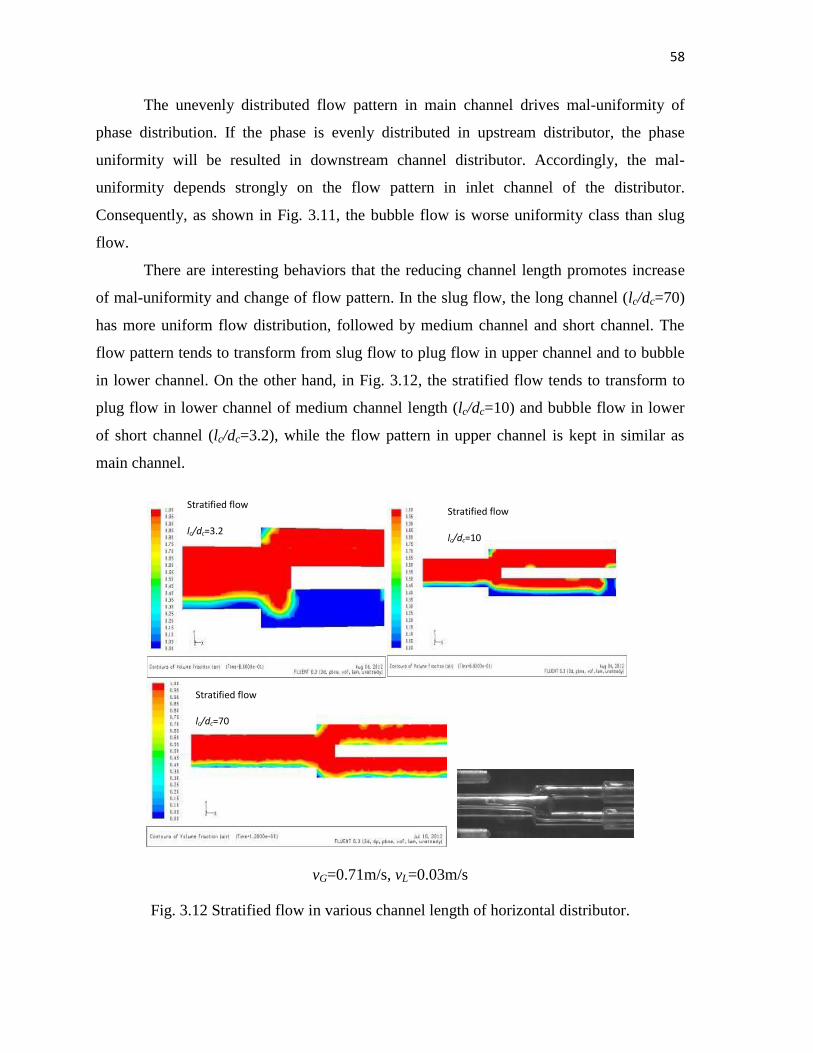
58
The unevenly distributed flow pattern in main channel drives mal-uniformity of
phase distribution. If the phase is evenly distributed in upstream distributor, the phase
uniformity will be resulted in downstream channel distributor. Accordingly, the mal-
uniformity depends strongly on the flow pattern in inlet channel of the distributor.
Consequently, as shown in Fig. 3.11, the bubble flow is worse uniformity class than slug
flow.
There are interesting behaviors that the reducing channel length promotes increase
of mal-uniformity and change of flow pattern. In the slug flow, the long channel (lc/dc=70)
has more uniform flow distribution, followed by medium channel and short channel. The
flow pattern tends to transform from slug flow to plug flow in upper channel and to bubble
in lower channel. On the other hand, in Fig. 3.12, the stratified flow tends to transform to
plug flow in lower channel of medium channel length (lc/dc=10) and bubble flow in lower
of short channel (lc/dc=3.2), while the flow pattern in upper channel is kept in similar as
main channel.
vG=0.71m/s, vL=0.03m/s
Fig. 3.12 Stratified flow in various channel length of horizontal distributor.
Stratified flow
lc/dc=70
Stratified flow
lc/dc=3.2
Stratified flow
lc/dc=10
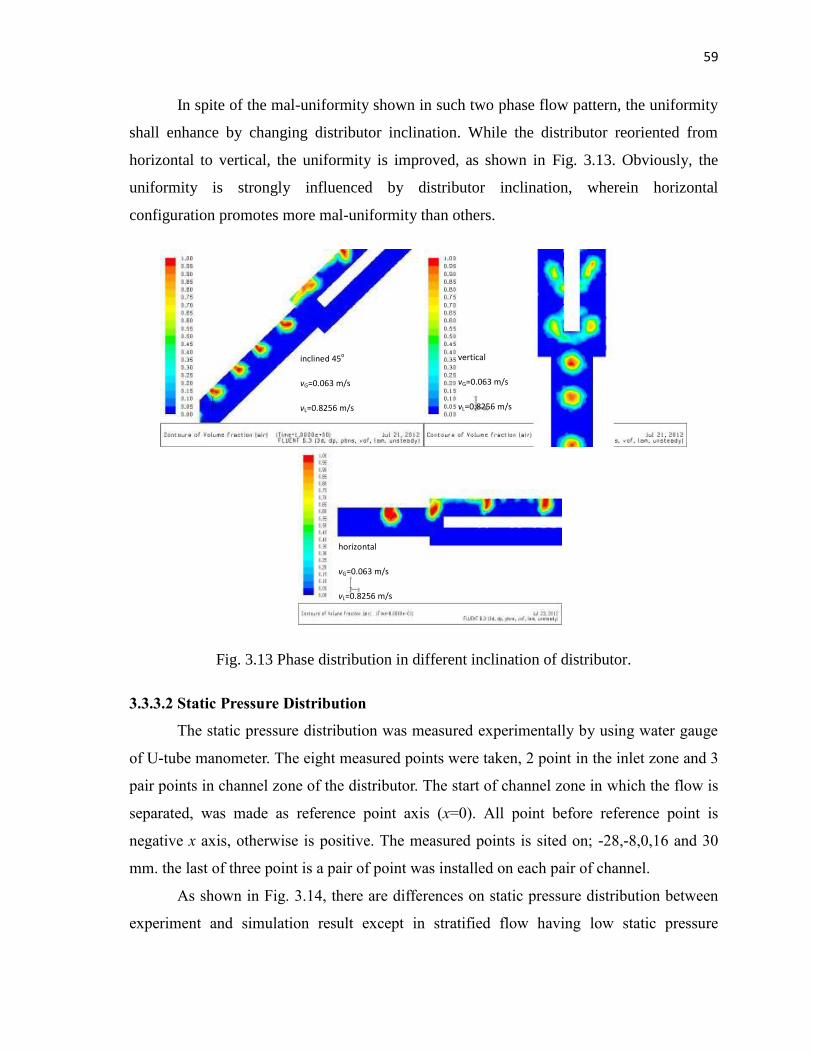
59
In spite of the mal-uniformity shown in such two phase flow pattern, the uniformity
shall enhance by changing distributor inclination. While the distributor reoriented from
horizontal to vertical, the uniformity is improved, as shown in Fig. 3.13. Obviously, the
uniformity is strongly influenced by distributor inclination, wherein horizontal
configuration promotes more mal-uniformity than others.
Fig. 3.13 Phase distribution in different inclination of distributor.
3.3.3.2 Static Pressure Distribution
The static pressure distribution was measured experimentally by using water gauge
of U-tube manometer. The eight measured points were taken, 2 point in the inlet zone and 3
pair points in channel zone of the distributor. The start of channel zone in which the flow is
separated, was made as reference point axis (x=0). All point before reference point is
negative x axis, otherwise is positive. The measured points is sited on; -28,-8,0,16 and 30
mm. the last of three point is a pair of point was installed on each pair of channel.
As shown in Fig. 3.14, there are differences on static pressure distribution between
experiment and simulation result except in stratified flow having low static pressure
inclined 45o
vG=0.063 m/s
vL=0.8256 m/s
vertical
vG=0.063 m/s
vL=0.8256 m/s
horizontal
vG=0.063 m/s
vL=0.8256 m/s
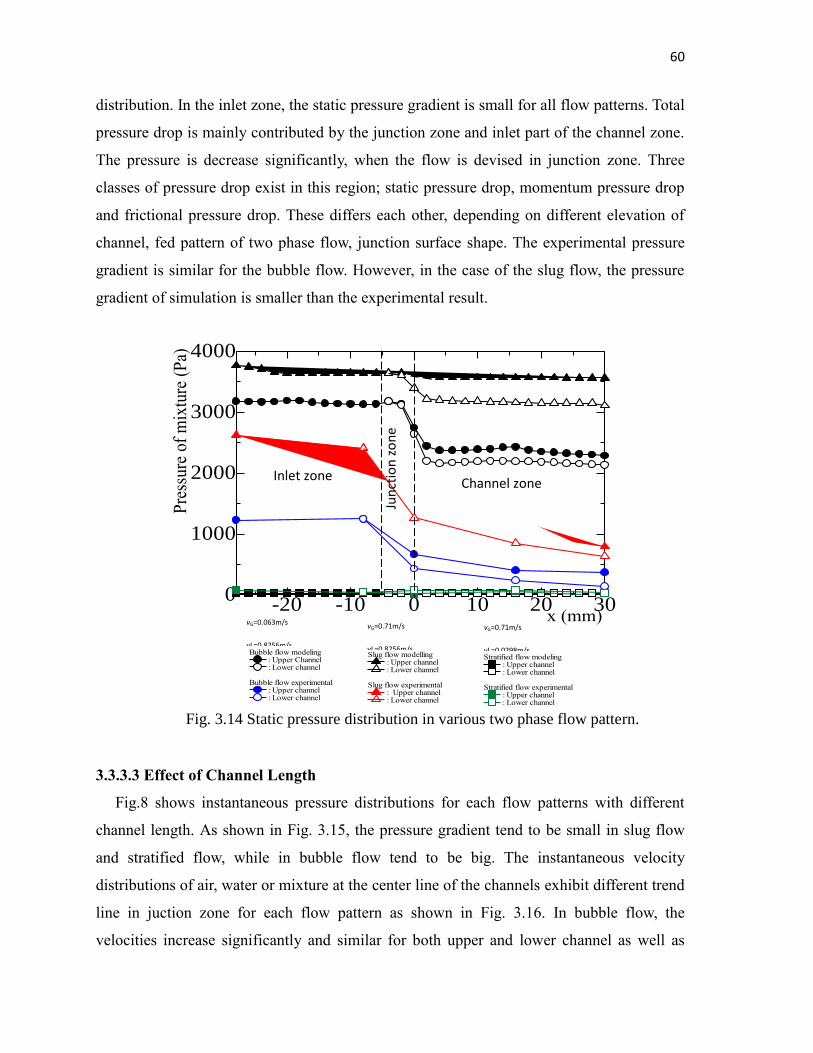
60
Fig. 3.14 Static pressure distribution in various two phase flow pattern.
distribution. In the inlet zone, the static pressure gradient is small for all flow patterns. Total
pressure drop is mainly contributed by the junction zone and inlet part of the channel zone.
The pressure is decrease significantly, when the flow is devised in junction zone. Three
classes of pressure drop exist in this region; static pressure drop, momentum pressure drop
and frictional pressure drop. These differs each other, depending on different elevation of
channel, fed pattern of two phase flow, junction surface shape. The experimental pressure
gradient is similar for the bubble flow. However, in the case of the slug flow, the pressure
gradient of simulation is smaller than the experimental result.
3.3.3.3 Effect of Channel Length
Fig.8 shows instantaneous pressure distributions for each flow patterns with different
channel length. As shown in Fig. 3.15, the pressure gradient tend to be small in slug flow
and stratified flow, while in bubble flow tend to be big. The instantaneous velocity
distributions of air, water or mixture at the center line of the channels exhibit different trend
line in juction zone for each flow pattern as shown in Fig. 3.16. In bubble flow, the
velocities increase significantly and similar for both upper and lower channel as well as
-20 -10 0 10 20 300
1000
2000
3000
4000
Pre
ssur
e of
mix
ture
(P
a)
x (mm)
Bubble flow modeling : Upper Channel : Lower channel
Bubble flow experimental : Upper channel : Lower channel
Stratified flow modeling : Upper channel : Lower channel
Stratified flow experimental : Upper channel : Lower channel
Slug flow modelling : Upper channel : Lower channel
Slug flow experimental : Upper channel : Lower channel
vG=0.063m/s
vL=0.8256m/s
vG=0.71m/s
vL=0.8256m/s
vG=0.71m/s
vL=0.0298m/s
Jun
ctio
n z
on
e
Inlet zone Channel zone
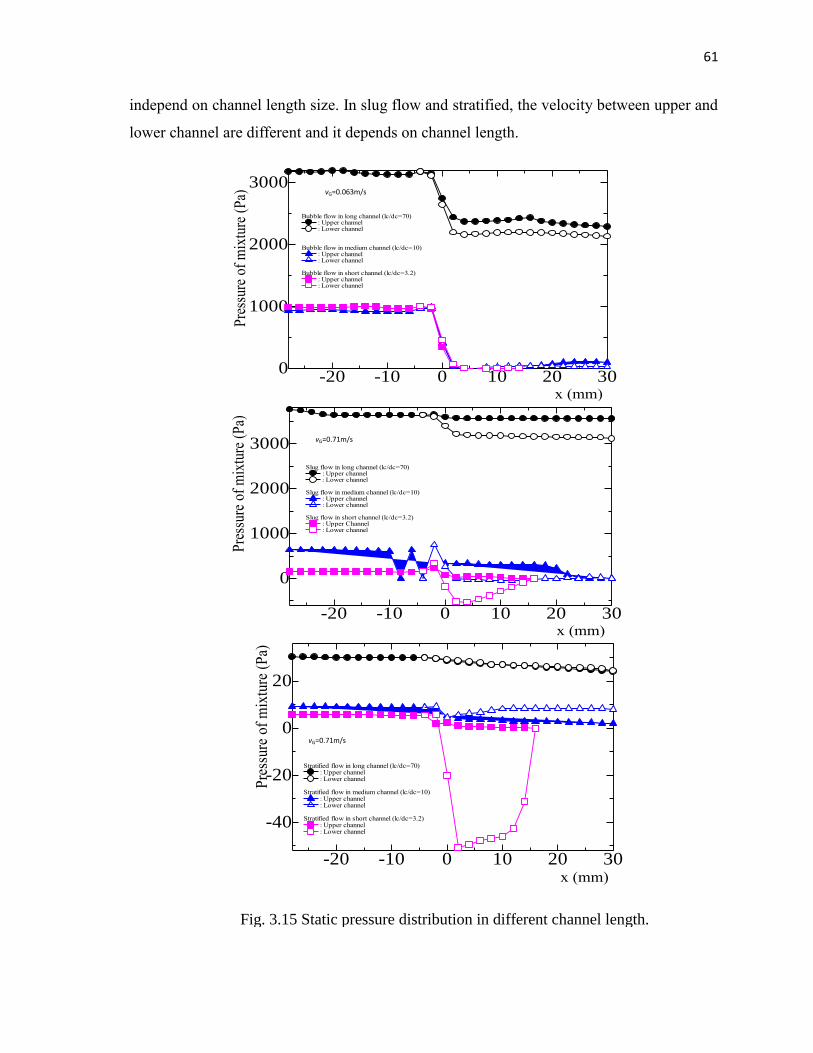
61
Fig. 3.15 Static pressure distribution in different channel length.
independ on channel length size. In slug flow and stratified, the velocity between upper and
lower channel are different and it depends on channel length.
-20 -10 0 10 20 300
1000
2000
3000
Pre
ssur
e of
mix
ture
(P
a)
x (mm)
Bubble flow in long channel (lc/dc=70) : Upper channel : Lower channel
Bubble flow in medium channel (lc/dc=10) : Upper channel : Lower channel
Bubble flow in short channel (lc/dc=3.2) : Upper channel : Lower channel
vG=0.063m/s
vL=0.8256m/s
-20 -10 0 10 20 30
0
1000
2000
3000
Slug flow in long channel (lc/dc=70) : Upper channel : Lower channel
Slug flow in medium channel (lc/dc=10) : Upper channel : Lower channel
Slug flow in short channel (lc/dc=3.2) : Upper Channel : Lower channel
Pre
ssur
e of
mix
ture
(P
a)
x (mm)
vG=0.71m/s
vL=0.8256m/s
vG=0.71m/s
vL=0.0298m/s
-20 -10 0 10 20 30
-40
-20
0
20
Stratified flow in long channel (lc/dc=70) : Upper channel : Lower channel
Stratified flow in medium channel (lc/dc=10) : Upper channel : Lower channel
Stratified flow in short channel (lc/dc=3.2) : Upper channel : Lower channel
Pre
ssur
e of
mix
ture
(P
a)
x (mm)
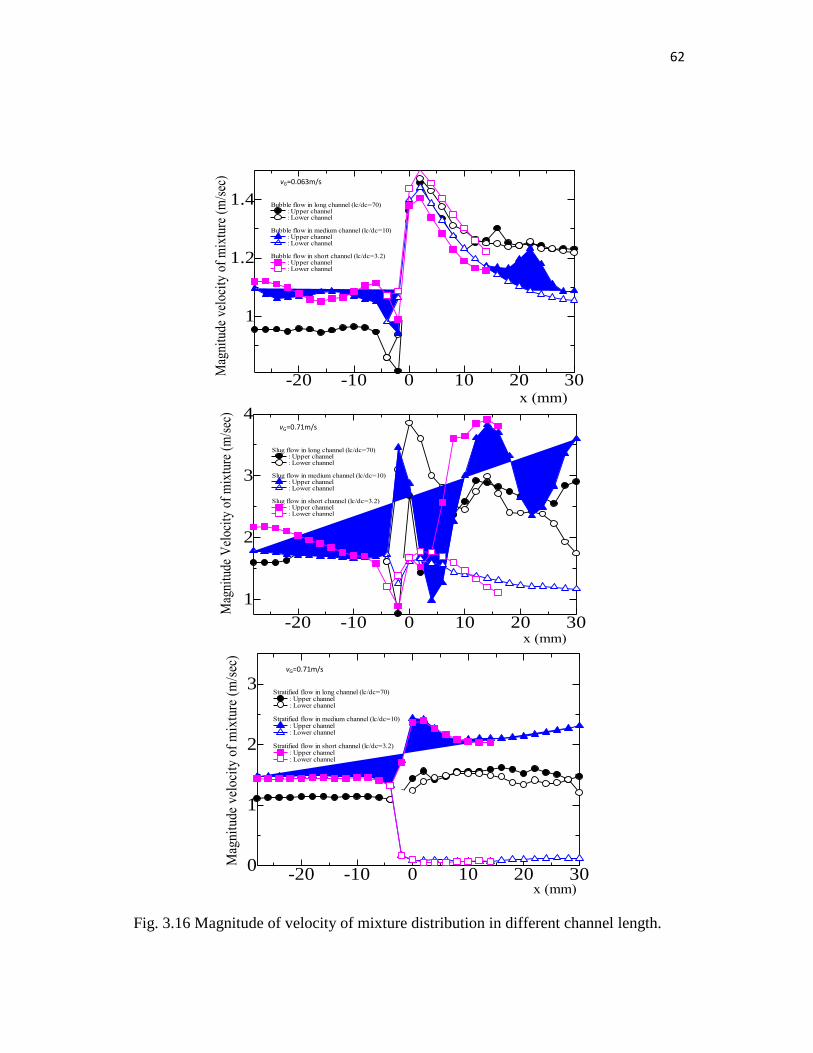
62
Fig. 3.16 Magnitude of velocity of mixture distribution in different channel length.
-20 -10 0 10 20 300
1
2
3
Mag
nit
ude
vel
oci
ty o
f m
ixtu
re (
m/s
ec)
x (mm)
Stratified flow in long channel (lc/dc=70) : Upper channel : Lower channel
Stratified flow in medium channel (lc/dc=10) : Upper channel : Lower channel
Stratified flow in short channel (lc/dc=3.2) : Upper channel : Lower channel
vG=0.71m/s
vL=0.0298m/s
-20 -10 0 10 20 30
1
1.2
1.4 Bubble flow in long channel (lc/dc=70) : Upper channel : Lower channel
Bubble flow in medium channel (lc/dc=10) : Upper channel : Lower channel
Bubble flow in short channel (lc/dc=3.2) : Upper channel : Lower channel
Mag
nitu
de v
eloc
ity
of m
ixtu
re (
m/s
ec)
x (mm)
vG=0.063m/s
vL=0.8256m/s
-20 -10 0 10 20 30
1
2
3
4
Slug flow in long channel (lc/dc=70) : Upper channel : Lower channel
Slug flow in medium channel (lc/dc=10) : Upper channel : Lower channel
Slug flow in short channel (lc/dc=3.2) : Upper channel : Lower channel
Mag
nitu
de V
eloc
ity
of m
ixtu
re (
m/s
ec)
x (mm)
vG=0.71m/s
vL=0.8256m/s
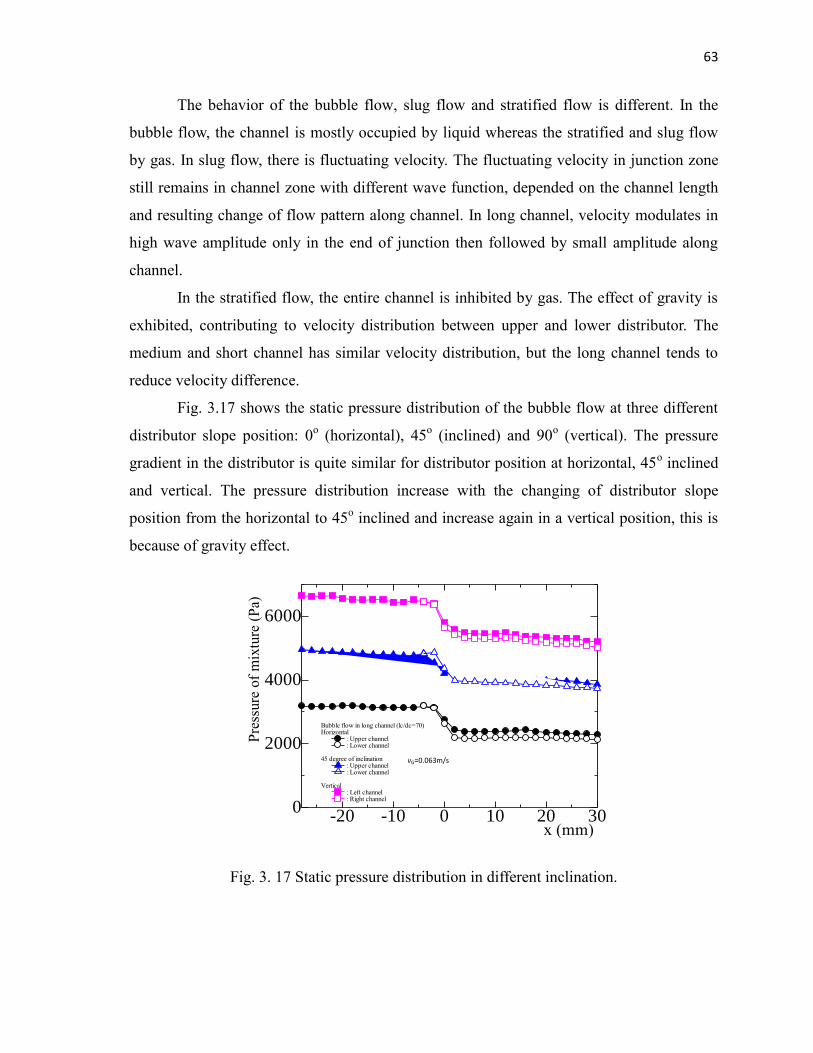
63
The behavior of the bubble flow, slug flow and stratified flow is different. In the
bubble flow, the channel is mostly occupied by liquid whereas the stratified and slug flow
by gas. In slug flow, there is fluctuating velocity. The fluctuating velocity in junction zone
still remains in channel zone with different wave function, depended on the channel length
and resulting change of flow pattern along channel. In long channel, velocity modulates in
high wave amplitude only in the end of junction then followed by small amplitude along
channel.
In the stratified flow, the entire channel is inhibited by gas. The effect of gravity is
exhibited, contributing to velocity distribution between upper and lower distributor. The
medium and short channel has similar velocity distribution, but the long channel tends to
reduce velocity difference.
Fig. 3.17 shows the static pressure distribution of the bubble flow at three different
distributor slope position: 0o (horizontal), 45
o (inclined) and 90
o (vertical). The pressure
gradient in the distributor is quite similar for distributor position at horizontal, 45o inclined
and vertical. The pressure distribution increase with the changing of distributor slope
position from the horizontal to 45o inclined and increase again in a vertical position, this is
because of gravity effect.
Fig. 3. 17 Static pressure distribution in different inclination.
-20 -10 0 10 20 300
2000
4000
6000
Pre
ssure
of
mix
ture
(P
a)
x (mm)
Bubble flow in long channel (lc/dc=70)Horizontal : Upper channel : Lower channel
45 degree of inclination : Upper channel : Lower channel
Vertical : Left channel : Right channel
vG=0.063m/s
vL=0.8256m/s
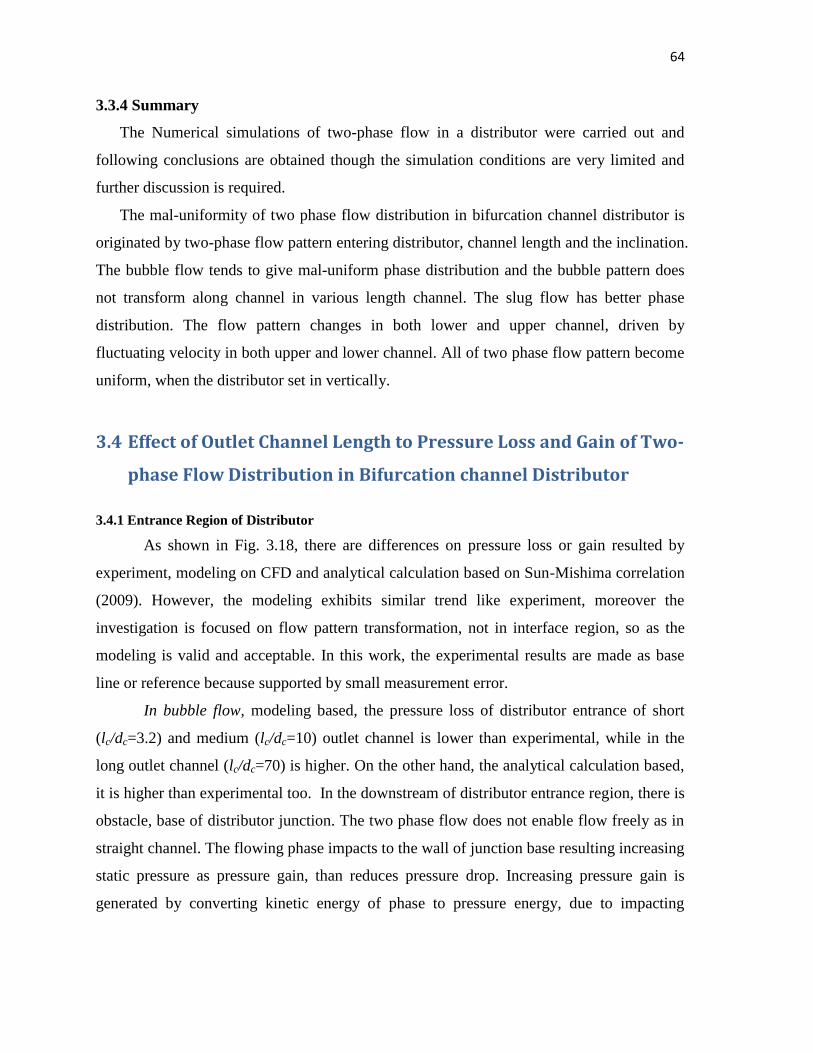
64
3.3.4 Summary
The Numerical simulations of two-phase flow in a distributor were carried out and
following conclusions are obtained though the simulation conditions are very limited and
further discussion is required.
The mal-uniformity of two phase flow distribution in bifurcation channel distributor is
originated by two-phase flow pattern entering distributor, channel length and the inclination.
The bubble flow tends to give mal-uniform phase distribution and the bubble pattern does
not transform along channel in various length channel. The slug flow has better phase
distribution. The flow pattern changes in both lower and upper channel, driven by
fluctuating velocity in both upper and lower channel. All of two phase flow pattern become
uniform, when the distributor set in vertically.
3.4 Effect of Outlet Channel Length to Pressure Loss and Gain of Two-
phase Flow Distribution in Bifurcation channel Distributor
3.4.1 Entrance Region of Distributor
As shown in Fig. 3.18, there are differences on pressure loss or gain resulted by
experiment, modeling on CFD and analytical calculation based on Sun-Mishima correlation
(2009). However, the modeling exhibits similar trend like experiment, moreover the
investigation is focused on flow pattern transformation, not in interface region, so as the
modeling is valid and acceptable. In this work, the experimental results are made as base
line or reference because supported by small measurement error.
In bubble flow, modeling based, the pressure loss of distributor entrance of short
(lc/dc=3.2) and medium (lc/dc=10) outlet channel is lower than experimental, while in the
long outlet channel (lc/dc=70) is higher. On the other hand, the analytical calculation based,
it is higher than experimental too. In the downstream of distributor entrance region, there is
obstacle, base of distributor junction. The two phase flow does not enable flow freely as in
straight channel. The flowing phase impacts to the wall of junction base resulting increasing
static pressure as pressure gain, than reduces pressure drop. Increasing pressure gain is
generated by converting kinetic energy of phase to pressure energy, due to impacting
65
process at end of junction distributor. The phase flow velocity is decelerated, Fig. 3.16,
reducing dynamic pressure energy and converting to static pressure energy.
Fig. 3.18 Pressure loss or gain in entrance region of distributor at different flow patterns.
Despite, the pressure loss of modeling based in entrance region of distributor will
equal to analytical based at certain length of outlet channel, but the meaning is difference.
In analytical based, using Sun-Mishima correlation, the correlation is built based on straight
channel without any restriction or obstacle. Therefore, there is no pressure gain effect.
jG=0.063 m s-1
jL=0.8256 m s-1
jG=0.71 m s-1
jL=0.8256 m s-1
jG=0.71 m s-1
jL=0.0298 m s-1
Experimental
66
Meanwhile, in the entrance region of long outlet channel distributor, the higher pressure
drop is resulted by multiple effects of pressure gain and loss. If the outlet channel length is
added, in the bubble flow, the pressure gain in entrance region increases, reducing pressure
loss. Thus, the pressure drop for short outlet channel distributor is higher than medium one.
When the length outlet channel is again added, the pressure gain will increase and continue
to reduce pressure drop up to minimum point at certain outlet channel length. The phase
flow will stagnant, further the static pressure entering distributor (operational pressure)
increase as depicted on Fig. 3.15, the new balance occurs with high pressure drop is
resulted. Hence, the pressure drop of long outlet channel distributor is the highest. The
‘modulating pressure drop’ phenomenon may be happen in transient mode, before reaching
steady state.
Also, if the outlet channel length is extended carefully, pressure loss of entrance
region, modeling based, will equal to experimental based may be at channel length slightly
higher than medium outlet channel, lc/dc=10. Perhaps, in this condition, the flow becomes
‘quasi’ balance between upstream and downstream junction distributor. This occurs in
different length of outlet channel depend on flow pattern as shown in Fig.3.18 and each
junction, Fig. 3.19 and 3.20. Though, in the quasi balance condition, the pressure drop of
modeling based will equal to experimental based, but it cannot represent equality. Because,
the modeling based disregards shear stress of interface between gas phase and liquid phase.
The analytical pressure drop tends to higher than experimental ones, because it
assumes the channel is straight and is not any restriction or obstacle as well as ignored
interface shear stress. Hence, here is no pressure gain. There have not been, proper
correlation for this case and limited researches emphasizing on it. In order to develop new
universal correlation of pressure drop in future. It is a good challenge to enhance
knowledge through investigating phenomenon of impacting wall of two-phase internal flow
by mean integrating between experimental and modeling based with considering interface
shear stress.
The behavior of slug flow in entrance distributor is similar to bubble flow both of
modeling based and correlation based, but in the bubble flow the ‘quasi balance’ region
comes earlier, at length ratio lc/dc<10. The slug flow is formed by increasing gas superficial
velocity at the same liquid superficial velocity. The gas adds ‘obstacle’ flowing phase
67
through distributor junction. Consequently, the pressure gain in the distributor entrance
region increases more. The characteristic of obstacle by gas is different from obstacle by
length of outlet channel. The more quantity of gas, distributed around limited liquid,
contributes gas oscillates in the junction and affecting to modulate magnitude velocity in
the outlet channels at different amplitude of wave depend on outlet channel length of
distributor as shown in Fig. 3.16. The oscillating velocity effect is subtle in the entrance
region because damped by existing sufficient quantity of liquid. In the long outlet channel
(lc/dc=70), the dumping effect by slug flow stronger than by bubble flow, indicated by big
gap pressure loss between model and experimental. This fact matches with Beguin’s works
(2009), because his experimental setup, the end of channel is filtered. Thus, it closes to long
outlet channel mode. Accordingly, the existing pressure loss and gain promoted by existing
oscillation and damping among phase is proven. The using combination analysis between
experimental and modeling is valid.
Different from other flow pattern, the stratified flow has very low liquid quantity.
In spite of low liquid quantity, but the effect of damping is bigger. Because, there is
significant difference of superficial velocity between gas and liquid, in which liquid
superficial velocity is lower than gas superficial velocity, so that the air is damped by water,
resulting over pressure gain or negative pressure loss, as shown in Fig. 3.18. In the other
word, the damping effect can be increased by increasing air superficial velocity and
decreasing liquid superficial velocity. Indeed, this condition is unstable. Moreover it is in
the low pressure, so that the flow through distributor looks like intermittent flow as well as
the pressure measurements is disturbed resulting bigger errors.
3.4.2 Junction Region of Distributor
In junction region, the phases is devised to two parts; to upper outlet channel and to
lower outlet channel with different behavior of velocity, pressure drop or gain as well as
phase distribution. These are influenced by fed flow pattern, outlet channel length, Fig. 3.12
and 3.13, and inclination, Fig. 3.14.
The pressure drop or gain in junction to upper outlet channel of distributor is
depicted on Fig. 3.19. In bubble flow, in short outlet channel, the magnitude velocity, Fig.
3.16, is bigger than others and either in lower cannels wherein almost free from the
‘obstacle’ of gas, is bigger than in upper outlet channel. In bubble flow, though it has more
68
liquid, but in this case, the superficial velocity of gas is limited. Therefore, the effect of
damping also reduces to minimum. Instead of minimum damping effect, the pressure loss is
increases significantly, closing to single phase liquid flow. Accordingly, both of upper and
lower outlet channel have similar magnitude velocity, Fig. 3.16.
For the slug flow, although in upper and lower outlet channel is damped by liquid,
but it is insufficient, due to similar superficial velocity in between gas and liquid. Still, the
damping process is supported by outlet channel length. In the long outlet channel
distributor, the magnitude velocity of junction to upper outlet channel is smaller than to
lower outlet channel due to more ‘obstacle’ of gas (more damping effect) in upper outlet
channel than others, Fig. 3.16. However, in the medium outlet channel, the magnitude
velocity of junction to upper outlet channel is higher than to lower outlet channel.
Therefore, the damping effect by outlet channel length is reduced significantly promoting
unbalance damping by liquid between upper and lower outlet channel, wherein upper outlet
channel is under damp and lower is over damp. Consequently, the different flow pattern is
formed between upper and lower outlet channel.
In the junction of short outlet channel, the gas phase tend to flow freely to upper outlet
channel due to small gravity effect, forming plug flow and the liquid flow to lower outlet
channel owing to more gravity effect, forming bubble flow, Fig. 3.12, so that the damping
effect is unbalance in between upper and lower outlet channel. The damping effect in upper
outlet channel is bigger due to more ‘obstacle of gas’ than in lower outlet channel. Until the
pressure loss in junction to upper outlet channel, Fig. 3.19 is smaller than it is in junction to
lower outlet channel, Fig. 3.20. Consequently, in the upper outlet channel the magnitude
velocity is smaller, followed by oscillating effect in high amplitude in upper outlet channel,
due to the minimum dumping by outlet channel. But, in lower outlet channel, the
magnitude velocity is high, while the oscillating effect in the lower outlet channel is
disappeared, Fig. 3.16.
The stratified flow in the junction is different from it in the entrance region, in
which impacting phase effect is dominant. While, in the junction the phase is devised and
expanded through downstream of ‘orifice’, producing high pressure loss. Ultimately, the
pressure gain is disappeared, covered by high pressure loss, Fig. 3.19-3.20. Although, the
damping effect in junction is limited, but the damping effect in outlet channel is significant,
69
especially in lower outlet channel, Fig. 3.21-3.22. The damping effects, is meanly
supported by outlet channel length, so that in the junction of long outlet channel distributor,
the magnitude velocity is devised in little difference between lower and upper outlet
channel, wherein to the upper outlet channel is higher than in to the lower outlet channel,
due to additional liquid damping in lower outlet channel, Fig.3.16. The effect of damping
by outlet channel length decreases along with reducing outlet channel length. Accordingly,
in the junction of medium and short outlet channel, the magnitude velocity between upper
and lower outlet channel devise in different significant value. This affects to which the part
of gas phase in lower outlet channel is sucked back to upper outlet channel, intermittently.
Thus, the flow pattern tends to transform to slug flow in lower outlet channel, not in upper
outlet channel.
Fig. 3.19 Pressure loss or gain in junction to upper outlet channel of distributor at different
flow patterns.
jG=0.063 m s-1
jL=0.8256 m s-1
jG=0.71 m s-1
jL=0.8256 m s-1
jG=0.71 m s-1
jL=0.0298 m s-1
70
Obviously, in the junction the effect of oscillating and damping among phases exist in all
flow patterns with different impact level. The highest impact level is in slug flow, followed
by stratified flow and the lowest one is in bubble flow. Therefore, the modeling pressure
drop of slug flow in the junction has the biggest gap with experimental results, while the
bubble flow has the lowest gap with them, Fig. 3.19. The analytical pressure drop defined
by correlation has slightly gap with experimental data. Because, the analytically pressure
drop, the effect of oscillating and damping as well as the interface shear stress of phases are
denied.
Fig. 3.20 Pressure loss or gain in junction to lower outlet channel of distributor at different
flow patterns.
jG=0.063 m s-1
jL=0.8256 m s-1
jG=0.71 m s-1
jL=0.8256 m s-1
jG=0.71 m s-1
jL=0.0298 m s-1
Hwang-Lahey
71
Similar to junction to upper outlet channel, Fig. 3.19, the junction to lower outlet channel
is, as depicted on pressure drop distribution in Fig. 3.20. The pressure loss or gain of
junction to lower outlet channel by the bubble flow tend to in similar level between
modeling based and analytical based, but for experimental based exhibit higher than others.
The effect of outlet channel length is not significant, influencing pressure loss, due to
minimum damping effect resulted by combination low gas superficial velocity and more
liquid superficial velocity. The higher pressure loss in experimental shall be affected by
more irreversibility producing bigger two-phase pressure coefficient than formulated in
equation (2.79). Hence, the two-phase flow coefficient for this bifurcation channel
distributor shall be reconstructed.
3.4.3 Outlet channel Region of Distributor
Two section of outlet channel was investigated; first and second section. The first
section begins from zero coordinate, outlet of junction, up to 16 mm distance of x
coordinate and the second section starts from 16 mm up to 30 mm of x coordinate, Fig.
3.8c.
The pressure loss and gain of upper outlet channel is figured by Fig. 3.21. In the
bubble flow, the pressure drop is increase by increasing upper outlet channel length and
followed by increasing pressure gain due to upper outlet channel damping effects,
proportional to upper outlet channel length too. Therefore, the pressure loss in short upper
outlet channel is small, than increase in medium upper outlet channel first section followed
by small pressure gain in second section and finally reduced pressure loss in the first and
second section of long upper outlet channel of distributor.
In the slug flow, the pressure loss in short upper outlet channel is the highest due to
limited liquid damper or minimum pressure gain. In medium, the effect of upper outlet
channel damping is dominant in second section of medium upper outlet channel.
Unfortunately, more additional upper outlet channel length, the damping effect by upper
outlet channel length is weaker than increasing pressure loss by upper outlet channel length.
This can be concluded that in slug flow, the damping effect by upper outlet channel length
plays effectively in certain length of upper outlet channel.
In the stratified flow, though the pressure gain is the highest in the entrance region,
due to impacting process, but in the junction the effect of damping is covered by the big
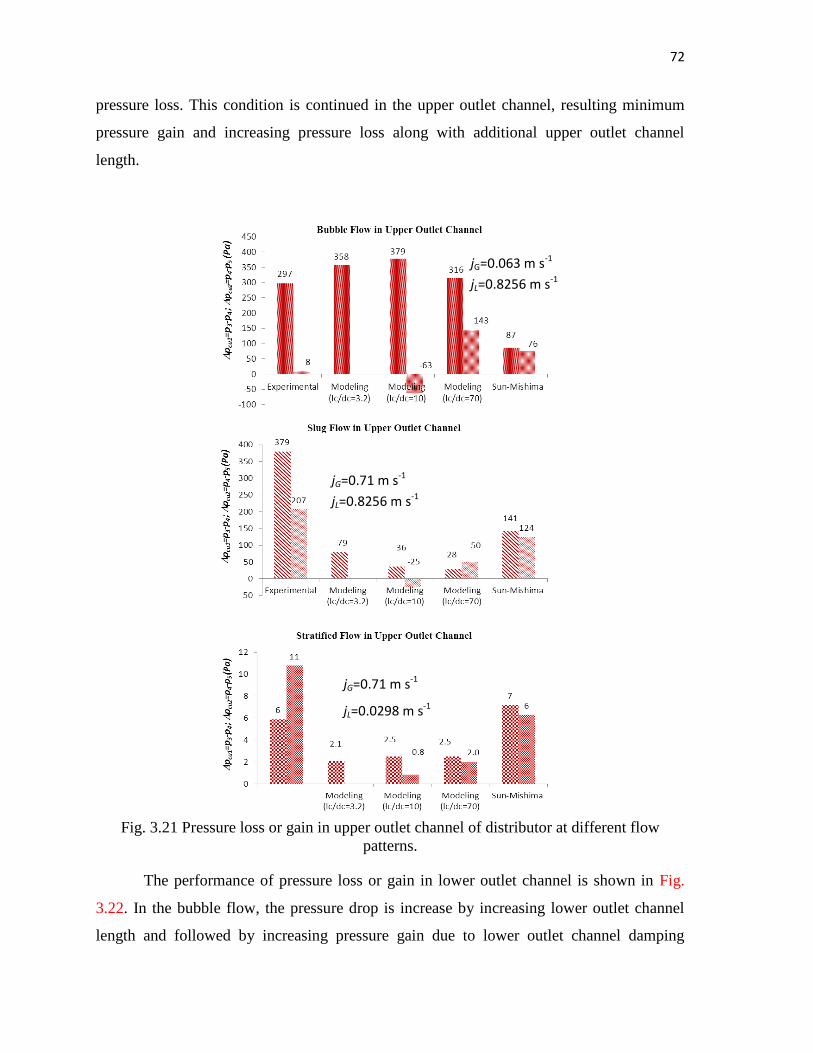
72
pressure loss. This condition is continued in the upper outlet channel, resulting minimum
pressure gain and increasing pressure loss along with additional upper outlet channel
length.
Fig. 3.21 Pressure loss or gain in upper outlet channel of distributor at different flow
patterns.
The performance of pressure loss or gain in lower outlet channel is shown in Fig.
3.22. In the bubble flow, the pressure drop is increase by increasing lower outlet channel
length and followed by increasing pressure gain due to lower outlet channel damping
jG=0.063 m s-1
jL=0.8256 m s-1
jG=0.71 m s-1
jL=0.8256 m s-1
jG=0.71 m s-1
jL=0.0298 m s-1
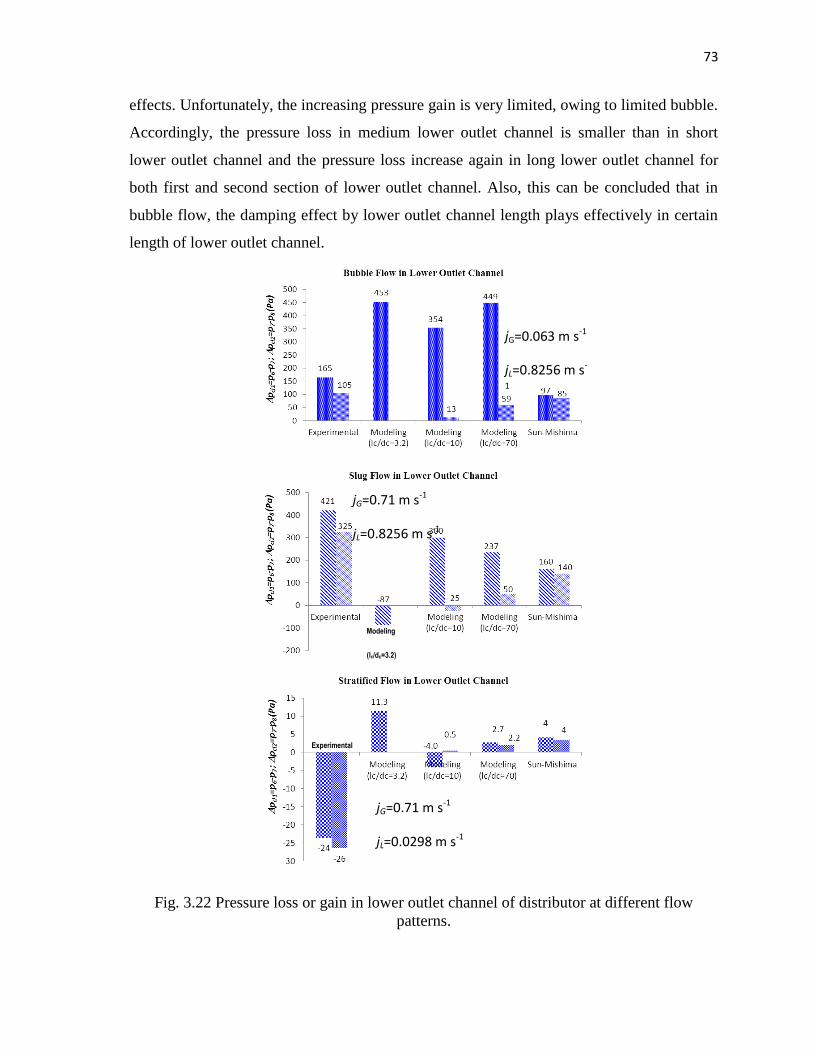
73
effects. Unfortunately, the increasing pressure gain is very limited, owing to limited bubble.
Accordingly, the pressure loss in medium lower outlet channel is smaller than in short
lower outlet channel and the pressure loss increase again in long lower outlet channel for
both first and second section of lower outlet channel. Also, this can be concluded that in
bubble flow, the damping effect by lower outlet channel length plays effectively in certain
length of lower outlet channel.
Fig. 3.22 Pressure loss or gain in lower outlet channel of distributor at different flow
patterns.
Modeling
(lc/dc=3.2)
jG=0.71 m s-1
jL=0.8256 m s-1
jG=0.063 m s-1
jL=0.8256 m s-
1
jG=0.71 m s-1
jL=0.0298 m s-1
Experimental
74
In the slug flow, in short lower outlet channel, instead of disappearing pressure loss
is existing pressure gain. The pressure loss increases along with increasing lower outlet
channel length, but pressure gain exhibits decrease in medium lower outlet channel and
increase again in long lower outlet channel. This phenomenon is caused by fluctuating
velocity as described above.
Now, the stratified flow behavior is different from others. In the experimental
result shows high pressure gain for both first and second section of lower outlet channel.
The gas phase is sucked back to upper outlet channel, due to significant different phase
velocity between upper and lower outlet channel.
Similar as in upper outlet channel, the pressure loss and gain of lower outlet
channel experimental based exhibit bigger than both modeling and analytical based. Except
in bubble flow, wherein pressure loss modeling based is bigger than experimental results.
These are caused by uncovered effect of oscillating and damping as well as interface shear
stress of phases along outlet channel in both of modeling and analytical based. Perhaps, in
slug and stratified flow their effect will be dominant within impacting process, but for
bubble flow will be dominant in straight outlet channel.
Only in entrance region of distributor with long outlet channel, the slug flow and
stratified flow have higher pressure gain than the bubble flow has. This indicated that the
Beguin’s works is not valid for junction and outlet channel. Therefore, the Beguin’s
correlation shall be revisited.
3.4.4 Summary
Numerical simulations of two-phase flow in a distributor were carried out. Although the
simulation conditions are limited and further discussion is required, the experimental results
give better support to obtain following conclusions;
1. The mal-uniformity of two phase flow distribution in bifurcation channel distributor is
originated by two-phase flow pattern entering distributor, length of outlet channel and
the inclination.
2. The bubble flow tends to give mal-uniform phase distribution and the bubble pattern
does not transform along outlet channel in various length of outlet channel. All of two
phase flow pattern become uniform in distribution, when the distributor is set vertically
75
3. The slug have better phase distribution and the flow pattern changes in both lower and
upper outlet channel, while in stratified flow , it changes in lower outlet channel only.
4. The impacting two phase flow in the entrance region of bifurcation channel distributor
promotes varying of pressure loss and pressure gain not only in entrance zone, but also
in junctions as well as in the outlet channels
5. The varying of pressure loss and pressure gain tend to what be caused by oscillating and
damping process of air and water phase, promoting fluctuating velocity and pattern
transformation in outlet channels.
6. The oscillating and dumping process among phases in entrance region has good
agreement with Beguin’s works (2009), but junction and outlet channels region does
not.
76
3.5 References
Ahmad, M., Fourmigue, J. F., Mercier, P. and Berthoud, G., (2007), CFD simulation of a
stratified flow at the inlet of a compact plate heat exchanger, Proc. of Fourth Int.
Conference on Computational Method in Multiphase Flow 4, p. 75-85.
Ahmad, M., Fourmigue, J. F., Mercier, P., and Berthoud, G., (2007), CFD simulation of a
stratified flow at the inlet of a compact plate heat exchanger, Proc. Fourth International
Conf. on Computational Method in Multiphase Flow4, p. 75-85.
Akers, W.W., Deans, H.A., Crosser, O.K., (1958), Condensing heat transfer within
horizontal tubes, Chem. Eng. Prog. 54, p. 89–90.
Al-Rawashdeh, M., Fluitsma, L.J.M., Nijhuis, T.A., Rebrov, E.V., Hessel, V. and Schouten,
J.C., (2012), Design criteria for a barrier-based gas-liquid flow distributor for parallel
micro channels, Chemical Engineering J. 181–182, p. 549–556
Aziz, A, Miyara, A. and Sugino, F., (2012), Distribution of two-phase flow in a distributor.
J. Engineering Science and Technology 7 (1), p. 41-55.
Beattie, D.R.H. and Whalley, P.B., (1982), A simple two-phase frictional pressure drop
calculation method, Int. J. Multiphase Flow 8, p. 83–87.
Beguin, C., Anscutter, F., Ross, A., Pettigrew, M.J. and Mureithi, N.W., (2009), Two-phase
damping and interface surface area in tubes with vertical internal flow, J. Fluids and
Structures 25, p. 178–204.
Bejan. A., (1997), Constructal tree network for fluid flow between a finite-size volume and
one source or sink, Rev Gen Therm. @ Elsevier, Paris 36, p. 592-604.
Chen, I.Y., Yang, K.S., Chang, Y.J. and Wang, C.C., (2001), Two-phase pressure drop of
air-water and R-410A in small horizontal tubes, Int. J. Multiphase Flow 27, p. 1293–
1299.
Chin, W.M., and Raghavan, V.R., (2011), On the adverse influence of higher statistical
moments of flow mal-distribution on the performance of a heat exchanger, J. of
International Journal of Thermal Sciences, vol. 50, pp. 581-591.
Cho, K. H., Lee, J., Kim, M.H. and Bejan, A., (2010), Vascular design of constructal
structures with low flow resistance and nonuniformity, Int. J. Thermal Sciences 49, p.
77
2309-2318.
Cicchitti, A., Lombardi, C., Silvestri, M., Soldaini, G. and Zavalluilli, R., (1960), Two-
phase cooling experiments-pressure drop, heat transfer and burnout measurements,
Energia nucleare 7, p. 407–425.
Dukler, A.E., Wicks, M. and Cleaveland, R.G., (1964), Pressure drop and hold up in two-
phase flow, AIChE J. 10, p. 38–51.
Fan, Z., Zhou, X., Luo, L. and Yuan, W., (2008), Experimental investigation of the flow
distribution of a 2-dimensional constructal distributor, Experimental Thermal and Fluid
Science 33, p. 77-83.
Friedel, L., (1979), Improved friction pressure drop correlations for horizontal and vertical
two-phase pipe flow, European Two-phase Group Meeting, Ispra, Italy, Paper E2.
Gandhi, M.S., Gangulia, A.A., Joshia, J.B., and Vijayan, P.K., (2012), CFD simulation for
steam distribution in header and tube, J. of Chemical Engineering Research and
Design, vol. 90, pp. 487–506.
Gresh, T., (2001), Compressor Performance: Aerodynamics for the User, Elsevier Science
& Technology Books, March, ISBN: 0750673427.
He, K., Wang, S., and Huang,J., (2011), The effect of flow pattern on split of two-phase
flow through a micro-T-junction, J. of International Journal of Heat and Mass Transfer,
vol. 54, pp. 3587–3593.
Hewitt, G.F. and Hall Taylor, N.S., (1970), Annular Two-phase Flow, Pergamon Press,
Oxford.
Hwang, S.T. and Lahey, R.T., (1988), A study on single- and two-phase pressure drop in
branching conduits, Exp. Therm. Fluid Sci. 1, p. 111–125.
Kim, S.M. and Mudawar, I., (2012), Universal approach to predicting two-phase frictional
pressure drop for adiabatic and condensing mini/micro-channel flows, Int. J. Heat and
Mass Transfer 55, p. 3246–3261
Lee, H.J. and Lee, S.Y., (2001) Pressure drop correlations for two-phase flow within
horizontal rectangular channels with small heights, Int. J. Multiphase Flow 27, p. 783–
796.
78
Lin, S., Kwok, C.C.K., Li, R.Y., Chen, Z.H. and Chen, Z.Y., (1991), Local frictional
pressure drop during vaporization of R-12 through capillary tubes, Int. J. Multiphase
Flow 17, p. 95–102.
Liu, H., Li, P. and Lew, J. V., (2010), CFD study on flow distribution uniformity in fuel
distributors having multiple structural bifurcations of flow channels, Int. J. Hydrogen
Energy 35, p. 9186-9198.
Lockhart, R.W. and Martinelli, R.C., (1949), Proposed correlation of data for isothermal
two-phase, two-component flow in pipes, Chem. Eng. Prog. 45, p. 39–48.
Luo, L. and Tondeur, D., (2005), Multiscale optimization of flow distribution by constructal
approach. China Particuology 3(6), p. 329-336.
Luo, L., Tondeur, D., Le Gall, H. and Corbel, S., (2007), Constructal approach and multi-
scale components, Applied Thermal Engineering 27, p. 1708–1714.
Mannini, C., Soda, A. and Schewe, G., (2010), Unsteady RANS modelling of flow past a
rectangular cylinder: Investigation of Reynolds number effects, J. Computers & Fluids
39, p. 1609–1624.
Marchitto, A., Fossa, M., and Guglielmini, G., (2012), The effect of the flow direction
inside the header on two-phase flow distribution in parallel vertical channels, J. of
Applied Thermal Engineering 36, p. 245-25.
McAdams, W.H., Woods, W.K. and Heroman, L.C., (1942), Vaporization inside horizontal
tubes, II. Benzene-oil mixture, Trans. ASME 64, p. 193–200.
Miguel, A.F., (2010), Special Brief Communication, Dendritic structures for fluid flow:
Laminar, turbulent and constructal design, J. Fluids and Structures 26, p. 330-335.
Moffat, R.J., (1988), Describing the uncertainties in experimental results, J. Experimental
Thermal and Fluid Science 1, p. 3–17.
Müller-Steinhagen, H. and Heck, K., (1986), A simple friction pressure drop correlation for
two-phase flow in pipes, Chem. Eng. Process. 20, p. 297–308.
Mustaghfirin, M.A., Miyara, A., Aziz , A., and Sugino, F., (2012), Uniformity of Two-
phase Flow Distribution in Curved Round Distributor, Proc. International Conf. on
Fluid Dynamics and Thermodynamics Technologies (FDTT 2012) 33, p. 76-81.
79
Owens, W.L., (1961), Two-phase pressure gradient. Int. Dev. Heat Transfer, Pt. II., ASME,
New York.
Ramos-Alvarado, B., Hernandez-Guerrero, A., Elizalde-Blancas, F. and Ellis, M.W., (2011),
Constructal flow distributor as a bipolar plate for proton exchange membrane fuel cells,
International J. Hydrogen Energy 36, p. 12965-12976A
Smith, S.L., (1969), Void fractions in two-phase flow: a correlation based upon an equal
velocity head model, Proc. of the Institution of Mechanical Engineers 36, p. 647–664.
Sun, L. and Mishima, K., (2009), Evaluation analysis of prediction methods for two-phase
flow pressure drop in mini-channels, Int. J. Multiphase Flow 35, p. 47–54.
Tapucu, A., Teyssedou, A., Troche, N. and Merilo, M., (1989), Pressure losses caused by
changes in a single channel flow under two-phase flow, Int. J. Multiphase Flow 15-1, p.
51-64
Tondeur, D. and Luo, L., (2004), Design and scaling laws of ramified fluid distributors by
the constructal approach, Chemical Engineering Science 59, p. 1799-1813.
Wen, M.Y., Lee, C.H., and Tasi, J.C., (2008), Improving two-phase refrigerant distribution
in the manifold of the refrigeration system, J. of Applied Thermal Engineering, vol. 28,
pp. 2126–2135.
Zhang,T.J., Wen, J.T., Julius, A., Peles, Y., and Jensen, M.K., (2011), Stability analysis
and mal-distribution control of two-phase flow in parallel, J. of International Journal of
Heat and Mass Transfer, vol. 54, pp. 5298–5305.

80
Chapter 4 Two-phase Flow Distribution in Plate Heat Exchanger
Introduce to heat exchanger including; process, classification and application. Further, describe more detail about Plate Heat Exchanger,
PHE, particularly Brazed Plate Heat Exchanger
Although the improving design of plate heat exchanger has been done, the optimum design has not been achieved yet. This initial work
was begun by comparing the performance of protrusion plate and corrugation ones, modeling based. The investigation had been
undertaken for single phase laminar flow of water with constant surface temperature approach for entire plate. The boundary conditions
are; water inlet velocity: 0.8 m/s on temperature 26oC with constant plate temperature 0oC. It is revealed that protrusion plate afford to
increase heat flux 111% more than in corrugation plate and 24 % for dimple channel. The protruded channel contributes to reduce
pressure drop per unit volume 49% less than in corrugation one, but the dimple channel is liable to increase it up to 204%. This is
promoted by crash flow in between adjacent intersection of dimple compartments. It is recommended to improve the intersection of
protrusions channel to reduce crash flow effect in dimple channel region or to combine dimple and protrusion in the same plate.
The other hand, the mal-uniformity phenomenon of plate heat exchanger has not disclosed clearly. The second work enhances the 3D
modeling of corrugate channels of brazed plate heat exchanger completely, covering geometry in inlet and outlet distributor zone. The full
acrylic corrugated channel is as test section used as validator, tested in two-phase flow mode in order to track the flow distribution clearly.
It is revealed that the mal-uniformity is generated by geometry of inlet and outlet distributor zone for single phase flow and it tend to be
promoted by flow pattern, buoyancy effect as well as geometry of inlet and outlet distributor zone for two-phase flow.
Meanwhile, the uniform flow distribution plays major role for enhancing plate heat exchanger performance. It is not easy to be achieved
particularly for two phase flow. The third work investigated air-water two phase flow behavior through acrylic corrugated channels as
mockup of plate heat exchanger channel. The effect of increasing quality on flow distribution and void fraction was investigated as well
as channel orientation. The two-phase stratified flow is fed to the inlet tube and distributed to corrugated channel, set vertically upward
and downward by quality variation from 0.1 to 0.6. The acrylic corrugate channel has chevron angle 30o and corrugation depth 1.5 mm.
The void fraction is measured carefully by quick acting valve aid. The flow pattern and flow distribution through corrugated channels is
observed using high speed video camera. It is disclosed that the increasing air quality of two phase flow promotes to increasing void
fraction in certain trend line quite different from existing correlations, followed by increasing uniformity distribution along channels for
both upward flow and downward flow. The upward flow tends to be more lack uniformity of phase distribution than downward flow.
Also, the void fraction is critical for determining pressure drop and heat transfer, and for the sizing of heat exchange equipment. Both
have interrelationship each other and are not easy to be achieved. Neither, there has not been discovered such accurate meter, nor there
has not been accomplished such accurate correlation for measuring or determining void fraction. This fourth work investigated void
fraction and flow distribution in more detail by means CFD modeling and validated by experimental results. All boundary conditions are
set similar to third work. The modeling shows that the increasing air quality of two phase flow promotes to increasing void fraction in
certain trend line slightly different from experimental measuring and correlations. Meanwhile, the phase distributions tend to have good
agreement between modeling and experiment. Upward flow tend to have worst uniformity than downward flow for all void fraction, due
to different orientation of inertia force promoted by buoyancy effect on gas phase in entrance distributor zone. The gas phase tends to go
directly to exit port in upward flow, vice versa for down flow.
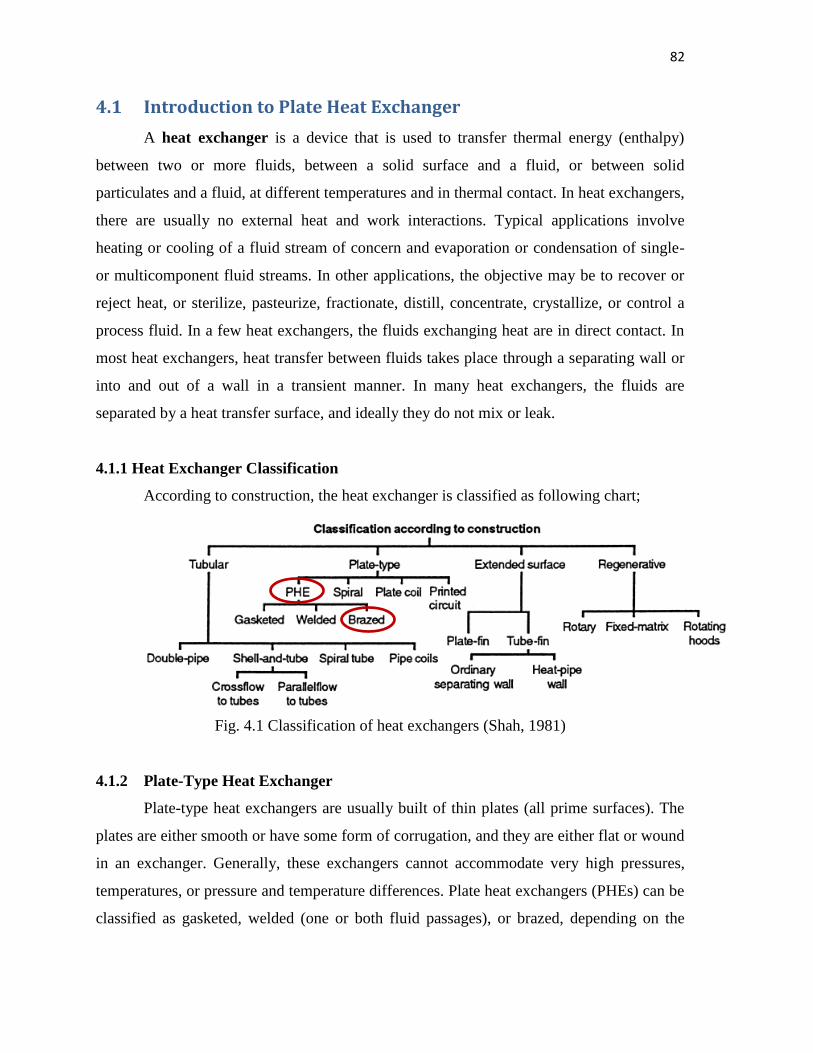
82
4.1 Introduction to Plate Heat Exchanger
A heat exchanger is a device that is used to transfer thermal energy (enthalpy)
between two or more fluids, between a solid surface and a fluid, or between solid
particulates and a fluid, at different temperatures and in thermal contact. In heat exchangers,
there are usually no external heat and work interactions. Typical applications involve
heating or cooling of a fluid stream of concern and evaporation or condensation of single-
or multicomponent fluid streams. In other applications, the objective may be to recover or
reject heat, or sterilize, pasteurize, fractionate, distill, concentrate, crystallize, or control a
process fluid. In a few heat exchangers, the fluids exchanging heat are in direct contact. In
most heat exchangers, heat transfer between fluids takes place through a separating wall or
into and out of a wall in a transient manner. In many heat exchangers, the fluids are
separated by a heat transfer surface, and ideally they do not mix or leak.
4.1.1 Heat Exchanger Classification
According to construction, the heat exchanger is classified as following chart;
Fig. 4.1 Classification of heat exchangers (Shah, 1981)
4.1.2 Plate-Type Heat Exchanger
Plate-type heat exchangers are usually built of thin plates (all prime surfaces). The
plates are either smooth or have some form of corrugation, and they are either flat or wound
in an exchanger. Generally, these exchangers cannot accommodate very high pressures,
temperatures, or pressure and temperature differences. Plate heat exchangers (PHEs) can be
classified as gasketed, welded (one or both fluid passages), or brazed, depending on the
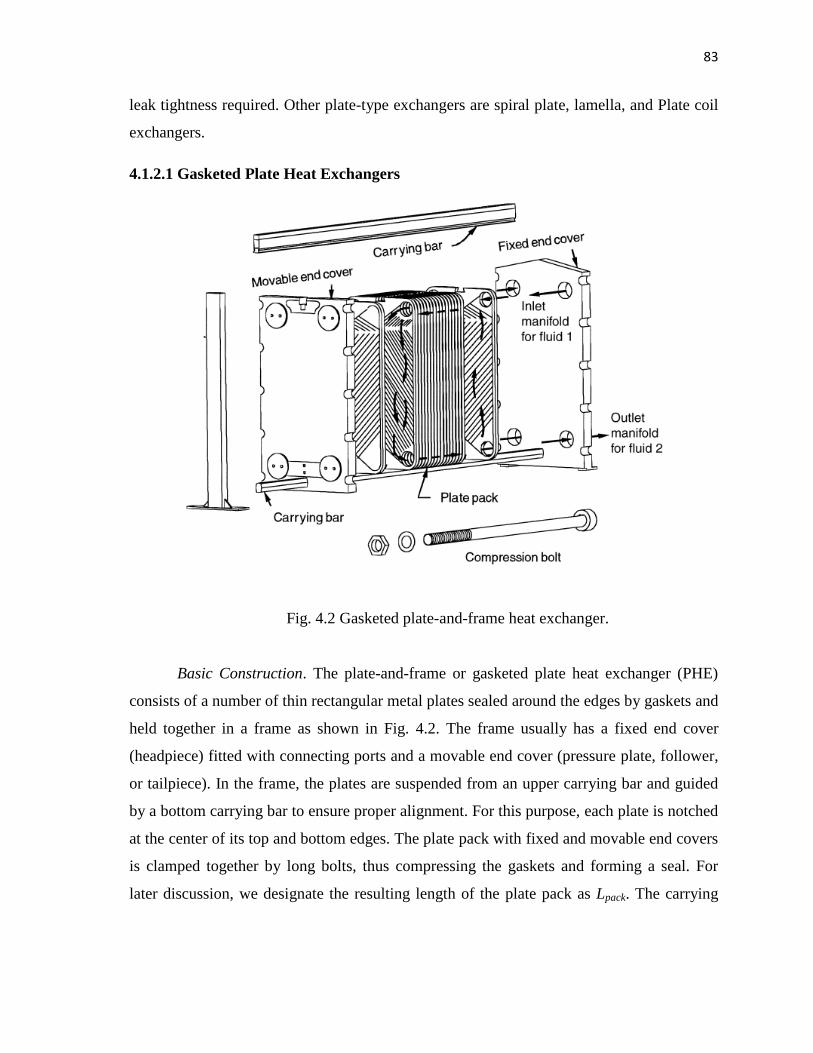
83
leak tightness required. Other plate-type exchangers are spiral plate, lamella, and Plate coil
exchangers.
4.1.2.1 Gasketed Plate Heat Exchangers
Fig. 4.2 Gasketed plate-and-frame heat exchanger.
Basic Construction. The plate-and-frame or gasketed plate heat exchanger (PHE)
consists of a number of thin rectangular metal plates sealed around the edges by gaskets and
held together in a frame as shown in Fig. 4.2. The frame usually has a fixed end cover
(headpiece) fitted with connecting ports and a movable end cover (pressure plate, follower,
or tailpiece). In the frame, the plates are suspended from an upper carrying bar and guided
by a bottom carrying bar to ensure proper alignment. For this purpose, each plate is notched
at the center of its top and bottom edges. The plate pack with fixed and movable end covers
is clamped together by long bolts, thus compressing the gaskets and forming a seal. For
later discussion, we designate the resulting length of the plate pack as Lpack. The carrying
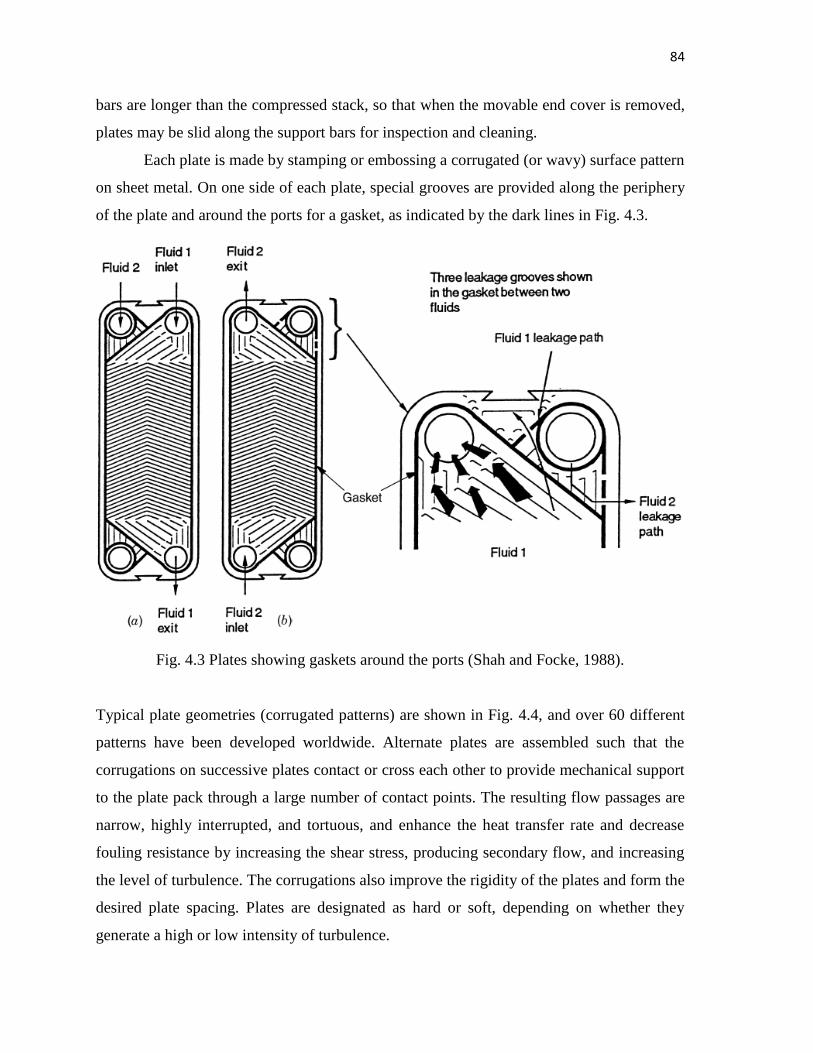
84
bars are longer than the compressed stack, so that when the movable end cover is removed,
plates may be slid along the support bars for inspection and cleaning.
Each plate is made by stamping or embossing a corrugated (or wavy) surface pattern
on sheet metal. On one side of each plate, special grooves are provided along the periphery
of the plate and around the ports for a gasket, as indicated by the dark lines in Fig. 4.3.
Fig. 4.3 Plates showing gaskets around the ports (Shah and Focke, 1988).
Typical plate geometries (corrugated patterns) are shown in Fig. 4.4, and over 60 different
patterns have been developed worldwide. Alternate plates are assembled such that the
corrugations on successive plates contact or cross each other to provide mechanical support
to the plate pack through a large number of contact points. The resulting flow passages are
narrow, highly interrupted, and tortuous, and enhance the heat transfer rate and decrease
fouling resistance by increasing the shear stress, producing secondary flow, and increasing
the level of turbulence. The corrugations also improve the rigidity of the plates and form the
desired plate spacing. Plates are designated as hard or soft, depending on whether they
generate a high or low intensity of turbulence.
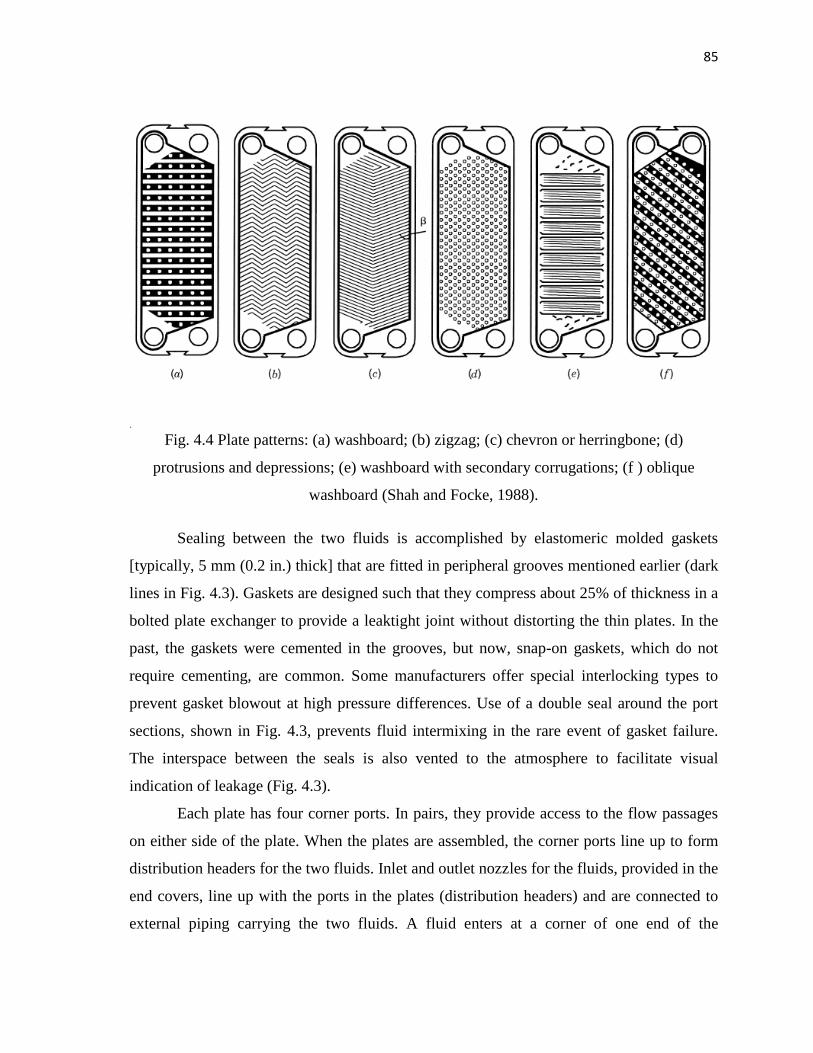
85
.
Fig. 4.4 Plate patterns: (a) washboard; (b) zigzag; (c) chevron or herringbone; (d)
protrusions and depressions; (e) washboard with secondary corrugations; (f ) oblique
washboard (Shah and Focke, 1988).
Sealing between the two fluids is accomplished by elastomeric molded gaskets
[typically, 5 mm (0.2 in.) thick] that are fitted in peripheral grooves mentioned earlier (dark
lines in Fig. 4.3). Gaskets are designed such that they compress about 25% of thickness in a
bolted plate exchanger to provide a leaktight joint without distorting the thin plates. In the
past, the gaskets were cemented in the grooves, but now, snap-on gaskets, which do not
require cementing, are common. Some manufacturers offer special interlocking types to
prevent gasket blowout at high pressure differences. Use of a double seal around the port
sections, shown in Fig. 4.3, prevents fluid intermixing in the rare event of gasket failure.
The interspace between the seals is also vented to the atmosphere to facilitate visual
indication of leakage (Fig. 4.3).
Each plate has four corner ports. In pairs, they provide access to the flow passages
on either side of the plate. When the plates are assembled, the corner ports line up to form
distribution headers for the two fluids. Inlet and outlet nozzles for the fluids, provided in the
end covers, line up with the ports in the plates (distribution headers) and are connected to
external piping carrying the two fluids. A fluid enters at a corner of one end of the
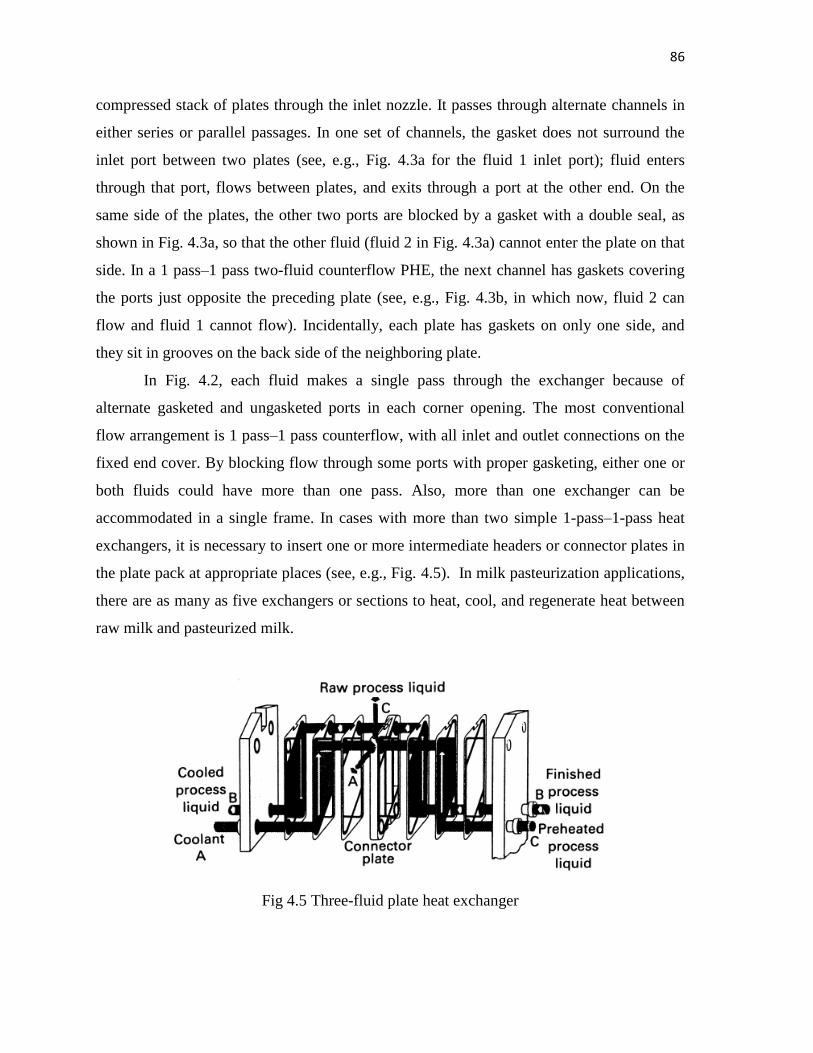
86
compressed stack of plates through the inlet nozzle. It passes through alternate channels in
either series or parallel passages. In one set of channels, the gasket does not surround the
inlet port between two plates (see, e.g., Fig. 4.3a for the fluid 1 inlet port); fluid enters
through that port, flows between plates, and exits through a port at the other end. On the
same side of the plates, the other two ports are blocked by a gasket with a double seal, as
shown in Fig. 4.3a, so that the other fluid (fluid 2 in Fig. 4.3a) cannot enter the plate on that
side. In a 1 pass–1 pass two-fluid counterflow PHE, the next channel has gaskets covering
the ports just opposite the preceding plate (see, e.g., Fig. 4.3b, in which now, fluid 2 can
flow and fluid 1 cannot flow). Incidentally, each plate has gaskets on only one side, and
they sit in grooves on the back side of the neighboring plate.
In Fig. 4.2, each fluid makes a single pass through the exchanger because of
alternate gasketed and ungasketed ports in each corner opening. The most conventional
flow arrangement is 1 pass–1 pass counterflow, with all inlet and outlet connections on the
fixed end cover. By blocking flow through some ports with proper gasketing, either one or
both fluids could have more than one pass. Also, more than one exchanger can be
accommodated in a single frame. In cases with more than two simple 1-pass–1-pass heat
exchangers, it is necessary to insert one or more intermediate headers or connector plates in
the plate pack at appropriate places (see, e.g., Fig. 4.5). In milk pasteurization applications,
there are as many as five exchangers or sections to heat, cool, and regenerate heat between
raw milk and pasteurized milk.
Fig 4.5 Three-fluid plate heat exchanger
87
Flow Arrangements. A large number of flow arrangements are possible in a plate
heat exchanger, Fig. 4.6, depending on the required heat transfer duty, available pressure
drops, minimum and maximum velocities allowed, and the flow rate ratio of the two fluid
streams. In each pass there can be an equal or unequal number of thermal plates. Whether
the plate exchanger is a single- or multi-pass unit, whenever possible, the
thermodynamically superior counterflow or overall counterflow arrangement
In the plate exchanger, the two outer plates serve as end plates and ideally do not
participate in heat transfer between the fluids because of the large thermal resistance
associated with thick end plates and air gaps between the end plates and the
header/follower. The remaining plates, known as thermal plates, transfer heat between the
fluids
One of the most common flow arrangements in a PHE is a 1-pass–1-pass U
configuration, Fig. 4.6a. This is because this design allows all fluid ports to be located on
the fixed end cover, permitting easy disassembly and cleaning/repair of a PHE without
disconnecting any piping. In a multi-pass arrangement, the ports and fluid connections are
located on both fixed and movable end covers. A multi-pass arrangement is generally used
when the flow rates are considerably different or when one would like to use up the
available pressure drop by multi-passing and hence getting a higher heat transfer coefficient
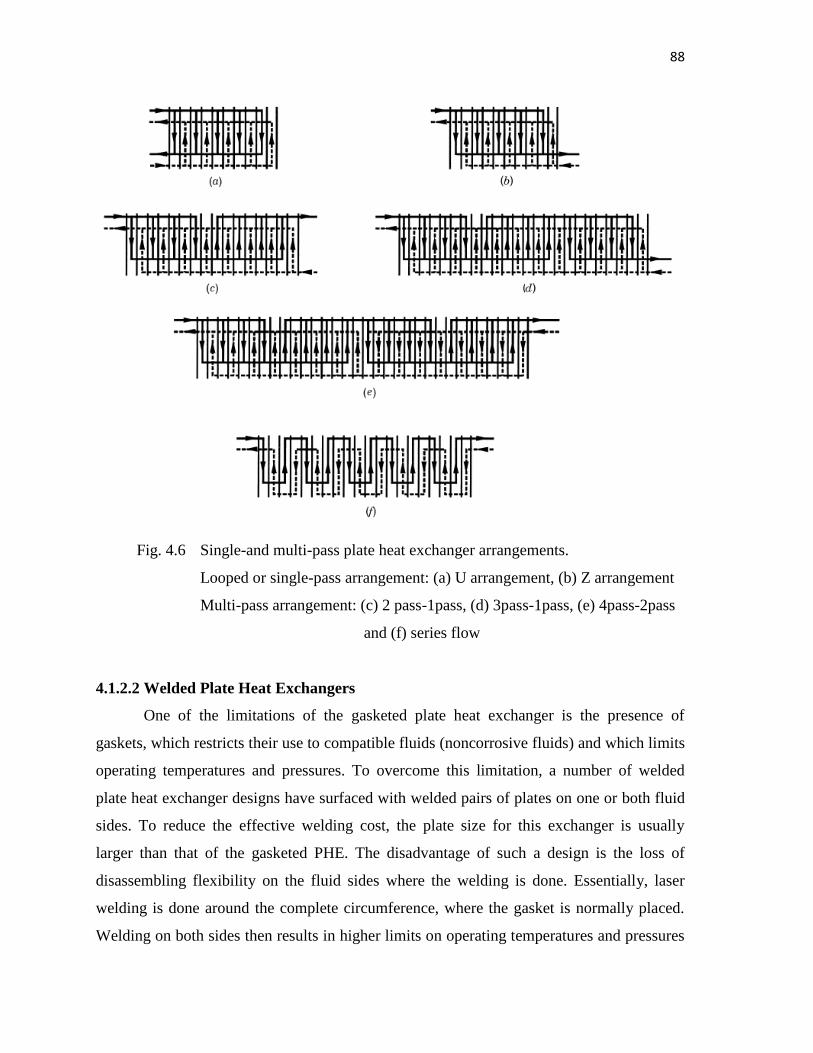
88
Fig. 4.6 Single-and multi-pass plate heat exchanger arrangements.
Looped or single-pass arrangement: (a) U arrangement, (b) Z arrangement
Multi-pass arrangement: (c) 2 pass-1pass, (d) 3pass-1pass, (e) 4pass-2pass
and (f) series flow
4.1.2.2 Welded Plate Heat Exchangers
One of the limitations of the gasketed plate heat exchanger is the presence of
gaskets, which restricts their use to compatible fluids (noncorrosive fluids) and which limits
operating temperatures and pressures. To overcome this limitation, a number of welded
plate heat exchanger designs have surfaced with welded pairs of plates on one or both fluid
sides. To reduce the effective welding cost, the plate size for this exchanger is usually
larger than that of the gasketed PHE. The disadvantage of such a design is the loss of
disassembling flexibility on the fluid sides where the welding is done. Essentially, laser
welding is done around the complete circumference, where the gasket is normally placed.
Welding on both sides then results in higher limits on operating temperatures and pressures
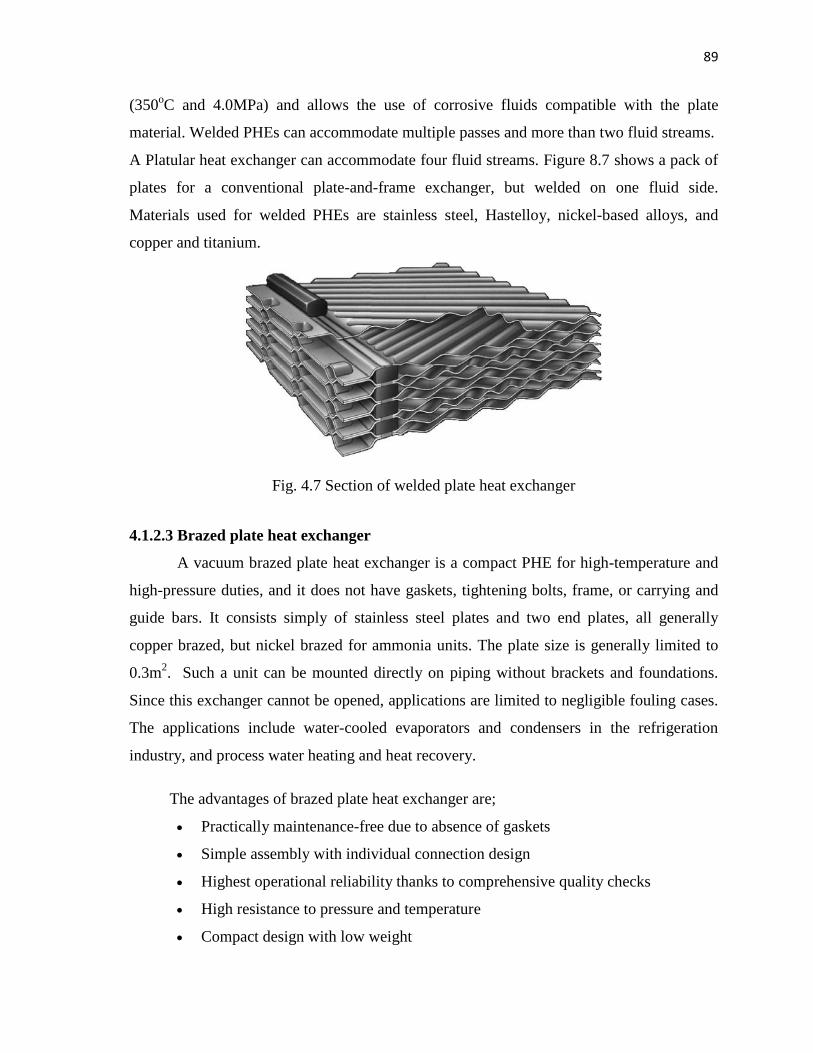
89
(350oC and 4.0MPa) and allows the use of corrosive fluids compatible with the plate
material. Welded PHEs can accommodate multiple passes and more than two fluid streams.
A Platular heat exchanger can accommodate four fluid streams. Figure 8.7 shows a pack of
plates for a conventional plate-and-frame exchanger, but welded on one fluid side.
Materials used for welded PHEs are stainless steel, Hastelloy, nickel-based alloys, and
copper and titanium.
Fig. 4.7 Section of welded plate heat exchanger
4.1.2.3 Brazed plate heat exchanger
A vacuum brazed plate heat exchanger is a compact PHE for high-temperature and
high-pressure duties, and it does not have gaskets, tightening bolts, frame, or carrying and
guide bars. It consists simply of stainless steel plates and two end plates, all generally
copper brazed, but nickel brazed for ammonia units. The plate size is generally limited to
0.3m2. Such a unit can be mounted directly on piping without brackets and foundations.
Since this exchanger cannot be opened, applications are limited to negligible fouling cases.
The applications include water-cooled evaporators and condensers in the refrigeration
industry, and process water heating and heat recovery.
The advantages of brazed plate heat exchanger are;
Practically maintenance-free due to absence of gaskets
Simple assembly with individual connection design
Highest operational reliability thanks to comprehensive quality checks
High resistance to pressure and temperature
Compact design with low weight
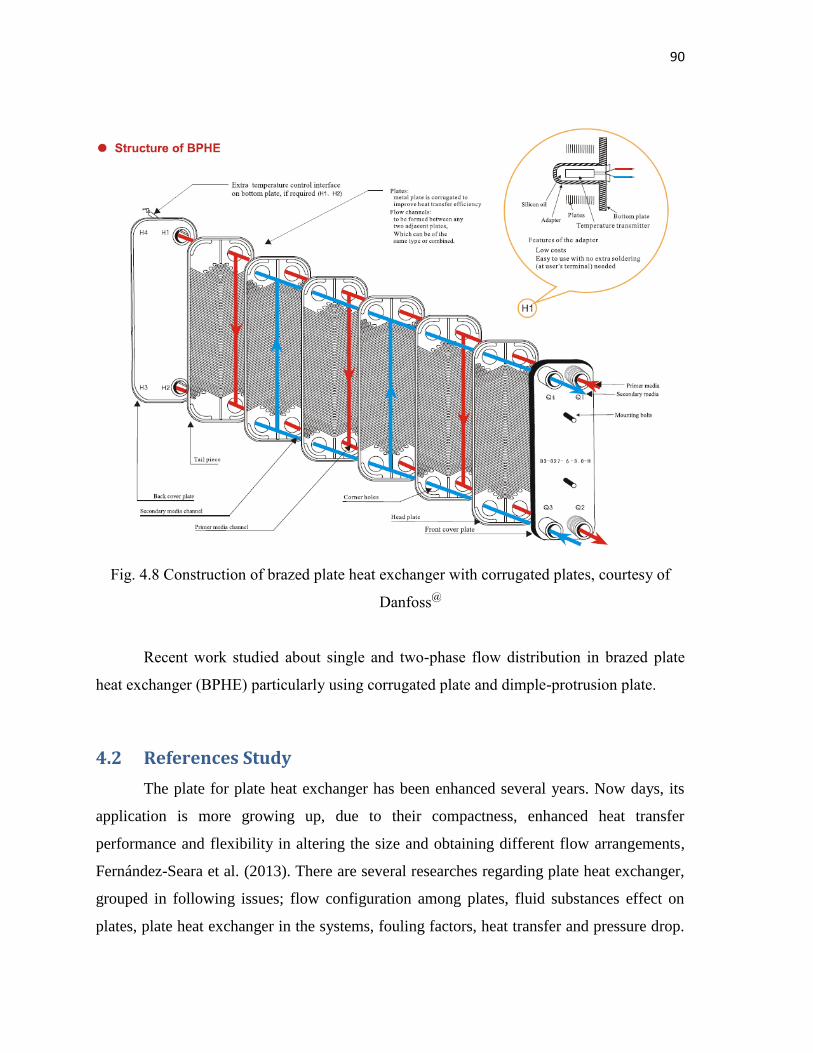
90
Fig. 4.8 Construction of brazed plate heat exchanger with corrugated plates, courtesy of
Danfoss@
Recent work studied about single and two-phase flow distribution in brazed plate
heat exchanger (BPHE) particularly using corrugated plate and dimple-protrusion plate.
4.2 References Study
The plate for plate heat exchanger has been enhanced several years. Now days, its
application is more growing up, due to their compactness, enhanced heat transfer
performance and flexibility in altering the size and obtaining different flow arrangements,
Fernández-Seara et al. (2013). There are several researches regarding plate heat exchanger,
grouped in following issues; flow configuration among plates, fluid substances effect on
plates, plate heat exchanger in the systems, fouling factors, heat transfer and pressure drop.
91
The works about plate geometry of plate heat exchanger are limited, whereas several
contours of plates were distributed widely.
The newly plate contours is the protrusion plate. The protrusion plate is the plate of
plate heat exchanger made protrusion in certain configuration on its surface. By this way,
the fluid passes through plate in surrounding of protrusion easier than through corrugate
channels. Accordingly, the pressure drop entire protruded channel is reduced significantly.
On the other hand the heat transfer rate over protruded plate can be enhanced. These results
are claimed by a Danfoss@
(2011) company.
Unfortunately the investigation of its performance has been carried out for
protrusion channels only. Whereas the arrangement of protrusion plates in plate heat
exchanger cannot form equal channel profile among plate layers. They have two different
profiles channel; protrusion in odd layer and dimple in even layer. Their fluid flow behavior
is different also. Accordingly the performances of both channels are unequal.
The initial study investigates the temperature, pressure and magnitude velocity
distribution of protrusion channel and corrugation ones. For protrusion channel, both side of
protrusion and dimple channel are observed. The performances of all are compared each
other to recognize their excellences and weaknesses. Eventually the work is useful to direct
the development of future plate contour for plate heat exchanger in order to attain better
performance.
Meanwhile, the works studying the effect of protrusion surface to enhance heat
transfer performance in different application have been done. These are; thermal
performance of protruded rectangular fin, Leung et al. (1985), heat transfer with
dimple/protrusion arrays in a rectangular duct, Hwang et al. (2008), split-dimple interrupted
fin configuration for heat transfer augmentation, Elyyan (2009), periodically dimple-
protrusion patterned walls for compact heat exchangers, Hwang et al. (2010), rotating
channel with dimples and protrusions, Elyyan et al. (2010) and heat transfer in a cooling
passage with protrusion-in-dimple surface, Kim et al. (2012). Although there are many
works about protrusion effect for various implementations, the works particularly for plate
heat exchanger are limited.
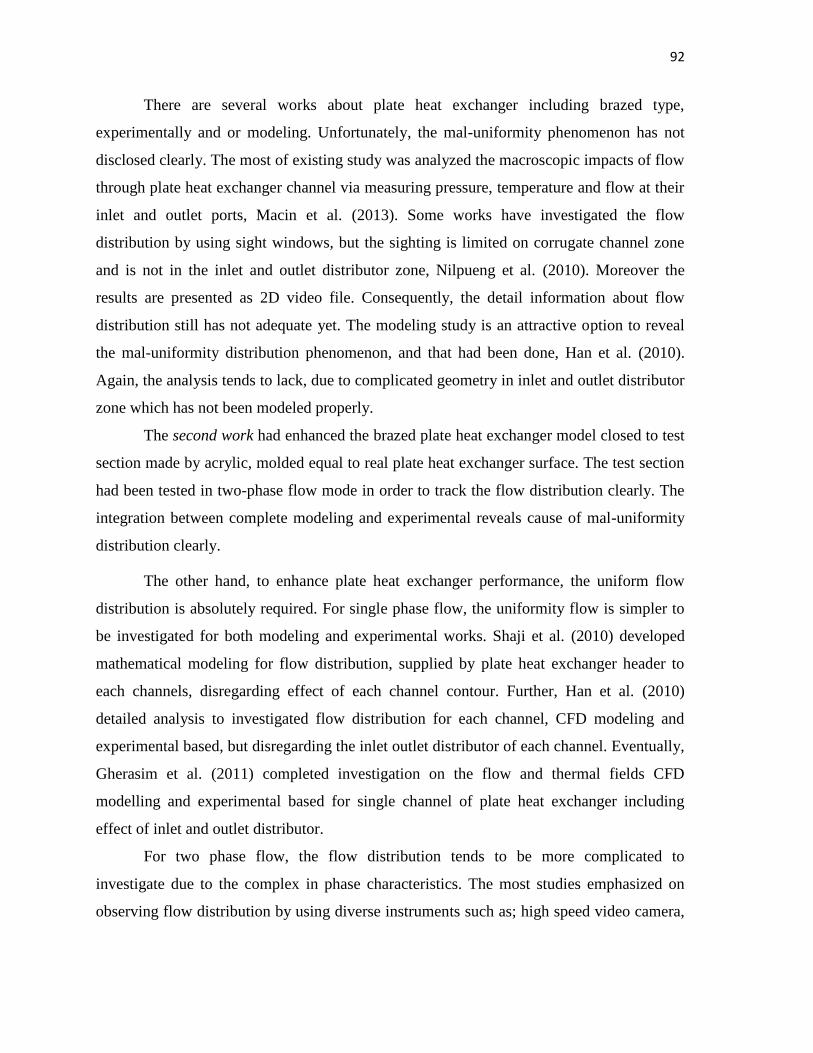
92
There are several works about plate heat exchanger including brazed type,
experimentally and or modeling. Unfortunately, the mal-uniformity phenomenon has not
disclosed clearly. The most of existing study was analyzed the macroscopic impacts of flow
through plate heat exchanger channel via measuring pressure, temperature and flow at their
inlet and outlet ports, Macin et al. (2013). Some works have investigated the flow
distribution by using sight windows, but the sighting is limited on corrugate channel zone
and is not in the inlet and outlet distributor zone, Nilpueng et al. (2010). Moreover the
results are presented as 2D video file. Consequently, the detail information about flow
distribution still has not adequate yet. The modeling study is an attractive option to reveal
the mal-uniformity distribution phenomenon, and that had been done, Han et al. (2010).
Again, the analysis tends to lack, due to complicated geometry in inlet and outlet distributor
zone which has not been modeled properly.
The second work had enhanced the brazed plate heat exchanger model closed to test
section made by acrylic, molded equal to real plate heat exchanger surface. The test section
had been tested in two-phase flow mode in order to track the flow distribution clearly. The
integration between complete modeling and experimental reveals cause of mal-uniformity
distribution clearly.
The other hand, to enhance plate heat exchanger performance, the uniform flow
distribution is absolutely required. For single phase flow, the uniformity flow is simpler to
be investigated for both modeling and experimental works. Shaji et al. (2010) developed
mathematical modeling for flow distribution, supplied by plate heat exchanger header to
each channels, disregarding effect of each channel contour. Further, Han et al. (2010)
detailed analysis to investigated flow distribution for each channel, CFD modeling and
experimental based, but disregarding the inlet outlet distributor of each channel. Eventually,
Gherasim et al. (2011) completed investigation on the flow and thermal fields CFD
modelling and experimental based for single channel of plate heat exchanger including
effect of inlet and outlet distributor.
For two phase flow, the flow distribution tends to be more complicated to
investigate due to the complex in phase characteristics. The most studies emphasized on
observing flow distribution by using diverse instruments such as; high speed video camera,
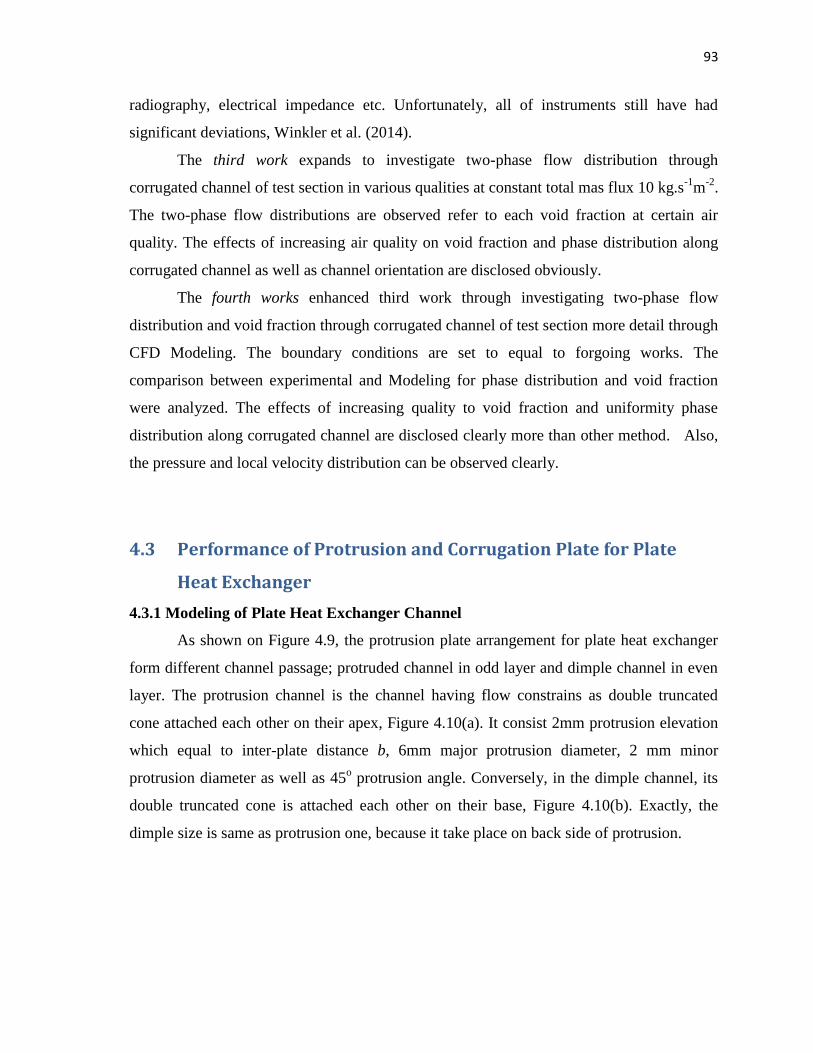
93
radiography, electrical impedance etc. Unfortunately, all of instruments still have had
significant deviations, Winkler et al. (2014).
The third work expands to investigate two-phase flow distribution through
corrugated channel of test section in various qualities at constant total mas flux 10 kg.s-1
m-2
.
The two-phase flow distributions are observed refer to each void fraction at certain air
quality. The effects of increasing air quality on void fraction and phase distribution along
corrugated channel as well as channel orientation are disclosed obviously.
The fourth works enhanced third work through investigating two-phase flow
distribution and void fraction through corrugated channel of test section more detail through
CFD Modeling. The boundary conditions are set to equal to forgoing works. The
comparison between experimental and Modeling for phase distribution and void fraction
were analyzed. The effects of increasing quality to void fraction and uniformity phase
distribution along corrugated channel are disclosed clearly more than other method. Also,
the pressure and local velocity distribution can be observed clearly.
4.3 Performance of Protrusion and Corrugation Plate for Plate
Heat Exchanger
4.3.1 Modeling of Plate Heat Exchanger Channel
As shown on Figure 4.9, the protrusion plate arrangement for plate heat exchanger
form different channel passage; protruded channel in odd layer and dimple channel in even
layer. The protrusion channel is the channel having flow constrains as double truncated
cone attached each other on their apex, Figure 4.10(a). It consist 2mm protrusion elevation
which equal to inter-plate distance b, 6mm major protrusion diameter, 2 mm minor
protrusion diameter as well as 45o protrusion angle. Conversely, in the dimple channel, its
double truncated cone is attached each other on their base, Figure 4.10(b). Exactly, the
dimple size is same as protrusion one, because it take place on back side of protrusion.
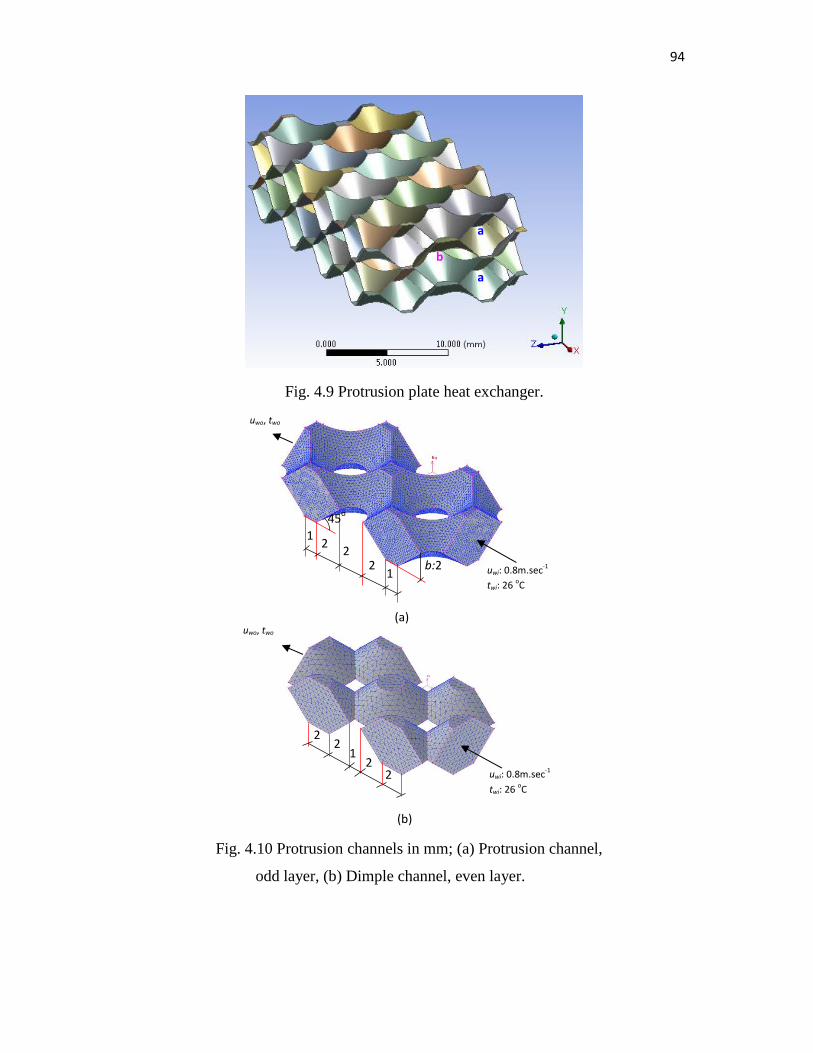
94
a
a
b
Fig. 4.9 Protrusion plate heat exchanger.
Fig. 4.10 Protrusion channels in mm; (a) Protrusion channel,
odd layer, (b) Dimple channel, even layer.
1 2
2 2 b:2
1
45o
uwo, two
(a)
uwi: 0.8m.sec-1
twi: 26 oC
uwo, two
(b)
2 2
2 2
1
uwi: 0.8m.sec-1
twi: 26 oC
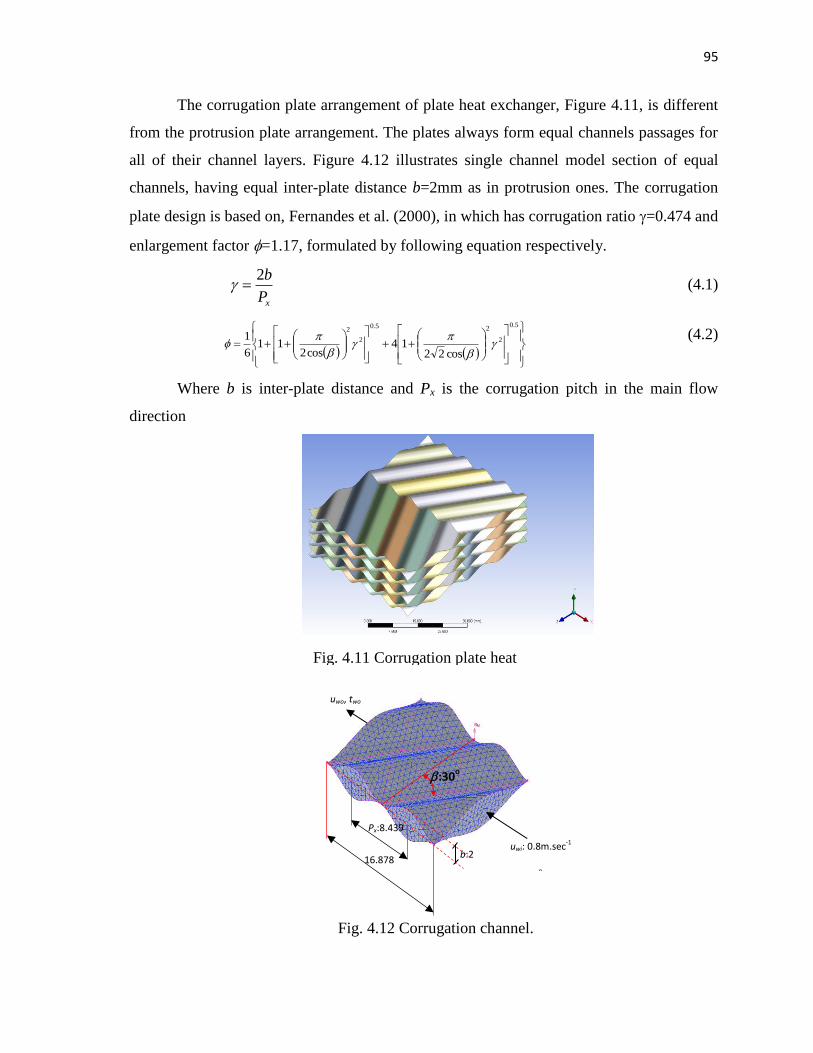
95
The corrugation plate arrangement of plate heat exchanger, Figure 4.11, is different
from the protrusion plate arrangement. The plates always form equal channels passages for
all of their channel layers. Figure 4.12 illustrates single channel model section of equal
channels, having equal inter-plate distance b=2mm as in protrusion ones. The corrugation
plate design is based on, Fernandes et al. (2000), in which has corrugation ratio =0.474 and
enlargement factor =1.17, formulated by following equation respectively.
xP
b2 (4.1)
5.0
2
25.0
2
2
cos2214
cos211
6
1
(4.2)
Where b is inter-plate distance and Px is the corrugation pitch in the main flow
direction
Fig. 4.11 Corrugation plate heat
Fig. 4.12 Corrugation channel.
16.878
Px:8.439
:30o
b:2 uwi: 0.8m.sec-1
twi: 26 oC
uwo, two
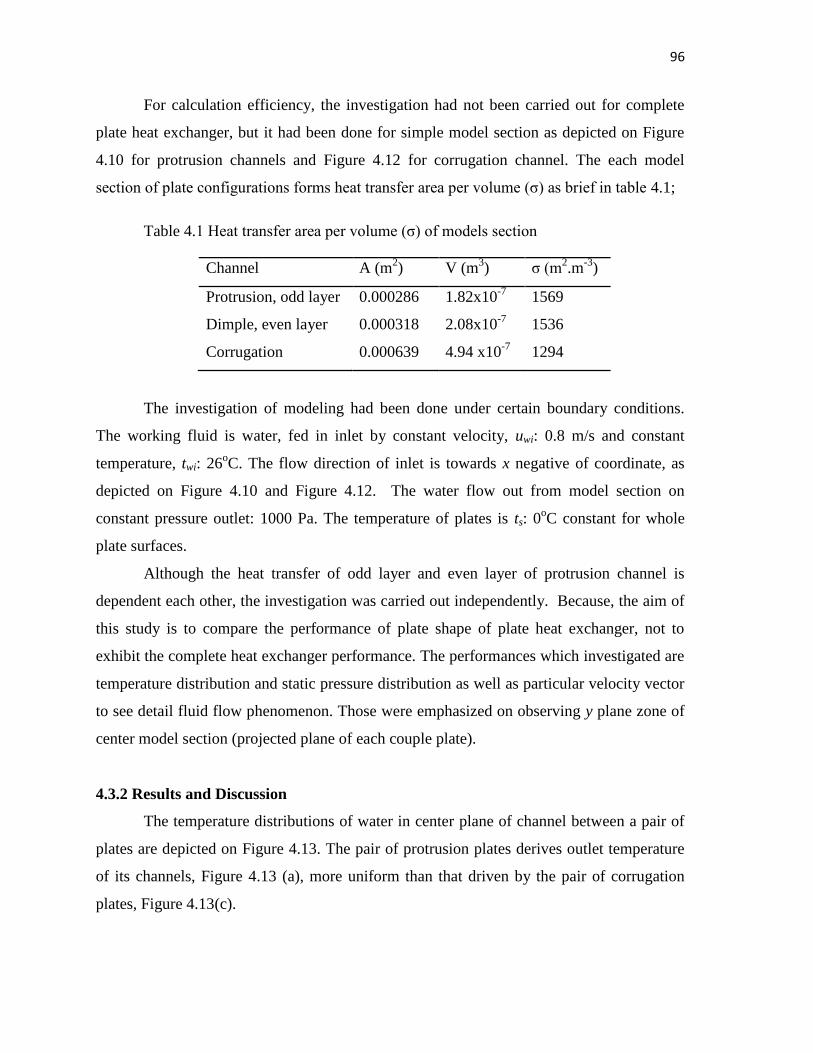
96
For calculation efficiency, the investigation had not been carried out for complete
plate heat exchanger, but it had been done for simple model section as depicted on Figure
4.10 for protrusion channels and Figure 4.12 for corrugation channel. The each model
section of plate configurations forms heat transfer area per volume (σ) as brief in table 4.1;
Table 4.1 Heat transfer area per volume (σ) of models section
Channel A (m2) V (m
3) σ (m
2.m
-3)
Protrusion, odd layer 0.000286 1.82x10⁻⁷
1569
Dimple, even layer 0.000318 2.08x10⁻⁷
1536
Corrugation 0.000639 4.94 x10⁻⁷
1294
The investigation of modeling had been done under certain boundary conditions.
The working fluid is water, fed in inlet by constant velocity, uwi: 0.8 m/s and constant
temperature, twi: 26oC. The flow direction of inlet is towards x negative of coordinate, as
depicted on Figure 4.10 and Figure 4.12. The water flow out from model section on
constant pressure outlet: 1000 Pa. The temperature of plates is ts: 0oC constant for whole
plate surfaces.
Although the heat transfer of odd layer and even layer of protrusion channel is
dependent each other, the investigation was carried out independently. Because, the aim of
this study is to compare the performance of plate shape of plate heat exchanger, not to
exhibit the complete heat exchanger performance. The performances which investigated are
temperature distribution and static pressure distribution as well as particular velocity vector
to see detail fluid flow phenomenon. Those were emphasized on observing y plane zone of
center model section (projected plane of each couple plate).
4.3.2 Results and Discussion
The temperature distributions of water in center plane of channel between a pair of
plates are depicted on Figure 4.13. The pair of protrusion plates derives outlet temperature
of its channels, Figure 4.13 (a), more uniform than that driven by the pair of corrugation
plates, Figure 4.13(c).
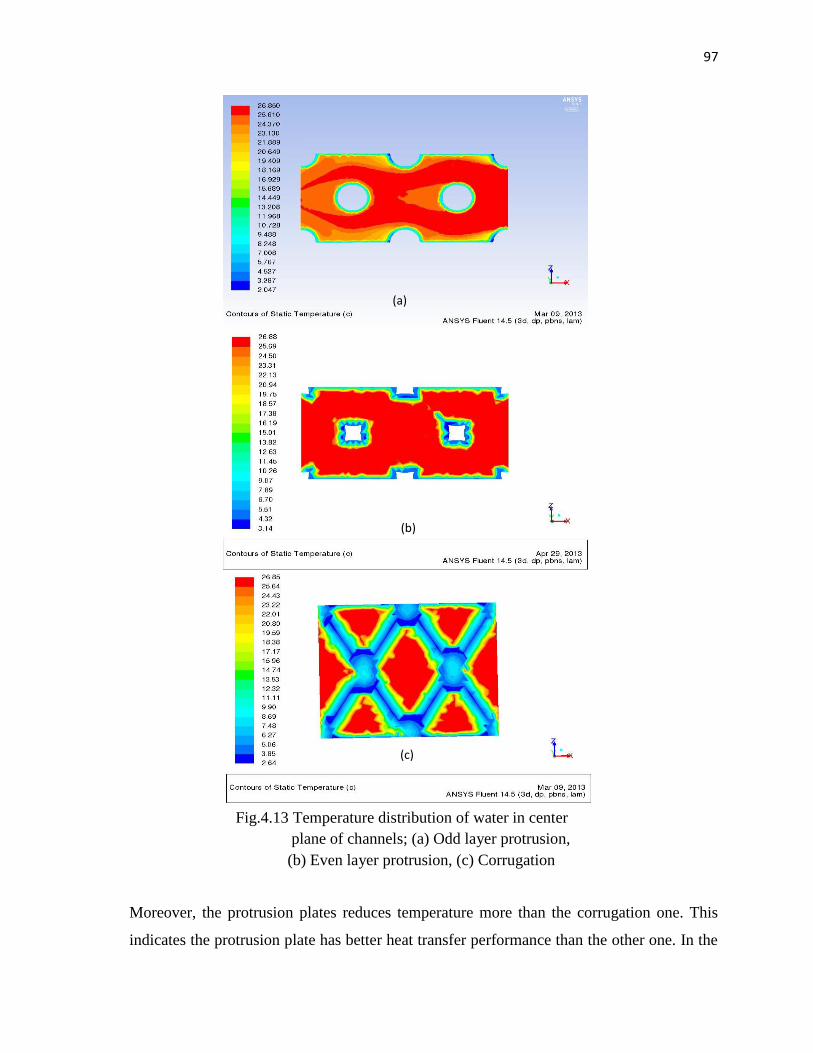
97
Moreover, the protrusion plates reduces temperature more than the corrugation one. This
indicates the protrusion plate has better heat transfer performance than the other one. In the
Fig.4.13 Temperature distribution of water in center
plane of channels; (a) Odd layer protrusion,
(b) Even layer protrusion, (c) Corrugation
(b)
(a)
(c)
98
dimple channel formed by another side of protrusion plate, even layer protrusion, Figure
4.13(b), apparently the performance of heat transfer is worse than in the corrugation one.
But if the investigation is extended to the total surface, than the dimple channel still has
heat transfer performance better than the corrugation channel has.
Table 4.2 show the total heat transfer released through plate of each model section.
The total heat released through corrugation plate exhibit greater than others. But the total
plate area of each protrusion and dimple is about half of corrugation one. Hence, the total
heated released per total heat transfer plate area or heat flux of corrugation plate is worse
than whose of both protrusion and dimple are. Eventually the protrusion channel increases
heat flux more than two times of corrugation channel correspond to 111% and the dimple
channel slightly increase heat flux, up to 24%.
Table 4.2 Total heat released over plates of models section
Channel Q (w) q (kW.m-2
) q (%)
Protrusion, odd layer 62.2 217 111
Dimple, even layer 40.6 128 24
Corrugation 65.9 103 -
The evidences correspond to a resulted by Hwang et al. [3] in which the average
Nusselt number of fluid flow over protruded plate is bigger than over dimpled plate. Also
the Nusselt number of dimple plate is bigger than that of flat plate. The Nusselt number of
fluid flow over corrugate plate would be lower than that, in between dimpled plate and flat
plat. Consequently, the heat flux released from fluid flow to protrusion or dimple plates is
much more than to corrugation plates.
Likewise, the pressure distributions of water in center plane of channel between pair
of plates are depicted on Figure 4.14. The best pressure distribution is for protrusion
channel followed by it is for dimple channel and the worst is for corrugation ones. Also, the
pressure drop between inlet and inlet model section of protrusion channels less than others.
While the dimpled channels exhibit the highest pressure drop. Hence, the total pressure
drop of protruded plate heat exchanger is worse than corrugation ones.
The highest pressure drop is caused by what the water flow adjacent dimple
compartments crash each other. The flow decelerates each other increasing significant
99
pressure gradient inter dimple compartment. This is promoted by what the flow vector
adjacent compartment format obtuse angle, φ, Figure 4.15 (b). The problem crash flow can
be resolved by modifying intersection inter protruded surfaces such that the flow vector
adjacent dimple compartment format acute angle (φ<90o).
(a)
(b)
(c)
Fig.4.14 Pressure distribution of water in center plane of channels;
(a) Odd layer protrusion, (b) Even layer protrusion, (c) Corrugation
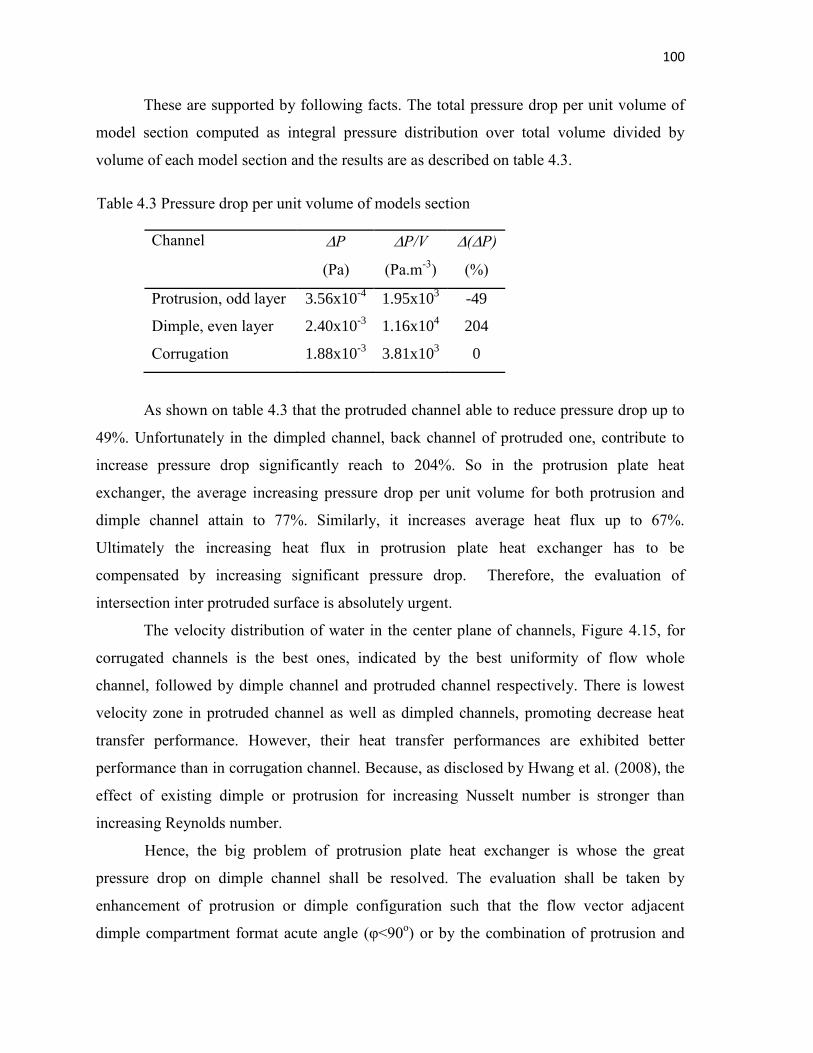
100
These are supported by following facts. The total pressure drop per unit volume of
model section computed as integral pressure distribution over total volume divided by
volume of each model section and the results are as described on table 4.3.
Table 4.3 Pressure drop per unit volume of models section
Channel P
(Pa)
P/V
(Pa.m-3
)
(P)
(%)
Protrusion, odd layer 3.56x10⁻⁴
1.95x10³ -49
Dimple, even layer 2.40x10⁻³
1.16x10⁴ 204
Corrugation 1.88x10⁻³
3.81x10³ 0
As shown on table 4.3 that the protruded channel able to reduce pressure drop up to
49%. Unfortunately in the dimpled channel, back channel of protruded one, contribute to
increase pressure drop significantly reach to 204%. So in the protrusion plate heat
exchanger, the average increasing pressure drop per unit volume for both protrusion and
dimple channel attain to 77%. Similarly, it increases average heat flux up to 67%.
Ultimately the increasing heat flux in protrusion plate heat exchanger has to be
compensated by increasing significant pressure drop. Therefore, the evaluation of
intersection inter protruded surface is absolutely urgent.
The velocity distribution of water in the center plane of channels, Figure 4.15, for
corrugated channels is the best ones, indicated by the best uniformity of flow whole
channel, followed by dimple channel and protruded channel respectively. There is lowest
velocity zone in protruded channel as well as dimpled channels, promoting decrease heat
transfer performance. However, their heat transfer performances are exhibited better
performance than in corrugation channel. Because, as disclosed by Hwang et al. (2008), the
effect of existing dimple or protrusion for increasing Nusselt number is stronger than
increasing Reynolds number.
Hence, the big problem of protrusion plate heat exchanger is whose the great
pressure drop on dimple channel shall be resolved. The evaluation shall be taken by
enhancement of protrusion or dimple configuration such that the flow vector adjacent
dimple compartment format acute angle (φ<90o) or by the combination of protrusion and
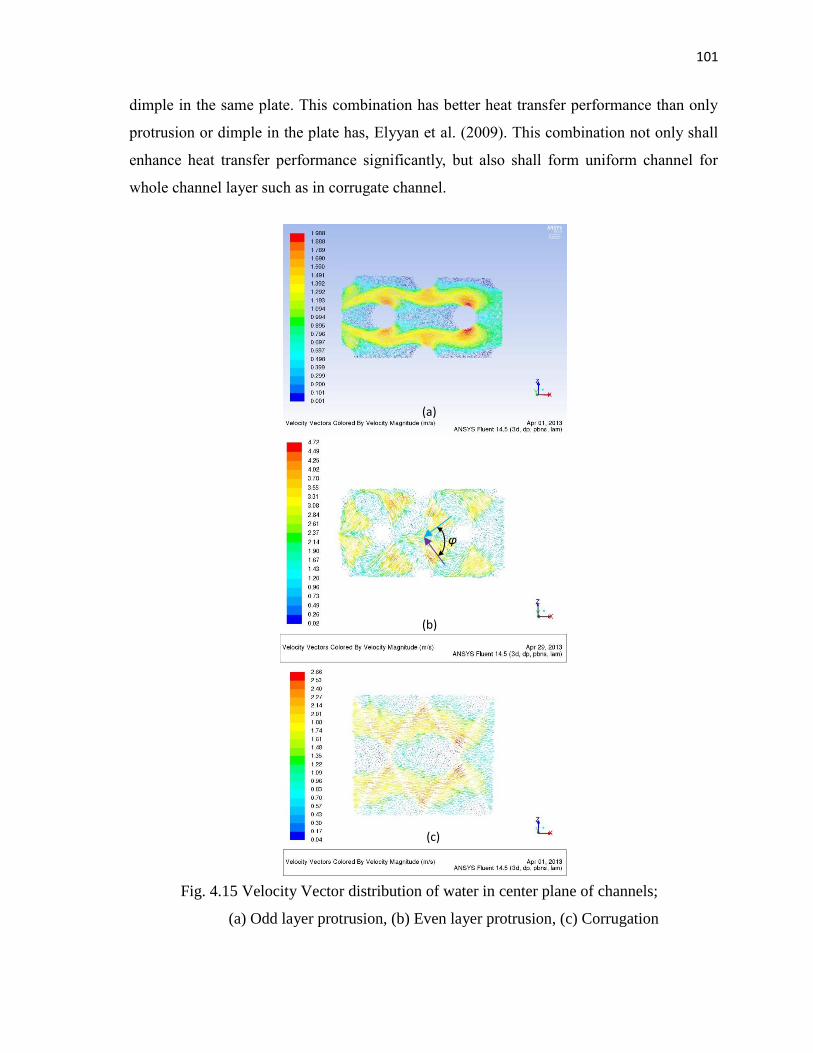
101
dimple in the same plate. This combination has better heat transfer performance than only
protrusion or dimple in the plate has, Elyyan et al. (2009). This combination not only shall
enhance heat transfer performance significantly, but also shall form uniform channel for
whole channel layer such as in corrugate channel.
Fig. 4.15 Velocity Vector distribution of water in center plane of channels;
(a) Odd layer protrusion, (b) Even layer protrusion, (c) Corrugation
φ
(a)
(b)
(c)
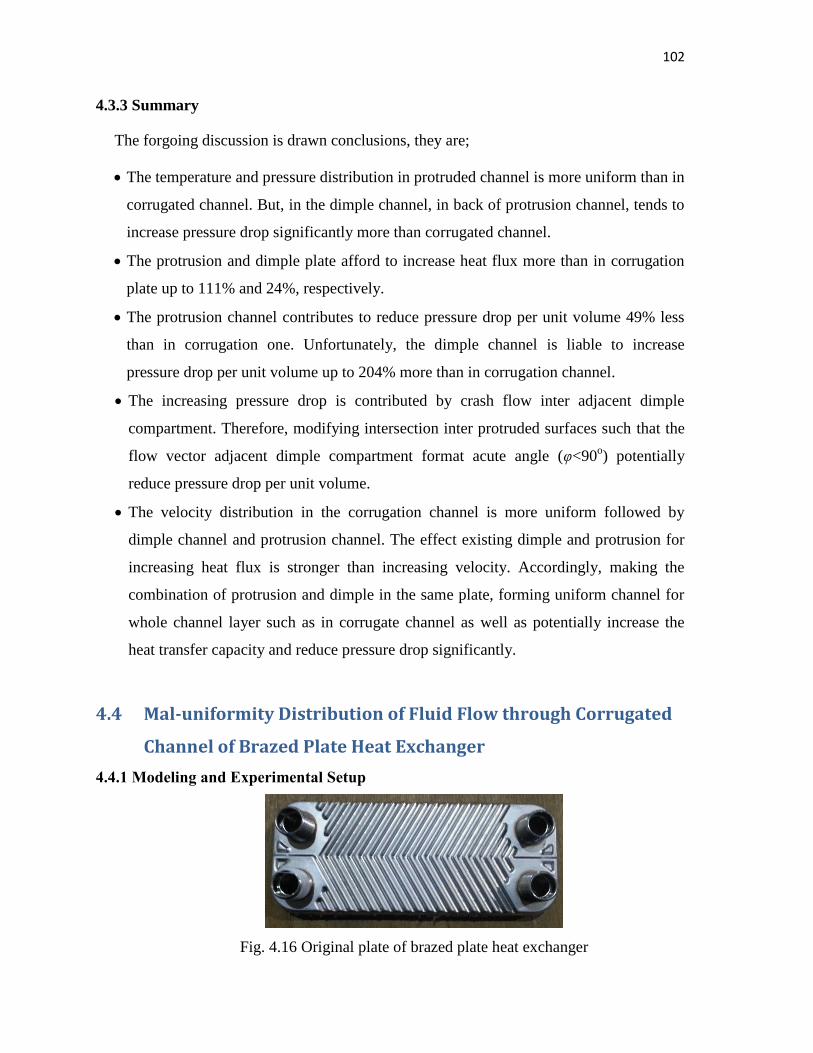
102
4.3.3 Summary
The forgoing discussion is drawn conclusions, they are;
The temperature and pressure distribution in protruded channel is more uniform than in
corrugated channel. But, in the dimple channel, in back of protrusion channel, tends to
increase pressure drop significantly more than corrugated channel.
The protrusion and dimple plate afford to increase heat flux more than in corrugation
plate up to 111% and 24%, respectively.
The protrusion channel contributes to reduce pressure drop per unit volume 49% less
than in corrugation one. Unfortunately, the dimple channel is liable to increase
pressure drop per unit volume up to 204% more than in corrugation channel.
The increasing pressure drop is contributed by crash flow inter adjacent dimple
compartment. Therefore, modifying intersection inter protruded surfaces such that the
flow vector adjacent dimple compartment format acute angle (φ<90o) potentially
reduce pressure drop per unit volume.
The velocity distribution in the corrugation channel is more uniform followed by
dimple channel and protrusion channel. The effect existing dimple and protrusion for
increasing heat flux is stronger than increasing velocity. Accordingly, making the
combination of protrusion and dimple in the same plate, forming uniform channel for
whole channel layer such as in corrugate channel as well as potentially increase the
heat transfer capacity and reduce pressure drop significantly.
4.4 Mal-uniformity Distribution of Fluid Flow through Corrugated
Channel of Brazed Plate Heat Exchanger
4.4.1 Modeling and Experimental Setup
Fig. 4.16 Original plate of brazed plate heat exchanger
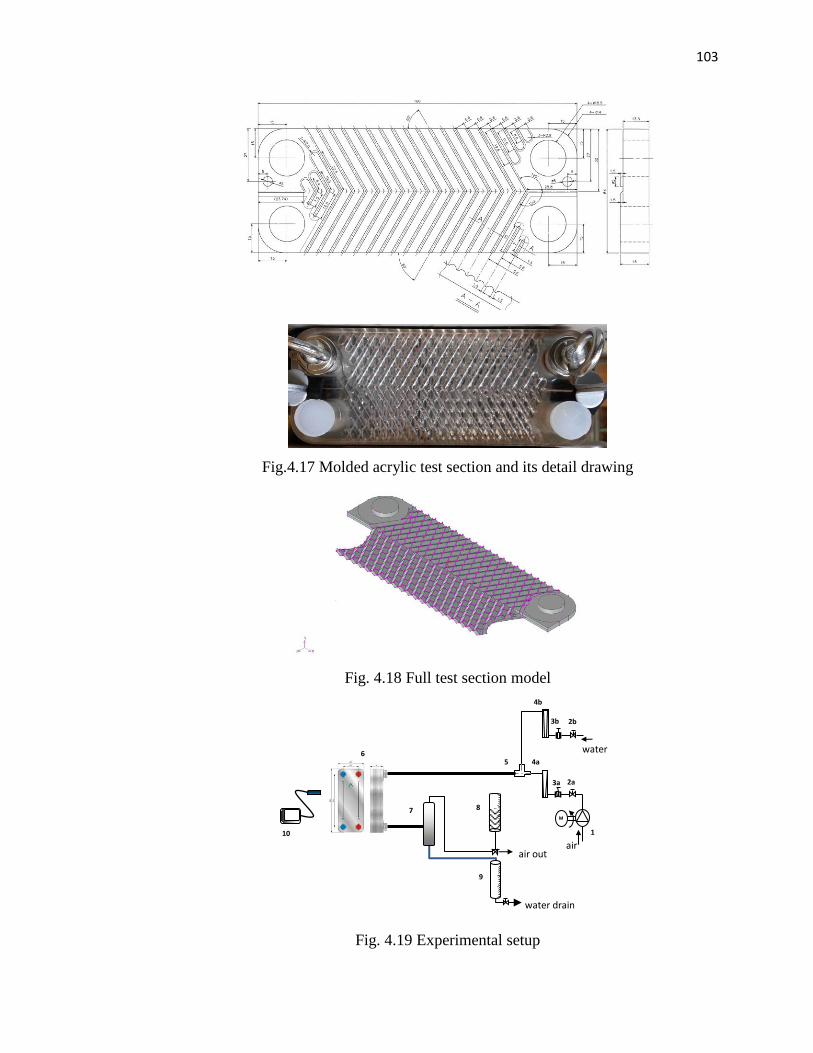
103
Fig.4.17 Molded acrylic test section and its detail drawing
Fig. 4.18 Full test section model
Fig. 4.19 Experimental setup
9
5
1
air
water
7 M
2a 3a
4b
4a
2b 3b
10
air out
water drain
8
6
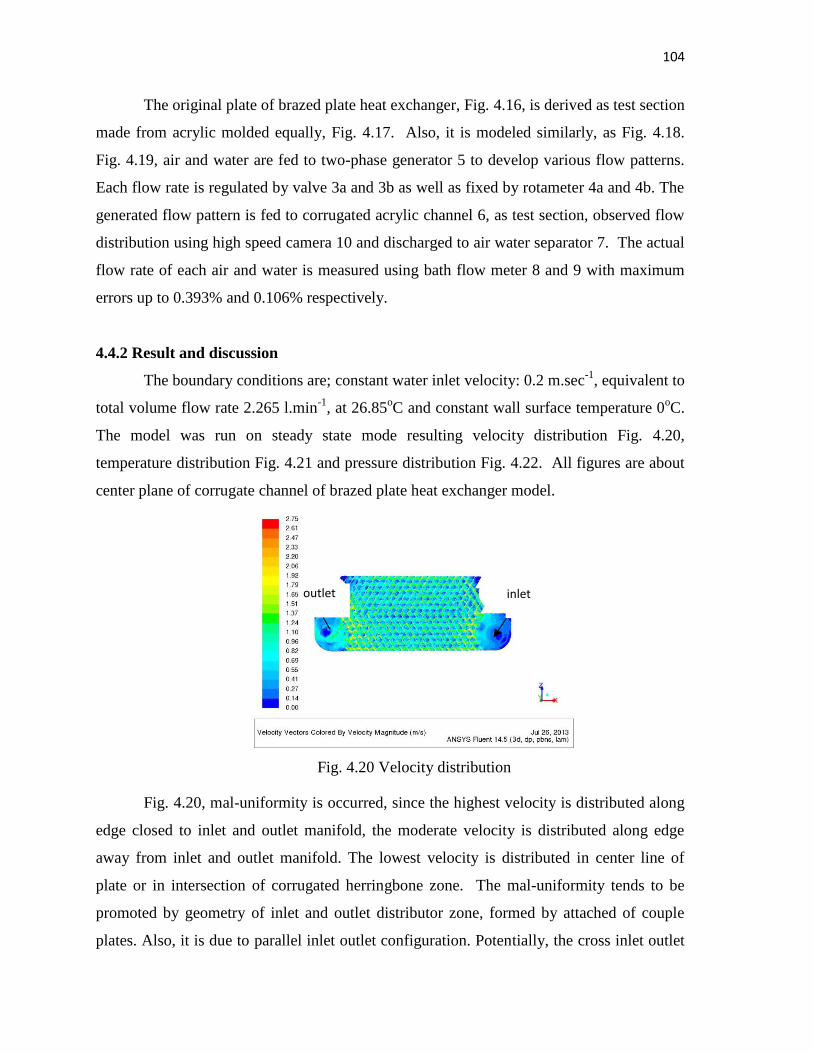
104
The original plate of brazed plate heat exchanger, Fig. 4.16, is derived as test section
made from acrylic molded equally, Fig. 4.17. Also, it is modeled similarly, as Fig. 4.18.
Fig. 4.19, air and water are fed to two-phase generator 5 to develop various flow patterns.
Each flow rate is regulated by valve 3a and 3b as well as fixed by rotameter 4a and 4b. The
generated flow pattern is fed to corrugated acrylic channel 6, as test section, observed flow
distribution using high speed camera 10 and discharged to air water separator 7. The actual
flow rate of each air and water is measured using bath flow meter 8 and 9 with maximum
errors up to 0.393% and 0.106% respectively.
4.4.2 Result and discussion
The boundary conditions are; constant water inlet velocity: 0.2 m.sec-1
, equivalent to
total volume flow rate 2.265 l.min-1
, at 26.85oC and constant wall surface temperature 0
oC.
The model was run on steady state mode resulting velocity distribution Fig. 4.20,
temperature distribution Fig. 4.21 and pressure distribution Fig. 4.22. All figures are about
center plane of corrugate channel of brazed plate heat exchanger model.
Fig. 4.20 Velocity distribution
Fig. 4.20, mal-uniformity is occurred, since the highest velocity is distributed along
edge closed to inlet and outlet manifold, the moderate velocity is distributed along edge
away from inlet and outlet manifold. The lowest velocity is distributed in center line of
plate or in intersection of corrugated herringbone zone. The mal-uniformity tends to be
promoted by geometry of inlet and outlet distributor zone, formed by attached of couple
plates. Also, it is due to parallel inlet outlet configuration. Potentially, the cross inlet outlet
inlet outlet
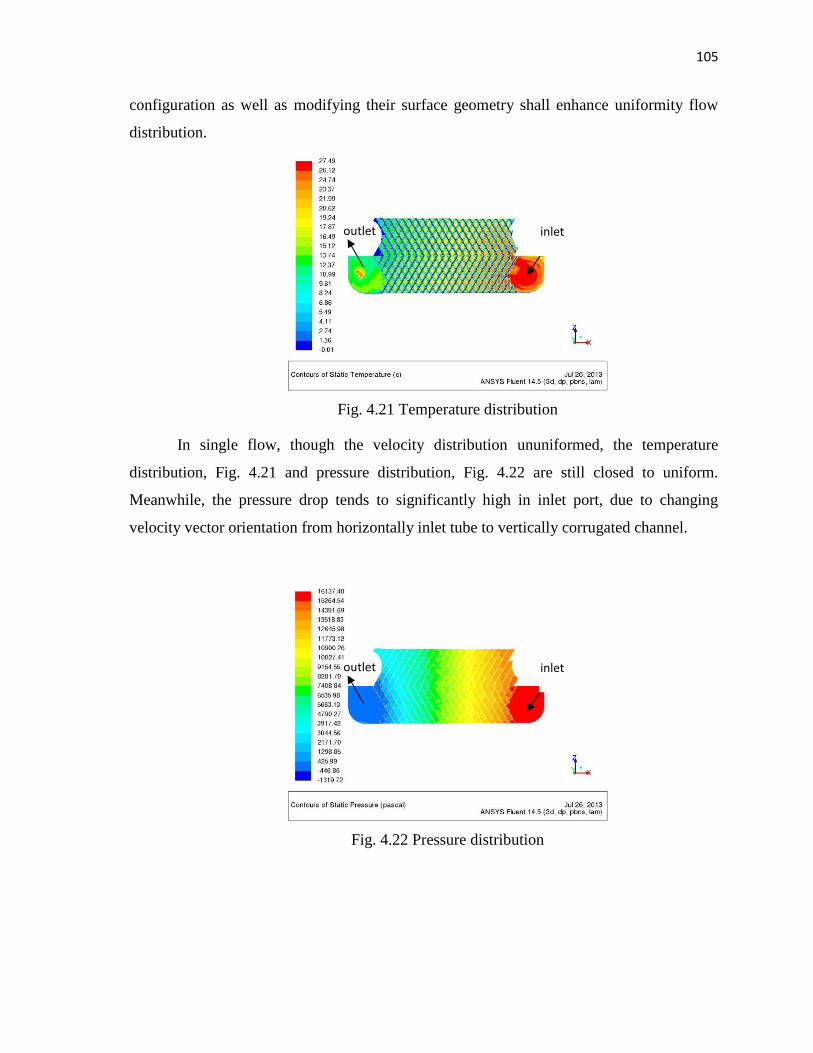
105
configuration as well as modifying their surface geometry shall enhance uniformity flow
distribution.
Fig. 4.21 Temperature distribution
In single flow, though the velocity distribution ununiformed, the temperature
distribution, Fig. 4.21 and pressure distribution, Fig. 4.22 are still closed to uniform.
Meanwhile, the pressure drop tends to significantly high in inlet port, due to changing
velocity vector orientation from horizontally inlet tube to vertically corrugated channel.
Fig. 4.22 Pressure distribution
inlet outlet
inlet outlet
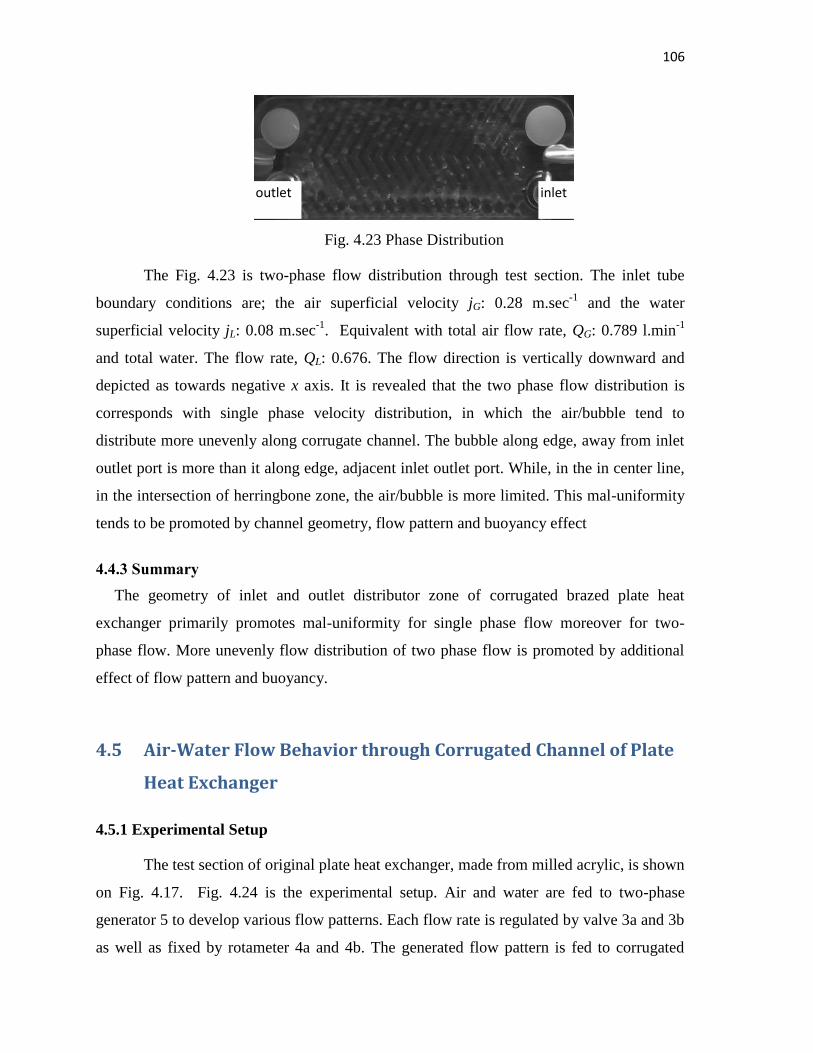
106
Fig. 4.23 Phase Distribution
The Fig. 4.23 is two-phase flow distribution through test section. The inlet tube
boundary conditions are; the air superficial velocity jG: 0.28 m.sec-1
and the water
superficial velocity jL: 0.08 m.sec-1
. Equivalent with total air flow rate, QG: 0.789 l.min-1
and total water. The flow rate, QL: 0.676. The flow direction is vertically downward and
depicted as towards negative x axis. It is revealed that the two phase flow distribution is
corresponds with single phase velocity distribution, in which the air/bubble tend to
distribute more unevenly along corrugate channel. The bubble along edge, away from inlet
outlet port is more than it along edge, adjacent inlet outlet port. While, in the in center line,
in the intersection of herringbone zone, the air/bubble is more limited. This mal-uniformity
tends to be promoted by channel geometry, flow pattern and buoyancy effect
4.4.3 Summary
The geometry of inlet and outlet distributor zone of corrugated brazed plate heat
exchanger primarily promotes mal-uniformity for single phase flow moreover for two-
phase flow. More unevenly flow distribution of two phase flow is promoted by additional
effect of flow pattern and buoyancy.
4.5 Air-Water Flow Behavior through Corrugated Channel of Plate
Heat Exchanger
4.5.1 Experimental Setup
The test section of original plate heat exchanger, made from milled acrylic, is shown
on Fig. 4.17. Fig. 4.24 is the experimental setup. Air and water are fed to two-phase
generator 5 to develop various flow patterns. Each flow rate is regulated by valve 3a and 3b
as well as fixed by rotameter 4a and 4b. The generated flow pattern is fed to corrugated
inlet outlet
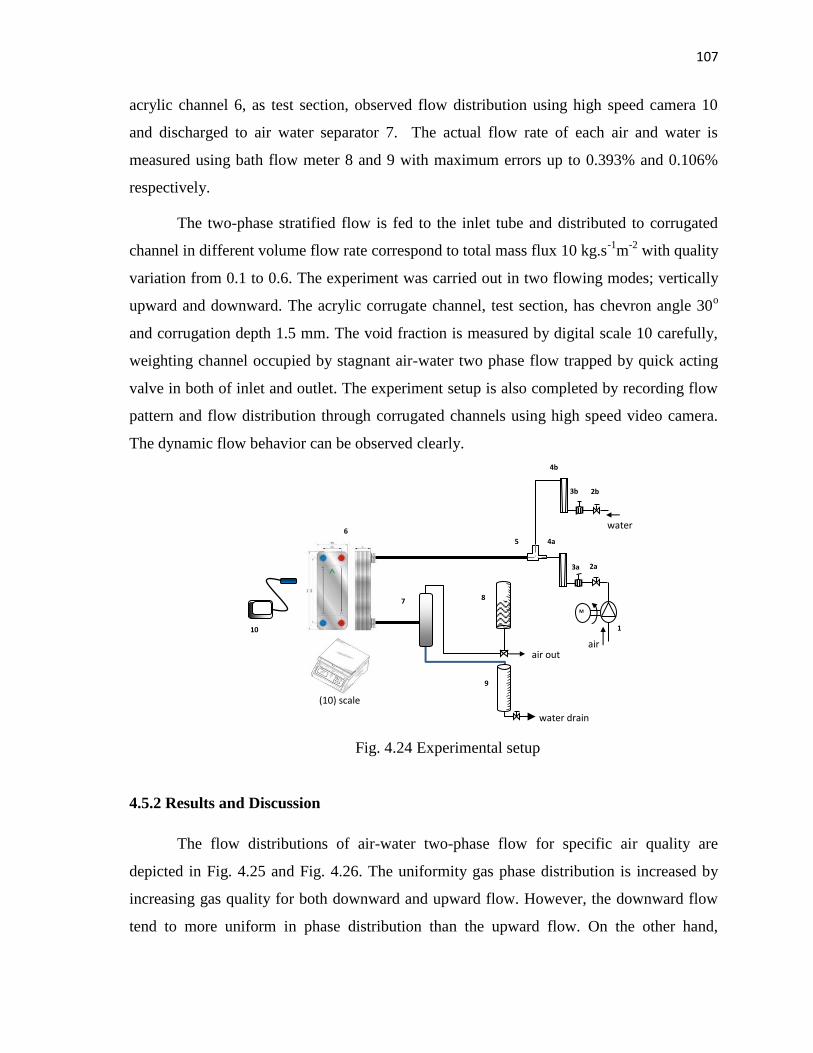
107
acrylic channel 6, as test section, observed flow distribution using high speed camera 10
and discharged to air water separator 7. The actual flow rate of each air and water is
measured using bath flow meter 8 and 9 with maximum errors up to 0.393% and 0.106%
respectively.
The two-phase stratified flow is fed to the inlet tube and distributed to corrugated
channel in different volume flow rate correspond to total mass flux 10 kg.s-1
m-2
with quality
variation from 0.1 to 0.6. The experiment was carried out in two flowing modes; vertically
upward and downward. The acrylic corrugate channel, test section, has chevron angle 30o
and corrugation depth 1.5 mm. The void fraction is measured by digital scale 10 carefully,
weighting channel occupied by stagnant air-water two phase flow trapped by quick acting
valve in both of inlet and outlet. The experiment setup is also completed by recording flow
pattern and flow distribution through corrugated channels using high speed video camera.
The dynamic flow behavior can be observed clearly.
Fig. 4.24 Experimental setup
4.5.2 Results and Discussion
The flow distributions of air-water two-phase flow for specific air quality are
depicted in Fig. 4.25 and Fig. 4.26. The uniformity gas phase distribution is increased by
increasing gas quality for both downward and upward flow. However, the downward flow
tend to more uniform in phase distribution than the upward flow. On the other hand,
9
5
1
air
water
7 M
2a 3a
4b
4a
2b 3b
10
air out
water drain
8
6
(10) scale
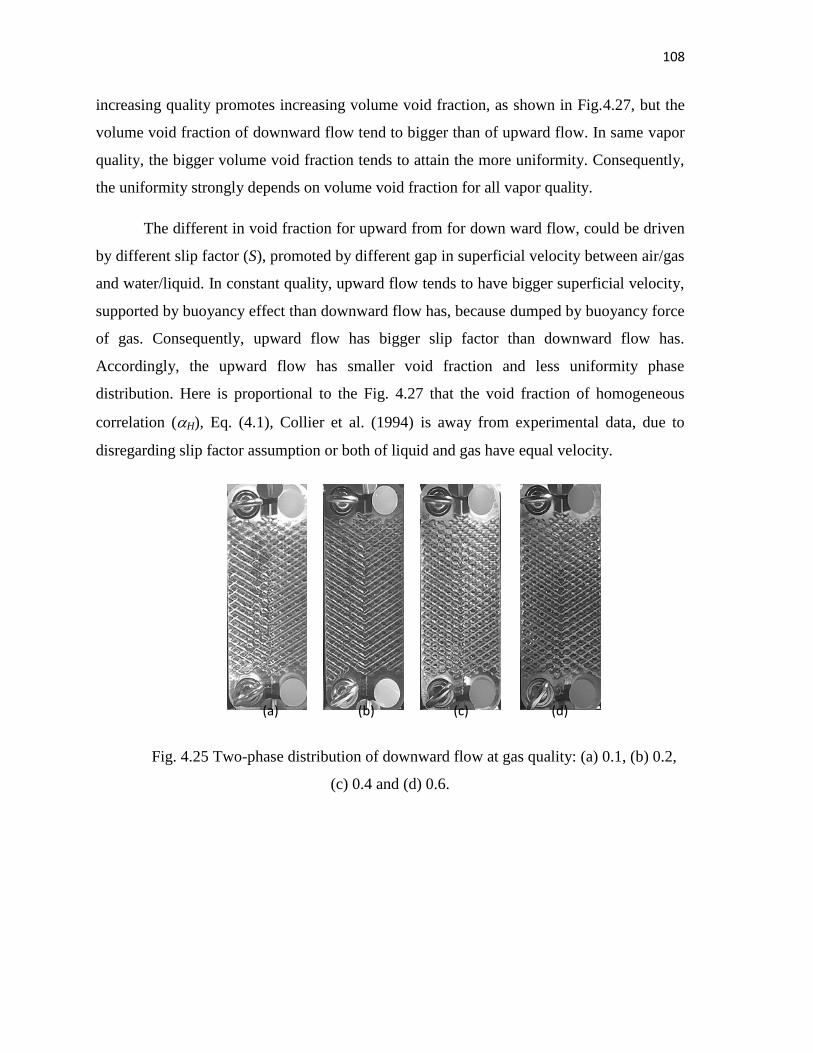
108
increasing quality promotes increasing volume void fraction, as shown in Fig.4.27, but the
volume void fraction of downward flow tend to bigger than of upward flow. In same vapor
quality, the bigger volume void fraction tends to attain the more uniformity. Consequently,
the uniformity strongly depends on volume void fraction for all vapor quality.
The different in void fraction for upward from for down ward flow, could be driven
by different slip factor (S), promoted by different gap in superficial velocity between air/gas
and water/liquid. In constant quality, upward flow tends to have bigger superficial velocity,
supported by buoyancy effect than downward flow has, because dumped by buoyancy force
of gas. Consequently, upward flow has bigger slip factor than downward flow has.
Accordingly, the upward flow has smaller void fraction and less uniformity phase
distribution. Here is proportional to the Fig. 4.27 that the void fraction of homogeneous
correlation (H), Eq. (4.1), Collier et al. (1994) is away from experimental data, due to
disregarding slip factor assumption or both of liquid and gas have equal velocity.
Fig. 4.25 Two-phase distribution of downward flow at gas quality: (a) 0.1, (b) 0.2,
(c) 0.4 and (d) 0.6.
(a) (b) (c) (d)
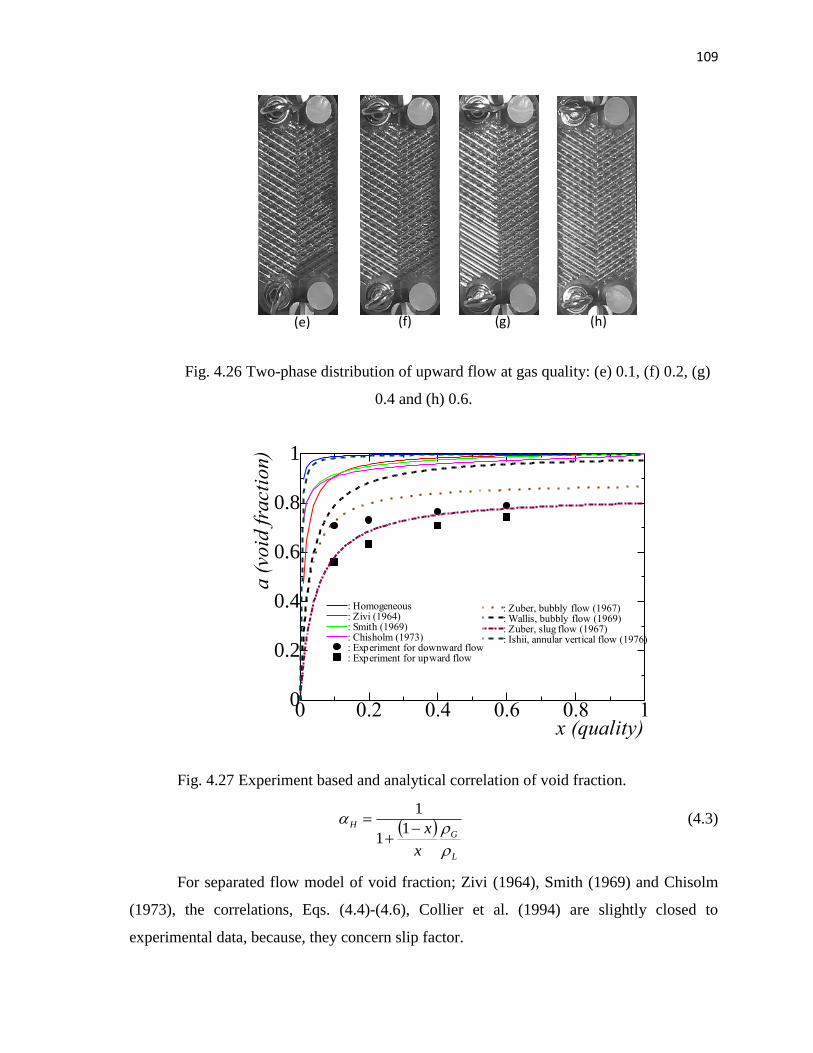
109
Fig. 4.26 Two-phase distribution of upward flow at gas quality: (e) 0.1, (f) 0.2, (g)
0.4 and (h) 0.6.
Fig. 4.27 Experiment based and analytical correlation of void fraction.
L
GH
x
x
1
1
1 (4.3)
For separated flow model of void fraction; Zivi (1964), Smith (1969) and Chisolm
(1973), the correlations, Eqs. (4.4)-(4.6), Collier et al. (1994) are slightly closed to
experimental data, because, they concern slip factor.
0 0.2 0.4 0.6 0.8 10
0.2
0.4
0.6
0.8
1
x (quality)
a (
void
fra
ctio
n)
: Homogeneous: Zivi (1964): Smith (1969): Chisholm (1973): Experiment for downward flow: Experiment for upward flow
: Zuber, bubbly flow (1967): Wallis, bubbly flow (1969): Zuber, slug flow (1967): Ishii, annular vertical flow (1976)
(e) (f) (g) (h)
110
S
x
x
L
G
1
1
1 (4.4)
G
L
L
G
u
uS
(4.5)
Zivi’s void fraction (1964);
32
11
1
L
G
x
x
(4.6)
Smith’s void fraction (1969);
58.078.01
79.01
1
L
G
x
x
(4.7)
Chisolm’s slip factor (1973);
21
11
G
L
L
G xu
uS
(4.8)
Although, their correlation is still away from experimental data, the trend line is
quite similar. Therefore, the void fraction model for plate heat exchanger potentially could
be derived from separated model by modification of slip factor correlation.
Fig. 4.27, different from others, the drift flux model of void fraction correlation d,
Eq. (4.7), Thome (2010);
1
1
m
UxxC
x GU
LG
o
G
d (4.9)
In which GUU , the drift velocity correlations are;
Zuber (1967) for bubbly flow
41
241.1
L
GLGU
gU
(4.10)
Wallis (1967) for bubbly flow
111
41
253.1
L
GLGU
gU
(4.11)
Zuber (1967) for slug flow
21
35.0
L
iGLGU
dgU
(4.12)
Ishii (1976) for annular vertical flow
L
GL
iG
LLGU
d
UU
23 (4.13)
Zuber (1967) and Wallis (1969), has the best trend line and proportionality with
experimental data, excluding Ishii’s correlation. The flow pattern reference of each
correlation is different. Though the fed flow pattern in inlet conduit is stratified regime, it
tends to transforms to slug flow regime. Therefore, Zuber’s correlation using slug flow
regime is the best void fraction correlation ones. However, his correlation shall be
readjusted in order to match to the recent boundary condition. Hence, the drift flux model
presented more realistic correlation.
Although the most of forgoing correlations are constructed based on two-phase flow
in circular tube, the correlations show good agreement and reasonable. Consequently, for
deriving void fraction correlation based on the drift flux model of Zuber (1967) correlation
shall consider; flow pattern, channel geometry and its orientation.
Furthermore, the uniformity of two-phase flow distribution is promoted by channel
geometry, especially in inlet and outlet channel of distributor zone, Mustaghfirin et al.
(2013) and is also promoted by effective length variation along channel entire corrugated
plate, in accordance with the initial study, Mustaghfirin et al. (2012). Similarly, mal-
uniformity also is driven by damping effect of channel length, gas-phase impact and low
velocity of liquid. They affect to transform flow pattern, Mustaghfirin et al. (2013).
Though, all of previous study was carried out on merge pipe distributor, the two-phase flow
distribution effect tend to similar, locally as well as tend to more complicated for entire
corrugated channel of plate heat exchanger.
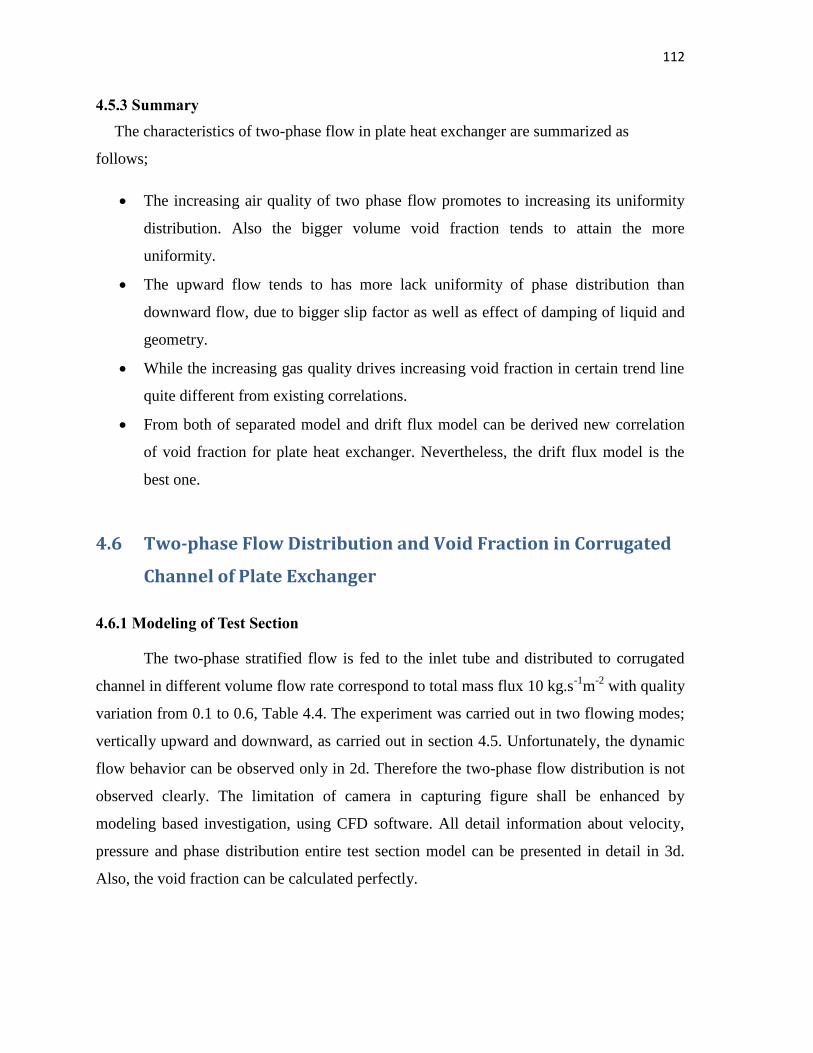
112
4.5.3 Summary
The characteristics of two-phase flow in plate heat exchanger are summarized as
follows;
The increasing air quality of two phase flow promotes to increasing its uniformity
distribution. Also the bigger volume void fraction tends to attain the more
uniformity.
The upward flow tends to has more lack uniformity of phase distribution than
downward flow, due to bigger slip factor as well as effect of damping of liquid and
geometry.
While the increasing gas quality drives increasing void fraction in certain trend line
quite different from existing correlations.
From both of separated model and drift flux model can be derived new correlation
of void fraction for plate heat exchanger. Nevertheless, the drift flux model is the
best one.
4.6 Two-phase Flow Distribution and Void Fraction in Corrugated
Channel of Plate Exchanger
4.6.1 Modeling of Test Section
The two-phase stratified flow is fed to the inlet tube and distributed to corrugated
channel in different volume flow rate correspond to total mass flux 10 kg.s-1
m-2
with quality
variation from 0.1 to 0.6, Table 4.4. The experiment was carried out in two flowing modes;
vertically upward and downward, as carried out in section 4.5. Unfortunately, the dynamic
flow behavior can be observed only in 2d. Therefore the two-phase flow distribution is not
observed clearly. The limitation of camera in capturing figure shall be enhanced by
modeling based investigation, using CFD software. All detail information about velocity,
pressure and phase distribution entire test section model can be presented in detail in 3d.
Also, the void fraction can be calculated perfectly.
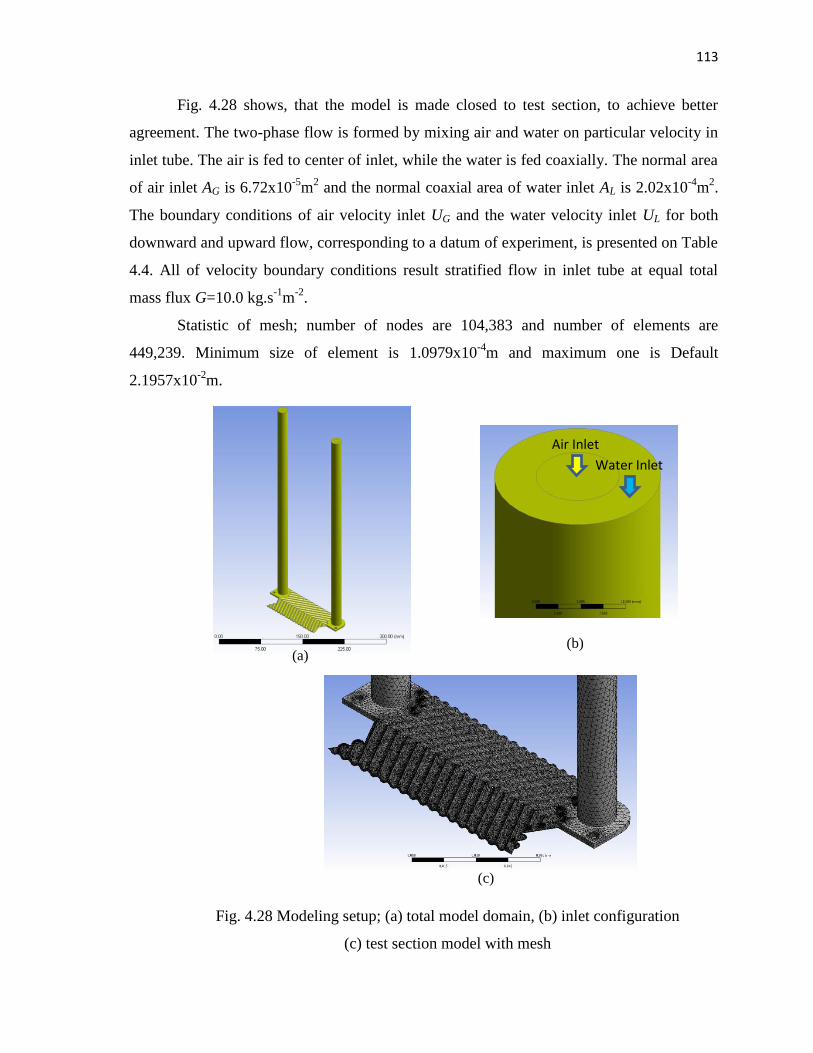
113
Fig. 4.28 shows, that the model is made closed to test section, to achieve better
agreement. The two-phase flow is formed by mixing air and water on particular velocity in
inlet tube. The air is fed to center of inlet, while the water is fed coaxially. The normal area
of air inlet AG is 6.72x10⁻⁵
m2 and the normal coaxial area of water inlet AL is 2.02x10
-4m
2.
The boundary conditions of air velocity inlet UG and the water velocity inlet UL for both
downward and upward flow, corresponding to a datum of experiment, is presented on Table
4.4. All of velocity boundary conditions result stratified flow in inlet tube at equal total
mass flux G=10.0 kg.s-1
m-2
.
Statistic of mesh; number of nodes are 104,383 and number of elements are
449,239. Minimum size of element is 1.0979x10⁻⁴
m and maximum one is Default
2.1957x10⁻²
m.
Fig. 4.28 Modeling setup; (a) total model domain, (b) inlet configuration
(c) test section model with mesh
(a) (b)
(c)
Air Inlet
Water Inlet
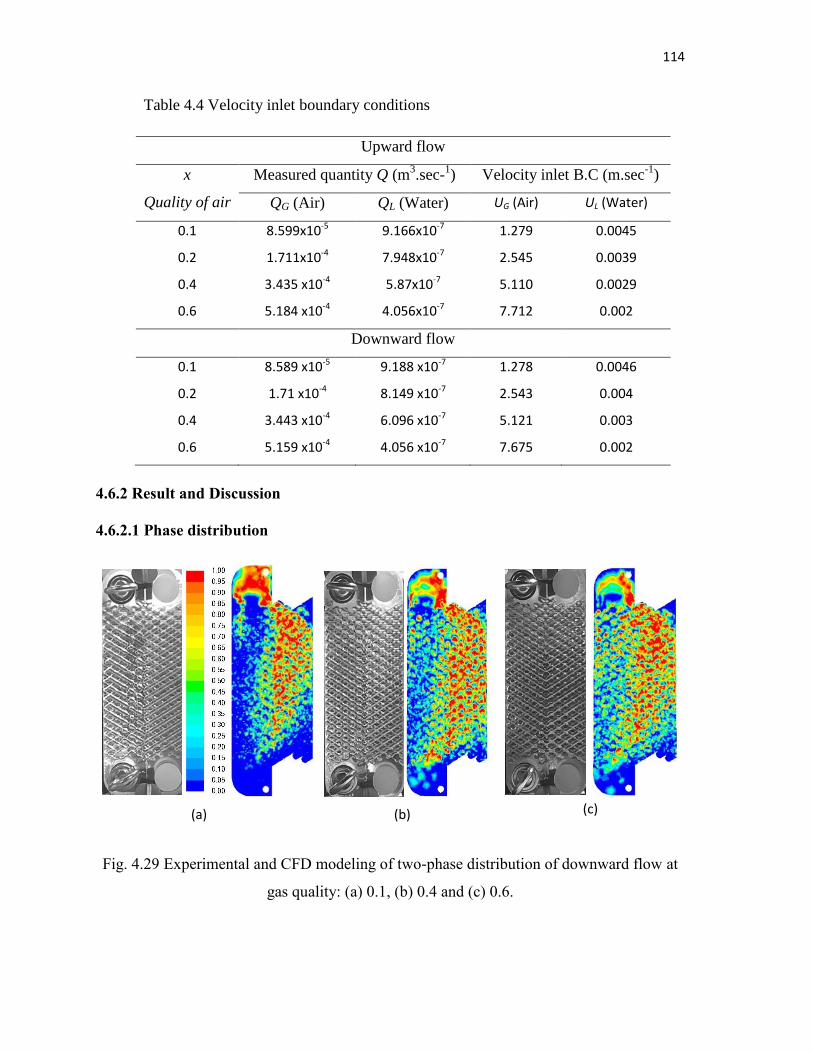
114
Table 4.4 Velocity inlet boundary conditions
Upward flow
x
Quality of air
Measured quantity Q (m3.sec-
1) Velocity inlet B.C (m.sec
-1)
QG (Air) QL (Water) UG (Air) UL (Water)
0.1 8.599x10⁻⁵ 9.166x10⁻⁷ 1.279 0.0045
0.2 1.711x10⁻⁴ 7.948x10⁻⁷ 2.545 0.0039
0.4 3.435 x10⁻⁴ 5.87x10⁻⁷ 5.110 0.0029
0.6 5.184 x10⁻⁴ 4.056x10⁻⁷ 7.712 0.002
Downward flow
0.1 8.589 x10⁻⁵ 9.188 x10⁻⁷ 1.278 0.0046
0.2 1.71 x10⁻⁴ 8.149 x10⁻⁷ 2.543 0.004
0.4 3.443 x10⁻⁴ 6.096 x10⁻⁷ 5.121 0.003
0.6 5.159 x10⁻⁴ 4.056 x10⁻⁷ 7.675 0.002
4.6.2 Result and Discussion
4.6.2.1 Phase distribution
Fig. 4.29 Experimental and CFD modeling of two-phase distribution of downward flow at
gas quality: (a) 0.1, (b) 0.4 and (c) 0.6.
(a) (b) (c)
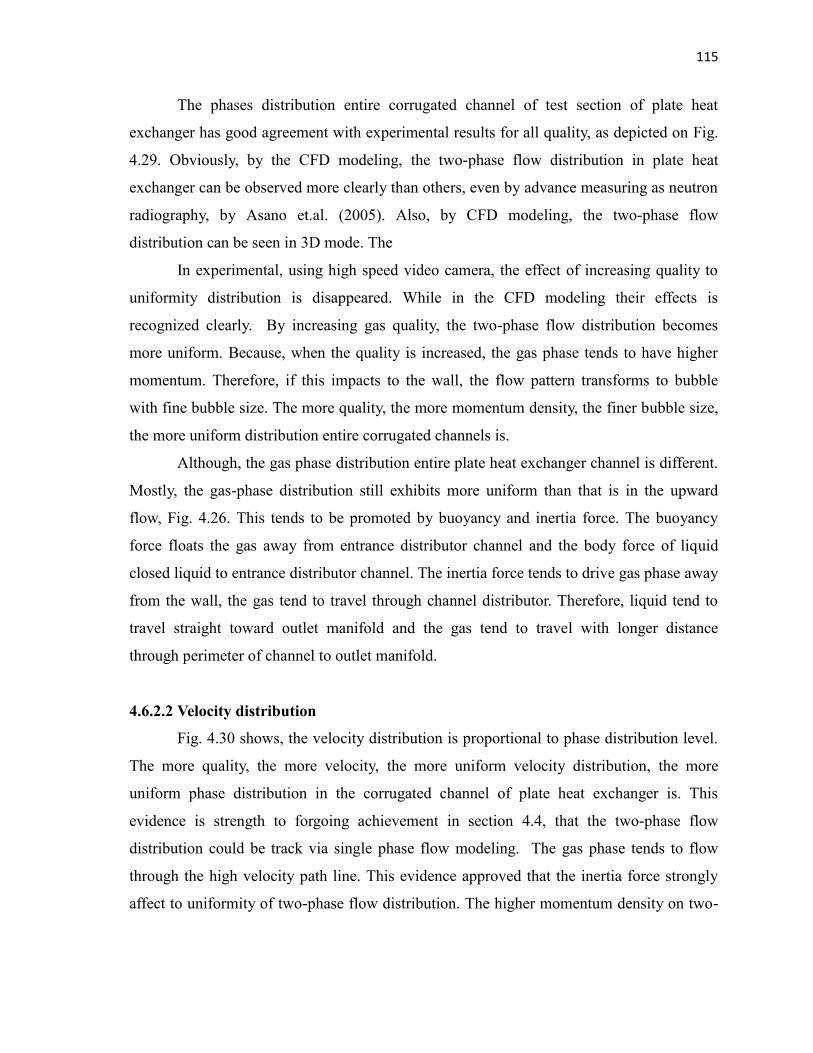
115
The phases distribution entire corrugated channel of test section of plate heat
exchanger has good agreement with experimental results for all quality, as depicted on Fig.
4.29. Obviously, by the CFD modeling, the two-phase flow distribution in plate heat
exchanger can be observed more clearly than others, even by advance measuring as neutron
radiography, by Asano et.al. (2005). Also, by CFD modeling, the two-phase flow
distribution can be seen in 3D mode. The
In experimental, using high speed video camera, the effect of increasing quality to
uniformity distribution is disappeared. While in the CFD modeling their effects is
recognized clearly. By increasing gas quality, the two-phase flow distribution becomes
more uniform. Because, when the quality is increased, the gas phase tends to have higher
momentum. Therefore, if this impacts to the wall, the flow pattern transforms to bubble
with fine bubble size. The more quality, the more momentum density, the finer bubble size,
the more uniform distribution entire corrugated channels is.
Although, the gas phase distribution entire plate heat exchanger channel is different.
Mostly, the gas-phase distribution still exhibits more uniform than that is in the upward
flow, Fig. 4.26. This tends to be promoted by buoyancy and inertia force. The buoyancy
force floats the gas away from entrance distributor channel and the body force of liquid
closed liquid to entrance distributor channel. The inertia force tends to drive gas phase away
from the wall, the gas tend to travel through channel distributor. Therefore, liquid tend to
travel straight toward outlet manifold and the gas tend to travel with longer distance
through perimeter of channel to outlet manifold.
4.6.2.2 Velocity distribution
Fig. 4.30 shows, the velocity distribution is proportional to phase distribution level.
The more quality, the more velocity, the more uniform velocity distribution, the more
uniform phase distribution in the corrugated channel of plate heat exchanger is. This
evidence is strength to forgoing achievement in section 4.4, that the two-phase flow
distribution could be track via single phase flow modeling. The gas phase tends to flow
through the high velocity path line. This evidence approved that the inertia force strongly
affect to uniformity of two-phase flow distribution. The higher momentum density on two-
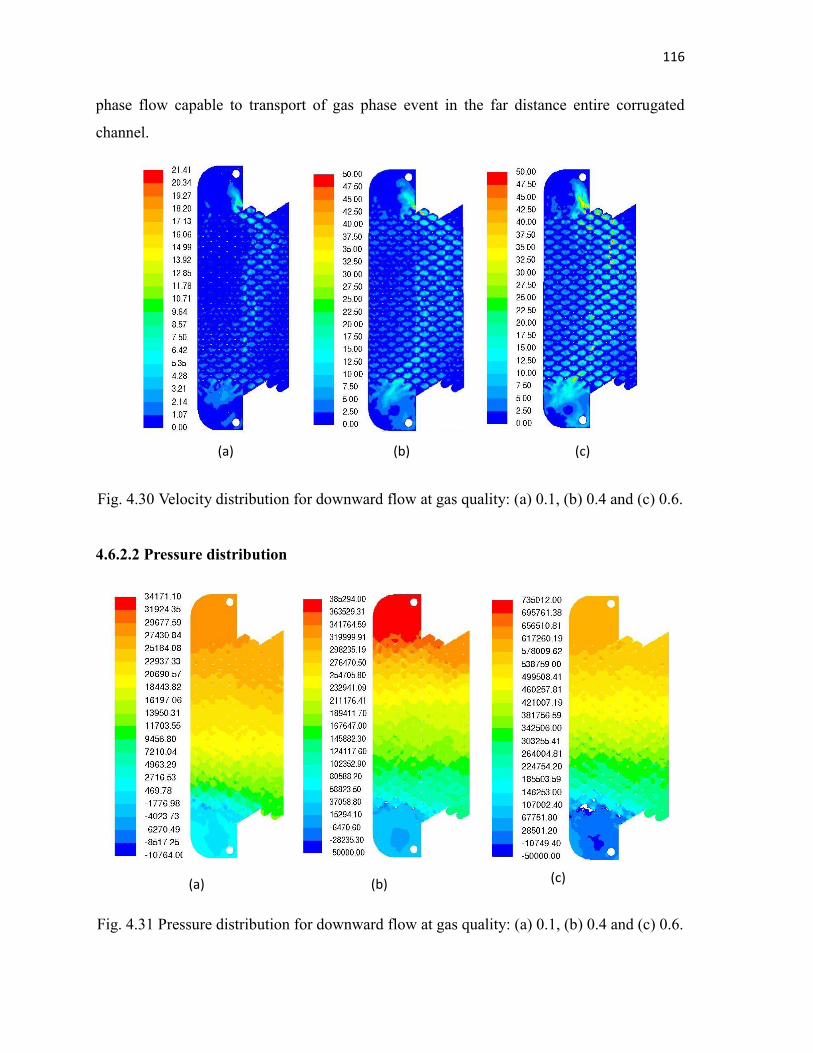
116
phase flow capable to transport of gas phase event in the far distance entire corrugated
channel.
Fig. 4.30 Velocity distribution for downward flow at gas quality: (a) 0.1, (b) 0.4 and (c) 0.6.
4.6.2.2 Pressure distribution
Fig. 4.31 Pressure distribution for downward flow at gas quality: (a) 0.1, (b) 0.4 and (c) 0.6.
(a) (b) (c)
(a) (b) (c)
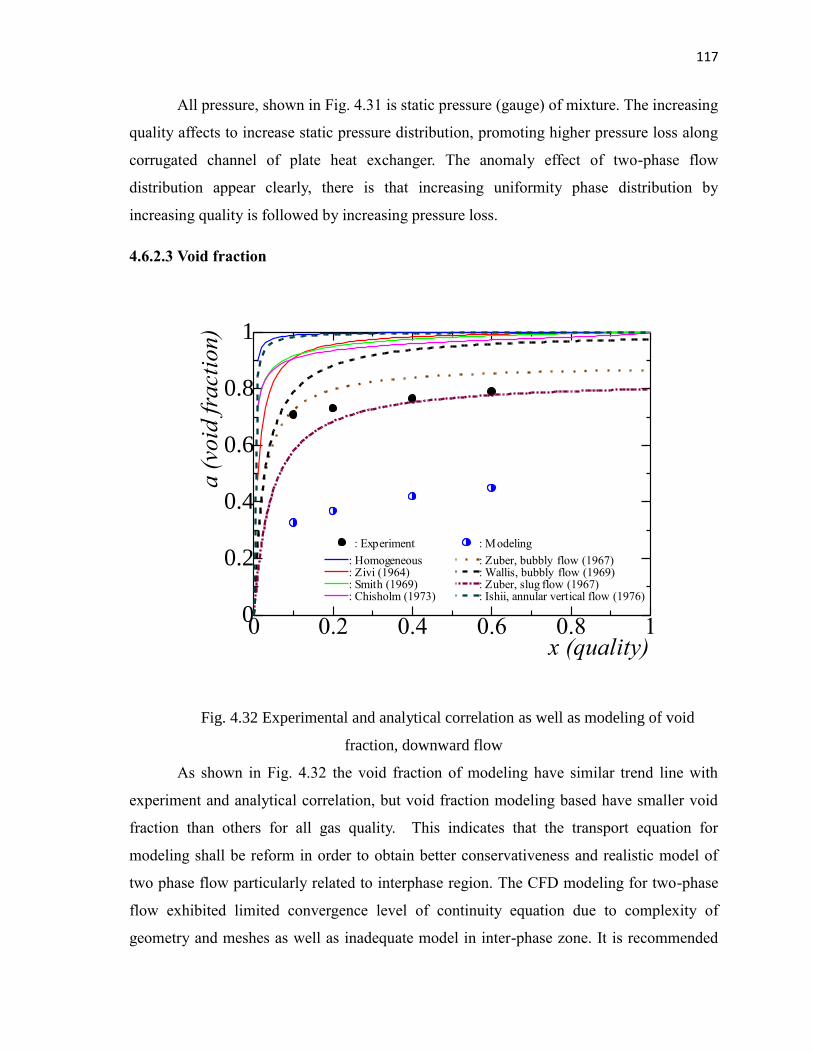
117
All pressure, shown in Fig. 4.31 is static pressure (gauge) of mixture. The increasing
quality affects to increase static pressure distribution, promoting higher pressure loss along
corrugated channel of plate heat exchanger. The anomaly effect of two-phase flow
distribution appear clearly, there is that increasing uniformity phase distribution by
increasing quality is followed by increasing pressure loss.
4.6.2.3 Void fraction
Fig. 4.32 Experimental and analytical correlation as well as modeling of void
fraction, downward flow
As shown in Fig. 4.32 the void fraction of modeling have similar trend line with
experiment and analytical correlation, but void fraction modeling based have smaller void
fraction than others for all gas quality. This indicates that the transport equation for
modeling shall be reform in order to obtain better conservativeness and realistic model of
two phase flow particularly related to interphase region. The CFD modeling for two-phase
flow exhibited limited convergence level of continuity equation due to complexity of
geometry and meshes as well as inadequate model in inter-phase zone. It is recommended
0 0.2 0.4 0.6 0.8 10
0.2
0.4
0.6
0.8
1
x (quality)
a (
void
fra
ctio
n)
: Homogeneous: Zivi (1964): Smith (1969): Chisholm (1973)
: Zuber, bubbly flow (1967): Wallis, bubbly flow (1969): Zuber, slug flow (1967): Ishii, annular vertical flow (1976)
: Experiment : Modeling
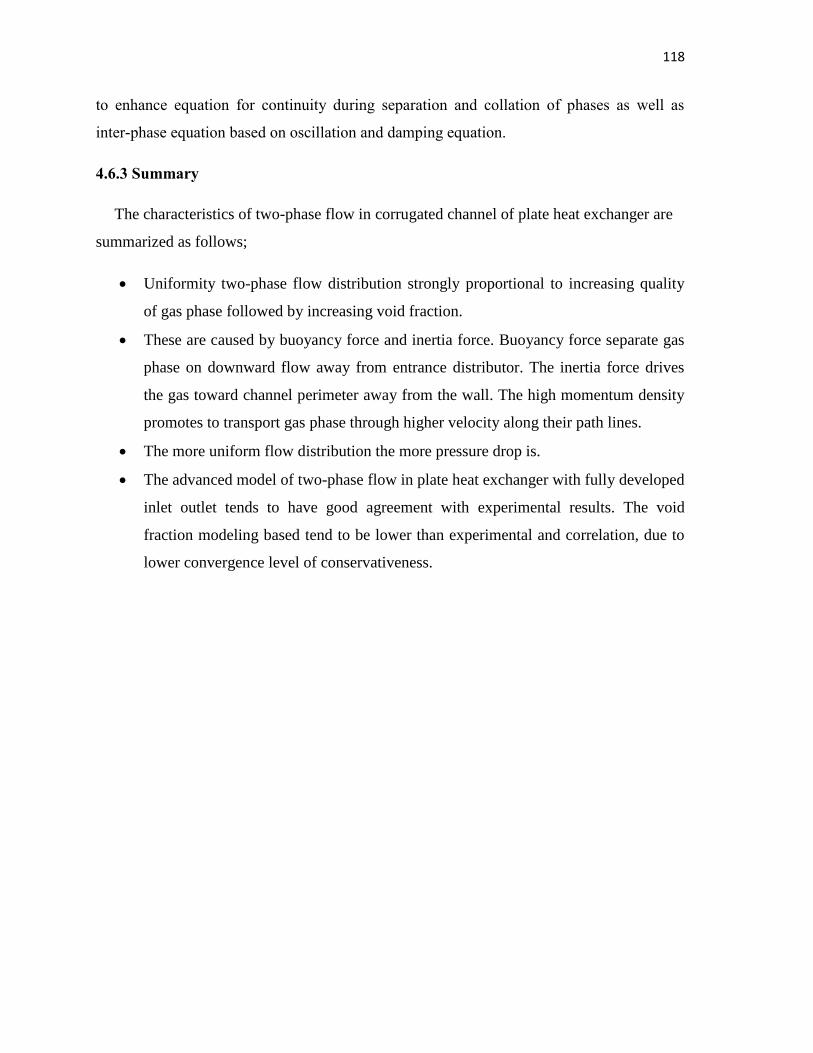
118
to enhance equation for continuity during separation and collation of phases as well as
inter-phase equation based on oscillation and damping equation.
4.6.3 Summary
The characteristics of two-phase flow in corrugated channel of plate heat exchanger are
summarized as follows;
Uniformity two-phase flow distribution strongly proportional to increasing quality
of gas phase followed by increasing void fraction.
These are caused by buoyancy force and inertia force. Buoyancy force separate gas
phase on downward flow away from entrance distributor. The inertia force drives
the gas toward channel perimeter away from the wall. The high momentum density
promotes to transport gas phase through higher velocity along their path lines.
The more uniform flow distribution the more pressure drop is.
The advanced model of two-phase flow in plate heat exchanger with fully developed
inlet outlet tends to have good agreement with experimental results. The void
fraction modeling based tend to be lower than experimental and correlation, due to
lower convergence level of conservativeness.
119
4.7 References
Asano, H., Takenaka, N., Wakabayashi, T. and Fujii, T., (2005), Visualization and void
fraction distribution of downward gas–liquid two-phase flow in a plate heat
exchanger by neutron radiography, Nuclear Instruments and Methods in Physics
Research A 542, p. 154–160
Collier, J. G. and Thome, J. R., (1994), Convective Boiling and Condensation, pp. 34-70,
Clarendon Press, Oxford.
Danfoss, (2011), Micro plate heat exchangers take brazed plate technology to the next level,
Refrigeration and Air conditioning Article, http://heating.danfoss.com/
Content/433b16b2-2323-4243-b701ba0368b8bc4_MNU17516840_SIT54.html.
Danfoss, (2011), Micro plate heat exchangers take brazed plate technology to the next level,
Refrigeration and Air conditioning Article, http://heating.danfoss.com/
Content/433b16b2-2323-4243-b701ba0368b8bc4_MNU17516840_SIT54.html.
Elyyan, M.A. and Tafti, D.K., (2009), A novel split-dimple interrupted fin configuration for
heat transfer augmentation, Int. J. Heat and Mass Transfer 52, p. 1561–1572.
Elyyan, M.A. and Tafti, D.K., (2010), Effect of Coriolis forces in a rotating channel with
dimples and protrusions, Int. J. Heat and Fluid Flow 31, p. 1–18.
Fernandes, C.S., Dias, R.P., Nóbrega, J.M. and Maia, J.M., (2000), Laminar flow in
chevron-type plate heat exchangers: CFD analysis of tortuosity, shape factor and
friction factor. Chemical Engineering Process 46, p. 825-833.
Fernández-Seara, J., Diz, R. and Uhía, F.J., (2013), Pressure drop and heat transfer
characteristics of a titanium brazed plate-fin heat exchanger with offset strip fins,
Applied Thermal Engineering 51, p. 502-511.
Gherasim, I., Galanis, N. and Nguyen, C. T., 2011, Effects of smooth longitudinal passages
and port configuration on the flow and thermal fields in a plate heat exchanger,
Applied Thermal Engineering, Vol. 31, pp. 4113-4124.
Han, X.H., Cui, L.Q., Chen, S.J., Chen, G.M. and Wang, Q. (2010), A numerical and
experimental study of chevron, corrugated-plate heat exchangers, Int. Comm. Heat
and Mass Transfer 37, p.1008–1014.
120
Han, X.H., Cui, L.Q., Chen, S.J., Chen, G.M. and Wang, Q., 2010, A numerical and
experimental study of chevron, corrugated-plate heat exchangers, Int.
Communications in Heat and Mass Transfer, Vol. 37, pp. 1008–1014.
Hesselgreaves, J.E., (2001), Compact Heat Exchanger; Selection, Design and Operation,
Elsevier Science Ltd The Boulevard, Langford Lane Kidlington, Oxford OX5 1GB,
UK, ISBN 0-08-042839-8
Hwang, S.D., Kwon, H.G. and Cho, H.H., (2010), Local heat transfer and thermal
performance on periodically dimple-protrusion patterned walls for compact heat
exchangers, Energy 35, pp. 5357-5364.
Hwang, S.D., Kwon, H.G. and Cho, H.H., (2008), Heat transfer with dimple/protrusion
arrays in a rectangular duct with a low Reynolds number range, Int. J. Heat and Fluid
Flow 29, p. 916–926.
Kim, J.E., Doo, J.H., Ha, M.Y., Yoon, H.S. and Son, C., (2012), Numerical study on
characteristics of flow and heat transfer in a cooling passage with protrusion-in-
dimple surface, Int. J. Heat and Mass Transfer 55, p. 7257–7267.
Kupan, T, (2000), Heat Exchanger Design Hand Book, Marcel Dekker, Inc. 270 Madison
Avenue, New York, NY 10016, ISBN: 0-8247-9787-6
Leung, C. W., Probert , S. D. and Shilston, M. J., 1985, Heat exchanger design: thermal
performances of rectangular fins protruding from vertical or horizontal rectangular
bases, Applied Energy, p. 123-140.
Mancin, S., Col, D.D. and Rossetto, L. (2013), R32 partial condensation inside a brazed
plate heat exchanger, Int. J. Refrigeration 36, p. 601-611.
Mustaghfirin, M.A. and Miyara, A., 2013, Mal-uniformity Distribution of Fluid Flow
through Corrugated Channel of Brazed Plate Heat Exchanger, Proc. JSME 26th
Computational Mechanics Division Conf., Saga, Vol. 13, pp. 3-4.
Mustaghfirin, M.A., Miyara, A. and Aziz, A., 2012, Mal-uniformity of two-phase flow
through merged pipe distributor, Proc. 3rd International Forum on Heat Transfer,
Nagasaki, IFHT 2012-135.
Mustaghfirin, M.A., Miyara, A. and Yuki, H., 2013, Mal-uniformity of two-phase flow
distribution in merge pipe distributor under different outlet channel length,
Mechanics Engineering and Automation, Vol. 3, pp. 107-120.
121
Nilpueng, K. and Wongwises, S. (2010), Two-phase gas–liquid flow characteristics inside a
plate heat exchanger, Experimental Thermal and Fluid Science 34, p. 1217–1229.
Shah, R. K., Focke, W. W., Subbarao, E. C. and Mashelkar, R. A., (1988), Plate heat
exchangers and their design theory in Heat Transfer Equipment Design, Hemisphere
Publishing, Washington, DC, p. 227–254.
Shah, R. K., Kakac¸ S., Bergles, A. E. and Mayinger, F. (1981), Classification of heat
exchangers, in Heat Exchangers: Thermal-Hydraulic Fundamentals and Design,
Hemisphere Publishing, Washington, DC, pp. 9–46.
Shaji, K. and Das, S. K., 2010, The effect of flow maldistribution on the evaluation of axial
dispersion and thermal performance during the single-blow testing of plate heat
exchangers, Int. J. of Heat and Mass Transfer, Vol. 53, pp. 1591–1602.
Thome, J. R., 2010, Engineering Data Book III, pp. 34-70, Wolverine Tube Inch., Alabama.
Winkler, J., Killion, J., Garimella, S. and Fronk, B. M., 2012, Void fractions for condensing
refrigerant flow in small channels: Part I literature review, Int. J. of Refrigeration,
Vol. 35, pp. 219-245.

122
Chapter 5 Conclusions and Recommendations
5.1 Conclusions
All forgoing investigation can be summarized in following general conclusions,
these are,
For bifurcation channel;
The curved reducer distributor has the best uniformity of phase distribution,
conversely has the highest pressure drop. While the bifurcation channel distributor has
the lack-uniformity of phase distribution due to stream line separation on sharp edge of
main channel cap, but has lower pressure drop than curve reducer distributor. The
straight reducer and T-reducer exhibit the optimum condition but both of them have to
be enhanced their design. The straight distributor must be reduced stagnation area and
optimized reducer slope. The T-reducer shall be narrowed the stagnation area while
developed to 3d design.
The mal-uniformity of two phase flow distribution in bifurcation channel distributor is
originated by two-phase flow pattern entering distributor, length of outlet channel and
the inclination.
The bubble flow tends to give mal-uniform phase distribution and the bubble pattern
does not transform along outlet channel in various length of outlet channel. All of two
phase flow pattern become uniform in distribution, when the distributor is set
vertically
The slug have better phase distribution and the flow pattern changes in both lower and
upper outlet channel, while in stratified flow , it changes in lower outlet channel only.
The impacting two phase flow in the entrance region of bifurcation channel distributor
promotes varying of pressure loss and pressure gain not only in entrance zone, but also
in junctions as well as in the outlet channels
The varying of pressure loss and pressure gain tend to what be caused by oscillating
and damping process of air and water phase, promoting fluctuating velocity and
124
pattern transformation in outlet channels.
The oscillating and dumping process among phases in entrance region has good
agreement with Beguin’s works (2009), but junction and outlet channels region does
not.
The phase impact in end wall of distributor junction promotes pressure gain in
entrance region accumulate and or followed by fluctuating static pressure entire
distributor
Perhaps, the fluctuating pressure is promoted by successive oscillation and damping in
interface zone and this will be reduced by increasing channel length, than vanish in
fully developed region
The Friedel (1979) correlation has better agreement to experimental results than others
for all domains. While, the pressure gain/loss correlation by Hwang et al. (1988) is the
best for bubble flow in junction only.
For plate heat exchanger;
The temperature and pressure distribution in protruded channel is more uniform than in
corrugated channel. But, in the dimple channel, in back of protrusion channel, tends to
increase pressure drop significantly more than corrugated channel.
The protrusion and dimple plate afford to increase heat flux more than in corrugation
plate up to 111% and 24%, respectively.
The protrusion channel contributes to reduce pressure drop per unit volume 49% less
than in corrugation one. Unfortunately, the dimple channel is liable to increase
pressure drop per unit volume up to 204% more than in corrugation channel.
The increasing pressure drop is contributed by crash flow inter adjacent dimple
compartment.
The velocity distribution in the corrugation channel is more uniform followed by
dimple channel and protrusion channel. The effect existing dimple and protrusion for
increasing heat flux is stronger than increasing velocity.
The geometry of inlet and outlet distributor zone of corrugated brazed plate heat
exchanger primarily promotes mal-uniformity for single phase flow moreover for two-
125
phase flow. More unevenly flow distribution of two phase flow is promoted by
additional effect of flow pattern and buoyancy.
The increasing air quality of two phase flow promotes to increasing its uniformity
distribution. Also the bigger volume void fraction tends to attain the more uniformity.
The upward flow tends to has more lack uniformity of phase distribution than
downward flow, due to bigger slip factor and effect of damping of liquid and geometry
as well as buoyancy.
While the increasing gas quality drives increasing void fraction in certain trend line
quite different from existing correlations.
The advanced model of two-phase flow in plate heat exchanger with fully developed
inlet outlet tends to have good agreement with experimental results.
5.2 Recommendations
For bifurcation channel;
The design development of distributor should refer to aerofoil contour by using
aerodynamics or hydrodynamics theory. The CFD modelling is recommended to
append viscous effect to detail turbulence phenomenon. The best modelling have to
expand to 3d modelling analysis for perfection design.
The transport equation for two-phase flow shall accommodate oscillating and
damping effect particularly in impingement flow.
Almost of all two-phase flow correlation should be reformed, while implemented on
all distributors in order to reach better agreement and the future correlation shall be
developed based on Friedel correlation (1979)
For plate heat exchanger;
Modifying intersection inter protruded surfaces such that the flow vector adjacent
dimple compartment format acute angle (φ<90o) potentially reduces pressure drop
per unit volume.
Making the combination of protrusion and dimple in the same plate, forming
uniform channel for whole channel layer such as in corrugate channel as well as
potentially increase the heat transfer capacity and reduce pressure drop significantly.
126
From both of separated model and drift flux model can be derived new correlation
of void fraction for plate heat exchanger. Nevertheless, the drift flux model is the
best one.
Uniformity two-phase flow distribution strongly proportional to increasing quality
of gas phase followed by increasing void fraction. These are caused by buoyancy
force and inertia force.
The buoyancy force separate gas phase on downward flow away from entrance
distributor. The inertia force drives the gas toward channel perimeter away from the
wall. The high momentum density promotes to transport gas phase through higher
velocity along their path lines.
The more uniform flow distribution the more pressure drop is.
The advanced model of two-phase flow in plate heat exchanger with fully developed
inlet outlet tends to have good agreement with experimental results. The void
fraction modeling based tend to be lower than experimental and correlation, due to
lower convergence level of conservativeness.
General recommendation;
The combination between experimental and modelling has been done. It is very
good method to obtain some detail information about two-phase flow in flow field which
cannot be achieved by experiment only. Some evidence has not been revealed yet and
become a good challenge in future research. There are; oscillating and damping in two-
phase flow and unrealistic model resulted by modeling in interphase region of two-phase
flow. These two problems are apparently having relationship each other. Accordingly, the
following works should be done in future research;
Try to develop new two-phase flow model using ‘damping and vibration’ approach
instead of existing model; homogeneous and separated model
Start work with developing related equation and tested via modeling using CFD
package by creating related equation in UDF (User Define Function). This shall
enhance two-phase flow model particularly in complicated problem, interphase
region
127
The problem of oscillation and damping is not change basic transport equations, but
only enhance source term equation to accommodate the oscillation and dumping
effect
Together, the experimental work should be done for validation purpose, the merge
pipe distributor is still relevant for this purpose
If the forgoing basic fundamental work is well done, the work related to plate heat
exchanger must be more realistic to explore such detail two-phase flow phenomenon in
there i.e.: phase, velocity, pressure distribution as well as quality and void fraction. By
enhancing source term of transport equation to vibration correlation, the calculation time
shall increase significantly. This is special challenge for future study.
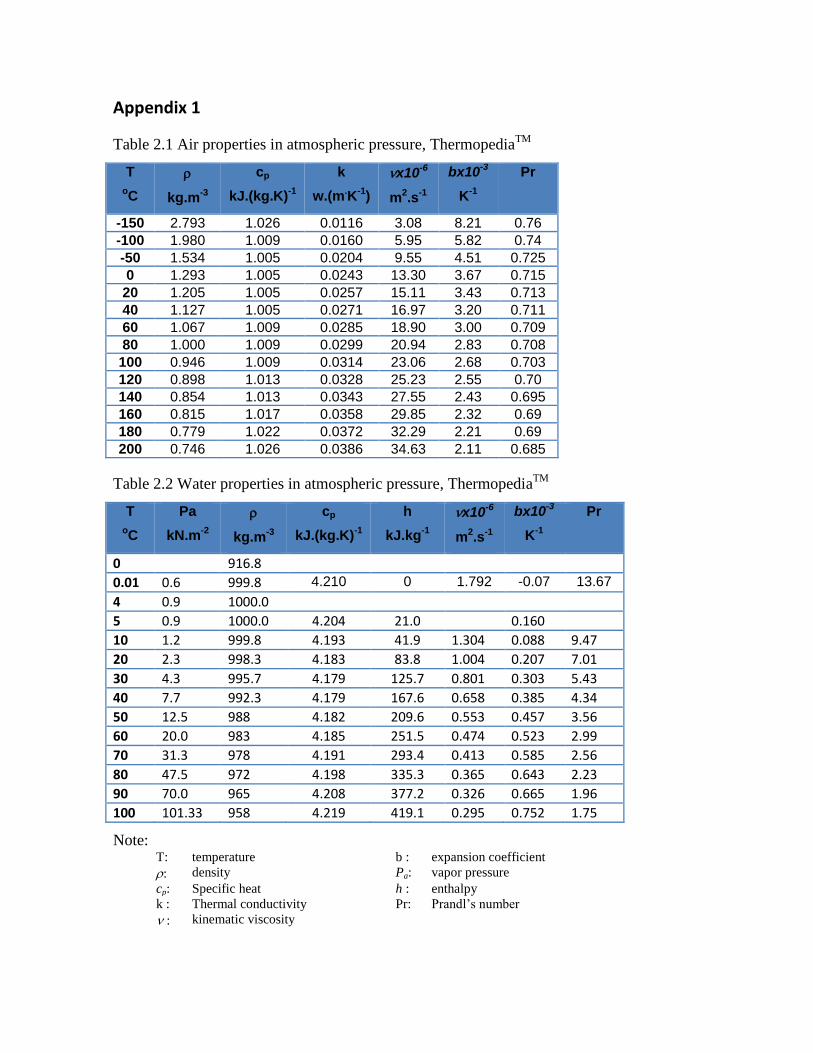
Appendix 1
Table 2.1 Air properties in atmospheric pressure, ThermopediaTM
T
oC
kg.m-3
cp
kJ.(kg.K)-1
k
w.(m.K
-1)
x10-6
m2.s
-1
bx10-3
K-1
Pr
-150 2.793 1.026 0.0116 3.08 8.21 0.76
-100 1.980 1.009 0.0160 5.95 5.82 0.74
-50 1.534 1.005 0.0204 9.55 4.51 0.725
0 1.293 1.005 0.0243 13.30 3.67 0.715
20 1.205 1.005 0.0257 15.11 3.43 0.713
40 1.127 1.005 0.0271 16.97 3.20 0.711
60 1.067 1.009 0.0285 18.90 3.00 0.709
80 1.000 1.009 0.0299 20.94 2.83 0.708
100 0.946 1.009 0.0314 23.06 2.68 0.703
120 0.898 1.013 0.0328 25.23 2.55 0.70
140 0.854 1.013 0.0343 27.55 2.43 0.695
160 0.815 1.017 0.0358 29.85 2.32 0.69
180 0.779 1.022 0.0372 32.29 2.21 0.69
200 0.746 1.026 0.0386 34.63 2.11 0.685
Table 2.2 Water properties in atmospheric pressure, ThermopediaTM
T
oC
Pa
kN.m-2
kg.m-3
cp
kJ.(kg.K)-1
h
kJ.kg-1
x10-6
m2.s
-1
bx10-3
K-1
Pr
0 916.8
0.01 0.6 999.8 4.210 0 1.792 -0.07 13.67
4 0.9 1000.0
5 0.9 1000.0 4.204 21.0 0.160
10 1.2 999.8 4.193 41.9 1.304 0.088 9.47
20 2.3 998.3 4.183 83.8 1.004 0.207 7.01
30 4.3 995.7 4.179 125.7 0.801 0.303 5.43
40 7.7 992.3 4.179 167.6 0.658 0.385 4.34
50 12.5 988 4.182 209.6 0.553 0.457 3.56
60 20.0 983 4.185 251.5 0.474 0.523 2.99
70 31.3 978 4.191 293.4 0.413 0.585 2.56
80 47.5 972 4.198 335.3 0.365 0.643 2.23
90 70.0 965 4.208 377.2 0.326 0.665 1.96
100 101.33 958 4.219 419.1 0.295 0.752 1.75
Note: T: temperature b : expansion coefficient
: density Pa: vapor pressure
cp: Specific heat h : enthalpy
k : Thermal conductivity Pr: Prandl’s number
: kinematic viscosity