Embed Size (px)
Citation preview

Thermal Modelling of Various Thermal Barrier Coatings In A High Heat Flux Rocket Engine
J.A. Nesbitt NASA Lewis Research Center
Cleveland, OH 441 35
ABSTRACT
A thermal model was developed to predict the thermal response of coated and uncoated tubes tested in a HJ0, rocket engine, Temperatures were predicted for traditional APS Zr02-Y203 thermal barrier coatings, as well as APS and LPPS Zr0,-Y,O$NiCrAIY cermet coatings. Good agreement was observed between predicted and measured metal temperatures at locations near the tube surface or at the inner tube wall.
The thermal model was also used to quantitatively examine the effect of various coating system parameters on the temperatures in the substrate and coating. Accordingly, the effect of the presence a metallic bond coat and the effect of radiation from the surface of the ceramic layer were examined. In addition, the effect of a variation in the values of the thermal conductivity of the ceramic layer was also investigated. It was shown that a variation in the thermal conductivity of the ceramic layer, on the order of that reported in the literature for plasma sprayed Zr02-Y203 coatings, can result in temperature differences in the substrate greater than IOo"C, a much greater effect than that due to the presence of a bond coat or radiation from the ceramic layer, The thermal model was also used to predict the thermal response of a coated rod in order to quantify the difference in the metal temperatures between the two substrate geometries in order to explain the previously-observed increased life of coatings on rods over that on tubes. It was shown that for the short duration testing in the rocket engine, the temperature in a tube could exceed that in a rod by more than 100°C. Lastly, a two-dimensional model was developed to evaluate the effect of tangential heat transfer around the tube and its impact on reducing the stagnation point temperature. It was also shown that tangential heat transfer does not significantly reduce the stagnation point temperature, thus allowing application of a simpler, one- dimensional model for comparing measured and predicted stagnation point temperatures.
1
https://ntrs.nasa.gov/search.jsp?R=20000004783 2018-05-25T17:40:00+00:00Z

Thermal Modelling of Various Thermal Barrier Coatings In A High Heat Flux Rocket Engine
INTRODUCTION
Previous testing (Ref. 1) of various thermal barrier coatings (TBC's) in a high-heat flux hydrogenloxygen (H2/02) rocket engine at the NASA Lewis Research Center (NASA-LeRC) showed that these coatings exhibit significant potential to reduce metal temperatures during short duration testing. In addition, durability testing of numerous TBC's from a variety of sources showed that certain TBC's possess considerable durability in a high heat flux environment, although repeatability in the life of a coating was an issue. This durability study, carried out with both rod and tube substrates, found that, in general, coatings were more durable on rod substrates than on tubes. The increased durability was attributed to the greater thermal mass of the rod resulting in lower coating and substrate temperatures, although temperature measurements on rod substrates were not performed.
The purpose of the present work was to model the thermal response of coated and uncoated tubes and rods tested in the rocket engine at NASA-LeRC. The coatings included traditional TBC's with a ceramic top coat and metallic bond coat, as well as two cermet coatings consisting of different amounts of ceramic and metal in the outer layer above a metallic bond coat. One cermet coating was applied by low pressure plasma spraying (LPPS) while the second was applied by air plasma spraying (APS). A thermal model was developed to predict temperatures for both tube and rod geometries in both the coated and uncoated conditions. These predictions were compared with metal temperatures measured just beneath the outer surface or at the inner wall of the tube (Ref. 1 ). Use was made of previously-measured gas temperatures and heat transfer coefficients for tubes located at the throat of the rocket engine (Ref. 2).
The thermal model was also used to examine the effect of the variation in reported values of the thermal conductivity of plasma sprayed Zr0,-Y203 ceramic coatings, the effect of the presence of a metallic bond coat, the effect of tangential heat transfer in reducing the temperature at the stagnation point of the tube, and the effect of radiation from the surface of the ceramic coating. The predicted effectiveness of the various coatings in reducing the thermal shock to SSME-HPFTP blades has been reported elsewhere (Ref. 3)
Background to Previous Experimental Results
Test Environment. Test tubes or rods were positioned at the throat of the gaseous H402 rocket engine. The samples were held in a copper holder such that all gas flow was perpendicular to the cylindrical axis of the samples. High pressures in the combustion chamber resulted in Mach I exhaust gas velocities slightly upstream from the throat plane (the plane passing through the cylindrical axis of each of the samples). Five tubes or rods were held in the copper holder, however, gas temperature measurements indicated significant temperature differences between the five test positions (Ref. 2). Hence, all durability testing of the coated tubes and rods had been performed in the center position. Metal temperatures in the tubes were only measured at the midpoint (lengthwise) of the tube where the gas temperature had been characterized in greatest detail (Ref 2). Gas temperatures at this position were relatively constant around the tube from the
2

stagnation point (e=Oo, facing the injector) through the throat plane (0=9OO), but decreased on the exhaust side of the tube opposite the injector (0=180"). Typical gas temperatures for the stagnation point and on the exhaust side of the tube are shown in Figure I. These relatively low gas temperatures were achieved by maintaining a hydrogen-rich environment in the rocket chamber with an 0, to H, mass ratio of approximately 1.2 to 1.4 (stoichiometric combustion at a mass ratio near 8 produces gas temperatures in excess of 3000°C). The decrease in gas temperature on the exhaust side of the tube is likely the result of entrained ambient air due to a flow separation which occurs near 8=*130° (Ref 2). Maximum heat transfer coefficients hccma) around the tube (Ref 2) are shown in Fig 3a. The decrease in ha,, on the exhaust side of the tube is again due to the flow separation. The heat transfer coefficients also varied with time during engine operation due to changing pressures and purge gases in the rocket chamber (Ref 2). The coefficients were at a maximum for I .2 seconds during the high pressure, high temperature portion of the test cycle (5-6.2 seconds, Fig I), were lower for 0.4 seconds during a brief H2 purge when the oxygen valve was closed and the pressure decreased, and were lower still for a final N, purge at approximately atmospheric pressure. The time dependence of h, was taken into account with a scaling factor K, shown in Fig 3b. Operation of the rocket engine and details of the measurements of the gas temperature and metal temperatures in the tubes are discussed in detail elsewhere (Refs. 2,4).
Substrates and Coatings. The substrate material for most tubes and rods was directionally solidified (DS) Mar-M246+Hf'. One tube of conventionally cast B-I 900 superalloy2 was also coated and tested. Both tubes and rods had an outer diameter of 0.953 cm (0.375 in) and the tubes had an inner diameter of 0.648 cm (0.255 in). Temperatures were measured with thermocouples located just beneath the outer tube surface or at the inner tube wall. The instrumented tubes were positioned so that the thermocouples were nearest the injector (0=0, see Fig 1). Details of the thermocoupling procedures and techniques are given elsewhere (Ref 2). The tubes were coated with either traditional plasma-sprayed Zr0,-Y203 TBC's or with cermet coatings. The traditional TBC's consisted of an APS Ni-Cr-AI-Y bond coat below a Zr02-7Y,03 top coat. Two thicknesses of coating were tested in either the as-sprayed condition or after a smoothing treatment with Sic paper. Two different cermet coatings were also tested. The bond coat and cermet layer of one coating was applied by LPPS, while both layers of the second coating were applied by APS. The LPPS cermet contained approximately 47% Zr0,-8Y,03 in a NiCrAlY matrix whereas the APS cermet contained only 33% of the same ceramic. Coating designations and thicknesses for both the traditional TBC's and the cermet coatings are given in Table I. Densities of the different coating materials are given in Table 11. Further details of the coatings, including compositions, surface roughness, plasma spraying parameters for the traditional TBC's, and cross-sectional microstructures, are given elsewhere (Ref. 4)
THERMAL MODELLING ANALYSIS AND RESULTS
Thermal Model Development and Analvsis. Two finite-difference thermal models were developed
' The nominal composition of DS Mar-M246+Hf is Ni-1 OCo-9Cr-1 OW-5.5A1-2.5Mo-1 STa-1 .5Ti-0.15C-0.015B-0.05Zr-1.75Hf weight percent. * The nominal composition of B-1900 superalloy is Ni-lOCo-8Cr-6Mo-6A1-4Ta-1Ti-O.1C-O.lZr-O.Ol5B weight percent.
3
to simulate heat transport in coated and uncoated tubes and rods during testing in the rocket engine. The first thermal model considered convective heat transfer over the entire outer surface of the tube from the stagnation point (O=Oo) to the exhaust side of the tube (8=180") and accounted for both radial and tangential conductive heat transfer within the tube wall (2-D model). The second thermal model simulated convective heat transfer at the stagnation point and accounted for conductive heat transfer in a radial direction only (I-D model). In both models, the appropriate heat transfer equations for conduction, convection and radiation were solved by the numerical computer program known as SINDA (Systems Improved Numerical Differencing Analyzer) (Ref. 5). The SINDA program requires, as a minimum, the thermal conductivity (K), the specific heat (Cp), and the density (p) for all materials transferring heat by conduction. The program also requires a grid to be defined for the geometry of interest. If desired, the SINDA program allows time and temperature-dependent thermophysical properties as well as time- dependent gas temperatures and heat transfer coefficients (hJ. The program also accounts for heat loss from the surface by radiation.
2-0 Model The maximum effect of the tangential heat flow was evaluated with the 2-D model by
simulating heat transfer to, and conduction around, an uncoated tube. This model consisted of 1 I O nodes and equidistant grid spacing, as shown schematically in Figure 2. Only half of the cylinder cross section was modelled due to the symmetry in gas flow around the upper and lower halves of the cylinder. Based on gas temperature measurements made around the tubes (Ref. 2), the higher gas temperature profile (9=Oo, Fig 1) was used for the surface nodes between 8=0" to 8=150" and the lower temperature profile (0=180", Fig 1) for the surface nodes between 8=150" to 0=180". Values for h, at the 10 surface nodes were taken from Fig 3a. The time dependence of h, was incorporated by multiplying the value for hamax) from Fig 3a with the time-dependent scaling factor, 4, from Fig 3b. Hence, each of the surface nodes have the value for ham, shown in Fig 3a between the time of 5.2 to 6.2 seconds, approximately 25% of that value during the H2 purge between 6.2 and 6.6 seconds, and approximately 5% of the maximum value during the N2 purge, thereafter. The temperature dependence of Cp and K for the DS Mar-M246+Hf substrates (Ref. 6) is shown in Figures 4a and b, respectively, and the density p (Ref. 6) is given in Table II.
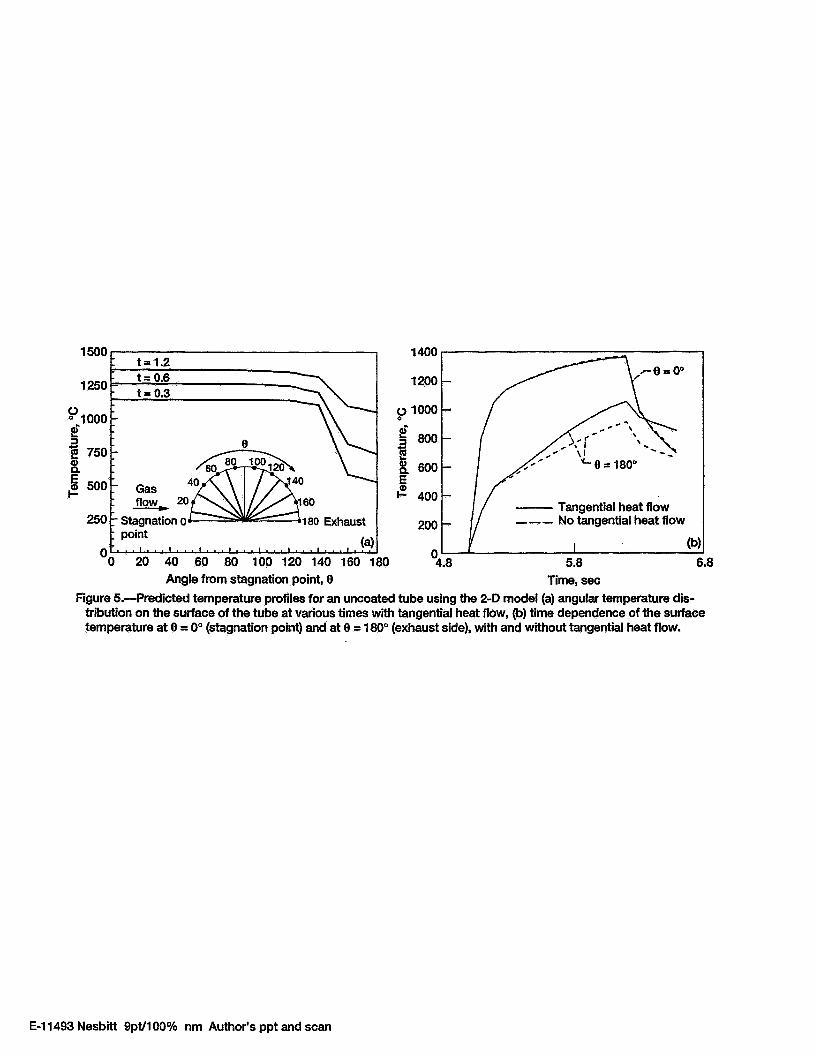
Surface temperatures around the tube predicted with the 2-0 thermal model affer 0.3, 0.6 and 1.2 seconds are shown in Figure 5a. As expected, the surface temperature at the stagnation point rises more rapidly than that on the exhaust side of the tube, rising to more than 80% of the maximum temperature after only 0.3 seconds. To quantitatively assess the effect of the tangential heat flow, the 2-D thermal model was also run with zero conductance between the nodes in the circumferential direction (i.e., radial heat flow only, no tangential flow). The time dependence of the predicted surface temperature at 8=0" and at 0=180", with and without tangential heat flow, is shown in Figure 5b. There is less than a 10°C reduction in the stagnation point temperature (9=Oo) when tangential heat transfer is taken into account. However, on the exhaust side of the tube (0=180"), heat flow around the tube to the exhaust side increases the temperature approximately 140°C. Hence, tangential heat flow does not significantly reduce the stagnation point temperature but does substantially increase the temperature on the exhaust side of the tube. Since all temperature measurements in the tubes were made at a location facing the injector (0=0, Fig I), the simpler, I-D thermal model was thereafter used to predict the stagnation point temperatures measured in the tubes.
1-D Model
4

Uncoated Tube: The l-D thermal model consisted of a 45" wedge that contained 61 nodes for the tube and 86 nodes for the rod. For the tube, the near-surface grid spacing was 12.5 pm (0.0005 in) and the spacing near the inner wall was 50 pm (0.002 in). The near-surface grid spacing for the rod was the same as that for the tube increasing to 125 pm (0.005 in) at the center of the rod. The l-D model is shown schematically in Figure 6. Thermophysical properties for the DS Mar-M246+Hf substrate (Cp, K and p) were used as with the 2-D model (Le., Figures 4a,b and Table 11). The gas temperature (Fig 1) and heat transfer coefficient (Fig 3a) appropriate for the stagnation point (9=Oo) were used to conduct heat to the surface node. The maximum value of the heat transfer coefficient (33 kW/m2K) was scaled with time according to the factor shown in Fig 3b. The convergence of the numerical solution (i.e., an adequate number of nodes) was verified by decreasing the number of nodes from 61 to 16. Temperature profiles through the wall of the tube differed by less than I "C when 30 nodes were used. However, when the number of nodes was reduced to 16, surface temperatures were up to 9" higher while inner wall temperatures were up to 41°C lower. Hence, the grid spacing resulting from using 30 or more nodes was sufficient to produce a convergent solution. Predicted and measured metal temperatures for the uncoated Mar-M246+Hf tube are shown in Fig 7. The agreement is good considering the uncertainties of the gas temperature measurements (Ref 2).
Coated Tube: Prior to predicting temperature profiles for the coated tubes tested in the rocket chamber, the 1-D model was used to examine various aspects associated with modelling the heat transfer to coated tubes. Since there is considerable variation in the reported values for the thermal conductivity of APS Zr02-Y203 ceramic coatings, the effect of this variation on predicted temperatures in the ceramic layer and the metal substrate was examined. In addition, the need to account for the presence of a metallic bond coat, and the need to account for radiation from the surface, were also investigated. Thermophysical properties for each of the coatings, whether metallic, cermet or ceramic, were assigned to the outer grids of the l-D model at a maximum grid spacing of 12.5 pm (0.0005 in). Coating designations, densities and reference sources for the various coatings are given in Table II.
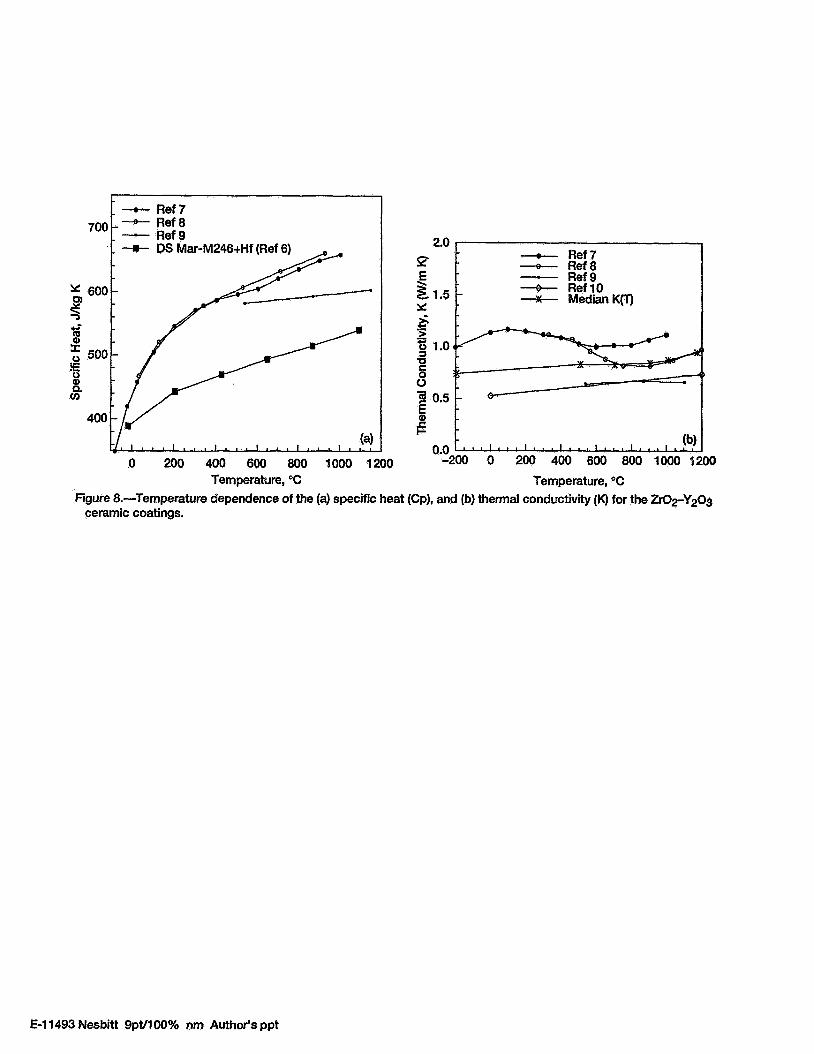
Several reported values of the temperature dependence of the specific heat (Cp) and the thermal conductivity (K) for APS ZrOz-Yz03 are shown in Figures 8a and 8b. The effect of the variation in the thermal conductivity values was examined by predicting temperature profiles for a 180 pm (0.007 in) thick ceramic layer on a Mar-M246+Hf tube. For the first case, (I), lower values for K were examined using the data from Ref I O (Figure 8b). For the second case (It), the higher values for K from Ref 7 were used (Figure 8b). The nearly identical data from Refs 7 and 8 were used for Cp (Figure 8a). All thermophysical data for the Mar-M246+Hf substrate was as described above for the uncoated tube. The predicted temperatures for the surface of the ceramic and at the ceramidmetal interface for these two cases are shown in Figure 9. The variation in the values of the thermal conductivity amounts to less than a 50°C difference in temperature at the ceramic surface but a 180°C difference at the ceramic/metal interface. Hence, the range in the reported values for K for APS Zr02-Y203 coatings result in significant temperature differences at the ceramic/metal interface but only moderate differences at the surface of the ceramic.
The TBC's modelled in this study contained a metallic bond coat beneath the cermet or ceramic layer. These bond coats were 25-75 pm (0.001-0.003 in) thick and were either plasma sprayed in air (APS) or at reduced oxygen pressures (LPPS). Values for Cp and K for APS and LPPS metallic coatings are shown in Figures 4a and b, respectively. Most of the Cp data are
5

closely grouped, however, the thermal conductivity of the APS coatings is generally much lower than that for the LPPS coatings. The lower values for the APS coating can generally be attributed to the amount and structure of the oxide present in these coatings. The maximum effect of a bond coat was evaluated by predicting substrate temperatures for a TBC with a 100 pm (0.004 in) APS bond coat below a 180 pm (0.007 in) ceramic top coat. Predictions were made with higher (Case I) and lower (Case II) thermal conductivity values for APS coatings. At the higher temperatures, the values for K differ by a factor of two (see data from Refs. 7 and 11 in Fig 4b). Similar values for Cp for the bond coat and identical values for K and Cp for the ceramic layer were used. Figure 10 shows the predicted temperature just below the bond coatlsubstrate interface for the two cases as well as the predicted temperature at the same location without a bond coat. For Case I with the higher conductivity bond coat, the temperature in the substrate was reduced by only 70°C while for Case I1 with the lower conductivity bond coat, the temperature in the substrate was reduced by approximately twice this amount. Temperatures increased in the ceramic layer, but by smaller amounts than the decreases in the substrate. Since the thermal conductivity for LPPS coatings is greater than that for the APS coatings and similar to, or greater, than that for the substrate (Figure 4b), an LPPS bond coat would be expected to have a negligible effect on the temperatures in the substrate or the ceramic coating. Hence, the bond coat produces only a small effect on the predicted temperatures in either the ceramic layer or the substrate. Consequently, bond coats were not included in the thermal model when predicting temperatures for the coated tubes tested in the rocket chamber.
Radiation from the ceramic coating reduces the temperature of the surface. Liebert (Ref. 13) has reported correlation equations for the emissivity for several thicknesses of APS Zr02-Y203 TBC's in the temperature range of 27°C to 2500°C. For a 180 pm (0.007 in) thick coating, the work by Liebert suggests a linearly decreasing value of the emissivity from 0.96 at 27°C to 0.46 at 1500°C. These emissivity values were used in the thermal model to evaluate the reduction in surface temperature due to radiative heat losses. Accounting for heat loss by radiation amounted to less than a 10°C decrease at the surface of the ceramic coating and an almost negligible decrease at the ceramic/metal interface. Hence, radiative heat losses from the ceramic coating were also ignored when predicting temperatures for the coated tubes tested in the rocket chamber.
Comparison of Measured and Predicted Metal Temoeratures in TBC-Coated Tubes. The 1-D tube model was used to predict temperatures in the traditional TBC's and the APS and LPPS cermet coatings. Based on the previous modelling results, a metallic bond coat and radiative heat losses were not included in the model. The gas temperature and heat transfer coefficient were as previously used for the l-D model. Thermophysical data for the DS Mar-M246+Hf substrate were also used as previously discussed. Median values for the thermal conductivity of the Zr02-Y203 coatings were defined and used (Figure 8b). Values for Cp from Reference 8 (Figure 8a) were taken as representative of the Zi02-Y203 coatings and a value of 4.8 gm/cm3 was taken as a typical density (Table 11). For the B-1900 substrate, values for Cp, K and the density of Mar- M246+Hf were used because of the similarity in values between the two Ni-base alloys (Ref. 14). The measured and predicted temperatures just below the ceramidmetal interface for the thick ceramic coatings (200 and 250 pm thickness) are shown in Figure 1 l a and for the thinner coatings (100 and 140 pm thickness) in Figure 1 I b. The measured and predicted inner wall temperatures for the thick ceramic coating (250 pm thickness) on the B-1900 substrate are shown in Figure 1 1 e. The decreasing temperatures associated with the H2 purge cooling period (6.2-6.5
6
seconds) is predicted somewhat sooner than actually observed. This difference in the onset of cooling may indicate the finite time required for the 0, valve to close and for the H, purge to actually begin. However, in considering the variation in the reported values for the thermal conductivity of the ceramic layer, the agreement between the measured and predicted temperatures is quite good.
The temperature dependence of Cp and K for the cermet coatings is given in Figures 4a and b. Average values for the coating thicknesses of 64 pm (0.0025 in) for the LPPS and 180 pm (0.007 in) for the APS cermet coatings (see Table I) were used. Measured and predicted inner wall temperatures for these two coatings are shown in Figure 12. Again, the agreement is quite reasonable considering the number of potential sources of uncertainty.
Predicted Metal Temperatures for Traditional TBC-Coated Tubes vs. Rods. The difference in the thermal response between a tube and rod was examined by predicting temperature profiles for both substrate geometries with 100 pm and 200 pm (0.004 and 0.008 in) thick ceramic coatings. The gas temperature and heat transfer coefficient were those discussed above for the 1-D model. Thermophysical properties and densities for the Mar-M246+Hf substrate and for the ceramic layer were as used in the proceeding section. The temperatures predicted on the surface of the ceramic layer and at the ceramidmetal interface for both the tube and rod geometry are shown in Figure 13a. There is only a small difference in the surface temperature of the ceramic between the tube and rod where, after 1.2 seconds, the rod was 34" and 16°C lower than the tube for the thinner and thicker coating, respectively. However, at the ceramidmetal interface, the temperature for the rod was 160°C and 145°C lower than the tube for the thinner and thicker coatings, respectively. These differences in temperature between the tube and rod reflect the greater thermal mass of the rod. Hence, for the given gas temperature profile, the metal surface temperature of the rod is approximately 150°C lower than that for the tube.
Figure 13a also highlights the importance of coating thickness on the substrate temperature. There is little temperature difference at the ceramic surface between the 100 and 200 pm coatings for either the tube or rod ( a maximum of 60°C after 0.3 sec). However, at the ceramidmetal interface, the temperature difference between the two coating thicknesses is 224°C &8OC depending on the tube or rod geometry). The predicted surface temperature of an uncoated tube after I .2 seconds, is approximately 1370°C (Fig 7). Hence, Figure 13 shows that the predicted benefit of a 100 pm (0.004 in) thick traditional TBC mating for the test conditions in this study is slightly under 300°C and the benefit of a 200 pm (0.008 in) thick traditional TBC is better than 500°C. As expected, the predicted temperature benefit is not directly proportional to the TBC thickness.
Radial temperature profiles through a 200 pm (0.008 in) thick traditional TBC coating and into a rod and tube substrate are shown in Figure 13b. Simply considering the area under the temperature profile for each substrate shows that the rod acts as a greater heat sink than the tube. It appears that the temperature across the ceramic coating decreases linearly. However, a close examination of the temperatures indicated a slight concave downward curvature consistent with a nearly-constant surface temperature (see Figure 13a) and a positive temperature dependence of the thermal conductivity for the ceramic (Figure 8b). As the surface temperature rises at short times (eo. 1 seconds), the temperatures in the ceramic layer did exhibit a slightly concave upward curvature, as expected during the early heat-up period.
7

DISCUSSION
Thermal modelling allowed investigation of various aspects associated with heat transfer to coated tubes and rods (e.g., tube vs. rod substrates, the effect of the presence of a bond coat and the effect of radiation). In addition, thermal modelling also allowed the effect of the variation in the reported values of the thermophysical properties (specifically the thermal conductivity) to be examined and quantified. For a I00 pm (0.004 in) APS metallic bond coat, where the reported values for K differ by more than a factor of two, it was shown that the substrate temperatures were reduced by only 10" to 20°C while temperatures in the ceramic increased even less. This limited effect of the bond coat is expected by realizing that the overall thermal resistance of the TBC consists of the sum of the thermal resistance for each layer (ceramic and bond coat). Since the thermal resistance is inversely proportional to the thermal conductivity, the thermal resistance of the ceramic far outweighs that for the bond coat for similar layer thicknesses. The relatively high thermal conductivity of the LPPS bond coats, which is similar to that of the Mar-M246+Hf substrate, results in very little thermal resistance and produces little effect on temperatures in the substrate.
The variation (approximately &50%) in the reported values for the thermal conductivity of the APS Zr02-Y203 ceramic layer has a significant effect on the predicted tube substrate temperatures, and to a lesser extent, the temperature in the ceramic layer itself. It is not known whether the differences in the values for K are solely due to variations in the ceramic material (e.g., extent of porosity and microcracking, etc.) or to differences in the measuring techniques. It is not likely that small differences in the composition of the APS Zr02-Y203 ceramic can account for these differences in K. However, the good agreement between the measured and predicted temperatures for the traditional Zr02-Y203 TBC's suggests that thermal modelling can be successfully performed using median values for K.
Modelling the thermal response of a coated tube and rod allowed the temperature difference due to the greater thermal mass of the rod to be quantified. In past durability testing of TBC's in the rocket engine (Ref. 1), coated rods were tested at gas temperatures estimated to be 150-200°C greater than that for the coated tubes. Even at this higher temperature, the coating lives on the rods were generally greater than those for the tubes. The results presented in Figure 13 show that for the same test conditions, the temperature at the ceramidmetal interface is 145- 160°C lower for the rod than for the tube. Temperature profiles in a coated rod were also predicted for higher gas temperatures. For a 100 pm (0.004 in) thick TBC, these predictions show that the gas temperature for the coated rod must be 250°C greater than that for the coated tube in order to produce similar metal surface temperatures for both substrate geometries. Likewise, for a 200 pm (0.008 in) thick coating, the gas temperature for the coated rod must be increased 310°C over that for the coated tube to produce similar metal surface temperatures.
Although lower substrate temperatures in the rod result in a higher thermal gradient in the ceramic layer (see inset in Fig 13b) and presumably a greater thermal gradient-induced stress within the ceramic, most TBC failures are attributed to thermally induced stresses produced by a mismatch in the thermal expansion coefficients (CTE) between the ceramic and the metallic bond coaffsubstrate. It is suggested in the following discussion that higher temperatures in the tubes eventually produce greater stresses across the ceramidmetal interface resulting in shorter TBC lives in the tubes. Generally, a "stress free" temperature is defined as the temperature of the
8

substrate during application of the ceramic layer. Cooling a coated component below this stress free temperature results in a compressive load on the ceramic and tensile load on the metallic bond coat. Testing at temperatures above the stress free temperature results in a tensile load on the ceramic layer while the bond coat, constrained by the ceramic layer, is compressively loaded. High temperatures at the ceramic/metal interface, which occur during testing, can allow the relatively soft metallic bond coat to plastically deform by thermally-activated processes to reduce the compressive stress. The consequence of this relaxation by the bond coat is that the stress free temperature increases. Higher bond coat temperatures allow the bond coat to deform more quickly and easily and result in a higher stress free temperature. Upon cooling, this increase in the stress free temperature causes a greater compressive stress on the ceramic layer, which can result in cracking and spalling of the layer. Hence, it is suggested that the shorter TBC lives on tubes in comparison to rods is directly related to the higher metal temperatures encountered by the tubes, given similar TBC thicknesses for the tube and rod. It should be noted that this argument assumes that compressive loading within the ceramic due to rapid heating is insufficient to cause ceramic spallation (i.e., spalling occurs only on cooldown and not on heatup), and also that sufficient time is spent above the stress free temperature to allow the thermally-activated processes to occur.
The good agreement between the predicted and measured temperatures for each of the various TBC's verifies the ability of the thermal model to simulate heat transfer to coated throat tubes during short thermal excursions. Good agreement was observed at locations near the ceramidmetal interface and at the inner wall of the tube. The slight time shift (0.1 to 0.2 seconds) between the measured and predicted maximum temperatures at the ceramidmetal interface (Figures I 1 a and b), likely reflects the finite time required for the oxygen valve to close and for the hot gas to be expelled from the combustion chamber. However, the good overall agreement between predicted and measured temperatures justifies the use of thermal models to predict heat transfer during short thermal excursions using median thermophysical property data for the various coatings.
SUMMARY AND CONCLUSIONS
A thermal model was used to successfully predict metal temperatures in coated and uncoated tubes tested in an H2/02 rocket engine. Traditional APS ZrO,-Y,O, TBC's, as well as APS and LPPS cermet coatings, were modelled. Good agreement was observed between predicted and measured temperatures in the metal near the tube surface for the uncoated tube and at the inner wall or near the coatinglmetal interface for the coated tubes.
The thermal model was also used to examine the effect of the variation in the reported values of the thermal conductivity of plasma sprayed Zr02-Y203 ceramic coatings, the effect of a 100 pm (0.004 in) thick metallic bond coat, the effect of tangential heat transfer around the tube, and the effect of radiation from the surface of the ceramic coating. It was shown that for the short duration rocket engine testing modelled in this study, radiation from the ceramic coating, tangential heat transfer within the tube wall, or the presence of a 100 pm (0.004 in) bond coat do not significantly affect the predicted metal temperatures. However, the difference in the reported values for the thermal conductivity of traditional APS Zr02-Y203 TBC's can amount to significantly different temperatures (>lOO"C) predicted in the tube. The thermal model was also used to compare the thermal response of a coated tube and rod. The results indicated substrate
9

temperatures approximately 150°C lower in the rod than in the tube. The increased life of coatings on rods over tubes tested in the rocket engine was directly attributed to this temperature difference.
10

REFERENCES
1. W.J. Brindley and J.A. Nesbitt, "Durability of Thermal Barrier Coatings in a High Heat Flux Environment", in Advanced Earth-To-Orbit Propulsion Technolonv 1988, May 10-12, 1988, Huntsville, Alabama.
2. J.A. Nesbitt and W.J. Brindley, "Heat Transfer to Throat Tubes in a Square-Chambered Rocket Engine at NASA LeRC", NASA TM 102336, October 1989.
3. J.A. Nesbitt, "Thermal Modelling of Various Thermal Barrier Coatings in a High Heat Flux Rocket Engine 'I , NASA TM 102418, December 1989.
4. J.A. Nesbitt, "Thermal Response of Various Thermal Barrier Coatings in a High Heat Flux Rocket Engine", Surf. Coat. Technol., 43144,458, 1990.
5. SlNDA - Systems Improved Numerical Differencing Analyzer, Available through Computer Software Management and Information Center (COSMIC), The University of Georgia, Athens, Georgia, 30602, Program MSC 18597.
6. W.T. Chandler, "Materials for Advanced Rocket Engine Turbopump Blades", NASA CR- t74729, November, 1983.
7. R.R. Holmes and T. N. McKechnie, Vacuum Application of Thermal Barrier Plasma Coatings", in Advanced Earth-to-Orbit ProDulsion Technolow 1988, NASA CP 3012, ed. R.J. Richmond and S.T. Wu, 1988.
8. R. Brandt, L. Pawlowski, G. Neuer and P. Fauchais, "Specific Heat and Thermal conductivity of Plasma Sprayed Yttria-Stabilized Zirconia and NiAI, NiCr, NiCrAl, NiCrAIY, NiCoCrAlY Coatings," High Temperatures-High Pressures, 18, 65-77, 1986.
9. R.A. Miller, "Current Status of Thermal Barrier Coatings - An Overview," Surf. Coat. Technol., - 30, 1 , 1987.
I O . T.E. Strangman, J. Neumann and A. Liu, "Thermal Barrier Coating Life-Prediction Model Development", Final Report, NASA CR-179648, Oct. 1987.
1 I. K.E. Wilkes and J.F. Lagedrost, "Thermophysical Properties of Plasma Sprayed Coatings," NASA CR-121144, March 1973.
12. J.T. DeMasi, "Thermal Barrier Coating Life Prediction Model Development", Second Annual Report, NASA CR-179508, April 1986.
13. C.H. Liebert, Emittance and Absorptance of the National Aeronautics and Space Administration Ceramic Thermal Barrier Coating, Thin Solid Films, 53, 235-240, 1978.
14. Aerospace Structural Metals Handbook, Metals and Ceramics Information Center, Battelle Labs, Columbus, OH, 1988.
11
FIGURE CAPTIONS
Figure 1. Representative gas temperature profiles at the stagnation point (O=Oo) and at the exhaust side (0=180") of the test position (Ref. 2).
Figure 2. Schematic view of the 2-0 thermal model of a tube incorporating radial and tangential heat transfer. Arrows indicate points of convective heat transfer.
Figure 3. (a) Angular dependence of the maximum heat transfer coefficient around the tube, and (b) time dependence of the scaling factor used to scale the heat transfer coefficient (hc) to account for changes in pressure and purge gasses (Ref. 2). Gas temperature profile is also shown for comparison.
Figure 4. Temperature dependence of the (a) specific heat (Cp) and (b) thermal conductivity (K) for the APS and LPPS metallic coatings, the cermet coatings, and the DS Mar-M246+Hf substrate.
Figure 5. Predicted temperature profiles for an uncoated tube using the 2-0 model (a) angular temperature distribution on the surface of the tube at various times with tangential heat flow, (b) time dependence of the surface temperature at 9=0 (stagnation point) and at 8=180" (exhaust side), with and without tangential heat flow.
Figure 6. Schematic view of the 1 -D thermal model of the rod and tube for heat transfer to the stagnation point and radial heat transfer. Arrow indicates the point of convective heat transfer.
Figure 7. Measured and predicted metal temperatures for an uncoated tube at a location just below the outer tube surface (0=0).
Figure 8. Temperature dependence of the (a) specific heat (Cp), and (b) thermal conductivity (K) for the ZIQ-Y~O~ ceramic coatings. Specific heat for DS Mar-M246+Hf shown for comparison in (a).
Figure 9. Predicted temperature profiles showing the effect of the variation in the values of the thermal conductivity for the ZQ-Y2O3 ceramic coatings. Case I used the lower values for K (Ref. I O ) and Case II used the higher values for K (Ref 7) shown in Figure 8b.
Figure 10. Predicted temperature profiles showing the effect of a 100 pm (0.004 in) APS metallic bond coat below a Zr02-Y203 ceramic top coat. Predicted temperatures are for a location just below the bond coatkubstrate interface. Case I used the higher K values (Ref. 1 I) and Case Il used the lower K values (Ref 7) shown in Figure 4b.
Figure 11. Measured and predicted temperatures for the traditional Zr02-Y203 TBC's (a) near- surface temperatures for TKI and TK2 with the thick ceramic coatings, (b) near-surface temperatures for TNI and TN2 with the thin ceramic coatings, and (c) inner wall temperatures for TK3, also with the thick ceramic coating.
12

Figure 12. Measured and predicted inner wall temperatures for the (a) LPPS and (b) APS cermet coated tubes.
Figure 13. Predicted temperature profiles for a 100 and 200 pm (0.004 and 0.008 in) traditional Zr02-Y20, TBC on a tube and rod substrate. (a) Time dependence of the temperature at the ceramic surface and at the ceramidmetal interface, and (b) radial temperature profiles in the ceramic and metallic substrate for the 200 pm (0.008 in) thick TBC's.
13

TABLE I Coating Designations, Thickness and Oxide in Top Coat
~~ ~~ ~~~ ~ ~~ ~ ~~
After sanding TN2 25-75 ( I -3) TK2 25-50 (1 -2)
Cermet Coatingc LPPS 50 (2) APS 40-60 (1.6-2.4)
I 1
~
100-140 (4-5.5) 100 200-250 (7.9-9.8) 100
50-75 (2-3) 47* 12 150-200 (6-8) 33k 10
I Bond Coat Top Coat Percent Oxide 1 Coating Designation
a APS NiCrAlY bond coat below APS Zr0,-7Y203 ceramic top coat. TN refers to thinner ceramic top coat, TK refers to thicker ceramic top coat.
Measured from cross sections after testing NiCrAlY bond coat below Zr02-8Y20, top coat 8-1900 superalloy substrate
1

TABLE II Designation and Density of Coatings and Substrate
a Representative values for several reported APS Zr0,-(7-8)Y20, coatings Based on reported 20% porosity Average for three different LPPS NiCrAl based metallic coatings
2

1200
;loo0 3 E 800
5 600 8 I- Tube cross section
400
200
0 5.0 5.5 6.0 6.5
Time, sec Figure 1 .-Representative gas temperature profiles at
the stagnation point (0 = 0") and at the exhaust side (0 = 180') of the test postion (Ref. 2).
E-1 1493 Nesbitt 9pt/lOO% nm Author's ppt

80" 100"
Figure 2,Cchematic view of the 2-D thermal model of a tube incorporating radial and tangential heat transfer. Arrows indicate points of convective heat transfer.
E-1 1493 Nesbitt 9pt/lOO% nm Author's ppt

00.0 ‘ I I I 1 0 45 90 135 1 80
Angle from stagnation point, 9
- 1600
- 1400
- 1200 9
-1000 e;
E 1 8 0 o g
0 - 600
iime, sec Figure 3.-(a) Angular dependence of the maximum heat transfer coefficient around the tube, and (b) time depend-
ence of the scaling factor @ used to scale the heat transfer coefficient (hc) to account for changes in pressure and purge gasses (Ref. 2)- Gas temperature profile is also shown for comparison.
E-1 1493 Nesbitt 9pt/lOO% nm Author‘s ppt

0 200 400 600 800 1000 Temperature, "C
-200 0 200 400 600 800 1000 Temperature, "C
Fgure 4.-Temperature dependence of the (a) specific heat (Cp) and (b) thermai conductivity (K) for the APS and LPPS metallic coatings, the cermet coatings, and the DS Mar-M246+Hf substrate.
I
E-1 1493 Nesbitt 9pt/lOO% nm Author's ppt
1500t tr1.2 I
(a) I 0 point
1250 I I -
- t = 0.6 -
I / , I- flow, 20
180 ~ Exhaust
9 1000
f 800
600 E
!- 400 ::I 200
4-
f - Tangential heat flow --- No tangential heat flow
E-1 1493 Nesbitt 9pt/lOO% nm Author's ppt and scan

__I)
Gas flow from injector
86 Nodes for rod 61 Nodes for tube
Cross section of rod or tube
Figure 6.4chematic view of the 1 -D thermal model of the rod and tube for heat transfer to the stagnation point and radial heat transfer. Arrow indicates the point of convective heat transfer.
E-1 1493 Nesbitt 9pt/lOO% nm Author's ppt

1400 I
1 - - 200 I
I - Measured
2oo ~, , ,I , , , , , , - ;;i;;d,, , ~ , , , , , , I 0 4.5 5.0 5.5 6.0 6.5 7.0 7.5 8.0
Time, sec Figure 7.-Measured and predicted metal tempera-
tures for an uncoated tube at a location just below the outer tube surface (9 E 0').
E-1 1493 Nesbitt 9pt/lOO% nm Author's ppt
700 2.0 - Ref7 P -8- Ref8
- - Ref7 - -8- Ref 8
Ref 9 _c
- - Ref9 + Ref10 Y ---xC- MedianKO
0 200 400 600 800 1000 1200 Temperature, "C Temperature, "C
Figure 8.-Temperature dependence of the (a) specific heat (Cp), and (b) thermal conductivity (K) for the ZrOry203 ceramic coatings.
E-1 1493 Nesbiit 9pVlOO% nm Author's ppt

Ceramidmetal
Time, sec Figure 9.-Predicted temperature profiles showing the
effect of the variation in the values of the thermal conductivity for the ZrO2-Y2O3 ceramic coatings. Case I used the lower values for K (Ref. 10) and Case II used the higher values for K ( Ref. 7') shown in Figure 8b.
E-1 1493 Nesbitt 9pt/lOO% nm scan

1000 r I
800
- Nobondcoat
Time, sec Figure 1 0.-Predicted temperature profiles showing
the effect of a 100 Nm (0.004 in) APS metallic bond coat below a ZrOrY2O3 ceramic top coat. Predict- ed temperatures are for a location just below the bond coat/substrate interface. Case I used the high- er K values (Ref. 11) and Case II used the lower K values [Ref. 7') shown in Figure 4b.
E-1 1493 Nesbitt 9pVlOO% nm scan

1200 9 1
10oot
- Predicted 200
0 5.0 5.5 6.0 6.5 7.0 7.5 8.0
Time, sec
v 800 c $ 600 0) E $! 400 - Measured - Predicted
200
0 5.0 5.5 6.0 6.5 7.0 7.5 E
Time, sec 3
I I
1000 1
2
Y
5.0 5.5 6.0 6.5 7.0 7.5 8.0 Time, sec
Figure 11 .-Measured and predicted temperatures for the traditional ZrOrY2O3 TBC's (a) near-surface temperatures for TKl and TK2 with the thick ceramic coatings, (b) near-surface temperatures for TN1 and TN2 with the thin ceramic coatings, and (c) inner wall temperatures for TK3, also with the thick ceramic coating.
E-1 1493 Nesbitt 9ptflOO% nm Author's ppt

1400
1200
1000
$ 800
Q 600
v
f 8 c
- Measured - Predicted
400
200
0 5.0 5.5 6.0 6.5 7.0 7.5 a
Time, sec
Figure 12.-Measured and predicted inner wall temper- atures for the LPPS and APS cermet coated tubes.
E-1 1493 Nesbitt 9pVlOOYo nm Author's ppt

(b) I I I I ob 0.1 0.2 0.3 0.4 0.5
Time, sec Distance, cm Figure 13.-Predicted temperature profiles for a 100 and 200 pm (0.004 and 0.008 in.) traditional ZrOrY2O3 TBC on
a tube and rod substrate. (a) Time dependence of the temperature at the ceramic surface and at the ceramic/metal interface. (b) Radial temperature profiles in the ceramic and metallic substrate for the 200 pm (0.008 in.) thick TBC's.
E-1 1 493 Nesbitt 9pt/lOO% nm scan