Embed Size (px)
Citation preview

Two-Dimensional Nanocrystals Produced by
Exfoliation of Ti(3)AlC(2)
Michael Naguib, Murat Kurtoglu, Volker Presser, Jun Lu, Junjie Niu,
Min Heon, Lars Hultman, Yury Gogotsi and Michel W Barsoum
Linköping University Post Print
N.B.: When citing this work, cite the original article.
This is the authors’ version of the article which is published in final form at:
Michael Naguib, Murat Kurtoglu, Volker Presser, Jun Lu, Junjie Niu, Min Heon, Lars
Hultman, Yury Gogotsi and Michel W Barsoum, Two-Dimensional Nanocrystals Produced
by Exfoliation of Ti(3)AlC(2), 2011, Advanced Materials, (23), 37, 4248-4253.
http://dx.doi.org/10.1002/adma.201102306
Copyright: Wiley-VCH Verlag Berlin
http://www.wiley-vch.de/publish/en/
Postprint available at: Linköping University Electronic Press
http://urn.kb.se/resolve?urn=urn:nbn:se:liu:diva-72027

Submitted to
1
DOI: 10.1002/adma.((please add manuscript number))
Two-Dimensional Nanocrystals Produced by Exfoliation of Ti3AlC2
By Michael Naguib, Murat Kurtoglu, Volker Presser, Jun Lu, Junjie Niu, Min Heon, Lars
Hultman, Yury Gogotsi* and Michel W. Barsoum*
[*] Prof. Michel Barsoum and Prof. Yury Gogotsi Corresponding-Authors
Department of Materials Science and Engineering, Y.G. is also a Trustee Chair Director of A.J.
Drexel Nanotechnology Institute. Drexel University, Philadelphia, PA 19104 (USA)
E-mail: ([email protected] and [email protected])
Michael Naguib Author-One, Murat Kurtoglu Author-Two, Dr. Volker Presser Author-
Three, Dr. Junjie Niu Author-Five, Min Heon Author-Six.
Department of Materials Science and Engineering, and A.J. Drexel Nanotechnology Institute.
Drexel University, Philadelphia, PA 19104 (USA)
Jun Lu Author-Four, Prof. Lars Hultman Author-Seven
Department of Physics, IFM
Linkoping University, Linkoping 58183 (Sweden)
Keywords: Nanosheets, MAX phase, Exfoliation, Carbide, Two-dimensional material
Typically two-dimensional 2-D free-standing crystals exhibit properties that differ from those of
their three-dimensional, 3-D counterparts.[1]
Currently, however, there are relatively few such
atomically layered solids.[2, 3, 4, 5]
Herein we report on 2-D nanosheets, comprised of a few Ti3C2
layers and conical scrolls produced by the room temperature exfoliation of Ti3AlC2 in
hydrofluoric acid. The large elastic moduli predicted by ab initio simulation, and the possibility
of varying their surface chemistries (herein they are terminated by hydroxyl and/or fluorine
groups) render these nanosheets attractive as polymer composite fillers. Theory also predicts that
their band gap can be tuned by varying the surface terminations. The good conductivity and
ductility of the treated powders suggest uses in Li-ion batteries, pseudocapacitors and other
electronic applications. Since Ti3AlC2 is a member of a 60+ group of layered ternary carbides and
nitrides known as the MAX phases, this discovery opens a door to the synthesis of a large
number of other 2-D crystals.

Submitted to
2
Arguably the most studied freestanding 2-D material is graphene, which was produced by
mechanical exfoliation, into single-layers in 2004[1]
. Some other layered materials, such as
hexagonal BN,[2]
transition metal oxides and hydroxides,[4]
including clays,[3]
have also been ex-
foliated into 2-D sheets. Interestingly, exfoliated MoS2 single layers were reported as early as in
1986.[5]
Graphene is finding its way to applications ranging from supercapacitor electrodes[6]
to
reinforcement in composites.[7]
Although graphene has attracted more attention than all other 2-D
materials together, its simple chemistry and the weak van der Waals bonding between layers in
multi-layer structures limit its use. Complex layered structures that contain more than one
element may offer new properties because they provide a larger number of compositional
variables that can be tuned for achieving specific properties. Currently, the number of non-oxide
materials that have been exfoliated is limited to two fairly small groups, viz. hexagonal, van der
Waals bonded structures (e.g. graphene and BN) and layered metal chalcogenides (e.g. MoS2,
WS2, etc.).[8]
It is well established that the ternary carbides and nitrides with a Mn+1AXn chemistry - where n =
1, 2, or 3, M is an early transition metal, A is an A-group (mostly groups 13 and 14) element, and
X is C and/or N – form laminated structures with anisotropic properties.[9][10]
These, so called
MAX, phases are layered hexagonal (space group P63/mmc), with two formula units per unit cell
(Figure 1a). Near close-packed M-layers are interleaved with pure A-group element layers, with
the X-atoms filling the octahedral sites between the former. One of the most widely studied and
promising members of this family is Ti3AlC2.[11, 12]
(Fig. 1a). Over 60 MAX phases are currently
known to exist.[9]
The Mn+1Xn layers are chemically quite stable. By comparison, because the A-group atoms are
relatively weakly bound, they are the most reactive species. For example, heating Ti3SiC2 in a C-
rich atmosphere results in the loss of Si and the formation of TiCx.[13]
When the same compound

Submitted to
3
is placed in molten cryolite,[14]
or molten Al,[15]
essentially the same reaction occurs: the Si
escapes and a TiCx forms. In the case of cryolite, the vacancies that form lead to the formation of
a partially ordered cubic TiC0.67. In both cases, the high temperatures led to a structural
transformation from a hexagonal to a cubic lattice and a partial loss of layering. In some cases,
such as Ti2InC, simply heating in vacuum at ≈ 800 °C, results in loss of the A-group element and
TiCx formation.[16]
Removing of both the M and A elements from MAX structure by high
temperature chlorination results in a porous carbon known as carbide derived carbon with useful
and unique properties.[17, 18]
Mechanical deformation of the MAX phases – which is mediated by basal dislocations and is
quite anisotropic - can lead to partial delamination and formation of lamellas with thicknesses
that range from tens to hundreds of nanometers.[19]
However, none of MAX phases has ever been
exfoliated into a few nanometer thick, crystalline layers reminiscent of graphene. Furthermore, as
far as we are aware, there are no reports on the selective room, or even moderate, temperature
liquid or gas phase extraction - of the A-group layers from the MAX phases and/or their
exfoliation. Herein we report the extraction of the Al from Ti3AlC2, and formation of a new of 2-
D material (Figs. 1b and c) that we propose to call “MXene” to emphasize its graphene-like
morphology.
Based on the results presented below it is reasonable to conclude that the following simplified
reactions occur when Ti3AlC2 is immersed in HF:
Ti3AlC2 + 3HF = AlF3 + 3/2 H2 + Ti3C2 (1)
Ti3C2 + 2H2O = Ti3C2(OH)2 + H2 (2)
Ti3C2 + 2HF = Ti3C2F2 + H2 (3)
Reaction (1) is essential and is followed by reaction (2) and/or (3). In the remainder of this paper
we present evidence for the aforementioned reactions and that they result in the exfoliation of 2-
Submitted to
4
D Ti3C2 layers, with OH and/or F surface groups (Figs. 1b and c). Reactions (2) and (3) are
simplified in that they assume the terminations are OH or F, respectively, when in fact they most
probably are a combination of both.
XRD spectra of the initial Ti2AlC-TiC mixture after heating to 1350°C for 2 h resulted in
peaks that corresponded mainly to Ti3AlC2 (bottom curve in Fig. 2a). When the Ti3AlC2 powders
were placed into the HF solution, bubbles, presumed to be H2, were observed suggesting a
chemical reaction. Ultrasonication of the reaction products in methanol for 300 s resulted in
significant weakening of the peaks and the appearance of an amorphous broad band around 24°
(top spectrum in Fig. 2a). In other words, exfoliation leads to a loss of diffraction signal in the
out-of-plane direction, and the non-planar shape of the nanosheets results in broadening of peaks
corresponding to in-plane diffraction. When the same powders were cold pressed at 1 GPa, into
free-standing, 300 µm thick and 25 mm diameter discs (Fig. 2e), their XRD showed that most of
the non-basal plane peaks of Ti3AlC2 - most notably the most intense peak at ≈ 39° - disappear
(middle curve in Fig. 2a). On the other hand, the (00l) peaks, such as the (002), (004) and (0010),
broadened, lost intensity, and shifted to lower angles compared to their location before treatment.
Using the Scherrer formula[20]
the average particle dimension in the [000l] direction after
treatment is estimated to be 11±3nm, which corresponds to roughly ten Ti3C2(OH)2 layers. To
identify the peaks we simulated XRD patterns of hydroxylated, viz. Ti3C2(OH)2, (red curve in
center of Fig. 2a) and fluorinated, Ti3C2F2, structures (gold curve in center of Fig. 2a). Clearly,
both were in good agreement with the XRD patterns of the pressed sample (purple curve in Fig.
2a), the agreement was better with the former. The disappearance of the most intense diffraction
peak of Ti3AlC2 at 39° and the good agreement between the simulated XRD spectra for
Ti3C2(OH)2 and the experimental results provides strong evidence of the formation of the latter.
The presence of OH groups after treatment was confirmed by FTIR.

Submitted to
5
Further DFT geometry optimization of the hydroxylated (Fig. 3f) and fluorinated structure
resulted in 5% and 16% expansion of the original Ti3AlC2 lattice, respectively, as observed. If Al
were simply removed, and not replaced by functional groups, the DFT optimization caused the
structure to contract by 19 %, which is not observed. The increase of the c-lattice parameters
upon reaction (Fig. 2a) is thus strong evidence for the validity of reactions 2, 3.
Raman spectra of Ti3AlC2, before and after HF treatment, are shown in Fig. 2b. Peaks II,
III, and IV vanished after treatment, while peaks VI and VII, merged, broadened and downshifted.
Such downshifting has been observed in Raman spectra of very thin layers of inorganic layered
compounds.21
The line broadening, and the spectral shifts in the Raman spectra are consistent
with exfoliation and are in agreement with the broadened XRD profiles. In analogy with
Ti3SiC2,[22]
peaks I to III in Fig. 2b can be assigned to Al-Ti vibrations, while peaks V and VI
involve only Ti-C vibrations. The fact that only the latter two exist after etching confirms both
the mode assignments, but more importantly the loss of Al from the structure. Note that peaks V
and VI are combined, broadened and downshifted.
The Ti 2p XPS spectra, before and after treatment, are shown in Fig. 2c. The C 1s and Ti 2p
peaks before treatment match previous work on Ti3AlC2.[23]
The presence of Ti-C and Ti-O bonds
was evident from both spectra, indicating the formation of Ti3C2(OH)2 after treatment. The Al
and F peaks (not shown) were also observed and their concentrations were calculated to be
around 3 at.% and 12 at.%, respectively. Aluminum fluoride (AlF3) – a reaction product, see
below - can probably account for most of the F signal seen in the spectra. The O 1s main signal
(not shown at ~530.3 cm-1
) suggest the presence of OH group.[24]
A SEM image of a ≈ 1500 µm3 Ti3AlC2 particle (Fig. 2d) shows how the basal planes fan
out and spread apart as a result of the HF treatment. EDAX of the particles showed them to be
comprised of Ti, C, O and F, with little, or no, Al. This implies that the Al layers were replaced

Submitted to
6
by oxygen (i.e. OH) and/or F. Note that the exfoliated particles maintained the pseudo-ductility of
Ti3AlC2 and could be easily CP into freestanding disks (Fig. 2e). This property can prove crucial
in some potential applications, such as anodes for Li-ion batteries.
TEM analysis of exfoliated sheets (Fig. 3a,b) shows them to be quite thin and transparent
to electrons since the carbon grid is clearly seen below them. This fact strongly suggests a very
thin foil, especially considering the high atomic number of Ti. The corresponding selected area
diffraction, SAD (inset in Fig. 3b) shows the hexagonal symmetry of the basal planes. EDAX of
the same flake showed the presence of Ti, C, O, and F. Figures 3c,d show cross-sections of
exfoliated single- and double-layer MXene sheets. Figures 3e,f show high-resolution TEM
micrographs and a simulated structure of two adjacent OH-terminated Ti3C2 sheets, respectively.
The experimentally observed interplanar distances and angles are found to be in good agreement
with the calculated structure. Figures 4a,b show stacked multilayer MXene sheets. The exfoliated
layers can apparently also be rolled into conical shapes (Fig. 4d); some are bent to radii of < 20
nm (Fig. 4e). Note that if Al atoms had been replaced by C atoms, the concomitant formation of
strong Ti-C bonds - as when, for example, Ti3SiC2 reacts with cryolite at 900 °C- [14]
exfoliation
would not have been possible. It follows that the reaction must have resulted in a solid in which
the Ti-Al bonds are replaced by much weaker hydrogen or van der Waals bonds. This comment
notwithstanding, the EDAX results consistently show the presence of F in the reaction products
implying that, as noted above, the terminations are most likely a mixture of F and OH. The
presence of up to 12 at.% F has also been confirmed using XPS. In the latter case, however, some
of it could originate from AlF3 residue in the sample.
Lastly, it is instructive to point out the similarities between MXene and graphene such as,
i) the exfoliation of 2-D Ti3C2 layers (Figs. 4a and b) into multilayer sheets that resemble
exfoliated graphite,[25]
ii) the formation of scrolls (Figs. 4d and e). Also, as cross-sectional TEM

Submitted to
7
(Fig. 4e) shows, some nanosheets were bent to radii < 20 nm without fracture, which is evidence
for strong and flexible Ti3C2 layers. Similar scrolls were produced by sonication of grapheme.[26,
27] We assume that the sonication used for exfoliation caused some nanosheets to roll into scrolls,
as schematically shown in Fig. 4f.
Multilayer structures may be used, for example, as hosts for Li storage. DFT calculations
at 0 K and in Li-rich environments show that the formation of Ti3C2Li2 as a result of the
intercalation of Li into the space vacated by the Al atoms (Fig. 4c) assuming reaction
Ti3C2 + 2Li = Ti3C2Li2 (4)
has an enthalpy change of 0.28 eV. One possible reason for the positive value maybe the fact that
Li has an atomic radius of 145 pm, whereas that of Al is 125 pm. The structure shown in Fig. 4c
would provide a capacity of 320 mAhg-1
, which is comparable to the 372 mAhg-1
of graphite for
(LiC6).
The elastic modulus of a single, exfoliated Ti3C2(OH)2 layer, along the basal plane, is
calculated to be around 300 GPa, which is within the typical range of transition metal carbides
and significantly higher than most oxides and clays.[3]
And while the 302 GPa value is lower than
that of graphene,[7]
the existence of surface functional groups for the treated powders, should
ensure better bonding to and better dispersion in polymer matrices if these exfoliated layers are to
be used as reinforcements in polymer composites. It is also fair to assume the bending rigidity of
the Ti3C2 layers to be significantly higher than graphene. It is important to note here that the
Ti3C2 sheets were much more stable than graphene sheets under the 200 kV electron beam in the
TEM.
DFT calculations also predict that the electronic properties of the exfoliated layers are a
function of surface termination (Fig. 3g). The calculated band structure of a single Ti3C2 layer
resembles a typical semi-metal with a finite density of states at the Fermi level. Indeed, the

Submitted to
8
resistivity of the thin disk shown in Fig. 2e is estimated to about an order of magnitude higher
than the same disc made with unreacted Ti2AlC powders, which translates to a resistivity of ≈
0.03 µΩm. This low resistivity should prove beneficial in applications such as Li-ion batteries
(Fig. 4c) or pseudo-capacitor electrodes, replacing layered transition metal oxides,[28]
which show
useful red-ox properties and Li-intercalation,[29]
but have low electrical conductivities. When
terminated with OH and F groups, the band structure has a semiconducting character with a clear
separation between valence and conduction bands by 0.05 eV and 0.1 eV, respectively (Fig. 3g).
Thus, it is reasonable to assume that it would be possible to tune the electronic structure of
exfoliated MAX layers by varying the functional groups. This behavior may be useful in certain
electronic applications, such as transistors, where the use of graphene[30]
and MoS2[31]
has been
successfully demonstrated.
In conclusion, the treatment of Ti3AlC2 powders for 2 h in HF results in the formation
exfoliated 2-D Ti3C2 layers. The exposed Ti surfaces appear to be terminated by OH and/or F.
The implications, and importance, of this work go far beyond the results shown herein. As noted
above, there are over 60 currently known MAX phases and thus this work, in principle, opens the
door for formation of a large number of 2-D Mn+1Xn structures, including the carbides and
nitrides of Ti, V, Cr, Nb, Ta, Hf and Zr. The latter could include 2-D structures of combination of
M-atoms, (e.g. (Ti0.5Zr0.5InC)[32]
and/or different combination of C and N (e.g. Ti2AlC0.5N0.5),[33]
if the selective chemical etching is extended to other MAX phases. We currently have solid
results for the exfoliation of Ta4AlC3 into Ta4C3 flakes.
Experimental Section
Powder of Ti3AlC2 was prepared by ball-milling Ti2AlC ( > 92 wt.% 3-ONE-2, Voorhees,
NJ) and TiC (99% Johnson Matthey Electronic, NY) powders in a 1:1 molar ratio for 24 h using
zirconia balls. The mixture was heated to 1350°C for 2 h under argon, Ar. The resulting loosely

Submitted to
9
held compact was crushed in a mortar and pestle. Roughly 10 g of powders are then immersed in
≈ 100 ml of a 50 % concentrated hydrofluoric acid, HF, (Fisher Scientific, Fair Lawn, NJ)
solution at room temperature for 2 h. The resulting suspension was then washed several times
using deionised water and centrifuged to separate the powders. In some cases, to align the flakes
and produce free-standing discs, the treated powders were cold pressed at a load corresponding to
a stress of 1 GPa in a steel die.
X-ray diffraction (XRD) patterns were obtained with a powder diffractometer (Siemens
D500, Germany) using Cu Kα radiation, and a step scan of 0.02° and 1 s per step. Si powder was
added to some samples as an internal standard. A scanning electron microscope, (SEM, Zeiss
Supra 50VP, Germany) was used to obtain high magnification images of the treated powders.
Transmission electron microscopes, TEMs, (JEOL JEM-2100F and JEM 2100, Japan; FEI,
Tecnai G2 TF20UT FEG, Netherlands) operating at 200 kV were used to characterize the
exfoliated powders. Chemical analysis in the TEM was carried out using an ultra-thin window X-
ray energy dispersive spectrometer, EDAX (EDAX, Mahwah, NJ). The TEM samples were
prepared by deposition of the flakes - from an isopropanol suspension - on a lacey-200 mesh
carbon coated copper grid. Raman spectroscopy of the cold pressed samples was carried out on a
microspectrometer (inVia, Renishaw plc, Gloucestershire, UK) using an Ar ion laser (514.5 nm)
and a grating with 1800 lines/mm. This corresponds to a spectral resolution of 1.9 cm-1
and a spot
size of 0.7 µm in the focal plane. X-ray photoelectron spectroscopy, XPS, (PHI 5000, ULVAC-
PHI, Inc., Japan) was used to analyze the surfaces of samples before and after exfoliation.
Theoretical calculations were performed by density functional theory (DFT) using the
plane-wave pseudo-potential approach, with ultrasoft pseudopotentials and Perdew Burke
Ernzerhof (PBE) exchange - Wu-Cohen (WC) correlation functional, as implemented in the
CASTEP code in Material Studio software (Version 4.5). A 8x8x1 Monkhorst-Pack grid and

Submitted to
10
planewave basis set cutoff of 500 eV were used for the calculations. Exfoliation was modeled by
first removing Al atoms from the Ti3AlC2 lattice. Exposed Ti atoms located on the bottom and
top of the remaining Ti3C2 layers were saturated by OH (Fig. 1b) or F groups followed by full
geometry optimization until all components of the residual forces became less than 0.01 eV/Å.
Equilibrium structures for exfoliated layers were determined by separating single Ti3C2 layers by
a 1.2 nm thick vacuum space in a periodic supercell followed by the aforementioned full
geometry optimization. Band structures of the optimized materials were calculated using a k
point separation of 0.015Å-1
. The elastic properties of the 2-D structures were calculated by
subjecting the optimized structure to various strains and calculating the resulting second
derivatives of the energy density.
Acknowledgments:
This work was supported by the Assistant Secretary for Energy Efficiency and Renewable
Energy, Office of Vehicle Technologies of the U.S. Department of Energy under Contract No.
DE-AC02-05CH11231, Subcontract 6951370 under the Batteries for Advanced Transportation
Technologies (BATT) Program. M. K. was supported by Gurallar Co., Turkey. V.P. was
supported by Alexander von Humboldt Foundation. The authors are thankful to Dr. V. Mochalin
for help with FTIR analysis. L. H. acknowledges support from the Swedish Foundation for
Strategic Research, the Knut and Alice Wallenberg Foundation, a Swedish Government Strategic
Grant and an European Research Council Advanced Grant.

Submitted to
11
References
[1] K. S. Novoselov, A. K. Geim, S. V. Morozov, D. Jiang, Y. Zhang, S. V. Dubonos, I. V.
Grigorieva, A. A. Firsov, Science 2004, 306, 666.
[2] D. acil , J. C. Meyer, C. . irit, A. ettl, Applied hysics Letters 008, 9 , 13310 .
[3] P. H. Nadeau, Applied Clay Science 1987, 2, 83.
[4] R. Ma, T. Sasaki, Advanced Materials 2010, 22, 5082.
[5] P. Joensen, R. F. Frindt, S. R. Morrison, Materials Research Bulletin 1986, 21, 457.
[6] M. D. Stoller, S. Park, Y. Zhu, J. An, R. S. Ruoff, Nano Letters 2008, 8, 3498.
[7] S. Stankovich, D. A. Dikin, G. H. B. Dommett, K. M. Kohlhaas, E. J. Zimney, E. A. Stach,
R. D. Piner, S. T. Nguyen, R. S. Ruoff, Nature 2006, 442, 282.
[8] J. N. Coleman, M. Lotya, A. O'Neill, S. D. Bergin, P. J. King, U. Khan, K. Young, A.
Gaucher, S. De, R. J. Smith, I. V. Shvets, S. K. Arora, G. Stanton, H. Y. Kim, K. Lee, G. T. Kim,
G. S. Duesberg, T. Hallam, J. J. Boland, J. J. Wang, J. F. Donegan, J. C. Grunlan, G. Moriarty, A.
Shmeliov, R. J. Nicholls, J. M. Perkins, E. M. Grieveson, K. Theuwissen, D. W. McComb, P. D.
Nellist, V. Nicolosi, Science 2011, 331, 568.
[9] M. W. Barsoum, Progress in Solid State Chemistry 2000, 28, 201.
[10] M. W. Barsoum, in Ceramics Science and Technology, Vol. 2: Properties,, Vol. 2 (Eds: R.
R. Riedel, I.-W. Chen), Wiley-VCH Verlag GmbH & Co, 2010.
[11] X. H. Wang, Y. C. Zhou, Journal of Materials Science & Technology 2010, 26, 385.
[12] N. V. Tzenov, M. W. Barsoum, Journal of the American Ceramic Society 2000, 83, 825.
[13] T. El-Raghy, M. W. Barsoum, J. Appl. Phys. 1998, 83, 112.
[14] M. W. Barsoum, T. El-Raghy, L. Farber, M. Amer, R. Christini, A. Adams, J.
Electrochem. Soc. 1999, 146, 3919.
[15] T. El-Raghy, M. W. Barsoum, M. Sika, Mater. Sci. Eng. A 2001, 298, 174.
[16] M. W. Barsoum, J. Golczewski, H. J. Siefert, F. Aldinger, J. Alloys and Compds. 2002,
340, 173.
[17] Y. Gogotsi, A. Nikitin, H. Ye, W. Zhou, J. E. Fischer, B. Yi, H. C. Foley, M. W. Barsoum,
Nature Materials 2003, 2, 591.
[18] G. Yushin, E. N. Hoffman, M. W. Barsoum, Y. Gogotsi, C. A. Howell, S. R. Sandeman,
G. J. Phillips, A. W. Lloyd, S. V. Mikhalovsky, Biomaterials 2006, 27, 5755.
[19] M. W. Barsoum, M. Radovic, in Encyclopedia of Materials: Science and Technology,
(Eds: K. H. J. Buschow, W. C. Robert, C. F. Merton, I. Bernard, J. K. Edward, M. Subhash, V.
Patrick), Elsevier, Oxford 2004, 1.
[20] B. D. Cullity, Elements of X-ray diffraction, Addison-Wesley 1978.
[21] C. N. R. Rao, et al., Science and Technology of Advanced Materials 2010, 11, 054502.
[22] J. Spanier, S. Gupta, M. Amer, M. W. Barsoum, Physical Review B 2005, 71, 012103.
[23] S. Myhra, J. A. A. Crossley, M. W. Barsoum, Journal of Physics and Chemistry of Solids
2001, 62, 811.
[24] M. Schmidt, S. G. Steinemann, Fresenius' Journal of Analytical Chemistry 1991, 341, 412.
[25] L. M. Viculis, J. J. Mack, O. M. Mayer, H. T. Hahn, R. B. Kaner, Journal of Materials
Chemistry 2005, 15, 974.
[26] L. M. Viculis, J. J. Mack, R. B. Kaner, Science 2003, 299, 1361.
[27] M. V. Savoskin, V. N. Mochalin, A. P. Yaroshenko, N. I. Lazareva, T. E. Konstantinova,
I. V. Barsukov, I. G. Prokofiev, Carbon 2007, 45, 2797.
[28] T. Brezesinski, J. Wang, S. H. Tolbert, B. Dunn, Nat Mater 2010, 9, 146.
[29] K. Kang, Y. S. Meng, J. Bréger, C. P. Grey, G. Ceder, Science 2006, 311, 977.
[30] F. Schwierz, Nat Nano 2010, 5, 487.

Submitted to
12
[31] B. Radisavljevic, A. Radenovic, J. Brivio, V. Giacometti, A. Kis, Nat Nano 2011, advance
online publication.
[32] S. Gupta, E. N. Hoffman, M. W. Barsoum, Journal of Alloys and Compounds 2006, 426,
168.
[33] M. W. Barsoum, T. El-Raghy, M. Ali, Metallurgical and Materials Transactions A 2000,
31, 1857.

Submitted to
13
Figure Captions;
Figure 1. Schematic of the exfoliation process for Ti3AlC2. (a) Ti3AlC2 structure. (b) Al atoms
replaced by OH after reaction with HF. (c) Breakage of the hydrogen bonds and separation of
nano sheets after sonication in methanol.
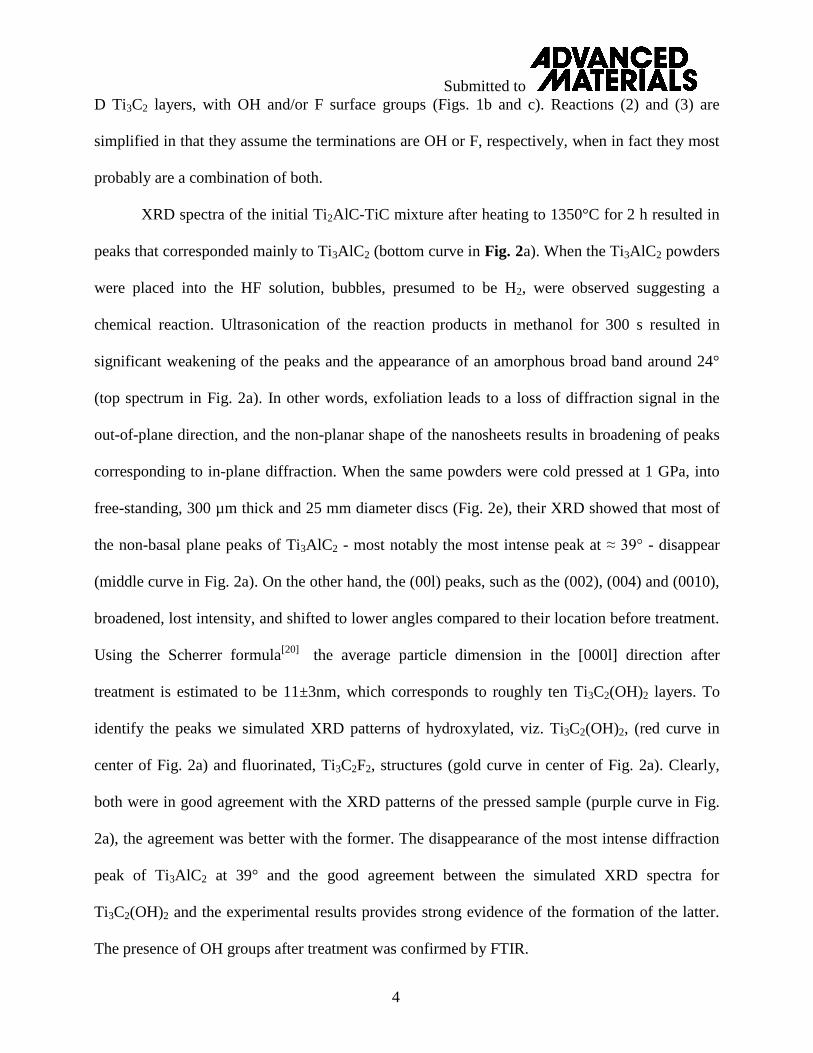
Figure 2. Analysis of Ti3AlC2 before and after exfoliation. (a) XRD pattern for Ti3AlC2 before
any treatment, simulated XRD patterns of Ti3C2F2 and Ti3C2(OH)2, measured XRD patterns of
Ti3AlC2 after HF treatment, and exfoliated nanosheets produced by sonication. (b) Raman spectra
of Ti3AlC2 before and after HF treatment. (c) XPS spectra of Ti3AlC2 before and after HF
treatment. (d) SEM image of a sample after HF treatment. (e) CP 25 mm disk of etched and
exfoliated material after HF treatment.
Figure 3. Exfoliated MXene nanosheets. (a) TEM micrographs of exfoliated 2-D nanosheets of
Ti-C-O-F. (b) Exfoliated 2-D nanosheets; inset SAD shows hexagonal basal plane. (c) Single and
double layer MXene sheets. (d) HRTEM image showing the separation of individual sheets after
sonication. (e) HRTEM image of bilayer Ti3C2(OH)xFy. (f) Atomistic model of the layer structure
shown in E. (g) Calculated band structure of single layer MXene with -OH and -F surface
termination and no termination (Ti3C2), showing a change from metal to semiconductor as a
result of change in the surface chemistry.
Figure 4. TEM images and simulated structures of multi-layer MXene. (a) TEM micrographs for
stacked layers of Ti-C-O-F. Those are similar to multilayer graphene or exfoliated graphite that
finds use in electrochemical storage. (b) The same as A but at a higher magnification. (c) Model
of the Li-intercalated structure of Ti3C2 (Ti3C2Li2) (d) Conical scroll of about 20 nm in outer
diameter. (e) Cross sectional TEM image of a scroll with inner radius less than 20 nm. (f)
Schematic for MXene scroll (OH-terminated).

Submitted to
14
Figure 1. Schematic of the exfoliation process for Ti3AlC2. (a) Ti3AlC2 structure. (b) Al atoms
replaced by OH after reaction with HF. (c) Breakage of the hydrogen bonds and separation of
nano sheets after sonication in methanol.
Submitted to
15
Figure 2. Analysis of Ti3AlC2 before and after exfoliation. (a) XRD pattern for Ti3AlC2 before
any treatment, simulated XRD patterns of Ti3C2F2 and Ti3C2(OH)2, measured XRD patterns of
Ti3AlC2 after HF treatment, and exfoliated nanosheets produced by sonication. (b) Raman spectra
of Ti3AlC2 before and after HF treatment. (c) XPS spectra of Ti3AlC2 before and after HF
treatment. (d) SEM image of a sample after HF treatment. (e) CP 25 mm disk of etched and
exfoliated material after HF treatment.

Submitted to
16
Figure 3. Exfoliated MXene nanosheets. (a) TEM micrographs of exfoliated 2-D nanosheets of
Ti-C-O-F. (b) Exfoliated 2-D nanosheets; inset SAD shows hexagonal basal plane. (c) Single and
double layer MXene sheets. (d) HRTEM image showing the separation of individual sheets after
sonication. (e) HRTEM image of bilayer Ti3C2(OH)xFy. (f) Atomistic model of the layer structure
shown in E. (g) Calculated band structure of single layer MXene with -OH and -F surface
termination and no termination (Ti3C2), showing a change from metal to semiconductor as a
result of change in the surface chemistry.

Submitted to
17
Figure 4. TEM images and simulated structures of multi-layer MXene. (a) TEM micrographs for
stacked layers of Ti-C-O-F. Those are similar to multilayer graphene or exfoliated graphite that
finds use in electrochemical storage. (b) The same as A but at a higher magnification. (c) Model
of the Li-intercalated structure of Ti3C2 (Ti3C2Li2) (d) Conical scroll of about 20 nm in outer
diameter. (e) Cross sectional TEM image of a scroll with inner radius less than 20 nm. (f)
Schematic for MXene scroll (OH-terminated).
Received: ((will be filled in by the editorial staff))
Revised: ((will be filled in by the editorial staff))
Published online: ((will be filled in by the editorial staff))
Submitted to
18
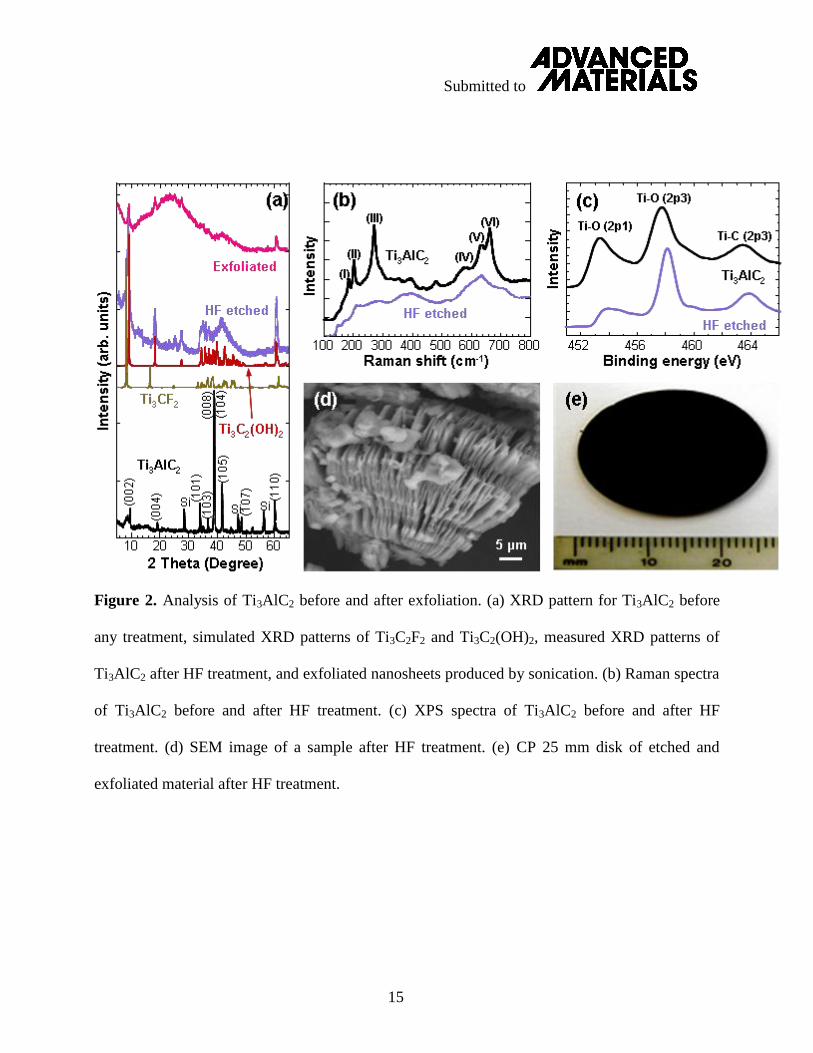
The table of contents entry:
Two-dimensional nanocrystals have unique properties. Herein we report on two-dimensional
Ti3C2 nanosheets, multi-layers structures and conical scrolls produced by room temperature
exfoliation of Ti3AlC2 in HF. Since Ti3AlC2 is a member of a 60+ group of layered ternary
carbides and nitrides (MAX phases), this discovery opens a door to the synthesis of a large
number of other 2-D crystals.
Keyword (Two-Dimensional Nanocrystals)
Michael Naguib, Murat Kurtoglu, Volker Presser, Jun Lu, Junjie Niu, Min Heon, Lars Hultman,
Yury Gogotsi* and Michel W. Barsoum*
Two-Dimensional Nanocrystals Produced by Exfoliation of Ti3AlC2
ToC figure ((55 mm broad, 50 mm high, or 110 mm broad, 20 mm high))

Submitted to
19
Supporting Information should be included here (for submission only; for publication, please
provide Supporting Information as a separate PDF file).