Embed Size (px)
Citation preview
IN DEGREE PROJECT CIVIL ENGINEERING AND URBAN MANAGEMENT,SECOND CYCLE, 30 CREDITS
, STOCKHOLM SWEDEN 2017
Two-dimensional analysis of the failure mechanisms of an embankment supported by rows of dry deep mixing columns.
BIEKE PEETERS
KTH ROYAL INSTITUTE OF TECHNOLOGYSCHOOL OF ARCHITECTURE AND THE BUILT ENVIRONMENT
Contents
1 Introduction 11.1 Background . . . . . . . . . . . . . . . . . . . . . . . . . . . . . . . . . . . 11.2 Objectives . . . . . . . . . . . . . . . . . . . . . . . . . . . . . . . . . . . . 21.3 Disposition . . . . . . . . . . . . . . . . . . . . . . . . . . . . . . . . . . . 21.4 Limitations . . . . . . . . . . . . . . . . . . . . . . . . . . . . . . . . . . . 3
2 Literature review 42.1 Deep mixing method . . . . . . . . . . . . . . . . . . . . . . . . . . . . . . 4
2.1.1 Current state of practice of the deep mixing method . . . . . . . . . 42.1.1.1 Installation and production of deep mixing columns . . . . 5
2.1.2 Properties of mixing materials . . . . . . . . . . . . . . . . . . . . . 82.1.3 Applications . . . . . . . . . . . . . . . . . . . . . . . . . . . . . . . 9
2.2 Failure of deep mixing stabilized ground . . . . . . . . . . . . . . . . . . . 102.2.1 Current Swedish design method for stabilized ground . . . . . . . . 102.2.2 All failure mechanisms . . . . . . . . . . . . . . . . . . . . . . . . . 13
2.3 Research on embankment supported by deep mixing columns . . . . . . . . 142.3.1 Numerical analysis . . . . . . . . . . . . . . . . . . . . . . . . . . . 14
2.3.1.1 Continuous shear panels . . . . . . . . . . . . . . . . . . . 182.3.2 Laboratory tests . . . . . . . . . . . . . . . . . . . . . . . . . . . . 20
2.4 Research on excavation supported with rows of dry deep mixing columns . 242.5 Summary . . . . . . . . . . . . . . . . . . . . . . . . . . . . . . . . . . . . 25
3 General methodology 273.1 Geometrical model . . . . . . . . . . . . . . . . . . . . . . . . . . . . . . . 283.2 Material properties . . . . . . . . . . . . . . . . . . . . . . . . . . . . . . . 29
4 Analytical calculations 324.1 Extrusion of soft ground between shear walls . . . . . . . . . . . . . . . . . 324.2 Internal stability . . . . . . . . . . . . . . . . . . . . . . . . . . . . . . . . 37
4.2.1 No reduction of strength and stiffness at the overlap . . . . . . . . . 384.2.1.1 Undrained shear strength . . . . . . . . . . . . . . . . . . 384.2.1.2 Drained shear strength . . . . . . . . . . . . . . . . . . . . 39
4.2.2 Reduction of strength and stiffness at the overlap . . . . . . . . . . 41
i
4.2.2.1 Undrained shear strength . . . . . . . . . . . . . . . . . . 414.2.2.2 Drained shear strength . . . . . . . . . . . . . . . . . . . . 43
4.2.3 Calculation safety factor . . . . . . . . . . . . . . . . . . . . . . . . 44
5 Numerical calculations 475.1 Geometrical model . . . . . . . . . . . . . . . . . . . . . . . . . . . . . . . 475.2 Material model . . . . . . . . . . . . . . . . . . . . . . . . . . . . . . . . . 50
5.2.1 Mohr-Coulomb model . . . . . . . . . . . . . . . . . . . . . . . . . 505.2.2 Material properties . . . . . . . . . . . . . . . . . . . . . . . . . . . 52
5.2.2.1 Properties of the overlap of the DM columns . . . . . . . . 525.2.2.2 Properties of the column and overlap zones in the 2D model 53
5.2.3 Definition of failure . . . . . . . . . . . . . . . . . . . . . . . . . . . 555.2.4 Safety analysis . . . . . . . . . . . . . . . . . . . . . . . . . . . . . 56
5.3 Results . . . . . . . . . . . . . . . . . . . . . . . . . . . . . . . . . . . . . . 565.3.1 Analysis of the failure mode . . . . . . . . . . . . . . . . . . . . . . 56
5.3.1.1 Quality of overlap: 50% . . . . . . . . . . . . . . . . . . . 575.3.1.2 Quality of overlap: 25% . . . . . . . . . . . . . . . . . . . 605.3.1.3 Quality of overlap: 100% . . . . . . . . . . . . . . . . . . . 60
5.3.2 Safety factors . . . . . . . . . . . . . . . . . . . . . . . . . . . . . . 64
6 General discussion 666.1 Risk for extrusion . . . . . . . . . . . . . . . . . . . . . . . . . . . . . . . . 666.2 Influence of overlap between adjacent columns . . . . . . . . . . . . . . . . 666.3 How representative is LEM compared to numerical analysis? . . . . . . . . 67
7 Conclusions 69
ii
Summary
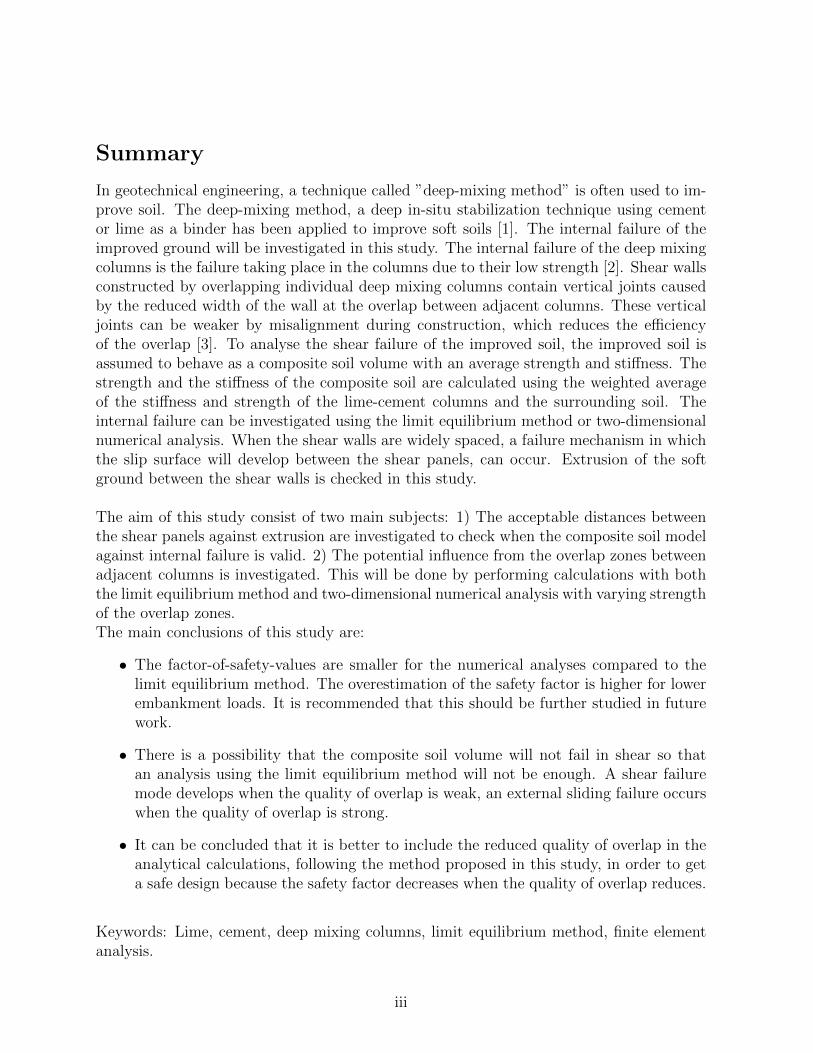
In geotechnical engineering, a technique called ”deep-mixing method” is often used to im-prove soil. The deep-mixing method, a deep in-situ stabilization technique using cementor lime as a binder has been applied to improve soft soils [1]. The internal failure of theimproved ground will be investigated in this study. The internal failure of the deep mixingcolumns is the failure taking place in the columns due to their low strength [2]. Shear wallsconstructed by overlapping individual deep mixing columns contain vertical joints causedby the reduced width of the wall at the overlap between adjacent columns. These verticaljoints can be weaker by misalignment during construction, which reduces the efficiencyof the overlap [3]. To analyse the shear failure of the improved soil, the improved soil isassumed to behave as a composite soil volume with an average strength and stiffness. Thestrength and the stiffness of the composite soil are calculated using the weighted averageof the stiffness and strength of the lime-cement columns and the surrounding soil. Theinternal failure can be investigated using the limit equilibrium method or two-dimensionalnumerical analysis. When the shear walls are widely spaced, a failure mechanism in whichthe slip surface will develop between the shear panels, can occur. Extrusion of the softground between the shear walls is checked in this study.
The aim of this study consist of two main subjects: 1) The acceptable distances betweenthe shear panels against extrusion are investigated to check when the composite soil modelagainst internal failure is valid. 2) The potential influence from the overlap zones betweenadjacent columns is investigated. This will be done by performing calculations with boththe limit equilibrium method and two-dimensional numerical analysis with varying strengthof the overlap zones.The main conclusions of this study are:
• The factor-of-safety-values are smaller for the numerical analyses compared to thelimit equilibrium method. The overestimation of the safety factor is higher for lowerembankment loads. It is recommended that this should be further studied in futurework.
• There is a possibility that the composite soil volume will not fail in shear so thatan analysis using the limit equilibrium method will not be enough. A shear failuremode develops when the quality of overlap is weak, an external sliding failure occurswhen the quality of overlap is strong.
• It can be concluded that it is better to include the reduced quality of overlap in theanalytical calculations, following the method proposed in this study, in order to geta safe design because the safety factor decreases when the quality of overlap reduces.
Keywords: Lime, cement, deep mixing columns, limit equilibrium method, finite elementanalysis.
iii
Sammanfattning
a Inom geotekniken anvnds vanligen kalk-cement pelare for att forbttra Jorden. Metodenanvander cement eller kalk som bindemedel for att forstarka jorden och utgors av pelaresom placeras i olika monster beroende pa typ av forstarkning. I samband med dessa typerav forstarkningar kan den forstarkta jorden ga till olika typer av brott, dar en ett inreskjuvbrott i form av en glidyta har studerats i detta arbete. Denna typ av brott utvecklatsi den forstarka jorden nar dess skjuvhallfasthet ar lag. Nar kalk-cement pelarna placeras irader uppstar en overlappning mellan pelarna, vars hallfasthet kan vara lagre pa grund avavvikelser i sidled vilket reducerar hallfastheten for detta omrade.Sakerheten mot brott beraknas vanligtvis med en forenklad jamviktanalys dar glidytanbetraktas som en stel kropp, men kan aven beraknas med numeriska analyser for atterhalla en mer korrekt bild av handelseforloppet. I bada dessa tva-dimensionella analyserbetraktas raderna av pelarna med en kompositmodell bestaende av jord med tillhorandekalk-cementpelare. Ett annat brott som kan intraffa ar utglidning mellan raderna av pelareom de placeras for brett isar.Syftet med detta arbete har varit att: (1) berakna acceptabla avastnd mellan kalk-cementpelarnafor det undersota fallet for att forhindra utglidning mellan pelarna, (2) undersoka hur vari-ation i hallfastheten i overlappzonen paverkar sakerheten mot glidning och (3) undersokaskillnaden i beraknad sakerhet jamfort med jamviktanalys och numerisk tva-dimensionellberakning.Resultaten fran det utforda arbetet visar att:
• Sakerhetsfaktorn ar mindre for de numeriska analyserna jamfort med analytisk jamvik-tanalys. Skillnaden ar vasentligt hogre vid laga belastningar. Det rekommenderasatt detta studeras vidare i framtida arbete.
• De numeriska analyserna visar att det ar mjligt att den forstarkta jorden inte gartill brott genom en utvecklad glidyta sasom antas i jamviktanalysen. Ett glidbrottforefaller att utvecklas om hallfastheten i den overlappande zonen ar lag, medandetta inte sker da hallfastheten i den overlappande zonen inte reduceras.
• Det kan konstateras att den potentiellt reducerade hallfastheten i den overlappandezonen bor tas med i berakningarna da den leder till en nagot lagre sakerhetsfaktor.
Nyckeord: kalk, cement, kalk-cement pelare, jamviktsanalys, fem
iv
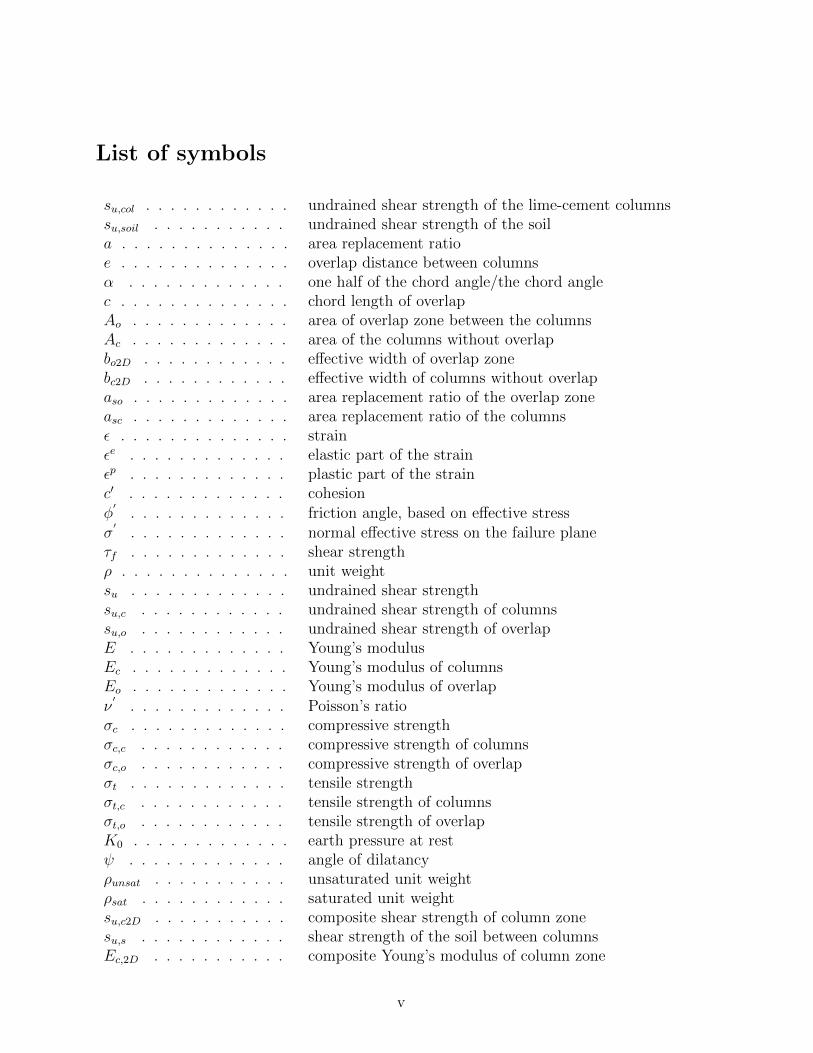
List of symbols
su,col . . . . . . . . . . . . undrained shear strength of the lime-cement columnssu,soil . . . . . . . . . . . undrained shear strength of the soila . . . . . . . . . . . . . . area replacement ratioe . . . . . . . . . . . . . . overlap distance between columnsα . . . . . . . . . . . . . one half of the chord angle/the chord anglec . . . . . . . . . . . . . . chord length of overlapAo . . . . . . . . . . . . . area of overlap zone between the columnsAc . . . . . . . . . . . . . area of the columns without overlapbo2D . . . . . . . . . . . . effective width of overlap zonebc2D . . . . . . . . . . . . effective width of columns without overlapaso . . . . . . . . . . . . . area replacement ratio of the overlap zoneasc . . . . . . . . . . . . . area replacement ratio of the columnsε . . . . . . . . . . . . . . strainεe . . . . . . . . . . . . . elastic part of the strainεp . . . . . . . . . . . . . plastic part of the strainc′ . . . . . . . . . . . . . cohesionφ
′. . . . . . . . . . . . . friction angle, based on effective stress
σ′
. . . . . . . . . . . . . normal effective stress on the failure planeτf . . . . . . . . . . . . . shear strengthρ . . . . . . . . . . . . . . unit weightsu . . . . . . . . . . . . . undrained shear strengthsu,c . . . . . . . . . . . . undrained shear strength of columnssu,o . . . . . . . . . . . . undrained shear strength of overlapE . . . . . . . . . . . . . Young’s modulusEc . . . . . . . . . . . . . Young’s modulus of columnsEo . . . . . . . . . . . . . Young’s modulus of overlapν
′. . . . . . . . . . . . . Poisson’s ratio
σc . . . . . . . . . . . . . compressive strengthσc,c . . . . . . . . . . . . compressive strength of columnsσc,o . . . . . . . . . . . . compressive strength of overlapσt . . . . . . . . . . . . . tensile strengthσt,c . . . . . . . . . . . . tensile strength of columnsσt,o . . . . . . . . . . . . tensile strength of overlapK0 . . . . . . . . . . . . . earth pressure at restψ . . . . . . . . . . . . . angle of dilatancyρunsat . . . . . . . . . . . unsaturated unit weightρsat . . . . . . . . . . . . saturated unit weightsu,c2D . . . . . . . . . . . composite shear strength of column zonesu,s . . . . . . . . . . . . shear strength of the soil between columnsEc,2D . . . . . . . . . . . composite Young’s modulus of column zone
v
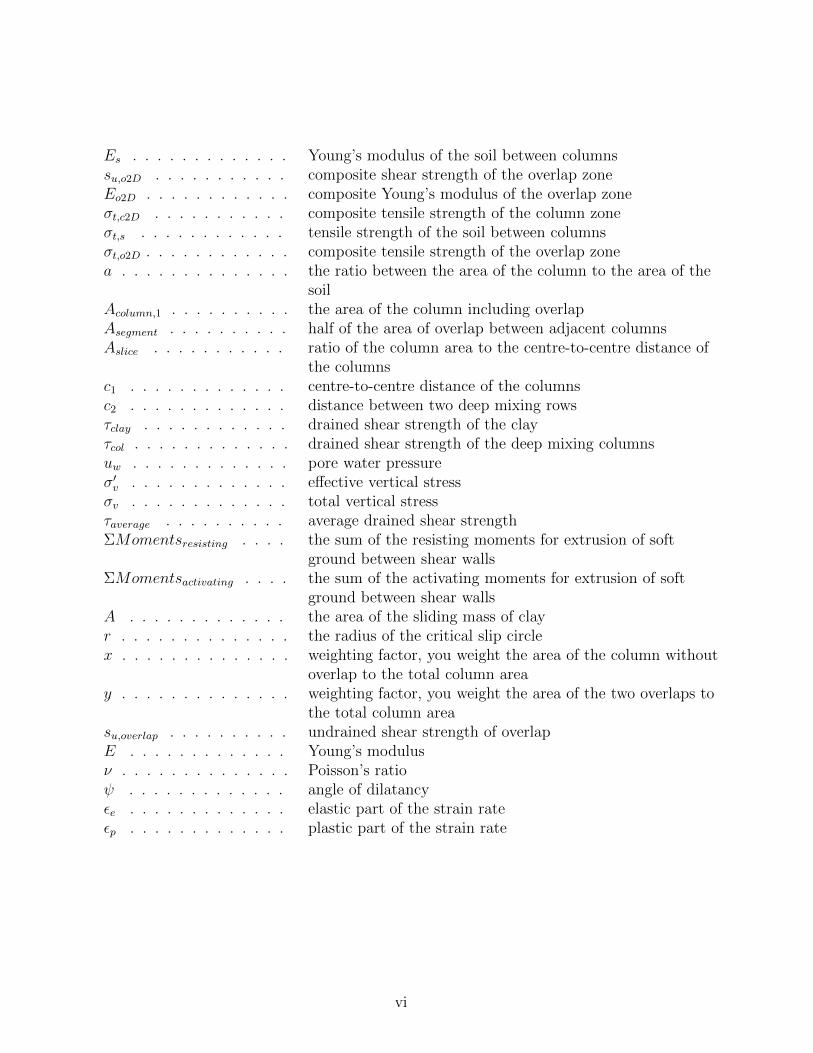
Es . . . . . . . . . . . . . Young’s modulus of the soil between columnssu,o2D . . . . . . . . . . . composite shear strength of the overlap zoneEo2D . . . . . . . . . . . . composite Young’s modulus of the overlap zoneσt,c2D . . . . . . . . . . . composite tensile strength of the column zoneσt,s . . . . . . . . . . . . tensile strength of the soil between columnsσt,o2D . . . . . . . . . . . . composite tensile strength of the overlap zonea . . . . . . . . . . . . . . the ratio between the area of the column to the area of the
soilAcolumn,1 . . . . . . . . . . the area of the column including overlapAsegment . . . . . . . . . . half of the area of overlap between adjacent columnsAslice . . . . . . . . . . . ratio of the column area to the centre-to-centre distance of
the columnsc1 . . . . . . . . . . . . . centre-to-centre distance of the columnsc2 . . . . . . . . . . . . . distance between two deep mixing rowsτclay . . . . . . . . . . . . drained shear strength of the clayτcol . . . . . . . . . . . . . drained shear strength of the deep mixing columnsuw . . . . . . . . . . . . . pore water pressureσ′v . . . . . . . . . . . . . effective vertical stressσv . . . . . . . . . . . . . total vertical stressτaverage . . . . . . . . . . average drained shear strengthΣMomentsresisting . . . . the sum of the resisting moments for extrusion of soft
ground between shear wallsΣMomentsactivating . . . . the sum of the activating moments for extrusion of soft
ground between shear wallsA . . . . . . . . . . . . . the area of the sliding mass of clayr . . . . . . . . . . . . . . the radius of the critical slip circlex . . . . . . . . . . . . . . weighting factor, you weight the area of the column without
overlap to the total column areay . . . . . . . . . . . . . . weighting factor, you weight the area of the two overlaps to
the total column areasu,overlap . . . . . . . . . . undrained shear strength of overlapE . . . . . . . . . . . . . Young’s modulusν . . . . . . . . . . . . . . Poisson’s ratioψ . . . . . . . . . . . . . angle of dilatancyεe . . . . . . . . . . . . . elastic part of the strain rateεp . . . . . . . . . . . . . plastic part of the strain rate
vi

vii
Chapter 1
Introduction
1.1 Background
To build a highway or railway embankment, a soil that can carry the applied loads withoutcollapsing is needed. Since in Sweden, the surface consists mainly of soft soil, soil improve-ment is often necessary to be sure that the applied loads can be carried without failureof the soil. In geotechnical engineering, a technique called ”deep-mixing method” is oftenused to improve soil. The deep-mixing method, a deep in-situ stabilization technique usingcement or lime as a binder has been applied to improve soft soils [1]. Binders like lime orcement are injected and mixed with the soil using special equipment. After the mixtureprocess, the binder hydrates and reacts with the soil to form hard soil columns which aremuch stronger and stiffer than the ambient soft soil. It has been used extensively sincethe 1970s to reduce settlement and to improve stability of for example railway embank-ments [4]. Lime columns were mainly used till the 1990s. Lime-cement colums replacedthe lime columns since the 1990s and they are used a lot nowadays [5]. The properties ofthe improved soil depend on the amount and characteristics of the cement-lime binder, thecharacteristics of the soil and the mixing and curing conditions [6].
Despite the succesful use of these lime-cement columns in the design of highay and railwayembankments, column failures or unexpected deformations occured in a few cases, evenwhen the design was made with sufficient high safety factors [8]. Analytical design methodsused nowadays to calculate the stability of the lime-cement columns can overestimatethe stability. In the majority of the cases where limit equilibrium methods are used toanalyse the stability, the limit equilibrium method will overestimate the factor of safetyof the structure compared to numerical analyses [7]. This happens because in addition toshear failure, numerical analysis can capture failure mechanisms not included in the limitequilibrium method.
The current Swedish design method for stabilized ground, described in TK Geo 13 [9]and [10] assumes that the improved soil volume behaves as a composite soil volume. Thestrength and the stiffness of the composite soil are calculated using the weighted average
1
Objectives 2
of the stiffness and strength of the lime-cement columns and the surrounding soil. Failureshould be checked in internal stability and external stability. The external stability isthe global failure of the improved ground area without any failure in the columns. Theinternal failure of the deep mixing columns is the failure taking place in the columns dueto their low strength [2]. In internal stability, the columns will fail by shearing all atthe same time. The stability of the embankment is analysed using a slip circle analysiswith an average strength and stiffness used for the composite soil volume. Shear wallsconstructed by overlapping individual deep mixing columns contain vertical joints causedby the reduced width of the wall at the overlap between adjacent columns. These verticaljoints can be weaker by misalignment during construction, which reduces the efficiency ofthe overlap [3]. The Swedish design method for stabilized ground does not take the effectof weaker overlap zones into account. Extrusion of the soft ground between the columnsshould also be checked. Extrusion of the soft clay ground could occur if the shear walls arewidely spaced.
1.2 Objectives
The objectives of the study are summarized as follows:
1. Investigate the acceptable distances between the shear panels against extrusion tocheck when the composite soil model against internal failure is valid.
(a) An analytical method to calculate the safety factors for extrusion of soft groundis made.
2. Investigate the potential influence from the overlap zones between adjacent columns.This will be done by performing calculations with both the limit equilibrium methodand two-dimensional numerical analysis with varying strength of the overlap zones.
(a) Compare the safety factors for internal stability calculated according to theSwedish design code for stabilized ground using the limit equilibrium methodwith the safety factors calculated using a 2D finite element model.
(b) A method to calculate the safety factors for internal stability taking weakeroverlaps into account is made. Compare the safety factors for internal stabilitycalculated using the limit equilibrium method considering the strength of theoverlap zones with the safety factors calculated using a 2D finite element model.
(c) Investigate the influence of the reduction of strength and stiffness in the overlapzones on the 2D numerical model.
1.3 Disposition
This thesis contains a review of studies and research performed concerning the failuremechanisms of deep mixing columns. Further, it contains a number of chapters that
Limitations 3
describe the methodology used to calculate safety factors for internal failure.
• Chapter 1: Literature review.A brief overview of studies and research performed so far concerning the failuremechanisms of deep mixing columns.
• Chapter 2: General methodology.A particular case where deep mixing columns are installed in rows of overlappingcolumns is studied. The properties and geometry of this particular case are describedin this chapter.
• Chapter 3: Analytical calculations.The method to obtain an analytical solution for internal failure and extrusion of thesoft ground between shear walls will be described here, as well as the obtained results.
• Chapter 4: Numerical calculations.Numerical analysis was performed to investigate the failure behaviour of deep mixingcolumns supporting a highway or railway embankment. A sensitivity analysis of thenumerical model is performed. The method used to make this numerical modelis described in this chapter. The results obtained from the numerical model arediscussed, as well as the comparison between the results of the numerical model andthe analytical solution. The influence of the overlap quality on the numerical modelis discussed as well.
• Chapter 5: General discussion.The overall results are discussed in this chapter with respect to the objectives.
• Chapter 6: Conclusions and recommendations.The conclusions drawn from the results of the numerical model and the analyticalsolution will be summarized here. Recommendations for further research are given.
1.4 Limitations
This study is not based on any specific site condition. The typical ground conditionwas chosen from literature with the care of choosing suitable parameters. Therefore, theresults obtained cannot be compared to any measurements of a real life situation. Anotherlimitation of this study is that the results of the 2D numerical model cannot be comparedto the results of a 3D numerical model. Therefore, it is insecure in which cases the 2Dmodels are good or bad representations of the 3D real situations. One failure mode willnot be checked by using the numerical 2D model, namely the extrusion of clay betweenthe shear wall panels.
Chapter 2
Literature review
2.1 Deep mixing method
The deep mixing method, a deep in-situ soil stabilization technique using lime and/orcement as a binder has been used in Sweden successfully for the last 40 years to supportrailway or highway embankments, specifically to increase their stability and to reduce theirsettlement [4]. Since the 1970s research has been done independently through differentcountries such as Sweden, Japan, US, China, Thailand. After the first conference aboutdeep mixing method in Japan in 1996, information about the method have been sharedworldwide [2].
2.1.1 Current state of practice of the deep mixing method
The deep mixing method consists of mechanical mixing of the in-situ soil with cementitiousmaterials in order to form columns or panels of improved ground. The deep mixing methodsuses quicklime, slaked lime, cement, fly ash or other agents as a binder [13]. Two differentmethods exist: dry method of deep mixing and wet method of deep mixing. In the drymethod of deep mixing dry powdered lime and cement are used as the stabilizing agents.In the wet method of deep mixing cement in a slurry form is used as a stabilizing agent[13]. In Sweden, dry binders are exclusively distributed in the soil. The wet mixing methodcan be used in soft clays, silts and fine-grained sands [14]. The wet mixing method is notapplicable when the water content is high because a high water/binder ratio may result ina lower strength [15],[16]. The wet method will produce homogeneous columns more easilycompared to the dry mixing method. The dry mixing method can be used for soft soilswith high moisture content. The advantages of the dry mixing method include lower watercontent of the improved soil, lower binder quality and generally higher strength [15].Stabilizing binders used in practice are Portland cement and quick lime in the majorityof cases. Additives, for example granulated blast furnace slag, fly ash, gypsum and silicadust, among others are used specially for the improvement of clay soils with high watercontent or organic soils [15], [16].
4
Current state of practice of the deep mixing method 5
There are some main reasons why this ground improvement method has expanded a greatdeal around the world. First of all, ground improvement by deep mixing allows, simul-taneously, an increase in stability and a reduction of settlements. Further, deep mixinghas a minor environmental impact and a great speed of execution. At last, because ofthe development of machinery, it is possible to execute the deep mixing method for largerdepths (greater than 40m), in non-homogeneous soil formations, including soft soils, sand,gravel, overconsolidated clays and even weathered soft rocks [15].
2.1.1.1 Installation and production of deep mixing columns
The deep mixing method mixes in-situ soil with cementitious materials to form columnsor panels of improved ground. There are many different methods of deep mixing withvariations in equipment, procedure and used materials. This section will discuss the dryand wet installation methods in general. The purpose is to provide a general overview ofthe typical construction methods and equipment used to install deep mixing columns [13].
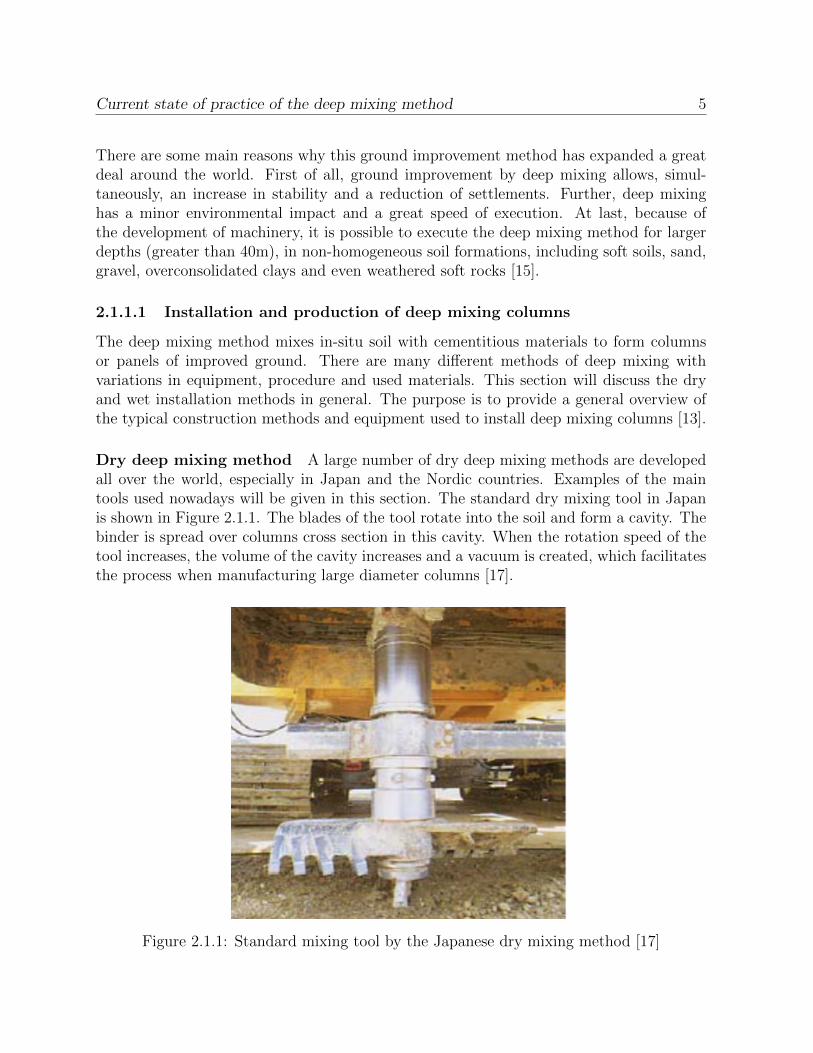
Dry deep mixing method A large number of dry deep mixing methods are developedall over the world, especially in Japan and the Nordic countries. Examples of the maintools used nowadays will be given in this section. The standard dry mixing tool in Japanis shown in Figure 2.1.1. The blades of the tool rotate into the soil and form a cavity. Thebinder is spread over columns cross section in this cavity. When the rotation speed of thetool increases, the volume of the cavity increases and a vacuum is created, which facilitatesthe process when manufacturing large diameter columns [17].
Figure 2.1.1: Standard mixing tool by the Japanese dry mixing method [17]
Current state of practice of the deep mixing method 6
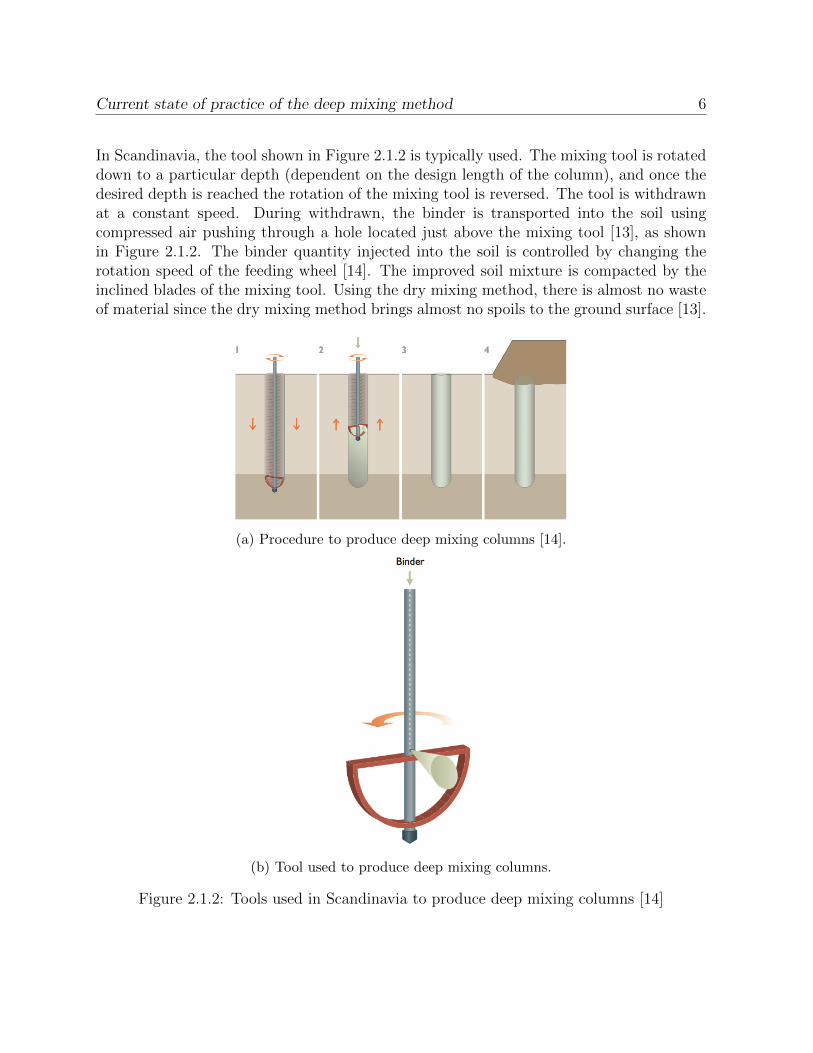
In Scandinavia, the tool shown in Figure 2.1.2 is typically used. The mixing tool is rotateddown to a particular depth (dependent on the design length of the column), and once thedesired depth is reached the rotation of the mixing tool is reversed. The tool is withdrawnat a constant speed. During withdrawn, the binder is transported into the soil usingcompressed air pushing through a hole located just above the mixing tool [13], as shownin Figure 2.1.2. The binder quantity injected into the soil is controlled by changing therotation speed of the feeding wheel [14]. The improved soil mixture is compacted by theinclined blades of the mixing tool. Using the dry mixing method, there is almost no wasteof material since the dry mixing method brings almost no spoils to the ground surface [13].
(a) Procedure to produce deep mixing columns [14].
(b) Tool used to produce deep mixing columns.
Figure 2.1.2: Tools used in Scandinavia to produce deep mixing columns [14]
Current state of practice of the deep mixing method 7
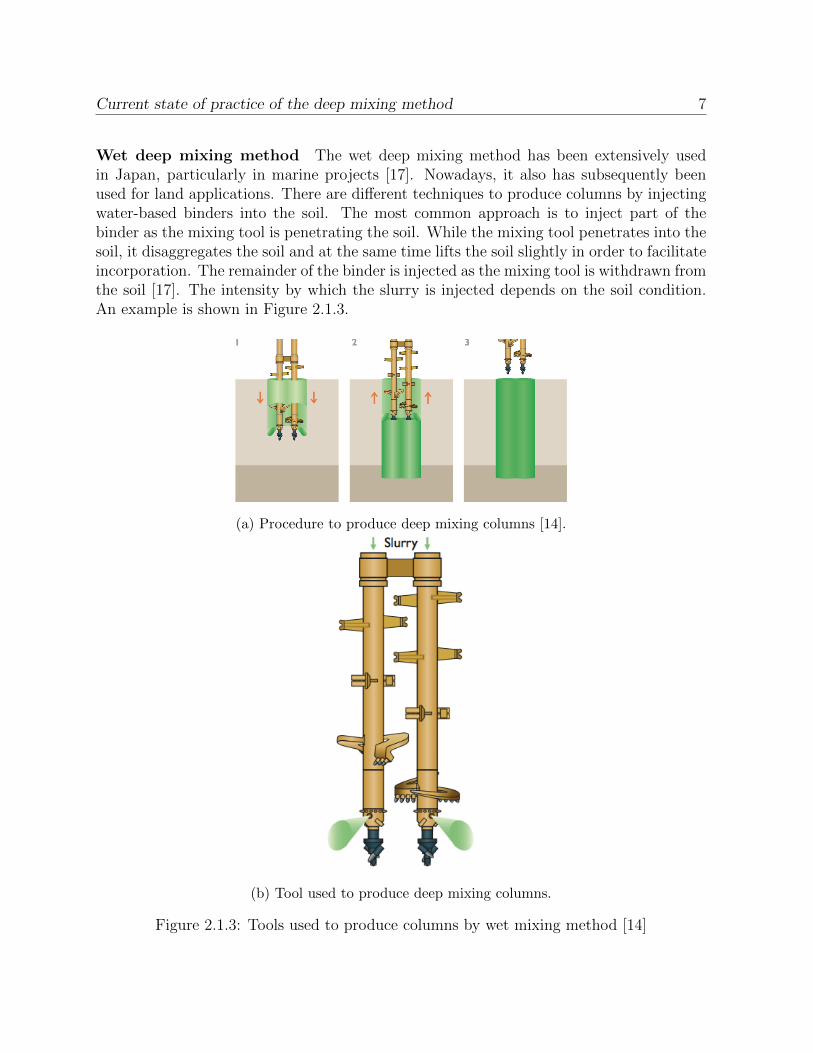
Wet deep mixing method The wet deep mixing method has been extensively usedin Japan, particularly in marine projects [17]. Nowadays, it also has subsequently beenused for land applications. There are different techniques to produce columns by injectingwater-based binders into the soil. The most common approach is to inject part of thebinder as the mixing tool is penetrating the soil. While the mixing tool penetrates into thesoil, it disaggregates the soil and at the same time lifts the soil slightly in order to facilitateincorporation. The remainder of the binder is injected as the mixing tool is withdrawn fromthe soil [17]. The intensity by which the slurry is injected depends on the soil condition.An example is shown in Figure 2.1.3.
(a) Procedure to produce deep mixing columns [14].
(b) Tool used to produce deep mixing columns.
Figure 2.1.3: Tools used to produce columns by wet mixing method [14]
Properties of mixing materials 8
2.1.2 Properties of mixing materials
Since the 1990s a lot of research was done to investigate the properties of soil and ce-ment/lime mixture, especially focusing on the strength and stiffness of the stabilized soil.The four main factors affecting mixture properties of cement and lime stabilized soil are[2]:
• Characteristics of the binders
• Characteristics and conditions of the original soil
• Mixing conditions
• Curing conditions
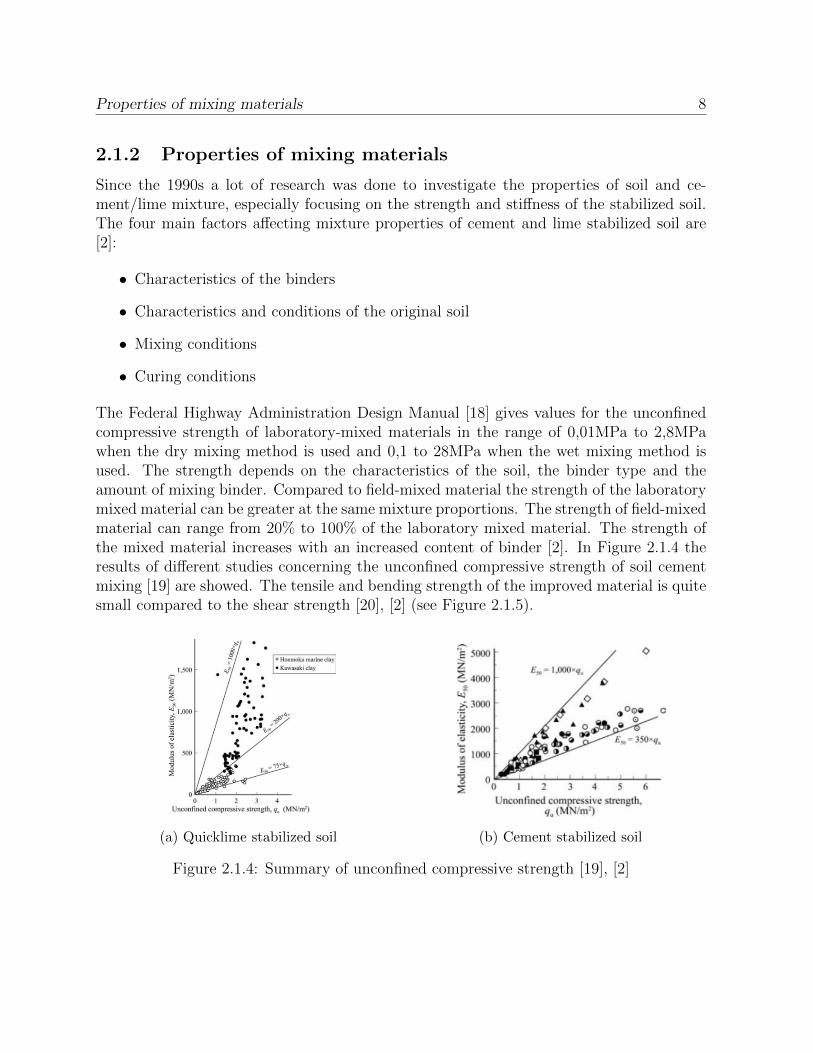
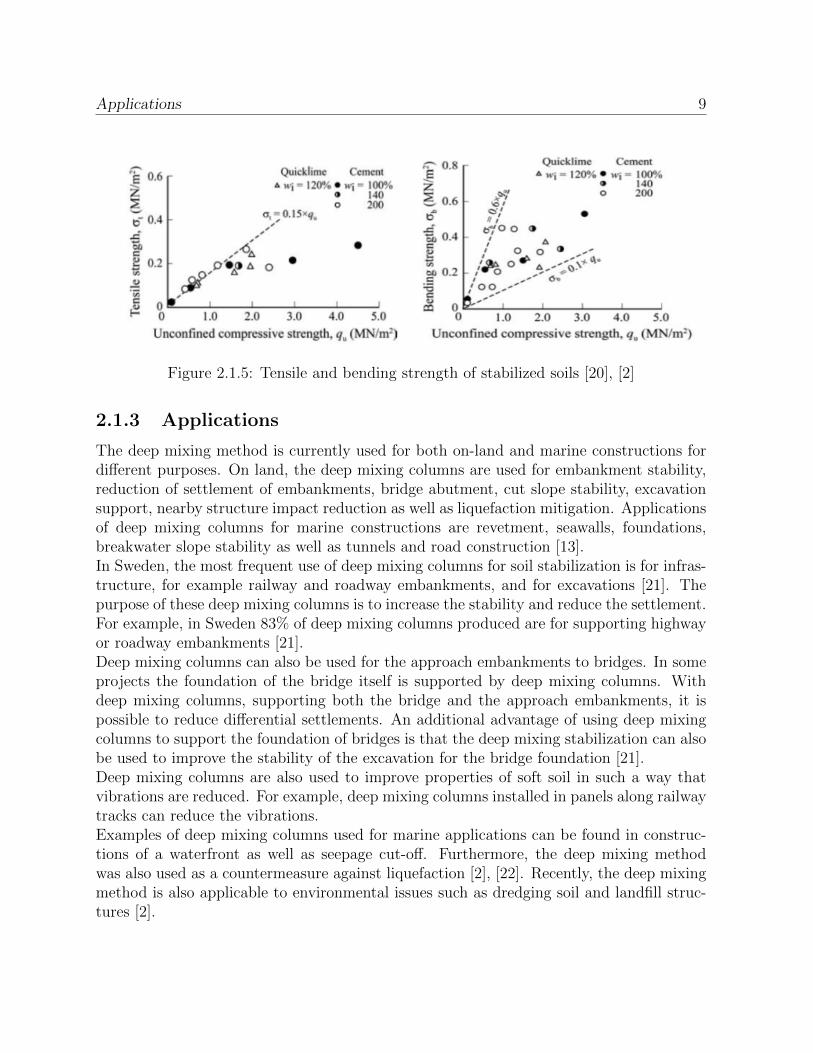
The Federal Highway Administration Design Manual [18] gives values for the unconfinedcompressive strength of laboratory-mixed materials in the range of 0,01MPa to 2,8MPawhen the dry mixing method is used and 0,1 to 28MPa when the wet mixing method isused. The strength depends on the characteristics of the soil, the binder type and theamount of mixing binder. Compared to field-mixed material the strength of the laboratorymixed material can be greater at the same mixture proportions. The strength of field-mixedmaterial can range from 20% to 100% of the laboratory mixed material. The strength ofthe mixed material increases with an increased content of binder [2]. In Figure 2.1.4 theresults of different studies concerning the unconfined compressive strength of soil cementmixing [19] are showed. The tensile and bending strength of the improved material is quitesmall compared to the shear strength [20], [2] (see Figure 2.1.5).
(a) Quicklime stabilized soil (b) Cement stabilized soil
Figure 2.1.4: Summary of unconfined compressive strength [19], [2]
Applications 9
Figure 2.1.5: Tensile and bending strength of stabilized soils [20], [2]
2.1.3 Applications
The deep mixing method is currently used for both on-land and marine constructions fordifferent purposes. On land, the deep mixing columns are used for embankment stability,reduction of settlement of embankments, bridge abutment, cut slope stability, excavationsupport, nearby structure impact reduction as well as liquefaction mitigation. Applicationsof deep mixing columns for marine constructions are revetment, seawalls, foundations,breakwater slope stability as well as tunnels and road construction [13].In Sweden, the most frequent use of deep mixing columns for soil stabilization is for infras-tructure, for example railway and roadway embankments, and for excavations [21]. Thepurpose of these deep mixing columns is to increase the stability and reduce the settlement.For example, in Sweden 83% of deep mixing columns produced are for supporting highwayor roadway embankments [21].Deep mixing columns can also be used for the approach embankments to bridges. In someprojects the foundation of the bridge itself is supported by deep mixing columns. Withdeep mixing columns, supporting both the bridge and the approach embankments, it ispossible to reduce differential settlements. An additional advantage of using deep mixingcolumns to support the foundation of bridges is that the deep mixing stabilization can alsobe used to improve the stability of the excavation for the bridge foundation [21].Deep mixing columns are also used to improve properties of soft soil in such a way thatvibrations are reduced. For example, deep mixing columns installed in panels along railwaytracks can reduce the vibrations.Examples of deep mixing columns used for marine applications can be found in construc-tions of a waterfront as well as seepage cut-off. Furthermore, the deep mixing methodwas also used as a countermeasure against liquefaction [2], [22]. Recently, the deep mixingmethod is also applicable to environmental issues such as dredging soil and landfill struc-tures [2].
Failure of deep mixing stabilized ground 10
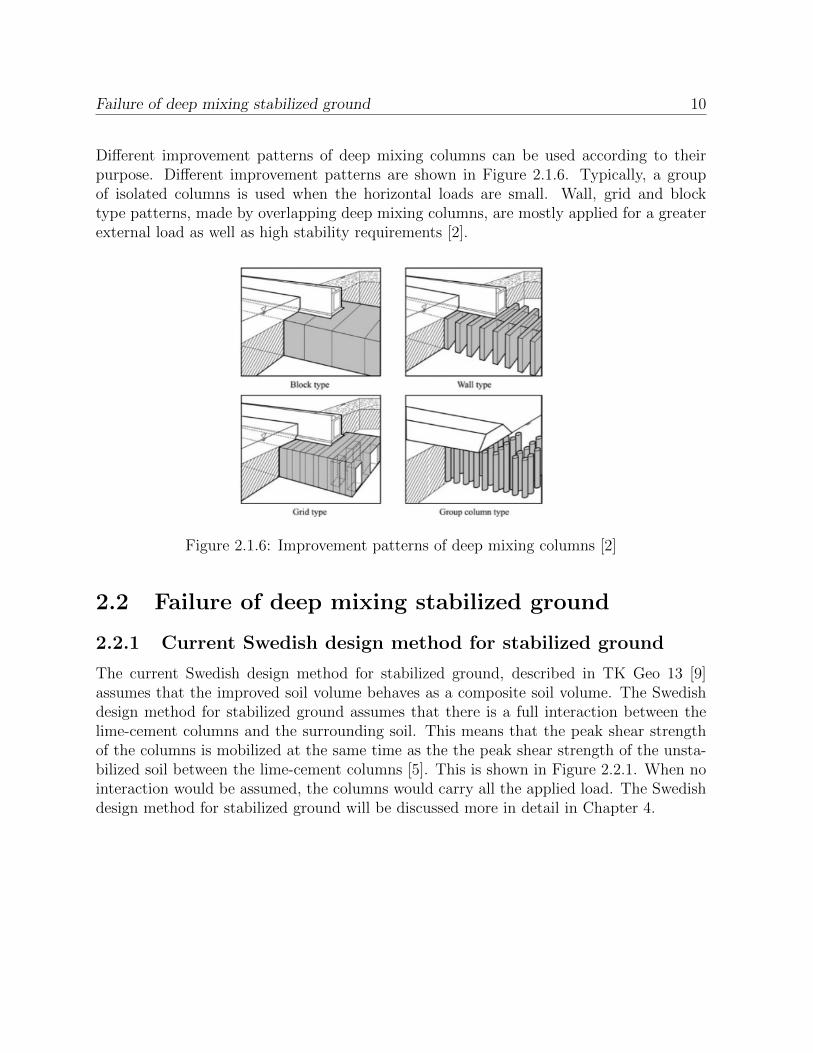
Different improvement patterns of deep mixing columns can be used according to theirpurpose. Different improvement patterns are shown in Figure 2.1.6. Typically, a groupof isolated columns is used when the horizontal loads are small. Wall, grid and blocktype patterns, made by overlapping deep mixing columns, are mostly applied for a greaterexternal load as well as high stability requirements [2].
Figure 2.1.6: Improvement patterns of deep mixing columns [2]
2.2 Failure of deep mixing stabilized ground
2.2.1 Current Swedish design method for stabilized ground
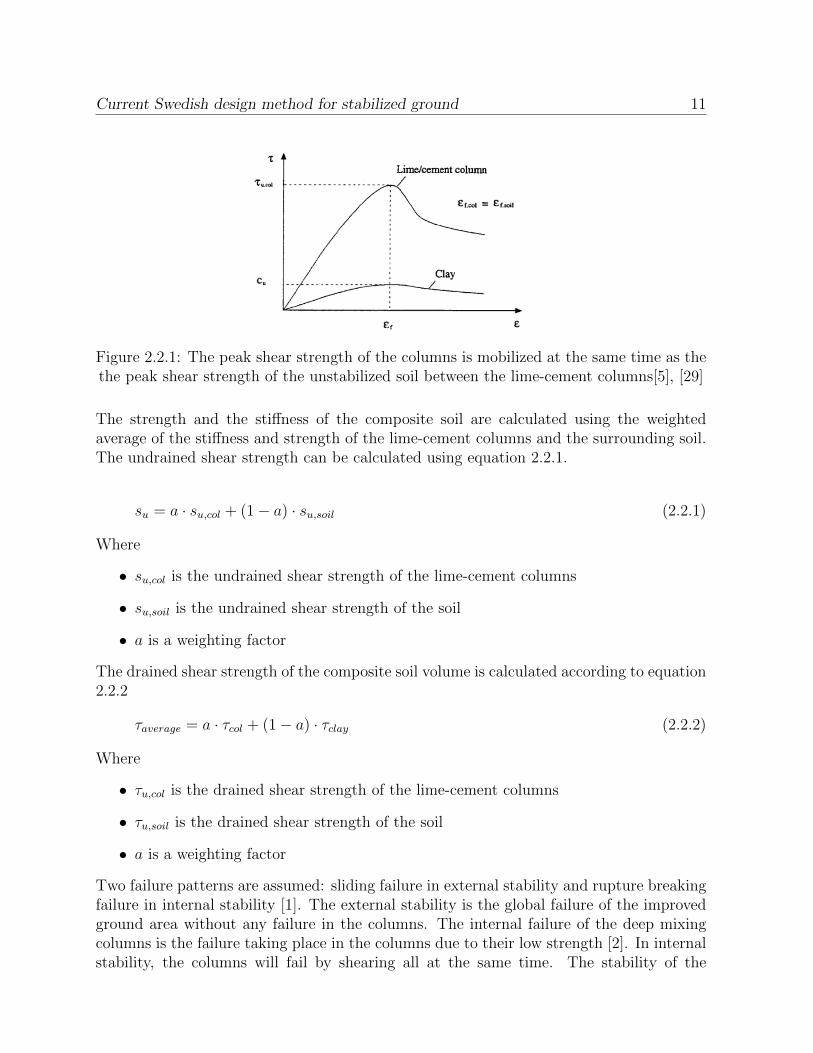
The current Swedish design method for stabilized ground, described in TK Geo 13 [9]assumes that the improved soil volume behaves as a composite soil volume. The Swedishdesign method for stabilized ground assumes that there is a full interaction between thelime-cement columns and the surrounding soil. This means that the peak shear strengthof the columns is mobilized at the same time as the the peak shear strength of the unsta-bilized soil between the lime-cement columns [5]. This is shown in Figure 2.2.1. When nointeraction would be assumed, the columns would carry all the applied load. The Swedishdesign method for stabilized ground will be discussed more in detail in Chapter 4.
Current Swedish design method for stabilized ground 11
Figure 2.2.1: The peak shear strength of the columns is mobilized at the same time as thethe peak shear strength of the unstabilized soil between the lime-cement columns[5], [29]
The strength and the stiffness of the composite soil are calculated using the weightedaverage of the stiffness and strength of the lime-cement columns and the surrounding soil.The undrained shear strength can be calculated using equation 2.2.1.
su = a · su,col + (1 − a) · su,soil (2.2.1)
Where
• su,col is the undrained shear strength of the lime-cement columns
• su,soil is the undrained shear strength of the soil
• a is a weighting factor
The drained shear strength of the composite soil volume is calculated according to equation2.2.2
τaverage = a · τcol + (1 − a) · τclay (2.2.2)
Where
• τu,col is the drained shear strength of the lime-cement columns
• τu,soil is the drained shear strength of the soil
• a is a weighting factor
Two failure patterns are assumed: sliding failure in external stability and rupture breakingfailure in internal stability [1]. The external stability is the global failure of the improvedground area without any failure in the columns. The internal failure of the deep mixingcolumns is the failure taking place in the columns due to their low strength [2]. In internalstability, the columns will fail by shearing all at the same time. The stability of the
Current Swedish design method for stabilized ground 12
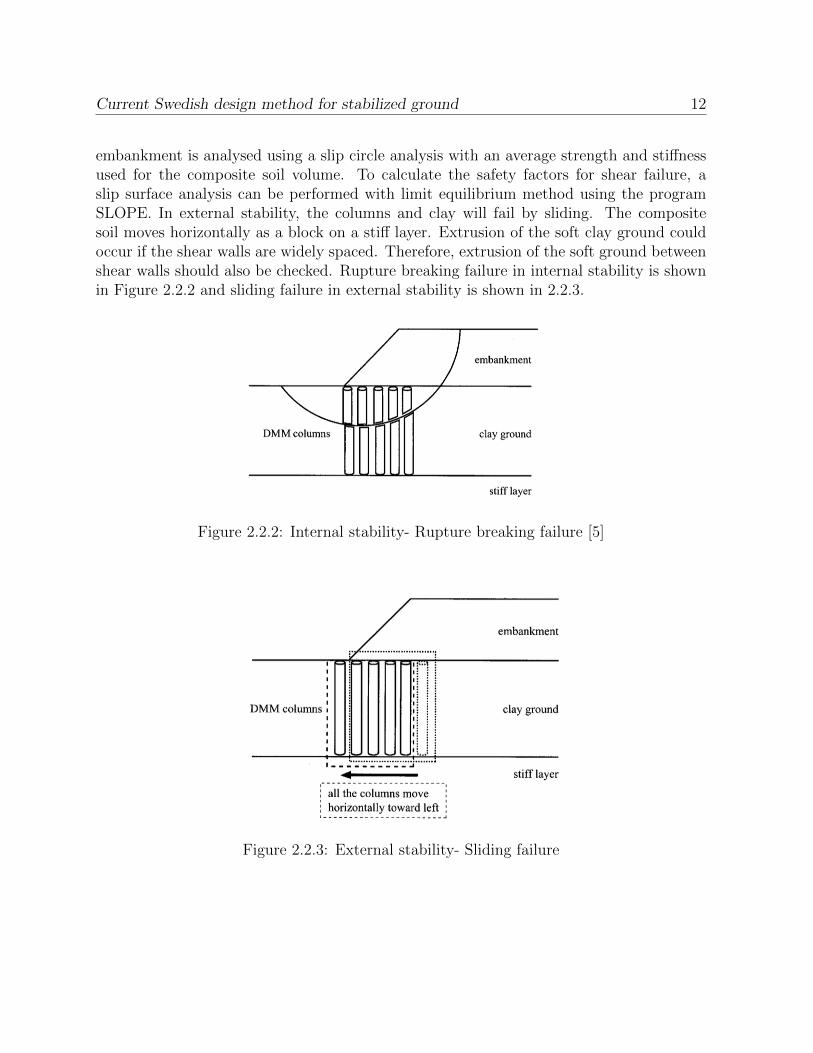
embankment is analysed using a slip circle analysis with an average strength and stiffnessused for the composite soil volume. To calculate the safety factors for shear failure, aslip surface analysis can be performed with limit equilibrium method using the programSLOPE. In external stability, the columns and clay will fail by sliding. The compositesoil moves horizontally as a block on a stiff layer. Extrusion of the soft clay ground couldoccur if the shear walls are widely spaced. Therefore, extrusion of the soft ground betweenshear walls should also be checked. Rupture breaking failure in internal stability is shownin Figure 2.2.2 and sliding failure in external stability is shown in 2.2.3.
Figure 2.2.2: Internal stability- Rupture breaking failure [5]
Figure 2.2.3: External stability- Sliding failure
All failure mechanisms 13
2.2.2 All failure mechanisms
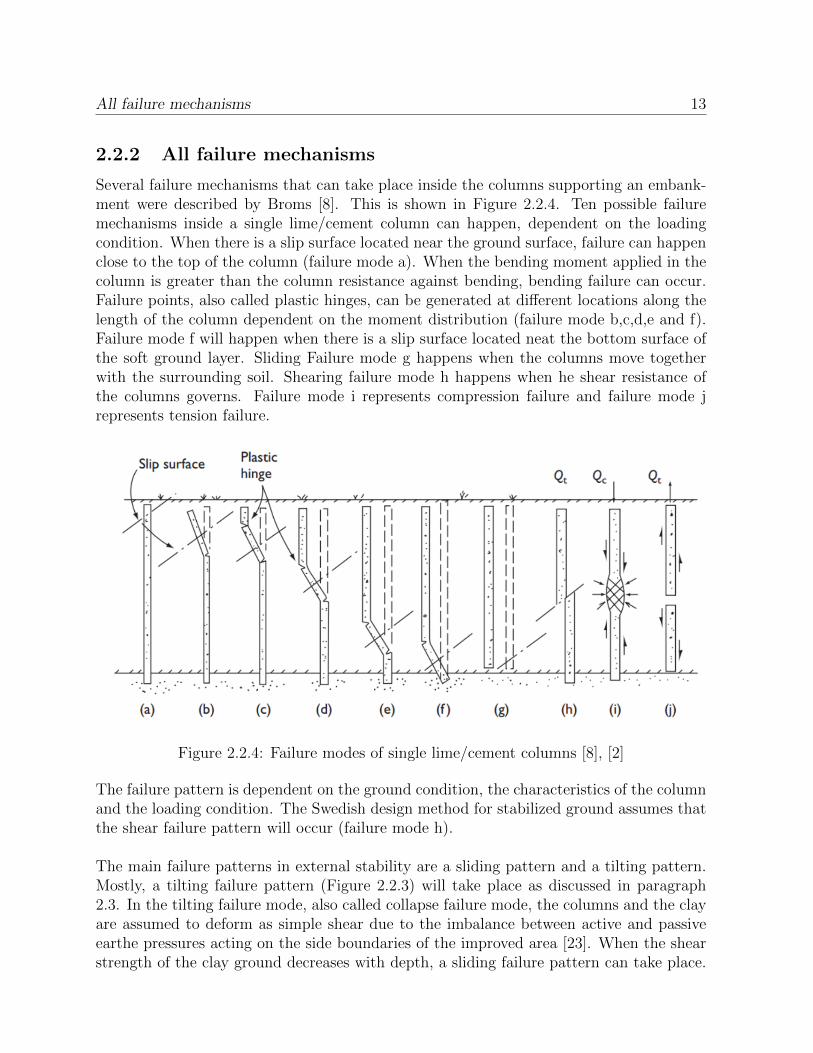
Several failure mechanisms that can take place inside the columns supporting an embank-ment were described by Broms [8]. This is shown in Figure 2.2.4. Ten possible failuremechanisms inside a single lime/cement column can happen, dependent on the loadingcondition. When there is a slip surface located near the ground surface, failure can happenclose to the top of the column (failure mode a). When the bending moment applied in thecolumn is greater than the column resistance against bending, bending failure can occur.Failure points, also called plastic hinges, can be generated at different locations along thelength of the column dependent on the moment distribution (failure mode b,c,d,e and f).Failure mode f will happen when there is a slip surface located neat the bottom surface ofthe soft ground layer. Sliding Failure mode g happens when the columns move togetherwith the surrounding soil. Shearing failure mode h happens when he shear resistance ofthe columns governs. Failure mode i represents compression failure and failure mode jrepresents tension failure.
Figure 2.2.4: Failure modes of single lime/cement columns [8], [2]
The failure pattern is dependent on the ground condition, the characteristics of the columnand the loading condition. The Swedish design method for stabilized ground assumes thatthe shear failure pattern will occur (failure mode h).
The main failure patterns in external stability are a sliding pattern and a tilting pattern.Mostly, a tilting failure pattern (Figure 2.2.3) will take place as discussed in paragraph2.3. In the tilting failure mode, also called collapse failure mode, the columns and the clayare assumed to deform as simple shear due to the imbalance between active and passiveearthe pressures acting on the side boundaries of the improved area [23]. When the shearstrength of the clay ground decreases with depth, a sliding failure pattern can take place.
Research on embankment supported by deep mixing columns 14
A sliding failure pattern can also occur using floating type improved ground. This cases aremore seldom. Although, the Swedish design method for stabilized ground assumes that asliding failure pattern will occur. The current Swedish design method for stabilized groundprovides reasonable failure mechanisms as long as the column strength is a relatively lowvalue where the improved ground is expected to fail by a shear pattern [23], as discussedin paragraph 2.3. However, when the column strength is a relatively high value, where theimproved ground is expected to fail by tilting pattern, the current Swedish design methodfor stabilized ground will overestimate the stability of the embankment [23].
2.3 Research on embankment supported by deep mix-
ing columns
Dry deep mixing columns has been used since the 1970s to support railway or highwayembankments, specifically to increase their stability and to reduce their settlement [4].During 1990s, several research studies focusing on this topic have been performed.Kivelo [29] formulated an analytical model for calculating the stability of embankmentssupported by deep mixing columns. The shear resistance of the columns depends on thelocation along the slip surface, the loading condition and the soil characteristics [28]. Thedifferent failure modes that can occur are based on studies of Broms [8]. The majority ofthe studies about deep mixing columns supporting an embankment are numerical tests orsmall scale model laboratory tests. The results of the most important studies performedabout this topic are summarized as followed.
2.3.1 Numerical analysis
Kitazume et al. [1] performed a series of slip circle analyses and FEM analyses to establishthe failure envelope of each failure pattern [1]. The deformation of the improved ground,as well as the the deep mixing columns were investigated through a FEM analysis.
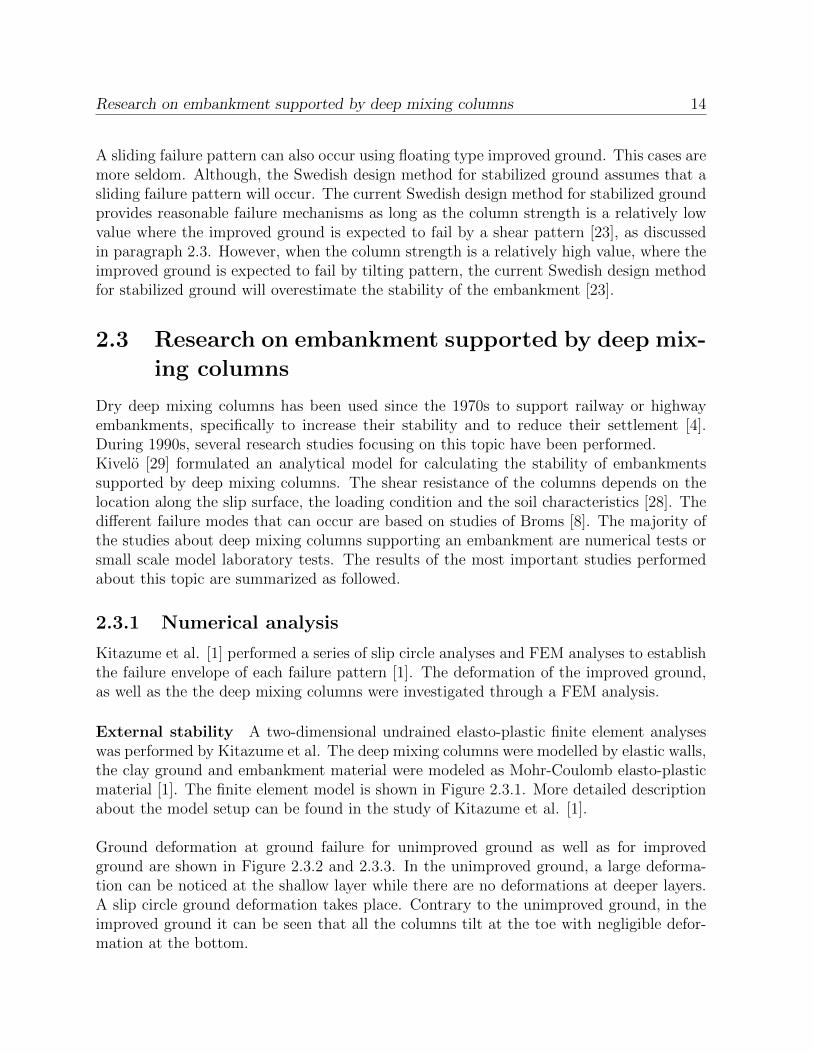
External stability A two-dimensional undrained elasto-plastic finite element analyseswas performed by Kitazume et al. The deep mixing columns were modelled by elastic walls,the clay ground and embankment material were modeled as Mohr-Coulomb elasto-plasticmaterial [1]. The finite element model is shown in Figure 2.3.1. More detailed descriptionabout the model setup can be found in the study of Kitazume et al. [1].
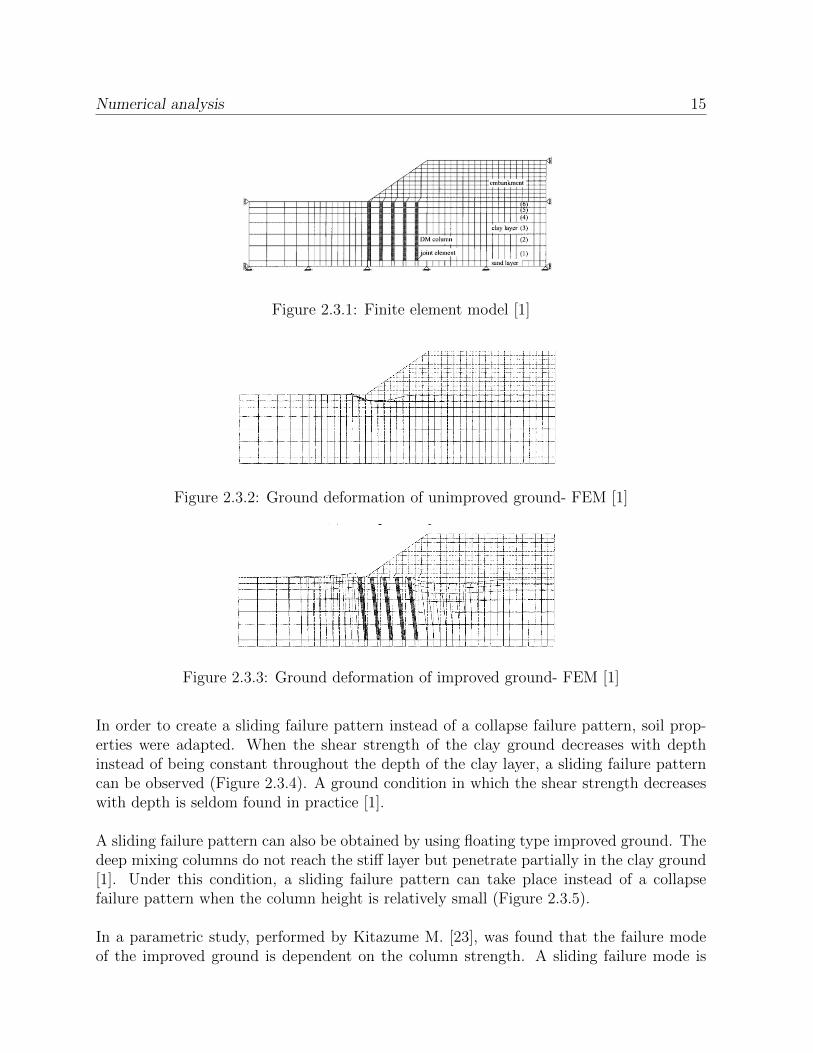
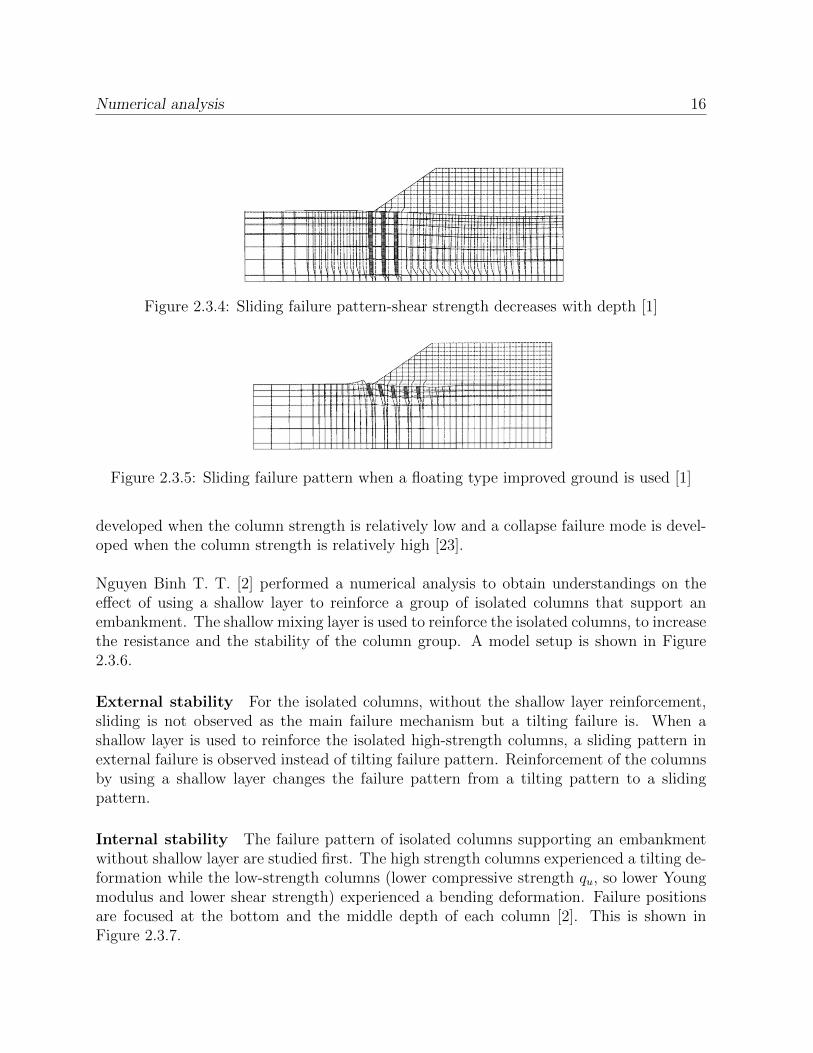
Ground deformation at ground failure for unimproved ground as well as for improvedground are shown in Figure 2.3.2 and 2.3.3. In the unimproved ground, a large deforma-tion can be noticed at the shallow layer while there are no deformations at deeper layers.A slip circle ground deformation takes place. Contrary to the unimproved ground, in theimproved ground it can be seen that all the columns tilt at the toe with negligible defor-mation at the bottom.
Numerical analysis 15
Figure 2.3.1: Finite element model [1]
Figure 2.3.2: Ground deformation of unimproved ground- FEM [1]
Figure 2.3.3: Ground deformation of improved ground- FEM [1]
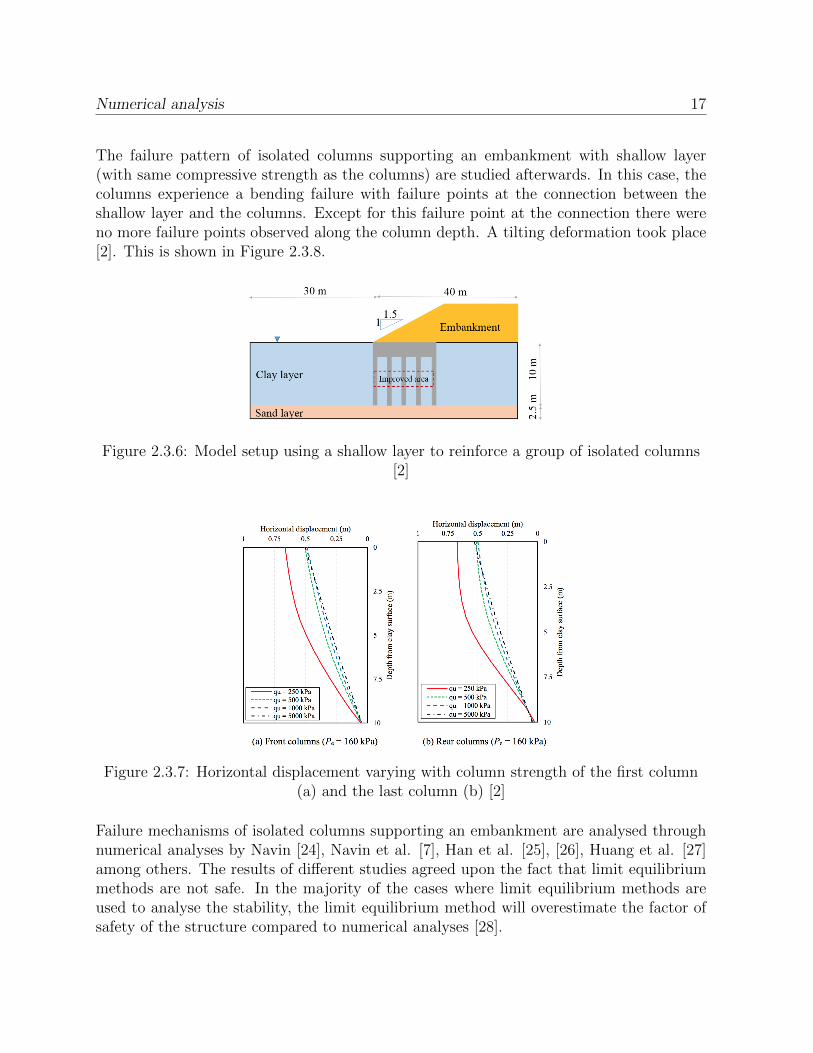
In order to create a sliding failure pattern instead of a collapse failure pattern, soil prop-erties were adapted. When the shear strength of the clay ground decreases with depthinstead of being constant throughout the depth of the clay layer, a sliding failure patterncan be observed (Figure 2.3.4). A ground condition in which the shear strength decreaseswith depth is seldom found in practice [1].
A sliding failure pattern can also be obtained by using floating type improved ground. Thedeep mixing columns do not reach the stiff layer but penetrate partially in the clay ground[1]. Under this condition, a sliding failure pattern can take place instead of a collapsefailure pattern when the column height is relatively small (Figure 2.3.5).
In a parametric study, performed by Kitazume M. [23], was found that the failure modeof the improved ground is dependent on the column strength. A sliding failure mode is
Numerical analysis 16
Figure 2.3.4: Sliding failure pattern-shear strength decreases with depth [1]
Figure 2.3.5: Sliding failure pattern when a floating type improved ground is used [1]
developed when the column strength is relatively low and a collapse failure mode is devel-oped when the column strength is relatively high [23].
Nguyen Binh T. T. [2] performed a numerical analysis to obtain understandings on theeffect of using a shallow layer to reinforce a group of isolated columns that support anembankment. The shallow mixing layer is used to reinforce the isolated columns, to increasethe resistance and the stability of the column group. A model setup is shown in Figure2.3.6.
External stability For the isolated columns, without the shallow layer reinforcement,sliding is not observed as the main failure mechanism but a tilting failure is. When ashallow layer is used to reinforce the isolated high-strength columns, a sliding pattern inexternal failure is observed instead of tilting failure pattern. Reinforcement of the columnsby using a shallow layer changes the failure pattern from a tilting pattern to a slidingpattern.
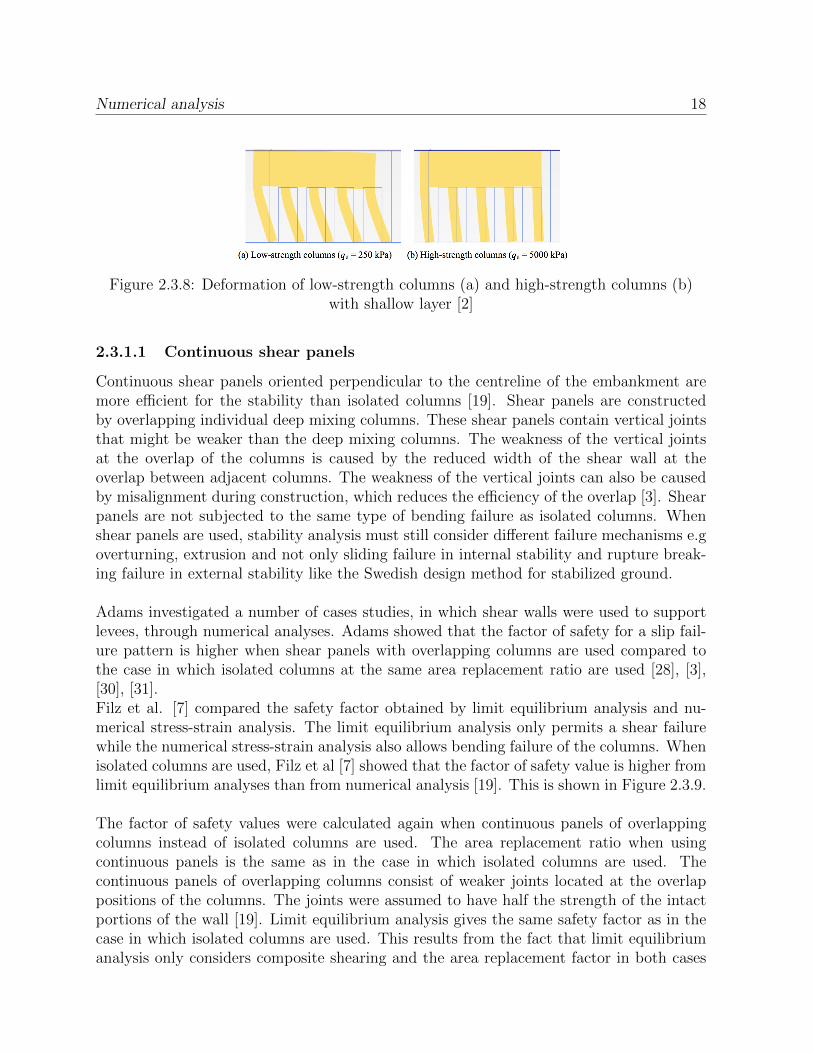
Internal stability The failure pattern of isolated columns supporting an embankmentwithout shallow layer are studied first. The high strength columns experienced a tilting de-formation while the low-strength columns (lower compressive strength qu, so lower Youngmodulus and lower shear strength) experienced a bending deformation. Failure positionsare focused at the bottom and the middle depth of each column [2]. This is shown inFigure 2.3.7.
Numerical analysis 17
The failure pattern of isolated columns supporting an embankment with shallow layer(with same compressive strength as the columns) are studied afterwards. In this case, thecolumns experience a bending failure with failure points at the connection between theshallow layer and the columns. Except for this failure point at the connection there wereno more failure points observed along the column depth. A tilting deformation took place[2]. This is shown in Figure 2.3.8.
Figure 2.3.6: Model setup using a shallow layer to reinforce a group of isolated columns[2]
Figure 2.3.7: Horizontal displacement varying with column strength of the first column(a) and the last column (b) [2]
Failure mechanisms of isolated columns supporting an embankment are analysed throughnumerical analyses by Navin [24], Navin et al. [7], Han et al. [25], [26], Huang et al. [27]among others. The results of different studies agreed upon the fact that limit equilibriummethods are not safe. In the majority of the cases where limit equilibrium methods areused to analyse the stability, the limit equilibrium method will overestimate the factor ofsafety of the structure compared to numerical analyses [28].
Numerical analysis 18
Figure 2.3.8: Deformation of low-strength columns (a) and high-strength columns (b)with shallow layer [2]
2.3.1.1 Continuous shear panels
Continuous shear panels oriented perpendicular to the centreline of the embankment aremore efficient for the stability than isolated columns [19]. Shear panels are constructedby overlapping individual deep mixing columns. These shear panels contain vertical jointsthat might be weaker than the deep mixing columns. The weakness of the vertical jointsat the overlap of the columns is caused by the reduced width of the shear wall at theoverlap between adjacent columns. The weakness of the vertical joints can also be causedby misalignment during construction, which reduces the efficiency of the overlap [3]. Shearpanels are not subjected to the same type of bending failure as isolated columns. Whenshear panels are used, stability analysis must still consider different failure mechanisms e.goverturning, extrusion and not only sliding failure in internal stability and rupture break-ing failure in external stability like the Swedish design method for stabilized ground.
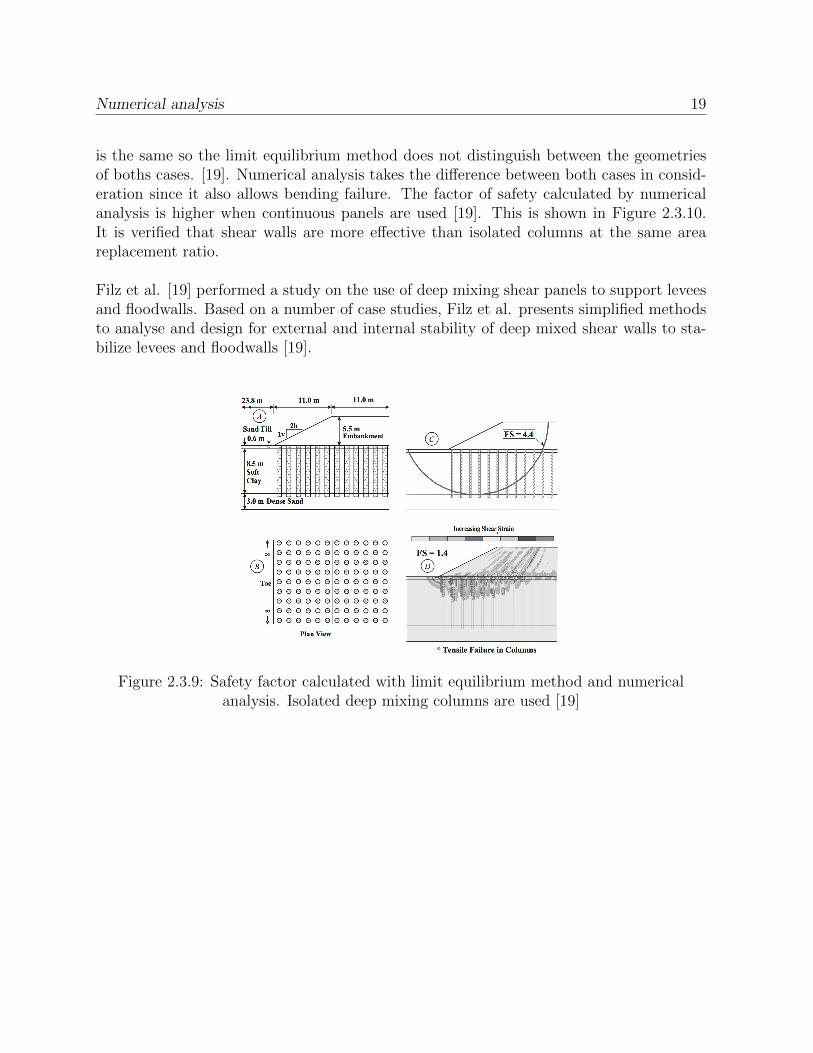
Adams investigated a number of cases studies, in which shear walls were used to supportlevees, through numerical analyses. Adams showed that the factor of safety for a slip fail-ure pattern is higher when shear panels with overlapping columns are used compared tothe case in which isolated columns at the same area replacement ratio are used [28], [3],[30], [31].Filz et al. [7] compared the safety factor obtained by limit equilibrium analysis and nu-merical stress-strain analysis. The limit equilibrium analysis only permits a shear failurewhile the numerical stress-strain analysis also allows bending failure of the columns. Whenisolated columns are used, Filz et al [7] showed that the factor of safety value is higher fromlimit equilibrium analyses than from numerical analysis [19]. This is shown in Figure 2.3.9.
The factor of safety values were calculated again when continuous panels of overlappingcolumns instead of isolated columns are used. The area replacement ratio when usingcontinuous panels is the same as in the case in which isolated columns are used. Thecontinuous panels of overlapping columns consist of weaker joints located at the overlappositions of the columns. The joints were assumed to have half the strength of the intactportions of the wall [19]. Limit equilibrium analysis gives the same safety factor as in thecase in which isolated columns are used. This results from the fact that limit equilibriumanalysis only considers composite shearing and the area replacement factor in both cases
Numerical analysis 19
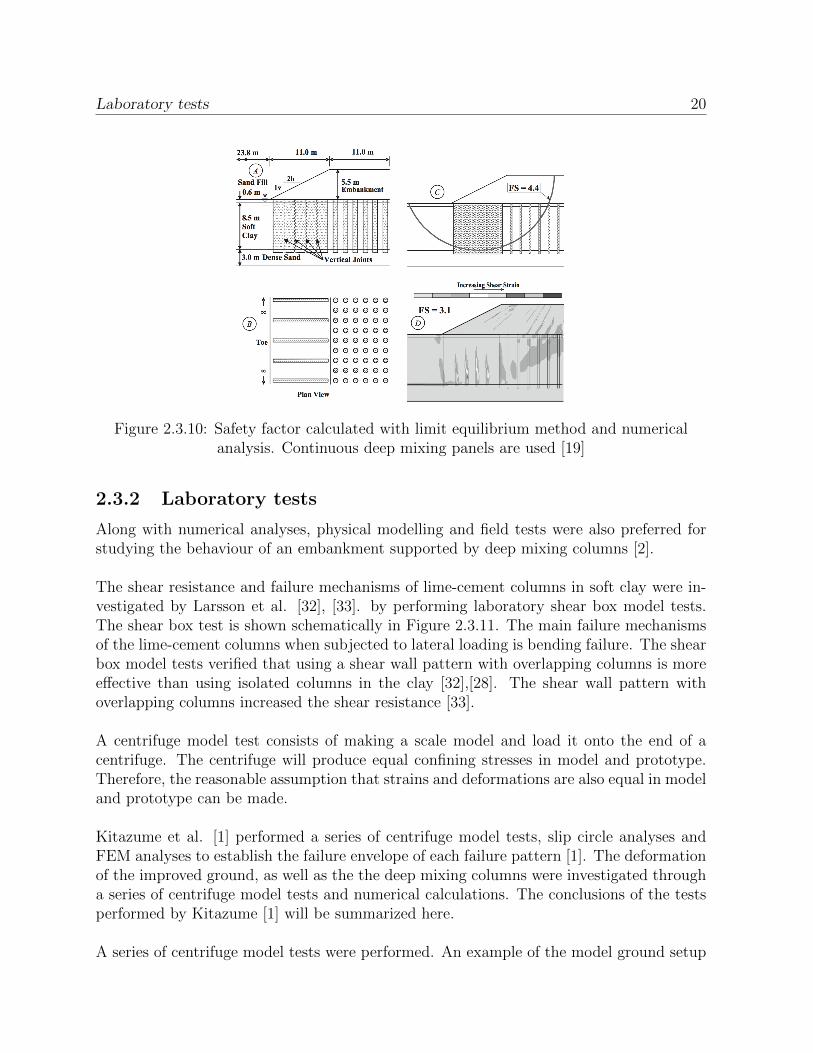
is the same so the limit equilibrium method does not distinguish between the geometriesof boths cases. [19]. Numerical analysis takes the difference between both cases in consid-eration since it also allows bending failure. The factor of safety calculated by numericalanalysis is higher when continuous panels are used [19]. This is shown in Figure 2.3.10.It is verified that shear walls are more effective than isolated columns at the same areareplacement ratio.
Filz et al. [19] performed a study on the use of deep mixing shear panels to support leveesand floodwalls. Based on a number of case studies, Filz et al. presents simplified methodsto analyse and design for external and internal stability of deep mixed shear walls to sta-bilize levees and floodwalls [19].
Figure 2.3.9: Safety factor calculated with limit equilibrium method and numericalanalysis. Isolated deep mixing columns are used [19]
Laboratory tests 20
Figure 2.3.10: Safety factor calculated with limit equilibrium method and numericalanalysis. Continuous deep mixing panels are used [19]
2.3.2 Laboratory tests
Along with numerical analyses, physical modelling and field tests were also preferred forstudying the behaviour of an embankment supported by deep mixing columns [2].
The shear resistance and failure mechanisms of lime-cement columns in soft clay were in-vestigated by Larsson et al. [32], [33]. by performing laboratory shear box model tests.The shear box test is shown schematically in Figure 2.3.11. The main failure mechanismsof the lime-cement columns when subjected to lateral loading is bending failure. The shearbox model tests verified that using a shear wall pattern with overlapping columns is moreeffective than using isolated columns in the clay [32],[28]. The shear wall pattern withoverlapping columns increased the shear resistance [33].
A centrifuge model test consists of making a scale model and load it onto the end of acentrifuge. The centrifuge will produce equal confining stresses in model and prototype.Therefore, the reasonable assumption that strains and deformations are also equal in modeland prototype can be made.
Kitazume et al. [1] performed a series of centrifuge model tests, slip circle analyses andFEM analyses to establish the failure envelope of each failure pattern [1]. The deformationof the improved ground, as well as the the deep mixing columns were investigated througha series of centrifuge model tests and numerical calculations. The conclusions of the testsperformed by Kitazume [1] will be summarized here.
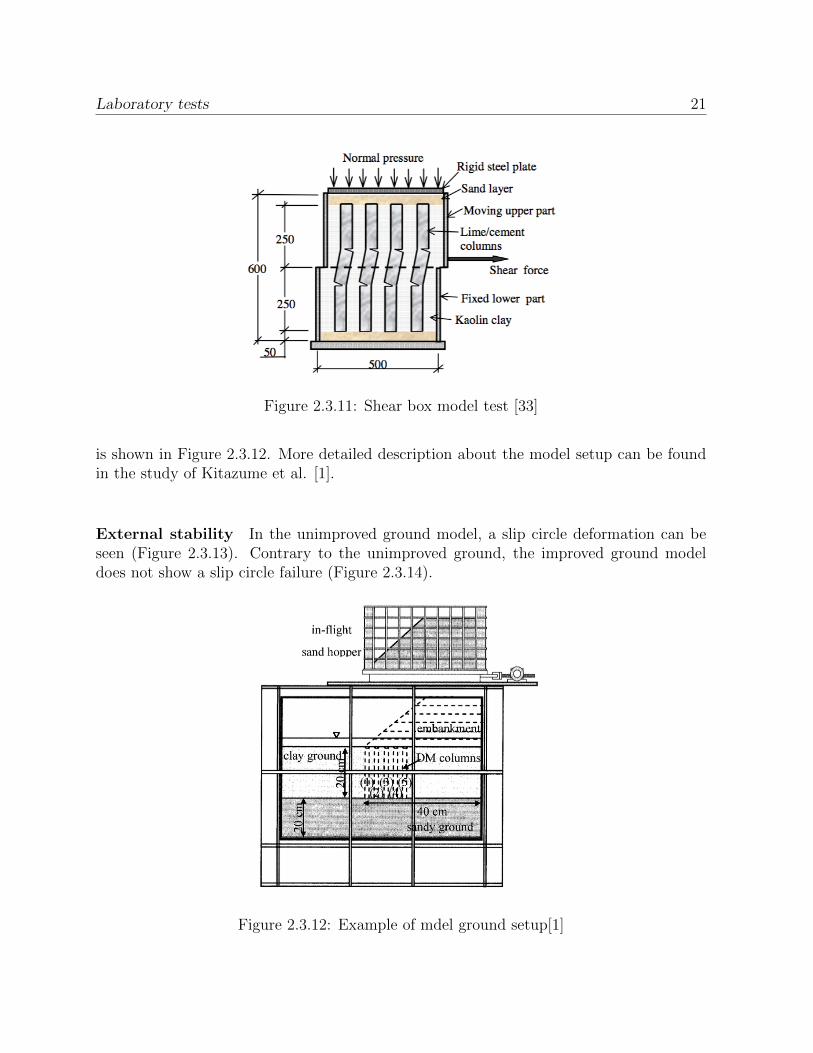
A series of centrifuge model tests were performed. An example of the model ground setup
Laboratory tests 21
Figure 2.3.11: Shear box model test [33]
is shown in Figure 2.3.12. More detailed description about the model setup can be foundin the study of Kitazume et al. [1].
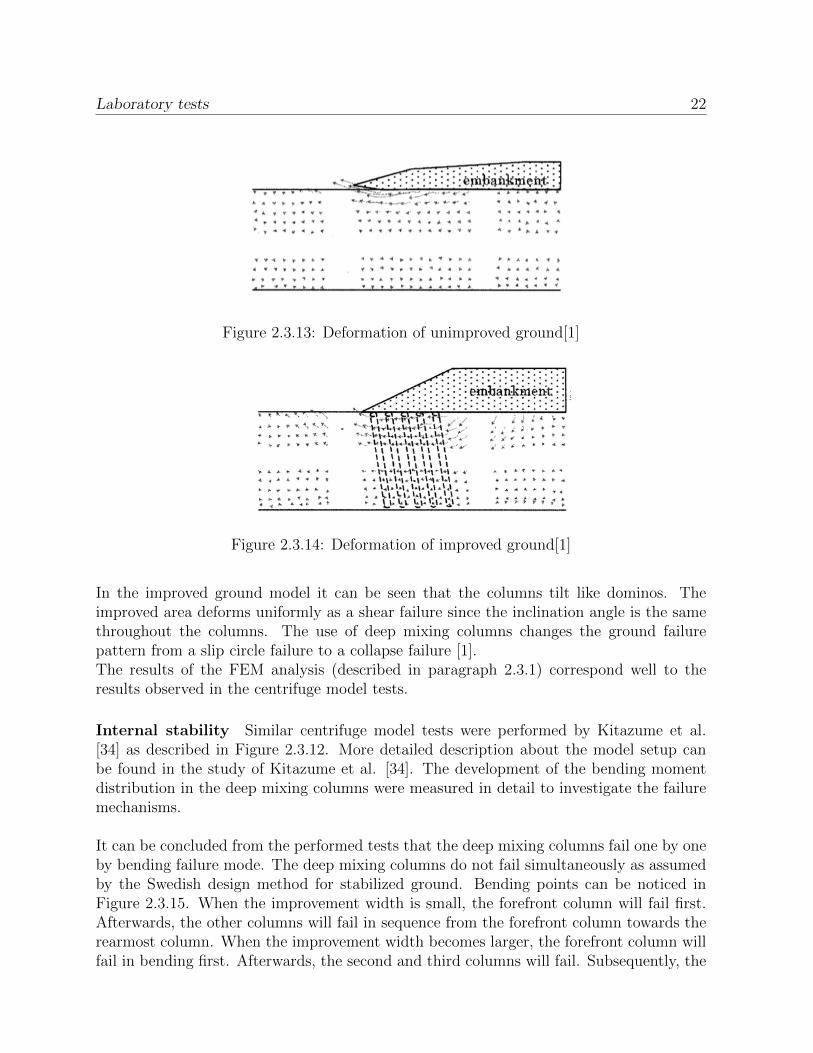
External stability In the unimproved ground model, a slip circle deformation can beseen (Figure 2.3.13). Contrary to the unimproved ground, the improved ground modeldoes not show a slip circle failure (Figure 2.3.14).
Figure 2.3.12: Example of mdel ground setup[1]
Laboratory tests 22
Figure 2.3.13: Deformation of unimproved ground[1]
Figure 2.3.14: Deformation of improved ground[1]
In the improved ground model it can be seen that the columns tilt like dominos. Theimproved area deforms uniformly as a shear failure since the inclination angle is the samethroughout the columns. The use of deep mixing columns changes the ground failurepattern from a slip circle failure to a collapse failure [1].The results of the FEM analysis (described in paragraph 2.3.1) correspond well to theresults observed in the centrifuge model tests.
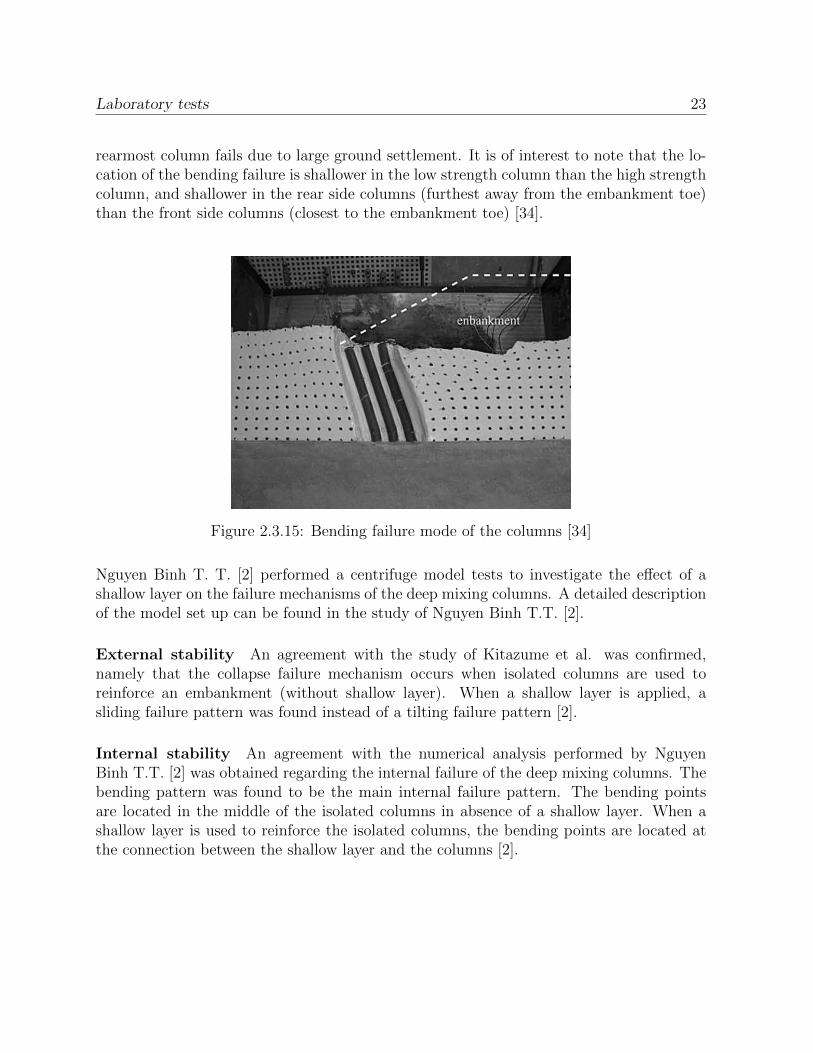
Internal stability Similar centrifuge model tests were performed by Kitazume et al.[34] as described in Figure 2.3.12. More detailed description about the model setup canbe found in the study of Kitazume et al. [34]. The development of the bending momentdistribution in the deep mixing columns were measured in detail to investigate the failuremechanisms.
It can be concluded from the performed tests that the deep mixing columns fail one by oneby bending failure mode. The deep mixing columns do not fail simultaneously as assumedby the Swedish design method for stabilized ground. Bending points can be noticed inFigure 2.3.15. When the improvement width is small, the forefront column will fail first.Afterwards, the other columns will fail in sequence from the forefront column towards therearmost column. When the improvement width becomes larger, the forefront column willfail in bending first. Afterwards, the second and third columns will fail. Subsequently, the
Laboratory tests 23
rearmost column fails due to large ground settlement. It is of interest to note that the lo-cation of the bending failure is shallower in the low strength column than the high strengthcolumn, and shallower in the rear side columns (furthest away from the embankment toe)than the front side columns (closest to the embankment toe) [34].
Figure 2.3.15: Bending failure mode of the columns [34]
Nguyen Binh T. T. [2] performed a centrifuge model tests to investigate the effect of ashallow layer on the failure mechanisms of the deep mixing columns. A detailed descriptionof the model set up can be found in the study of Nguyen Binh T.T. [2].
External stability An agreement with the study of Kitazume et al. was confirmed,namely that the collapse failure mechanism occurs when isolated columns are used toreinforce an embankment (without shallow layer). When a shallow layer is applied, asliding failure pattern was found instead of a tilting failure pattern [2].
Internal stability An agreement with the numerical analysis performed by NguyenBinh T.T. [2] was obtained regarding the internal failure of the deep mixing columns. Thebending pattern was found to be the main internal failure pattern. The bending pointsare located in the middle of the isolated columns in absence of a shallow layer. When ashallow layer is used to reinforce the isolated columns, the bending points are located atthe connection between the shallow layer and the columns [2].
Research on excavation supported with rows of dry deep mixing columns 24
2.4 Research on excavation supported with rows of
dry deep mixing columns
As mentioned in paragraph 2.1.3, the main applications of deep mixing columns in Swedenare the support of railway and roadway embankments as well as the excavation support.Since, this study will deal with deep mixing columns supporting embankments, two im-portant research studies on excavation supported with rows of dry deep mixing columnsare described briefly.
Yang et al. [35] investigated by numerical analyses the behaviour of an embedded im-proved soil raft. An embedded improved soil raft (a raft of overlapping short columns) isconstructed by using soil cement columns that form a continuously improved compositeground [28]. During excavation, the columns are loaded laterally by the inward-moving re-taining wall. Thus,the mobilised mass properties in lateral direction are important for thedesign [35]. Yang et al. examined the mechanisms of how mass properties of the improvedare mobilized and their relation to the elemental properties, the variation of propertieswithin a column and the geometrical arrangement of the columns [35]. The analysis andthe simulation of a case study showed that soil-cement columns used for supporting exca-vations should be constructed with overlap rather than just in contact with each other [28].
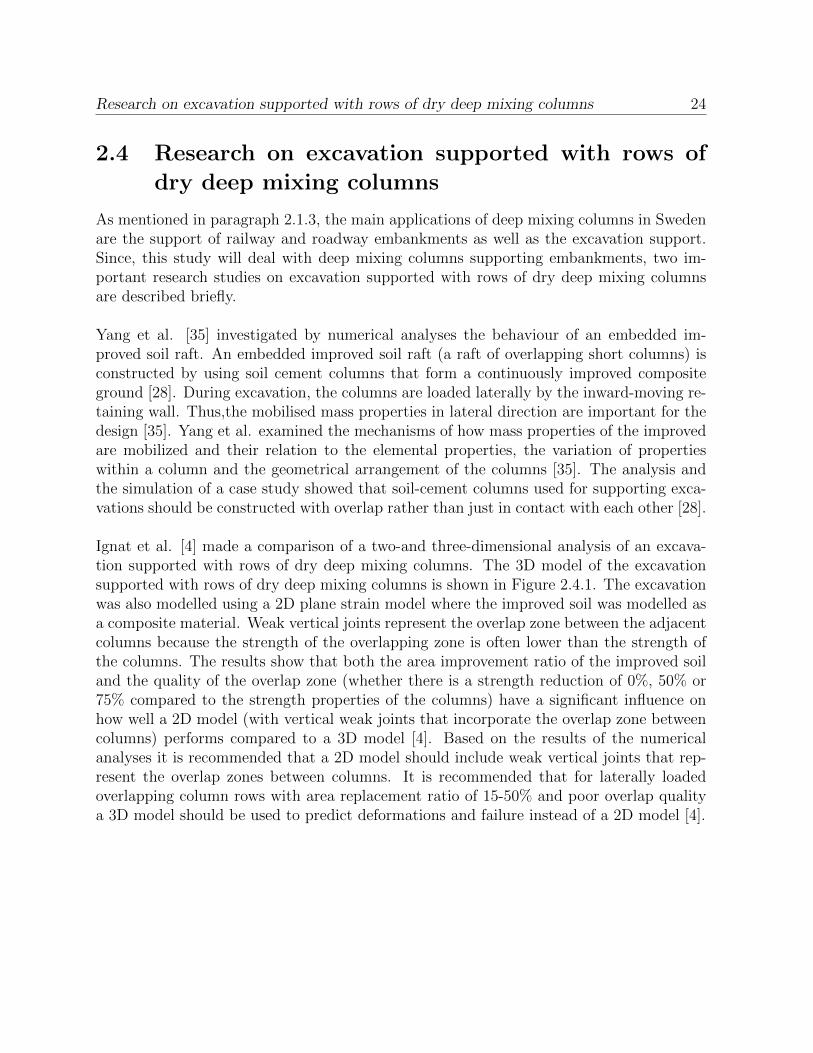
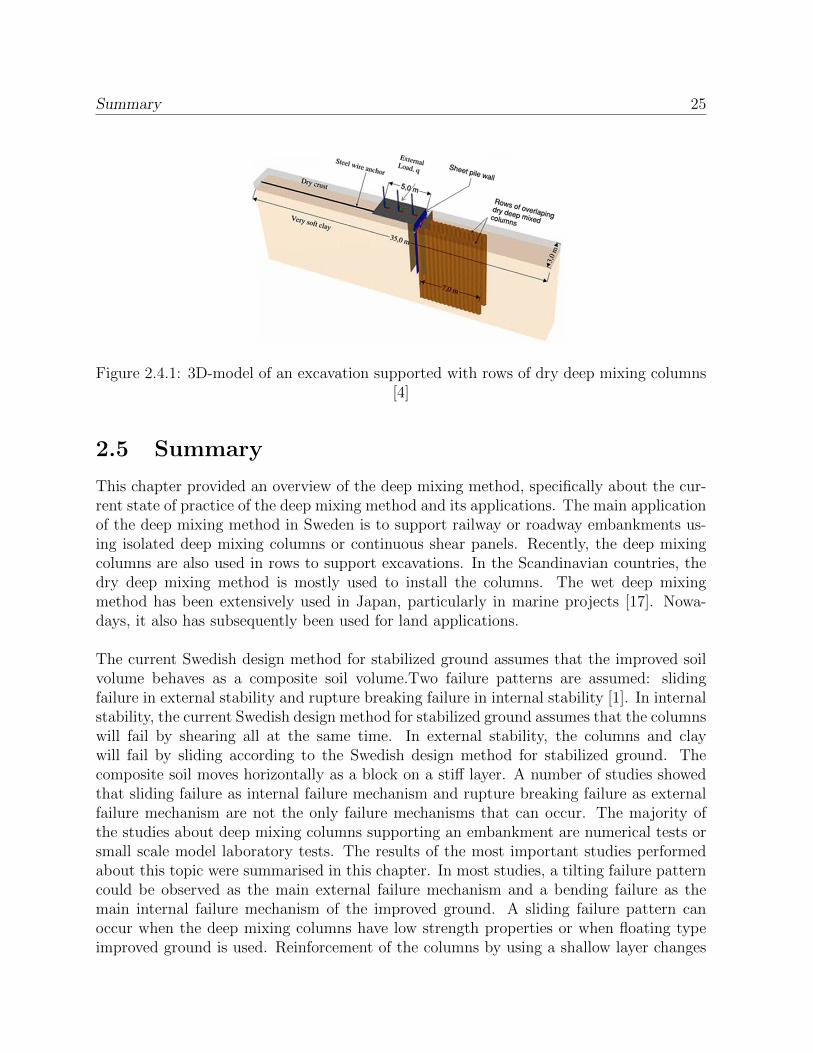
Ignat et al. [4] made a comparison of a two-and three-dimensional analysis of an excava-tion supported with rows of dry deep mixing columns. The 3D model of the excavationsupported with rows of dry deep mixing columns is shown in Figure 2.4.1. The excavationwas also modelled using a 2D plane strain model where the improved soil was modelled asa composite material. Weak vertical joints represent the overlap zone between the adjacentcolumns because the strength of the overlapping zone is often lower than the strength ofthe columns. The results show that both the area improvement ratio of the improved soiland the quality of the overlap zone (whether there is a strength reduction of 0%, 50% or75% compared to the strength properties of the columns) have a significant influence onhow well a 2D model (with vertical weak joints that incorporate the overlap zone betweencolumns) performs compared to a 3D model [4]. Based on the results of the numericalanalyses it is recommended that a 2D model should include weak vertical joints that rep-resent the overlap zones between columns. It is recommended that for laterally loadedoverlapping column rows with area replacement ratio of 15-50% and poor overlap qualitya 3D model should be used to predict deformations and failure instead of a 2D model [4].
Summary 25
Figure 2.4.1: 3D-model of an excavation supported with rows of dry deep mixing columns[4]
2.5 Summary
This chapter provided an overview of the deep mixing method, specifically about the cur-rent state of practice of the deep mixing method and its applications. The main applicationof the deep mixing method in Sweden is to support railway or roadway embankments us-ing isolated deep mixing columns or continuous shear panels. Recently, the deep mixingcolumns are also used in rows to support excavations. In the Scandinavian countries, thedry deep mixing method is mostly used to install the columns. The wet deep mixingmethod has been extensively used in Japan, particularly in marine projects [17]. Nowa-days, it also has subsequently been used for land applications.
The current Swedish design method for stabilized ground assumes that the improved soilvolume behaves as a composite soil volume.Two failure patterns are assumed: slidingfailure in external stability and rupture breaking failure in internal stability [1]. In internalstability, the current Swedish design method for stabilized ground assumes that the columnswill fail by shearing all at the same time. In external stability, the columns and claywill fail by sliding according to the Swedish design method for stabilized ground. Thecomposite soil moves horizontally as a block on a stiff layer. A number of studies showedthat sliding failure as internal failure mechanism and rupture breaking failure as externalfailure mechanism are not the only failure mechanisms that can occur. The majority ofthe studies about deep mixing columns supporting an embankment are numerical tests orsmall scale model laboratory tests. The results of the most important studies performedabout this topic were summarised in this chapter. In most studies, a tilting failure patterncould be observed as the main external failure mechanism and a bending failure as themain internal failure mechanism of the improved ground. A sliding failure pattern canoccur when the deep mixing columns have low strength properties or when floating typeimproved ground is used. Reinforcement of the columns by using a shallow layer changes
Summary 26
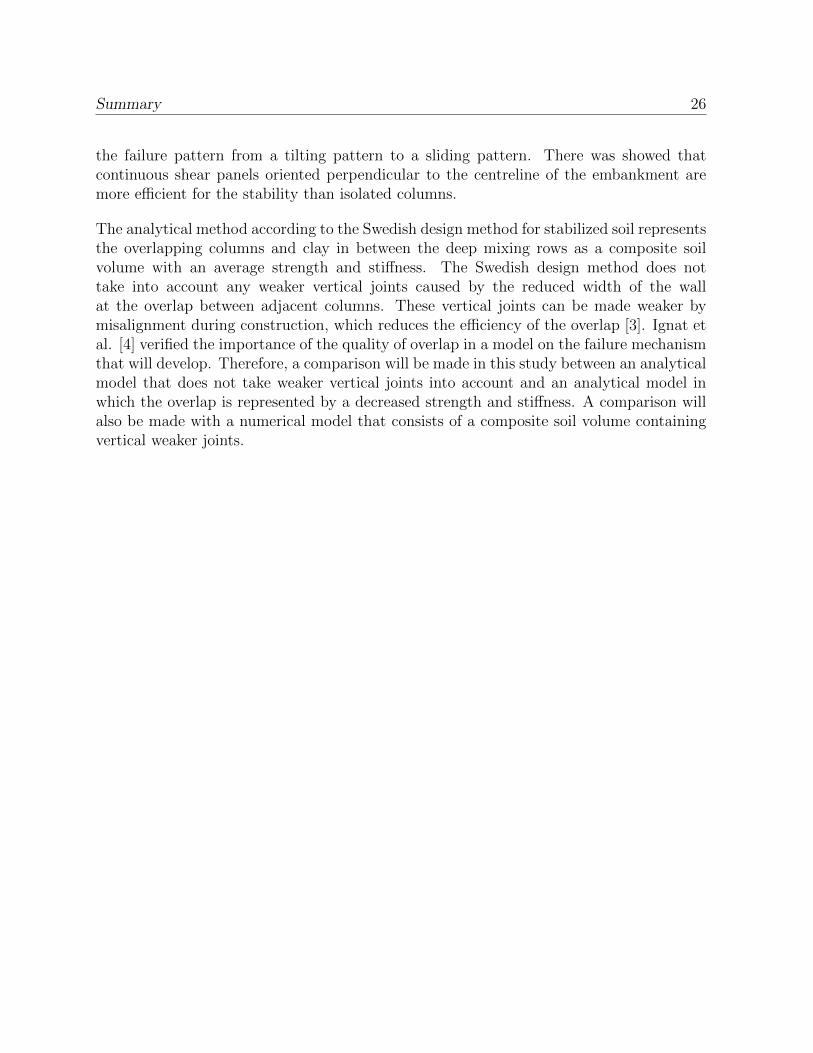
the failure pattern from a tilting pattern to a sliding pattern. There was showed thatcontinuous shear panels oriented perpendicular to the centreline of the embankment aremore efficient for the stability than isolated columns.
The analytical method according to the Swedish design method for stabilized soil representsthe overlapping columns and clay in between the deep mixing rows as a composite soilvolume with an average strength and stiffness. The Swedish design method does nottake into account any weaker vertical joints caused by the reduced width of the wallat the overlap between adjacent columns. These vertical joints can be made weaker bymisalignment during construction, which reduces the efficiency of the overlap [3]. Ignat etal. [4] verified the importance of the quality of overlap in a model on the failure mechanismthat will develop. Therefore, a comparison will be made in this study between an analyticalmodel that does not take weaker vertical joints into account and an analytical model inwhich the overlap is represented by a decreased strength and stiffness. A comparison willalso be made with a numerical model that consists of a composite soil volume containingvertical weaker joints.
Chapter 3
General methodology
In this study, following steps will be performed.
• Analytical model: Extrusion of soft ground between shear walls.An analytical method to obtain safety factors for extrusion of clay between the shearpanels is made. The safety factors are calculated.
• Analytical model: Internal stability- No reduction of strength and stiffness in theoverlap zones.An analytical solution is obtained by following the Swedish design code for stabilizedground. This does not take any reduction of strength and stiffness into account atthe overlap between adjacent columns. Safety factors for shear failure are calculatedwith limit equilibrium method using program SLOPE.
• Analytical model: Internal stability- Reduction of strength and stiffness of 75% and50% in the overlap zones.An analytical method to obtain safety factors for shear failure is made, taking intoaccount the reduced strength and stiffness at the overlap between adjacent columns.Safety factors for shear failure are calculated with limit equilibrium method usingprogram SLOPE.
• Numerical model.A numerical 2D plane strain model is made to calculate the safety factors for internalstability and to see which failure mechanism will develop.
• Sensitivity analysis.The influence of the strength and stiffness in the overlap zones on the failure mech-anisms obtained are discussed.
This study is not based on any specific site condition, so a typical ground condition is chosenfrom literature with the care of choosing suitable parameters for the size and dimension ofthe model ground, deep mixing columns, embankment etc. as well as the soil properties.
27
Geometrical model 28
The properties used for both the analytical model and the numerical model are representedin this chapter.
3.1 Geometrical model
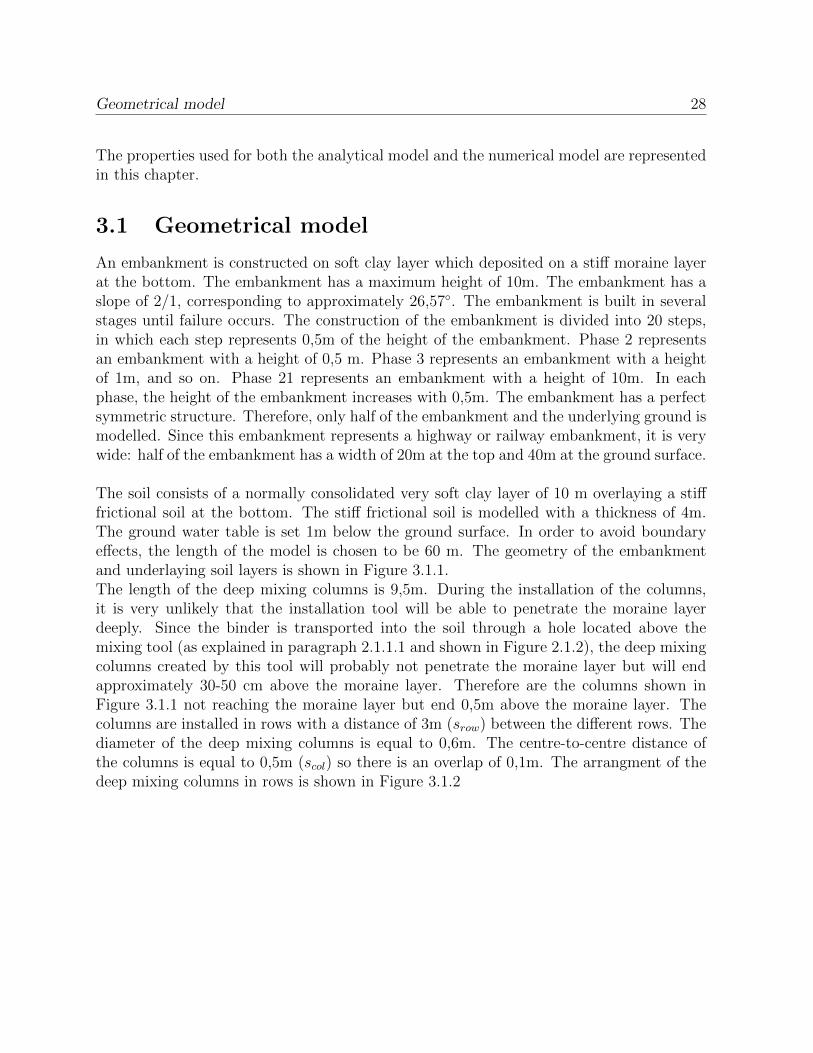
An embankment is constructed on soft clay layer which deposited on a stiff moraine layerat the bottom. The embankment has a maximum height of 10m. The embankment has aslope of 2/1, corresponding to approximately 26,57◦. The embankment is built in severalstages until failure occurs. The construction of the embankment is divided into 20 steps,in which each step represents 0,5m of the height of the embankment. Phase 2 representsan embankment with a height of 0,5 m. Phase 3 represents an embankment with a heightof 1m, and so on. Phase 21 represents an embankment with a height of 10m. In eachphase, the height of the embankment increases with 0,5m. The embankment has a perfectsymmetric structure. Therefore, only half of the embankment and the underlying ground ismodelled. Since this embankment represents a highway or railway embankment, it is verywide: half of the embankment has a width of 20m at the top and 40m at the ground surface.
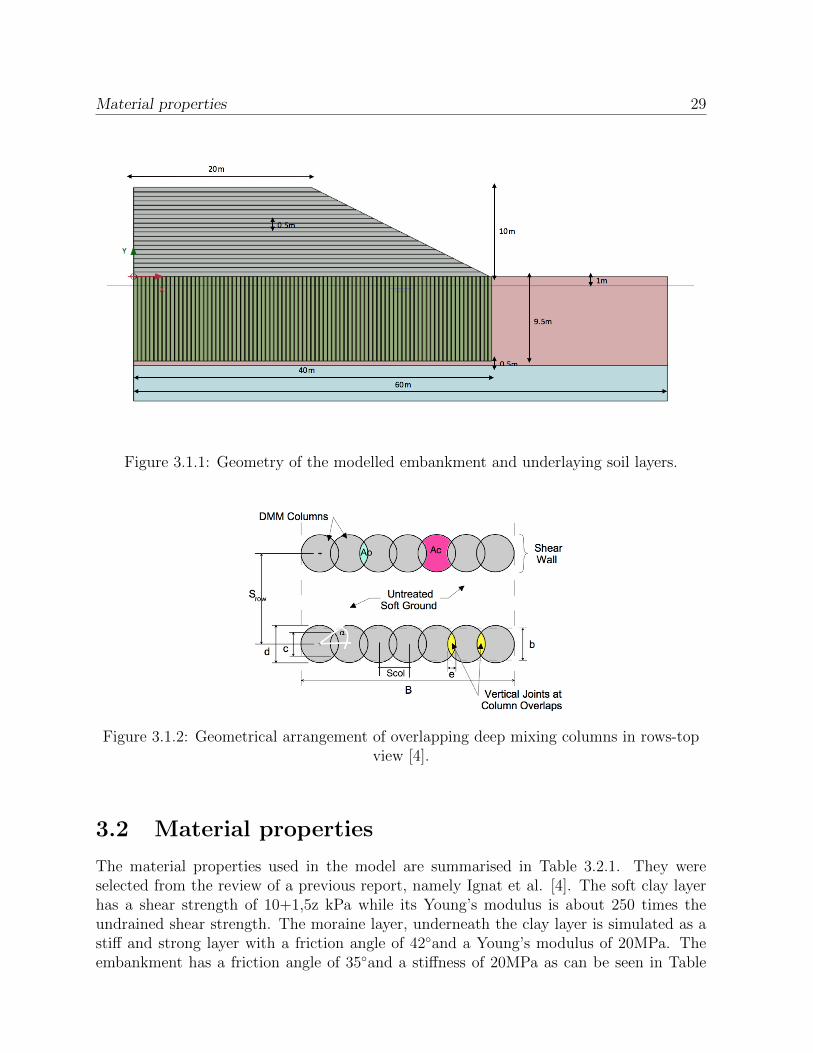
The soil consists of a normally consolidated very soft clay layer of 10 m overlaying a stifffrictional soil at the bottom. The stiff frictional soil is modelled with a thickness of 4m.The ground water table is set 1m below the ground surface. In order to avoid boundaryeffects, the length of the model is chosen to be 60 m. The geometry of the embankmentand underlaying soil layers is shown in Figure 3.1.1.The length of the deep mixing columns is 9,5m. During the installation of the columns,it is very unlikely that the installation tool will be able to penetrate the moraine layerdeeply. Since the binder is transported into the soil through a hole located above themixing tool (as explained in paragraph 2.1.1.1 and shown in Figure 2.1.2), the deep mixingcolumns created by this tool will probably not penetrate the moraine layer but will endapproximately 30-50 cm above the moraine layer. Therefore are the columns shown inFigure 3.1.1 not reaching the moraine layer but end 0,5m above the moraine layer. Thecolumns are installed in rows with a distance of 3m (srow) between the different rows. Thediameter of the deep mixing columns is equal to 0,6m. The centre-to-centre distance ofthe columns is equal to 0,5m (scol) so there is an overlap of 0,1m. The arrangment of thedeep mixing columns in rows is shown in Figure 3.1.2
Material properties 29
Figure 3.1.1: Geometry of the modelled embankment and underlaying soil layers.
Figure 3.1.2: Geometrical arrangement of overlapping deep mixing columns in rows-topview [4].
3.2 Material properties
The material properties used in the model are summarised in Table 3.2.1. They wereselected from the review of a previous report, namely Ignat et al. [4]. The soft clay layerhas a shear strength of 10+1,5z kPa while its Young’s modulus is about 250 times theundrained shear strength. The moraine layer, underneath the clay layer is simulated as astiff and strong layer with a friction angle of 42◦and a Young’s modulus of 20MPa. Theembankment has a friction angle of 35◦and a stiffness of 20MPa as can be seen in Table
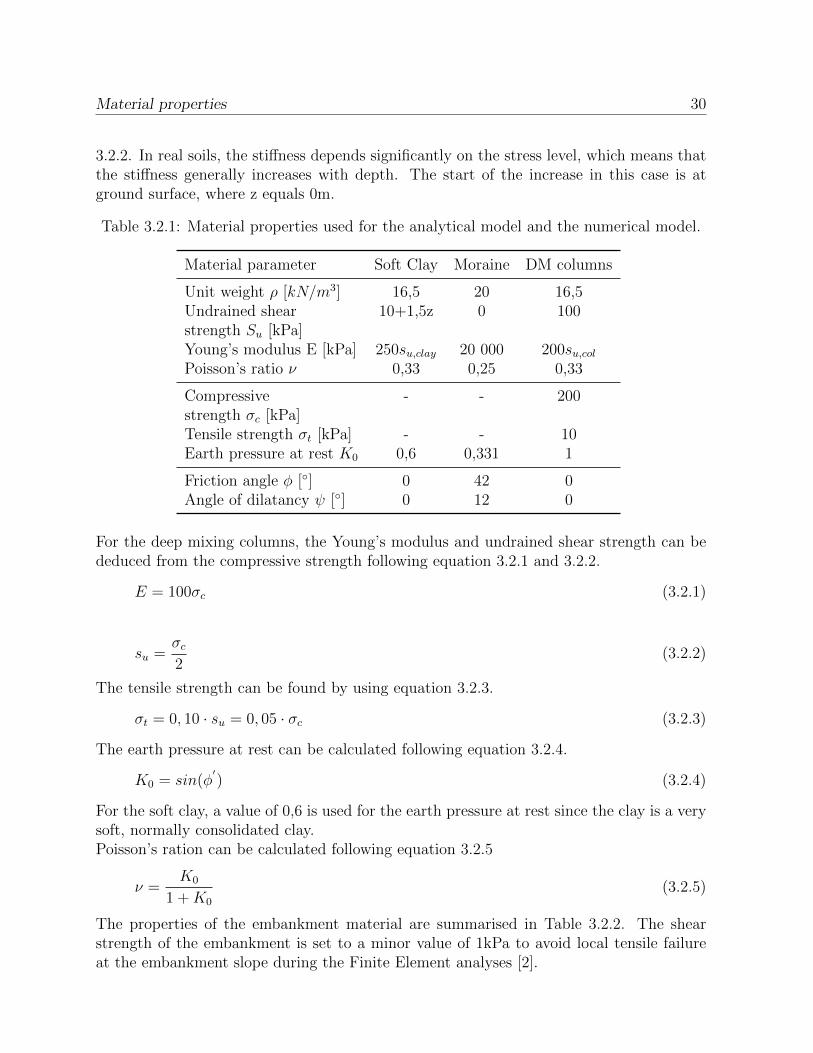
Material properties 30
3.2.2. In real soils, the stiffness depends significantly on the stress level, which means thatthe stiffness generally increases with depth. The start of the increase in this case is atground surface, where z equals 0m.
Table 3.2.1: Material properties used for the analytical model and the numerical model.
Material parameter Soft Clay Moraine DM columns
Unit weight ρ [kN/m3] 16,5 20 16,5Undrained shear 10+1,5z 0 100strength Su [kPa]Young’s modulus E [kPa] 250su,clay 20 000 200su,colPoisson’s ratio ν 0,33 0,25 0,33
Compressive - - 200strength σc [kPa]Tensile strength σt [kPa] - - 10Earth pressure at rest K0 0,6 0,331 1
Friction angle φ [◦] 0 42 0Angle of dilatancy ψ [◦] 0 12 0
For the deep mixing columns, the Young’s modulus and undrained shear strength can bededuced from the compressive strength following equation 3.2.1 and 3.2.2.
E = 100σc (3.2.1)
su =σc2
(3.2.2)
The tensile strength can be found by using equation 3.2.3.
σt = 0, 10 · su = 0, 05 · σc (3.2.3)
The earth pressure at rest can be calculated following equation 3.2.4.
K0 = sin(φ′) (3.2.4)
For the soft clay, a value of 0,6 is used for the earth pressure at rest since the clay is a verysoft, normally consolidated clay.Poisson’s ration can be calculated following equation 3.2.5
ν =K0
1 +K0
(3.2.5)
The properties of the embankment material are summarised in Table 3.2.2. The shearstrength of the embankment is set to a minor value of 1kPa to avoid local tensile failureat the embankment slope during the Finite Element analyses [2].
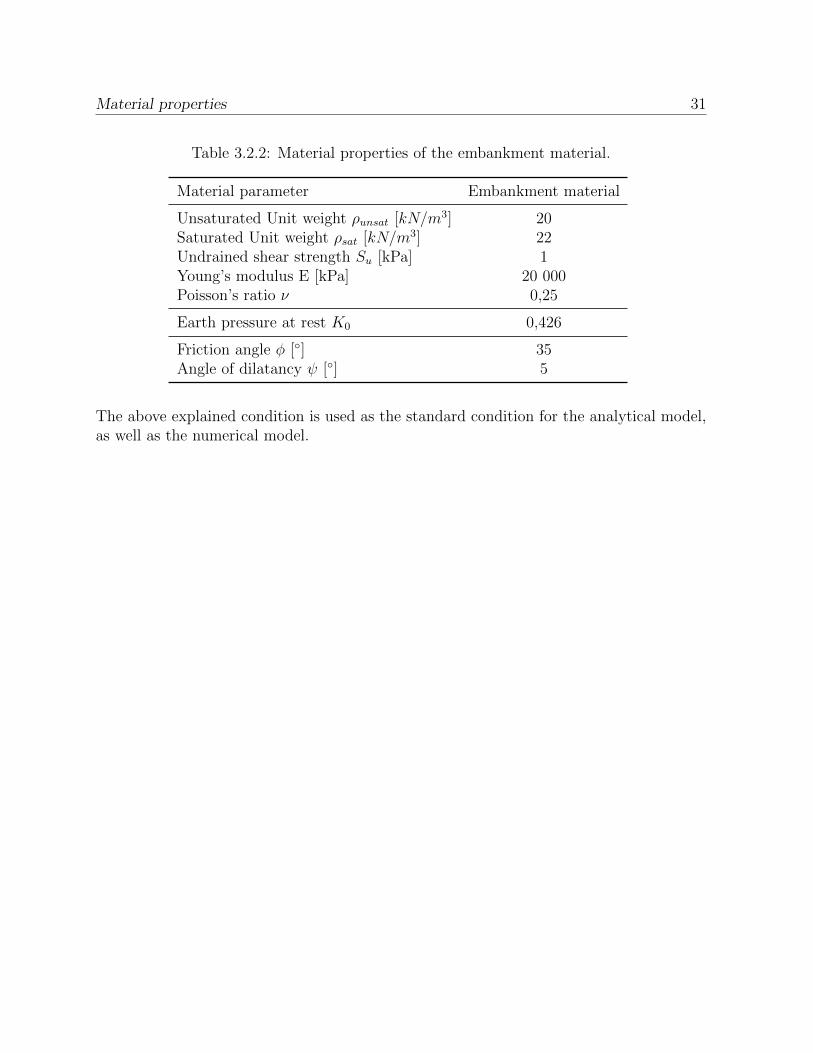
Material properties 31
Table 3.2.2: Material properties of the embankment material.
Material parameter Embankment material
Unsaturated Unit weight ρunsat [kN/m3] 20Saturated Unit weight ρsat [kN/m3] 22Undrained shear strength Su [kPa] 1Young’s modulus E [kPa] 20 000Poisson’s ratio ν 0,25
Earth pressure at rest K0 0,426
Friction angle φ [◦] 35Angle of dilatancy ψ [◦] 5
The above explained condition is used as the standard condition for the analytical model,as well as the numerical model.
Chapter 4
Analytical calculations
In this chapter, first the safety factors for extrusion of soft ground between shear panels arecalculated in sequencing construction stages. The safety factors are calculated for differentdistances between the rows of deep mixing columns. In this way, you can determine theminimum distance srow that has to be present. The method to obtain this analyticalsolution will be described here, as well as the obtained results.
Afterwards, a safety analysis of an embankment supported by panels of overlapping deepmixing columns according to the Swedish design method for stabilized ground [9], [10]will be performed. According to the Swedish design method for stabilized ground withdeep mixing columns, the overlapping columns and the clay in between the deep mixingrows is represented as a composite soil volume with average strength and stiffness. Shearwalls constructed by overlapping individual deep mixing columns contain vertical jointscaused by the reduced width of the wall at the overlap between adjacent columns. Thesevertical joints can be made weaker by misalignment during construction, which reduces theefficiency of the overlap [3]. The analytical model according to the Swedish design codefor stabilized ground does not take these extra weakness in the vertical joints into account.Therefore, an analytical method that does take the reduced strength and stiffness in theoverlap between adjacent columns into account is made. The average shear strength of thecomposite soil volume will have a lower shear strength because of an assumed reduction of50% or 75% of strength and stiffness in the overlap between adjacent columns.
4.1 Extrusion of soft ground between shear walls
Extrusion of the soft clay ground could occur if the shear walls are widely spaced. Thesafety factors for extrusion of soft ground between shear panels are calculated in sequenc-ing construction stages in this paragraph. The safety factors are calculated for differentdistances between the rows of deep mixing columns. In this way, you can determine theminimum distance srow that has to be present.
32
Extrusion of soft ground between shear walls 33
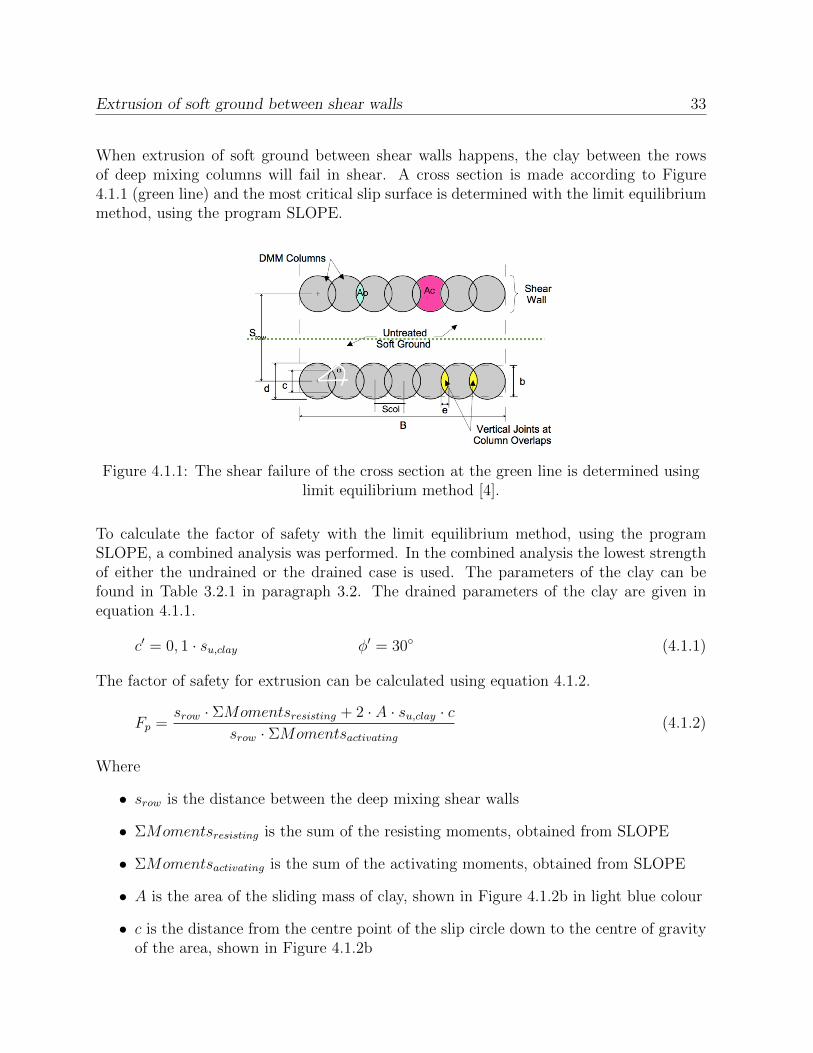
When extrusion of soft ground between shear walls happens, the clay between the rowsof deep mixing columns will fail in shear. A cross section is made according to Figure4.1.1 (green line) and the most critical slip surface is determined with the limit equilibriummethod, using the program SLOPE.
Figure 4.1.1: The shear failure of the cross section at the green line is determined usinglimit equilibrium method [4].
To calculate the factor of safety with the limit equilibrium method, using the programSLOPE, a combined analysis was performed. In the combined analysis the lowest strengthof either the undrained or the drained case is used. The parameters of the clay can befound in Table 3.2.1 in paragraph 3.2. The drained parameters of the clay are given inequation 4.1.1.
c′ = 0, 1 · su,clay φ′ = 30◦ (4.1.1)
The factor of safety for extrusion can be calculated using equation 4.1.2.
Fp =srow · ΣMomentsresisting + 2 · A · su,clay · c
srow · ΣMomentsactivating(4.1.2)
Where
• srow is the distance between the deep mixing shear walls
• ΣMomentsresisting is the sum of the resisting moments, obtained from SLOPE
• ΣMomentsactivating is the sum of the activating moments, obtained from SLOPE
• A is the area of the sliding mass of clay, shown in Figure 4.1.2b in light blue colour
• c is the distance from the centre point of the slip circle down to the centre of gravityof the area, shown in Figure 4.1.2b
Extrusion of soft ground between shear walls 34
• su,clay is the undrained shear strength of the clay
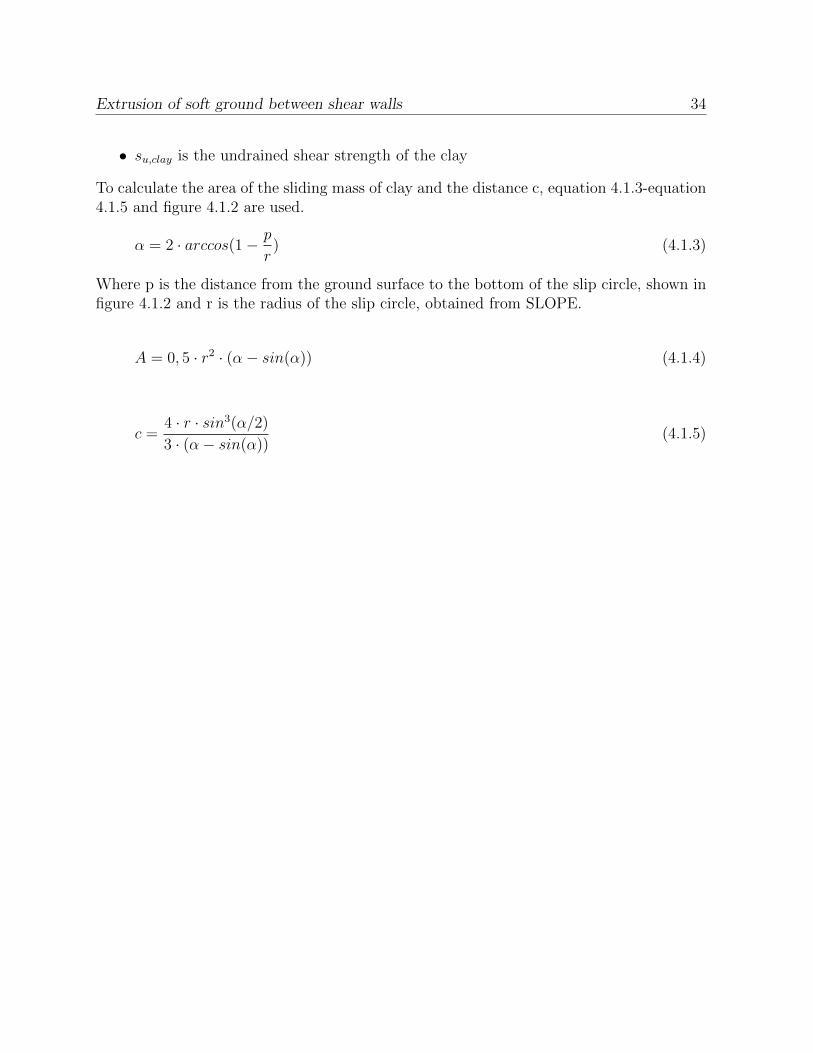
To calculate the area of the sliding mass of clay and the distance c, equation 4.1.3-equation4.1.5 and figure 4.1.2 are used.
α = 2 · arccos(1 − p
r) (4.1.3)
Where p is the distance from the ground surface to the bottom of the slip circle, shown infigure 4.1.2 and r is the radius of the slip circle, obtained from SLOPE.
A = 0, 5 · r2 · (α− sin(α)) (4.1.4)
c =4 · r · sin3(α/2)
3 · (α− sin(α))(4.1.5)
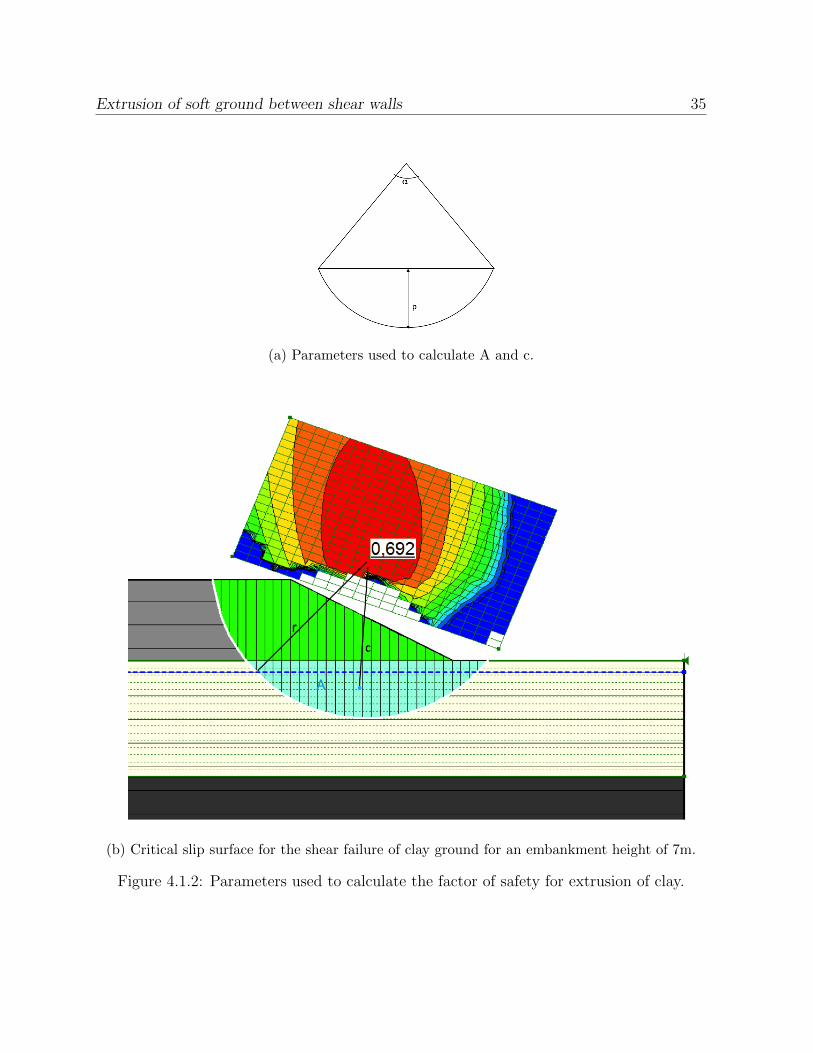
Extrusion of soft ground between shear walls 35
(a) Parameters used to calculate A and c.
(b) Critical slip surface for the shear failure of clay ground for an embankment height of 7m.
Figure 4.1.2: Parameters used to calculate the factor of safety for extrusion of clay.
Extrusion of soft ground between shear walls 36
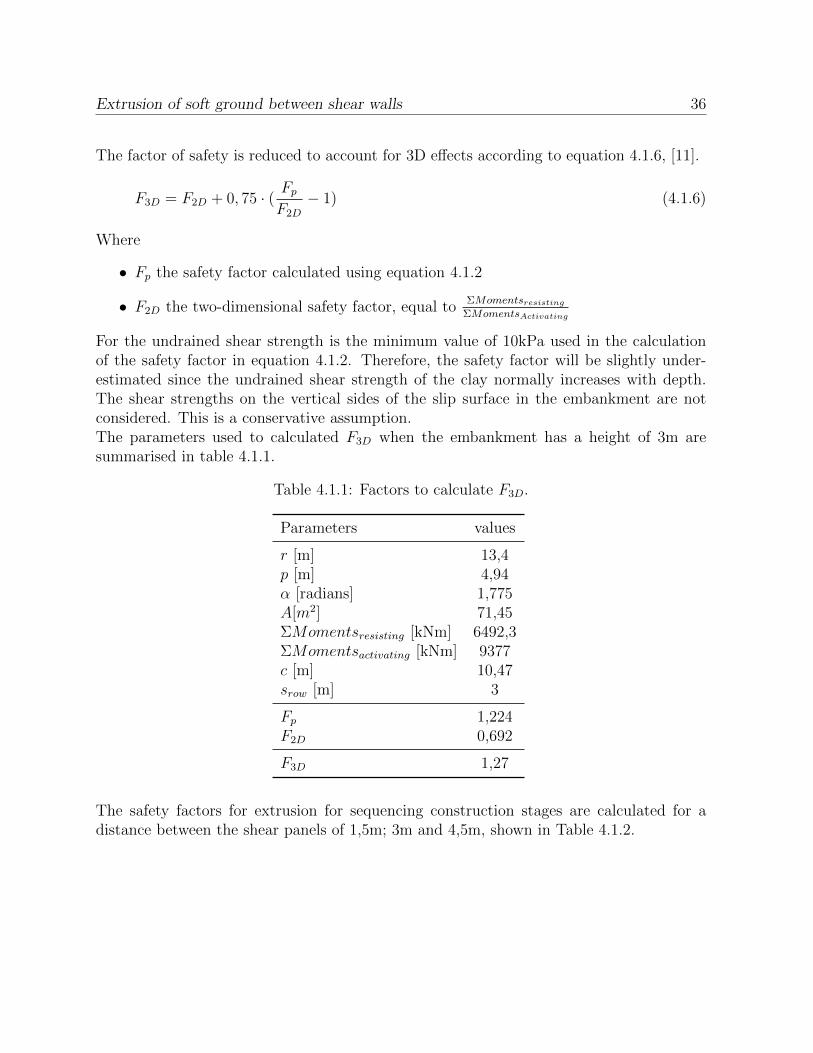
The factor of safety is reduced to account for 3D effects according to equation 4.1.6, [11].
F3D = F2D + 0, 75 · (Fp
F2D
− 1) (4.1.6)
Where
• Fp the safety factor calculated using equation 4.1.2
• F2D the two-dimensional safety factor, equal toΣMomentsresisting
ΣMomentsActivating
For the undrained shear strength is the minimum value of 10kPa used in the calculationof the safety factor in equation 4.1.2. Therefore, the safety factor will be slightly under-estimated since the undrained shear strength of the clay normally increases with depth.The shear strengths on the vertical sides of the slip surface in the embankment are notconsidered. This is a conservative assumption.The parameters used to calculated F3D when the embankment has a height of 3m aresummarised in table 4.1.1.
Table 4.1.1: Factors to calculate F3D.
Parameters values
r [m] 13,4p [m] 4,94α [radians] 1,775A[m2] 71,45ΣMomentsresisting [kNm] 6492,3ΣMomentsactivating [kNm] 9377c [m] 10,47srow [m] 3
Fp 1,224F2D 0,692
F3D 1,27
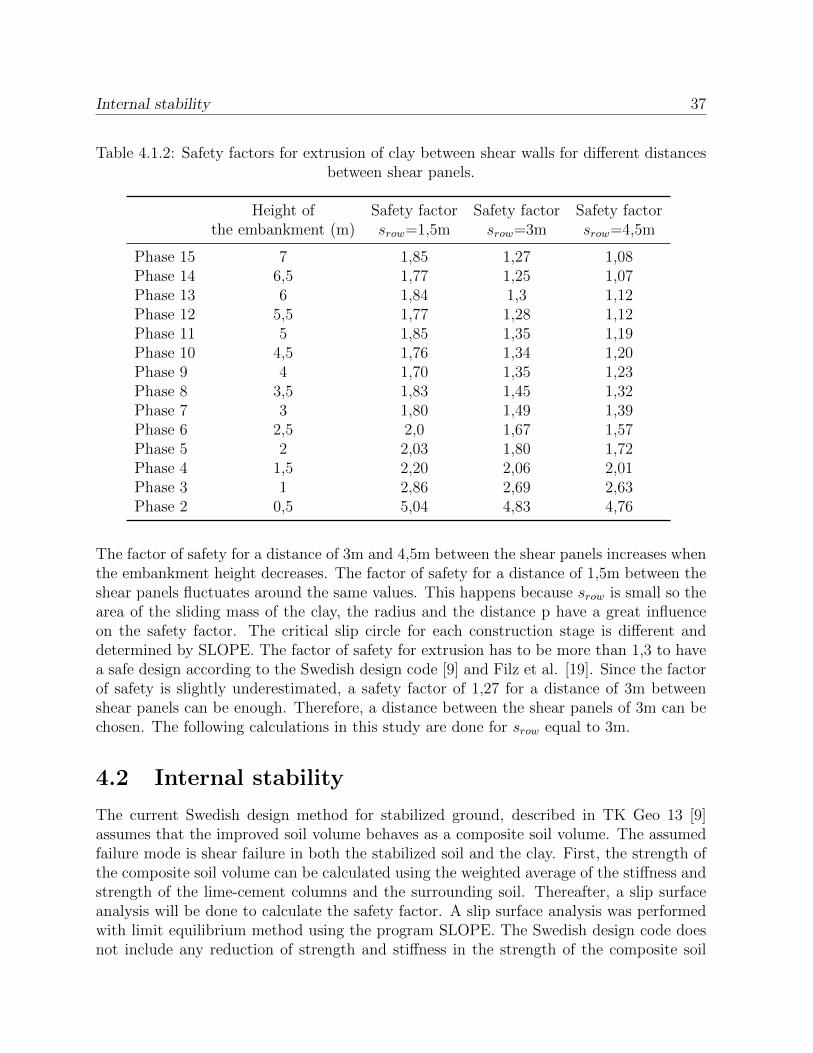
The safety factors for extrusion for sequencing construction stages are calculated for adistance between the shear panels of 1,5m; 3m and 4,5m, shown in Table 4.1.2.
Internal stability 37
Table 4.1.2: Safety factors for extrusion of clay between shear walls for different distancesbetween shear panels.
Height of Safety factor Safety factor Safety factorthe embankment (m) srow=1,5m srow=3m srow=4,5m
Phase 15 7 1,85 1,27 1,08Phase 14 6,5 1,77 1,25 1,07Phase 13 6 1,84 1,3 1,12Phase 12 5,5 1,77 1,28 1,12Phase 11 5 1,85 1,35 1,19Phase 10 4,5 1,76 1,34 1,20Phase 9 4 1,70 1,35 1,23Phase 8 3,5 1,83 1,45 1,32Phase 7 3 1,80 1,49 1,39Phase 6 2,5 2,0 1,67 1,57Phase 5 2 2,03 1,80 1,72Phase 4 1,5 2,20 2,06 2,01Phase 3 1 2,86 2,69 2,63Phase 2 0,5 5,04 4,83 4,76
The factor of safety for a distance of 3m and 4,5m between the shear panels increases whenthe embankment height decreases. The factor of safety for a distance of 1,5m between theshear panels fluctuates around the same values. This happens because srow is small so thearea of the sliding mass of the clay, the radius and the distance p have a great influenceon the safety factor. The critical slip circle for each construction stage is different anddetermined by SLOPE. The factor of safety for extrusion has to be more than 1,3 to havea safe design according to the Swedish design code [9] and Filz et al. [19]. Since the factorof safety is slightly underestimated, a safety factor of 1,27 for a distance of 3m betweenshear panels can be enough. Therefore, a distance between the shear panels of 3m can bechosen. The following calculations in this study are done for srow equal to 3m.
4.2 Internal stability
The current Swedish design method for stabilized ground, described in TK Geo 13 [9]assumes that the improved soil volume behaves as a composite soil volume. The assumedfailure mode is shear failure in both the stabilized soil and the clay. First, the strength ofthe composite soil volume can be calculated using the weighted average of the stiffness andstrength of the lime-cement columns and the surrounding soil. Thereafter, a slip surfaceanalysis will be done to calculate the safety factor. A slip surface analysis was performedwith limit equilibrium method using the program SLOPE. The Swedish design code doesnot include any reduction of strength and stiffness in the strength of the composite soil
No reduction of strength and stiffness at the overlap 38
volume due to a reduction of strength and stiffness in the overlap between adjacent columns.The method used by the Swedish design code is described in paragraph 4.2.1. The methodused to include reduction of strength and stiffness of the overlap between adjacent columnsin the undrained and drained shear strength of the composite soil volume is described inparagraph 4.2.2.
4.2.1 No reduction of strength and stiffness at the overlap
The Swedish design code for stabilized ground does not include any reduction in strengthand stiffness due to a weaker overlap. The following calculations are made according tothe Swedish design code for stabilized ground.
4.2.1.1 Undrained shear strength
The undrained shear strength of the composite soil volume can be calculated using equation4.2.13.
su = a · su,column + (1 − a) · su,clay (4.2.1)
Where:
• su,column is the undrained shear strength of the deep mixing columns, equal to 100kPa
• su,clay is the undrained shear strength of the clay ground, equal to 10+1,5z [kPa]
• a is the weighting factor, calculated below
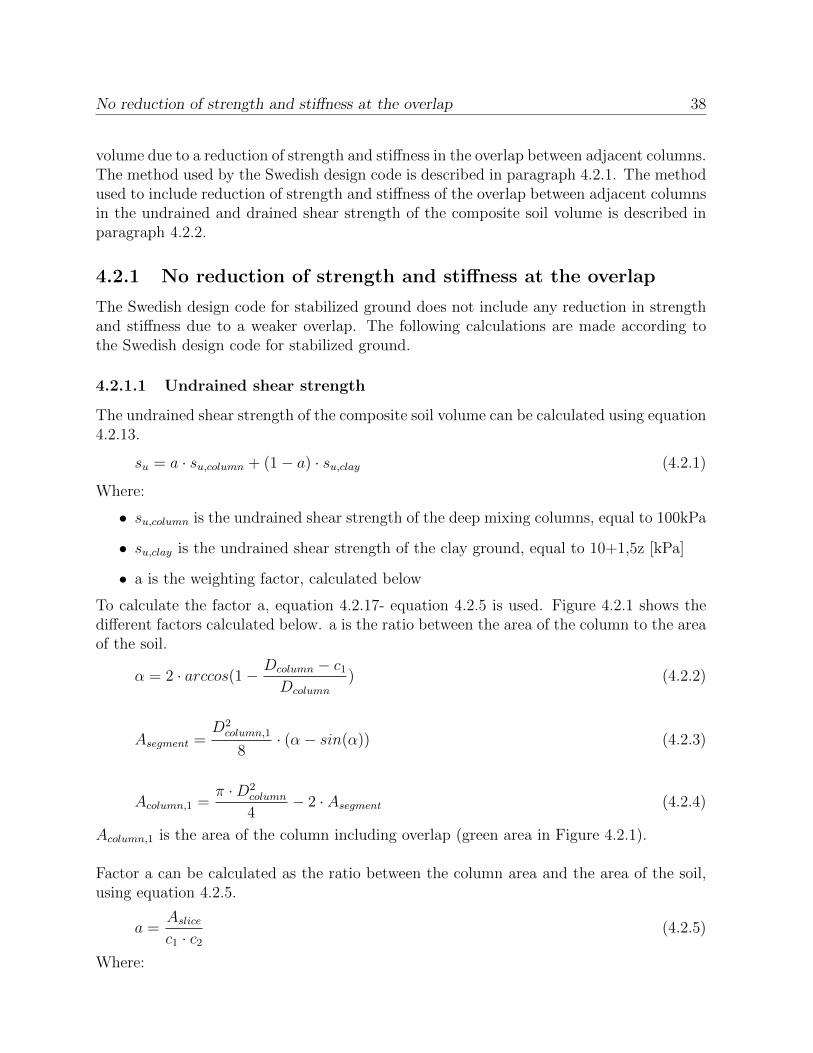
To calculate the factor a, equation 4.2.17- equation 4.2.5 is used. Figure 4.2.1 shows thedifferent factors calculated below. a is the ratio between the area of the column to the areaof the soil.
α = 2 · arccos(1 − Dcolumn − c1
Dcolumn
) (4.2.2)
Asegment =D2
column,1
8· (α− sin(α)) (4.2.3)
Acolumn,1 =π ·D2
column
4− 2 · Asegment (4.2.4)
Acolumn,1 is the area of the column including overlap (green area in Figure 4.2.1).
Factor a can be calculated as the ratio between the column area and the area of the soil,using equation 4.2.5.
a =Aslice
c1 · c2
(4.2.5)
Where:
No reduction of strength and stiffness at the overlap 39
• d is the diameter of the deep mixing columns, equal to 0,6m
• c1 is the centre-to-centre distance of the columns, equal to 0,5m
• c2 is the distance between two deep mixing rows, equal to 3m
Figure 4.2.1: Angle α, area of a circle segment in purple, area of the column, Acolumn,1 ingreen [10].
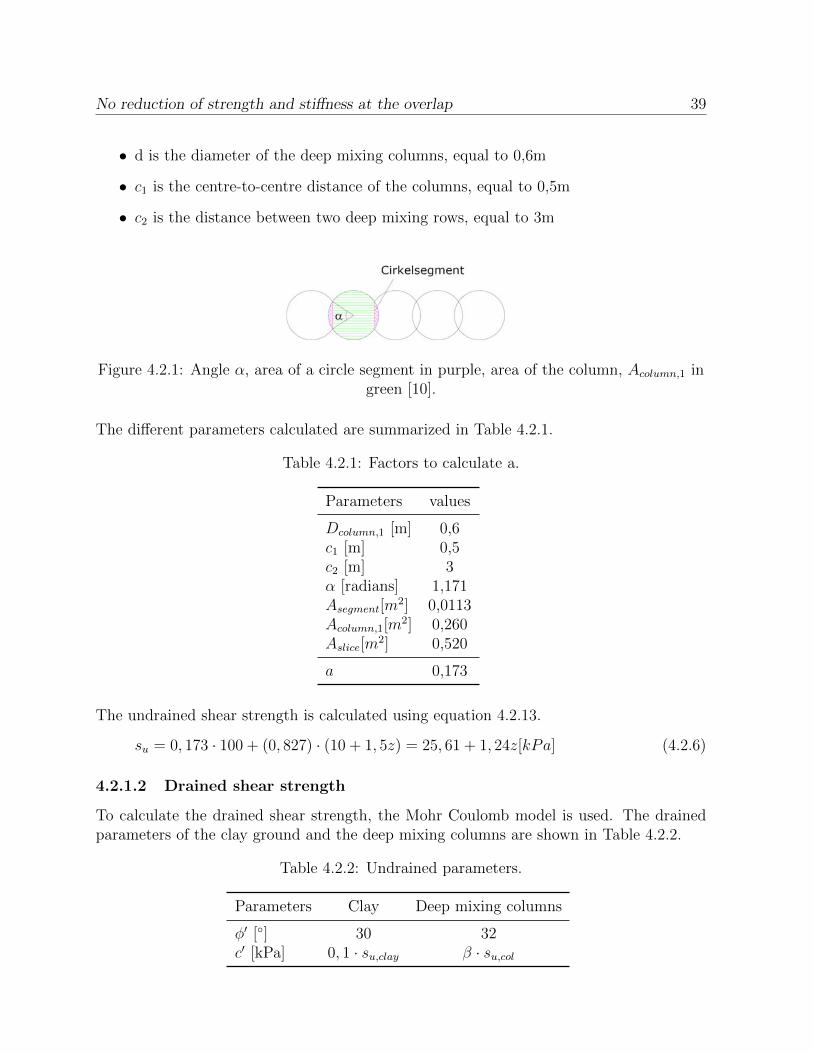
The different parameters calculated are summarized in Table 4.2.1.
Table 4.2.1: Factors to calculate a.
Parameters values
Dcolumn,1 [m] 0,6c1 [m] 0,5c2 [m] 3α [radians] 1,171Asegment[m
2] 0,0113Acolumn,1[m2] 0,260Aslice[m
2] 0,520
a 0,173
The undrained shear strength is calculated using equation 4.2.13.
su = 0, 173 · 100 + (0, 827) · (10 + 1, 5z) = 25, 61 + 1, 24z[kPa] (4.2.6)
4.2.1.2 Drained shear strength
To calculate the drained shear strength, the Mohr Coulomb model is used. The drainedparameters of the clay ground and the deep mixing columns are shown in Table 4.2.2.
Table 4.2.2: Undrained parameters.
Parameters Clay Deep mixing columns
φ′ [◦] 30 32c′ [kPa] 0, 1 · su,clay β · su,col
No reduction of strength and stiffness at the overlap 40
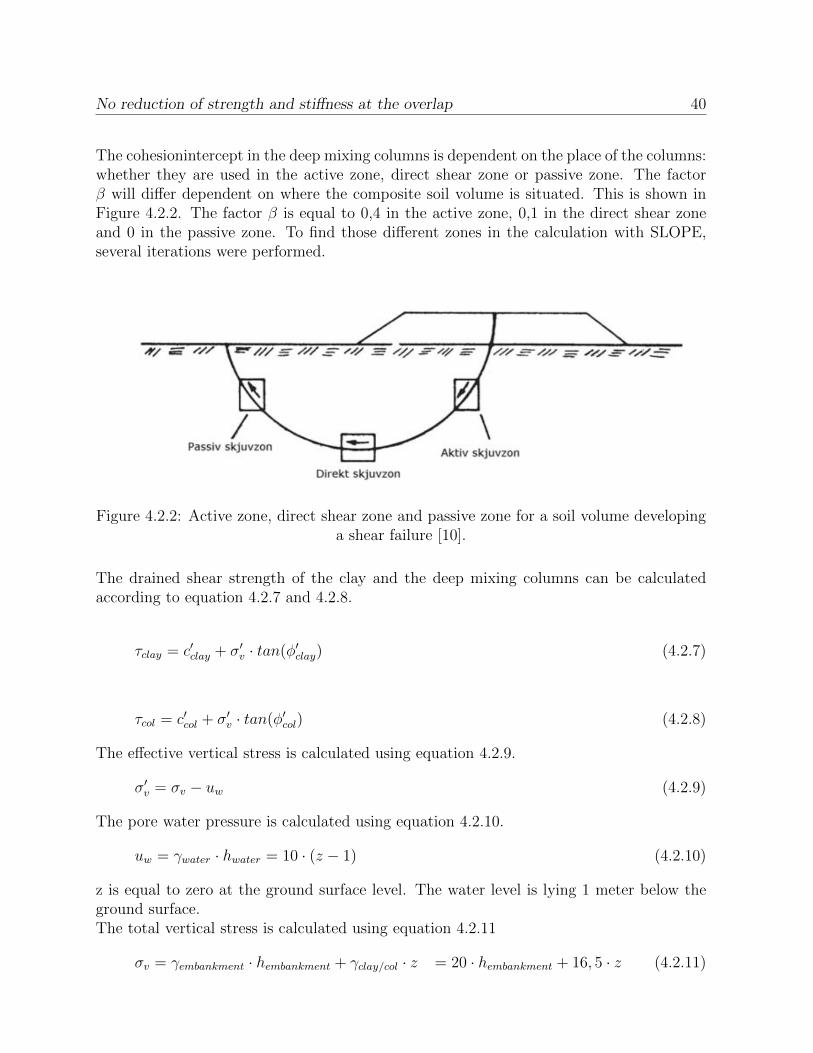
The cohesionintercept in the deep mixing columns is dependent on the place of the columns:whether they are used in the active zone, direct shear zone or passive zone. The factorβ will differ dependent on where the composite soil volume is situated. This is shown inFigure 4.2.2. The factor β is equal to 0,4 in the active zone, 0,1 in the direct shear zoneand 0 in the passive zone. To find those different zones in the calculation with SLOPE,several iterations were performed.
Figure 4.2.2: Active zone, direct shear zone and passive zone for a soil volume developinga shear failure [10].
The drained shear strength of the clay and the deep mixing columns can be calculatedaccording to equation 4.2.7 and 4.2.8.
τclay = c′clay + σ′v · tan(φ′clay) (4.2.7)
τcol = c′col + σ′v · tan(φ′col) (4.2.8)
The effective vertical stress is calculated using equation 4.2.9.
σ′v = σv − uw (4.2.9)
The pore water pressure is calculated using equation 4.2.10.
uw = γwater · hwater = 10 · (z − 1) (4.2.10)
z is equal to zero at the ground surface level. The water level is lying 1 meter below theground surface.The total vertical stress is calculated using equation 4.2.11
σv = γembankment · hembankment + γclay/col · z = 20 · hembankment + 16, 5 · z (4.2.11)
Reduction of strength and stiffness at the overlap 41
The average drained shear strength is calculated according to equation 4.2.12
τaverage = a · τcol + (1 − a) · τclay (4.2.12)
For an embankment with a height of 7m, the undrained shear strength of the clay, thedeep mixing columns and the average shear strength is summarized in Table 4.2.3.
Table 4.2.3: Undrained shear strength for an embankment height of 7m.
τclay [kPa] τcolumns [kPa] τaverage [kPa]
General 87,55+3,91z - -
Active zone - 133,75+4,06z 95,57+3,93zDirect shear zone [m] - 103,75+4,06z 90,36+3,93zPassive zone - 93,75+4,06z 88,63+3,93z
4.2.2 Reduction of strength and stiffness at the overlap
The method used to include reduction of strength and stiffness of the overlap betweenadjacent columns in the undrained and drained shear strength of the composite soil volumeis described in this paragraph.
4.2.2.1 Undrained shear strength
The undrained shear strength of the composite soil volume can be calculated using equation4.2.13.
su = x · su,column + y · su,overlap + (1 − x− y) · su,clay (4.2.13)
Where:
• su,column is the undrained shear strength of the deep mixing columns, equal to 100kPa
• su,overlap is the undrained shear strength of the overlap, assumed to be equal to 50%of su,column = 50kPa or 25% of su,column = 25kPa
• su,clay is the undrained shear strength of the clay ground, equal to 10+1,5z [kPa]
• x and y are weighting factors, calculated below
The weighting factor x is calculated using equation 4.2.14.
x =asc · (Ac − 2 · Ao)
Ac
(4.2.14)
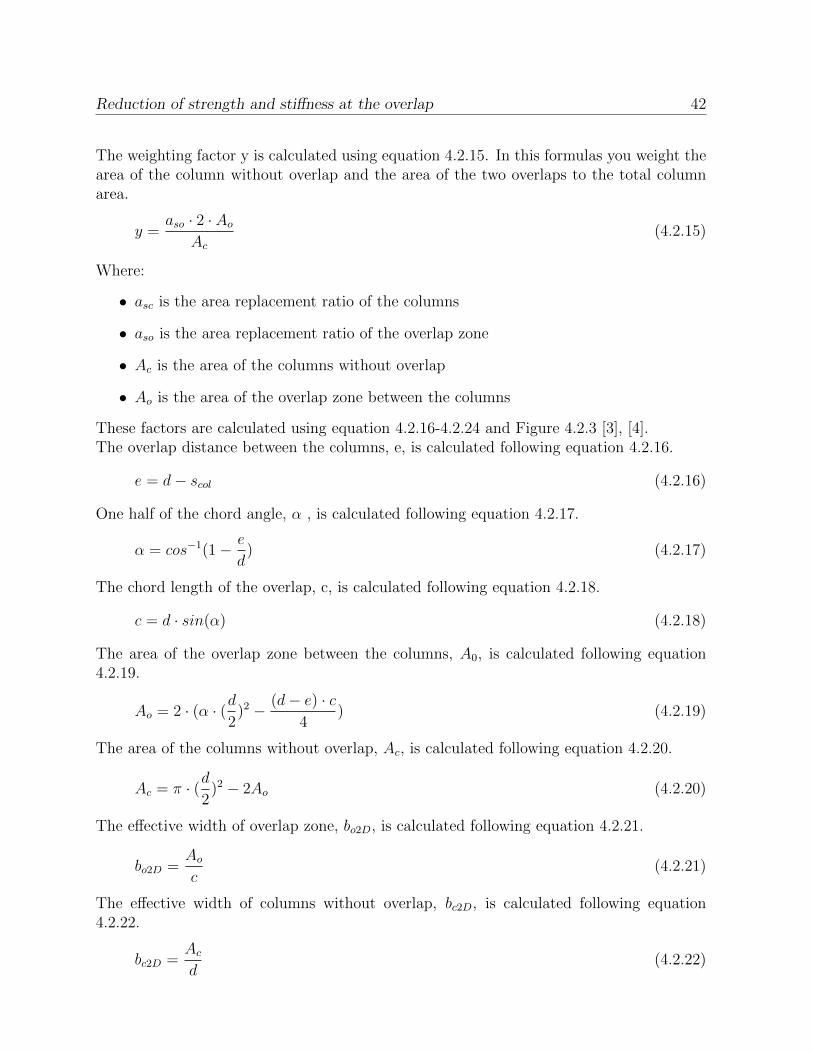
Reduction of strength and stiffness at the overlap 42
The weighting factor y is calculated using equation 4.2.15. In this formulas you weight thearea of the column without overlap and the area of the two overlaps to the total columnarea.
y =aso · 2 · Ao
Ac
(4.2.15)
Where:
• asc is the area replacement ratio of the columns
• aso is the area replacement ratio of the overlap zone
• Ac is the area of the columns without overlap
• Ao is the area of the overlap zone between the columns
These factors are calculated using equation 4.2.16-4.2.24 and Figure 4.2.3 [3], [4].The overlap distance between the columns, e, is calculated following equation 4.2.16.
e = d− scol (4.2.16)
One half of the chord angle, α , is calculated following equation 4.2.17.
α = cos−1(1 − e
d) (4.2.17)
The chord length of the overlap, c, is calculated following equation 4.2.18.
c = d · sin(α) (4.2.18)
The area of the overlap zone between the columns, A0, is calculated following equation4.2.19.
Ao = 2 · (α · (d
2)2 − (d− e) · c
4) (4.2.19)
The area of the columns without overlap, Ac, is calculated following equation 4.2.20.
Ac = π · (d
2)2 − 2Ao (4.2.20)
The effective width of overlap zone, bo2D, is calculated following equation 4.2.21.
bo2D =Ao
c(4.2.21)
The effective width of columns without overlap, bc2D, is calculated following equation4.2.22.
bc2D =Ac
d(4.2.22)
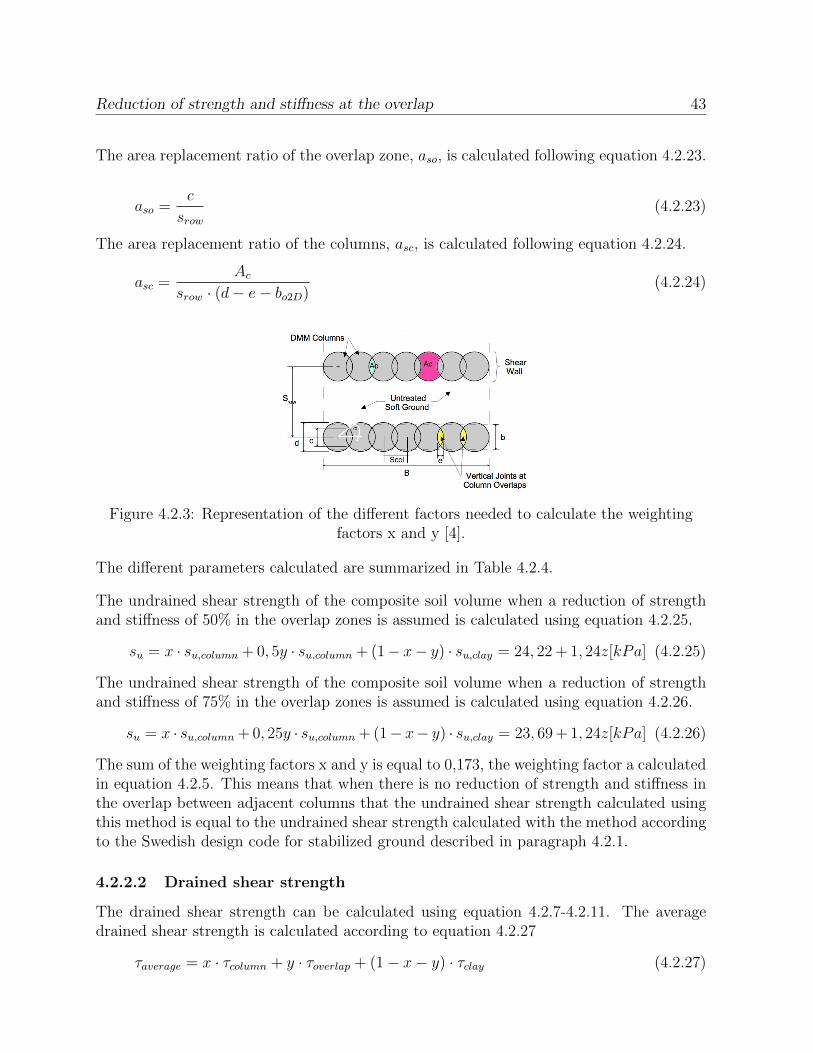
Reduction of strength and stiffness at the overlap 43
The area replacement ratio of the overlap zone, aso, is calculated following equation 4.2.23.
aso =c
srow(4.2.23)
The area replacement ratio of the columns, asc, is calculated following equation 4.2.24.
asc =Ac
srow · (d− e− bo2D)(4.2.24)
Figure 4.2.3: Representation of the different factors needed to calculate the weightingfactors x and y [4].
The different parameters calculated are summarized in Table 4.2.4.
The undrained shear strength of the composite soil volume when a reduction of strengthand stiffness of 50% in the overlap zones is assumed is calculated using equation 4.2.25.
su = x · su,column + 0, 5y · su,column + (1− x− y) · su,clay = 24, 22 + 1, 24z[kPa] (4.2.25)
The undrained shear strength of the composite soil volume when a reduction of strengthand stiffness of 75% in the overlap zones is assumed is calculated using equation 4.2.26.
su = x · su,column + 0, 25y · su,column + (1− x− y) · su,clay = 23, 69 + 1, 24z[kPa] (4.2.26)
The sum of the weighting factors x and y is equal to 0,173, the weighting factor a calculatedin equation 4.2.5. This means that when there is no reduction of strength and stiffness inthe overlap between adjacent columns that the undrained shear strength calculated usingthis method is equal to the undrained shear strength calculated with the method accordingto the Swedish design code for stabilized ground described in paragraph 4.2.1.
4.2.2.2 Drained shear strength
The drained shear strength can be calculated using equation 4.2.7-4.2.11. The averagedrained shear strength is calculated according to equation 4.2.27
τaverage = x · τcolumn + y · τoverlap + (1 − x− y) · τclay (4.2.27)
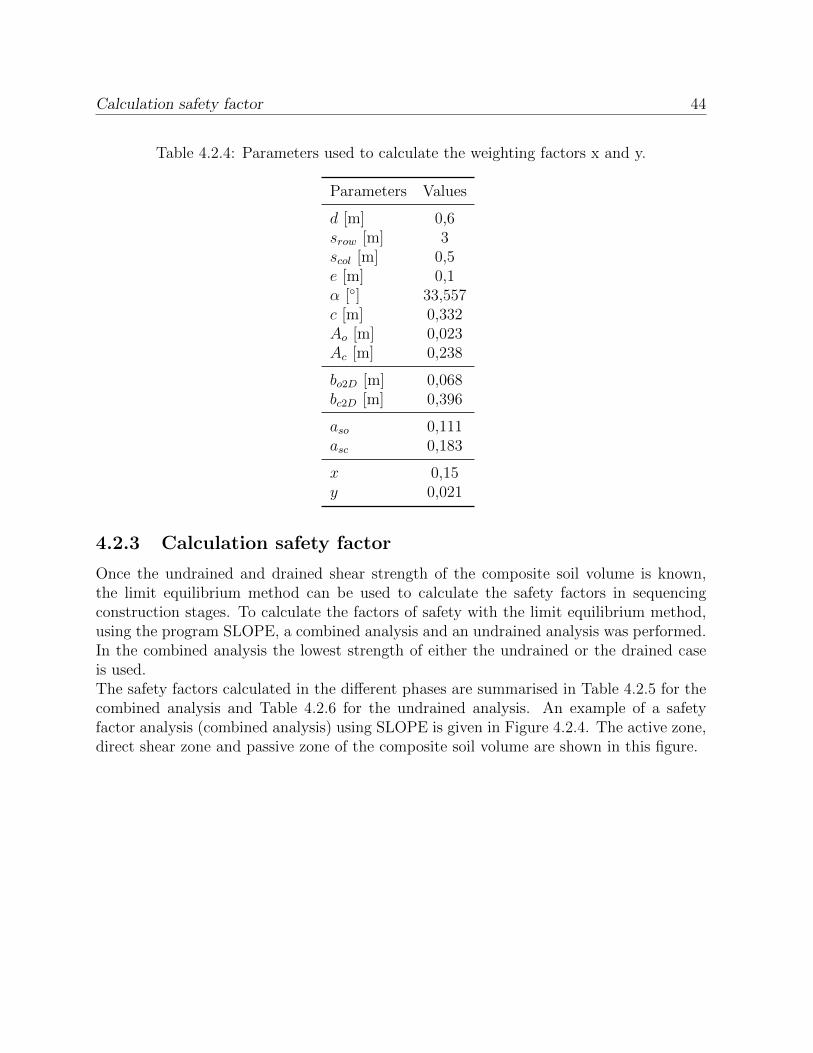
Calculation safety factor 44
Table 4.2.4: Parameters used to calculate the weighting factors x and y.
Parameters Values
d [m] 0,6srow [m] 3scol [m] 0,5e [m] 0,1α [◦] 33,557c [m] 0,332Ao [m] 0,023Ac [m] 0,238
bo2D [m] 0,068bc2D [m] 0,396
aso 0,111asc 0,183
x 0,15y 0,021
4.2.3 Calculation safety factor
Once the undrained and drained shear strength of the composite soil volume is known,the limit equilibrium method can be used to calculate the safety factors in sequencingconstruction stages. To calculate the factors of safety with the limit equilibrium method,using the program SLOPE, a combined analysis and an undrained analysis was performed.In the combined analysis the lowest strength of either the undrained or the drained caseis used.The safety factors calculated in the different phases are summarised in Table 4.2.5 for thecombined analysis and Table 4.2.6 for the undrained analysis. An example of a safetyfactor analysis (combined analysis) using SLOPE is given in Figure 4.2.4. The active zone,direct shear zone and passive zone of the composite soil volume are shown in this figure.
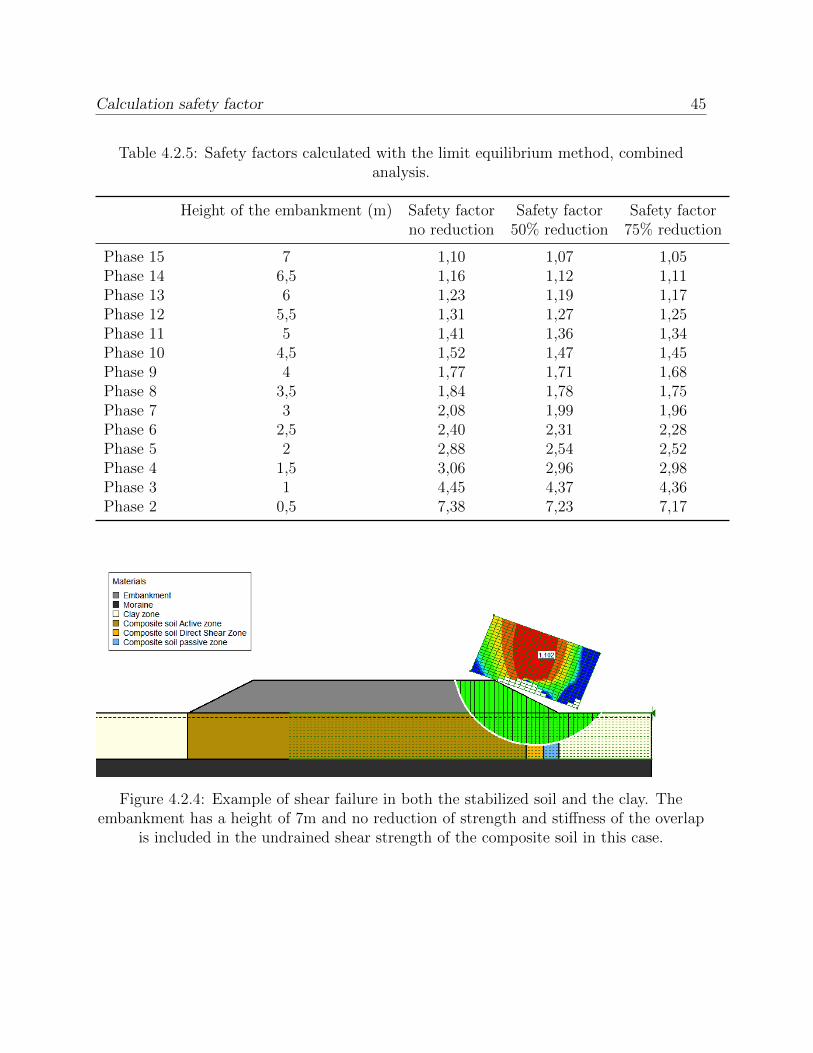
Calculation safety factor 45
Table 4.2.5: Safety factors calculated with the limit equilibrium method, combinedanalysis.
Height of the embankment (m) Safety factor Safety factor Safety factorno reduction 50% reduction 75% reduction
Phase 15 7 1,10 1,07 1,05Phase 14 6,5 1,16 1,12 1,11Phase 13 6 1,23 1,19 1,17Phase 12 5,5 1,31 1,27 1,25Phase 11 5 1,41 1,36 1,34Phase 10 4,5 1,52 1,47 1,45Phase 9 4 1,77 1,71 1,68Phase 8 3,5 1,84 1,78 1,75Phase 7 3 2,08 1,99 1,96Phase 6 2,5 2,40 2,31 2,28Phase 5 2 2,88 2,54 2,52Phase 4 1,5 3,06 2,96 2,98Phase 3 1 4,45 4,37 4,36Phase 2 0,5 7,38 7,23 7,17
Figure 4.2.4: Example of shear failure in both the stabilized soil and the clay. Theembankment has a height of 7m and no reduction of strength and stiffness of the overlap
is included in the undrained shear strength of the composite soil in this case.
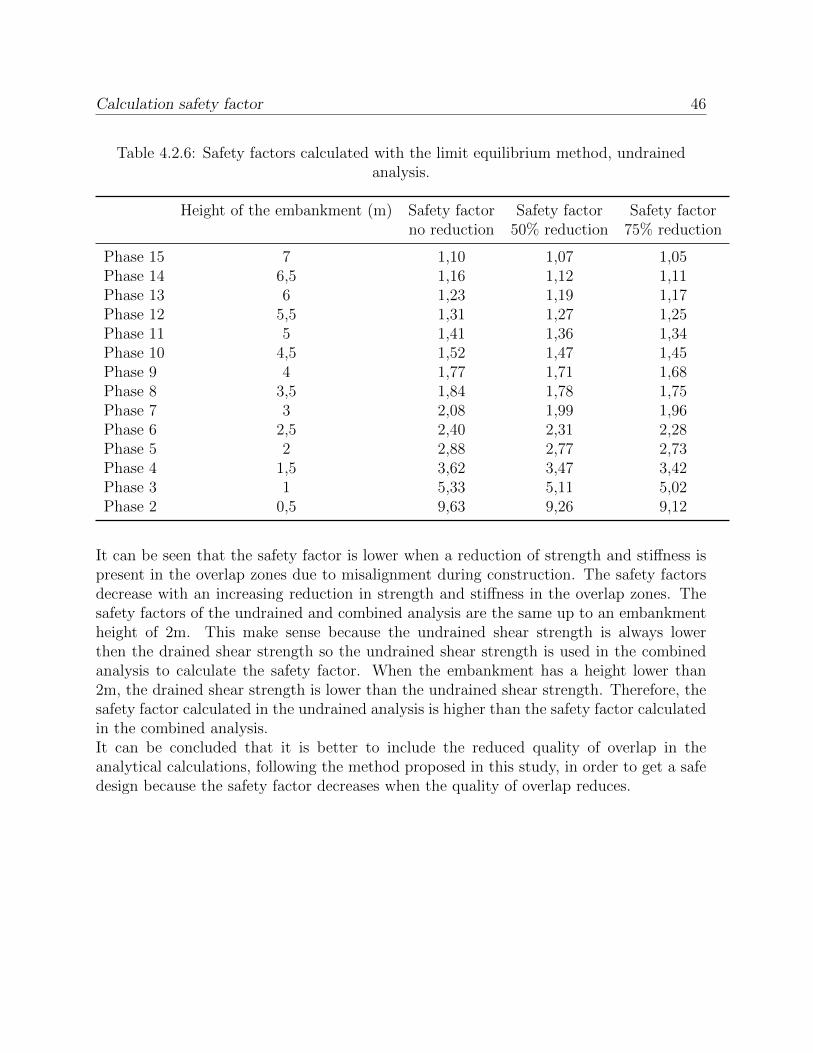
Calculation safety factor 46
Table 4.2.6: Safety factors calculated with the limit equilibrium method, undrainedanalysis.
Height of the embankment (m) Safety factor Safety factor Safety factorno reduction 50% reduction 75% reduction
Phase 15 7 1,10 1,07 1,05Phase 14 6,5 1,16 1,12 1,11Phase 13 6 1,23 1,19 1,17Phase 12 5,5 1,31 1,27 1,25Phase 11 5 1,41 1,36 1,34Phase 10 4,5 1,52 1,47 1,45Phase 9 4 1,77 1,71 1,68Phase 8 3,5 1,84 1,78 1,75Phase 7 3 2,08 1,99 1,96Phase 6 2,5 2,40 2,31 2,28Phase 5 2 2,88 2,77 2,73Phase 4 1,5 3,62 3,47 3,42Phase 3 1 5,33 5,11 5,02Phase 2 0,5 9,63 9,26 9,12
It can be seen that the safety factor is lower when a reduction of strength and stiffness ispresent in the overlap zones due to misalignment during construction. The safety factorsdecrease with an increasing reduction in strength and stiffness in the overlap zones. Thesafety factors of the undrained and combined analysis are the same up to an embankmentheight of 2m. This make sense because the undrained shear strength is always lowerthen the drained shear strength so the undrained shear strength is used in the combinedanalysis to calculate the safety factor. When the embankment has a height lower than2m, the drained shear strength is lower than the undrained shear strength. Therefore, thesafety factor calculated in the undrained analysis is higher than the safety factor calculatedin the combined analysis.It can be concluded that it is better to include the reduced quality of overlap in theanalytical calculations, following the method proposed in this study, in order to get a safedesign because the safety factor decreases when the quality of overlap reduces.
Chapter 5
Numerical calculations
Numerical analysis using a 2D plane strain model was performed to investigate the failurebehaviour of deep mixing columns supporting a highway or railway embankment. Thethree-dimensional columns are represented by a composite soil volume consisting of verticaljoints representing the overlap between adjacent columns. A comparison is made betweenthe analytical solution and the results from the numerical model. Afterwards, a sensitivityanalysis of the numerical model is performed in which the influence of the quality of theoverlap of adjacent columns is studied. The condition explained in paragraph 3.1 is usedas the standard.The finite element program PLAXIS 2D 2016 was used in this study to model the embank-ment supported by deep mixing columns.
5.1 Geometrical model
Deep mixing column panels oriented perpendicular to the axis of the embankment are aneffective arrangement for supporting the embankment loads. Shear walls constructed byoverlapping individual deep mixing columns contain vertical joints caused by the reducedwidth of the wall at the overlap between adjacent columns. These vertical joints can bemade weaker by misalignment during construction, which reduces the efficiency of theoverlap [3]. In the numerical model, the weak vertical joints that are present in a three-dimensional situation will be modelled in the 2D model. In the standard condition thevertical joints are assumed to have a strength and stiffness equal to 50% of the strengthand stiffness of the deep mixing columns.
In order to calculate the dimensions of the 2D model, namely the width of the columnsexcluding the overlap zone, bc2D, and the width of the vertical joints representing the over-lap zone, bo2D, the procedure described by Adams [3] and Ignat et al. [4] was used.
The parameters that have to be chosen are the diameter of the columns, d, the distancebetween the column panels, srow, and the distance between the adjacent columns, scol. The
47
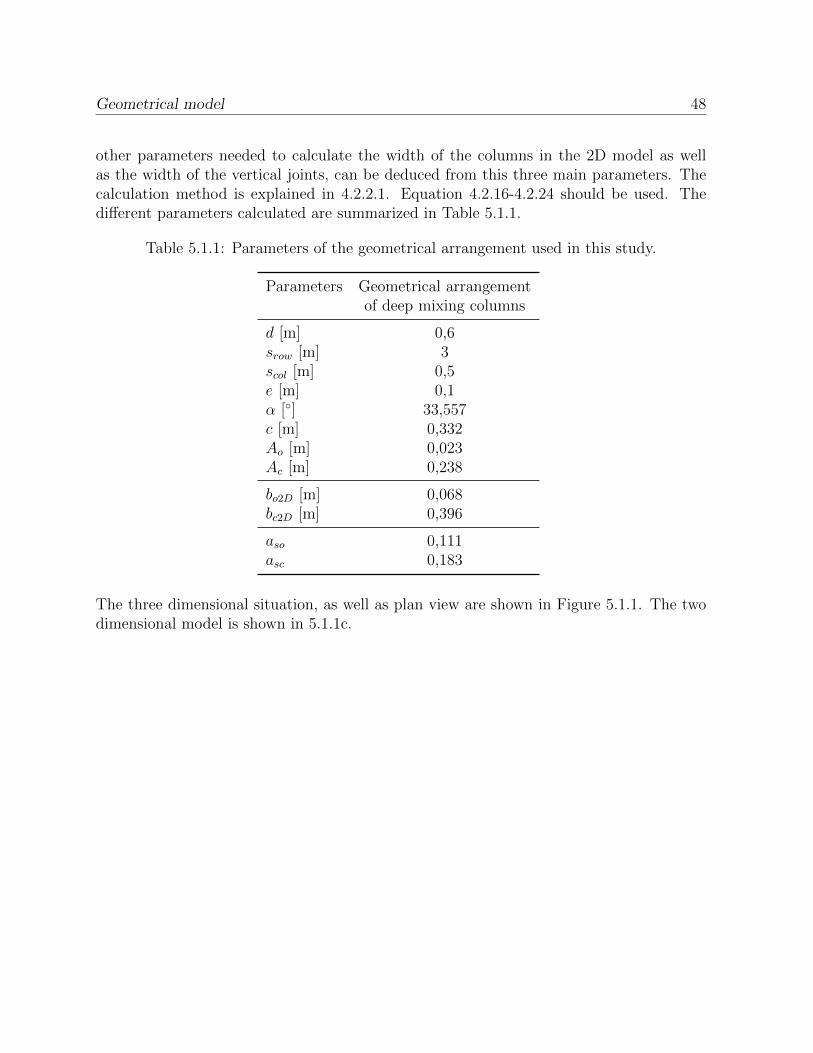
Geometrical model 48
other parameters needed to calculate the width of the columns in the 2D model as wellas the width of the vertical joints, can be deduced from this three main parameters. Thecalculation method is explained in 4.2.2.1. Equation 4.2.16-4.2.24 should be used. Thedifferent parameters calculated are summarized in Table 5.1.1.
Table 5.1.1: Parameters of the geometrical arrangement used in this study.
Parameters Geometrical arrangementof deep mixing columns
d [m] 0,6srow [m] 3scol [m] 0,5e [m] 0,1α [◦] 33,557c [m] 0,332Ao [m] 0,023Ac [m] 0,238
bo2D [m] 0,068bc2D [m] 0,396
aso 0,111asc 0,183
The three dimensional situation, as well as plan view are shown in Figure 5.1.1. The twodimensional model is shown in 5.1.1c.
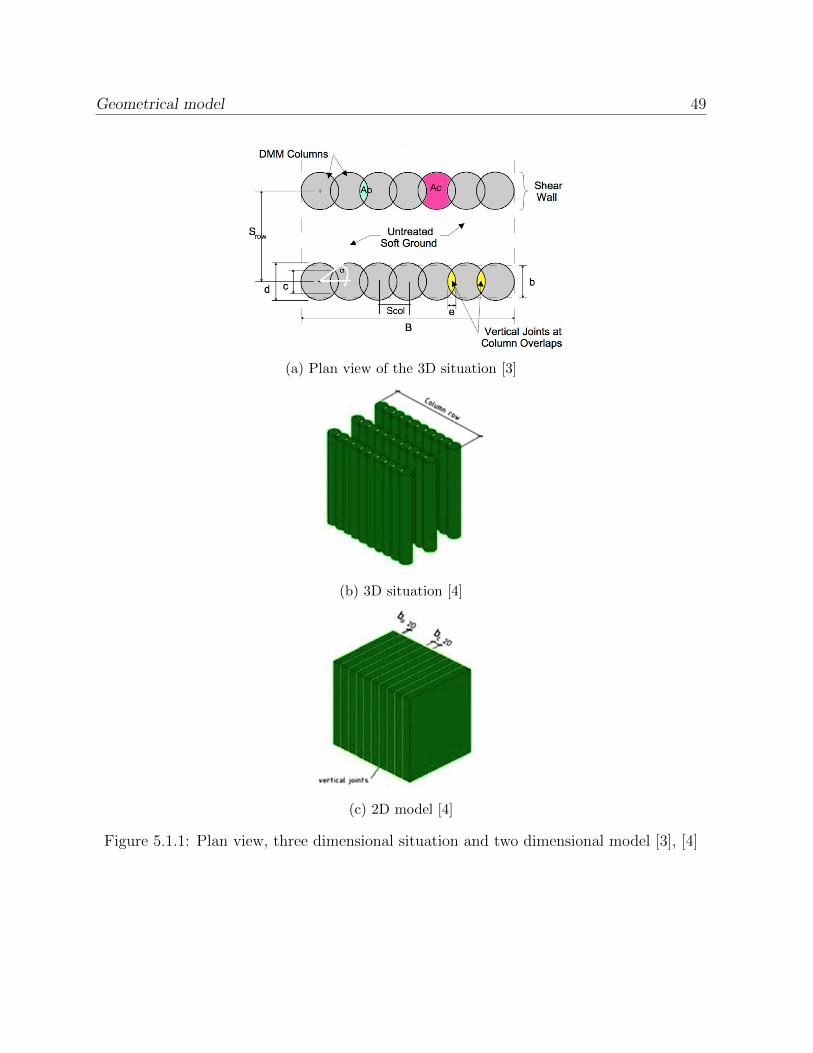
Geometrical model 49
(a) Plan view of the 3D situation [3]
(b) 3D situation [4]
(c) 2D model [4]
Figure 5.1.1: Plan view, three dimensional situation and two dimensional model [3], [4]
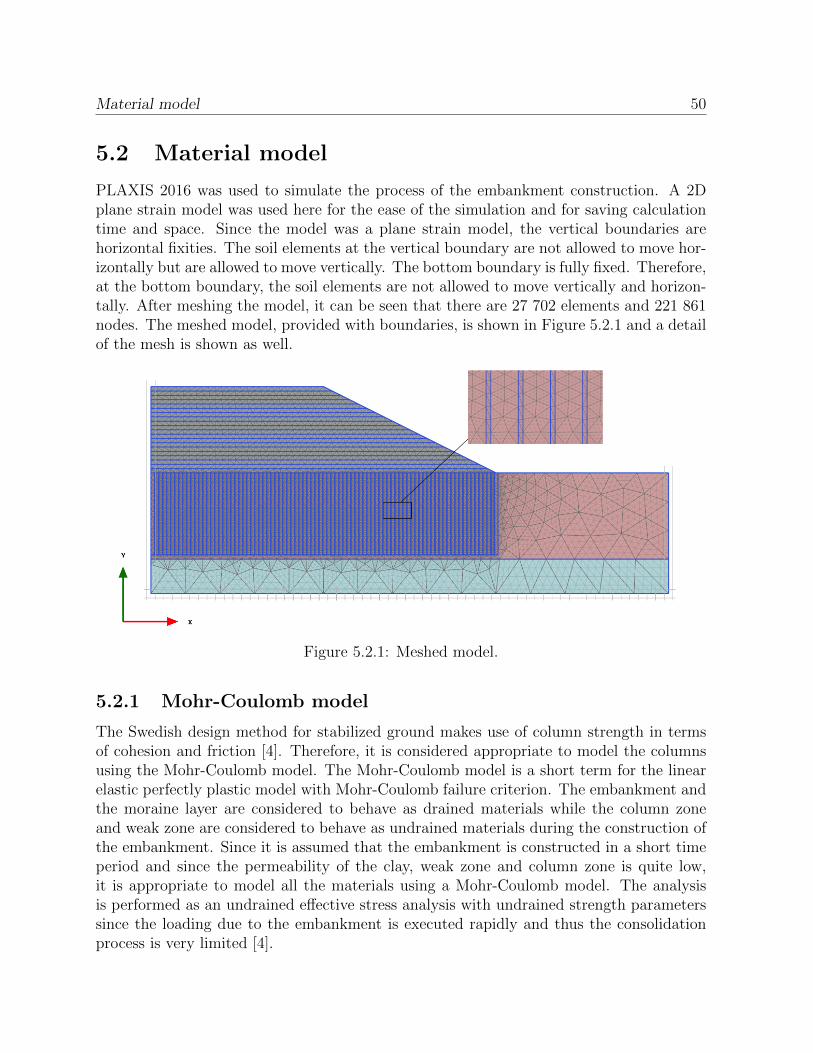
Material model 50
5.2 Material model
PLAXIS 2016 was used to simulate the process of the embankment construction. A 2Dplane strain model was used here for the ease of the simulation and for saving calculationtime and space. Since the model was a plane strain model, the vertical boundaries arehorizontal fixities. The soil elements at the vertical boundary are not allowed to move hor-izontally but are allowed to move vertically. The bottom boundary is fully fixed. Therefore,at the bottom boundary, the soil elements are not allowed to move vertically and horizon-tally. After meshing the model, it can be seen that there are 27 702 elements and 221 861nodes. The meshed model, provided with boundaries, is shown in Figure 5.2.1 and a detailof the mesh is shown as well.
Figure 5.2.1: Meshed model.
5.2.1 Mohr-Coulomb model
The Swedish design method for stabilized ground makes use of column strength in termsof cohesion and friction [4]. Therefore, it is considered appropriate to model the columnsusing the Mohr-Coulomb model. The Mohr-Coulomb model is a short term for the linearelastic perfectly plastic model with Mohr-Coulomb failure criterion. The embankment andthe moraine layer are considered to behave as drained materials while the column zoneand weak zone are considered to behave as undrained materials during the construction ofthe embankment. Since it is assumed that the embankment is constructed in a short timeperiod and since the permeability of the clay, weak zone and column zone is quite low,it is appropriate to model all the materials using a Mohr-Coulomb model. The analysisis performed as an undrained effective stress analysis with undrained strength parameterssince the loading due to the embankment is executed rapidly and thus the consolidationprocess is very limited [4].
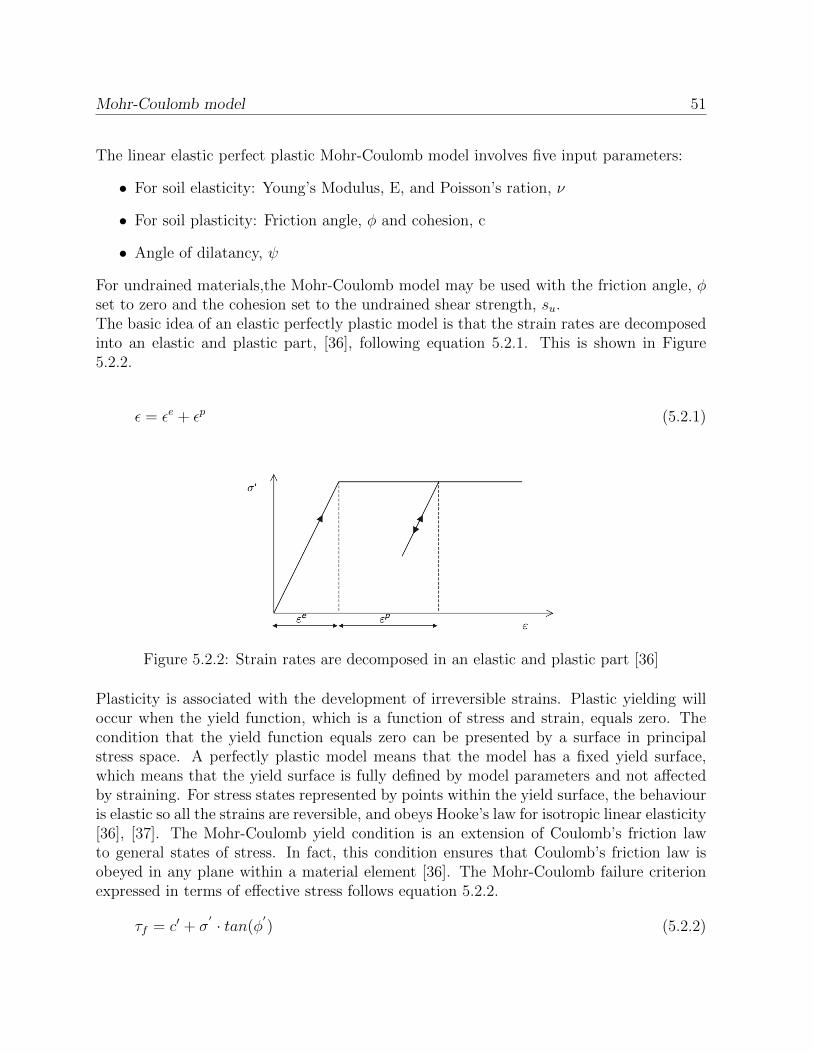
Mohr-Coulomb model 51
The linear elastic perfect plastic Mohr-Coulomb model involves five input parameters:
• For soil elasticity: Young’s Modulus, E, and Poisson’s ration, ν
• For soil plasticity: Friction angle, φ and cohesion, c
• Angle of dilatancy, ψ
For undrained materials,the Mohr-Coulomb model may be used with the friction angle, φset to zero and the cohesion set to the undrained shear strength, su.The basic idea of an elastic perfectly plastic model is that the strain rates are decomposedinto an elastic and plastic part, [36], following equation 5.2.1. This is shown in Figure5.2.2.
ε = εe + εp (5.2.1)
Figure 5.2.2: Strain rates are decomposed in an elastic and plastic part [36]
Plasticity is associated with the development of irreversible strains. Plastic yielding willoccur when the yield function, which is a function of stress and strain, equals zero. Thecondition that the yield function equals zero can be presented by a surface in principalstress space. A perfectly plastic model means that the model has a fixed yield surface,which means that the yield surface is fully defined by model parameters and not affectedby straining. For stress states represented by points within the yield surface, the behaviouris elastic so all the strains are reversible, and obeys Hooke’s law for isotropic linear elasticity[36], [37]. The Mohr-Coulomb yield condition is an extension of Coulomb’s friction lawto general states of stress. In fact, this condition ensures that Coulomb’s friction law isobeyed in any plane within a material element [36]. The Mohr-Coulomb failure criterionexpressed in terms of effective stress follows equation 5.2.2.
τf = c′ + σ′ · tan(φ
′) (5.2.2)
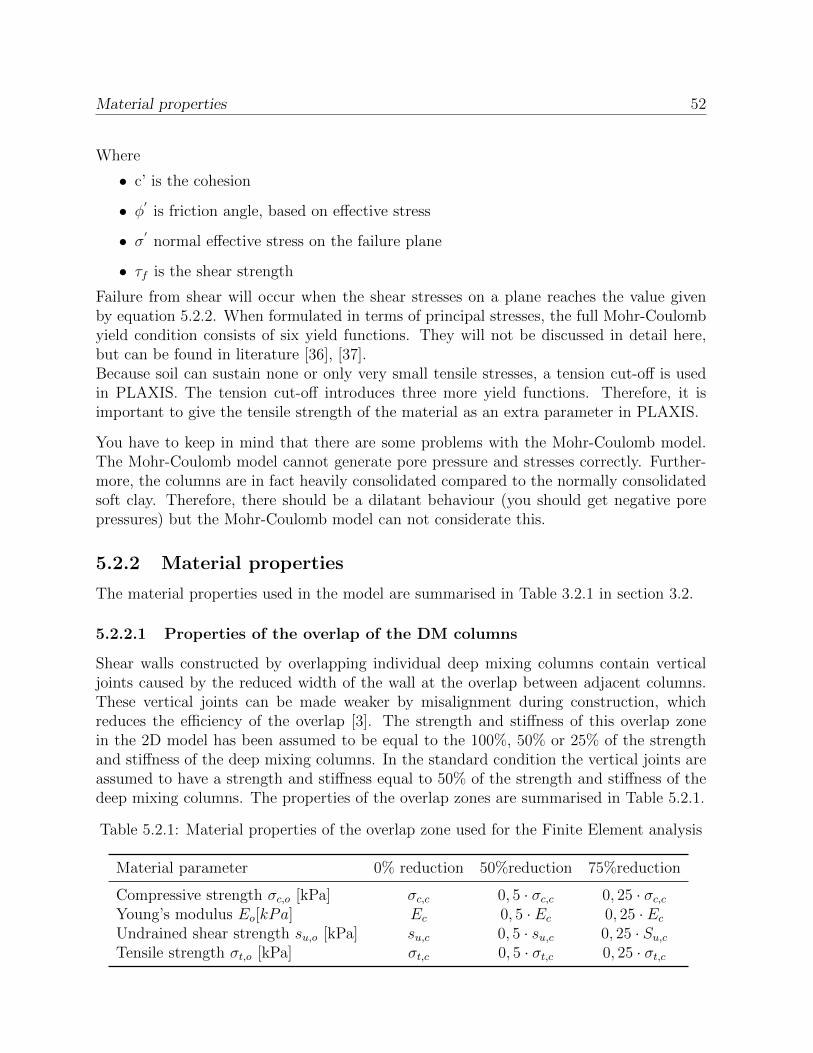
Material properties 52
Where
• c’ is the cohesion
• φ′
is friction angle, based on effective stress
• σ′
normal effective stress on the failure plane
• τf is the shear strength
Failure from shear will occur when the shear stresses on a plane reaches the value givenby equation 5.2.2. When formulated in terms of principal stresses, the full Mohr-Coulombyield condition consists of six yield functions. They will not be discussed in detail here,but can be found in literature [36], [37].Because soil can sustain none or only very small tensile stresses, a tension cut-off is usedin PLAXIS. The tension cut-off introduces three more yield functions. Therefore, it isimportant to give the tensile strength of the material as an extra parameter in PLAXIS.
You have to keep in mind that there are some problems with the Mohr-Coulomb model.The Mohr-Coulomb model cannot generate pore pressure and stresses correctly. Further-more, the columns are in fact heavily consolidated compared to the normally consolidatedsoft clay. Therefore, there should be a dilatant behaviour (you should get negative porepressures) but the Mohr-Coulomb model can not considerate this.
5.2.2 Material properties
The material properties used in the model are summarised in Table 3.2.1 in section 3.2.
5.2.2.1 Properties of the overlap of the DM columns
Shear walls constructed by overlapping individual deep mixing columns contain verticaljoints caused by the reduced width of the wall at the overlap between adjacent columns.These vertical joints can be made weaker by misalignment during construction, whichreduces the efficiency of the overlap [3]. The strength and stiffness of this overlap zonein the 2D model has been assumed to be equal to the 100%, 50% or 25% of the strengthand stiffness of the deep mixing columns. In the standard condition the vertical joints areassumed to have a strength and stiffness equal to 50% of the strength and stiffness of thedeep mixing columns. The properties of the overlap zones are summarised in Table 5.2.1.
Table 5.2.1: Material properties of the overlap zone used for the Finite Element analysis
Material parameter 0% reduction 50%reduction 75%reduction
Compressive strength σc,o [kPa] σc,c 0, 5 · σc,c 0, 25 · σc,cYoung’s modulus Eo[kPa] Ec 0, 5 · Ec 0, 25 · Ec
Undrained shear strength su,o [kPa] su,c 0, 5 · su,c 0, 25 · Su,c
Tensile strength σt,o [kPa] σt,c 0, 5 · σt,c 0, 25 · σt,c
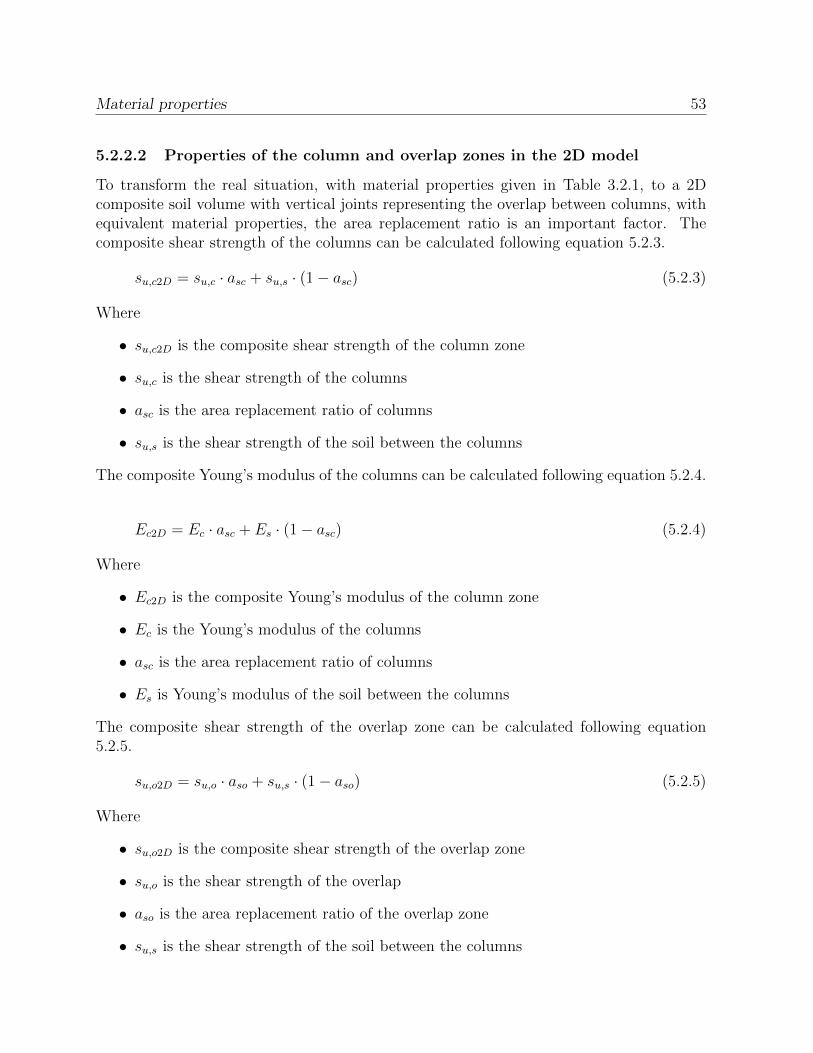
Material properties 53
5.2.2.2 Properties of the column and overlap zones in the 2D model
To transform the real situation, with material properties given in Table 3.2.1, to a 2Dcomposite soil volume with vertical joints representing the overlap between columns, withequivalent material properties, the area replacement ratio is an important factor. Thecomposite shear strength of the columns can be calculated following equation 5.2.3.
su,c2D = su,c · asc + su,s · (1 − asc) (5.2.3)
Where
• su,c2D is the composite shear strength of the column zone
• su,c is the shear strength of the columns
• asc is the area replacement ratio of columns
• su,s is the shear strength of the soil between the columns
The composite Young’s modulus of the columns can be calculated following equation 5.2.4.
Ec2D = Ec · asc + Es · (1 − asc) (5.2.4)
Where
• Ec2D is the composite Young’s modulus of the column zone
• Ec is the Young’s modulus of the columns
• asc is the area replacement ratio of columns
• Es is Young’s modulus of the soil between the columns
The composite shear strength of the overlap zone can be calculated following equation5.2.5.
su,o2D = su,o · aso + su,s · (1 − aso) (5.2.5)
Where
• su,o2D is the composite shear strength of the overlap zone
• su,o is the shear strength of the overlap
• aso is the area replacement ratio of the overlap zone
• su,s is the shear strength of the soil between the columns
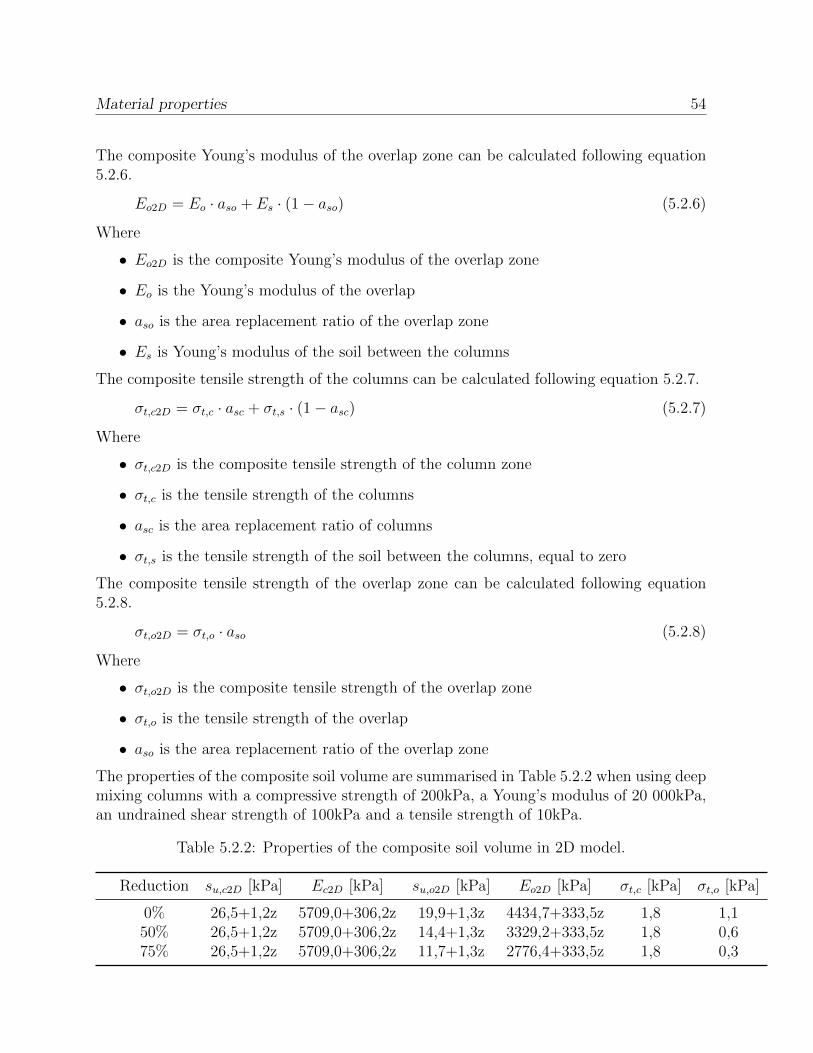
Material properties 54
The composite Young’s modulus of the overlap zone can be calculated following equation5.2.6.
Eo2D = Eo · aso + Es · (1 − aso) (5.2.6)
Where
• Eo2D is the composite Young’s modulus of the overlap zone
• Eo is the Young’s modulus of the overlap
• aso is the area replacement ratio of the overlap zone
• Es is Young’s modulus of the soil between the columns
The composite tensile strength of the columns can be calculated following equation 5.2.7.
σt,c2D = σt,c · asc + σt,s · (1 − asc) (5.2.7)
Where
• σt,c2D is the composite tensile strength of the column zone
• σt,c is the tensile strength of the columns
• asc is the area replacement ratio of columns
• σt,s is the tensile strength of the soil between the columns, equal to zero
The composite tensile strength of the overlap zone can be calculated following equation5.2.8.
σt,o2D = σt,o · aso (5.2.8)
Where
• σt,o2D is the composite tensile strength of the overlap zone
• σt,o is the tensile strength of the overlap
• aso is the area replacement ratio of the overlap zone
The properties of the composite soil volume are summarised in Table 5.2.2 when using deepmixing columns with a compressive strength of 200kPa, a Young’s modulus of 20 000kPa,an undrained shear strength of 100kPa and a tensile strength of 10kPa.
Table 5.2.2: Properties of the composite soil volume in 2D model.
Reduction su,c2D [kPa] Ec2D [kPa] su,o2D [kPa] Eo2D [kPa] σt,c [kPa] σt,o [kPa]
0% 26,5+1,2z 5709,0+306,2z 19,9+1,3z 4434,7+333,5z 1,8 1,150% 26,5+1,2z 5709,0+306,2z 14,4+1,3z 3329,2+333,5z 1,8 0,675% 26,5+1,2z 5709,0+306,2z 11,7+1,3z 2776,4+333,5z 1,8 0,3
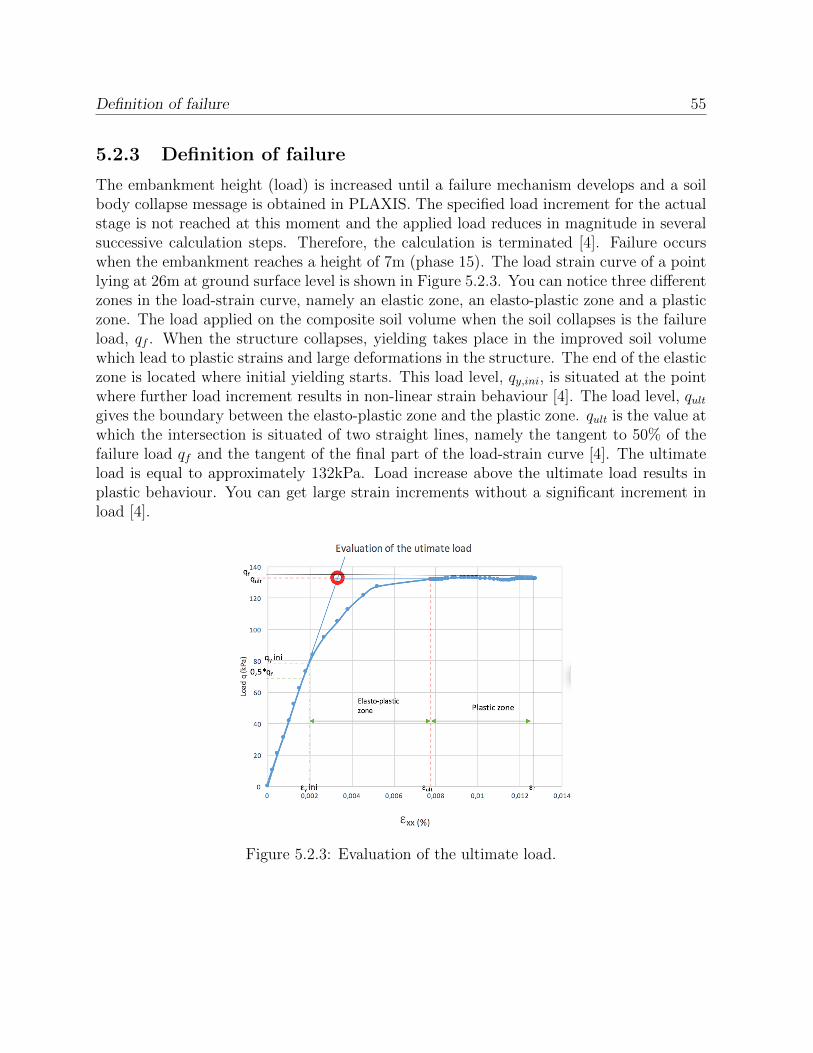
Definition of failure 55
5.2.3 Definition of failure
The embankment height (load) is increased until a failure mechanism develops and a soilbody collapse message is obtained in PLAXIS. The specified load increment for the actualstage is not reached at this moment and the applied load reduces in magnitude in severalsuccessive calculation steps. Therefore, the calculation is terminated [4]. Failure occurswhen the embankment reaches a height of 7m (phase 15). The load strain curve of a pointlying at 26m at ground surface level is shown in Figure 5.2.3. You can notice three differentzones in the load-strain curve, namely an elastic zone, an elasto-plastic zone and a plasticzone. The load applied on the composite soil volume when the soil collapses is the failureload, qf . When the structure collapses, yielding takes place in the improved soil volumewhich lead to plastic strains and large deformations in the structure. The end of the elasticzone is located where initial yielding starts. This load level, qy,ini, is situated at the pointwhere further load increment results in non-linear strain behaviour [4]. The load level, qultgives the boundary between the elasto-plastic zone and the plastic zone. qult is the value atwhich the intersection is situated of two straight lines, namely the tangent to 50% of thefailure load qf and the tangent of the final part of the load-strain curve [4]. The ultimateload is equal to approximately 132kPa. Load increase above the ultimate load results inplastic behaviour. You can get large strain increments without a significant increment inload [4].
Figure 5.2.3: Evaluation of the ultimate load.
Safety analysis 56
5.2.4 Safety analysis
To obtain the safety factors of the numerical model in the sequencing building stages, asafety analysis is performed in PLAXIS. With this safety analysis, a global safety factorwill be determined for all the construction stages.
The global safety factor is defined as the ratio of the collapse load to the working load, asseen in Equation 5.2.9 [38].
SF =Smaximumavailable
Sneededforequilibrium
(5.2.9)
Where S is the shear strength.By introducing the standard Coulomb condition, the safety factor is obtained, as seen inequation 5.2.10 [38].
SF =c− σn tan(φ)
cr − σn tan(φr)(5.2.10)
Where c and φ are the input strength parameters and σn is the actual stress component.The parameters cr and φr are reduced strength parameters that are just large enough tomaintain equilibrium. The principle described above is the basis for a safety analysis inPLAXIS to calculate the global safety factor [38]. In this approach, the cohesion and thetangent of the friction angle are reduced in the same proportion, as seen in Equation 5.2.11[38].
c
cr=
tan(φ)
tan(φr)=
∑Msf (5.2.11)
The reduction of the strength parameters is controlled by the total multiplier∑Msf . This
parameter is increased in a step-by-step procedure in PLAXIS until failure occurs. Thesafety factor is then defined as the value of
∑Msf at failure [38].
5.3 Results
The results obtained by the numerical model are given in this chapter.
5.3.1 Analysis of the failure mode
The deep mixing columns have a compressive strength of 200kPa, a Young’s modulus of20000kPa, an undrained shear strength of 100kPa and a tensile strength of 10kPa in thebase case.
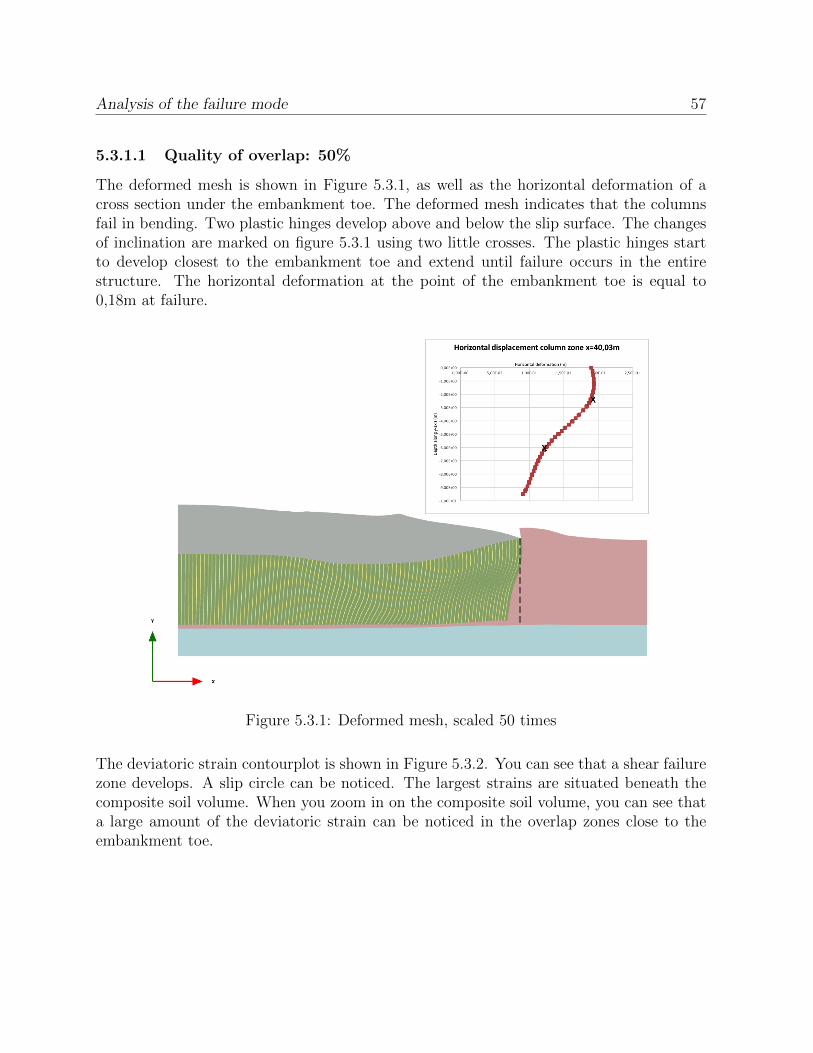
Analysis of the failure mode 57
5.3.1.1 Quality of overlap: 50%
The deformed mesh is shown in Figure 5.3.1, as well as the horizontal deformation of across section under the embankment toe. The deformed mesh indicates that the columnsfail in bending. Two plastic hinges develop above and below the slip surface. The changesof inclination are marked on figure 5.3.1 using two little crosses. The plastic hinges startto develop closest to the embankment toe and extend until failure occurs in the entirestructure. The horizontal deformation at the point of the embankment toe is equal to0,18m at failure.
Figure 5.3.1: Deformed mesh, scaled 50 times
The deviatoric strain contourplot is shown in Figure 5.3.2. You can see that a shear failurezone develops. A slip circle can be noticed. The largest strains are situated beneath thecomposite soil volume. When you zoom in on the composite soil volume, you can see thata large amount of the deviatoric strain can be noticed in the overlap zones close to theembankment toe.
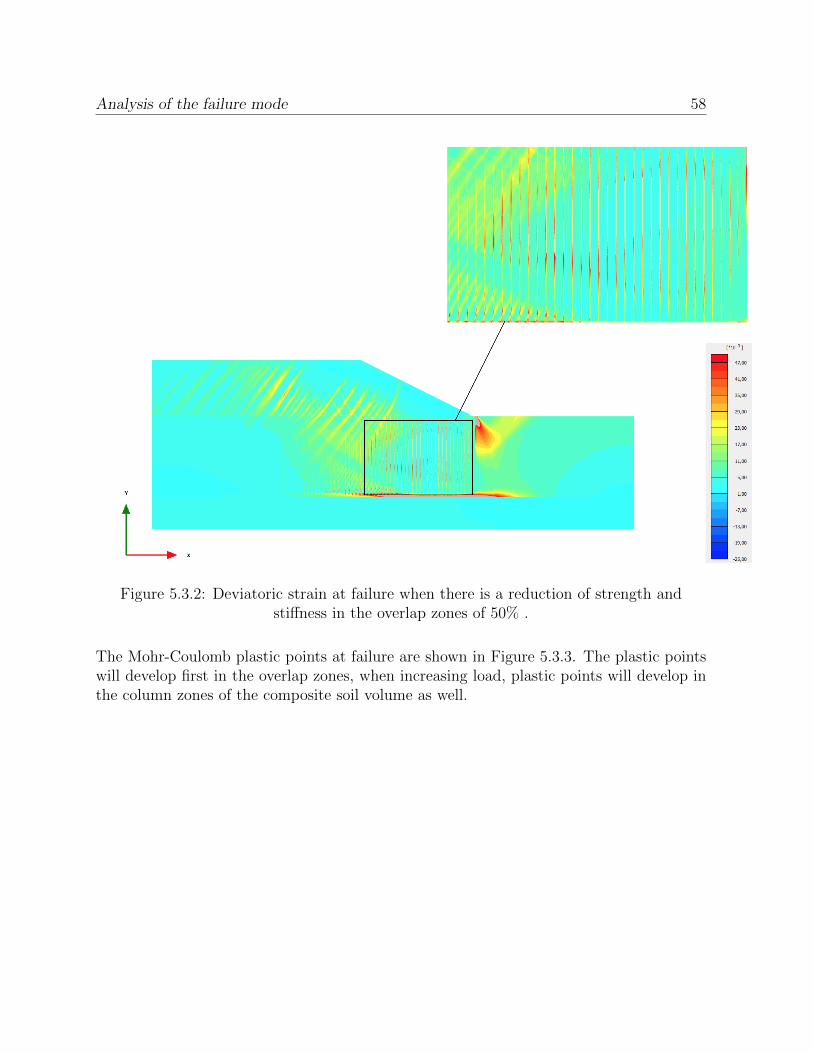
Analysis of the failure mode 58
Figure 5.3.2: Deviatoric strain at failure when there is a reduction of strength andstiffness in the overlap zones of 50% .
The Mohr-Coulomb plastic points at failure are shown in Figure 5.3.3. The plastic pointswill develop first in the overlap zones, when increasing load, plastic points will develop inthe column zones of the composite soil volume as well.
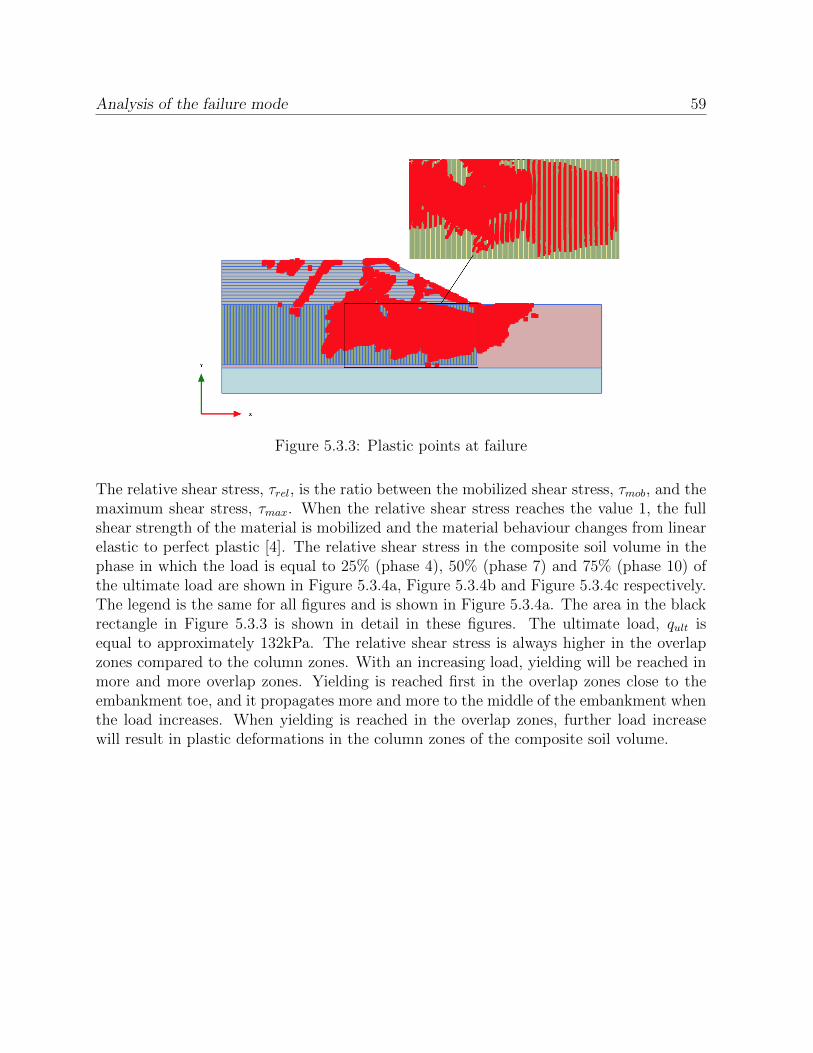
Analysis of the failure mode 59
Figure 5.3.3: Plastic points at failure
The relative shear stress, τrel, is the ratio between the mobilized shear stress, τmob, and themaximum shear stress, τmax. When the relative shear stress reaches the value 1, the fullshear strength of the material is mobilized and the material behaviour changes from linearelastic to perfect plastic [4]. The relative shear stress in the composite soil volume in thephase in which the load is equal to 25% (phase 4), 50% (phase 7) and 75% (phase 10) ofthe ultimate load are shown in Figure 5.3.4a, Figure 5.3.4b and Figure 5.3.4c respectively.The legend is the same for all figures and is shown in Figure 5.3.4a. The area in the blackrectangle in Figure 5.3.3 is shown in detail in these figures. The ultimate load, qult isequal to approximately 132kPa. The relative shear stress is always higher in the overlapzones compared to the column zones. With an increasing load, yielding will be reached inmore and more overlap zones. Yielding is reached first in the overlap zones close to theembankment toe, and it propagates more and more to the middle of the embankment whenthe load increases. When yielding is reached in the overlap zones, further load increasewill result in plastic deformations in the column zones of the composite soil volume.
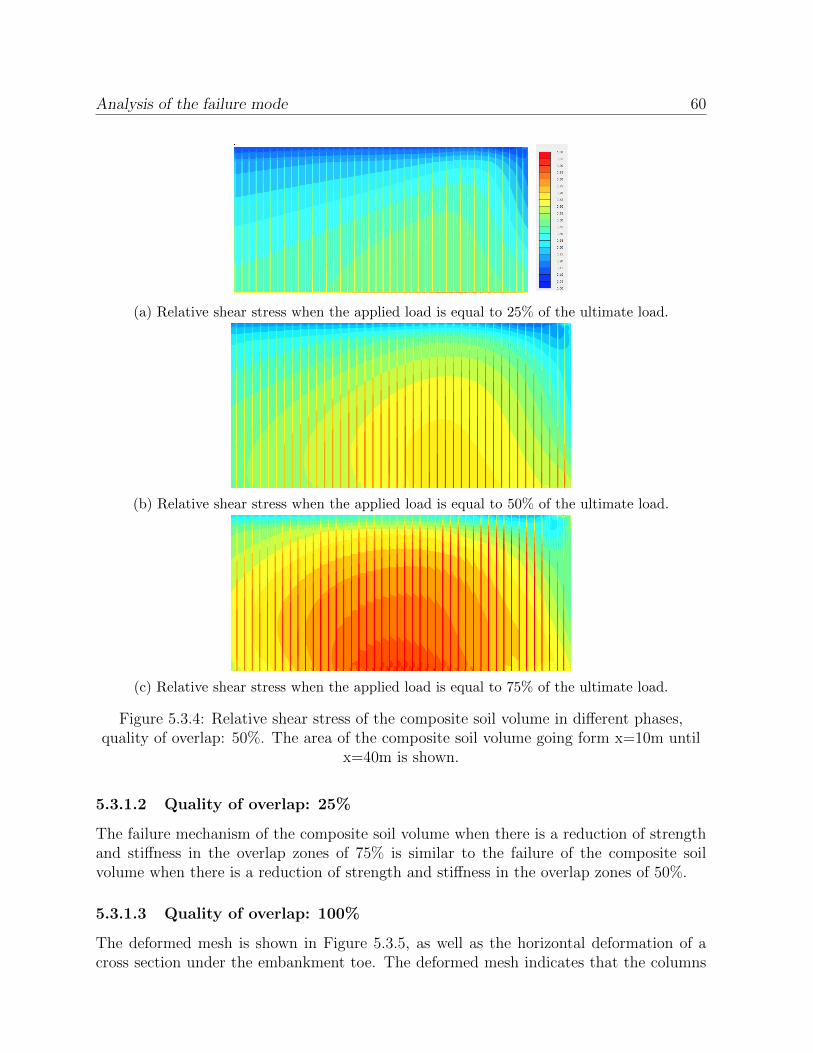
Analysis of the failure mode 60
(a) Relative shear stress when the applied load is equal to 25% of the ultimate load.
(b) Relative shear stress when the applied load is equal to 50% of the ultimate load.
(c) Relative shear stress when the applied load is equal to 75% of the ultimate load.
Figure 5.3.4: Relative shear stress of the composite soil volume in different phases,quality of overlap: 50%. The area of the composite soil volume going form x=10m until
x=40m is shown.
5.3.1.2 Quality of overlap: 25%
The failure mechanism of the composite soil volume when there is a reduction of strengthand stiffness in the overlap zones of 75% is similar to the failure of the composite soilvolume when there is a reduction of strength and stiffness in the overlap zones of 50%.
5.3.1.3 Quality of overlap: 100%
The deformed mesh is shown in Figure 5.3.5, as well as the horizontal deformation of across section under the embankment toe. The deformed mesh indicates that the columns
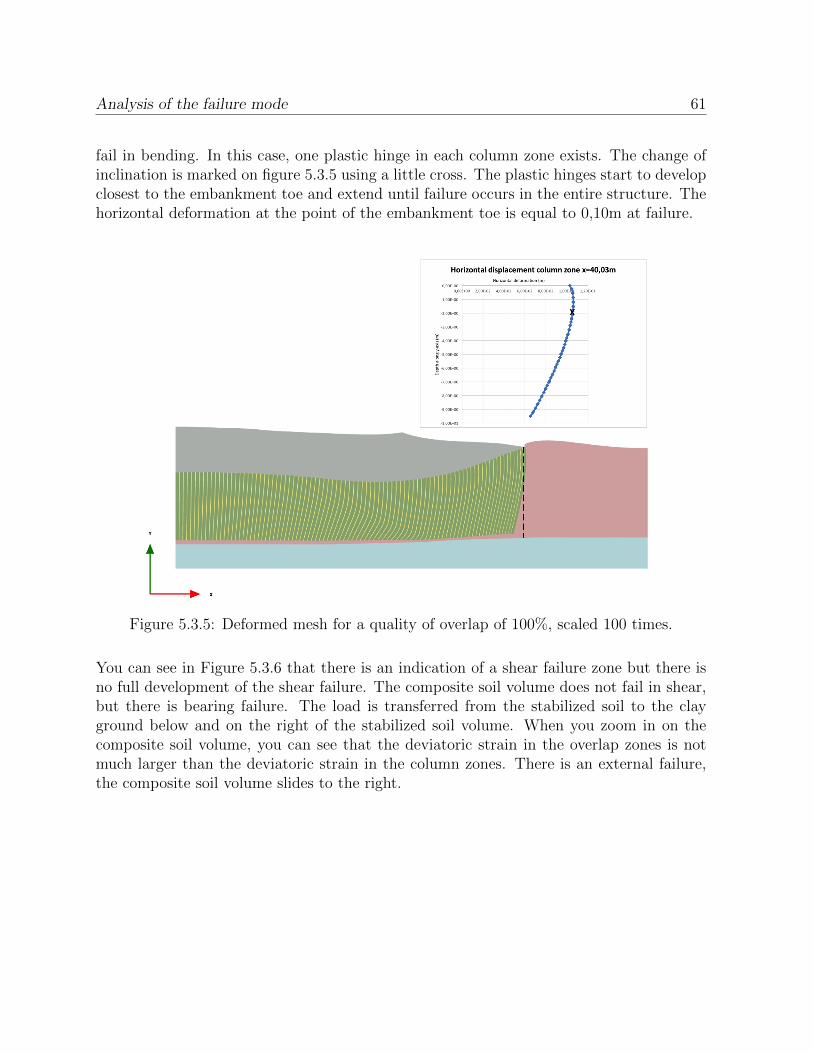
Analysis of the failure mode 61
fail in bending. In this case, one plastic hinge in each column zone exists. The change ofinclination is marked on figure 5.3.5 using a little cross. The plastic hinges start to developclosest to the embankment toe and extend until failure occurs in the entire structure. Thehorizontal deformation at the point of the embankment toe is equal to 0,10m at failure.
Figure 5.3.5: Deformed mesh for a quality of overlap of 100%, scaled 100 times.
You can see in Figure 5.3.6 that there is an indication of a shear failure zone but there isno full development of the shear failure. The composite soil volume does not fail in shear,but there is bearing failure. The load is transferred from the stabilized soil to the clayground below and on the right of the stabilized soil volume. When you zoom in on thecomposite soil volume, you can see that the deviatoric strain in the overlap zones is notmuch larger than the deviatoric strain in the column zones. There is an external failure,the composite soil volume slides to the right.
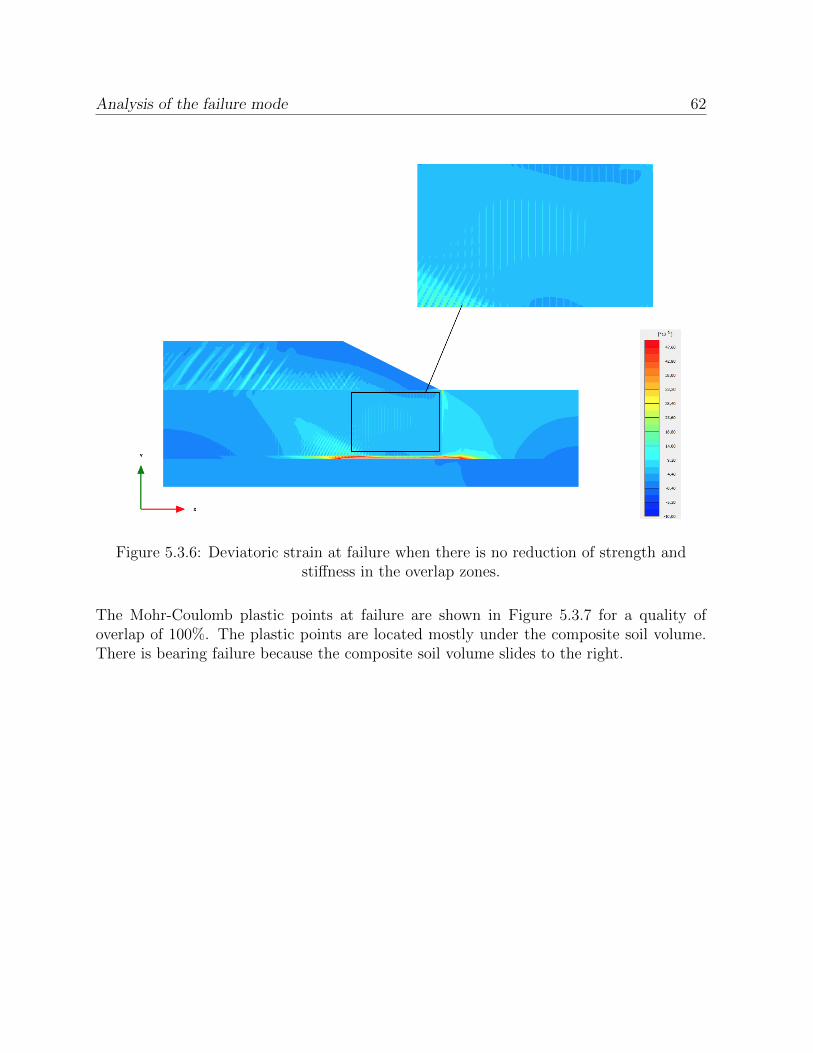
Analysis of the failure mode 62
Figure 5.3.6: Deviatoric strain at failure when there is no reduction of strength andstiffness in the overlap zones.
The Mohr-Coulomb plastic points at failure are shown in Figure 5.3.7 for a quality ofoverlap of 100%. The plastic points are located mostly under the composite soil volume.There is bearing failure because the composite soil volume slides to the right.
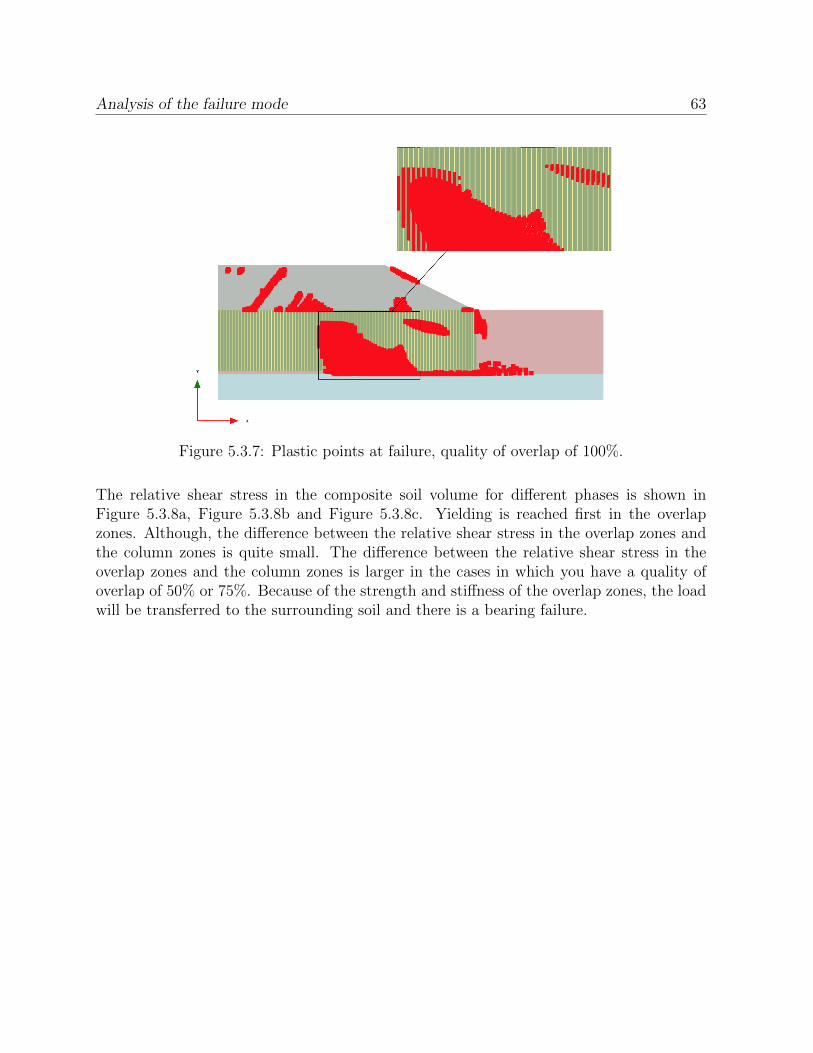
Analysis of the failure mode 63
Figure 5.3.7: Plastic points at failure, quality of overlap of 100%.
The relative shear stress in the composite soil volume for different phases is shown inFigure 5.3.8a, Figure 5.3.8b and Figure 5.3.8c. Yielding is reached first in the overlapzones. Although, the difference between the relative shear stress in the overlap zones andthe column zones is quite small. The difference between the relative shear stress in theoverlap zones and the column zones is larger in the cases in which you have a quality ofoverlap of 50% or 75%. Because of the strength and stiffness of the overlap zones, the loadwill be transferred to the surrounding soil and there is a bearing failure.
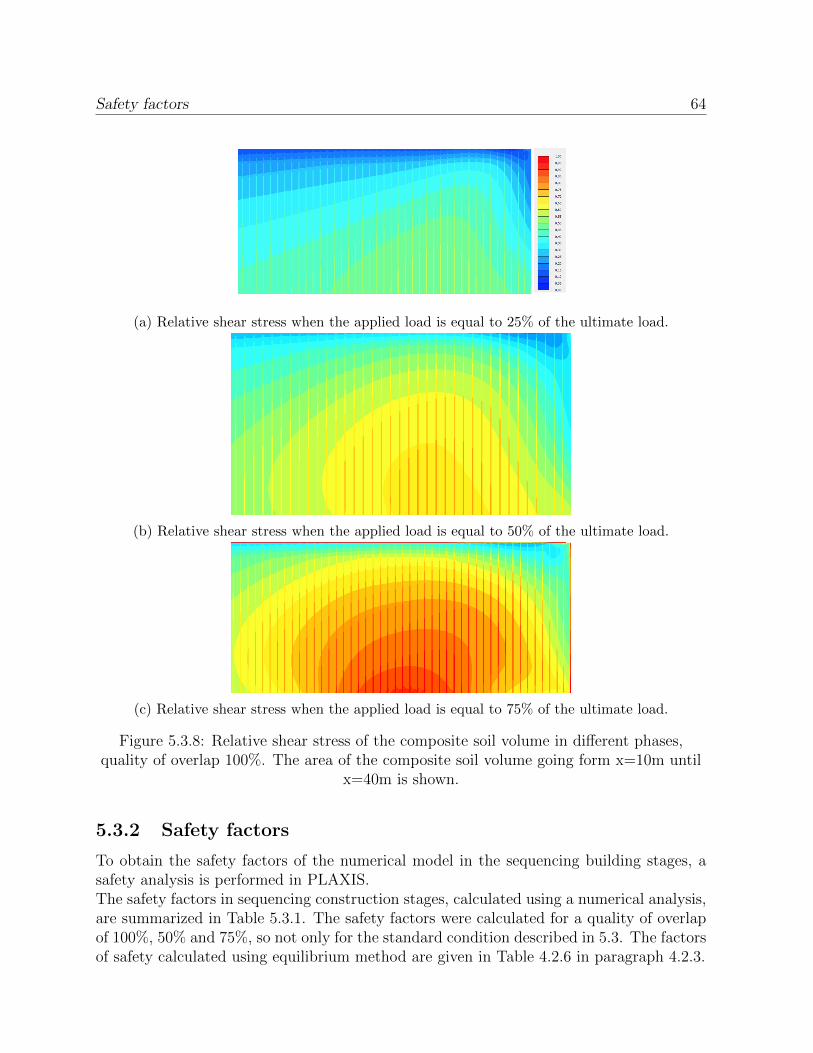
Safety factors 64
(a) Relative shear stress when the applied load is equal to 25% of the ultimate load.
(b) Relative shear stress when the applied load is equal to 50% of the ultimate load.
(c) Relative shear stress when the applied load is equal to 75% of the ultimate load.
Figure 5.3.8: Relative shear stress of the composite soil volume in different phases,quality of overlap 100%. The area of the composite soil volume going form x=10m until
x=40m is shown.
5.3.2 Safety factors
To obtain the safety factors of the numerical model in the sequencing building stages, asafety analysis is performed in PLAXIS.The safety factors in sequencing construction stages, calculated using a numerical analysis,are summarized in Table 5.3.1. The safety factors were calculated for a quality of overlapof 100%, 50% and 75%, so not only for the standard condition described in 5.3. The factorsof safety calculated using equilibrium method are given in Table 4.2.6 in paragraph 4.2.3.
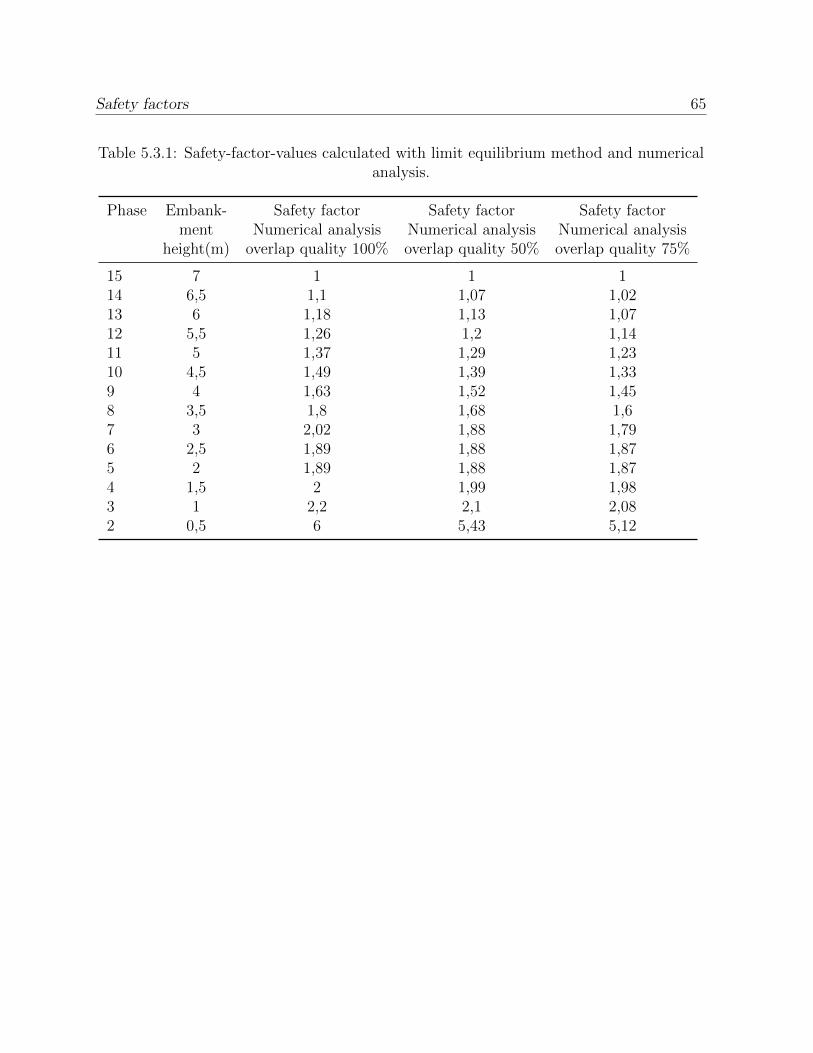
Safety factors 65
Table 5.3.1: Safety-factor-values calculated with limit equilibrium method and numericalanalysis.
Phase Embank- Safety factor Safety factor Safety factorment Numerical analysis Numerical analysis Numerical analysis
height(m) overlap quality 100% overlap quality 50% overlap quality 75%
15 7 1 1 114 6,5 1,1 1,07 1,0213 6 1,18 1,13 1,0712 5,5 1,26 1,2 1,1411 5 1,37 1,29 1,2310 4,5 1,49 1,39 1,339 4 1,63 1,52 1,458 3,5 1,8 1,68 1,67 3 2,02 1,88 1,796 2,5 1,89 1,88 1,875 2 1,89 1,88 1,874 1,5 2 1,99 1,983 1 2,2 2,1 2,082 0,5 6 5,43 5,12
Chapter 6
General discussion
6.1 Risk for extrusion
Extrusion of the soft clay ground can occur if the shear walls are widely spaced. The2D numerical model cannot capture extrusion of the soft ground between shear panels.Therefore, the safety factors for extrusion of soft ground between shear panels are calculatedin sequencing construction stages using the limit equilibrium method. The safety factorsare calculated for different distances between the rows of deep mixing columns. The resultsfrom this calculation show that a distance of 3m between the shear panels is acceptable.Therefore it can be concluded that the composite soil model using a distance of 3m betweenthe shear panels is valid against internal failure.
6.2 Influence of overlap between adjacent columns
It can be seen from paragraph 5.3.1 that a shear failure mechanism will develop in thecomposite soil volume when there is a quality of overlap of 50%. A slip circle can benoticed. A large amount of the deviatoric strain is present in the overlap zones. Yieldingis reached first in the overlap zones close to the embankment toe, and it propagates moreand more to the middle of the embankment when the load increases. When yielding isreached in the overlap zones, further load increase will result in plastic deformations in thecolumn zones of the composite soil volume.
When the composite soil volume becomes stronger, you have to consider that there is apossibility that the composite soil volume will not fail in shear. It can be seen from theresults of the numerical model that when columns with a shear strength of 100kPa and aquality of overlap of 100% are used, the slip circle is not fully developed but bearing failureoccurs instead. The load is transferred from the stabilized soil to the clay ground belowand on the right of the stabilized soil volume. There is an external failure, the compositesoil volume slides to the right.
66
How representative is LEM compared to numerical analysis? 67
The difference between the deviatoric strain present in the column zones and overlap zonesis smaller than in the in which there is a quality of overlap of 50%. It can be seen fromthe relative shear stress plot that yielding is reached first in the overlap zones. Although,the difference between the relative shear stress in the overlap zones and the column zonesis smaller than the difference in the cases in which you have a quality of overlap of 50%.Because of the great strength and stiffness of the overlap zones, the load will be transferredto the surrounding soil and there is a bearing failure due to the sliding of the compositesoil volume.
6.3 How representative is LEM compared to numer-
ical analysis?
A 2D numerical plane strain model was made to observe the failure mechanisms and calcu-late the safety factors in sequencing construction stages. The three-dimensional columnsare represented by a composite soil volume consisting of vertical joints representing theoverlap between adjacent columns. The factor-of-safety values calculated using the analyt-ical method proposed in this study, including the reduced quality of overlap are comparedto the factor-of-safety values obtained by the numerical model.The factor-of-safety-values for the limit equilibrium method and the numerical analysesare similar. The factor-of-safety-value is smaller for the numerical analyses compared tothe limit equilibrium method. It is already proven by Kitazume et al. [1], [34], [23], [20]that the limit equilibrium method slightly overestimates the safety factors compared to anumerical analysis. This is due to the possibility that different failure modes can occur inthe deep mixing columns at failure and not only shear failure as assumed by LEM. Thisconclusion is strengthened here. The ratio of the factor of safety from the limit equilibriumanalysis to the factor of safety from numerical analysis, FSLE/FSNM is plotted againstthe applied embankment load for the different qualities of overlap in Figure 6.3.1. Youcan see that the limit equilibrium method overestimates the safety factor with a factorof 1,5 or even more for small stresses. This indicates that the safety factor might besignificantly overestimated for lower embankments when the limit equilibrium method isused, and that this question should be further studied. The ratio FSLE/FSNM is lowerfor higher embankment loads. The overlap quality influences the factor-of-safety-valuesalthough the effect is relatively small. The worse the overlap quality is, the greater theratio FSLE/FSNM is for the late construction stages.
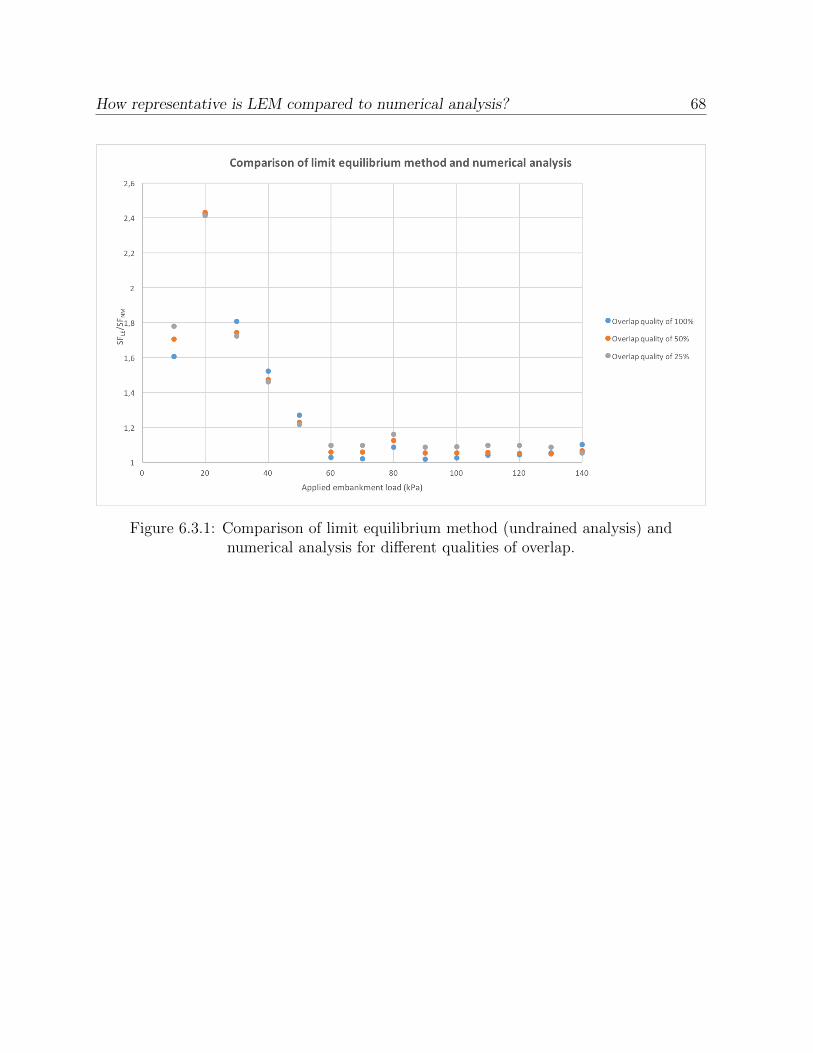
How representative is LEM compared to numerical analysis? 68
Figure 6.3.1: Comparison of limit equilibrium method (undrained analysis) andnumerical analysis for different qualities of overlap.
Chapter 7
Conclusions
The conclusions are summarized here.
• The factor-of-safety-values are smaller for the numerical analyses compared to thelimit equilibrium method. It is already proven by Kitazume et al. [1], [34], [23],[20] that the limit equilibrium method slightly overestimates the safety factors. Thisconclusion is strengthened here. The overestimation of the safety factor is higher forlower embankment loads. It is recommended that this should be further studied infuture work.
• There is a possibility that the composite soil volume will not fail in shear so that ananalysis using the limit equilibrium method will not be enough. A shear failure modedevelops when the quality of overlap is weak (50% and 25%). An external slidingfailure occurs when the quality of overlap is strong.
• It can be concluded that it is better to include the reduced quality of overlap in theanalytical calculations, following the method proposed in this study, in order to geta safe design because the safety factor decreases when the quality of overlap reduces.The Swedish design code does not take any reduction of strength and stiffness in theoverlap zones between adjacent columns into account.
69
Bibliography
[1] Kitazume M. & Maruyama K. (2006) External stability of group column type deepmixing improved ground under embankment loading. Soils and foundations Vol. 46,No. 3, 323-340, June 2006.
[2] Binh Nguyen T. T. (2016) Failure of Deep Mixing Column Group reinforced by ShallowMixing Layer. Tokyo Institute of Technology, Japan, 2015
[3] Adams T.E. (2011) Stability of levees and floodwalls supported by deep mixed shearwalls: five case studies in the New Orleans area. PhD dissertation, Virginia PolytechnicInstitute and State University, Blacksburg VA.
[4] Ignat R. , Baker S., Larsson S. & Liedberg S. (2015) Two- and three-dimensionalanalyses of excavation support with rows of dry deep mixing columns. Computers andGeotechnics, Vol. 66, p16-30, January 2015.
[5] Charbit, B. (2009). Numerical Analysis of laterally loaded lime/cement columns. RoyalInstitute of Technology, Stockholm, Sweden.
[6] Mohammed Salim Al-Naqshabandy ”Strength variability in lime-cement columns andits effect on the reliability of embankments.”,KTH Royal Institute of Technology: De-partment of Civil and Architectural Engineering, Stockholm, 2011
[7] Filz, G.M. & Navin, M.P. (2006) Stability of column-supported embankments. VirginiaTransportation Research Council, Charlottesville, Virginia, 64 p.
[8] Broms, B. B. (2004) Lime and lime/cement columns Chapter 8 in Ground Improvement2nd edition, edited by Moseley M.P. & Kirsch K., London and New York, Spon Press,2004.
[9] Trafikverket. (2014). TK Geo 13: Technical requirements for geoconstructions-Trafikverkets tekniska krav fr geokonstruktioner. The Swedish Transport Administra-tion, Sweden, Publ. TDOK 2013:0667.
[10] Rolf Larsson (2006) Rapport 17: Djupstabilisering med bindemedels- stabiliser-ade pelare och masstabilisering. Swedish Deep Stabilization Research Centre, 2006,Linkping.
70
BIBLIOGRAPHY 71
[11] Skredkommissionen (1995) Anvisningar fr slntstabilitetsutredningar. Commission onslope stability, 1995, Linkping.
[12] Filz G., Templeton A.E. , Tiffany E. & Adams P.E. (2011) Stability analyses for leveeson deep-mixed shear walls. Grout improvement, p117-126, volume 164 Issue GI3, 2011
[13] Smith M.E. (2005) Design of bridgning layers in geosynthetic-reinforced column-supported embankments. PhD dissertation, Virginia Polytechnic Institute and StateUniversity, Blacksburg VA.
[14] Keller Company (2017) Deep soil mixing: improvement by the DSM method. BrochureKeller company, Londen, UK
[15] Venda Oliveira P.J., Pinheiro J.P.L.& Correia A.A.S (2011) Numerical analysis of anembankment built on soft soil reinforced with deep mixing columns: Parametric study.Computers and Geotechnics, Vol. 38, p.566-576.
[16] Edil T.B. & Staab D.A. (2005) Practitioners guide for deep-mixed stabilization oforganic soils and peat. Final report. The national deep mixing research program, projectnumber NDM302
[17] Larsson S. (2005) State of Practice Report-Execution, monitoring and quality control.Royal Institute of Technology, Stockholm, Sweden
[18] Bruce C., Berg R.R, Collin J.G., Filz G.M., Terashi M. &, Yang D.S. (2013) FederalHighway Administration Design Manual: Deep Mixing for Embankment and FoundationSupport. Geotechnical, Sa., Inc., Venetia
[19] Filz G., Adams T., Navin M., & Templeton A.E. (2012) Design of Deep Mixing forSupport of Levees and Floodwalls. Grouting and Deep Mixing, pp.89-133, 2012
[20] Kitazume M. & Terashi M. (2002) The deep mixing method principle, design andconstruction. Edited by Coastal Development Institute of Technology, Balkema, Japan
[21] Hanson J. L., Termaat R.J (2001) Deep Mixing. Soft Ground Technology Conference,pp105-122, Noordwijkerhout, the Netherlands
[22] Takano M. et al. (2015) Cement deep mixing in Lach Huyen port construction projectin Northern Vietnam. Deep Mixing. Deep foundation Institute, pp 309-318, Hawthorne,USA.
[23] Kitazume M. (2009) A parametric study on evaluation of stability of column type deepmixing improved ground. Proc. of Int. Symp. on Geoenvironmental Eng. September8-10, 2009, Hangzhou, China.
[24] Navin M.P. (2005) Stability of embankments founded on soft soil improved with deepmixing-method columns. PhD dissertation, Virginia Polytechnic Institute and StateUniversity, Blacksburg VA
BIBLIOGRAPHY 72
[25] Han J., Chen J., Hong Z., & Shen S. (2005) Mitigation of levee failures using deepmixed columns and geosynthetics. Geom Geoeng, Vol. 1, p. 49-55.
[26] Han J., Oztoprak S., Parsons R.L. & Huang J. (2007) Numerical analysis of foundationcolumns to support widening of embankment. Computers and Geotechnics, Vol. 34(6),p.435-48.
[27] Huang J., Han J. & Porbaha A. (2006) Two and three-dimensional modeling of DMcolumns under embankments. GeoCongress, Geotechnical engineering in the Informa-tion technology age, ASCE, Atlanta.
[28] Ignat R. (2015) Field and laboratory tests of laterally loaded rows of lime-cementcolumns. Royal Institute of Technology, Stockholm, Sweden.
[29] Kivelo M. & Broms, B.B. (1999) Mechanical behavior and shear resistance oflime/cement columns. Proceedings of the International Conference on Dry Mix Methodsfor Deep Soil Stabilization, Stockholm, pp. 115-121, October 1999.
[30] Adams T.E., Filz G.M. & Navin M. (2009) Stability of embankments and levees ondeep mixed foundations. Proceedings of the international symposium on deep mixingand admixture stabilization, p.305-100, Kinawa.
[31] Adams T.E., Filz G.M., Cali PR., & Woodward ML. (2008) Stability Analyses of aLevee on Deep Mixed Columns, Plaquemines Parish, Louisiana. ASCE GeotechnicalSpecial Publication No. 178; p. 708-15
[32] Larsson S. (1999) Shear box apparatus for modeling chemical stabilized soil introduc-tory tests. Proceedings of the international conference on dry mix methods for deep soilstabilization, p. 115-21, Stockholm
[33] Larsson S. & Broms B.B. (2000). Shear box model tests with lime/cement columnssome observations of failure mechanisms. Proceedings of geoeng, 6p Melbourne.
[34] Kitazume M. & Maruyama K. (2007) Internal stablity of group column type deepmixing improved ground under embankment loading. Soils and foundations Vol. 47,No. 3, 437-455, June 2007.
[35] Yang T., Tan T.S. & Leung C.F. (2011) Mass behaviour of embedded improved soilraft in an excavation. Proceeding of he Institution of Civil EngineersGeotechnical En-gineering, Vol. 164, p.11-25
[36] PLAXIS (2011) Plaxis: Materials Model Manual. Plaxis company, The Netherlands.
[37] Das Braja M. & Sobhan K. (2014) Principles of Geotechnical Engineering. Eight Edi-tion. United States of America: Cengage Learning, 2014
[38] R. B. J. Brinkgreve, 2011 Plaxis Introductory: Student Pack and Tutorial Manual2010, Publisher: Plaxis BV

TRITA 17:02
ISSN 1652-599X
www.kth.se