Embed Size (px)
Citation preview
Page 1 of 36
Two Decades of TABOR Analysis of Colorado’s Taxpayer’s Bill of Rights
Twenty-Years-After (Expanded, Supportive Edition)
Research Paper, June 14, 2016
By Fred Holden
Public Policy Specialist, Speaker and Author,
TOTAL Power of ONE in America:
Discover What You Need to Know,
Why and How to be a More Powerful Person and Citizen
Page 2 of 36
Executive Summary
Twenty years of TABOR have passed since Colorado voters
adopted The Taxpayer’s Bill of Rights in 1992, “to
reasonably restrict most the growth of government.” It is in
Colorado’s Constitution as Article X-Revenue, Section 20.
TABOR allows government to grow each year at the rate of
Colorado inflation-plus-population; plus more tax growth by
presentation of the districts and consent of the voters.
The Comprehensive Annual Financial Report, CAFR, is the
annual professionally-audited government accounting
document, thirty-years-of-which provided the three decades
of this report: Pre-TABOR, TABOR Decade-1 and TABOR Decade-2.
The results are revealing and encouraging. Pre-TABOR serves as a
reference “Compared to what?’ to help analyze and compare the Two
Decades of TABOR performance in these four areas:
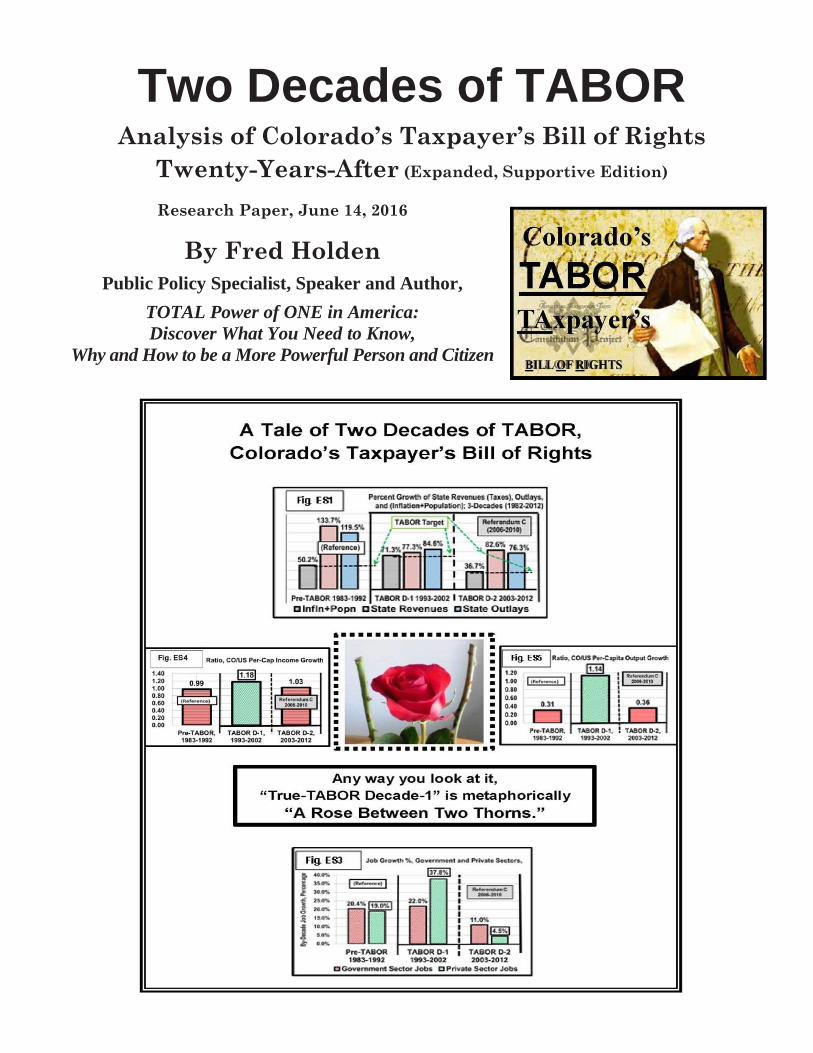
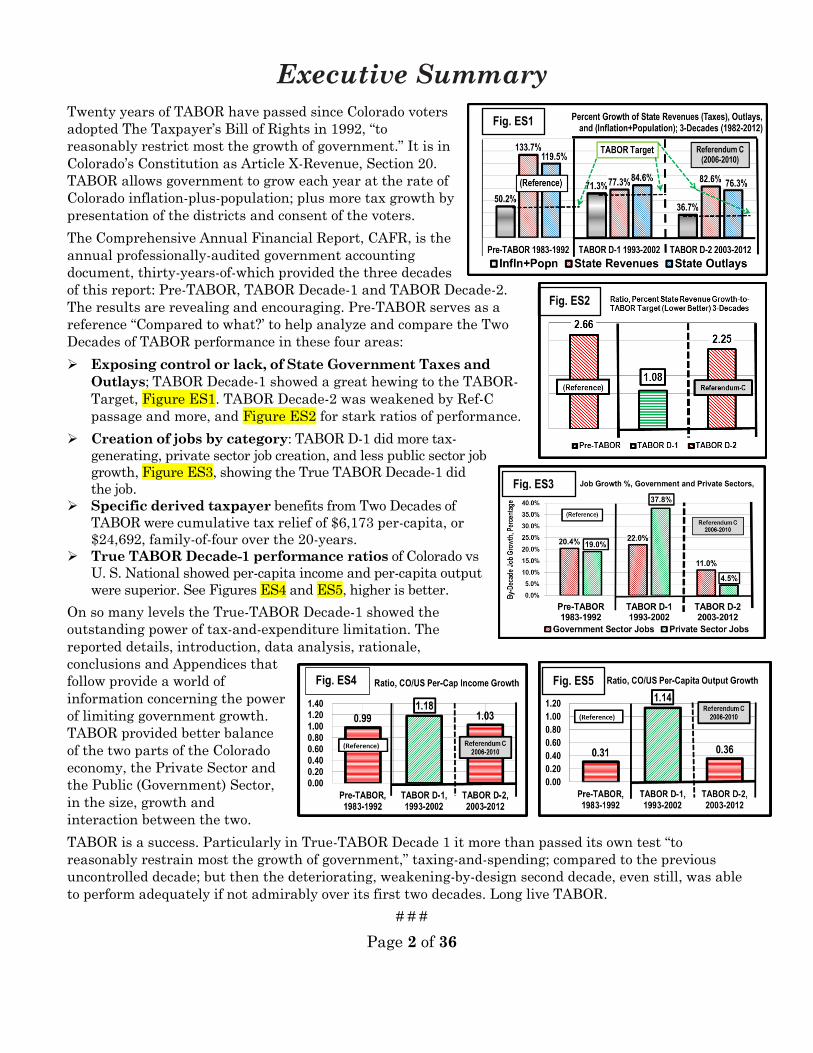
Exposing control or lack, of State Government Taxes and
Outlays; TABOR Decade-1 showed a great hewing to the TABOR-
Target, Figure ES1. TABOR Decade-2 was weakened by Ref-C
passage and more, and Figure ES2 for stark ratios of performance.
Creation of jobs by category: TABOR D-1 did more tax-
generating, private sector job creation, and less public sector job
growth, Figure ES3, showing the True TABOR Decade-1 did
the job.
Specific derived taxpayer benefits from Two Decades of
TABOR were cumulative tax relief of $6,173 per-capita, or
$24,692, family-of-four over the 20-years.
True TABOR Decade-1 performance ratios of Colorado vs
U. S. National showed per-capita income and per-capita output
were superior. See Figures ES4 and ES5, higher is better.
On so many levels the True-TABOR Decade-1 showed the
outstanding power of tax-and-expenditure limitation. The
reported details, introduction, data analysis, rationale,
conclusions and Appendices that
follow provide a world of
information concerning the power
of limiting government growth.
TABOR provided better balance
of the two parts of the Colorado
economy, the Private Sector and
the Public (Government) Sector,
in the size, growth and
interaction between the two.
TABOR is a success. Particularly in True-TABOR Decade 1 it more than passed its own test “to
reasonably restrain most the growth of government,” taxing-and-spending; compared to the previous
uncontrolled decade; but then the deteriorating, weakening-by-design second decade, even still, was able
to perform adequately if not admirably over its first two decades. Long live TABOR.
# # #
Fig. ES1
Fig. ES2
Fig. ES3
Fig. ES4 Fig. ES5
Page 3 of 36
Introduction
It can be no secret that government tax-and-expenditure limitations are anathema to those
in-and-around governments. But to the people, to the hard-working, taxpaying people, both
public (government) and private sectors, such limitation brings government power and
control closer to the people. As such it is unlikely that those in government will ever so bind
themselves. Fortunately, Colorado is one of 26 “Initiative and Referendum States.”.i
Keep in mind throughout this Research Paper that TABOR Decade 1 was accepted and
enforced in a respected, unencumbered and most abided-by, in its initial implementation,
then decay.
The TABOR Amendment: What is It, and Why?
“Slow government growth” is the three-word mission statement of Colorado citizens who
created the Taxpayer’s Bill of Rights. Its second sentence elaborates, “Its preferred
interpretation shall reasonably restrain most the growth of government.” TABOR is a
unique, controversial and powerful tax-and-spending limitation amendment to the Colorado
Constitution. It is found in Article X-Revenue, Section 20. The full text of TABOR is provided
as Appendix G in this Research Paper. No other state has such a comprehensive tax-and-
spending-limitation in place. With twenty years history, its impacts can be, and herein are,
studied, quantified and analyzed, and compared to the preceding non-TABOR 10-years. The
three decade aredubbed Pre-TABOR, TABOR D-1 and TABOR D-2, or in more descriptive
words, No-TABOR, True-TABOR, and Weakened-TABOR.
The Taxpayer’s Bill of Rights’ main objective was to contain government taxation-and-
spending growth, but not be any sort of barrier to necessary government growth. TABOR
requires voter approval of all tax-and-debt increases, “or a tax policy change directly causing
a net tax revenue gain to any district,” Colorado Constitution, Article 10, Section 20, (4) (a).
Early efforts to enact the first 1988 version of TABOR foundered on the issue of restrictions
on government fees. The voter-approved 1992 version of TABOR did not include direct limits
on fees. Instead, the annual increase in overall state spending and taxing was limited to the
annual rate of inflation-plus-population growth, based on “United States Bureau of Labor
Statistics Consumer Price Index for Denver-Boulder-Greeleyii, all items, all urban
consumers, or its successor index.” [Art X, Sec. 20, (2) (f)]. Local revenue growth was limited
by other provisions.
Importantly, TABOR exempts much government income from itself, covered later, and
requires public disclosures and ballot information about proposed tax or spending increases.
TABOR does not tell lawmakers what legislation to pass or how to apportion available
moneys to spending. With provisions for logical annual increasing spending, TABOR does
limit the total amount of money spent and does prevent new taxes or tax rate increases,
although governments may justify and request more money; and voters are always free to
approve extra spending, debt or taxes. TABOR encourages elected officials to seek, justify,
promote and offer by referendum to Colorado voters, necessary additional taxes, resulting in
rewarding good government with more funds for new and/or existing successful programs.
Page 4 of 36
What Was TABOR Supposed to Do?
Here are some intended outcomes of the tax-and- spending limitation Colorado
Constitution Taxpayer’s Bill of Rights Amendment:
Slow -- not stop or cut -- growth of state and local governments’ taxes and
spending, without diminishing or damaging governments’ important roles,
functions, responsibilities and operations,
Reveal TABOR’s influence, if any, on “Jobs, Jobs, Jobs,” almost a mantra by
those running for or serving in public office, especially by the voters who put
them there to live by their public works and public service.
Control and provide information about local debt.
Put the people who pay the taxes more in control of their taxes.
Encourage better government performance and utilization of public moneys.
Create incentives for fiscal prudence and government productivity.
Stimulate growth of entrepreneurship, businesses and employment, to help
create Coloradan’s higher standard-of-living and quality-of-life.
TABOR — Love It or Hate It, but Can’t Ignore It
TABOR enjoys a love-hate relationship. Polls show that strong majorities of taxpayers and
small business owners, leaders and managers, the SGAs, Small Government Advocates, love
TABOR. Those who like to control and expand state spending or are its recipients, the BGAs,
Big Government Advocates, hate it. TABOR gets in the way of the latter’s lobbying,
legislative and political agenda, in doling out and receiving largesse, creating a bigger fiscal
pie or piece of the pie — a bigger state — that can dispense more government (taxpayer-
funded) goodies all around, and in the process, be able to exert more and greater control over
Colorado citizens.
In a 1987 meeting following the defeat of the 1986 tax limitation Amendment 4, George
Dibble, then-president of Colorado Association of Commerce and Industry (CACI), the state
business chamber of commerce, was asked by proponents what it would take to get CACI to
support tax limitation. He answered, “We will never support tax limitation.” Asked Why?
“Because the state already has all the money. We want a voice in how it is spent.”
The BIG BONUS: With TABOR, taxpayers need not regularly, continuously, relentlessly and
exhaustively monitor and react to the fiscal foibles of the political process. The people have
their own quite personal, professional, working and family lives, and prefer a systemic,
“always on” solution. What they chose in TABOR was to use the authority and power of the
Constitution, and the honored Oath of Office of elected, appointed and hired public officials,
to continue the important work of providing for, yet limiting government growth and power.
What about that “Population-plus-Inflation” Thing?
A powerful and essential evaluation tool is the demanding question, “Compared to what?”
A reasonable and rational standard, population-plus-inflation, is defined, applied, and used
as a measure of performance or adherence to the desired government growth outcome.
Page 5 of 36
Why population-plus-inflation? Colorado’s Taxpayer’s Bill of Rights adopts that standard
to allow generous annual government growth, to obtain more revenues (taxes), and spend
more. This objective considers that governments have adequately performed their services
for a year, and, to do so the next year, taxing-and-spending must be allowed to increase,
1) to serve more people, and 2) to restore spending power of that lost to inflation; hence,
population-plus-inflation. If population grows 2% and inflation grows 3%, TABOR-allows
government to grow unencumbered, 5%.This ignores any prized government creativity,
effectivity and productivity.
The expressed foundation and mission of Colorado’s Taxpayer’s Bill of Rights “shall
reasonably restrain most the growth of government”; that is, to attenuate the inevitable
damage that excess government growth does to both public and private sectors, and people
within, for both the short run and long run, consequently diminishing the peoples’ “life,
liberty and pursuit of happiness.” Two Decades of TABOR provides a marvelous opportunity
to evaluate the effects and value of government tax-and-spending limitation. It is
understandable that these two impacts are at work regarding TABOR.
Two Important Research Paper Review Factors must be taken into account: Data
Veracity, and Causality vs Coincidence. These
considerations take precedence for such an analysis.
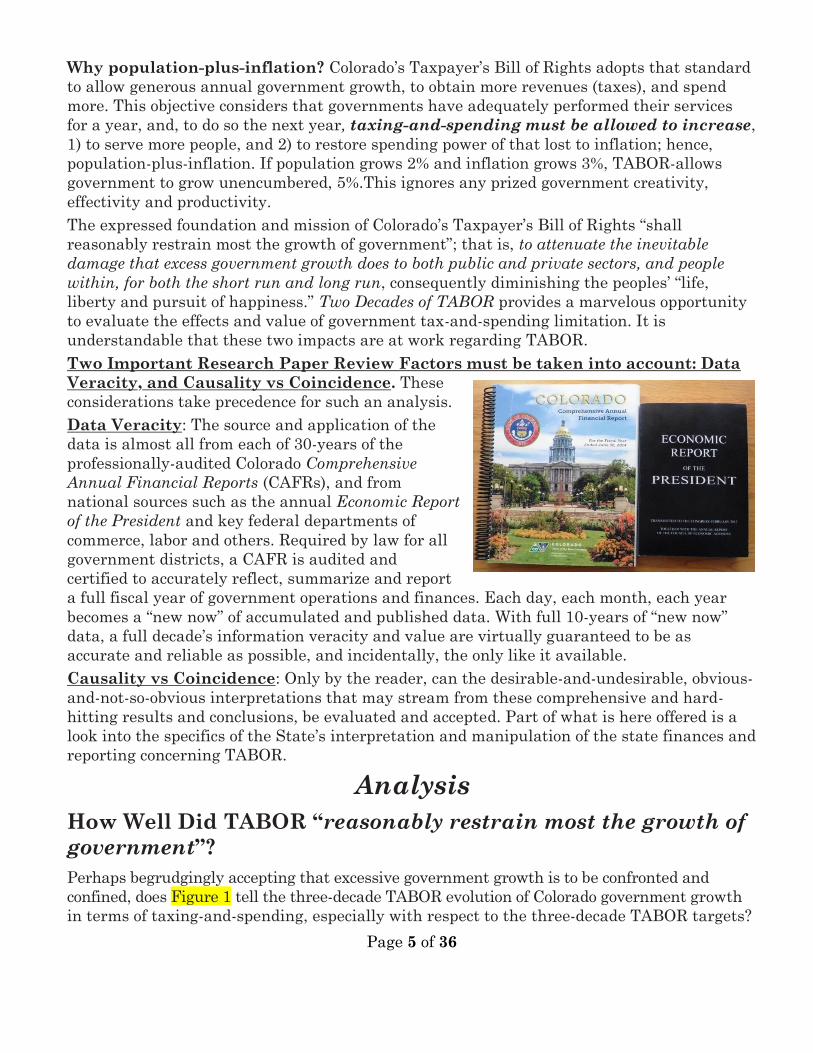
Data Veracity: The source and application of the
data is almost all from each of 30-years of the
professionally-audited Colorado Comprehensive
Annual Financial Reports (CAFRs), and from
national sources such as the annual Economic Report
of the President and key federal departments of
commerce, labor and others. Required by law for all
government districts, a CAFR is audited and
certified to accurately reflect, summarize and report
a full fiscal year of government operations and finances. Each day, each month, each year
becomes a “new now” of accumulated and published data. With full 10-years of “new now”
data, a full decade’s information veracity and value are virtually guaranteed to be as
accurate and reliable as possible, and incidentally, the only like it available.
Causality vs Coincidence: Only by the reader, can the desirable-and-undesirable, obvious-
and-not-so-obvious interpretations that may stream from these comprehensive and hard-
hitting results and conclusions, be evaluated and accepted. Part of what is here offered is a
look into the specifics of the State’s interpretation and manipulation of the state finances and
reporting concerning TABOR.
Analysis
How Well Did TABOR “reasonably restrain most the growth of
government”?
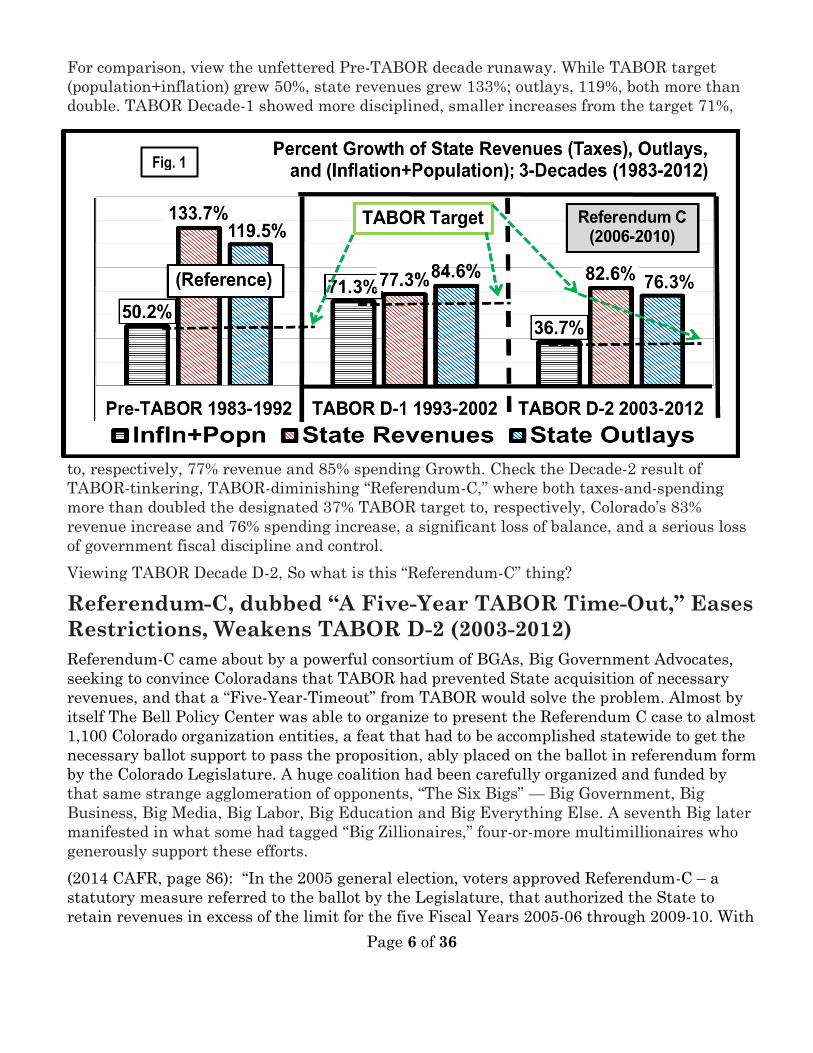
Perhaps begrudgingly accepting that excessive government growth is to be confronted and
confined, does Figure 1 tell the three-decade TABOR evolution of Colorado government growth
in terms of taxing-and-spending, especially with respect to the three-decade TABOR targets?
Page 6 of 36
For comparison, view the unfettered Pre-TABOR decade runaway. While TABOR target
(population+inflation) grew 50%, state revenues grew 133%; outlays, 119%, both more than
double. TABOR Decade-1 showed more disciplined, smaller increases from the target 71%,
to, respectively, 77% revenue and 85% spending Growth. Check the Decade-2 result of
TABOR-tinkering, TABOR-diminishing “Referendum-C,” where both taxes-and-spending
more than doubled the designated 37% TABOR target to, respectively, Colorado’s 83%
revenue increase and 76% spending increase, a significant loss of balance, and a serious loss
of government fiscal discipline and control.
Viewing TABOR Decade D-2, So what is this “Referendum-C” thing?
Referendum-C, dubbed “A Five-Year TABOR Time-Out,” Eases
Restrictions, Weakens TABOR D-2 (2003-2012)
Referendum-C came about by a powerful consortium of BGAs, Big Government Advocates,
seeking to convince Coloradans that TABOR had prevented State acquisition of necessary
revenues, and that a “Five-Year-Timeout” from TABOR would solve the problem. Almost by
itself The Bell Policy Center was able to organize to present the Referendum C case to almost
1,100 Colorado organization entities, a feat that had to be accomplished statewide to get the
necessary ballot support to pass the proposition, ably placed on the ballot in referendum form
by the Colorado Legislature. A huge coalition had been carefully organized and funded by
that same strange agglomeration of opponents, “The Six Bigs” — Big Government, Big
Business, Big Media, Big Labor, Big Education and Big Everything Else. A seventh Big later
manifested in what some had tagged “Big Zillionaires,” four-or-more multimillionaires who
generously support these efforts.
(2014 CAFR, page 86): “In the 2005 general election, voters approved Referendum-C – a
statutory measure referred to the ballot by the Legislature, that authorized the State to
retain revenues in excess of the limit for the five Fiscal Years 2005-06 through 2009-10. With
Fig. 1
Page 7 of 36
the end of the Referendum C five-year excess revenue retention period, the State is subject to
an Excess State Revenue Cap (ESRC) starting in Fiscal Year 2010-11.” The State retained
$3,593.6 million during the five-year refund time-out authorized by Referendum C, and
$6,228.6 million from Fiscal Year 2010-11 through 2013-14 due to the increasing ESRC as
compared to TABOR limit, for a total of $9,822.2 million of retained Referendum C revenue.”
(See p. 15). So what is the ESRC (Excess State Revenue Cap)? From the 2014 CAFR, p. 38:
“CONDITIONS EXPECTED TO AFFECT FUTURE OPERATIONS
“Many of the conditions affecting future operations of the State that were included in the
Fiscal Year 2012-13 Management Discussion and Analysis continue to affect the State at the
end of Fiscal Year 2013-14, as follows:
“Referendum C Sunsets – Referendum C was passed by the voters in November 2005 and
allowed the State to retain all revenues in excess of the TABOR limit for a five-year period
from Fiscal Year 2005-06 through 2009-10. During that period, the State retained $3,593.6
million that it would otherwise have been required to refund to State taxpayers. No amounts
were retained in Fiscal Years 2008-09 or 2009-10. Referendum C created an Excess State
Revenue Cap (ESRC) that increases each year for inflation and population growth and allows
the State to retain and spend amounts above the TABOR limit and below the ESRC. This
provision removes the effect of the TABOR ratchet down provision (discussed earlier in this
MDA). However, economic recovery and State revenue growth rates in excess of the population
and inflation adjustment could result in future refunds of TABOR revenues in excess of the
new ESRC. In Fiscal Year 2013-14, the State was $160.5 million under the ESRC, but absent
Referendum C, would have been required to refund $2,125.3 million per the TABOR limit due
to its ratchet down provision. Both the Legislative Council economist and the Governor’s
Office of State Planning and Budgeting economist project that under current law there will be
a TABOR refund in Fiscal Year 2015-16.” iii A more dynamic, sweeping panorama of the decade before the advent of TABOR, followed by
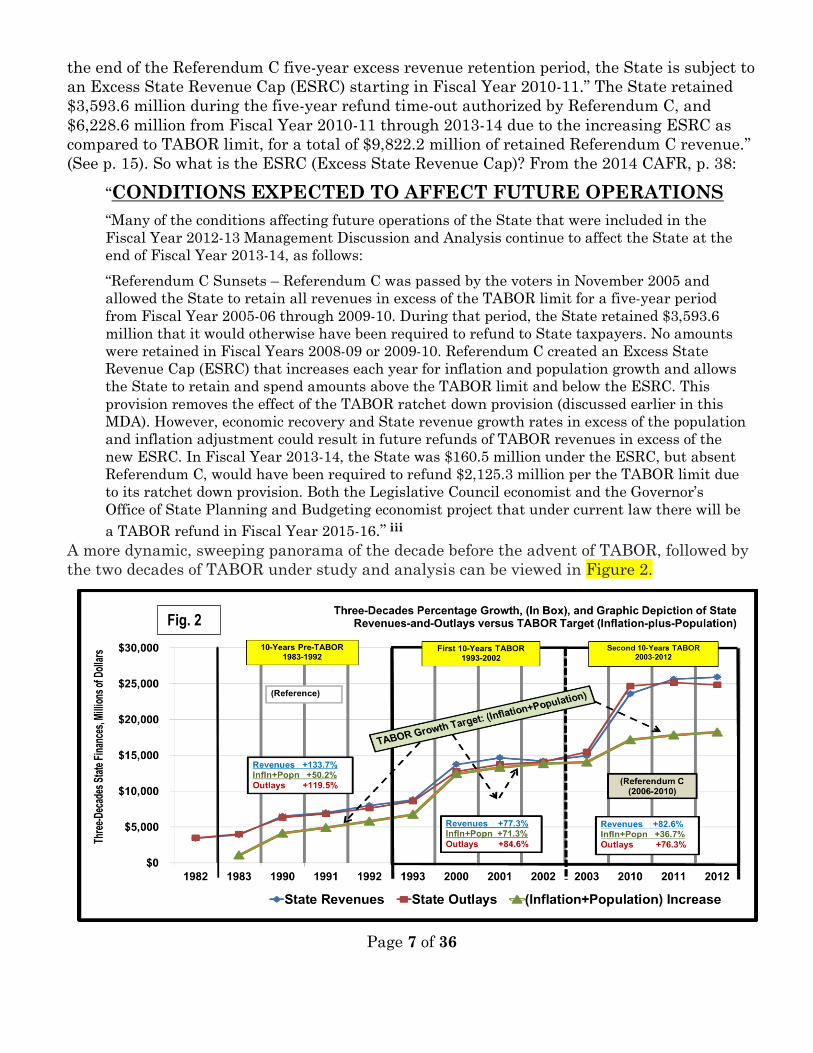
the two decades of TABOR under study and analysis can be viewed in Figure 2.
Fig. 2
Page 8 of 36
1983-to-2014 Comprehensive Financial Reports provide 30-
Years of Colorado Economic Data for Analysis.
This Figure 2 broad sweep of Colorado data has never been assembled before. Researching,
recording in spreadsheet format and analysis in various forms, three-decades data growth to
seek, find, qualify, record, and double-check for accuracy. Then ten-year percentage growth
rates were calculated in dollars and Compound Annual Growth Rates, CAGRiv. Once
assembled on large spread sheets, analyses were performed on the data, that data selected
for analysis had to do with growth and comparisons of growth over three decades in some 30
categories. These are presented and discussed in various categories, showing results in
appropriate charts for illustration, clarification and comprehension. The crux of the three
decades are presented in a one-page, three-decade unifying chart, Appendix A,
Comprehensive Master Colorado Growth Chart, showing analyzed categories and results for
comparison.
Figure 2 is a full 3-decade overview of Colorado State Revenues, Outlays, and TABOR target
(Population+Inflation) of the Pre-TABOR and two-decade flow of TABOR Data. Contrary to
some reporting it is noteworthy that in the 30-years, only one year, 2002, were State
revenues (blue) less than the year before. For handy availability, by-decade percentage
growth boxes are provided for contrast-and-comparison of Population-plus-Inflation, and
State Revenues and Outlays.
Next. a brief foray into employment effects of the Three Decades. Before continuing Colorado
government growth, we a look at jobs-and-TABOR.
Jobs, Jobs, Jobs: What Effect if any, have No-TABOR and Two
Decades of TABOR had on Colorado Public (Government)-
and-Private Sectors Job Growth?
TABOR jobs growth effects are here
interjected upfront because of their
compelling impact on the performance of
Colorado’s economy, with more government
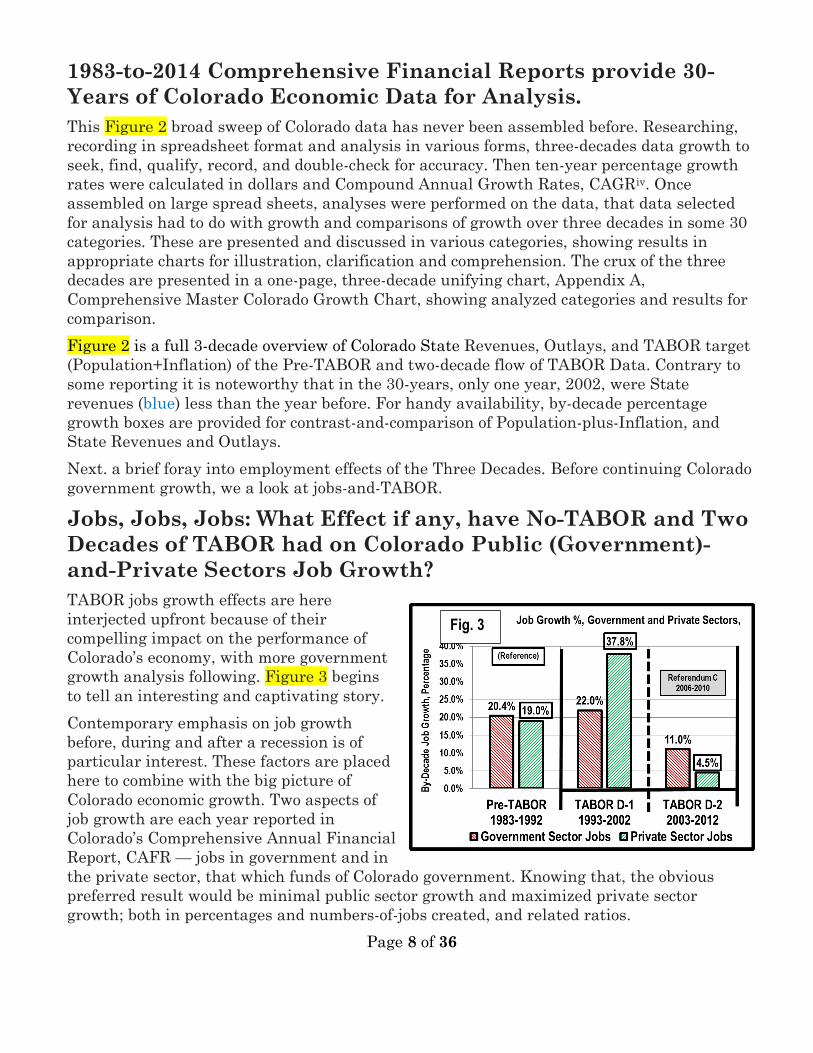
growth analysis following. Figure 3 begins
to tell an interesting and captivating story.
Contemporary emphasis on job growth
before, during and after a recession is of
particular interest. These factors are placed
here to combine with the big picture of
Colorado economic growth. Two aspects of
job growth are each year reported in
Colorado’s Comprehensive Annual Financial
Report, CAFR — jobs in government and in
the private sector, that which funds of Colorado government. Knowing that, the obvious
preferred result would be minimal public sector growth and maximized private sector
growth; both in percentages and numbers-of-jobs created, and related ratios.
Fig. 3
Page 9 of 36
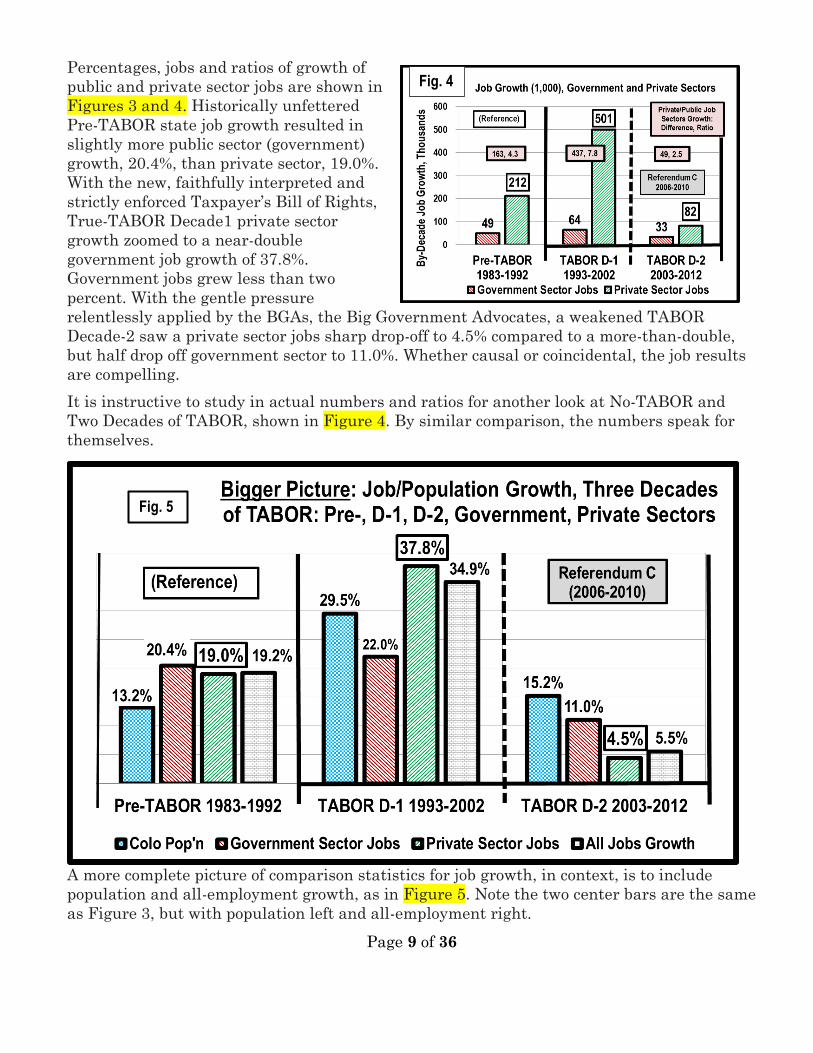
Percentages, jobs and ratios of growth of
public and private sector jobs are shown in
Figures 3 and 4. Historically unfettered
Pre-TABOR state job growth resulted in
slightly more public sector (government)
growth, 20.4%, than private sector, 19.0%.
With the new, faithfully interpreted and
strictly enforced Taxpayer’s Bill of Rights,
True-TABOR Decade1 private sector
growth zoomed to a near-double
government job growth of 37.8%.
Government jobs grew less than two
percent. With the gentle pressure
relentlessly applied by the BGAs, the Big Government Advocates, a weakened TABOR
Decade-2 saw a private sector jobs sharp drop-off to 4.5% compared to a more-than-double,
but half drop off government sector to 11.0%. Whether causal or coincidental, the job results
are compelling.
It is instructive to study in actual numbers and ratios for another look at No-TABOR and
Two Decades of TABOR, shown in Figure 4. By similar comparison, the numbers speak for
themselves.
A more complete picture of comparison statistics for job growth, in context, is to include
population and all-employment growth, as in Figure 5. Note the two center bars are the same
as Figure 3, but with population left and all-employment right.
Fig. 4
Fig. 5
Page 10 of 36
If one can accept that higher private sector growth should be emphasized and government
sector growth minimized it is obvious that more favorable results occurred during the more
disciplined and enforced True-TABOR Decade-1 than the No-TABOR Decade before and
continually-weakening TABOR Decade-2 after, especially by Referendum C, the “five-year
TABOR time-out,” 2006-2010. And focus especially Decade-2 job growth of 5.5% failing to
provide jobs for population growth at 15.2%. Same for government jobs growing well over
twice private sector jobs. Does it appear in job creation-and-apportionment that the solid
True-TABOR-1 Decade is a “rose between two thorns”? “Jobs, Jobs, Jobs” echoes loudly and
maintains its continuing appeal and importance.
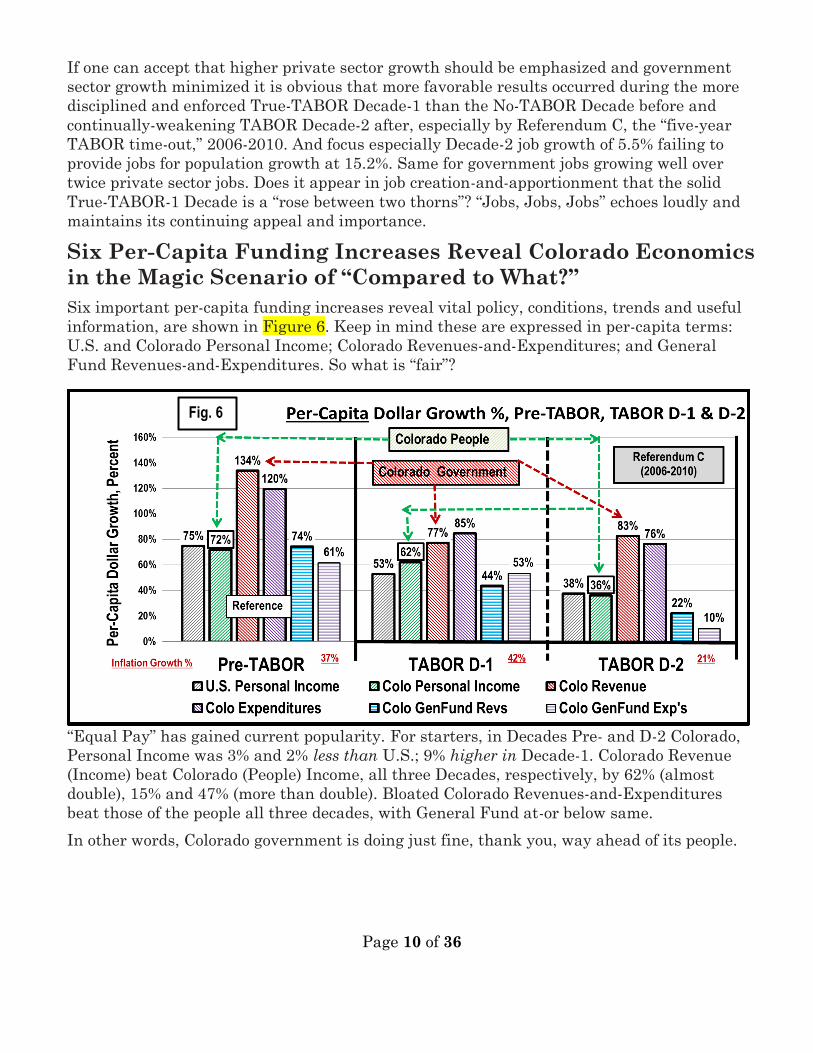
Six Per-Capita Funding Increases Reveal Colorado Economics
in the Magic Scenario of “Compared to What?”
Six important per-capita funding increases reveal vital policy, conditions, trends and useful
information, are shown in Figure 6. Keep in mind these are expressed in per-capita terms:
U.S. and Colorado Personal Income; Colorado Revenues-and-Expenditures; and General
Fund Revenues-and-Expenditures. So what is “fair”?
“Equal Pay” has gained current popularity. For starters, in Decades Pre- and D-2 Colorado,
Personal Income was 3% and 2% less than U.S.; 9% higher in Decade-1. Colorado Revenue
(Income) beat Colorado (People) Income, all three Decades, respectively, by 62% (almost
double), 15% and 47% (more than double). Bloated Colorado Revenues-and-Expenditures
beat those of the people all three decades, with General Fund at-or below same.
In other words, Colorado government is doing just fine, thank you, way ahead of its people.
Fig. 6
Page 11 of 36
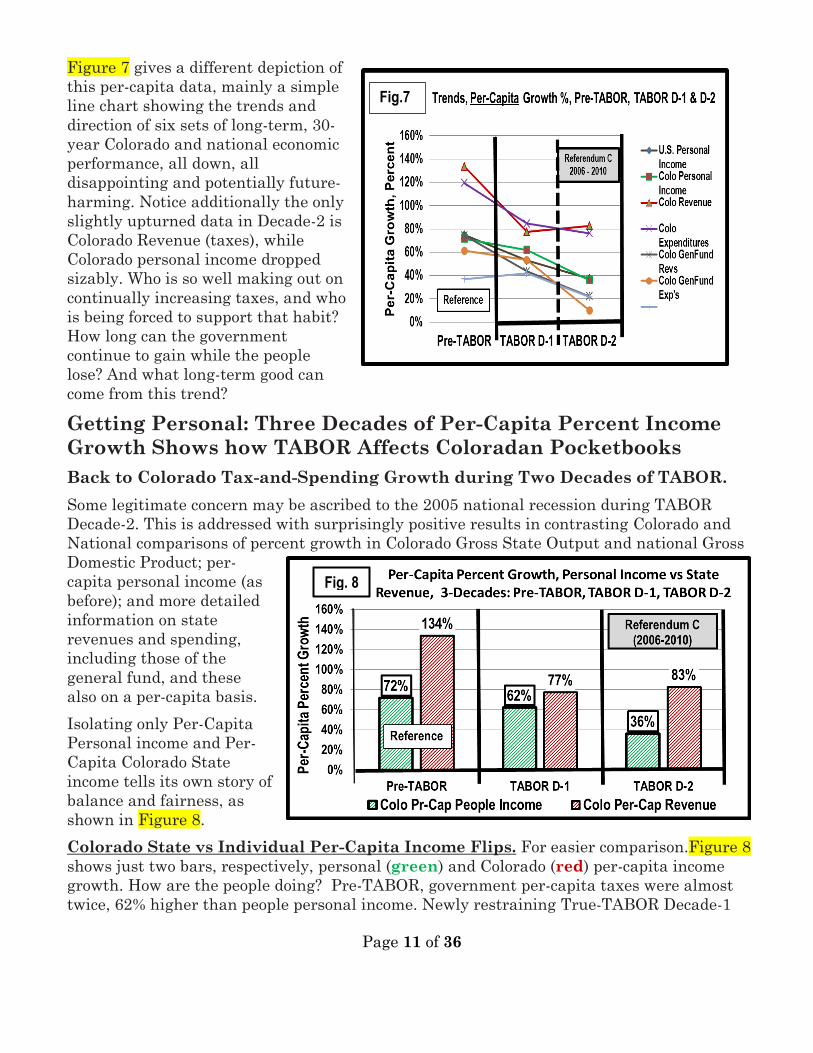
Figure 7 gives a different depiction of
this per-capita data, mainly a simple
line chart showing the trends and
direction of six sets of long-term, 30-
year Colorado and national economic
performance, all down, all
disappointing and potentially future-
harming. Notice additionally the only
slightly upturned data in Decade-2 is
Colorado Revenue (taxes), while
Colorado personal income dropped
sizably. Who is so well making out on
continually increasing taxes, and who
is being forced to support that habit?
How long can the government
continue to gain while the people
lose? And what long-term good can
come from this trend?
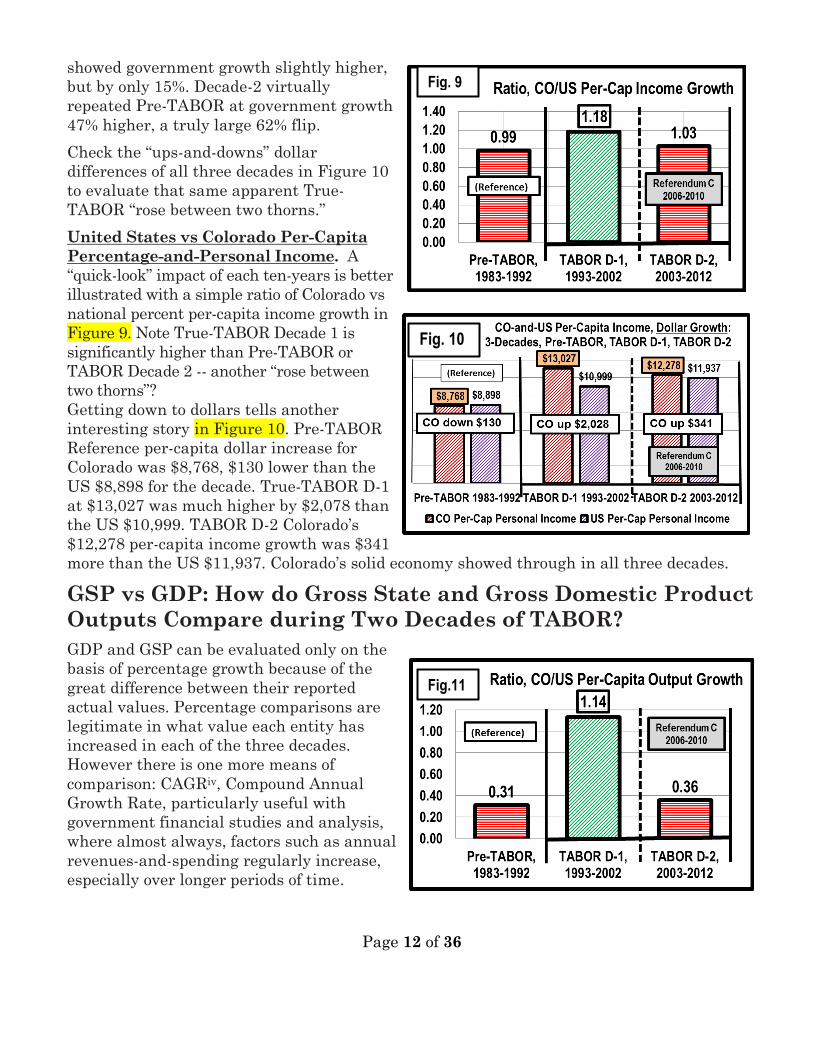
Getting Personal: Three Decades of Per-Capita Percent Income
Growth Shows how TABOR Affects Coloradan Pocketbooks
Back to Colorado Tax-and-Spending Growth during Two Decades of TABOR.
Some legitimate concern may be ascribed to the 2005 national recession during TABOR
Decade-2. This is addressed with surprisingly positive results in contrasting Colorado and
National comparisons of percent growth in Colorado Gross State Output and national Gross
Domestic Product; per-
capita personal income (as
before); and more detailed
information on state
revenues and spending,
including those of the
general fund, and these
also on a per-capita basis.
Isolating only Per-Capita
Personal income and Per-
Capita Colorado State
income tells its own story of
balance and fairness, as
shown in Figure 8.
Colorado State vs Individual Per-Capita Income Flips. For easier comparison.Figure 8
shows just two bars, respectively, personal (green) and Colorado (red) per-capita income
growth. How are the people doing? Pre-TABOR, government per-capita taxes were almost
twice, 62% higher than people personal income. Newly restraining True-TABOR Decade-1
Fig.7
Fig. 8
Page 12 of 36
showed government growth slightly higher,
but by only 15%. Decade-2 virtually
repeated Pre-TABOR at government growth
47% higher, a truly large 62% flip.
Check the “ups-and-downs” dollar
differences of all three decades in Figure 10
to evaluate that same apparent True-
TABOR “rose between two thorns.”
United States vs Colorado Per-Capita
Percentage-and-Personal Income. A
“quick-look” impact of each ten-years is better
illustrated with a simple ratio of Colorado vs
national percent per-capita income growth in
Figure 9. Note True-TABOR Decade 1 is
significantly higher than Pre-TABOR or
TABOR Decade 2 -- another “rose between
two thorns”?
Getting down to dollars tells another
interesting story in Figure 10. Pre-TABOR
Reference per-capita dollar increase for
Colorado was $8,768, $130 lower than the
US $8,898 for the decade. True-TABOR D-1
at $13,027 was much higher by $2,078 than
the US $10,999. TABOR D-2 Colorado’s
$12,278 per-capita income growth was $341
more than the US $11,937. Colorado’s solid economy showed through in all three decades.
GSP vs GDP: How do Gross State and Gross Domestic Product
Outputs Compare during Two Decades of TABOR?
GDP and GSP can be evaluated only on the
basis of percentage growth because of the
great difference between their reported
actual values. Percentage comparisons are
legitimate in what value each entity has
increased in each of the three decades.
However there is one more means of
comparison: CAGRiv, Compound Annual
Growth Rate, particularly useful with
government financial studies and analysis,
where almost always, factors such as annual
revenues-and-spending regularly increase,
especially over longer periods of time.
Fig. 10
Fig. 9
Fig.11
Page 13 of 36
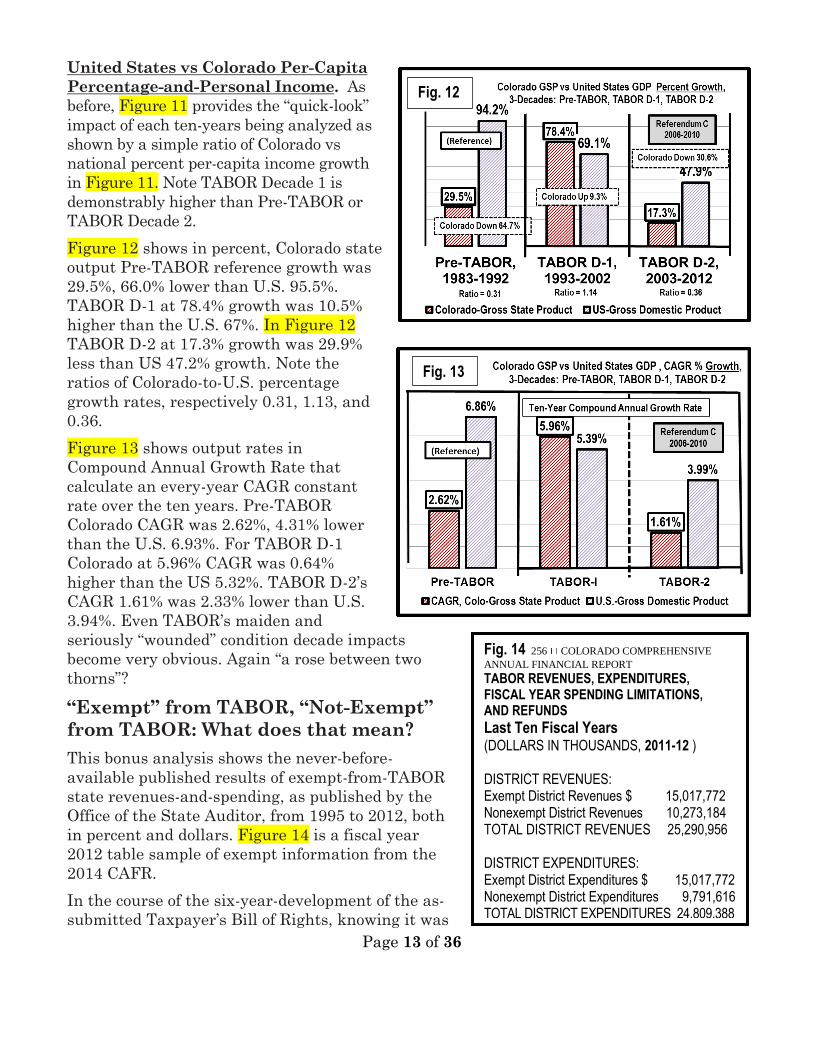
United States vs Colorado Per-Capita
Percentage-and-Personal Income. As
before, Figure 11 provides the “quick-look”
impact of each ten-years being analyzed as
shown by a simple ratio of Colorado vs
national percent per-capita income growth
in Figure 11. Note TABOR Decade 1 is
demonstrably higher than Pre-TABOR or
TABOR Decade 2.
Figure 12 shows in percent, Colorado state
output Pre-TABOR reference growth was
29.5%, 66.0% lower than U.S. 95.5%.
TABOR D-1 at 78.4% growth was 10.5%
higher than the U.S. 67%. In Figure 12
TABOR D-2 at 17.3% growth was 29.9%
less than US 47.2% growth. Note the
ratios of Colorado-to-U.S. percentage
growth rates, respectively 0.31, 1.13, and
0.36.
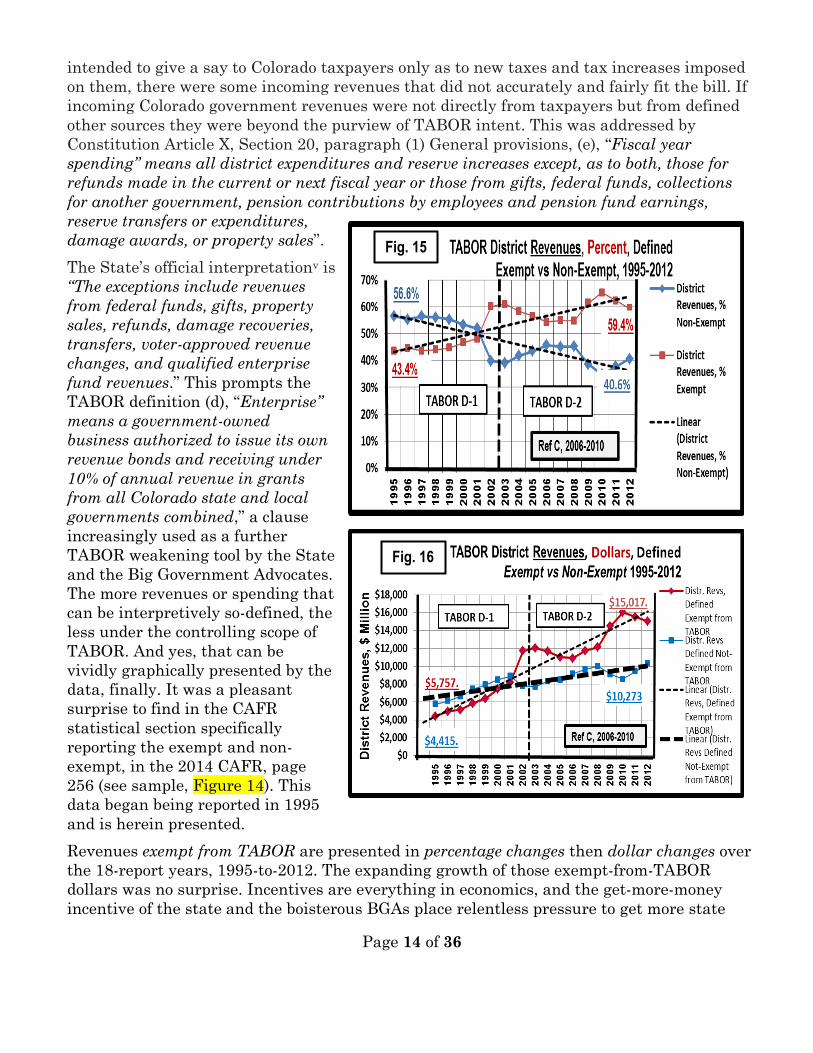
Figure 13 shows output rates in
Compound Annual Growth Rate that
calculate an every-year CAGR constant
rate over the ten years. Pre-TABOR
Colorado CAGR was 2.62%, 4.31% lower
than the U.S. 6.93%. For TABOR D-1
Colorado at 5.96% CAGR was 0.64%
higher than the US 5.32%. TABOR D-2’s
CAGR 1.61% was 2.33% lower than U.S.
3.94%. Even TABOR’s maiden and
seriously “wounded” condition decade impacts
become very obvious. Again “a rose between two
thorns”?
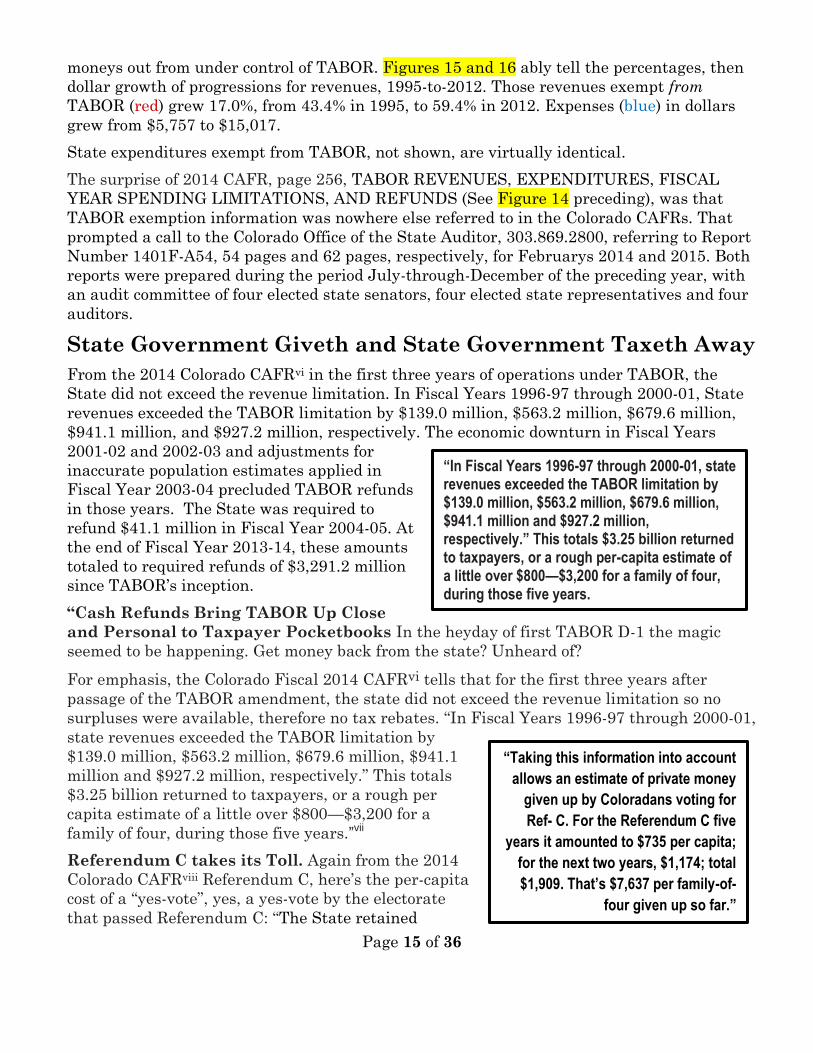
“Exempt” from TABOR, “Not-Exempt”
from TABOR: What does that mean?
This bonus analysis shows the never-before-
available published results of exempt-from-TABOR
state revenues-and-spending, as published by the
Office of the State Auditor, from 1995 to 2012, both
in percent and dollars. Figure 14 is a fiscal year
2012 table sample of exempt information from the
2014 CAFR.
In the course of the six-year-development of the as-
submitted Taxpayer’s Bill of Rights, knowing it was
Fig. 14 256 COLORADO COMPREHENSIVE
ANNUAL FINANCIAL REPORT
TABOR REVENUES, EXPENDITURES, FISCAL YEAR SPENDING LIMITATIONS, AND REFUNDS
Last Ten Fiscal Years (DOLLARS IN THOUSANDS, 2011-12 ) DISTRICT REVENUES: Exempt District Revenues $ 15,017,772 Nonexempt District Revenues 10,273,184 TOTAL DISTRICT REVENUES 25,290,956 DISTRICT EXPENDITURES: Exempt District Expenditures $ 15,017,772 Nonexempt District Expenditures 9,791,616 TOTAL DISTRICT EXPENDITURES 24,809,388
Fig. 12
Fig. 13
Page 14 of 36
intended to give a say to Colorado taxpayers only as to new taxes and tax increases imposed
on them, there were some incoming revenues that did not accurately and fairly fit the bill. If
incoming Colorado government revenues were not directly from taxpayers but from defined
other sources they were beyond the purview of TABOR intent. This was addressed by
Constitution Article X, Section 20, paragraph (1) General provisions, (e), “Fiscal year
spending” means all district expenditures and reserve increases except, as to both, those for
refunds made in the current or next fiscal year or those from gifts, federal funds, collections
for another government, pension contributions by employees and pension fund earnings,
reserve transfers or expenditures,
damage awards, or property sales”.
The State’s official interpretationv is
“The exceptions include revenues
from federal funds, gifts, property
sales, refunds, damage recoveries,
transfers, voter-approved revenue
changes, and qualified enterprise
fund revenues.” This prompts the
TABOR definition (d), “Enterprise”
means a government-owned
business authorized to issue its own
revenue bonds and receiving under
10% of annual revenue in grants
from all Colorado state and local
governments combined,” a clause
increasingly used as a further
TABOR weakening tool by the State
and the Big Government Advocates.
The more revenues or spending that
can be interpretively so-defined, the
less under the controlling scope of
TABOR. And yes, that can be
vividly graphically presented by the
data, finally. It was a pleasant
surprise to find in the CAFR
statistical section specifically
reporting the exempt and non-
exempt, in the 2014 CAFR, page
256 (see sample, Figure 14). This
data began being reported in 1995
and is herein presented.
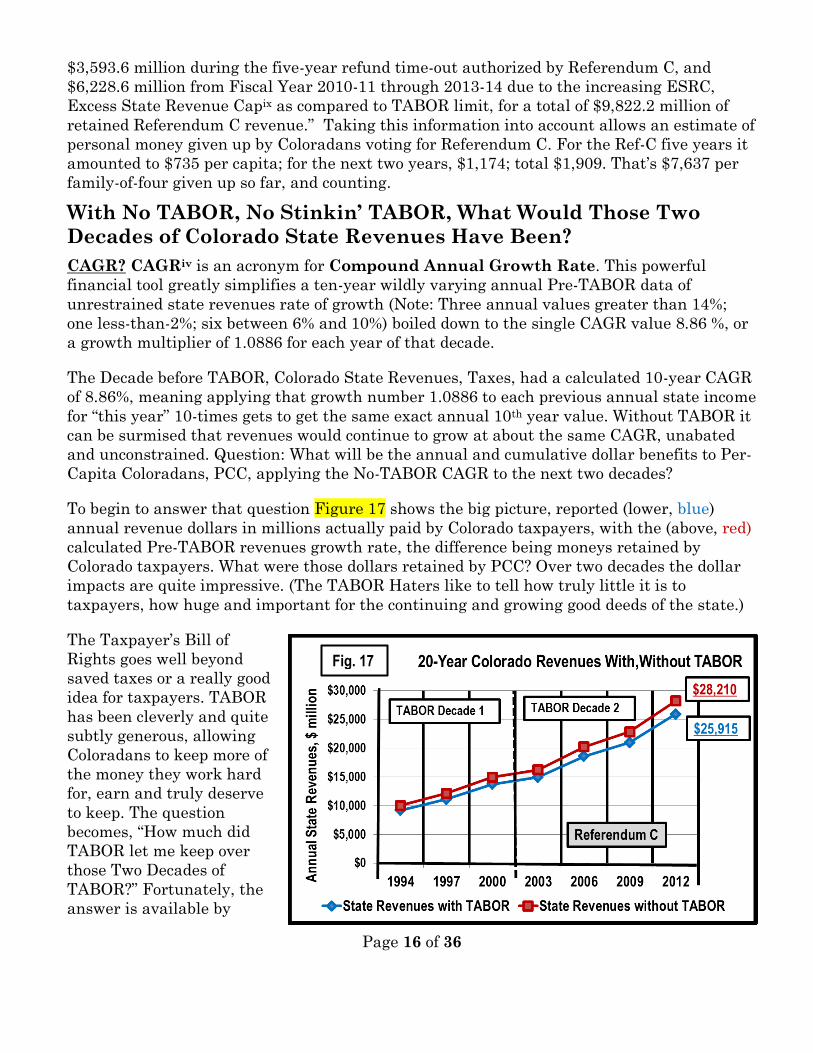
Revenues exempt from TABOR are presented in percentage changes then dollar changes over
the 18-report years, 1995-to-2012. The expanding growth of those exempt-from-TABOR
dollars was no surprise. Incentives are everything in economics, and the get-more-money
incentive of the state and the boisterous BGAs place relentless pressure to get more state
Fig. 15
Fig. 16
Page 15 of 36
moneys out from under control of TABOR. Figures 15 and 16 ably tell the percentages, then
dollar growth of progressions for revenues, 1995-to-2012. Those revenues exempt from
TABOR (red) grew 17.0%, from 43.4% in 1995, to 59.4% in 2012. Expenses (blue) in dollars
grew from $5,757 to $15,017.
State expenditures exempt from TABOR, not shown, are virtually identical.
The surprise of 2014 CAFR, page 256, TABOR REVENUES, EXPENDITURES, FISCAL
YEAR SPENDING LIMITATIONS, AND REFUNDS (See Figure 14 preceding), was that
TABOR exemption information was nowhere else referred to in the Colorado CAFRs. That
prompted a call to the Colorado Office of the State Auditor, 303.869.2800, referring to Report
Number 1401F-A54, 54 pages and 62 pages, respectively, for Februarys 2014 and 2015. Both
reports were prepared during the period July-through-December of the preceding year, with
an audit committee of four elected state senators, four elected state representatives and four
auditors.
State Government Giveth and State Government Taxeth Away
From the 2014 Colorado CAFRvi in the first three years of operations under TABOR, the
State did not exceed the revenue limitation. In Fiscal Years 1996-97 through 2000-01, State
revenues exceeded the TABOR limitation by $139.0 million, $563.2 million, $679.6 million,
$941.1 million, and $927.2 million, respectively. The economic downturn in Fiscal Years
2001-02 and 2002-03 and adjustments for
inaccurate population estimates applied in
Fiscal Year 2003-04 precluded TABOR refunds
in those years. The State was required to
refund $41.1 million in Fiscal Year 2004-05. At
the end of Fiscal Year 2013-14, these amounts
totaled to required refunds of $3,291.2 million
since TABOR’s inception.
“Cash Refunds Bring TABOR Up Close
and Personal to Taxpayer Pocketbooks In the heyday of first TABOR D-1 the magic
seemed to be happening. Get money back from the state? Unheard of?
For emphasis, the Colorado Fiscal 2014 CAFRvi tells that for the first three years after
passage of the TABOR amendment, the state did not exceed the revenue limitation so no
surpluses were available, therefore no tax rebates. “In Fiscal Years 1996-97 through 2000-01,
state revenues exceeded the TABOR limitation by
$139.0 million, $563.2 million, $679.6 million, $941.1
million and $927.2 million, respectively.” This totals
$3.25 billion returned to taxpayers, or a rough per
capita estimate of a little over $800—$3,200 for a
family of four, during those five years.”vii
Referendum C takes its Toll. Again from the 2014
Colorado CAFRviii Referendum C, here’s the per-capita
cost of a “yes-vote”, yes, a yes-vote by the electorate
that passed Referendum C: “The State retained
“Taking this information into account
allows an estimate of private money
given up by Coloradans voting for
Ref- C. For the Referendum C five
years it amounted to $735 per capita;
for the next two years, $1,174; total
$1,909. That’s $7,637 per family-of-
four given up so far.”
“In Fiscal Years 1996-97 through 2000-01, state revenues exceeded the TABOR limitation by $139.0 million, $563.2 million, $679.6 million, $941.1 million and $927.2 million, respectively.” This totals $3.25 billion returned to taxpayers, or a rough per-capita estimate of a little over $800—$3,200 for a family of four, during those five years.
Page 16 of 36
$3,593.6 million during the five-year refund time-out authorized by Referendum C, and
$6,228.6 million from Fiscal Year 2010-11 through 2013-14 due to the increasing ESRC,
Excess State Revenue Capix as compared to TABOR limit, for a total of $9,822.2 million of
retained Referendum C revenue.” Taking this information into account allows an estimate of
personal money given up by Coloradans voting for Referendum C. For the Ref-C five years it
amounted to $735 per capita; for the next two years, $1,174; total $1,909. That’s $7,637 per
family-of-four given up so far, and counting.
With No TABOR, No Stinkin’ TABOR, What Would Those Two
Decades of Colorado State Revenues Have Been?
CAGR? CAGRiv is an acronym for Compound Annual Growth Rate. This powerful
financial tool greatly simplifies a ten-year wildly varying annual Pre-TABOR data of
unrestrained state revenues rate of growth (Note: Three annual values greater than 14%;
one less-than-2%; six between 6% and 10%) boiled down to the single CAGR value 8.86 %, or
a growth multiplier of 1.0886 for each year of that decade.
The Decade before TABOR, Colorado State Revenues, Taxes, had a calculated 10-year CAGR
of 8.86%, meaning applying that growth number 1.0886 to each previous annual state income
for “this year” 10-times gets to get the same exact annual 10th year value. Without TABOR it
can be surmised that revenues would continue to grow at about the same CAGR, unabated
and unconstrained. Question: What will be the annual and cumulative dollar benefits to Per-
Capita Coloradans, PCC, applying the No-TABOR CAGR to the next two decades?
To begin to answer that question Figure 17 shows the big picture, reported (lower, blue)
annual revenue dollars in millions actually paid by Colorado taxpayers, with the (above, red)
calculated Pre-TABOR revenues growth rate, the difference being moneys retained by
Colorado taxpayers. What were those dollars retained by PCC? Over two decades the dollar
impacts are quite impressive. (The TABOR Haters like to tell how truly little it is to
taxpayers, how huge and important for the continuing and growing good deeds of the state.)
The Taxpayer’s Bill of
Rights goes well beyond
saved taxes or a really good
idea for taxpayers. TABOR
has been cleverly and quite
subtly generous, allowing
Coloradans to keep more of
the money they work hard
for, earn and truly deserve
to keep. The question
becomes, “How much did
TABOR let me keep over
those Two Decades of
TABOR?” Fortunately, the
answer is available by
Fig. 17
Page 17 of 36
applying good economics, finance, mathematics, CAGRiv, and the power of the spreadsheet.
”What’s past is prologue,” or, what we’ve always done, we keep on doing. And we get what we
got. With that we can approximate the two decades of state revenues with no TABOR
restraint, then compare to the actual Two Decades of TABOR reported under the discipline of
TABOR.
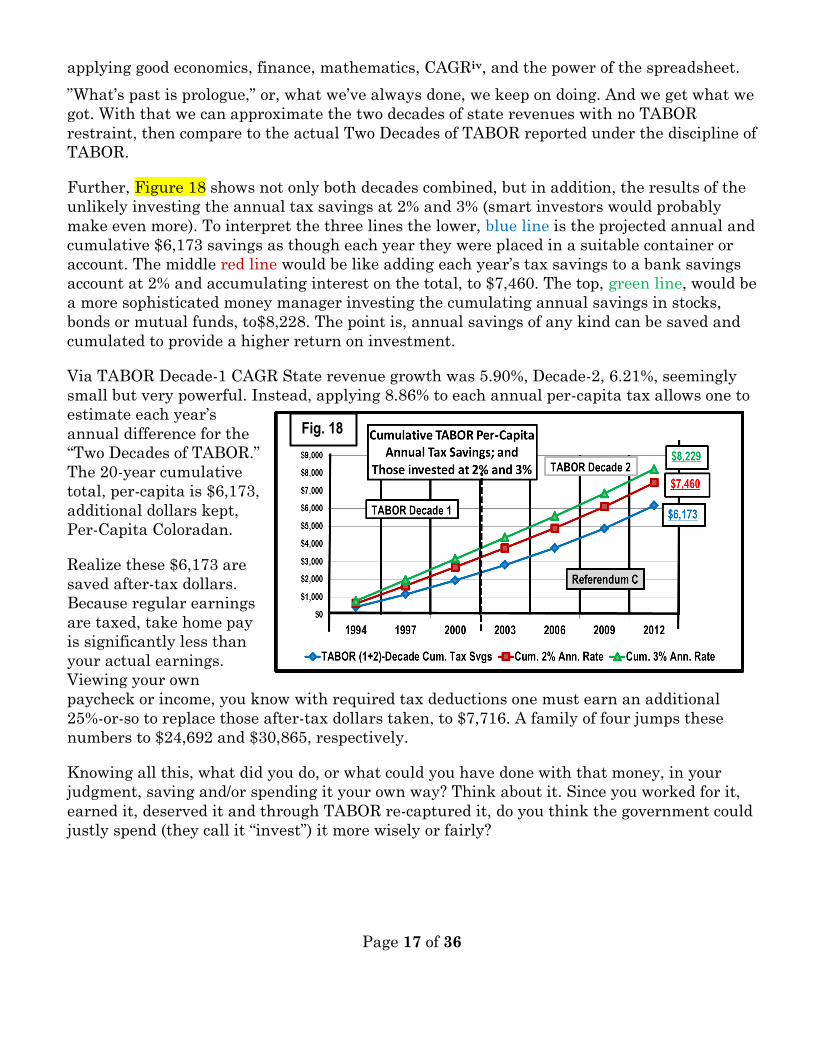
Further, Figure 18 shows not only both decades combined, but in addition, the results of the
unlikely investing the annual tax savings at 2% and 3% (smart investors would probably
make even more). To interpret the three lines the lower, blue line is the projected annual and
cumulative $6,173 savings as though each year they were placed in a suitable container or
account. The middle red line would be like adding each year’s tax savings to a bank savings
account at 2% and accumulating interest on the total, to $7,460. The top, green line, would be
a more sophisticated money manager investing the cumulating annual savings in stocks,
bonds or mutual funds, to$8,228. The point is, annual savings of any kind can be saved and
cumulated to provide a higher return on investment.
Via TABOR Decade-1 CAGR State revenue growth was 5.90%, Decade-2, 6.21%, seemingly
small but very powerful. Instead, applying 8.86% to each annual per-capita tax allows one to
estimate each year’s
annual difference for the
“Two Decades of TABOR.”
The 20-year cumulative
total, per-capita is $6,173,
additional dollars kept,
Per-Capita Coloradan.
Realize these $6,173 are
saved after-tax dollars.
Because regular earnings
are taxed, take home pay
is significantly less than
your actual earnings.
Viewing your own
paycheck or income, you know with required tax deductions one must earn an additional
25%-or-so to replace those after-tax dollars taken, to $7,716. A family of four jumps these
numbers to $24,692 and $30,865, respectively.
Knowing all this, what did you do, or what could you have done with that money, in your
judgment, saving and/or spending it your own way? Think about it. Since you worked for it,
earned it, deserved it and through TABOR re-captured it, do you think the government could
justly spend (they call it “invest”) it more wisely or fairly?
Fig. 18
Page 18 of 36
Just in case you feel queasy about your TABOR-
retained 2012 PCC, Per-Capita Coloradan,
$442 state tax you didn’t have to pay because
of the Taxpayer’s Bill of Rights, don’t. Outside
this Research Paper it is impossible for you to
know that each PCC, you, that year already
paid $4,995 to provide that year’s total
$25, 914,750,000 State Revenuesx that kept
your Colorado State Government going.
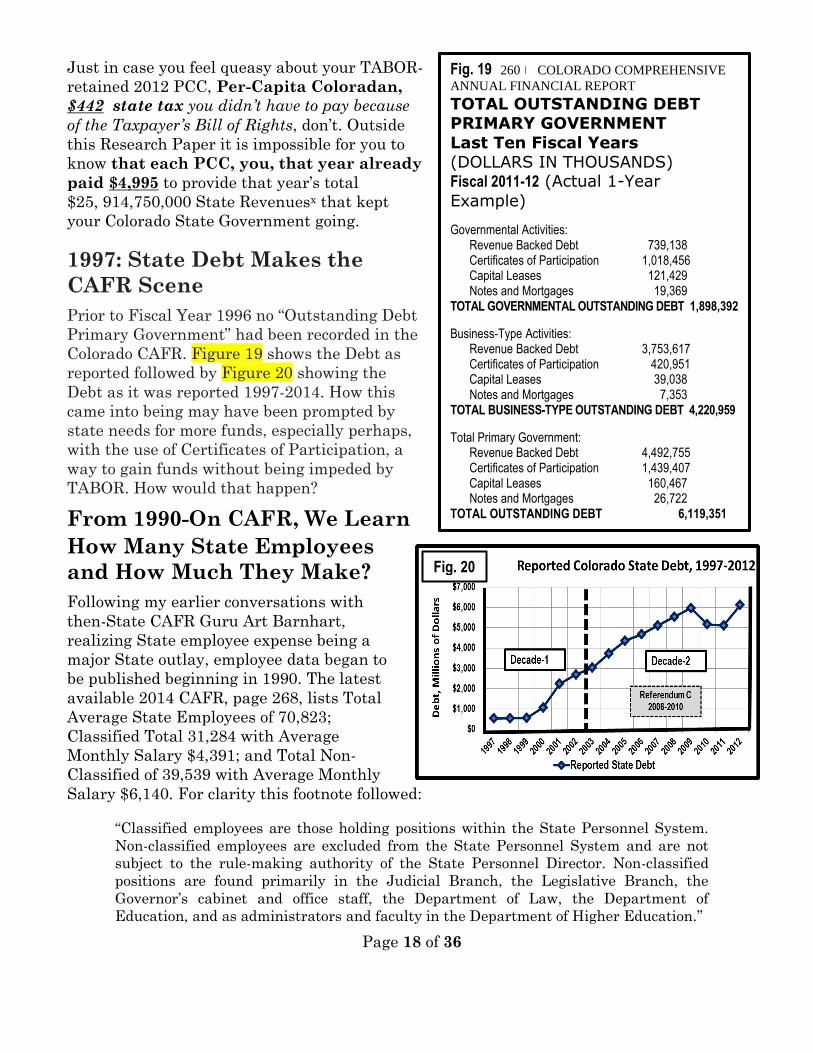
1997: State Debt Makes the
CAFR Scene
Prior to Fiscal Year 1996 no “Outstanding Debt
Primary Government” had been recorded in the
Colorado CAFR. Figure 19 shows the Debt as
reported followed by Figure 20 showing the
Debt as it was reported 1997-2014. How this
came into being may have been prompted by
state needs for more funds, especially perhaps,
with the use of Certificates of Participation, a
way to gain funds without being impeded by
TABOR. How would that happen?
From 1990-On CAFR, We Learn
How Many State Employees
and How Much They Make?
Following my earlier conversations with
then-State CAFR Guru Art Barnhart,
realizing State employee expense being a
major State outlay, employee data began to
be published beginning in 1990. The latest
available 2014 CAFR, page 268, lists Total
Average State Employees of 70,823;
Classified Total 31,284 with Average
Monthly Salary $4,391; and Total Non-
Classified of 39,539 with Average Monthly
Salary $6,140. For clarity this footnote followed:
“Classified employees are those holding positions within the State Personnel System.
Non-classified employees are excluded from the State Personnel System and are not
subject to the rule-making authority of the State Personnel Director. Non-classified
positions are found primarily in the Judicial Branch, the Legislative Branch, the
Governor’s cabinet and office staff, the Department of Law, the Department of
Education, and as administrators and faculty in the Department of Higher Education.”
Fig. 19 260 COLORADO COMPREHENSIVE
ANNUAL FINANCIAL REPORT
TOTAL OUTSTANDING DEBT PRIMARY GOVERNMENT
Last Ten Fiscal Years (DOLLARS IN THOUSANDS) Fiscal 2011-12 (Actual 1-Year
Example)
Governmental Activities: Revenue Backed Debt 739,138 Certificates of Participation 1,018,456 Capital Leases 121,429 Notes and Mortgages 19,369
TOTAL GOVERNMENTAL OUTSTANDING DEBT 1,898,392
Business-Type Activities: Revenue Backed Debt 3,753,617 Certificates of Participation 420,951 Capital Leases 39,038 Notes and Mortgages 7,353
TOTAL BUSINESS-TYPE OUTSTANDING DEBT 4,220,959
Total Primary Government: Revenue Backed Debt 4,492,755 Certificates of Participation 1,439,407 Capital Leases 160,467 Notes and Mortgages 26,722
TOTAL OUTSTANDING DEBT 6,119,351
Fig. 20
Page 19 of 36
The Power of Masterful Employee Leadership, Administration,
Realization, Cost Control, and Management Discipline
Gosh what can be done with such data? Can we find out?
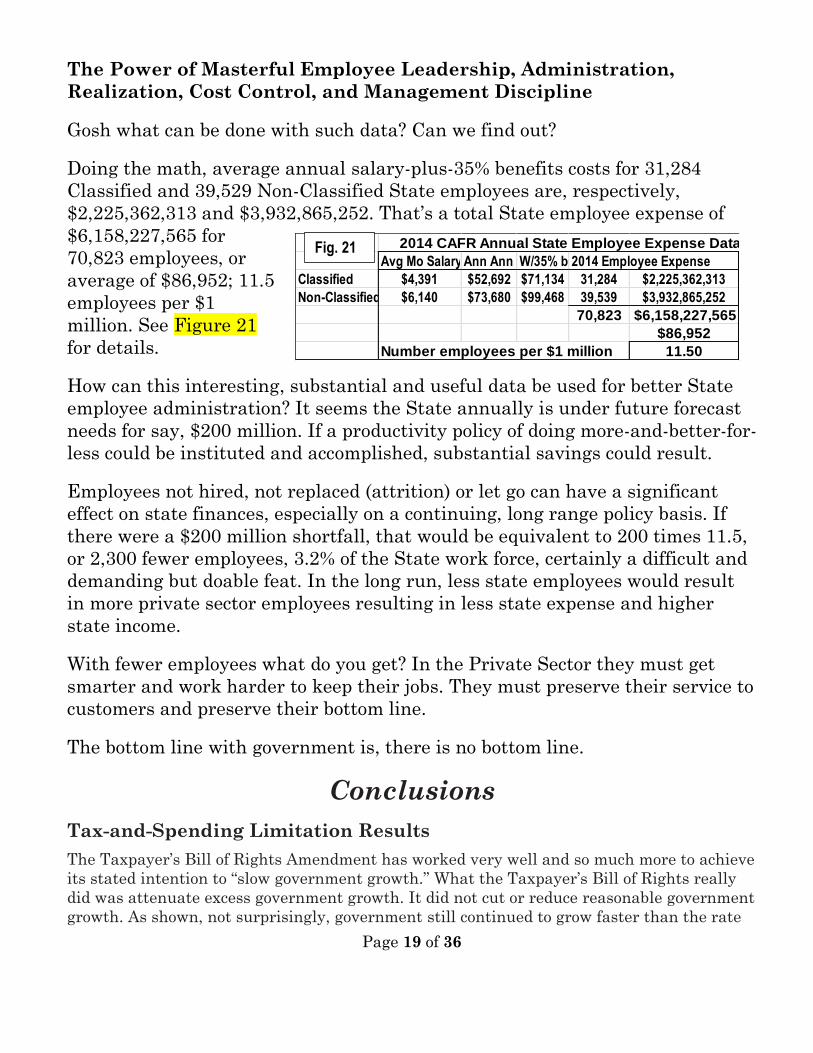
Doing the math, average annual salary-plus-35% benefits costs for 31,284
Classified and 39,529 Non-Classified State employees are, respectively,
$2,225,362,313 and $3,932,865,252. That’s a total State employee expense of
$6,158,227,565 for
70,823 employees, or
average of $86,952; 11.5
employees per $1
million. See Figure 21
for details.
How can this interesting, substantial and useful data be used for better State
employee administration? It seems the State annually is under future forecast
needs for say, $200 million. If a productivity policy of doing more-and-better-for-
less could be instituted and accomplished, substantial savings could result.
Employees not hired, not replaced (attrition) or let go can have a significant
effect on state finances, especially on a continuing, long range policy basis. If
there were a $200 million shortfall, that would be equivalent to 200 times 11.5,
or 2,300 fewer employees, 3.2% of the State work force, certainly a difficult and
demanding but doable feat. In the long run, less state employees would result
in more private sector employees resulting in less state expense and higher
state income.
With fewer employees what do you get? In the Private Sector they must get
smarter and work harder to keep their jobs. They must preserve their service to
customers and preserve their bottom line.
The bottom line with government is, there is no bottom line.
Conclusions
Tax-and-Spending Limitation Results
The Taxpayer’s Bill of Rights Amendment has worked very well and so much more to achieve
its stated intention to “slow government growth.” What the Taxpayer’s Bill of Rights really
did was attenuate excess government growth. It did not cut or reduce reasonable government
growth. As shown, not surprisingly, government still continued to grow faster than the rate
2014 CAFR Annual State Employee Expense Data
Avg Mo Salary Ann Ann SalaryW/35% benefits2014 Employee Expense
Classified $4,391 $52,692 $71,134 31,284 $2,225,362,313
Non-Classified $6,140 $73,680 $99,468 39,539 $3,932,865,252
70,823 $6,158,227,565
$86,952
Number employees per $1 million 11.50
Fig. 21
Page 20 of 36
of population-plus-inflation, even with Colorado’s Taxpayer’s Bill of Rights. TABOR is simply
undoing earlier spending sprees, not shrinking government to unrealistic levels, not
shrinking government at all. TABOR encourages elected officials to better set priorities and
resist heavy special interest lobbying pressures. TABOR frees up capital in the private sector
to create more wealth-creating jobs that boost productivity and output—and more moneys to
governments, for those who understand.
Colorado’s Taxpayer’s Bill of Rights has shown itself to be an effective, rational and practical
means to accomplish its stated mission “to reasonably restrain most the growth of
government.” It has done so convincingly and much more, by applying 30-years of Colorado’s
Comprehensive Annual Financial Report (CAFR) statistics, economics, finances, numbers
and interpretations, as well as positively beating national “Compared to what?” percent
growth, with respect to Coloradan vs national per-capita income, and Colorado vs national
per-capita output.
Three successive decades, 1983-2012, are analyzed, No-TABOR, Enforced-TABOR and
Weakened-TABOR, metaphorically turning out to be “a rose between two thorns.” True-
TABOR Decade-1 performed admirably while Pre-TABOR was uncontrolled. Decade 3 was
particularly weakened by the “five-year TABOR-timeout” of electorate-supported
Referendum C which relaxed TABOR constraints years for five years 2006-2010. Colorado
state government continues to grow wildly with respect to the TABOR-Target - inflation-
plus-population.
The following results may be found in abbreviated detail in Appendix A: “Comprehensive
Master Colorado Growth Chart,” a single-page summary of the entire analysis, in 25-
numbered lines and 10-alphabetic columns. Chart references are here given as line-and-
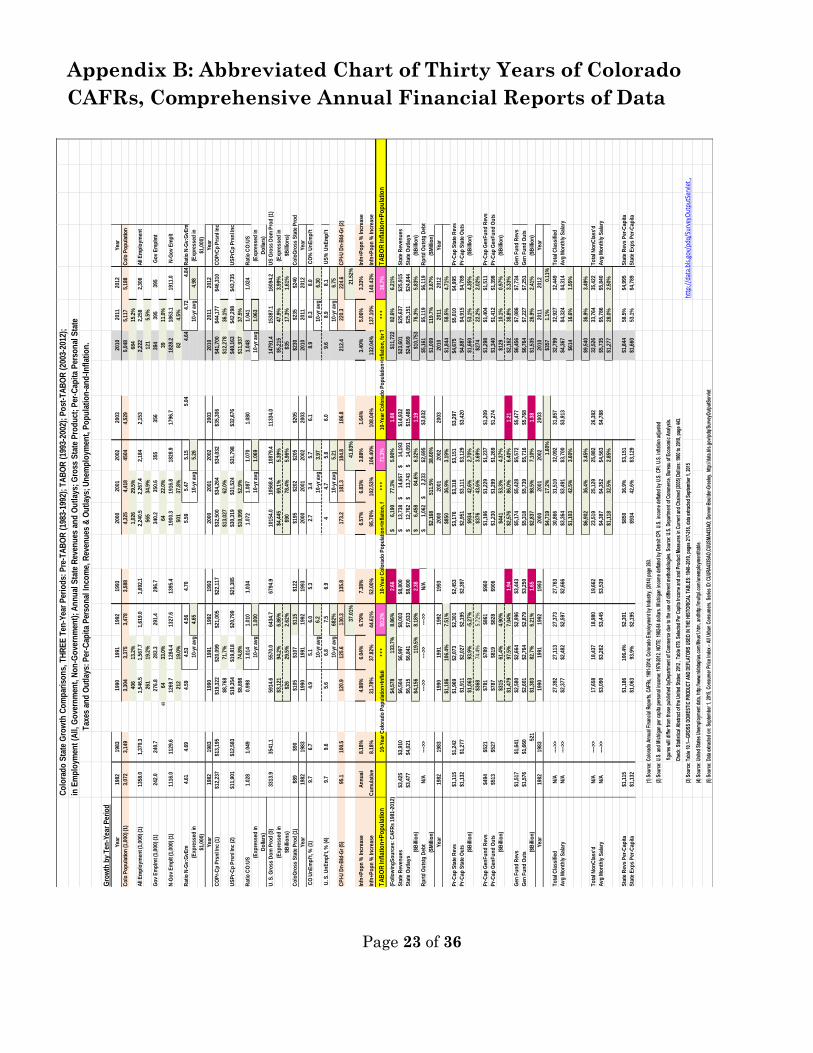
column numbers. Appendix B offers abbreviated 30-Year CAFR data as “Abbreviated Chart
of Thirty Colorado CAFRs, Comprehensive Annual Financial Reports of Data.”
Government Growth: With lower value better, Pre-TABOR Target growth was
50.2% with resulting state revenue-and-expenditure growth a much higher 133.7%-
and-119.5%; and respectively, TABOR Decade-1 Target of 71.3%: somewhat higher
77.3%-and-84.6%; TABOR Decade-2: Target 36.7%, much higher 82.6%-and-76.3%
(Target 4-A,E,H; Revenues 6-A,E,H; Outlays 7-A,E,H)).
Job Growth: Job creation was a surprising and fanciful serendipity. Upfront it must
be realized that the private sector is the source of funds for the public (government)
sector. This is easier understood in terms of wealth-creation and wealth consumption.
A blossoming, wealth-creating private sector and a restrained net wealth-consuming
public sector provide the necessary balance for a prospering and growing economy, all
measurable in amount and kind of job growth.
Jobs-to-Population Growth: With higher value better, in the three sectors percent
growth of jobs-to-population were respectively 46.5%, 48.5% and 44.4%, (3-C,G,J).
Private Sector-to Public Sector Job Growth: Of related importance was insight
into the split of private-to-public sector job growth, higher better, expressed in terms
of ratios 4.28, 7.83 and 2.10 (24-C,G,J), again Decade 2 the outstanding and more
highly desired “rose.”
Page 21 of 36
Per-Capita Income Growth: Coloradan vs U. S. for the three decades, higher better,
were 98.5%, 118.4% and 102.9%, respectively (15-C,G,J).
Colorado State Product vs Gross National Output Per-Capita Growth: For the
three decades, higher better, ratios were 0.31, 1.14 and 0.36, respectively (12-C,G,J).
Revenues and Expenditures defined “exempt from TABOR” grew significantly.
Initial TABOR refunds to taxpayers were sizable.
Ensuing TABOR refunds after Referendum C were taxpayer-costly.
Without those Two Decades of TABOR as they were, taxpayers would have
forfeited a cumulative $6,173 per-capita, or $24,692 for family-of-four; or invested at a
modest yearly 3% interest, the amounts respectively would be $8,228 and $32,912.
Colorado Reported State Debt began to magically appear in the CAFRs in 1997.
State Employee size, growth and expense data provided possibility and flexibility
for more TABOR cost control opportunities.
TABOR has wildly succeeded. It did not cut or freeze government growth, and allowed
additional growth by a vote of Colorado’s people. TABOR did not wreck the state business
economy or the state government, as its “Six-plus-One Big Opponents” had predicted.
Instead, the state government and private-sector job creation were able to grow at a
reasonable but lessened pace, even surviving impressively while other Non-TABOR states
languished in over-taxing, over-spending and cumulating and destructive debt. Colorado
families were able to retain much more of the fruits of their labor.
# # #
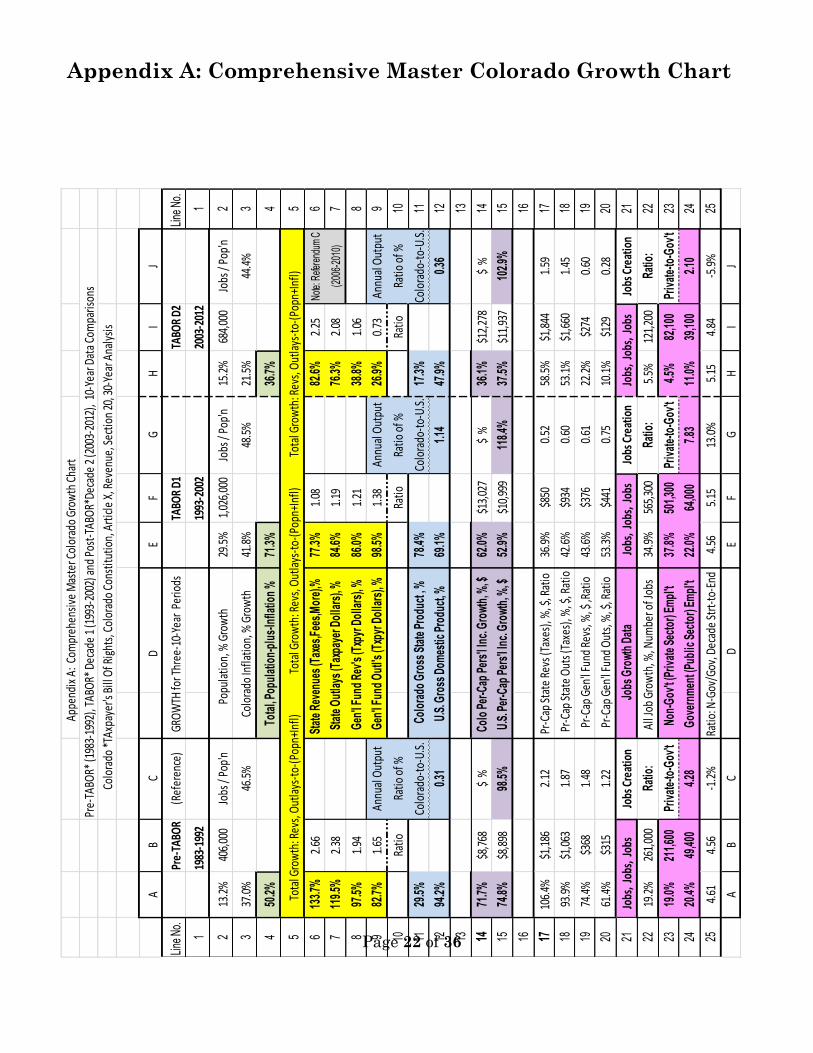
Appendices The following Appendix A: Comprehensive Master Colorado Growth Chart has a
world of information about the Two Decades of TABOR and that of Pre-TABOR. Line 4 has
the basic TABOR government growth target of population-plus-inflation for each of the ten-
year-periods, respectively, 50.2%, 71.3% and 36.7%. These serve as TABOR standards of
performance for government growth. All the other lines contain related data that has been
similarly recorded and analyzed. Not all are immediately obvious in their relative
importance. While a lot of contemplation and curiosity is available in addition to the writings
and charts in this Research Paper, an example of the valuable information has to do with
“Jobs, Jobs, Jobs.” The percentage growth numbers don’t tell the full person-worker story but
the people-numbers are also listed, and provide great meaning. Check them out.
Recent and continuing national media information streams have emphasized repeatedly the
importance of “Creating Jobs.” That’s not all there is. Yes, government can “create” jobs out
of thin air, and no one can stop them. The Public Sector can establish a position, give it a
title, draw up a job description and whoosh, a new job is created, no matter the true need,
object, mission, goal or objective, performance, or whether it is justified or needed at all.
Contrasting to the Private Sector, any new job must have a legitimate function that directly
or indirectly contributes positively to the bottom line profitability of the enterprise.
The bottom line problem with government is there is no bottom line.
Page 22 of 36
Appendix A: Comprehensive Master Colorado Growth Chart
A
ppen
dix
A: C
ompr
ehen
sive
Mas
ter C
olor
ado
Grow
th C
hart
Pre-
TABO
R* (1
983-
1992
), TA
BOR*
Dec
ade
1 (1
993-
2002
) and
Pos
t-TA
BOR*
Deca
de 2
(200
3-20
12),
10-
Year
Dat
a Co
mpa
rison
s
C
olor
ado
*TAx
paye
r's B
ill O
f Rig
hts,
Col
orad
o Co
nstit
utio
n, A
rtic
le X
, Rev
enue
, Sec
tion
20, 3
0-Ye
ar A
naly
sis
AB
C
D
EF
GH
IJ
Line
No.
Pre-
TABO
R(R
efer
ence
) G
ROW
TH fo
r Thr
ee-1
0-Ye
ar P
erio
dsTA
BOR
D1TA
BOR
D2Li
ne N
o.
119
83-1
992
1993
-200
220
03-2
012
1
213
.2%
406,
000
Jobs
/ Po
p'n
P
opul
atio
n, %
Gro
wth
29.5
%1,
026,
000
Jobs
/ Po
p'n
15.2
%68
4,00
0Jo
bs /
Pop'
n2
337
.0%
46.5
%
C
olor
ado
Infla
tion,
% G
row
th41
.8%
48.5
%21
.5%
44.4
%3
450
.2%
T
otal
, Pop
ulat
ion-
plus
-Infla
tion
%
71.3
%36
.7%
4
5
Tot
al G
row
th: R
evs,
Out
lays
-to-
(Pop
n+In
fl)
To
tal G
row
th: R
evs,
Out
lays
-to-
(Pop
n+In
fl)
Tot
al G
row
th: R
evs,
Out
lays
-to-
(Pop
n+In
fl)5
613
3.7%
2.66
Sta
te R
even
ues
(Tax
es,F
ees,
Mor
e),%
77.3
%1.
0882
.6%
2.25
Not
e: R
efer
endu
m C
6
711
9.5%
2.38
Sta
te O
utla
ys (T
axpa
yer D
olla
rs),
%84
.6%
1.19
76.3
%2.
08(2
006-
2010
)7
897
.5%
1.94
Gen
'l Fu
nd R
ev's
(Txp
yr D
olla
rs),
%86
.0%
1.21
38.8
%1.
068
982
.7%
1.65
Annu
al O
utpu
t G
en'l
Fund
Out
l's (T
xpyr
Dol
lars
), %
98.5
%1.
38An
nual
Out
put
26.9
%0.
73An
nual
Out
put
9
10Ra
tioRa
tio o
f %Ra
tioRa
tio o
f %Ra
tioRa
tio o
f %10
1129
.5%
Colo
rado
-to-
U.S.
C
olor
ado
Gro
ss S
tate
Pro
duct
, %78
.4%
Colo
rado
-to-
U.S.
17.3
%Co
lora
do-t
o-U.
S.11
1294
.2%
0.31
U
.S. G
ross
Dom
estic
Pro
duct
, %69
.1%
1.14
47.9
%0.
3612
1313
1471
.7%
$8,7
68$
% C
olo
Per-C
ap P
ers'
l Inc
. Gro
wth,
%, $
62.0
%$1
3,02
7$
%36
.1%
$12,
278
$ %
14
1574
.8%
$8,8
9898
.5%
U.S
. Per
-Cap
Per
s'l I
nc. G
rowt
h, %
, $52
.9%
$10,
999
118.
4%37
.5%
$11,
937
102.
9%15
1616
1710
6.4%
$1,1
862.
12 P
r-Ca
p St
ate
Revs
(Tax
es),
%, $
, Rat
io36
.9%
$850
0.52
58.5
%$1
,844
1.59
17
1893
.9%
$1,0
631.
87 P
r-Ca
p St
ate
Out
s (Ta
xes)
, %, $
, Rat
io42
.6%
$934
0.60
53.1
%$1
,660
1.45
18
1974
.4%
$368
1.48
Pr
-Cap
Gen
'l Fu
nd R
evs,
%, $
,Rat
io43
.6%
$376
0.61
22.2
%$2
740.
6019
2061
.4%
$315
1.22
Pr
-Cap
Gen
'l Fu
nd O
uts,
%, $
, Rat
io53
.3%
$441
0.75
10.1
%$1
290.
2820
21 J
obs,
Job
s, J
obs
Jobs
Cre
atio
n
J
obs
Gro
wth
Data
Jo
bs,
Jobs
, Jo
bsJo
bs C
reat
ion
Jo
bs,
Jobs
, Jo
bsJo
bs C
reat
ion
21
2219
.2%
261,
000
Ratio
: A
ll Jo
b Gr
owth
, %, N
umbe
r of J
obs
34.9
%56
5,30
0Ra
tio:
5.5%
121,
200
Ratio
:22
2319
.0%
211,
600
Priv
ate-
to-G
ov't
N
on-G
ov't
(Priv
ate
Sect
or) E
mpl
't37
.8%
501,
300
Priv
ate-
to-G
ov't
4.5%
82,1
00Pr
ivat
e-to
-Gov
't23
2420
.4%
49,4
004.
28
Gov
ernm
ent (
Publ
ic S
ecto
r) Em
pl't
22.0
%64
,000
7.83
11.0
%39
,100
2.10
24
254.
614.
56-1
.2%
Ratio
: N-G
ov/G
ov, D
ecad
e St
rt-t
o-En
d4.
565.
1513
.0%
5.15
4.84
-5.9
%25
AB
C
D
EF
GH
IJ
Page 23 of 36
Appendix B: Abbreviated Chart of Thirty Years of Colorado
CAFRs, Comprehensive Annual Financial Reports of Data
Co
lora
do
Sta
te G
row
th C
om
par
iso
ns,
TH
RE
E T
en-Y
ear
Per
iod
s: P
re-T
AB
OR
(19
83-1
992)
; T
AB
OR
(19
93-2
002)
; P
ost
-TA
BO
R (
2003
-201
2);
in E
mp
loym
ent
(All
, G
ove
rnm
ent,
No
n-G
ove
rnm
ent)
; A
nn
ual
Sta
te R
even
ues
an
d O
utl
ays;
Gro
ss S
tate
Pro
du
ct;
Per
-Cap
ita
Per
son
al S
tate
Tax
es a
nd
Ou
tlay
s: P
er-C
apit
a P
erso
nal
In
com
e, R
even
ues
& O
utl
ays;
Un
emp
loym
ent,
Po
pu
lati
on
-an
d-I
nfl
atio
n.
Gro
wth
by
Te
n-Y
ea
r P
eri
od
Yea
r19
8219
8319
9019
9119
9219
9320
0020
0120
0220
0320
1020
1120
12Y
ear
Co
lo P
op
ula
tion
(1,0
00) (
1)3,
072
3,14
93,
304
3,37
53,
478
3,58
84,
325
4,41
845
044,
529
5,04
85,
117
5,18
8C
olo
Po
pu
latio
n
406
13.2
%1,
026
29.5
%68
415
.2%
All
Em
plo
ymen
t (1,
000)
(1)
1358
.01,
370.
31,
546.
51,
567.
71,
619.
01,
692.
12,
240.
52,
267.
42,
184
2,15
32,
222
2,25
82,
306
All
Em
plo
ymen
t
261
19.2
%56
534
.9%
121
5.5%
Go
v E
mp
lmt (
1,00
0) (1
)24
2.0
240.
727
6.8
283.
329
1.4
296.
734
0.2
350.
635
535
639
439
539
5 G
ov
Em
plm
t
4964
33.0
%64
22.0
%39
11.0
%
N-G
ov
Em
plt
(1,0
00) (
1)11
16.0
1129
.612
69.7
1284
.413
27.6
1395
.419
00.3
1916
.818
28.9
1796
.718
28.2
1863
.119
11.0
N-G
ov
Em
plt
212
19.0
%50
137
.8%
824.
5%
Rat
io N
-Gv:
GvE
m4.
614.
694.
594.
534.
564.
705.
595.
475.
155.
044.
644.
724.
84R
atio
N-G
v:G
vEm
(Exp
ress
ed in
10-y
r av
g4.
6510
-yr
avg
5.26
10-y
r av
g4.
98(E
xpre
ssed
in
$1,0
00)
$1,0
00)
Yea
r19
8219
8319
9019
9119
9219
9320
0020
0120
0220
0320
1020
1120
12Y
ear
CO
Pr-
Cp
Prs
nl I
nc
(1)
$12,
237
$13,
195
$19,
322
$20,
099
$21,
005
$22,
117
$32,
500
$34,
264
$34,
032
$35,
306
$41,
700
$44,
177
$46,
310
CO
PrC
p P
rsn
l In
c
$8,7
6871
.7%
$13,
027
62.0
%$1
2,27
836
.1%
US
Pr-
Cp
Prs
nl I
nc
(2)
$11,
901
$12,
583
$19,
354
$19,
818
$20,
799
$21,
385
$30,
319
$31,
524
$31,
798
$32,
676
$40,
163
$42,
298
$43,
735
US
PrC
p P
rsn
l In
c
$8,8
9874
.8%
$10,
999
52.9
%$1
1,93
737
.5%
Rat
io C
O:U
S1.
028
1.04
90.
998
1.01
41.
010
1.03
41.
072
1.08
71.
070
1.08
01.
048
1.04
11.
024
Rat
io C
O:U
S
(Exp
ress
ed in
10-y
r av
g1.
000
10-y
r av
g1.
069
10-y
r av
g1.
063
(Exp
ress
ed in
Do
llars
)D
olla
rs)
U. S
. Gro
ss D
om
Pro
d (3
)33
13.9
3541
.159
14.6
5570
.064
34.7
6794
.910
154.
010
568.
410
879.
411
334.
014
791.
415
387.
116
094.
2U
S G
ross
Do
m P
rod
(1)
(Exp
ress
ed in
$3,1
2194
.2%
6.86
%$4
,445
69.1
%5.
39%
$5,2
1547
.9%
3.99
%(E
xpre
ssed
in
$Bill
ion
s)$2
629
.5%
2.62
%$9
078
.4%
5.96
%$3
517
.3%
1.61
%$B
illio
ns)
Co
loG
ross
Sta
te P
rod
(1)
$89
$90
$105
$107
$115
$122
$195
$202
$205
$205
$230
$235
$240
Co
loG
ross
Sta
te P
rod
Yea
r19
8219
8319
9019
9119
9219
9320
0020
0120
0220
0320
1020
1120
12Y
ear
CO
Un
Em
pl't
, % (1
)9.
76.
74.
95.
16.
05.
32.
73.
45.
76.
18.
98.
38.
0 C
O%
Un
Em
pl't
10-y
r av
g6.
210
-yr
avg
3.97
10-y
r av
g6.
30
U. S
. Un
Em
pl't
, % (4
)9.
79.
65.
66.
87.
56.
94
4.7
5.8
6.0
9.6
8.9
8.1
US
% U
nE
mp
l't
10-y
r av
g68
2%10
-yr
avg
5.21
10-y
r av
g6.
75
CP
I-U D
n-B
ld-G
r (5
)95
.110
0.5
120.
912
5.6
130.
313
5.8
173.
218
1.3
184.
818
6.8
212.
422
0.3
224.
6C
PI-U
Dn
-Bld
-Gr
(2)
37.0
1%41
.83%
21.5
2%
Infn
+Po
pn
% In
crea
seA
nn
ual
8.18
%4.
98%
6.04
%6.
79%
7.38
%6.
57%
6.83
%3.
88%
1.64
%3.
40%
5.06
%3.
33%
Infn
+Po
pn
% In
crea
se
Infn
+Po
pn
% In
crea
seC
um
ula
tive
8.18
%31
.78%
37.8
2%44
.61%
52.0
0%95
.70%
102.
53%
106.
40%
108.
04%
132.
04%
137.
10%
140.
43%
Infn
+Po
pn
% In
crea
se
TA
BO
R In
fla
tio
n+
Po
pu
lati
on
10-
Yea
r C
olo
rad
o P
op
ula
tion
+In
flatio
n, f
or
Tax
pay
er's
Bill
of R
igh
ts P
urp
ose
s*
* *
50.2
%
1
0-Y
ear
Co
lora
do
Po
pu
latio
n+I
nfla
tion
, fo
r T
axp
ayer
's B
ill o
f Rig
hts
Pu
rpo
ses
* *
*71
.3%
10-
Yea
r C
olo
rad
o P
op
ula
tion
+In
flatio
n, f
or
Tax
pay
er's
Bill
of R
igh
ts P
urp
ose
s*
* *
36.7
%T
AB
OR
Infl
ati
on
+P
op
ula
tio
n
(Fo
llow
ing
So
urc
es:
CA
FR
s 19
81-2
012)
$4,5
7813
3.7%
8.86
%2.
666,
190
$
77
.3%
5.90
%1.
08$1
1,72
282
.6%
6.21
%
Sta
te R
even
ues
$3,4
25$3
,910
$6,5
04$6
,997
$8,0
03$8
,800
13,7
38$
14
,657
$
14,1
93$
$14,
932
$23,
601
$25,
637
$25,
915
Sta
te R
even
ues
Sta
te O
utla
ys$3
,477
$4,0
21$6
,315
$6,8
41$7
,633
$8,6
0012
,762
$
13,7
43$
14
,091
$
$1
5,48
8$2
4,66
9$2
5,15
1$2
4,84
4S
tate
Ou
tlays
($B
illio
n)
$4,1
5611
9.5%
8.18
%2.
386,
458
$
84
.6%
6.32
%1.
19$1
0,75
376
.3%
5.83
%($
Bill
ion
)
Rp
rtd
Ou
tstg
Deb
tN
/A--
-->>
----
>>--
-->>
----
>>N
/A1,
062
$
2,
233
$
$2,6
95$3
,032
$5,1
61$5
,119
$6,1
19R
prt
d O
uts
tg D
ebt
($M
illio
n)
$2,1
6851
1.5%
38.6
0%$1
,009
119.
7%3.
67%
($M
illio
n)
Yea
r19
8219
8319
9019
9119
9219
9320
0020
0120
0220
0320
1020
1120
12Y
ear
$1,1
8610
6.4%
7.51
%$8
5036
.9%
3.19
%$1
,844
58.5
%4.
71%
Pr-
Cap
Sta
te R
evs
$1,1
15$1
,242
$1,9
69$2
,073
$2,3
01$2
,453
$3,1
76$3
,318
$3,1
51$3
,297
$4,6
75$5
,010
$4,9
95P
r-C
ap S
tate
Rev
s
Pr-
Cap
Sta
te O
uts
$1,1
32$1
,277
$1,9
11$2
,027
$2,1
95$2
,397
$2,9
51$3
,111
$3,1
29$3
,420
$4,8
87$4
,915
$4,7
89P
r-C
ap S
tate
Ou
ts
($B
illio
n)
$1,0
6393
.9%
-5.2
7%$9
3442
.6%
2.70
%$1
,660
53.1
%4.
35%
($B
illio
n)
$368
74.4
%5.
72%
$376
43.6
%3.
69%
$274
22.2
%2.
02%
Pr-
Cap
Gen
Fu
nd
Rev
s$4
94$5
21$7
81$7
89$8
61$9
60$1
,196
$1,2
29$1
,237
$1,2
09$1
,298
$1,4
04$1
,511
Pr-
Cap
Gen
Fu
nd
Rev
s
Pr-
Cap
Gen
Fu
nd
Ou
ts$5
13$5
27$7
87$8
19$8
28$9
06$1
,230
$1,2
99$1
,269
$1,2
74$1
,340
$1,4
12$1
,398
Pr-
Cap
Gen
Fu
nd
Ou
ts
($B
illio
n)
$315
61.4
%4.
90%
$441
53.3
%4.
37%
$129
10.1
%0.
97%
($B
illio
n)
$1,4
7997
.5%
7.04
%1.
94$2
,576
86.0
%6.
40%
1.21
$2,1
6238
.8%
3.33
%
Gen
Fu
nd
Rev
s$1
,517
$1,6
41$2
,580
$2,6
64$2
,996
$3,4
43$5
,174
$5,4
28$5
,572
$5,4
77$6
,456
$7,0
86$7
,734
Gen
Fu
nd
Rev
s
Gen
Fu
nd
Ou
ts$1
,576
$1,6
60$2
,601
$2,7
64$2
,879
$3,2
50$5
,318
$5,7
39$5
,716
$5,7
68$6
,764
$7,2
27$7
,251
Gen
Fu
nd
Ou
ts
($B
illio
n)
521
$1,3
0382
.7%
6.21
%1.
65$2
,837
98.5
%7.
10%
1.38
$1,5
3526
.9%
2.41
%($
Bill
ion
)
Yea
r19
8219
8319
9019
9119
9219
9320
0020
0120
0220
0320
1020
1120
12Y
ear
$4,7
1917
.2%
1.60
%$3
571.
1%0.
11%
To
tal C
lass
ified
N/A
----
>>27
,392
27,1
1327
,373
27,7
6330
,866
31,5
1032
,092
31,8
5732
,799
32,9
2732
,449
To
tal C
lass
ified
Avg
Mo
nth
ly S
alar
yN
/A--
-->>
$2,3
77$2
,482
$2,5
97$2
,666
$3,3
64$3
,491
$3,7
00$3
,913
$4,3
67$4
,324
$4,3
14A
vg M
on
thly
Sal
ary
$1,1
0342
.5%
3.60
%$6
1416
.6%
1.55
%
$6,9
0236
.4%
3.45
%$9
,540
36.9
%3.
49%
To
tal N
on
Cla
ss'd
N/A
----
>>17
,658
18,4
3718
,980
19,6
6223
,519
25,1
2925
,882
26,3
8232
,526
33,7
6435
,422
To
tal N
on
Cla
ss'd
Avg
Mo
nth
ly S
alar
yN
/A--
-->>
$3,0
90$3
,262
$3,4
45$3
,539
$4,3
87$4
,352
$4,5
63$4
,788
$5,7
35$5
,786
$5,8
40A
vg M
on
thly
Sal
ary
$1,1
1832
.5%
2.85
%$1
,277
28.0
%2.
50%
Sta
te R
evs
Per
-Cap
ita$1
,115
$1,1
8610
6.4%
$2,3
01$8
5036
.9%
$3,1
51$1
,844
58.5
%$4
,995
Sta
te R
evs
Per
-Cap
ita
Sta
te E
xps
Per
-Cap
ita$1
,132
$1,0
6393
.9%
$2,1
95$9
3442
.6%
$3,1
29$1
,660
53.1
%$4
,789
Sta
te E
xps
Per
-Cap
ita
(1) S
ourc
e:Co
lora
do A
nnua
l Fin
anci
al R
epor
ts, C
AFRs
, 198
1-20
14; C
olor
ado
Empl
oym
ent b
y In
dust
ry, (
2014
) pag
e 26
3.
(2) S
ourc
e:U.
S. a
nd M
ichi
gan
per c
apita
per
sona
l inc
ome:
197
0-20
12. N
OTE
: 198
2-84
dol
lars
. Mic
higa
n in
com
e de
flate
d by
Det
roit
CPI.
U.S.
inco
me
defla
ted
by U
.S. C
PI. U
.S. i
nfla
tion
adju
sted
figu
res
will
diffe
r fro
m th
ose
publ
ishe
d by
Depa
rtmen
t of C
omm
erce
due
to th
e us
e of
diff
eren
t met
hodo
logi
es. S
ourc
e: U
.S. D
epar
tmen
t of C
omm
erce
, Bur
eau
of E
cono
mic
Ana
lysi
s.
Chec
k: S
tatis
tical
Abs
tract
of t
he U
nite
d St
ates
: 201
2 , T
able
679
. Sel
ecte
d Pe
r Cap
ita In
com
e an
d an
d Pr
oduc
t Mea
sure
s in
Cur
rent
and
Cha
ined
(200
5) D
olla
rs: 1
960
to 2
010,
pag
e 44
3.
(3) S
ourc
e:Ta
ble
10.1
—G
ROSS
DO
MES
TIC
PRO
DUCT
AND
DEF
LATO
RS U
SED
IN T
HE H
ISTO
RICA
L TA
BLES
: 194
0–20
19, p
ages
217
-218
, dat
a ex
tract
ed S
epte
mbe
r 1, 2
015
http
://d
ata.
bls.
gov/
pdq/
Surv
eyO
utpu
tSer
vlet
,
(4) S
ourc
e:Un
ited
Stat
es U
nem
ploy
men
t dat
a, h
ttp://
www.
nida
tapl
us.c
om/lf
eus1
.htm
, and
http
://m
ultp
l.com
/une
mpl
oym
ent/t
able
.
(5) S
ourc
e:Da
ta e
xtra
cted
on:
Sep
tem
ber 1
, 201
5, C
onsu
mer
Pric
e In
dex
– Al
l Urb
an C
onsu
mer
s. S
erie
s ID
: CUU
RA43
3SAO
,CUU
SMA4
33AO
; Den
ver-B
ould
er-G
reel
ey. h
ttp://
data
.bls
.gov
/pdq
/Sur
veyO
utpu
tSer
vlet
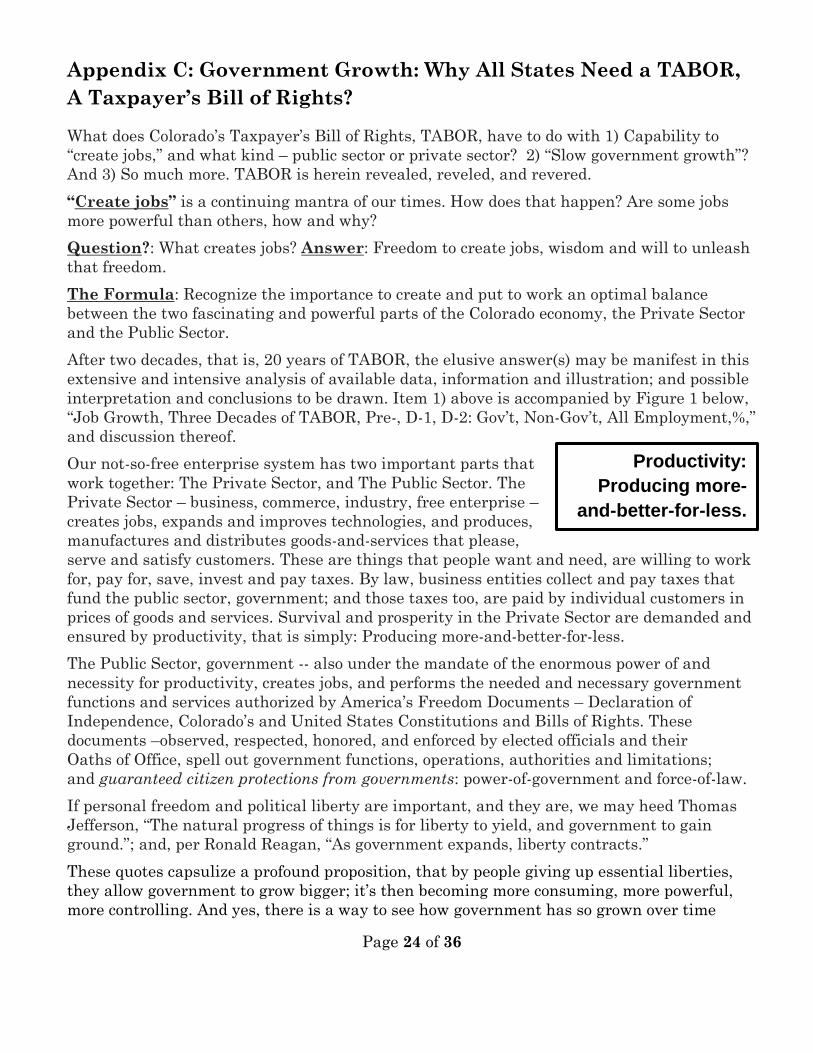
Page 24 of 36
Appendix C: Government Growth: Why All States Need a TABOR,
A Taxpayer’s Bill of Rights?
What does Colorado’s Taxpayer’s Bill of Rights, TABOR, have to do with 1) Capability to
“create jobs,” and what kind – public sector or private sector? 2) “Slow government growth”?
And 3) So much more. TABOR is herein revealed, reveled, and revered.
“Create jobs” is a continuing mantra of our times. How does that happen? Are some jobs
more powerful than others, how and why?
Question?: What creates jobs? Answer: Freedom to create jobs, wisdom and will to unleash
that freedom.
The Formula: Recognize the importance to create and put to work an optimal balance
between the two fascinating and powerful parts of the Colorado economy, the Private Sector
and the Public Sector.
After two decades, that is, 20 years of TABOR, the elusive answer(s) may be manifest in this
extensive and intensive analysis of available data, information and illustration; and possible
interpretation and conclusions to be drawn. Item 1) above is accompanied by Figure 1 below,
“Job Growth, Three Decades of TABOR, Pre-, D-1, D-2: Gov’t, Non-Gov’t, All Employment,%,”
and discussion thereof.
Our not-so-free enterprise system has two important parts that
work together: The Private Sector, and The Public Sector. The
Private Sector – business, commerce, industry, free enterprise –
creates jobs, expands and improves technologies, and produces,
manufactures and distributes goods-and-services that please,
serve and satisfy customers. These are things that people want and need, are willing to work
for, pay for, save, invest and pay taxes. By law, business entities collect and pay taxes that
fund the public sector, government; and those taxes too, are paid by individual customers in
prices of goods and services. Survival and prosperity in the Private Sector are demanded and
ensured by productivity, that is simply: Producing more-and-better-for-less.
The Public Sector, government -- also under the mandate of the enormous power of and
necessity for productivity, creates jobs, and performs the needed and necessary government
functions and services authorized by America’s Freedom Documents – Declaration of
Independence, Colorado’s and United States Constitutions and Bills of Rights. These
documents –observed, respected, honored, and enforced by elected officials and their
Oaths of Office, spell out government functions, operations, authorities and limitations;
and guaranteed citizen protections from governments: power-of-government and force-of-law.
If personal freedom and political liberty are important, and they are, we may heed Thomas
Jefferson, “The natural progress of things is for liberty to yield, and government to gain
ground.”; and, per Ronald Reagan, “As government expands, liberty contracts.”
These quotes capsulize a profound proposition, that by people giving up essential liberties,
they allow government to grow bigger; it’s then becoming more consuming, more powerful,
more controlling. And yes, there is a way to see how government has so grown over time
Productivity:
Producing more-
and-better-for-less.
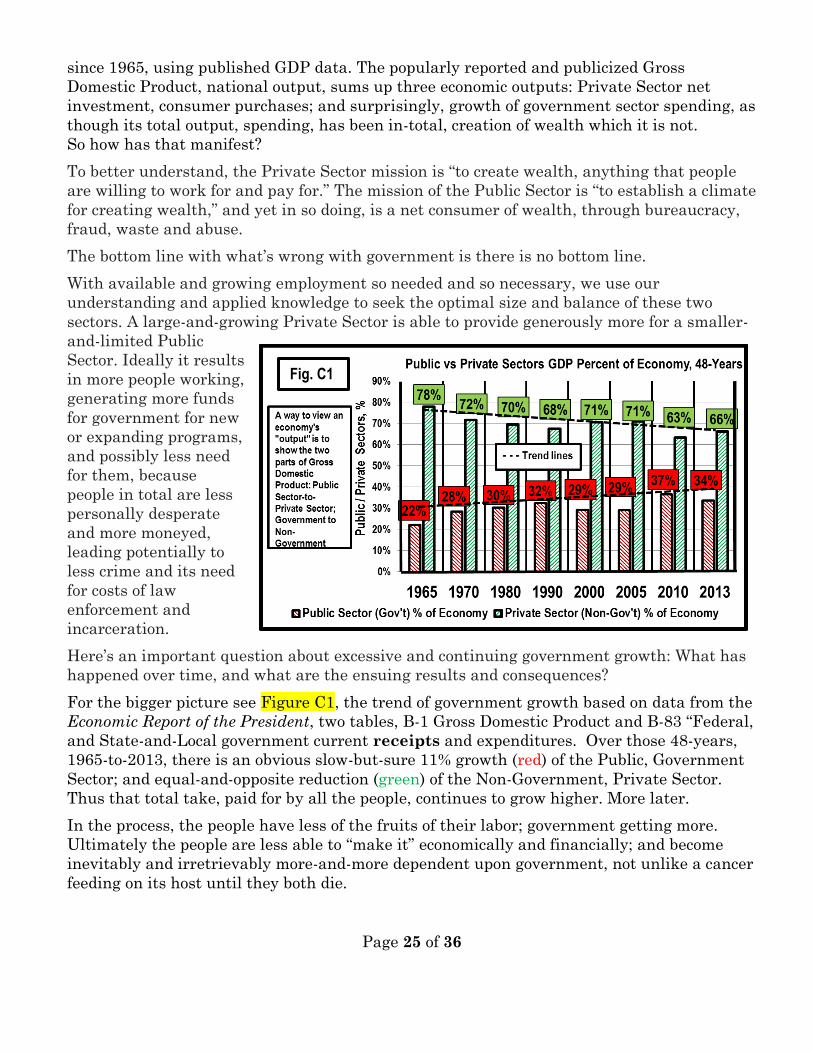
Page 25 of 36
since 1965, using published GDP data. The popularly reported and publicized Gross
Domestic Product, national output, sums up three economic outputs: Private Sector net
investment, consumer purchases; and surprisingly, growth of government sector spending, as
though its total output, spending, has been in-total, creation of wealth which it is not.
So how has that manifest?
To better understand, the Private Sector mission is “to create wealth, anything that people
are willing to work for and pay for.” The mission of the Public Sector is “to establish a climate
for creating wealth,” and yet in so doing, is a net consumer of wealth, through bureaucracy,
fraud, waste and abuse.
The bottom line with what’s wrong with government is there is no bottom line.
With available and growing employment so needed and so necessary, we use our
understanding and applied knowledge to seek the optimal size and balance of these two
sectors. A large-and-growing Private Sector is able to provide generously more for a smaller-
and-limited Public
Sector. Ideally it results
in more people working,
generating more funds
for government for new
or expanding programs,
and possibly less need
for them, because
people in total are less
personally desperate
and more moneyed,
leading potentially to
less crime and its need
for costs of law
enforcement and
incarceration.
Here’s an important question about excessive and continuing government growth: What has
happened over time, and what are the ensuing results and consequences?
For the bigger picture see Figure C1, the trend of government growth based on data from the
Economic Report of the President, two tables, B-1 Gross Domestic Product and B-83 “Federal,
and State-and-Local government current receipts and expenditures. Over those 48-years,
1965-to-2013, there is an obvious slow-but-sure 11% growth (red) of the Public, Government
Sector; and equal-and-opposite reduction (green) of the Non-Government, Private Sector.
Thus that total take, paid for by all the people, continues to grow higher. More later.
In the process, the people have less of the fruits of their labor; government getting more.
Ultimately the people are less able to “make it” economically and financially; and become
inevitably and irretrievably more-and-more dependent upon government, not unlike a cancer
feeding on its host until they both die.
Fig. C1
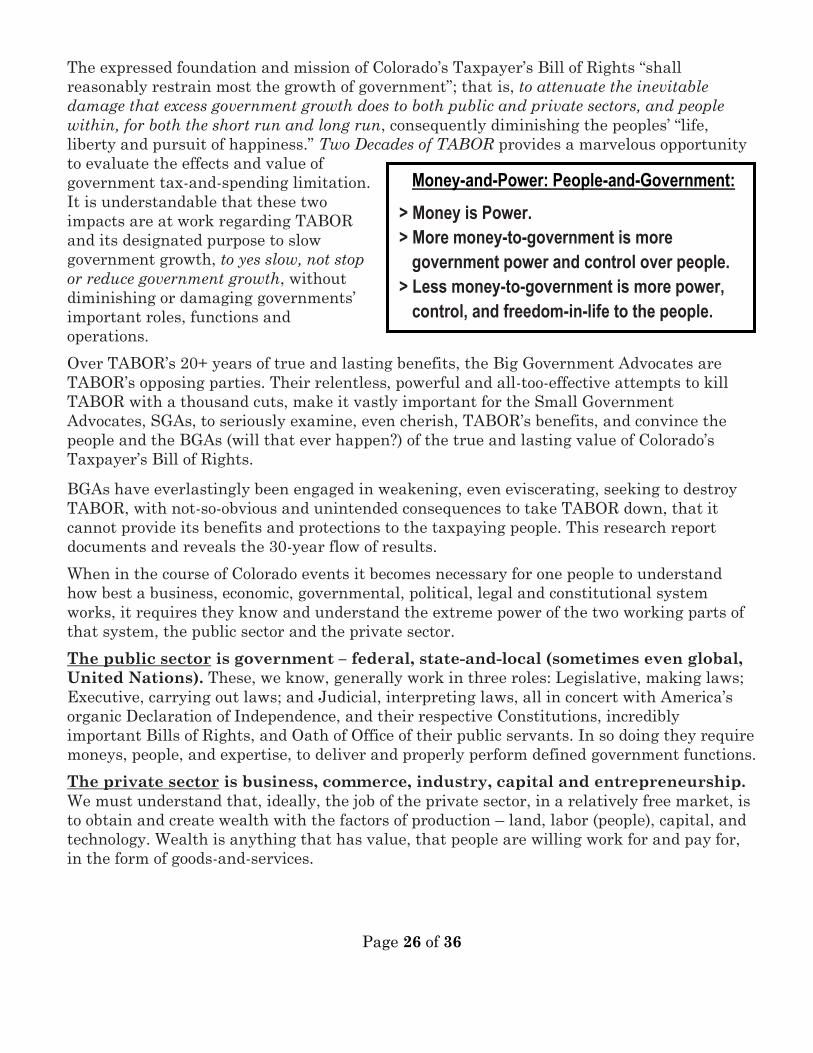
Page 26 of 36
The expressed foundation and mission of Colorado’s Taxpayer’s Bill of Rights “shall
reasonably restrain most the growth of government”; that is, to attenuate the inevitable
damage that excess government growth does to both public and private sectors, and people
within, for both the short run and long run, consequently diminishing the peoples’ “life,
liberty and pursuit of happiness.” Two Decades of TABOR provides a marvelous opportunity
to evaluate the effects and value of
government tax-and-spending limitation.
It is understandable that these two
impacts are at work regarding TABOR
and its designated purpose to slow
government growth, to yes slow, not stop
or reduce government growth, without
diminishing or damaging governments’
important roles, functions and
operations.
Over TABOR’s 20+ years of true and lasting benefits, the Big Government Advocates are
TABOR’s opposing parties. Their relentless, powerful and all-too-effective attempts to kill
TABOR with a thousand cuts, make it vastly important for the Small Government
Advocates, SGAs, to seriously examine, even cherish, TABOR’s benefits, and convince the
people and the BGAs (will that ever happen?) of the true and lasting value of Colorado’s
Taxpayer’s Bill of Rights.
BGAs have everlastingly been engaged in weakening, even eviscerating, seeking to destroy
TABOR, with not-so-obvious and unintended consequences to take TABOR down, that it
cannot provide its benefits and protections to the taxpaying people. This research report
documents and reveals the 30-year flow of results.
When in the course of Colorado events it becomes necessary for one people to understand
how best a business, economic, governmental, political, legal and constitutional system
works, it requires they know and understand the extreme power of the two working parts of
that system, the public sector and the private sector.
The public sector is government – federal, state-and-local (sometimes even global,
United Nations). These, we know, generally work in three roles: Legislative, making laws;
Executive, carrying out laws; and Judicial, interpreting laws, all in concert with America’s
organic Declaration of Independence, and their respective Constitutions, incredibly
important Bills of Rights, and Oath of Office of their public servants. In so doing they require
moneys, people, and expertise, to deliver and properly perform defined government functions.
The private sector is business, commerce, industry, capital and entrepreneurship.
We must understand that, ideally, the job of the private sector, in a relatively free market, is
to obtain and create wealth with the factors of production – land, labor (people), capital, and
technology. Wealth is anything that has value, that people are willing work for and pay for,
in the form of goods-and-services.
Money-and-Power: People-and-Government:
> Money is Power.
> More money-to-government is more
government power and control over people.
> Less money-to-government is more power,
control, and freedom-in-life to the people.
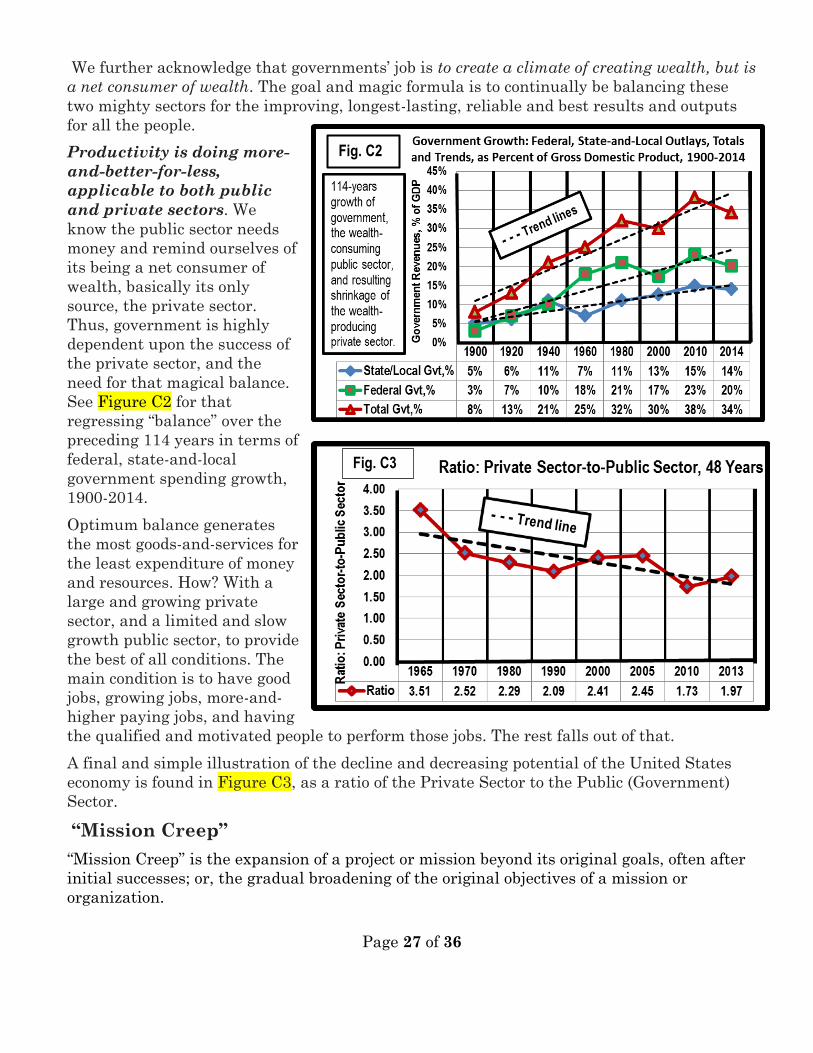
Page 27 of 36
We further acknowledge that governments’ job is to create a climate of creating wealth, but is
a net consumer of wealth. The goal and magic formula is to continually be balancing these
two mighty sectors for the improving, longest-lasting, reliable and best results and outputs
for all the people.
Productivity is doing more-
and-better-for-less,
applicable to both public
and private sectors. We
know the public sector needs
money and remind ourselves of
its being a net consumer of
wealth, basically its only
source, the private sector.
Thus, government is highly
dependent upon the success of
the private sector, and the
need for that magical balance.
See Figure C2 for that
regressing “balance” over the
preceding 114 years in terms of
federal, state-and-local
government spending growth,
1900-2014.
Optimum balance generates
the most goods-and-services for
the least expenditure of money
and resources. How? With a
large and growing private
sector, and a limited and slow
growth public sector, to provide
the best of all conditions. The
main condition is to have good
jobs, growing jobs, more-and-
higher paying jobs, and having
the qualified and motivated people to perform those jobs. The rest falls out of that.
A final and simple illustration of the decline and decreasing potential of the United States
economy is found in Figure C3, as a ratio of the Private Sector to the Public (Government)
Sector.
“Mission Creep”
“Mission Creep” is the expansion of a project or mission beyond its original goals, often after
initial successes; or, the gradual broadening of the original objectives of a mission or
organization.
Fig. C2
Fig. C3
Page 28 of 36
“Mission Creep” of the private sector results in more and better goods-and-services with
higher quality and lower prices; examples, smart phones, computers, tablets, LED-4K-large
screen televisions, digital cameras, refrigerators, microwave ovens and air conditioners.
The massive and irresistible “Mission Creep” of
government is to create or re-define a bureau, agency,
authority, project, take on more growth, and result in more
and bigger agencies, more people and functions, all seeking
not only to survive but continue to grow. One example is
CHFA, Colorado Housing and Finance Authority,
extending well beyond helping people purchase houses.
Other Colorado government examples of “Mission Creep”
are initial Colorado Lottery $1 gambling tickets sold manually in stores, to big dollar tickets
sold in impressive, expensive, self-selling machines; “Limited Casino Gambling” (yeah, right),
“to preserve the historic character of Colorado mountain towns” (yeah, right again) to valley-
dominating, mountain-replacing, spreading, towering behemoths; burgeoning Open-Space
expansions; Mass Transit, bus-to-experimental-to-limited light rail-to-expanding front range
light rail; a “catch-up,” temporary, 10-year Cultural Arts Tax to launch a new era of metro-
Denver arts and culture, passed in 1987g, again submitted and approved in 1997, 2007, and
slated once again for 2017. And should be mentioned also, accomplished taxpayer-funded
professional baseball and football facilities (keeping in mind the privately-funded Pepsi
Center), and their “returns” (or lack thereof) to generous funding by Colorado taxpayers?
Yes, mission creep. It happens.
In a time when Leviathan – huge and growing government prevails, to government growth,
must attention be paid? Is excessive growth of government good or bad, and Why?
# # #
Appendix D: Related TABOR Historical Information
Previous tax limitations appeared on the Colorado ballot by citizen initiative in 1966. Tax
reform initiatives were defeated in 1972, 1976, and 1978. Another string of citizen-taxpayer
initiatives began in 1986 with Amendment 4, which would have required only, that all tax
increases must be approved by the taxpayers to be taxed. Proponent leaders John and Diane
Cox of Palisade were able to garner only 37% in favor.
Colorado Springs property owner Douglas Bruce and supporters successfully organized a
1988 campaign for the first of three TABOR, or Taxpayer’s Bill of Rights petition drives that
captured enough signatures to appear on the ballot, and now important, all with volunteer,
unpaid signature gatherers! The TABOR initiatives brought together a noteworthy
agglomeration of opponents. “The Six Bigs”—Big Government, Big Business, Big Media, Big
Labor, Big Education and Big Everything Else—prevailed when Bruce’s 1988 attempt got
only 43% of the vote.
Surprisingly, Bruce came back in 1990 with a new, improved version which then-Governor
Roy Romer personally fought vigorously with all the power of his office, saying if it passed he
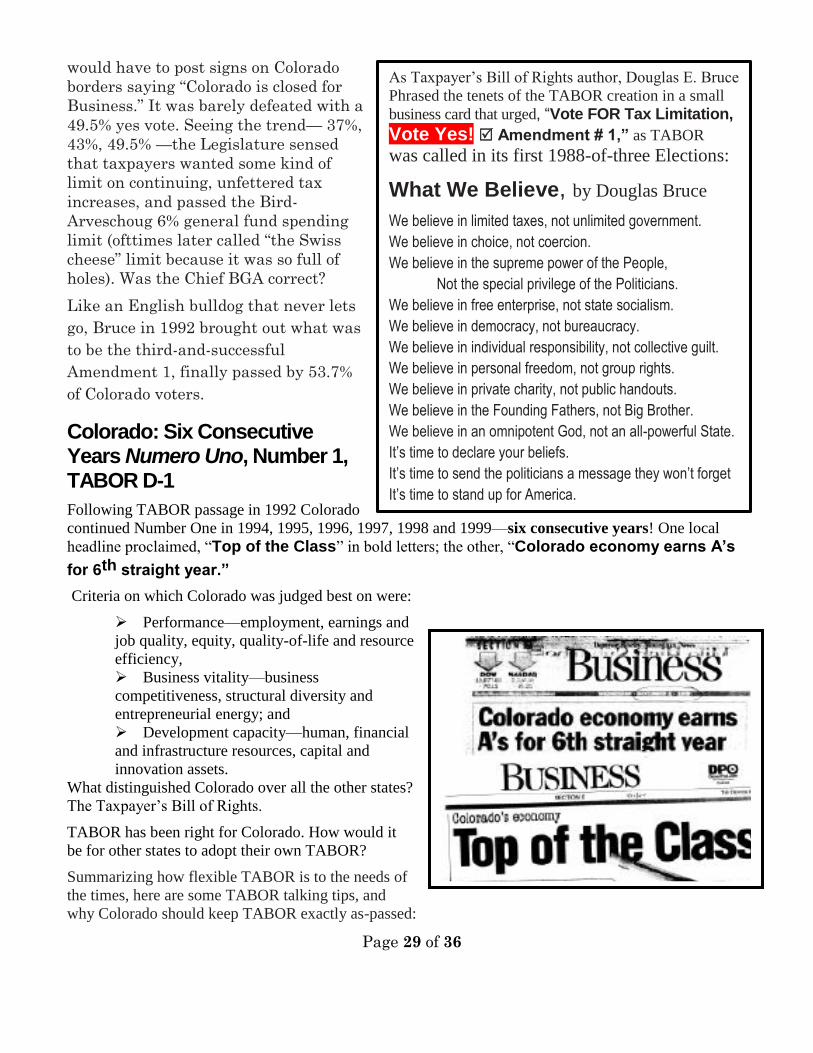
Page 29 of 36
would have to post signs on Colorado
borders saying “Colorado is closed for
Business.” It was barely defeated with a
49.5% yes vote. Seeing the trend— 37%,
43%, 49.5% —the Legislature sensed
that taxpayers wanted some kind of
limit on continuing, unfettered tax
increases, and passed the Bird-
Arveschoug 6% general fund spending
limit (ofttimes later called “the Swiss
cheese” limit because it was so full of
holes). Was the Chief BGA correct?
Like an English bulldog that never lets
go, Bruce in 1992 brought out what was
to be the third-and-successful
Amendment 1, finally passed by 53.7%
of Colorado voters.
Colorado: Six Consecutive Years Numero Uno, Number 1, TABOR D-1
Following TABOR passage in 1992 Colorado
continued Number One in 1994, 1995, 1996, 1997, 1998 and 1999—six consecutive years! One local
headline proclaimed, “Top of the Class” in bold letters; the other, “Colorado economy earns A’s
for 6th straight year.”
Criteria on which Colorado was judged best on were:
Performance—employment, earnings and
job quality, equity, quality-of-life and resource
efficiency,
Business vitality—business
competitiveness, structural diversity and
entrepreneurial energy; and
Development capacity—human, financial
and infrastructure resources, capital and
innovation assets.
What distinguished Colorado over all the other states?
The Taxpayer’s Bill of Rights.
TABOR has been right for Colorado. How would it
be for other states to adopt their own TABOR?
Summarizing how flexible TABOR is to the needs of
the times, here are some TABOR talking tips, and
why Colorado should keep TABOR exactly as-passed:
As Taxpayer’s Bill of Rights author, Douglas E. Bruce
Phrased the tenets of the TABOR creation in a small
business card that urged, “Vote FOR Tax Limitation, Vote Yes! Amendment # 1,” as TABOR was called in its first 1988-of-three Elections:
What We Believe, by Douglas Bruce
We believe in limited taxes, not unlimited government.
We believe in choice, not coercion.
We believe in the supreme power of the People,
Not the special privilege of the Politicians.
We believe in free enterprise, not state socialism.
We believe in democracy, not bureaucracy.
We believe in individual responsibility, not collective guilt.
We believe in personal freedom, not group rights.
We believe in private charity, not public handouts.
We believe in the Founding Fathers, not Big Brother.
We believe in an omnipotent God, not an all-powerful State.
It’s time to declare your beliefs.
It’s time to send the politicians a message they won’t forget
It’s time to stand up for America.
Page 30 of 36
TABOR provides taxpayer and business protections against uncontrolled increases in taxes
and government spending.
TABOR allows spending increases over TABOR limits by a vote of the people; to keep up
with inflation; population growth; government productivity growth; increases resulting from the
sale of government assets and taxed revenues from such sales; gifts and federal fund increases;
employee pension fund contributions; and such things as reserve transfers and damage awards.
TABOR gives taxpayers more “remote control” of taxes and government size, growth,
power and control. The biggest obstacle to smooth and manageable fiscal and budget policy in
Colorado has been the rigid and over-generous mandates of Amendment 23, K-12 required
government school funding growth, not TABOR.
Why keep TABOR exactly as-is? Here are a few TABOR talking tips:
1. TABOR provides taxpayer protections.
2. TABOR allows increases in spending by
A vote of the people.
Inflation growth.
Population growth.
Government productivity growth via strict and disciplined apportionment of state finances..
Sale of government assets, then tax revenues from them.
Gifts and federal funds.
Employee pension contributions and funds earnings.
Reserves transfers or expenditures, and damage awards.
3. TABOR gives taxpayers some control of taxes and government size, growth and power.
Why would the people give up the right and power of their vote to control their taxes?
Why would the people suffer less control and higher taxes by accepting a much more
generous factor such as increase in personal income substitute for the more well-defined and
controlling inflation-plus-population?
If the people work harder, work overtime, take on another job, spouse, children take on an
additional job, boost their productivity or invent something, should government standing by receive
a tax bonus?
Why?
Loud voices declared, “We have a budget crisis. We need more money,” while they asked Coloradans to
support their Referendum C (and D that went down). Now Coloradans are witnessing a command
performance to bamboozle the populace into supporting a new BBC, “Building a Better Colorado.”
Coloradans have Three Things in Common, why not:
1) We all pay taxes,
2) Taxes are a great burden,
3) Government continues to be a “growth industry.”
Who is “We”?
There are two “We’s,” “We the Government” (and its BGAs, Big Government Advocates), and “We the
People.” The former want to manipulate and fool the people to emasculate Colorado’s Taxpayer’s Bill of
Rights, contending that “We” (all) are the government. No, they are, and we are not. What are we currently
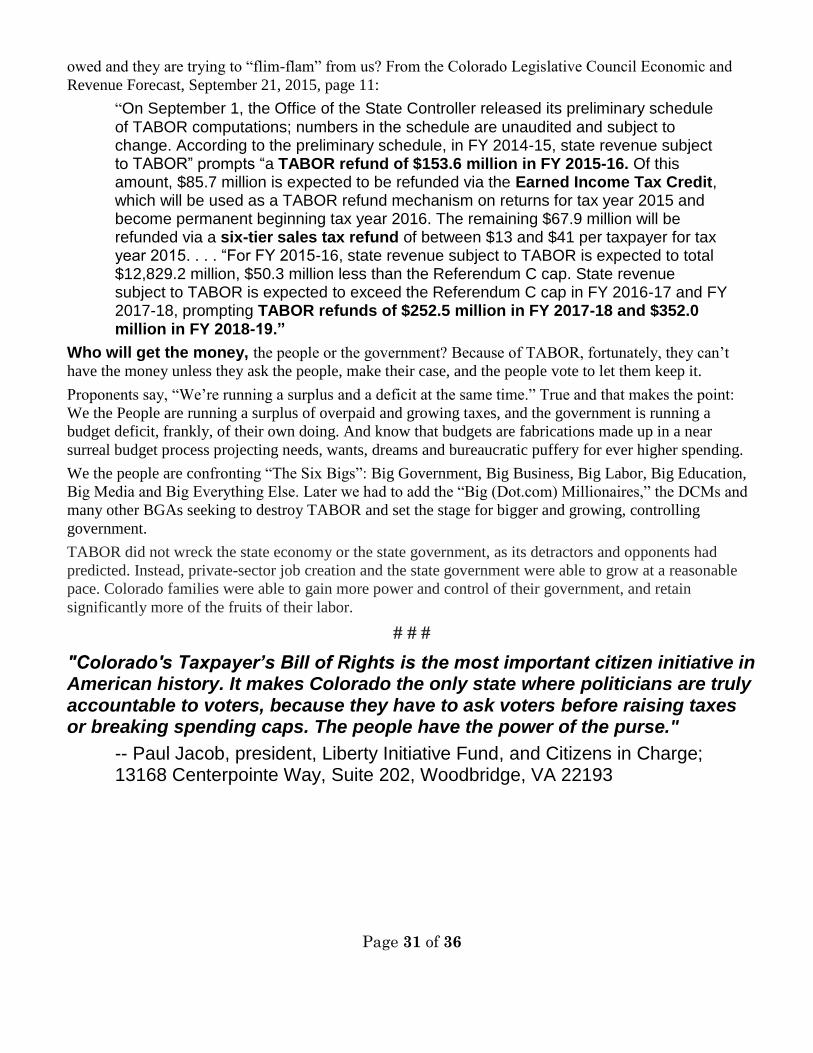
Page 31 of 36
owed and they are trying to “flim-flam” from us? From the Colorado Legislative Council Economic and
Revenue Forecast, September 21, 2015, page 11:
“On September 1, the Office of the State Controller released its preliminary schedule of TABOR computations; numbers in the schedule are unaudited and subject to change. According to the preliminary schedule, in FY 2014-15, state revenue subject to TABOR” prompts “a TABOR refund of $153.6 million in FY 2015-16. Of this amount, $85.7 million is expected to be refunded via the Earned Income Tax Credit, which will be used as a TABOR refund mechanism on returns for tax year 2015 and become permanent beginning tax year 2016. The remaining $67.9 million will be refunded via a six-tier sales tax refund of between $13 and $41 per taxpayer for tax year 2015. . . . “For FY 2015-16, state revenue subject to TABOR is expected to total $12,829.2 million, $50.3 million less than the Referendum C cap. State revenue subject to TABOR is expected to exceed the Referendum C cap in FY 2016-17 and FY 2017-18, prompting TABOR refunds of $252.5 million in FY 2017-18 and $352.0 million in FY 2018-19.”
Who will get the money, the people or the government? Because of TABOR, fortunately, they can’t
have the money unless they ask the people, make their case, and the people vote to let them keep it.
Proponents say, “We’re running a surplus and a deficit at the same time.” True and that makes the point:
We the People are running a surplus of overpaid and growing taxes, and the government is running a
budget deficit, frankly, of their own doing. And know that budgets are fabrications made up in a near
surreal budget process projecting needs, wants, dreams and bureaucratic puffery for ever higher spending.
We the people are confronting “The Six Bigs”: Big Government, Big Business, Big Labor, Big Education,
Big Media and Big Everything Else. Later we had to add the “Big (Dot.com) Millionaires,” the DCMs and
many other BGAs seeking to destroy TABOR and set the stage for bigger and growing, controlling
government.
TABOR did not wreck the state economy or the state government, as its detractors and opponents had
predicted. Instead, private-sector job creation and the state government were able to grow at a reasonable
pace. Colorado families were able to gain more power and control of their government, and retain
significantly more of the fruits of their labor.
# # #
"Colorado's Taxpayer’s Bill of Rights is the most important citizen initiative in American history. It makes Colorado the only state where politicians are truly accountable to voters, because they have to ask voters before raising taxes or breaking spending caps. The people have the power of the purse."
-- Paul Jacob, president, Liberty Initiative Fund, and Citizens in Charge; 13168 Centerpointe Way, Suite 202, Woodbridge, VA 22193
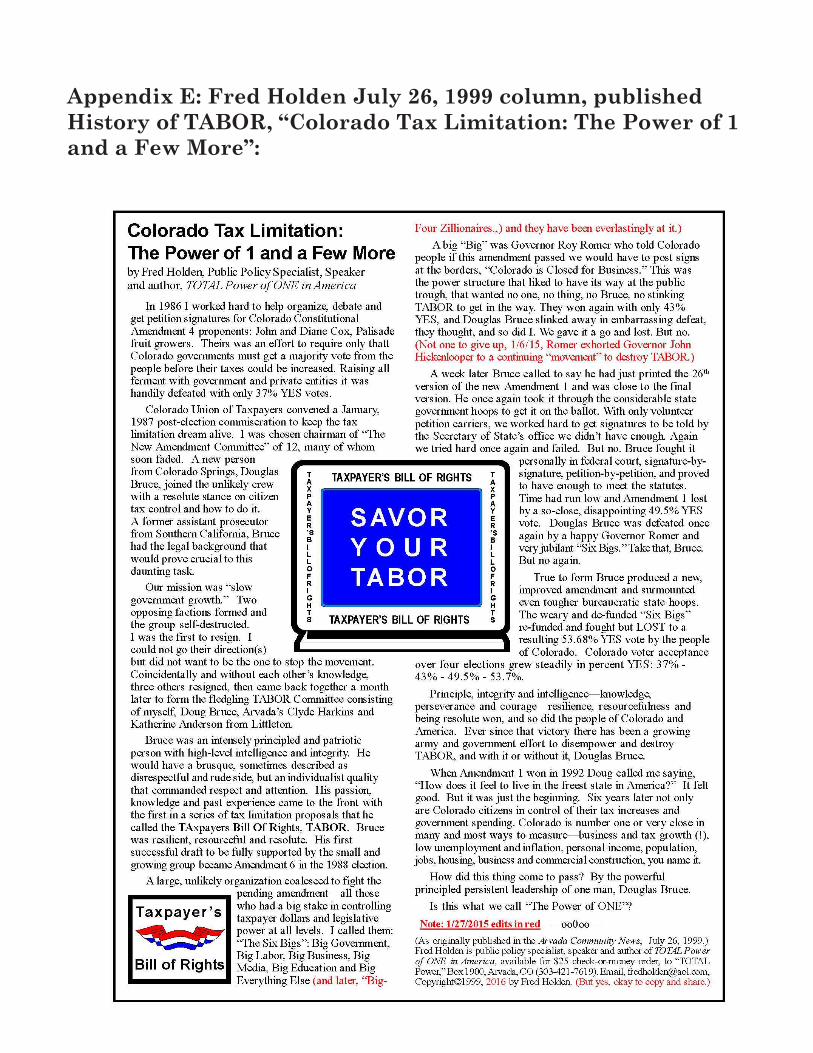
Page 32 of 36
Appendix E: Fred Holden July 26, 1999 column, published
History of TABOR, “Colorado Tax Limitation: The Power of 1
and a Few More”:
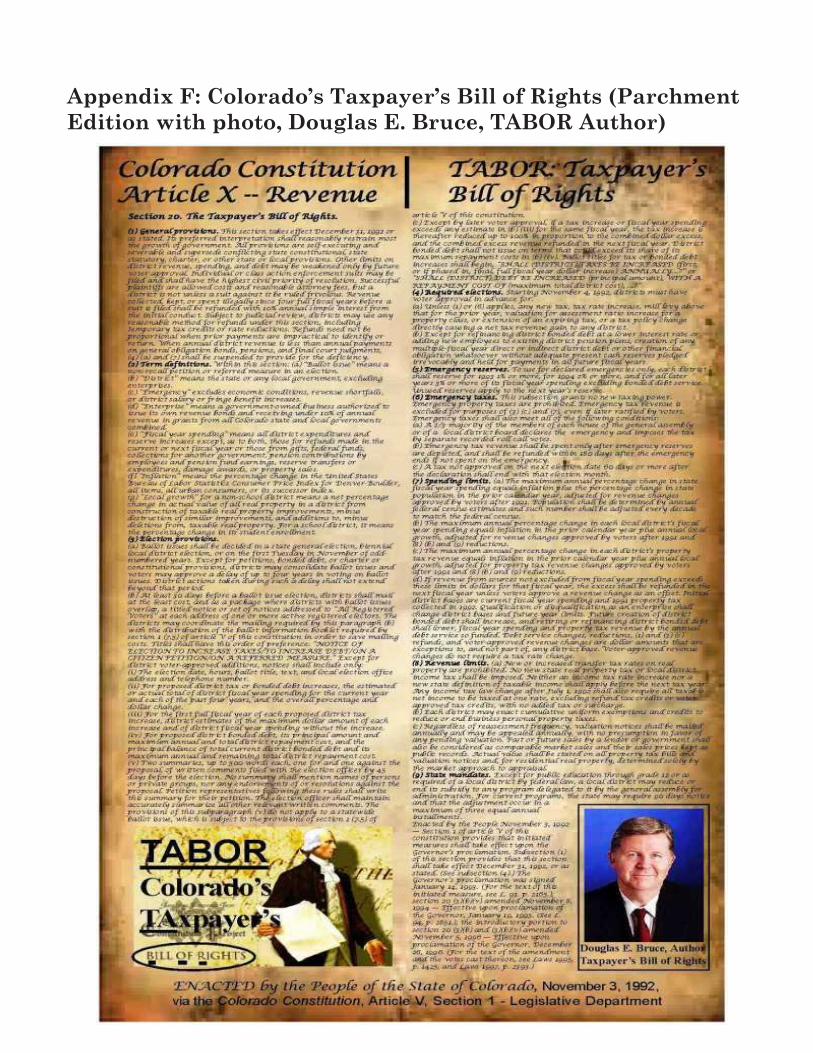
Page 33 of 36
Appendix F: Colorado’s Taxpayer’s Bill of Rights (Parchment
Edition with photo, Douglas E. Bruce, TABOR Author)
Page 34 of 36
Appendix G: Colorado’s, The Taxpayer’s Bill of Rights
Colorado Constitution, Article X, Revenue
Section 20. The Taxpayer’s Bill of Rights. (1) General provisions. This section takes effect December 31,
1992 or as stated. Its preferred interpretation shall reasonably
restrain most the growth of government. All provisions are self-
executing and severable and supersede conflicting state
constitutional, state statutory, charter, or other state or local
provisions. Other limits on district revenue, spending, and debt
may be weakened only by future voter approval. Individual or
class action enforcement suits may be filed and shall have the
highest civil priority of resolution. Successful plaintiffs are
allowed costs and reasonable attorney fees, but a district is not
unless a suit against it be ruled frivolous. Revenue collected,
kept, or spent illegally since four full fiscal years before a suit is
filed shall be refunded with 10% annual simple interest from the
initial conduct. Subject to judicial review, districts may use any
reasonable method for refunds under this section, including
temporary tax credits or rate reductions. Refunds need not be
proportional when prior payments are impractical to identify or
return. When annual district revenue is less than annual
payments on general obligation bonds, pensions, and final court
judgments, (4) (a) and (7) shall be suspended to provide for the
deficiency.
(2) Term definitions. Within this section:
(a) “Ballot issue” means a non-recall petition or referred
measure in an election.
(b) “District” means the state or any local government, excluding
enterprises.
(c) “Emergency” excludes economic conditions, revenue
shortfalls, or district salary or fringe benefit increases.
(d) “Enterprise” means a government-owned business authorized
to issue its own revenue bonds and receiving under 10% of
annual revenue in grants from all Colorado state and local
governments combined.
(e) “Fiscal year spending” means all district expenditures and
reserve increases except, as to both, those for refunds made in
the current or next fiscal year or those from gifts, federal funds,
collections for another government, pension contributions by
employees and pension fund earnings, reserve transfers or
expenditures, damage awards, or property sales.
(f) “Inflation” means the percentage change in the United States
Bureau of Labor Statistics Consumer Price Index for Denver-
Boulder, all items, all urban consumers, or its successor index.
(g) “Local growth” for a non-school district means a net
percentage change in actual value of all real property in a
district from construction of taxable real property
improvements, minus destruction of similar improvements, and
additions to, minus deletions from, taxable real property. For a
school district, it means the percentage change in its student
enrollment.
(3) Election provisions.
(a) Ballot issues shall be decided in a state general election,
biennial local district election, or on the first Tuesday in
November of odd-numbered years. Except for petitions, bonded
debt, or charter or constitutional provisions, districts may
consolidate ballot issues and voters may approve a delay of up to
four years in voting on ballot issues. District actions taken
during such a delay shall not extend beyond that period.
(b) At least 30 days before a ballot issue election, districts shall
mail at the least cost, and as a package where districts with
ballot issues overlap, a titled notice or set of notices addressed to
“All Registered Voters” at each address of one or more active
registered electors. The districts may coordinate the mailing
required by this paragraph (b) with the distribution of the ballot
information booklet required by section 1 (7.5) of article V of this
constitution in order to save mailing costs. Titles shall have this
order of preference: “NOTICE OF ELECTION TO INCREASE
TAXES/TO INCREASE DEBT/ON A CITIZEN PETITION/ON A
REFERRED MEASURE.” Except for district voter-approved
additions, notices shall include only:
(i) The election date, hours, ballot title, text, and local election
office address and telephone number.
(ii) For proposed district tax or bonded debt increases, the
estimated or actual total of district fiscal year spending for the
current year and each of the past four years, and the overall
percentage and dollar change.
(iii) For the first full fiscal year of each proposed district tax
increase, district estimates of the maximum dollar amount of
each increase and of district fiscal year spending without the
increase.
(iv) For proposed district bonded debt, its principal amount and
maximum annual and total district repayment cost, and the
principal balance of total current district bonded debt and its
maximum annual and remaining total district repayment cost.
(v) Two summaries, up to 500 words each, one for and one
against the proposal, of written comments filed with the election
officer by 45 days before the election. No summary shall mention
names of persons or private groups, nor any endorsements of or
resolutions against the proposal. Petition representatives
following these rules shall write this summary for their petition.
The election officer shall maintain and accurately summarize all
other relevant written comments. The provisions of this
subparagraph (v) do not apply to a statewide ballot issue, which
is subject to the provisions of section 1 (7.5) of article V of this
constitution.
(c) Except by later voter approval, if a tax increase or fiscal year
spending exceeds any estimate in (b) (iii) for the same fiscal
year, the tax increase is thereafter reduced up to 100% in
proportion to the combined dollar excess, and the combined
excess revenue refunded in the next fiscal year. District bonded
debt shall not issue on terms that could exceed its share of its
Page 35 of 36
maximum repayment costs in (b) (iv). Ballot titles for tax or
bonded debt increases shall begin, “SHALL (DISTRICT) TAXES
BE INCREASED (first, or if phased in, final, full fiscal year
dollar increase) ANNUALLY...?” or “SHALL (DISTRICT) DEBT
BE INCREASED (principal amount), WITH A REPAYMENT
COST OF (maximum total district cost), ...?”
(4) Required elections. Starting November 4, 1992, districts
must have voter approval in advance for:
(a) Unless (1) or (6) applies, any new tax, tax rate increase, mill
levy above that for the prior year, valuation for assessment ratio
increase for a property class, or extension of an expiring tax, or a
tax policy change directly causing a net tax revenue gain to any district.
(b) Except for refinancing district bonded debt at a lower interest
rate or adding new employees to existing district pension plans,
creation of any multiple-fiscal year direct or indirect district debt
or other financial obligation whatsoever without adequate
present cash reserves pledged irrevocably and held for payments
in all future fiscal years.
(5) Emergency reserves. To use for declared emergencies only,
each district shall reserve for 1993 1% or more, for 1994 2% or
more, and for all later years 3% or more of its fiscal year
spending excluding bonded debt service. Unused reserves apply
to the next year’s reserve.
(6) Emergency taxes. This subsection grants no new taxing
power. Emergency property taxes are prohibited. Emergency tax
revenue is excluded for purposes of (3) (c) and (7), even if later
ratified by voters. Emergency taxes shall also meet all of the
following conditions: (a) A 2/3 majority of the members of each
house of the general assembly or of a local district board declares
the emergency and imposes the tax by separate recorded roll call votes.
(b) Emergency tax revenue shall be spent only after emergency
reserves are depleted, and shall be refunded within 180 days
after the emergency ends if not spent on the emergency.
(c) A tax not approved on the next election date 60 days or more
after the declaration shall end with that election month.
(7) Spending limits. (a) The maximum annual percentage change
in state fiscal year spending equals inflation plus the percentage
change in state population in the prior calendar year, adjusted
for revenue changes approved by voters after 1991. Population
shall be determined by annual federal census estimates and
such number shall be adjusted every decade to match the federal
census.
(b) The maximum annual percentage change in each local
district’s fiscal year spending equals inflation in the prior
calendar year plus annual local growth, adjusted for revenue
changes approved by voters after 1991 and (8) (b) and (9) reductions.
(c) The maximum annual percentage change in each district’s
property tax revenue equals inflation in the prior calendar year
plus annual local growth, adjusted for property tax revenue
changes approved by voters after 1991 and (8) (b) and (9)
reductions.
(d) If revenue from sources not excluded from fiscal year
spending exceeds these limits in dollars for that fiscal year, the
excess shall be refunded in the next fiscal year unless voters
approve a revenue change as an offset. Initial district bases are
current fiscal year spending and 1991 property tax collected in
1992. Qualification or disqualification as an enterprise shall
change district bases and future year limits. Future creation of
district bonded debt shall increase, and retiring or refinancing
district bonded debt shall lower, fiscal year spending and
property tax revenue by the annual debt service so funded. Debt
service changes, reductions, (1) and (3) (c) refunds, and voter-
approved revenue changes are dollar amounts that are
exceptions to, and not part of, any district base. Voter-approved
revenue changes do not require a tax rate change.
(8) Revenue limits. (a) New or increased transfer tax rates on
real property are prohibited. No new state real property tax or
local district income tax shall be imposed. Neither an income tax
rate increase nor a new state definition of taxable income shall
apply before the next tax year. Any income tax law change after
July 1, 1992 shall also require all taxable net income to be taxed
at one rate, excluding refund tax credits or voter-approved tax
credits, with no added tax or surcharge.
(b) Each district may enact cumulative uniform exemptions and
credits to reduce or end business personal property taxes.
(c) Regardless of reassessment frequency, valuation notices shall
be mailed annually and may be appealed annually, with no
presumption in favor of any pending valuation. Past or future
sales by a lender or government shall also be considered as
comparable market sales and their sales prices kept as public
records. Actual value shall be stated on all property tax bills and
valuation notices and, for residential real property, determined
solely by the market approach to appraisal.
(9) State mandates. Except for public education through grade
12 or as required of a local district by federal law, a local district
may reduce or end its subsidy to any program delegated to it by
the general assembly for administration. For current programs,
the state may require 90 days notice and that the adjustment
occur in a maximum of three equal annual installments.
Enacted by the People November 3, 1992 — Section 1 of article V
of this constitution provides that initiated measures shall take
effect upon the Governor’s proclamation. Subsection (1) of this
section provides that this section shall take effect December 31,
1992, or as stated. (See subsection (4).) The Governor’s
proclamation was signed January 14, 1993. (For the text of this
initiated measure, see L. 93. p. 2165.); section 20 (3)(b)(v)
amended November 8, 1994 — Effective upon proclamation of
the Governor, January 19, 1995. (See L. 94, p. 2851.); the
introductory portion to section 20 (3)(b) and (3)(b)(v) amended
November 5, 1996 — Effective upon proclamation of the
Governor, December 26, 1996. (For the text of the amendment
and the votes cast thereon, see Laws 1995, p. 1425, and Laws
1997, p. 2393.)
# # #
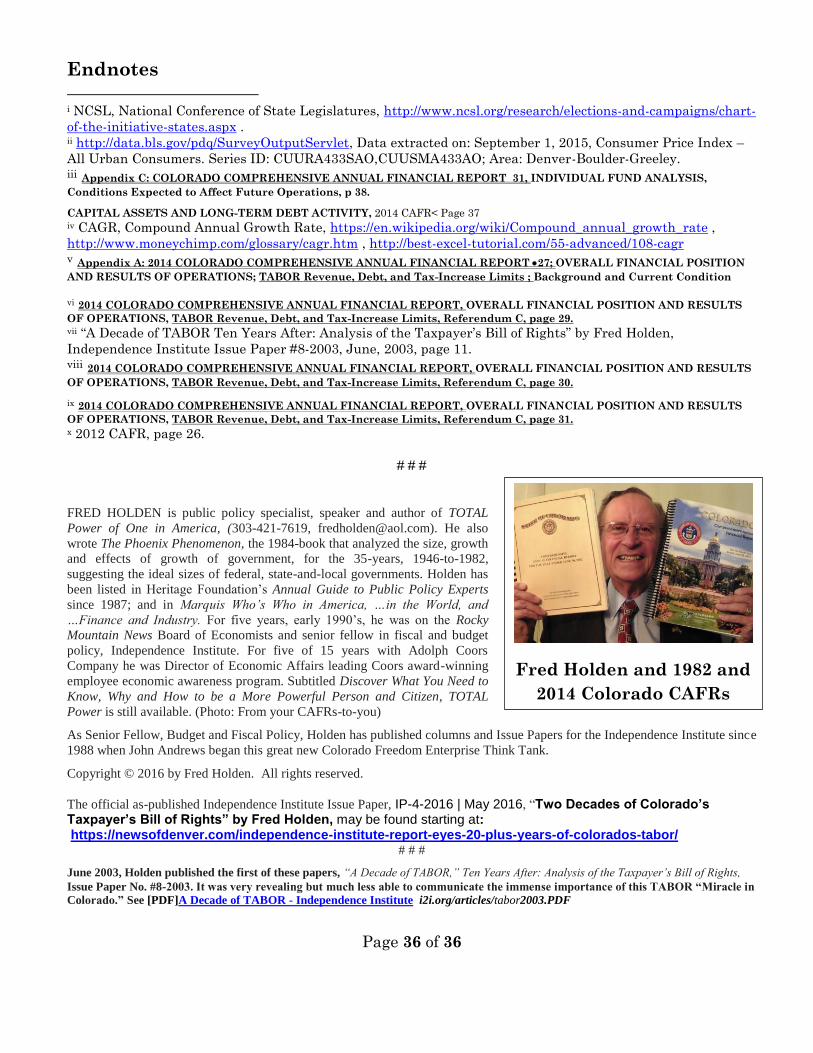
Page 36 of 36
Endnotes
i NCSL, National Conference of State Legislatures, http://www.ncsl.org/research/elections-and-campaigns/chart-
of-the-initiative-states.aspx . ii http://data.bls.gov/pdq/SurveyOutputServlet, Data extracted on: September 1, 2015, Consumer Price Index –
All Urban Consumers. Series ID: CUURA433SAO,CUUSMA433AO; Area: Denver-Boulder-Greeley. iii Appendix C: COLORADO COMPREHENSIVE ANNUAL FINANCIAL REPORT 31, INDIVIDUAL FUND ANALYSIS,
Conditions Expected to Affect Future Operations, p 38.
CAPITAL ASSETS AND LONG-TERM DEBT ACTIVITY, 2014 CAFR< Page 37 iv CAGR, Compound Annual Growth Rate, https://en.wikipedia.org/wiki/Compound_annual_growth_rate ,
http://www.moneychimp.com/glossary/cagr.htm , http://best-excel-tutorial.com/55-advanced/108-cagr v Appendix A: 2014 COLORADO COMPREHENSIVE ANNUAL FINANCIAL REPORT 27; OVERALL FINANCIAL POSITION
AND RESULTS OF OPERATIONS; TABOR Revenue, Debt, and Tax-Increase Limits ; Background and Current Condition
vi 2014 COLORADO COMPREHENSIVE ANNUAL FINANCIAL REPORT, OVERALL FINANCIAL POSITION AND RESULTS
OF OPERATIONS, TABOR Revenue, Debt, and Tax-Increase Limits, Referendum C, page 29. vii “A Decade of TABOR Ten Years After: Analysis of the Taxpayer’s Bill of Rights” by Fred Holden,
Independence Institute Issue Paper #8-2003, June, 2003, page 11. viii 2014 COLORADO COMPREHENSIVE ANNUAL FINANCIAL REPORT, OVERALL FINANCIAL POSITION AND RESULTS
OF OPERATIONS, TABOR Revenue, Debt, and Tax-Increase Limits, Referendum C, page 30. ix 2014 COLORADO COMPREHENSIVE ANNUAL FINANCIAL REPORT, OVERALL FINANCIAL POSITION AND RESULTS
OF OPERATIONS, TABOR Revenue, Debt, and Tax-Increase Limits, Referendum C, page 31. x 2012 CAFR, page 26.
# # #
FRED HOLDEN is public policy specialist, speaker and author of TOTAL
Power of One in America, (303-421-7619, [email protected]). He also
wrote The Phoenix Phenomenon, the 1984-book that analyzed the size, growth
and effects of growth of government, for the 35-years, 1946-to-1982,
suggesting the ideal sizes of federal, state-and-local governments. Holden has
been listed in Heritage Foundation’s Annual Guide to Public Policy Experts
since 1987; and in Marquis Who’s Who in America, …in the World, and
…Finance and Industry. For five years, early 1990’s, he was on the Rocky
Mountain News Board of Economists and senior fellow in fiscal and budget
policy, Independence Institute. For five of 15 years with Adolph Coors
Company he was Director of Economic Affairs leading Coors award-winning
employee economic awareness program. Subtitled Discover What You Need to
Know, Why and How to be a More Powerful Person and Citizen, TOTAL
Power is still available. (Photo: From your CAFRs-to-you)
As Senior Fellow, Budget and Fiscal Policy, Holden has published columns and Issue Papers for the Independence Institute since
1988 when John Andrews began this great new Colorado Freedom Enterprise Think Tank.
Copyright © 2016 by Fred Holden. All rights reserved.
The official as-published Independence Institute Issue Paper, IP-4-2016 | May 2016, “Two Decades of Colorado’s Taxpayer’s Bill of Rights” by Fred Holden, may be found starting at: https://newsofdenver.com/independence-institute-report-eyes-20-plus-years-of-colorados-tabor/
# # #
June 2003, Holden published the first of these papers, “A Decade of TABOR,” Ten Years After: Analysis of the Taxpayer’s Bill of Rights,
Issue Paper No. #8-2003. It was very revealing but much less able to communicate the immense importance of this TABOR “Miracle in
Colorado.” See [PDF]A Decade of TABOR - Independence Institute i2i.org/articles/tabor2003.PDF
Fred Holden and 1982 and
2014 Colorado CAFRs