Embed Size (px)
DESCRIPTION
credit risk management
Citation preview
BANCON 2013
Two decades of credit management in banks:
Looking back and moving ahead
K.C. Chakrabarty
Deputy Governor
Reserve Bank of India

Introduction
Business of banking is business of intermediation Credit risk is integral to banking business
When banking was simple Lending decisions - made on impressionistic basis
Credit risk management – straightforward
Information requirements – minimal
As banking became diverse, complex, sophisticate Risks increased, became transmitive and contagious
But, credit risk management – lagged behind
And, information systems – remained primitive and did not capture granular data correctly

Objectives Examine how Indian banks have dealt with credit
risk over the last two decades Evolution of regulatory framework Analyse trends in asset quality of Indian banks Trends in gross and net NPAs Trends in slippages, write offs and recoveries Trends in restructuring Dwell on some facets that have a bearing on the asset
quality of banks Risk management and primitive information systems GDP growth trends Size / segment analysis of impaired assets General governance and management structure Credit appraisal and monitoring standards Way forward for the regulators, policy makers,
banks and bank customers

Evolution of NPA regulation in India
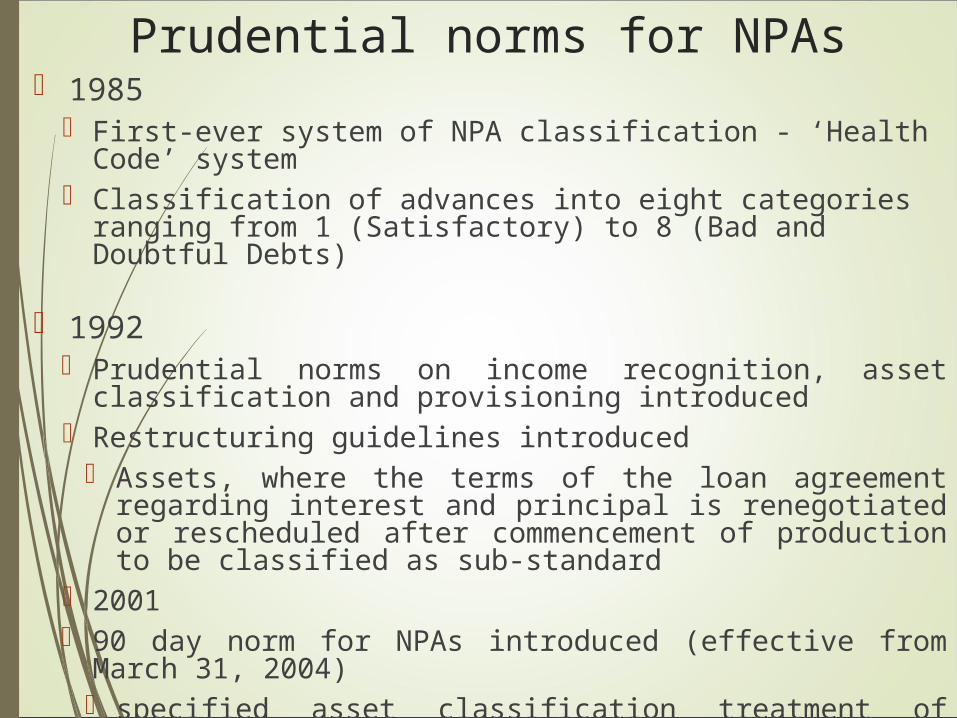
Prudential norms for NPAs 1985
First-ever system of NPA classification - ‘Health Code’ system
Classification of advances into eight categories ranging from 1 (Satisfactory) to 8 (Bad and Doubtful Debts)
1992 Prudential norms on income recognition, asset
classification and provisioning introduced Restructuring guidelines introduced
Assets, where the terms of the loan agreement regarding interest and principal is renegotiated or rescheduled after commencement of production to be classified as sub-standard
2001 90 day norm for NPAs introduced (effective from March
31, 2004) specified asset classification treatment of restructured
accounts tightened

NPA trends – Reflecting regulatory initiatives NPAs rose when prudential regulations introduced - reduced
thereafter as regulatory initiatives facilitated improved credit risk management by banks
Pace of introduction / tightening of regulatory reforms slowed after 2001 Regulatory norms were not further tightened during the “good” pre-
crisis years Reflected in poor credit standards and increased delinquencies
Provisioning levels remained low for the Indian banking sector Norms with regard to floating provisions changed Provisioning coverage ratio was introduced but relaxed thereafter Dynamic provisioning coverage yet to be introduced
Mere tweaking and flip flop approach to Prudential norms Restructuring increased as regulatory requirements were relaxed,
especially in the post crisis years One time special dispensation for asset classification of restructured
accounts provided to deal with the impact of the global financial crisis

Trends in asset quality

Trends in gross and net NPAs Early 1990s
NPA ratios rose Immediate impact of
prudential norms
Thereafter, the NPA ratios declined Improved risk management Increased write offs Rising credit growth / robust
economic growth Abundant liquidity conditions Increased restructuring
In recent years, NPA ratios have been rising, though on an average, the ratios are not higher
Average NPA in % GNPA NNPAs
1997-2001 12.8 8.42001-2005 8.5 4.22005-2009 3.1 1.22009-2013 2.6 1.2Mar 2013 3.4 1.7Sep 2013 4.2 2.2

Divergent bank group wise trends
1996-2003 – wide variation between NPA ratio of PSBs and other bank groups
2003-06 - NPA ratios of all bank groups moved in tandem
2007-09 – NPA ratios begin to decouple
After 2009, gap between PSBs and other bank groups started rising
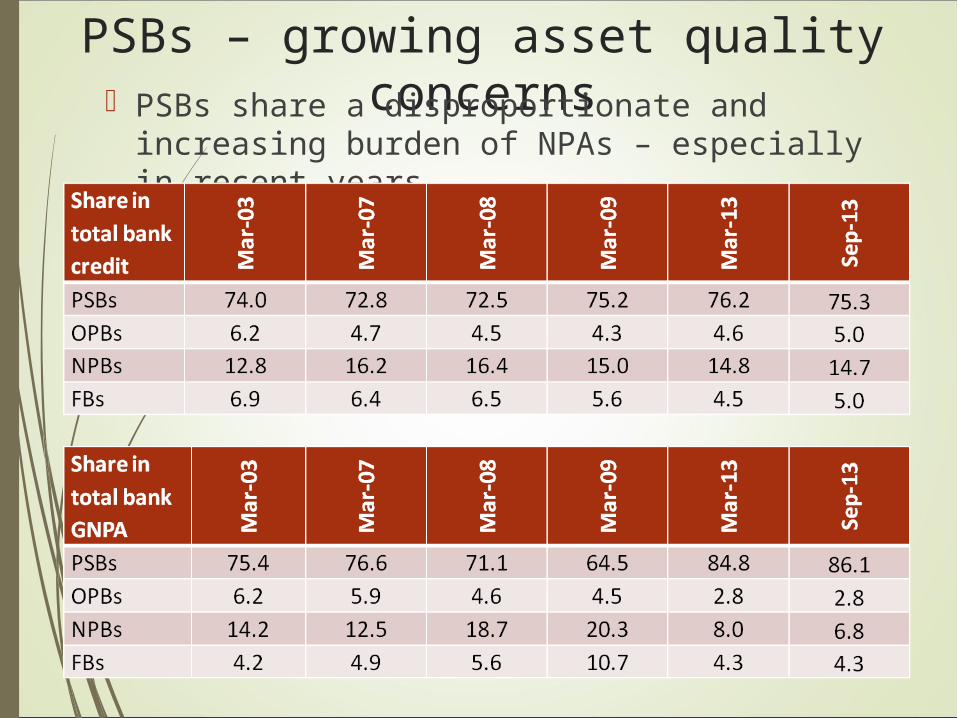
PSBs – growing asset quality concerns PSBs share a disproportionate and increasing
burden of NPAs – especially in recent years

Looking beyond the veil of headline numbers
Gross and net NPAs numbers have limitations!
In the 1990s, only data about gross and net NPAs were availableSubsequently, data on flow of NPAs (fresh accretions and recoveries) collected, followed by data on restructuring, which allowed better understanding of the real problem of credit management in the banks A more detailed understanding of trends in asset quality of banks required collection and analysis of granular data about various aspects of NPA management viz. Slippages, Write offs and Recoveries – Segment wise and activity wiseSuch data has been collected only in recent years(since 2009), largely due to regulatory impetusThe current analysis is an attempt to examine trends in asset quality based on this detailed information

NPA movement over the last decade Increasing slippages and write offs since the crisis years New accretion to NPAs exceeds reduction in NPAs post
crisis
All amount in (Rs crore)
2001-2013 2001-2007 2007-2013
NPAs at Beginning of the period
60,434 60,434 50,647
New Accretion to NPAs during the period
652,987 160,102 492,885
Reduction in NPAs during the period
520,221 169,889 350,332
Due to upgradation 114,890 24,003 90,887
Due to write-off 216,133 74,838 141,295
Due to actual recovery
189,198 71,049 118,149
NPAs at End of the period
193,200 50,647 193,200

Slippages … Trends Slippages – better metric to assess credit
management Slippages & net slippages
Showed a declining trend in the early 2000s; started rising since 2006-07

Recovery efforts deteriorating Extent to which banks able to reduce NPAs through
recovery efforts deteriorating evidenced by increasing ratio of slippages to recovery
and upgradation
Average Slippage to (Recovery + Upgradation) Ratio
Slippage to (Recovery + Upgradation) Ratio
Mar-01 191.3Mar-02 279.0Mar-03 190.5Mar-04 167.1Mar-05 129.5Mar-06 125.4Mar-07 173.2Mar-08 205.2Mar-09 221.0Mar-10 264.1Mar-11 217.0Mar-12 255.9Mar-13 257.0
PSB OPB NPB FB
2001-13 191.1 191.3 452.8 438.6
2001-07 211.3 179.6 376.6 350.6
2007-13 220.6 202.7 418.7 430.3

Recovery & write offs – associated moral hazard Write offs contributing significantly in reduction in NPAs
Reducing incentives to improve recovery efforts
Slippages exceeding reduction in NPAs especially post crisis
The trends indicate weaknesses in credit as well as recovery management
Upgradation as % of reduction
in NPAs
Write off as % of reduction in
NPAs
Recovery as % of reduction in
NPAs
Mar-01 12.6 39.3 48.1Mar-02 12.0 49.4 38.7Mar-03 16.0 50.7 33.4Mar-04 12.3 48.3 39.4Mar-05 15.2 39.0 45.8Mar-06 15.2 40.2 44.6Mar-07 14.5 42.5 42.9Mar-08 17.4 40.7 41.8Mar-09 23.8 39.6 36.6Mar-10 21.3 50.2 28.4Mar-11 24.2 42.4 33.4Mar-12 31.7 33.4 34.9Mar-13 33.1 37.8 29.2
Reduction as a % of slippages
2001-13 78.4
2001-07 105.3
2007-13 70.8
Upgradation as a % of slippages
2001-13 17.6
2001-07 14.9
2007-13 18.4

Write-Off and recovery from Write-offs
Recovery from written off Accounts during the FY ended (Rs. crore)
Mar-01 Mar-02 Mar-03 Mar-04 Mar-05 Mar-06 Mar-07 Mar-08 Mar-09 Mar-10 Mar-11 Mar-12 Mar-13
All Banks
424 501 479 1,065 1,768 2,902 2,480 3,101 3,686 4,362 5,036 5,191 6,960
PSBs 418 494 463 1,008 1,612 2,699 2,220 2,824 3,372 3,819 4,412 4,656 5,953
OPBs 2 3 5 26 45 84 132 173 217 207 231 201 200
NPBs 3 2 4 30 111 109 120 87 92 197 327 294 779
FBs 0 1 6 0 0 10 8 16 4 139 66 40 29
Write offs of NPAs during the FY ended Mar-01 Mar-02 Mar-03 Mar-04 Mar-05 Mar-06 Mar-07 Mar-08 Mar-09 Mar-10 Mar-11 Mar-12 Mar-13
All Banks
6,446 8,711 12,021 13,559 10,823 11,657 11,621 11,653 15,996 25,019 23,896 20,892 32,218
PSBs 5,555 6,428 9,448 11,308 8,048 8,799 9,189 8,019 6,966 11,185 17,794 15,551 27,013
OPBs 331 588 653 525 464 544 610 724 616 884 682 671 863
NPBs 580 896 1,564 1,286 1,682 1,409 1,232 1,577 5,063 6,712 2,336 3,024 3,487
FBs 20 798 356 440 628 905 590 1,334 3,350 6,238 3,083 1,646 855
Substantial Write-off but recovery from write-off has been very poor

Divergent bank group wise trends - slippages
In the aftermath of the crisis, slippage ratios rose, especially for FBs and NPBs
FBs and NPBs, though quickly arrested deterioration in asset quality post-crisis through improved credit risk management
In recent years, the ratio rose sharply for PSBs
Slippage Ratio
All Banks PSB OPB NPB FB
Mar-07 1.8 1.8 1.8 2.0 1.5
Mar-08 1.7 1.7 1.4 2.1 2.1
Mar-09 2.2 1.8 1.9 3.0 5.5
Mar-10 2.1 2.0 2.2 2.0 5.5
Mar-11 2.0 2.2 1.7 1.3 2.2
Mar-12 2.5 2.8 1.5 1.1 2.3
Mar-13 2.6 3.1 1.8 1.2 1.8
Average slippage ratio PSB OPB NPB FB
2001-13 2.7 2.6 3.9 2.8
2001-07 3.2 3.3 5.7 2.4
2007-13 2.2 1.8 1.8 3.0
Slippage ratio = fresh accretion to NPAs during the year to standard advances at the beginning of the year

Divergent bank group wise trends – net slippages
Recovery performance also varied across banks as revealed by trends in net slippages
Net Slippage
Ratio
All Banks PSB OPB NPB FB
Mar-07 0.8 0.6 0.5 1.5 1.0Mar-08 0.9 0.7 0.5 1.8 1.6Mar-09 1.2 0.7 1.0 2.4 4.7Mar-10 1.3 1.2 1.1 1.5 3.9Mar-11 1.1 1.2 0.7 0.6 0.6Mar-12 1.5 1.8 0.6 0.5 1.5Mar-13 1.6 1.9 0.8 0.6 1.1
Average net slippage ratio
PSB OPB NPB FB
2001-13 1.3 1.3 2.5 1.8
2001-07 1.3 1.6 3.6 1.4
2007-13 1.2 0.8 1.3 2.1
Net slippage ratio is slippage ratio net of recoveries

Divergent bank group wise trends – slippages and fresh restructured accounts
The bank group wise trends in slippages are further re-enforced when the trends in slippages and fresh restructuring are examined
All banks PSB OPB NPB FBMar-09 5.1 5.2 5.2 3.9 6.8Mar-10 5.4 5.6 4.0 4.0 6.8Mar-11 2.9 3.2 2.7 1.5 2.3Mar-12 5.4 6.5 2.8 1.9 2.3Mar-13 5.9 7.1 3.4 1.8 1.8
Slippages + fresh restructured ratio

Summing up… Standards of credit and recovery administration is
inefficient and poor as is reflected from the fact that upgradation as a % of slippage is very low – only less than 20 % of accounts have been upgraded
Recoveries are very less- A major part of reduction is through write-off
Even during 2001-07, recoveries and upgradation were not as good-things have considerably deteriorated thereafter
Gross NPA in itself not a problem but in conjunction with restructured advances they have emerged as a major issue

Restructured Accounts … Trends Growth in restructured accounts
mixed trend in early 2000s
sharp uptick in 2008 / 2009 due to the one time regulatory dispensation
Continued high growth rate thereafter

Restructured Accounts … Use and Misuse Forbearance a necessity, especially for viable accounts
facing temporary difficulties But, increasing evidence of misuse of facility for “ever-
greening” of problem accounts by banks Restructuring of unviable units
Deserving & viable units especially for small borrowers get overlooked
Promoters contribution to equity not ensured Restructuring increasingly used as a tool of NPA
management by banks
All Banks (%)
Mar-09
Mar-10
Mar-11
Mar-12
Mar-13
GNPA Ratio
2.4 2.5 2.3 2.9 3.4
(GNPA + Rest. Std. Adv) to Total Adv.
5.1 6.7 5.8 7.6 9.2
(GNPA + Rest. Std. Adv) to
Total Adv.
Mar-09
Mar-10 Mar-11 Mar-12 Mar-13
PSBs 5.1 7.3 6.6 8.9 11.1
OPBs 5.7 5.9 4.9 5.3 5.9
NPBs 5.5 4.8 3.2 3.2 3.1
FBs 5.0 4.7 2.7 2.8 3.1

Divergent bank group wise trends in restructuring and write -off
Asset quality deteriorates further if restructured accounts and write offs are included, especially in the case of PSBs
Banks which are more aggressive in identifying NPAs appear to be able to manage them better
Impaired Assets ratio = (GNPA + Restructured Standard Advances +Cumulative write off) to (Total Advances + Cumulative write off)
Impaired Assets ratio PSB OPB NPB FBMar-09 6.8 6.8 6.6 6.5Mar-10 8.8 7.3 7.3 9.5Mar-11 8.1 6.1 5.5 7.2Mar-12 10.0 6.3 5.4 6.6Mar-13 12.1 6.8 5.3 6.4

Summing up….. Only less then 10% of the total amount written off (including the
Technical Write-off ) is recovered
The amount of restructuring and write –offs distorts inter-segment comparison of credit quality
Technical write –off creates moral hazard and creates a dent in overall recovery efforts
Banks should be given the freedom to decide whether the cases involve restructuring
- where only the technical covenants of the loan or the date of commencement of commercial production might have changed and the banks are convinced that the pay-offs from asset created will be sufficient to repay the loan
- Cases where the reduction does not bring down the lending rate below base rate should not be considered as concession
I24

Segment wise NPA Trends Deterioration in asset quality highest for industries’ segment
Though banks devote fewer resources to the administration of small credits vis-à-vis larger credits
Within industries segment - deterioration driven by medium and large enterprises (50% share in NPAs)
in % Mar-09 Mar-10 Mar-11 Mar-12 Mar-13
Micro+Small 10.7 10.6 9.4 9.7 10.6Medium+Large 7.8 9.4 8.0 11.2 14.8
Impaired Assets ratio

Infrastructure finance – significantly affected
Infrastructure projects – strain on banks
regulatory, administrative and legal constraints Banks’ took inadequate
cognizance of the need for contingency planning for large projects in their appraisal
absence or insufficiency of user charges
Impaired Assets ratio
In % Mar-09 Mar-13
Mining 4.0 8.2
Iron and Steel 9.3 16.9
Textiles 16.7 21.3
Infrastructure 5.0 18.0
Real Estate 2.5 2.0

Large ticket advances – greater share in restructured accounts
Restructuring – provided primarily to large corporates medium and large accounts make up over 90 per cent
of restructured accounts
larger ticket accounts hold major share in CDR
in % Mar-09 Mar-10 Mar-11 Mar-12 Mar-13
Share in total bank credit
Micro+Small* 10.1 11.4 12.0 10.8 10.7
Medium+Large 39.9 42.9 45.0 46.8 48.4
Share in total bank NPA
Micro+Small 16.1 20.4 21.1 17.5 17.2
Medium+Large 23.8 28.7 27.5 37.7 48.8
Share in total bank restructuring
Micro+Small 12.2 7.7 7.7 4.3 3.4
Medium+Large 77.4 69.6 71.1 83.0 90.8
* The data for ‘Medium & Large’ and ‘Micro & Small’ pertains to Industries and services sectors.

Asset quality worse for Directed Lending – A myth
General belief is that directed lending has contributed to rising NPAs GNPA ratio higher for priority sector than non-priority
sector However, considering restructured accounts and write
offs, asset quality worse for the non-priority sector
Priority sector Non Priority sector
Study Conclusions & Other Issues :
Why high NPA and such poor state of Credit Management?

Primitive Information Systems
Improvements in information systems were not coincident with increased size of asset portfolio, increasing complexities in credit management
Banks ability to manage the quality of their asset portfolio remained weak given The lack of granular data on slippages, early
indications of deterioration in asset quality, segment wise, trends, etc.
Banks failed in identifying / arresting the early pre-crisis trends – from 2005-06 - in asset quality deterioration

GDP slowdown leading to increased NPAs!
Recent decline in asset quality coincided with deceleration in GDP growth

Higher NPAs only a result of GDP slowdown?Beginnings of deterioration in asset quality started
ahead of slowdown in economic growth
Growth rate of GNPAs started rising before the crisis even as the pace of slippages turned sharply
positive in 2006-07

Asset quality of PSBs – Economic downturn or sub-optimal credit
management? Recent increase in NPAs not reflected across all bank groups Though economic downturn faced by all banks
Early threats to asset quality - swiftly and effectively managed by private sector and foreign banks
PSBs suffer from structural deficiencies related to the management and governance arrangements Reflected in lacunae in credit management Pre-dates the crisis, but not dealt with on time,
unlike in the case of the FBs and NPBs

Lax Credit Management Deficiencies in credit
management crept in during the pre-crisis “good years”
In general, banks with high credit growth in 2004-08 ended up with higher NPA growth in 2008-13
The appraisal process failed to differentiate between promoter’s debt and equity
Promoters equity contribution declined / leverage higher
Credit monitoring was neglected
Recovery efforts slowed
Legal infrastructure for recovery remained non-supportive
Restructuring became rampant
OPB
NPB
PSB
FB

Increasing incidence of frauds, especially large value frauds in recent years
Over 64 % of fraud cases are advances related – over 70% in case of large value frauds (over Rs. 50 crore)
Poor appraisal and absence of equity has led to larger no. of advance related frauds especially through diversion
Moral hazard associated with identifying business failures as frauds Lacunae in credit
appraisal not identified Fixation of Staff
accountability a casualty
Increasing frauds – or are they business failures?
Advance Related Frauds (>Rs. 1cr)
2010-11 2011-12 2012-13Cumulative (end Mar13)
Bank Grou
pNo.
Amt (in cr.)
No.
Amt
(in cr.)
No.
Amt
(in cr.)
No. Amt (in cr.)
PSBs 201 1820 228 2961 309 6078 1792 14577
OPB 20 289 14 63 12 49 149 767
NPB 18 234 12 75 24 67 363 1068
FB 3 33 19 83 4 16 456 277
Grand Total
242 2376 273 3183 349 6212 2760 16690

Credit appraisal suffered…(1) Poor Credit appraisal at the time of sanctioning as also at the time of
restruturing
Significant increase in indebtedness of large business groups Sample of 10 large corporate groups - credit more than doubled between 2007
and 2013 even while overall debt rose 6 times
Credit growth concentrated in segments with higher level of impairment Lending elevated in several sectors where impairments were higher than
average
Source : Credit Suisse Research
Sectors
CAGR of credit 2009-2012
Impaired Assets ratio
(March 2013)
Iron and Steel 25 17
Infrastructure 33 18
Power 41 18
Telecom 28 16Aggregate banking sector 19 11

Indian corporates - accessing international markets to raise capital Risk from un-hedged exposures Risk from increase in interest rates Impact could spill-over to lenders
Project risks not taken due cognizance of Contingency planning for large projects
Restructuring extended to large corporates that faced problems of over-leverage and inadequate profitability
Companies with dwindling repayment capacity to repay debt - raising more and more debt from banks ability of corporates to service debt was falling exposure of companies to interest rate risk was rising
Credit appraisal suffered…(2)

Summing up…..
High credit growth in select sectors has led to decline in credit quality in subsequent periods
High incidence of advance related frauds are an outcome of deficient credit appraisal standards
Level of Leverage of corporate borrowers, credit growth, diversion of funds, sub standard assets and fraud cases are highly correlated. They are first order derivative of improper credit and recovery management

Assessing the resilience of the banking system

Resilience of the banking sector…(1) Current NPA levels - not alarming though could pose
concern if current trends persist
Year
All Banks PSBs Old Pvt. Sec. Banks
New Pvt. Sec Banks Foreign Banks
GNPA Ratio
NNPA Ratio
GNPA Ratio
NNPA Ratio
GNPA Ratio
NNPA Ratio
GNPA Ratio
NNPA Ratio
GNPA Ratio
NNPA Ratio
Mar 94 19.07 13.71 21.11 15.44 6.93 3.88 - - 1.46 -0.65
Mar-95 15.31 10.46 17.12 11.98 7.35 4.12 2.21 0.93 1.62 -0.91
Mar-97 14.33 9.50 16.44 11.15 8.29 4.66 2.92 2.51 3.57 1.02
Mar-99 13.34 8.99 14.63 10.17 13.02 7.82 4.55 3.52 5.00 0.86
Mar-01 11.14 6.28 11.99 6.97 11.86 6.71 5.40 3.21 6.69 1.72
Mar-03 8.81 4.42 9.36 4.54 8.86 5.41 7.50 4.67 5.34 1.76
Mar-05 4.94 1.96 5.38 2.07 5.97 2.72 2.93 1.53 3.01 0.87

Stress testing reveals resilience of banking system due to strong capital position
June 2013 CRAR Core CRARGNPA Ratio
Losses as % of Capital
Baseline 13.4 9.7 4.0 -
NPA increases by 50% 11.5 8.0 5.9 15.4NPA increases by 100%
10.6 7.0 7.9 23.2NPA increases by 150%
9.6 6.0 9.9 31.0
30% of restructured advances turn into NPAs (Sub-Standard) 12.1 8.6 5.7 10.4
30% of restructured advances written off (Loss) 11.2 7.6 5.7 18.2
Resilience of the banking sector…(2)

Provision coverage ratios of Indian banks low by international standards – declining in recent times
Resilience of the banking sector…(3)

Stressed Assets Provision Coverage Ratio
Mar 2009 Mar 2010 Mar 2011 Mar 2012 Mar 2013
PSBs38.47 29.61 34.29 30.00 27.71
OPBs 33.16 35.40 41.58 33.31 31.11
NPBs 38.91 42.64 63.25 55.52 53.73
FBs 51.58 57.73 81.75 83.44 74.04
All Banks 34.80 30.78 36.25 33.00 30.25
Stressed Assets Provision Coverage Ratio defined as {(Total Provisions (excl. Provision for std adv) + Tech W/Os) to (GNPAs + Rest Std Adv + Tech W/Os)}
Provision Coverage Ratio presents a dismal picture when Restructured Standard Advances are also considered

Recommendations and Way ahead

Recommendations and way ahead
Short run Addressing the existing stock of impaired assets –
NPAs and restructured Time bound revival or recovery
Long run Robust risk management
Improved information system Facilitating granular analysis of trends in asset quality
Improved credit management Credit appraisal and monitoring
Facilitative regulatory and legal infrastructure

Short term: Review of NPAs / restructured advances
Assess viability of NPA and restructured accounts – on case-to-case basis
Pre-stipulated time-frame for review/ restructuring
Accounts found viable Promoters to assume their share of losses - not resort to
further borrowing for equity
If need be bring new promoters
Burden to be equally shared
Restructuring of small accounts - Reorient restructuring towards small customers – SMEs, priority sector
Accounts found to be un-viable
Put under time bound asset recovery
banks takeover of units where promoters’ equity is low
sale of assets to ARCs

Improve credit risk managementEnhanced Credit Appraisal Group Leverage, Source/ structure of equity capital
Complex project structure (as in SPV)
External constraints – effective contingency planning
Keep a check on credit growth and linkage with equity
Need for quicker decision making Appraisal, sanction, disbursement - timely and fast
More compassion to smaller borrower and increased stringency for larger borrowers
Strengthen Credit Monitoring Comprehensive MIS and Early Warning Systems to facilitate regular
viability assessment
Enforce accountability
Accountability on Individuals and all levels of hierarchy
Accountability to encompass all aspects of credit management
Accountability for delayed decision making / non-action

Improved information systems
Information systems – the backbone of credit risk management
Robust information systems needed
Facilitate more intensive data capturing
Integrated into decision making, capital planning, business strategies, and reviewing achievements.
Enable timely detection of problem accounts,
Flag early signs of delinquencies,
Facilitate timely information to management on these aspects
Coordinating mechanism across departments within a bank and across banks
MIS for capturing common exposure across banks
Regulatory framework
Need to review the existing regulatory arrangements for asset classification and provisioning
Facilitative and practical regulation
Restructured accounts to be classified as NPA – aligning domestic norms with global best practices
The practice of technical write offs of NPAs to be dispensed with
Increased provisioning requirements in line with international norms and to ensure resilience of the banking system
Uniform approach to regulation – either principle or rule based
For stability in credit risk management practices
To eliminate ad-hoc implementation processes

Reforming legal & institutional structures
Corporate Debt Restructuring (CDR) mechanism Remove existing bias towards large-ticket accounts Ensure viability and promoters’ stake upfront Independent oversight of large CDR account
Debt Recovery Tribunals (DRTs) & other legal provisions
Need for vigorous follow up in the case of suit filed accounts setting up of more DRTs and DRATs
Asset Reconstruction Companies (ARCs) Review and revitalise functioning of ARCs
Credit Information Companies (CICs)
Expand use of CICs for credit management

Concluding Thoughts

Key Messages …..(1) Present level of stressed asset as an outcome is not a
big problem but present processes, systems and structure of creation of stressed assets are a big problem.
Existing level of NPAs are manageable but if corrective actions to arrest the slide in NPA are not initiated, the stability of financial system will be at great risk.
Gross NPAs are not alarming but the quantum and growth of restructured assets is of great concern
Economic slowdown and global meltdown are not the primary reason for creation of stressed assets but the state of credit and recovery administration in the system involving banks, borrowers, policy makers, regulators and legal system have contributed significantly to the present state of affairs.

Key Messages ….(2) Credit quality has a high positive correlation with the
prudential norms and regulations prescribed by RBI
Laxity, soft and flip-flop approach to regulatory and prudential norms have contributed significantly to creation of NPAs and stressed assets in the system
Level of Leverage of corporate borrowers, credit growth, diversion of funds, sub standard assets and fraud cases are highly correlated. They are first order derivative of improper credit appraisal in determining appropriate structure of debt and equity both in terms of quantity and quality.
Overall standard and quality of credit management and recovery management is very poor.
Less than 20% of NPAs are upgraded
Reduction of NPAs is less than slippages
About 50% reduction in NPA is through write-off

Key Messages ….(3) Banks following the process of recognizing NPAs quickly
and more aggressively are having better control over NPAs.
Appraisal standards are lax for bigger loans both at the time of sanction as also restructuring while appraisal rules are very stringent for smaller borrowers
Restructuring and write off processes are highly biased towards bigger loans as compared to smaller loans.
Credit risk for small borrowers is lower than that for bigger borrowers
Credit risk in priority sector is less than in the non-priority sector
High pace of credit growth has resulted in lower credit quality in subsequent periods

Measures …….(1) Credit Appraisal needs to be strengthened with focus
on:
Quantum of equity brought in by the promoters
Sources of Equity
Contingency Planning in respect of infrastructure projects
Improve appraisal and approval process for restructuring proposals
Benefits of restructuring to be also extended to smaller borrowers
CDR Mechanism grossly misutilised and needs a thorough overhaul
Need for an oversight structure for dealing with restructuring of large ticket advances
Independent body to oversee CDR mechanism

Measures …..(2) Restructuring and Technical Write-off as a prudential
measure should be eased out by the regulator
Existing NPAs need careful examination for determining rehabilitation or recovery
Conduct viability study
Quick rehabilitation with support from both –the bank and the borrower
Those who put spoke needs to be sufficiently dis-incentivized
Bring new promoter if the existing promoter unable to bring new equity
Restructuring decision should be left to the bank
Quick and determined action is the need of the hour !

Thank you